Article

A Novel Method for Aging Life Evaluation of O-Rings Based on the Sealing Performance Degradation Model and the Artificial Neural Network Model

1
Comprehensive Technology Department of Basic Products, AVIC China Aero Poly-Technology Establishment, Beijing 100028, China
2
Beijing Institute of Astronautical Systems Engineering, Beijing 100076, China
3
School of Queen Mary University of London Engineering, Northwestern Polytechnical University, Xi’an 710072, China
4
National Key Laboratory of Strength and Structural Integrity, School of Aeronautic Science and Engineering, Beihang University, Beijing 100191, China
*
Author to whom correspondence should be addressed.
Aerospace 2025, 12(7), 570; https://doi.org/10.3390/aerospace12070570
Submission received: 6 May 2025 / Revised: 14 June 2025 / Accepted: 17 June 2025 / Published: 23 June 2025

Abstract

The effectiveness and stability of sealing structures and O-rings in engineering not only impact the performance and safety of engineering systems but also directly affect the operational lifespan and maintenance costs of equipment. This study proposes an aging life evaluation method for sealing rings based on a sealing performance degradation model and an artificial neural network (ANN) model. First, the impact of compression ratios on the sealing performance of the O-ring was analyzed using comprehensive macro–micro numerical simulations. Next, accelerated aging tests were conducted under five different temperature conditions, and a performance degradation model for the O-ring was developed based on a dynamic curve model, expanding the degradation data. Furthermore, an aging life evaluation method for O-rings based on the ANN model is proposed to predict the aging life of O-rings under different temperatures and compression sets. The results indicate that in practical applications, an appropriate compression ratio for the O-ring should be selected, and the sealing structures with smaller Von Mises stress should be prioritized under the condition that the contact stress is greater than the medium pressure. Moreover, the established O-ring performance degradation model aligns well with the experimental results. The proposed ANN model demonstrates good effectiveness in predicting the aging life of O-rings under different operating conditions and selected sets. The ANN model achieved a root mean square error (RMSE) of 1.8264, a coefficient of determination (R2) of 0.9999, and a mean absolute percentage error (MAPE) of 8.05%, demonstrating high prediction accuracy and generalization capability. This method offers an effective approach for engineering sealing structure design and aging life prediction of sealing rings.

1. Introduction

In hydraulic systems, the performance of seals is crucial to the overall reliability and lifespan of the system. Hydraulic seals, mainly made from thermoplastic elastomers and rubbers, are widely used in industries like automotive, oil and gas refining, aviation, and medical sectors [1]. Although seals are relatively low-cost components often considered consumable, they play an indispensable role in preventing leakage and facilitating the smooth conversion of fluid power into mechanical power [2]. However, seals are prone to failure in operation due to various factors such as thermal aging, frictional wear, and chemical degradation. In many hydraulic systems, seal failure can lead to sudden changes in fluid pressure or flow, potentially disrupting system functionality or damaging equipment [3,4]. Variations in temperature, pressure, speed, and chemical environment present significant challenges to the performance and lifespan of seals, affecting the system’s functionality and economic efficiency.
In recent years, as demand for high-temperature and high-pressure conditions has increased, researchers have begun focusing on the failure mechanisms and performance degradation of hydraulic seals under these conditions. Patel et al. [5,6] found that the failure of seal assemblies is always the primary cause of well control incidents and proposed a finite element modeling method to evaluate the performance and fitness for service of conventional elastomer hanger seal assemblies under high-temperature and high-pressure conditions. Studies indicate that elevated temperatures can significantly accelerate the thermal aging of sealing materials, resulting in the deterioration of their mechanical and chemical properties [7]. This degradation manifests in issues, such as seal material expansion, rapid gas decompression, changes in cross-link density, and chain breakage, all of which directly impact the durability and reliability of seals, potentially leading to severe system shutdowns or mechanical failures [8,9,10].
In engineering applications, it is very common for O-ring seals to be compressed into grooves, and some experiments and finite element simulations were conducted to analyze the impact of groove design, compression ratio, and other factors on seal performance. Zhang et al. [11] found that the depth and chamfer design of the groove are crucial for its performance. Unreasonable groove design may lead to premature failure of the O-ring, such as fatigue failure and bitten failure. Tong et al. [12] revealed through hydraulic testing and finite element analysis that increasing the compression ratio of the O-ring seal and the bottle head thickness contributes to improving the sealing performance, as well as reducing the distance between the straight edge section of the bottle head and the sealing groove. Wang et al. [13] studied the impact of different sealing structure parameters on the sealing performance of the hydro-pneumatic spring seal through simulations and experiments, which provided effective theoretical guidance for the design of related sealing structures for hydro-pneumatic springs. Given the working environment and lifespan requirements of seals, groove design optimization and accelerated life testing have become essential methods for assessing seal life and enhancing design standards [14,15,16,17]. Optimizing groove design can improve the stress distribution uniformity within the seal structure, reducing wear during dynamic motion and thereby extending the seal’s practical lifespan [18]. Following design optimization, accelerated life testing can simulate the degradation behavior of seals under extreme conditions in a shorter period, quickly yielding life data. This approach not only verifies the reliability of seal designs but also identifies potential failure modes, providing data to support the development of life prediction models. However, relevant research is still limited.
In the research on the aging life of seals, Kömmling et al. [8] performed hardness and compression stress relaxation tests on ethylene propylene diene monomer (EPDM) O-rings and hydrogenated nitrile butadiene rubber (HNBR) O-rings after 1.5 years of aging at five different temperatures. Jaunich et al. [19] conducted aging tests at temperatures ranging from 75 °C to 150 °C, with durations from 1 day to 5 years, using compression testing methods to estimate performance and lifespan. The tests showed significant signs of material degradation, including compression permanent deformation, compression stress relaxation, and elongation at break. Zeng et al. [20] designed an aging experiment to study the performance of aging of O-rings used in gas-insulated switchgear (GIS) at different temperatures. Zhu et al. [17] propose a new butterfly rubber ring structure to improve static sealing performance and prevent buffer failure in landing gear by analyzing the factors affecting sealing performance and comparing it with the O-ring, showing a 30% increase in contact pressure in assembly state and 14% in working state. In operation, seal failure may lead to fluid leaks and contamination issues, increasing maintenance and replacement costs. However, in most cases, seals are typically replaced directly without considering the factors influencing their long-term degradation and their impact on failure. Understanding the impact of high temperatures on seal failure and exploring methods to improve seal performance have thus become critical in engineering applications.
In the mid-1960s, fundamental theories of rubber aging, such as the dynamic curve model, began to develop and gradually matured. Researchers [21,22,23,24] proposed a method for estimating the storage period and service life of rubber by extrapolating the results of accelerated aging tests conducted at three or more different temperatures. However, predicting the aging life of O-rings using this method requires designing numerous experimental groups to obtain data for model parameter calibration. Since O-ring sealing tests typically demand significant time and labor costs, this approach is resource intensive. With the advancement of computer science and artificial intelligence, data-driven machine learning (ML) methods have emerged as effective solutions to overcome these limitations. In recent years, ML techniques have been increasingly applied across various fields [25,26,27,28]. ML models extract valuable and interpretable patterns from large and complex datasets, enabling predictions or decision-making on new data [29]. Common types of ML include supervised learning, unsupervised learning, semi-supervised learning, and reinforcement learning [30]. Zhan et al. [31,32] proposed a novel fatigue life prediction method that combines the theory of continuous damage mechanics (CDM) with the ML model, uses a fatigue model based on CDM to generate training data, and employs a variety of ML models for fatigue life prediction, and the results show that the method has a high prediction accuracy and is suitable for engineering applications. Zhou et al. [33] proposed a dual-stage optimization strategy combining the K-nearest neighbor algorithm and the technique for order preference by similarity to the ideal solution for motor O-ring design. Experimental verification demonstrated the reliability of the optimized sealing structure, providing an efficient solution for hyper-elastic material seal design. Jiao et al. [34] developed a fast optimization model based on the genetic algorithm–artificial neural network (GA-ANN) for subsea pipeline metal sealing structures. This model reduced computation time to 3–6% of traditional GA-ANN methods while maintaining high accuracy. Additionally, by integrating the non-dominated sorting genetic algorithm-I (NSGA-I) multi-objective optimization algorithm, the generated candidate solutions outperformed traditional response surface methodology in both contact pressure and structural compactness. Pokharel [35] utilized underground drainage network data and multiple variables to develop a service life prediction model for concrete and ceramic pipelines using 19 supervised learning algorithms. Through hyper-parameter optimization, the final model demonstrated outstanding performance in remaining life estimation. Bao et al. [36] applied an ML approach by combining support vector machines (SVMs) with high-resolution synchrotron X-ray tomography to predict the fatigue life of Ti-6Al-4V alloys fabricated by selective laser melting. Their study revealed that defect size, location, and morphology had nonlinear effects on fatigue life. Zhan et al. [32] used ANNs, random forest (RF), and support vector machines (SVMs) to predict the fatigue life of additive manufacturing stainless steel 316 L and compared the prediction performance of different ML models. The results showed that the RF model performed best in fatigue life prediction, followed by ANNs, while the SVM model performed poorly. A large body of studies indicates that machine learning methods have the potential to achieve low-cost, high-precision predictions for the aging life of O-ring seals.
This study proposes an aging life evaluation method for sealing rings based on the ANN model and performance degradation model of O-rings. First, the effects of compression ratios on the sealing performance of EPDM O-rings were analyzed through comprehensive macro–micro numerical analysis. Then, accelerated aging tests were conducted under five different temperature conditions, and a performance degradation model for O-rings was established based on a dynamic curve model. Through regression analysis, an aging life prediction model for O-rings under actual operating temperatures was obtained. Based on this model, aging data were expanded, and an aging life prediction method for sealing rings based on the ANN model was proposed and trained. As a result, the aging life of the O-ring under different operating conditions and selected compression sets was successfully predicted.
The structure of this paper is as follows. Section 1 summarizes the current state of research. Section 2 introduces the macro–micro comprehensive numerical model and the numerical computation process and constructs the performance degradation model of the sealing ring. Additionally, an aging life prediction method based on the ANN model was developed. Section 3 provides a detailed description of the accelerated thermal aging tests. Section 4 presents an in-depth explanation of the macro–micro numerical analysis and the results of the performance degradation model and the training ANN model. Finally, Section 5 summarizes the conclusions and relevant discussions.

2. Method and Models

2.1. Macro–Micro Comprehensive Numerical Analysis of Typical Sealing Structures

From a macroscopic perspective, engineering flange sealing can be categorized as a planar sealing issue. From a microscopic perspective, due to factors such as spindle runout and tool wear during machining, the flange surface is not an ideal plane but rather a surface composed of numerous microscopic peaks and valleys. These peaks and valleys form potential leakage paths. Therefore, it is necessary to consider the effect of surface roughness on the sealing interface in sealing simulation analysis. This section proposes a simulation analysis method for typical engineering sealing structures based on a comprehensive macro- and micro-level analysis with the overall approach as follows.
Figure 1 shows the workflow of the macro–micro comprehensive numerical analysis of typical sealing structures. First, a macroscopic geometric simulation model of the engineering sealing structure is established, and macroscopic simulation analysis is performed using ANSYS finite element (FE) software (version 2020 R2) to calculate the contact stress and Von Mises stress of the seal. In addition, MATLAB (version R2021b) is applied to generate the rough peaks on the flange sealing surface of the engineering structure. Using the maximum contact stress obtained from the macroscopic analysis, the contact stress distribution of the rough peaks is calculated.

2.1.1. Constitutive Model of Material

In this study, the finite element analysis was primarily conducted to evaluate the distribution of contact stress and Von Mises stress under different compression ratios at room temperature in order to guide the selection of sealing structures for subsequent aging experiments. To strike a balance between computational efficiency and accuracy, the classical two-parameter Mooney–Rivlin model was selected as the constitutive model for EPDM rubber. This model is a widely used hyper-elastic formulation for describing the nonlinear elastic behavior of rubber-like materials, and it is particularly effective within moderate strain ranges. The two-parameter Mooney–Rivlin model [18] is used to describe the mechanical behavior of sealing material, which is described as follows:
W - = C 10 I 1 3 + C 01 I 2 3
where W - represents the strain energy and I 1 and I 2 represent the first and the second deviatoric strain invariants. C 10 and C 01 are the hyper-elastic parameters of material, which are obtained from experiments or empirical data.
Although the Mooney–Rivlin model does not explicitly account for aging or thermo-oxidative degradation effects, it is well-suited for simulating the mechanical response of unaged EPDM material under static compression. Therefore, it was deemed appropriate and efficient for use in the present finite element simulations.
It should be noted that if the objectives were to simulate the time- and temperature-dependent degradation behavior of EPDM under long-term thermal exposure and to correlate numerical results directly with experimental aging data, a more advanced constitutive model incorporating coupled thermo–oxidative–mechanical degradation mechanisms would be necessary.

2.1.2. Random Rough Surface Generation

According to the theory of statistics and probability, the height of a rough surface can be considered a random variable. Therefore, the generation process of the flange’s rough surface can be regarded as a quasi-random process, and the characteristics of the rough surface can be reflected through the statistical distribution of surface heights. In this study, the conjugate gradient method is used to generate the microscopic topography of the flange’s rough surface, and an autocorrelation function is applied to describe the statistical distribution of the rough surface heights. The expression for the autocorrelation function is as follows, which is approximately expressed in the form of an exponential function [37].
R ( τ x , τ y ) = σ 2 exp 2.3 τ x / λ x 2 + τ y / λ y 2 1 / 2
where the essential variables used to describe the autocorrelation function are the autocorrelation lengths in two mutually perpendicular directions. τx and τy are lag parameters in the autocorrelation function, representing the delay along the x and y dimensions. λx is the correlation length in the x direction and λy is the correlation length in the y direction. If the rough surface is isotropic, then λx = λy. σ is the root mean square (RMS) roughness.
In this study, a stationary roughness assumption was adopted based on several considerations: (1) In practical engineering applications, surfaces produced through controlled manufacturing processes (e.g., turning, grinding) often exhibit statistically stationary roughness; (2) a unified autocorrelation function simplifies the modeling process and reduces computational cost; and (3) the constructed rough surface models include adequate sampling size and resolution to ensure statistical representativeness.

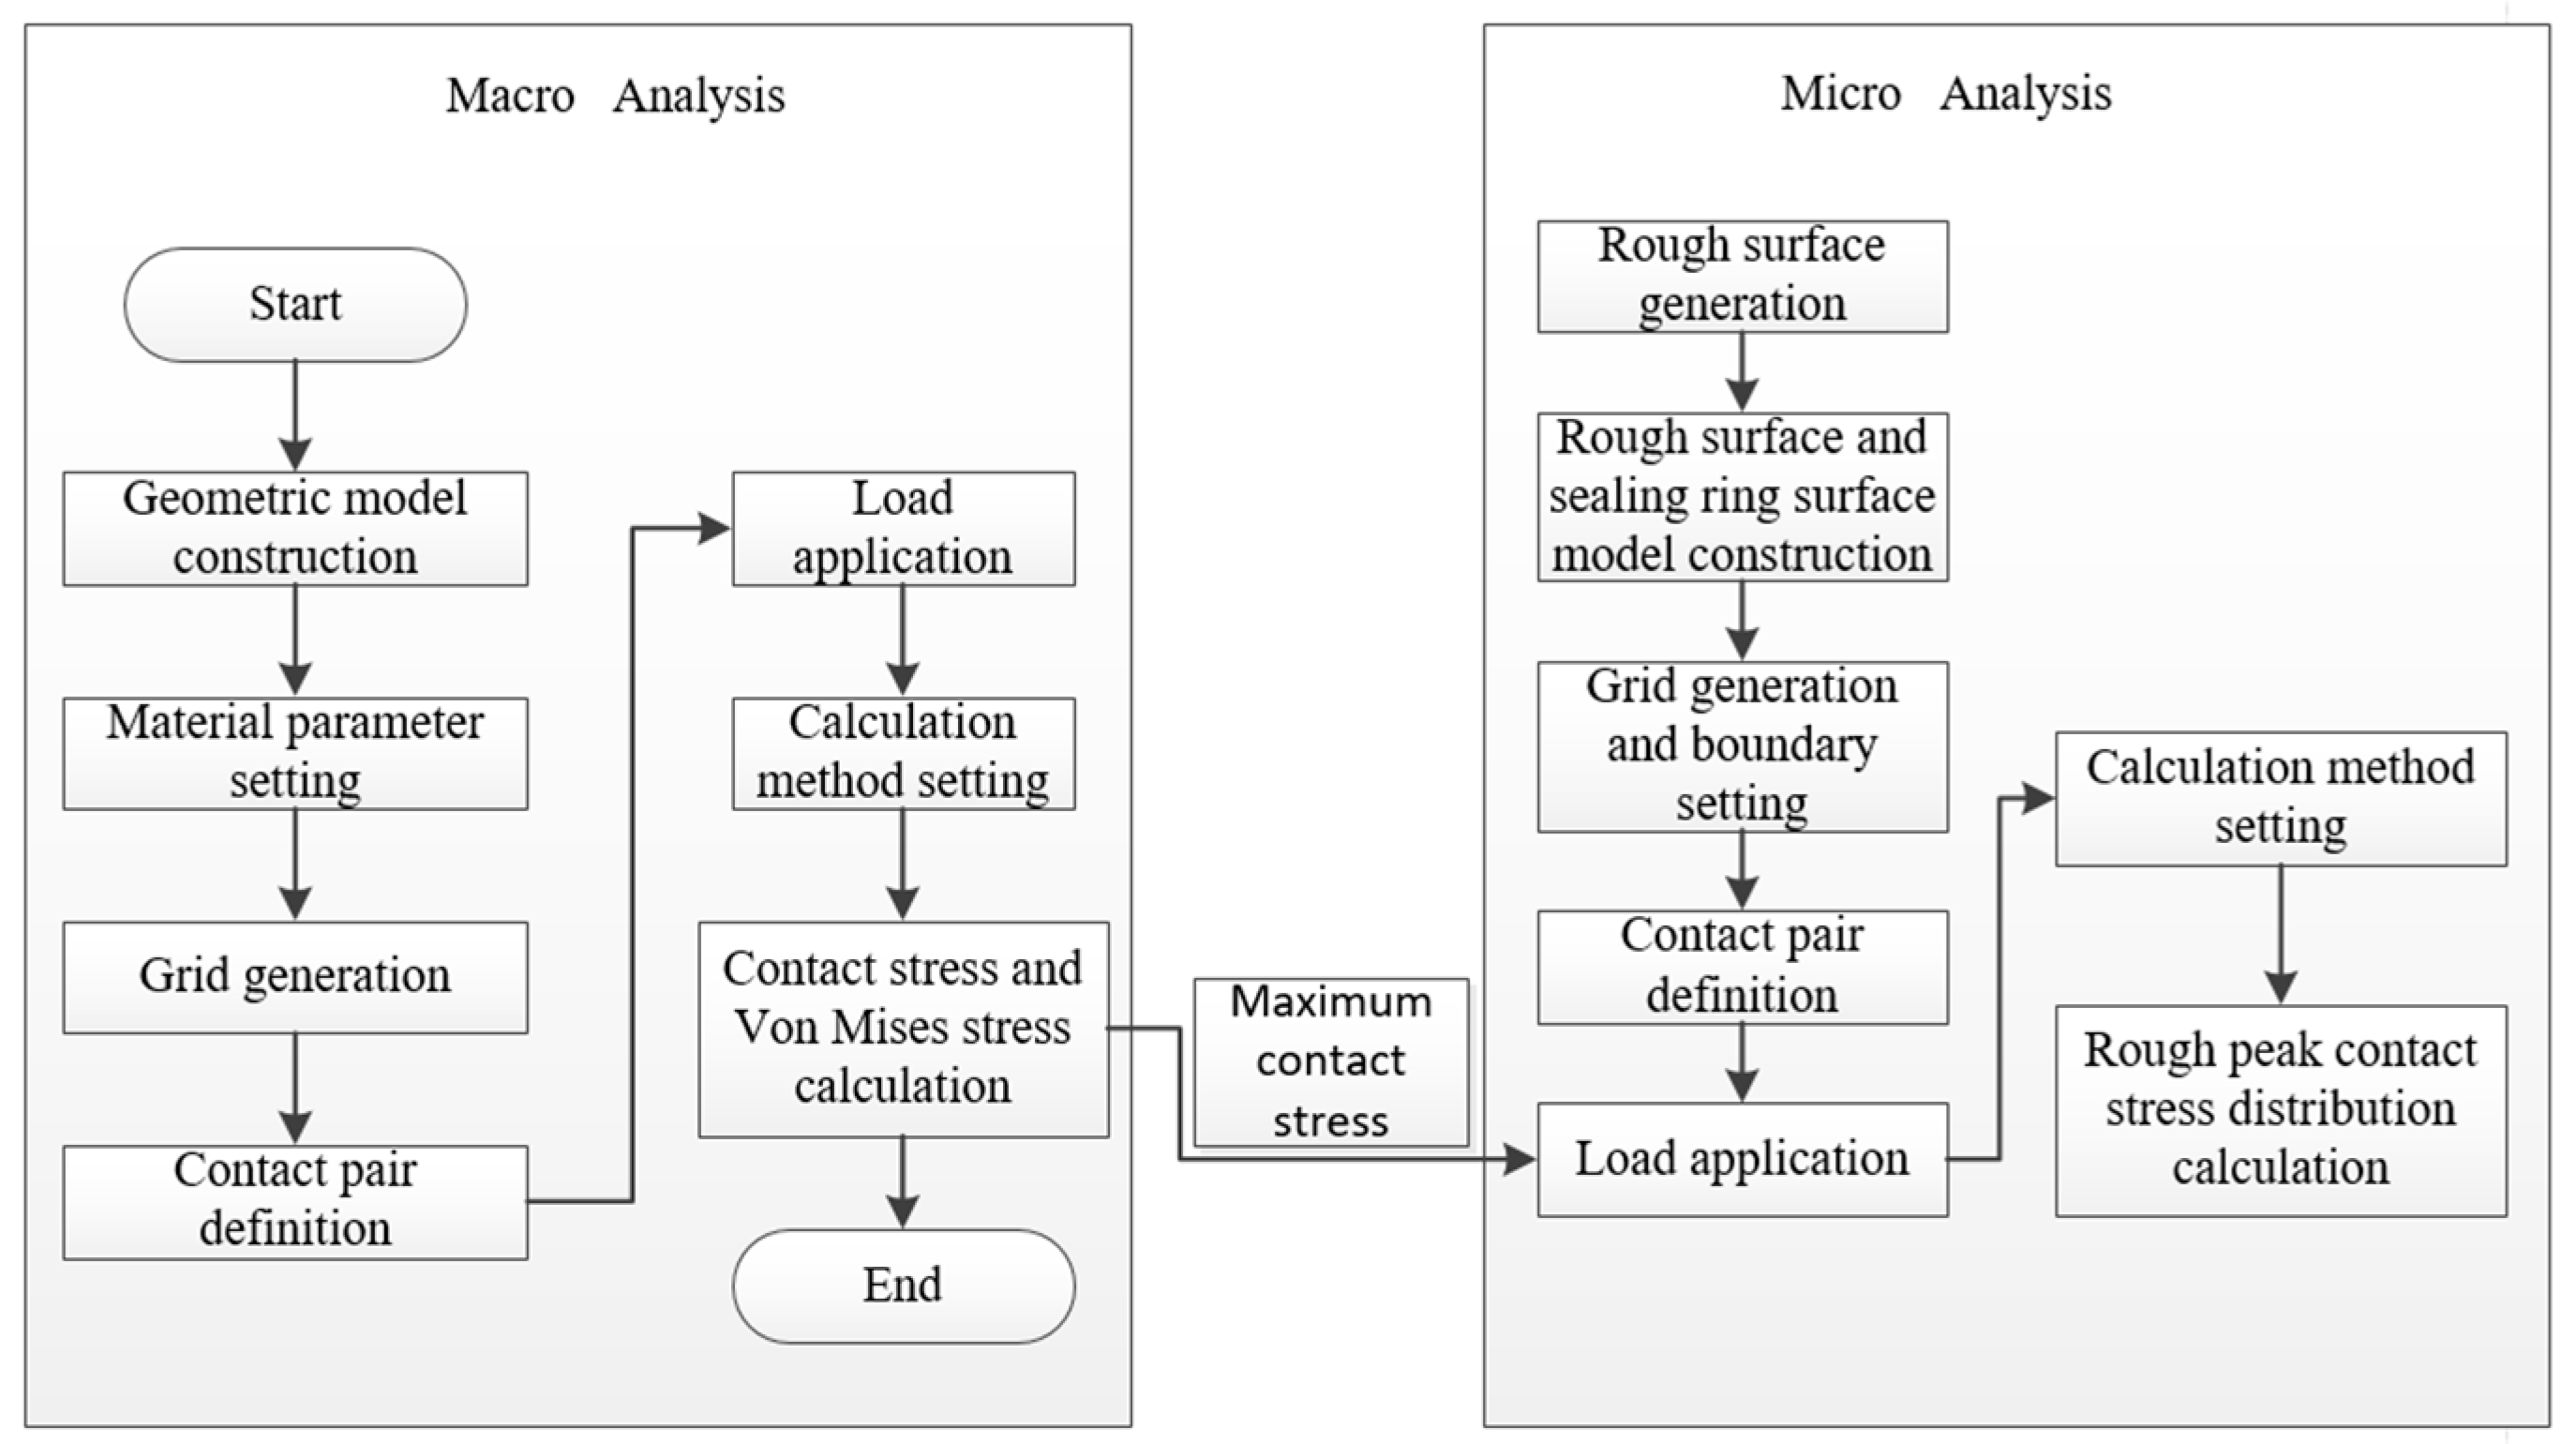
2.1.3. Macro–Micro Numerical Analysis Process

The sealing structure in practical engineering is a rectangular groove, with a groove width of 10 mm and five groove depths of 8.0, 7.6, 6.9, 6.4, and 5.9. The sealing ring diameter is 8.4 mm. Since the O-ring sealing structure model is axisymmetric and the applied forces are also axisymmetric, a two-dimensional axisymmetric model is established for the sealing ring, upper flange, and rectangular groove during macro-finite element analysis of the O-ring. A mesh independence analysis was conducted using three different mesh densities of 4648, 6896, and 9317. The maximum contact stress and Von Mises stress under an 18% compression ratio were calculated, and the results are presented in Figure 2. For convergence, strict criteria were adopted, with tolerances for displacements set to 10−5. The results showed that the differences in maximum contact stress and Von Mises stress among meshes were less than 3%, demonstrating good convergence and sufficient mesh refinement. Based on this analysis, the finest mesh was selected for subsequent simulations, which is shown in Figure 3a.
Considering the axial symmetry of the structure and the uniform load distribution along the thickness direction, a two-dimensional plane strain model was adopted in this study. Both the O-ring and the rectangular groove were meshed using four-node 2D plane strain elements (PLANE182), which offer high accuracy in contact stress analysis. To simulate the actual operating conditions, a uniform displacement load was applied on the upper flange to represent mechanical clamping, and an additional 0.6 MPa pressure was applied on the sealing surface to accurately reflect the working pressure. The pressure represents a typical working condition in the actual application environment. In this scenario, the sealing structure is mainly subjected to sustained compressive loading, and the influence of dynamic or cyclic loads on sealing performance is relatively minor. Moreover, this study focuses on analyzing the initial sealing performance and contact characteristics of the sealing structure. The static pressure load condition effectively captures the deformation and pressure distribution at the sealing interface. Therefore, conducting finite element analysis under this static pressure load can accurately reflect the stress state and sealing behavior of the sealing component. Additionally, the rectangular groove was fully fixed to prevent rigid body motion, which is illustrated in Figure 3a.
There is extrusion between the sealing ring and the end faces of the upper and lower flanges, so the finite element analysis of the sealing ring involves the contact problem between rubber and metal. In this simulation, contact pairs were defined between the O-ring and the groove walls, and the contact type used is frictional (with friction). Before relative sliding occurs, a certain amount of shear force exists between the two contact surfaces, and the friction coefficient is set to 0.3. In this study, a friction coefficient of 0.3 was applied at the contact interface between the sealing material and the metal surface. This value was selected based on previous experimental studies on dry friction behavior between elastomeric materials and steel. According to the literature, the dry friction coefficient between EPDM or CR rubber and steel typically falls within the range of 0.2 to 0.4, depending on variables such as surface roughness, normal load, and sliding velocity [38,39]. The contact algorithm is program controlled. To improve convergence, ANSYS automatically adjusted the contact stiffness. Contact stabilization was activated during the initial loading phase to ensure gradual engagement between the O-ring and the groove, thereby maintaining stable computation. The loading was applied in two sequential steps: first, a displacement load was applied to the upper surface to simulate the pre-tightening force; second, after convergence, a pressure load was applied to one side of the sealing ring to simulate the gas pressure. This two-step loading strategy effectively improves the convergence and efficiency of the calculation.
In microscopic modeling, to convert the numerical model into a geometry suitable for finite element analysis software, the ANSYS APDL language is used for automatic transformation. The rough surface data z(x,y) obtained from MATLAB is exported in a format compatible with ANSYS APDL commands. Key points are used to generate a point cloud, which is then used to create a rough surface and solid model. The microscopic simulation focuses on the deformation of the sealing geometry. The mesh of the microscopic model is illustrated in Figure 3b. To achieve higher computational accuracy, hexahedral elements were used, specifically the SOLID185 element. To preserve the full geometry of the rough surface microstructure, the rough surface was meshed using adaptive tetrahedral elements (SOLID187), which are well-suited for complex geometries. The sealing material geometry was constrained in displacement under load. A pressure load was applied on the upper plane, and all four surrounding faces of the elastomer were fully constrained in the x, y, and z directions. The base of the rough surface substrate was constrained in the x and y directions, and a displacement load was applied in the z direction. The rough surface itself was constrained in the x and y directions. The contact side of the sealing geometry was defined as the contact surface using CONTA173 elements, and the rough surface was defined as the target surface using TARGE170 elements. In this simulation, the contact type used is frictional (with friction). Before relative sliding occurs, a certain amount of shear force exists between the two contact surfaces. The contact process between the two rough surfaces is simplified by constructing a contact model between the rough surface and an elastic plane.
The geometry model is divided into two parts, the rough surface and the matrix, and the mesh density is controlled to generate the mesh, as shown in Figure 3b. Boundary conditions are applied by imposing a pressure load on the plane and constraining the degrees of freedom of the elastic body and rough surface in the x, y, and z directions. In the contact pair setup, the component with a larger elastic modulus is set as the target surface, and the one with a smaller modulus is the contact surface. To avoid penetration and ensure convergence, the loading process is performed in two steps: first, a displacement load is applied to initiate contact, followed by a pressure load on the sealing material surface for the calculation. This methodology ensures proper interaction between the rough surface and sealing material while maintaining convergence and accuracy in the simulation.
In the present study, the augmented Lagrange method provided by ANSYS was employed to handle contact constraints in both macro- and micro-scale simulations. For the macroscopic contact between the O-ring and the groove, this method offers a good balance between the accuracy of the Lagrange approach and the numerical efficiency of the penalty method. It allows small penetration while adaptively adjusting contact stiffness to enhance stability and convergence. For microscopic contact simulations involving rough surfaces, the same method was used, along with a two-step loading scheme to ensure smooth establishment of the contact interface. This approach enables realistic modeling of contact behavior while maintaining computational efficiency.

2.2. Degradation Model of the Sealing Ring

The degradation model of the seal’s performance with respect to aging time is usually described as follows [40]:
1 ε = B e K t α
where the terms of ( 1 ε ) are defined as compression set retention; B and α are test constants; K represents the aging rate constant; t is the aging time; and ε is the compression set, which is expressed as follows:
ε = h 0 h 2 h 0 h 1 100 %
where h 0 is the original cross-sectional diameter of the seal; h 1 is the height of the sealing groove; and h 2 is the radial cross-sectional height of the seal after deformation.
From Equation (3), a linear relationship of ln(1 − ε ) to t α can be derived by taking the following logarithm:
ln 1 ε = ln B K t α
The values of the compression set of the sealing ring at each test time point under a specific temperature in the accelerated lifetime test are fitted to obtain the performance degradation trajectory.
Within a certain temperature range, the aging rate constant K follows the Arrhenius model [10], which is related to the thermodynamic temperature T as follows:
K = A e E R T
where A is a characteristic factor (d−1 or min−1); E represents an active energy (J/mol); and R is the Molar gas constant (R = 8.314 J/(mol·K)). Taking the logarithm on both sides of Equation (6), we obtain the following:
l n K = l n A E R T
It can be seen that the logarithm of the aging rate constant K is linearly related to the reciprocal of the temperature T. By performing a simple linear regression, the aging rate constant K at different temperatures can be obtained. By combining with Equation (3), the aging model of the seal under a specific temperature can be obtained through regression.

2.3. ANN-Based Aging Life Prediction Model

Relying only on the experimental data to regress the performance degradation trajectory model for O-rings to obtain the model parameters to predict the aging life of O-rings under different operating conditions and compression set retention is time consuming and labor intensive. To address this limitation, we developed a machine learning model based on the performance degradation trajectory model for O-rings, which is designed to obtain the O-ring performance decay characteristics accurately and quickly.
In this section, an ANN machine learning model is presented, which is combined with a performance degradation trajectory model for O-rings to predict the aging life of O-rings under different operating conditions and compression set retention. The dataset for training the ML model was expanded from the degradation model obtained in Section 2.2. Subsequently, the prediction of the aging life of the O-rings under different operating conditions and compression set retention and the tuning of the ANN model parameters were performed. This model combines the advantages of the performance degradation trajectory model for O-rings and the ML model to obtain the O-ring performance decay characteristics in a more efficient way to predict the aging life of O-rings under different operating conditions and compression set retentions.

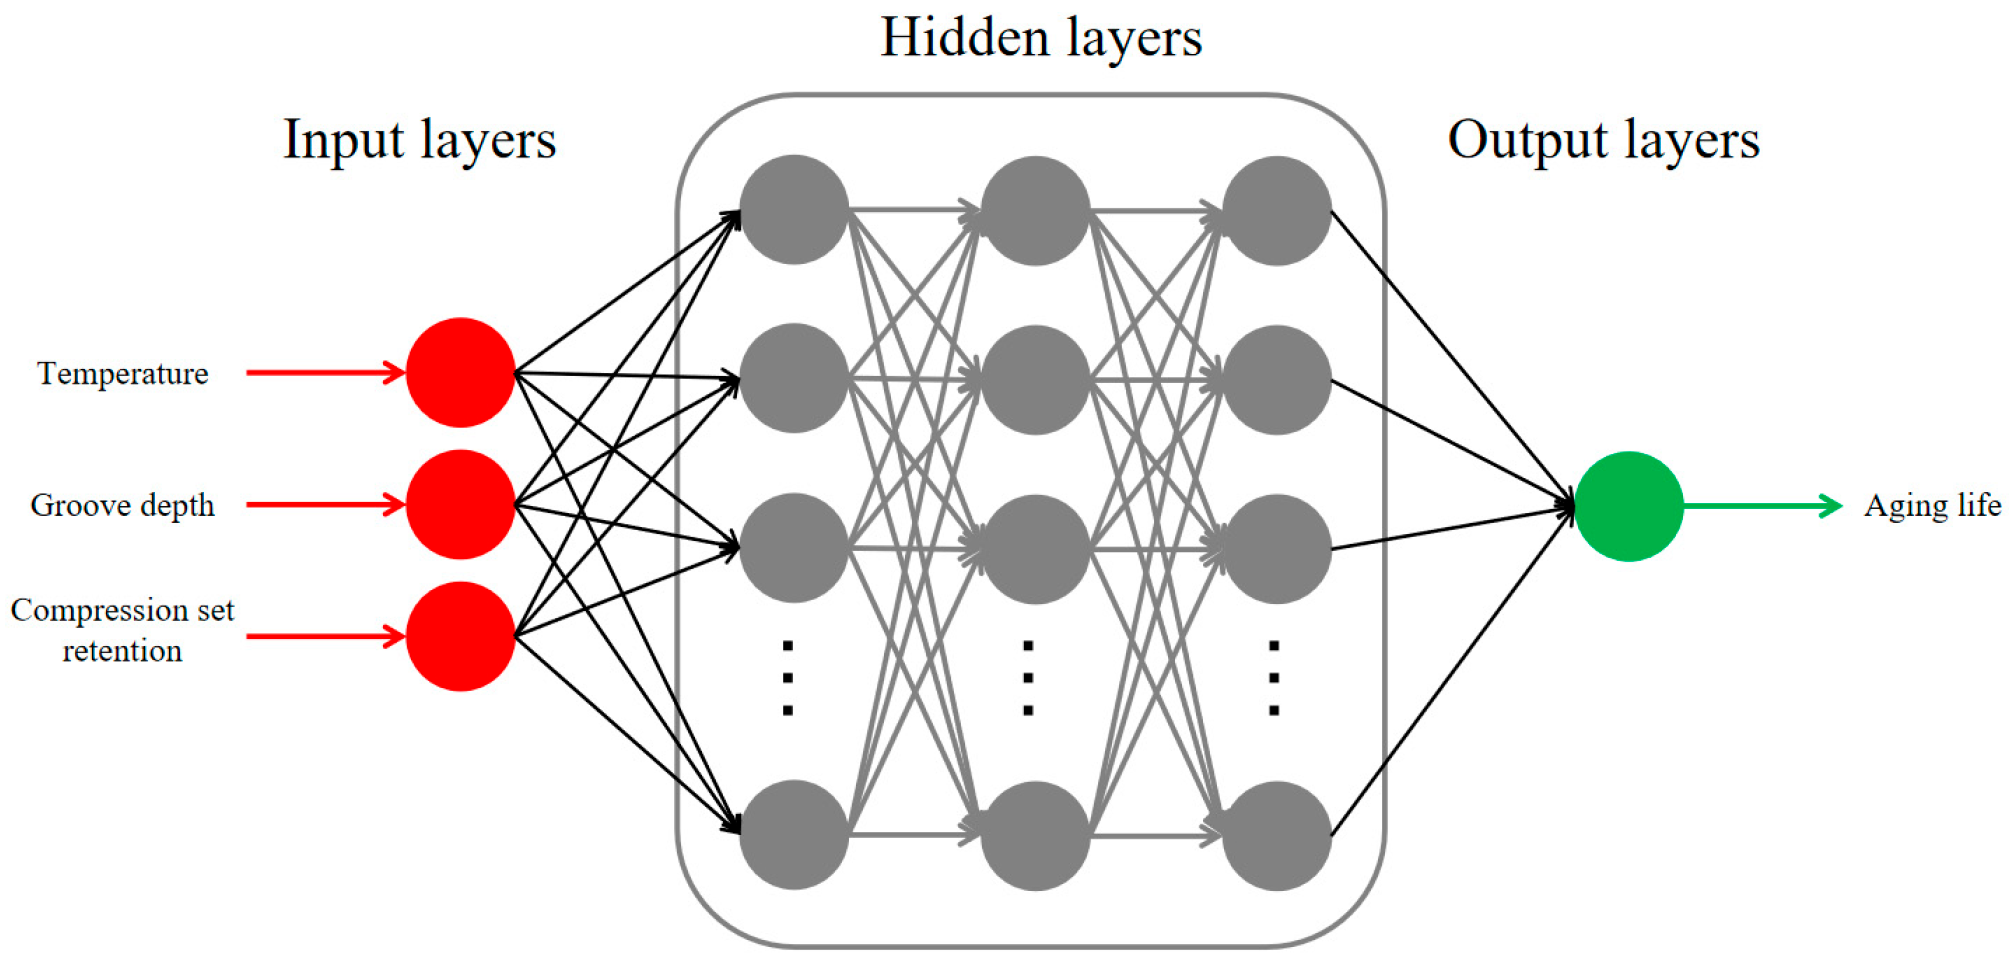
2.3.1. Construction of the ANN Model

For the problem of predicting the aging life of O-rings using data-driven methods, this study employed the ANN model. The aging life of O-rings is typically influenced by multiple factors and exhibits significant nonlinear characteristics, such as the coupled effects of temperature on lifespan. The ANN has a strong nonlinear fitting capability and can automatically learn complex mappings between inputs and outputs from data. This enables the ANN model to better capture the dynamic characteristics of material degradation over time in the prediction of nonlinear and non-stationary aging processes. Moreover, the ANN demonstrates better robustness in handling high-dimensional features and noisy data, and with appropriate adjustments to the network structure and training parameters, the training time of the ANN remains within an acceptable range.
As shown in Figure 4, the ANN model typically consists of three main components. The input layer is responsible for receiving external data, with each node corresponding to an input feature. In this study, the inputs include temperature, groove depth, and compression set retention. The hidden layers consist of multiple neurons that primarily perform feature extraction and data transformation. Increasing the number of layers generally enhances the model’s learning capability. The output layer generates the final prediction results, with the number of output nodes determined by the specific task. In this study, the output is the aging life of O-rings.
The input data vector X is processed by each neuron, where it is multiplied by weights and added to a bias. Then, the output result Y is obtained by applying the activation function f.
Y = f w · X + b
where w and b represent the weight and bias of the neuron, respectively. The activation function f is used to enhance the expressive capability of the neural network. In this study, the ANN training process relies on the Adam optimization algorithm. Adam combines the advantages of the Momentum method and the RMSprop algorithm, improving model performance and accelerating convergence. To control the training process and ensure effective parameter adjustments within a reasonable time frame, the ANN model in this study is trained with a fixed number of 1200 iterations.

2.3.2. Establishment of the Database

The ANN model was constructed, trained, and validated by applying the Python 3.10 programming language. The model inputs include important variables related to the aging life of the O-ring, namely, temperature, groove depth, and user-defined compression set retention. The output of the model is the aging life of the O-ring.
First, a correlation analysis was conducted on the features in the database. Figure 5 presents the correlation coefficients between the input and output parameters of the model. It can be observed that the correlation coefficients between the three input features are very small, indicating that they are considered unrelated. Temperature shows a weak negative correlation with the aging life of the O-ring, while the other two input features are not correlated with the O-ring’s aging life. This suggests that the use of an ANN model is more appropriate for the problem studied in this paper than a simple linear machine learning model.
The degradation model obtained in Section 2.2 is used to expand the machine learning database, resulting in 956 sets of data on O-ring aging life under different operating conditions and compression set retention. After randomly shuffling the data, they are divided into a ratio of 7:3. The 669 sets were used for training and the remaining 287 sets for testing. In order to improve the training efficiency and stability of the neural network, the data in the ANN model are normalized before entering the hidden layer.

2.3.3. Parameter Optimization and Aging Life Prediction

The prediction accuracy of the mode is largely determined by the internal structure of the model. In an ANN model, hyper-parameters such as the activation function, the number of hidden layers, and the number of neurons in each hidden layer need to be optimized. Two indicators of the RMSE and the coefficient of R2 are applied to evaluate the quality of the parameters. The expressions for these indicators are as follows:
R M S E = 1 n i = 1 n ( y i y ^ i ) 2
R 2 = i = 1 n ( y ^ i y ¯ ) 2 i = 1 n ( y i y ¯ ) 2
where y i is the expected value, y ^ i is the predicted value, y ¯ is the average of the expected values, and n is the number of samples. It is known that a smaller RMSE value or an R2 value closer to 1 indicates better model quality. In addition, we also added the MAPE to the prediction results of the ANN model to visualize how much the model’s predictions deviate from the true values on average. The MAPE is a commonly used measure of forecast accuracy and is expressed as a percent as follows:
M A P E = 1 n i = 1 n y i y ^ i y i × 100 %
The activation function is the rectified linear unit (ReLU) function, which effectively addresses the vanishing gradient problem and is commonly used in deep networks. When optimizing the parameters of the ANN model, it is necessary to discuss in detail the selection of the number of hidden layers and the allocation of neurons within each hidden layer.

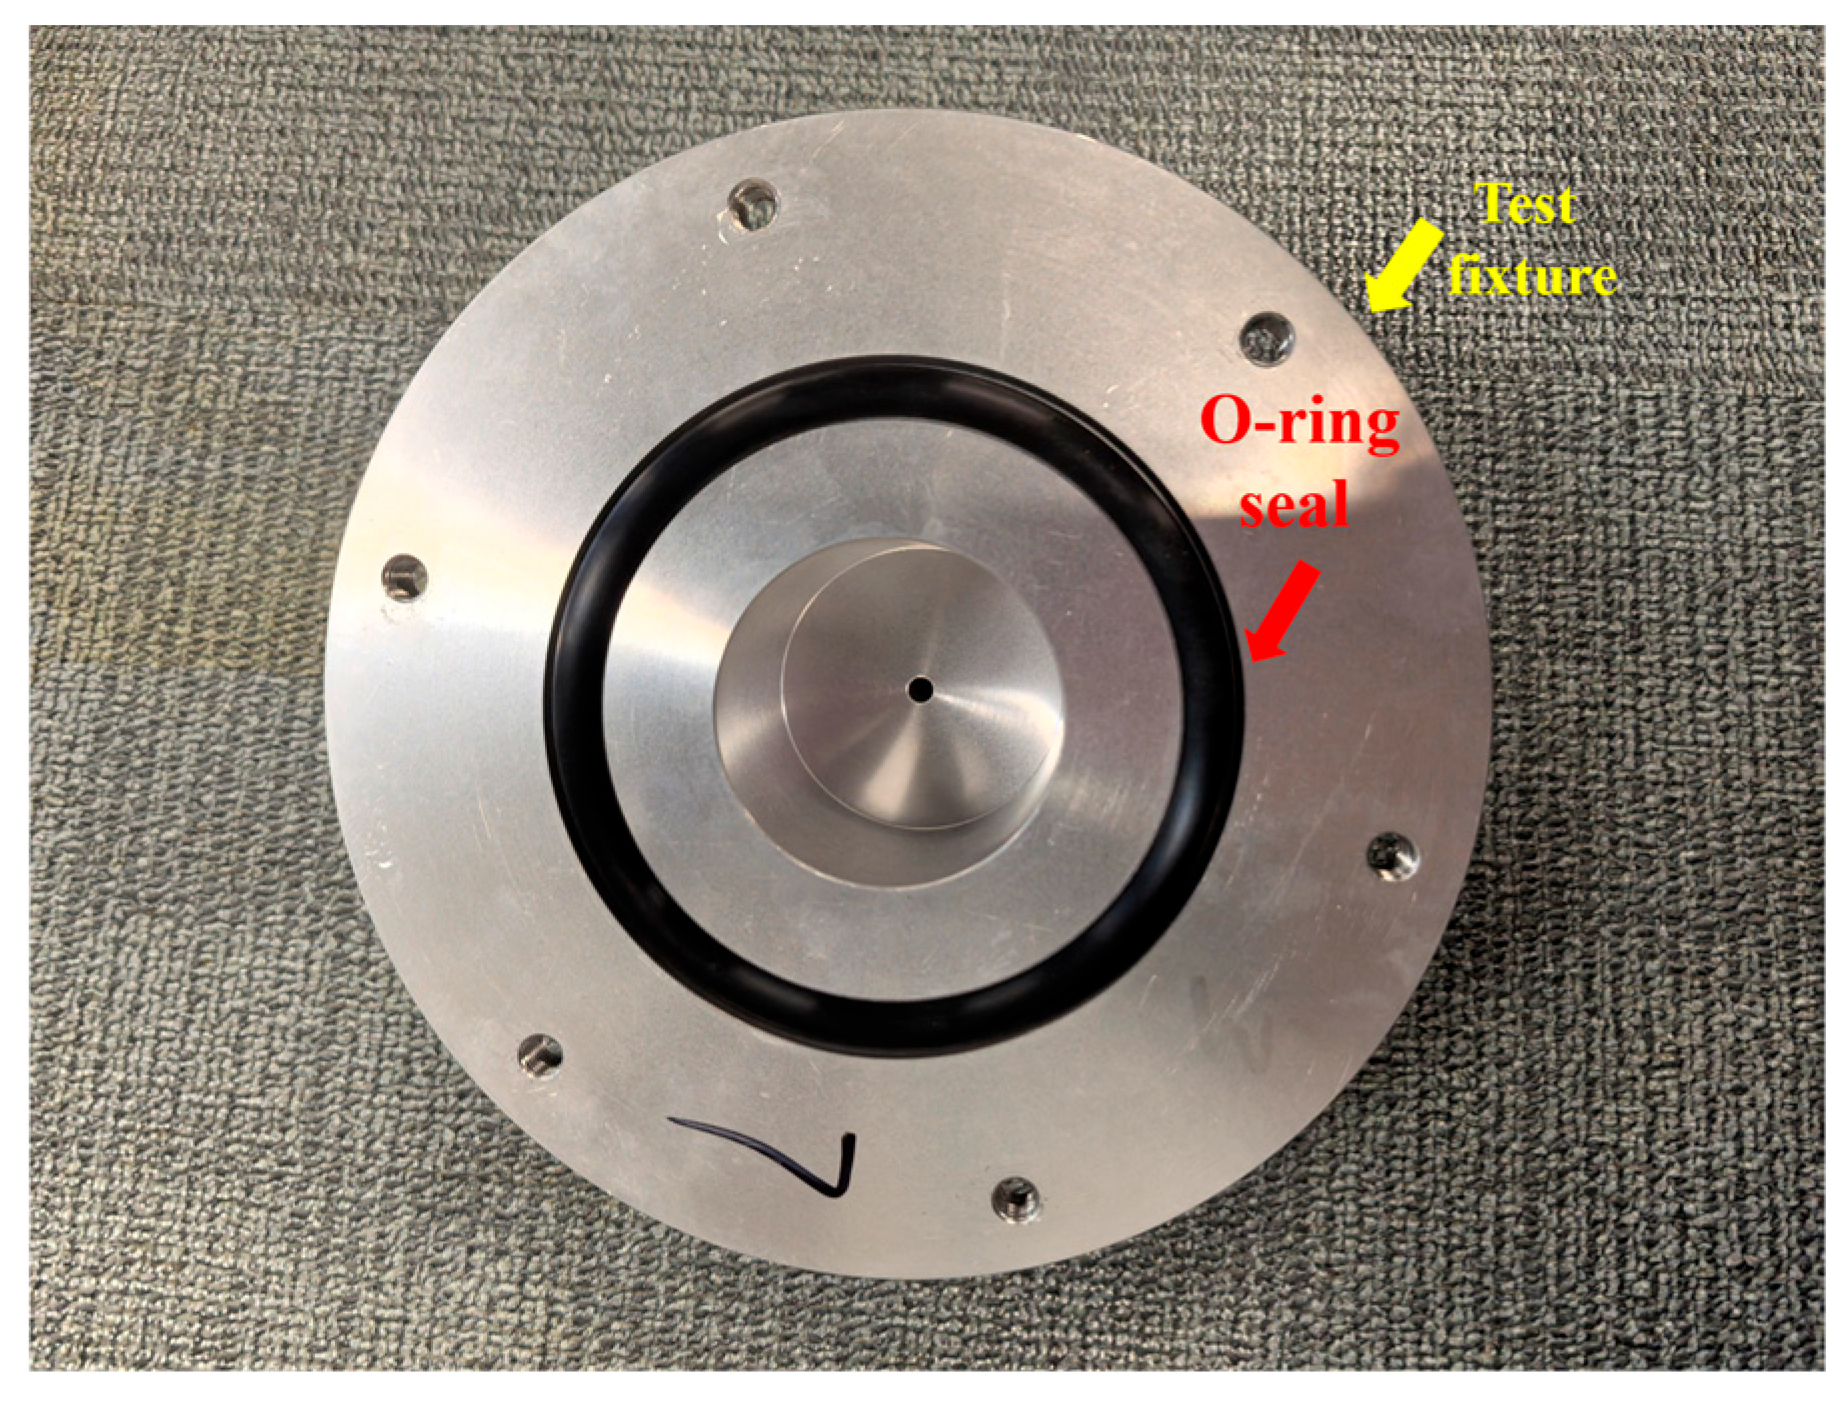
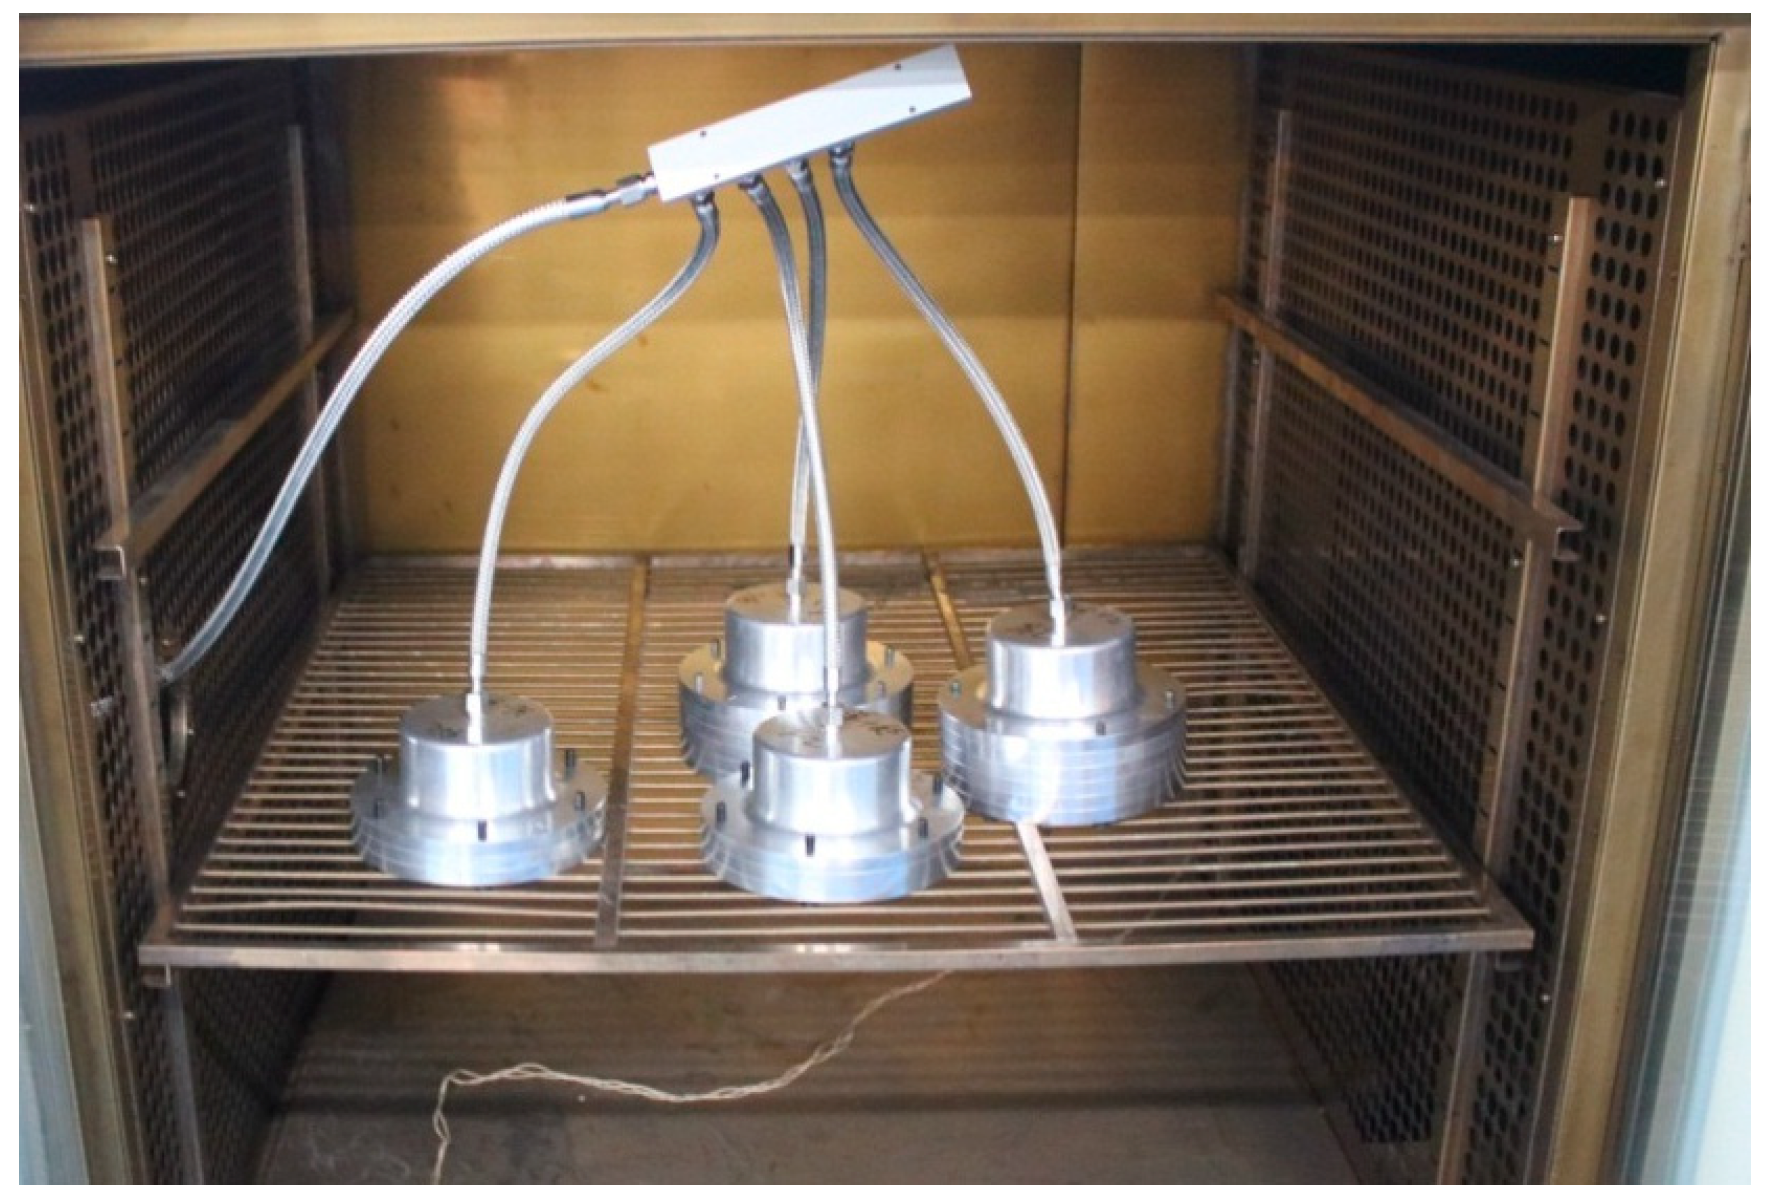
3. Accelerated Thermal Aging Test

EPDM is a type of synthetic rubber that is widely used in industrial applications due to its excellent resistance to aging, ultraviolet (UV) radiation, heat, and chemicals. Accelerated thermal aging tests were conducted to investigate the sealing performance of EPDM under two sealing structures with different compression ratios of 28.6% and 18%.
According to the requirements of GB/T 20028-2005 [41], five temperatures of 90 °C, 110 °C, 120 °C, 130 °C, and 140 °C are chosen as the aging temperature in our study. The parameters of the accelerated thermal aging experiment are listed in Table 1. The groove depth of the sealing structure with a 28.6% compression ratio is 6 mm, while the groove depth of the sealing structure with an 18% compression ratio is 6.9 mm.
The test fixture simulates the actual engineering application, which is aluminum alloy flange parts, and the O-ring is put in its groove, as shown in Figure 6. According to the numerical results, the roughness of the aluminum alloy material, flange mounting surface, and sealing surface are all machined to Ra1.6 μm. One mounting groove dimension matches the actual engineering specifications, while the other one is machined based on the numerical analysis results. Prior to installation, the test fixture with mounting grooves must undergo drying treatment to remove surface grease, attached debris, etc. When installing the sealing ring, one should ensure proper placement without twisting or flipping.
In addition, the assembled sealing O-ring sample is first placed on the tray of the high-temperature aging chamber at a specified distance to make the sealing ring sample evenly heated. The placement of test specimens during the accelerated thermal aging test is shown in Figure 7. During the aging test, the test specimens were subjected to a temperature load and a 0.6 MPa air pressure load. After the heat preservation stage, the fixture is removed. The assembled samples are then cooled in air for 1 h before individually removing the sealing ring assemblies for subsequent disassembly operations. Samples were taken according to the planned time, and the compression set rate of the sealing ring was measured. It is noted that among the five temperature levels, the compression value should reach the critical value at the termination of testing at three higher temperature levels. For lower temperature conditions, the compression value at the end of the test should not be less than 50%.

4. Results

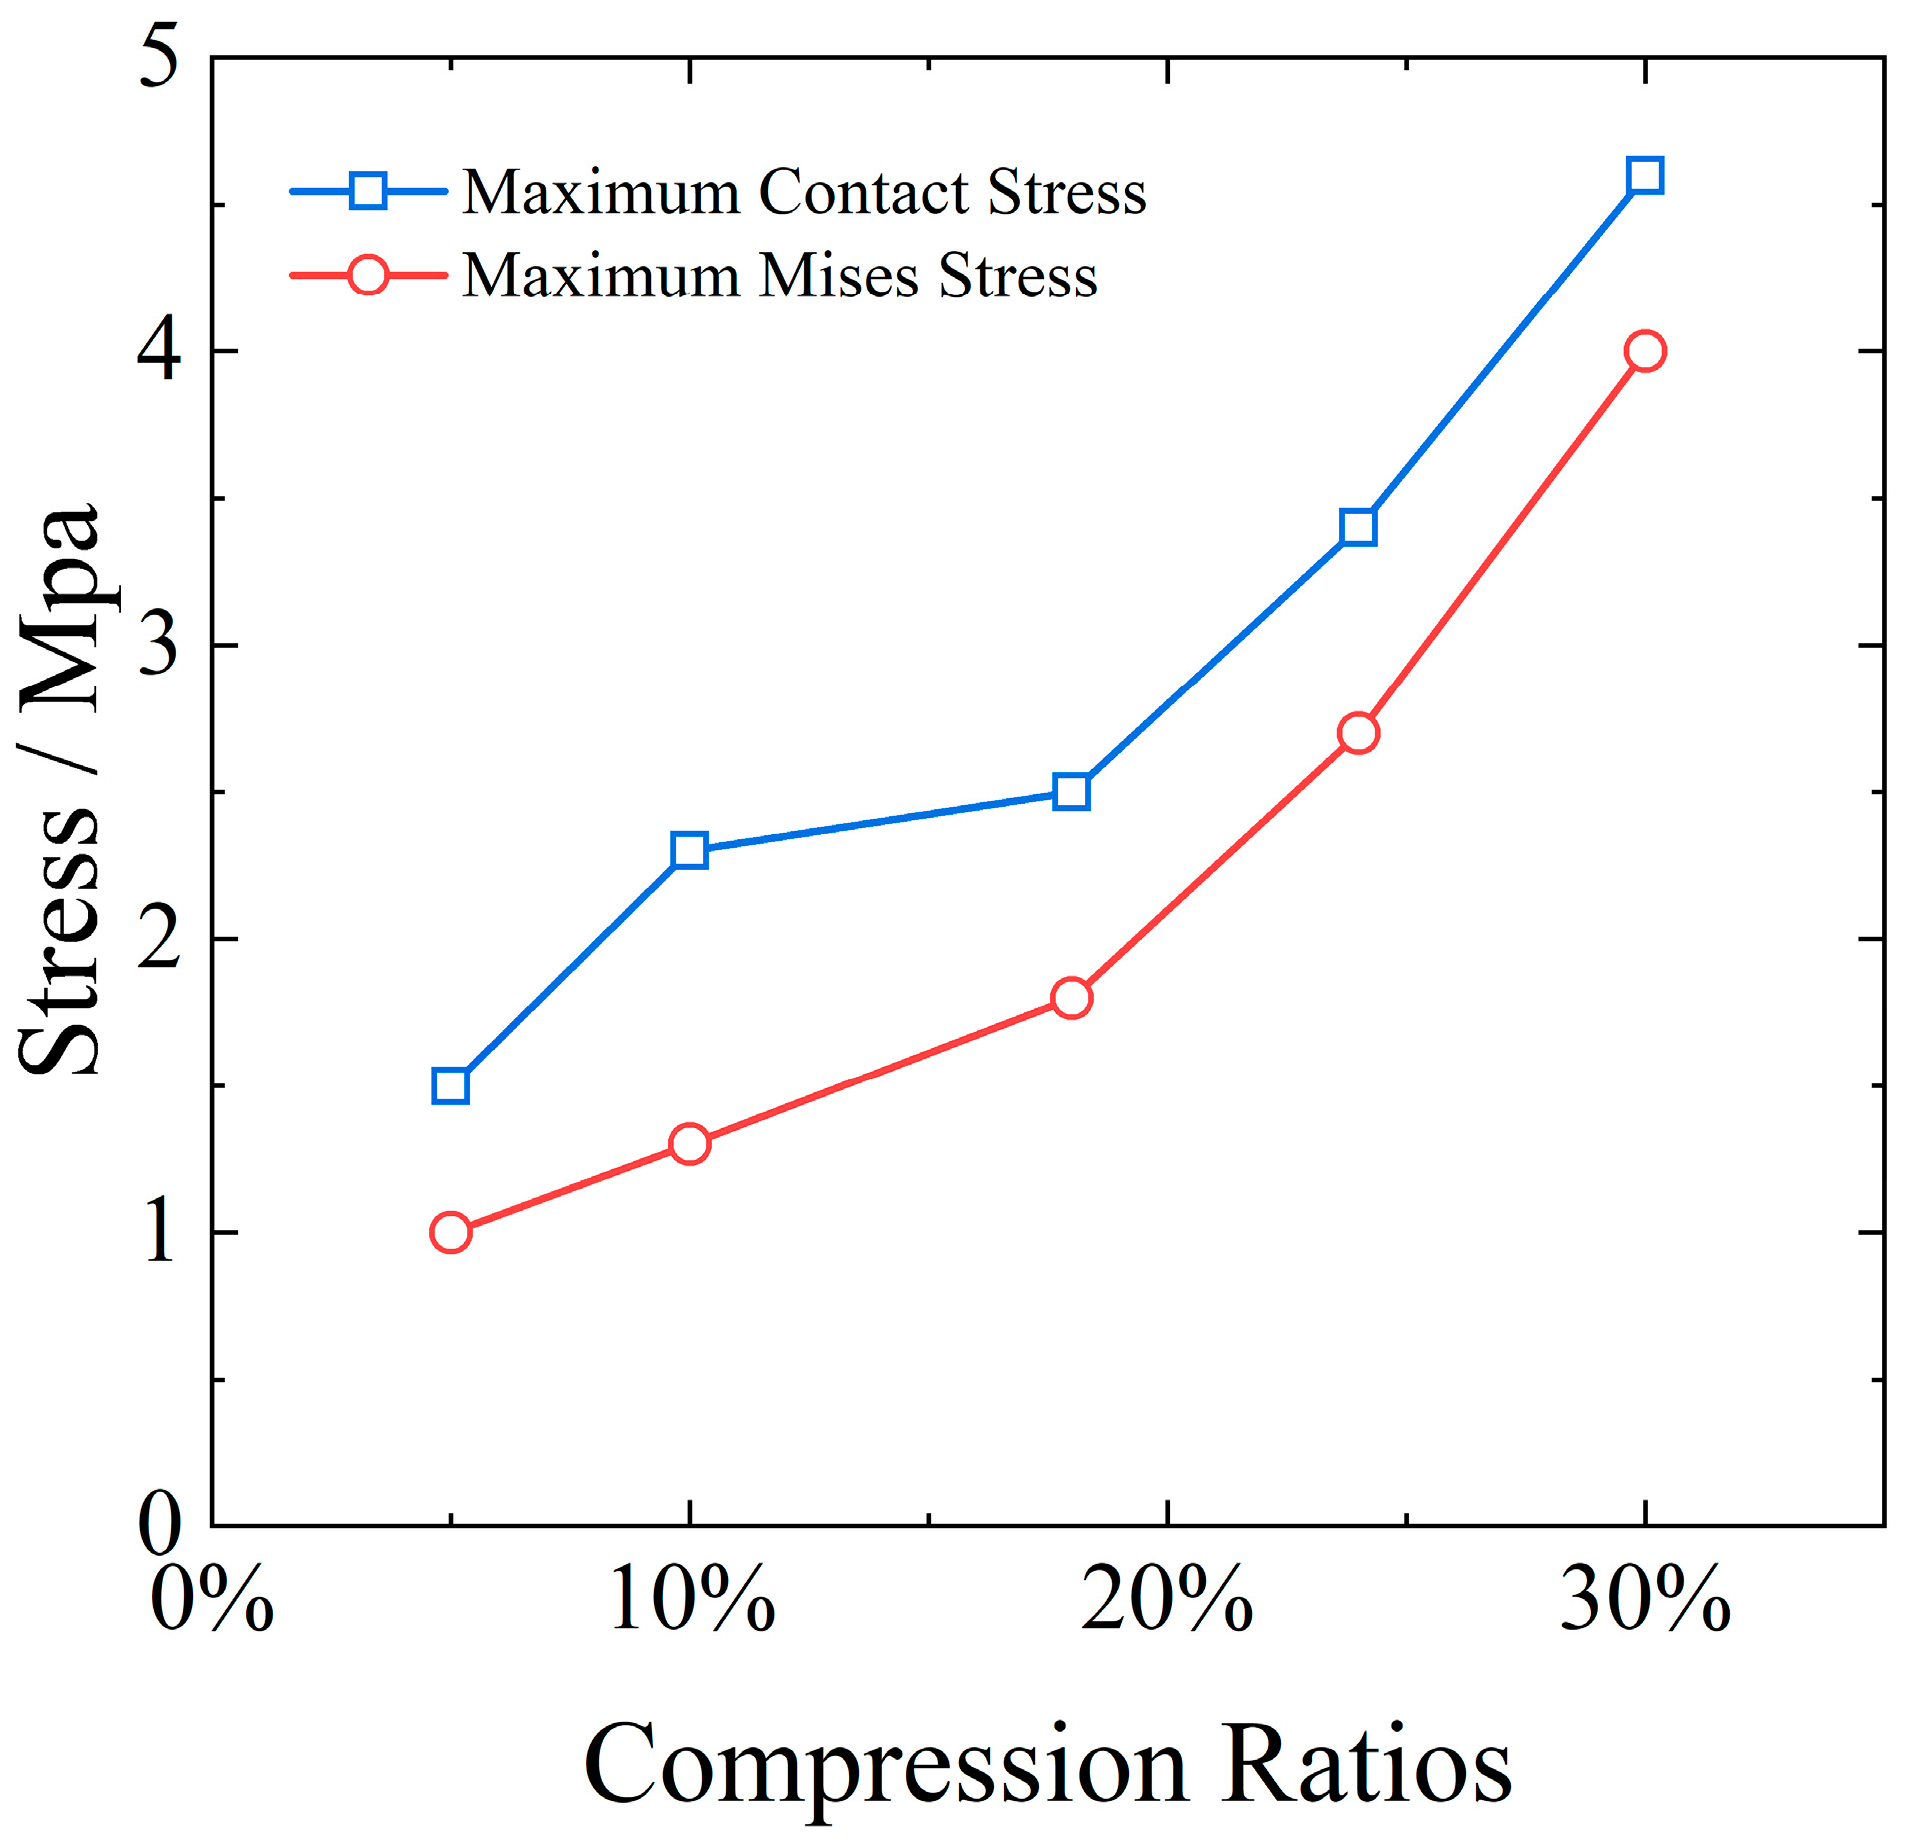
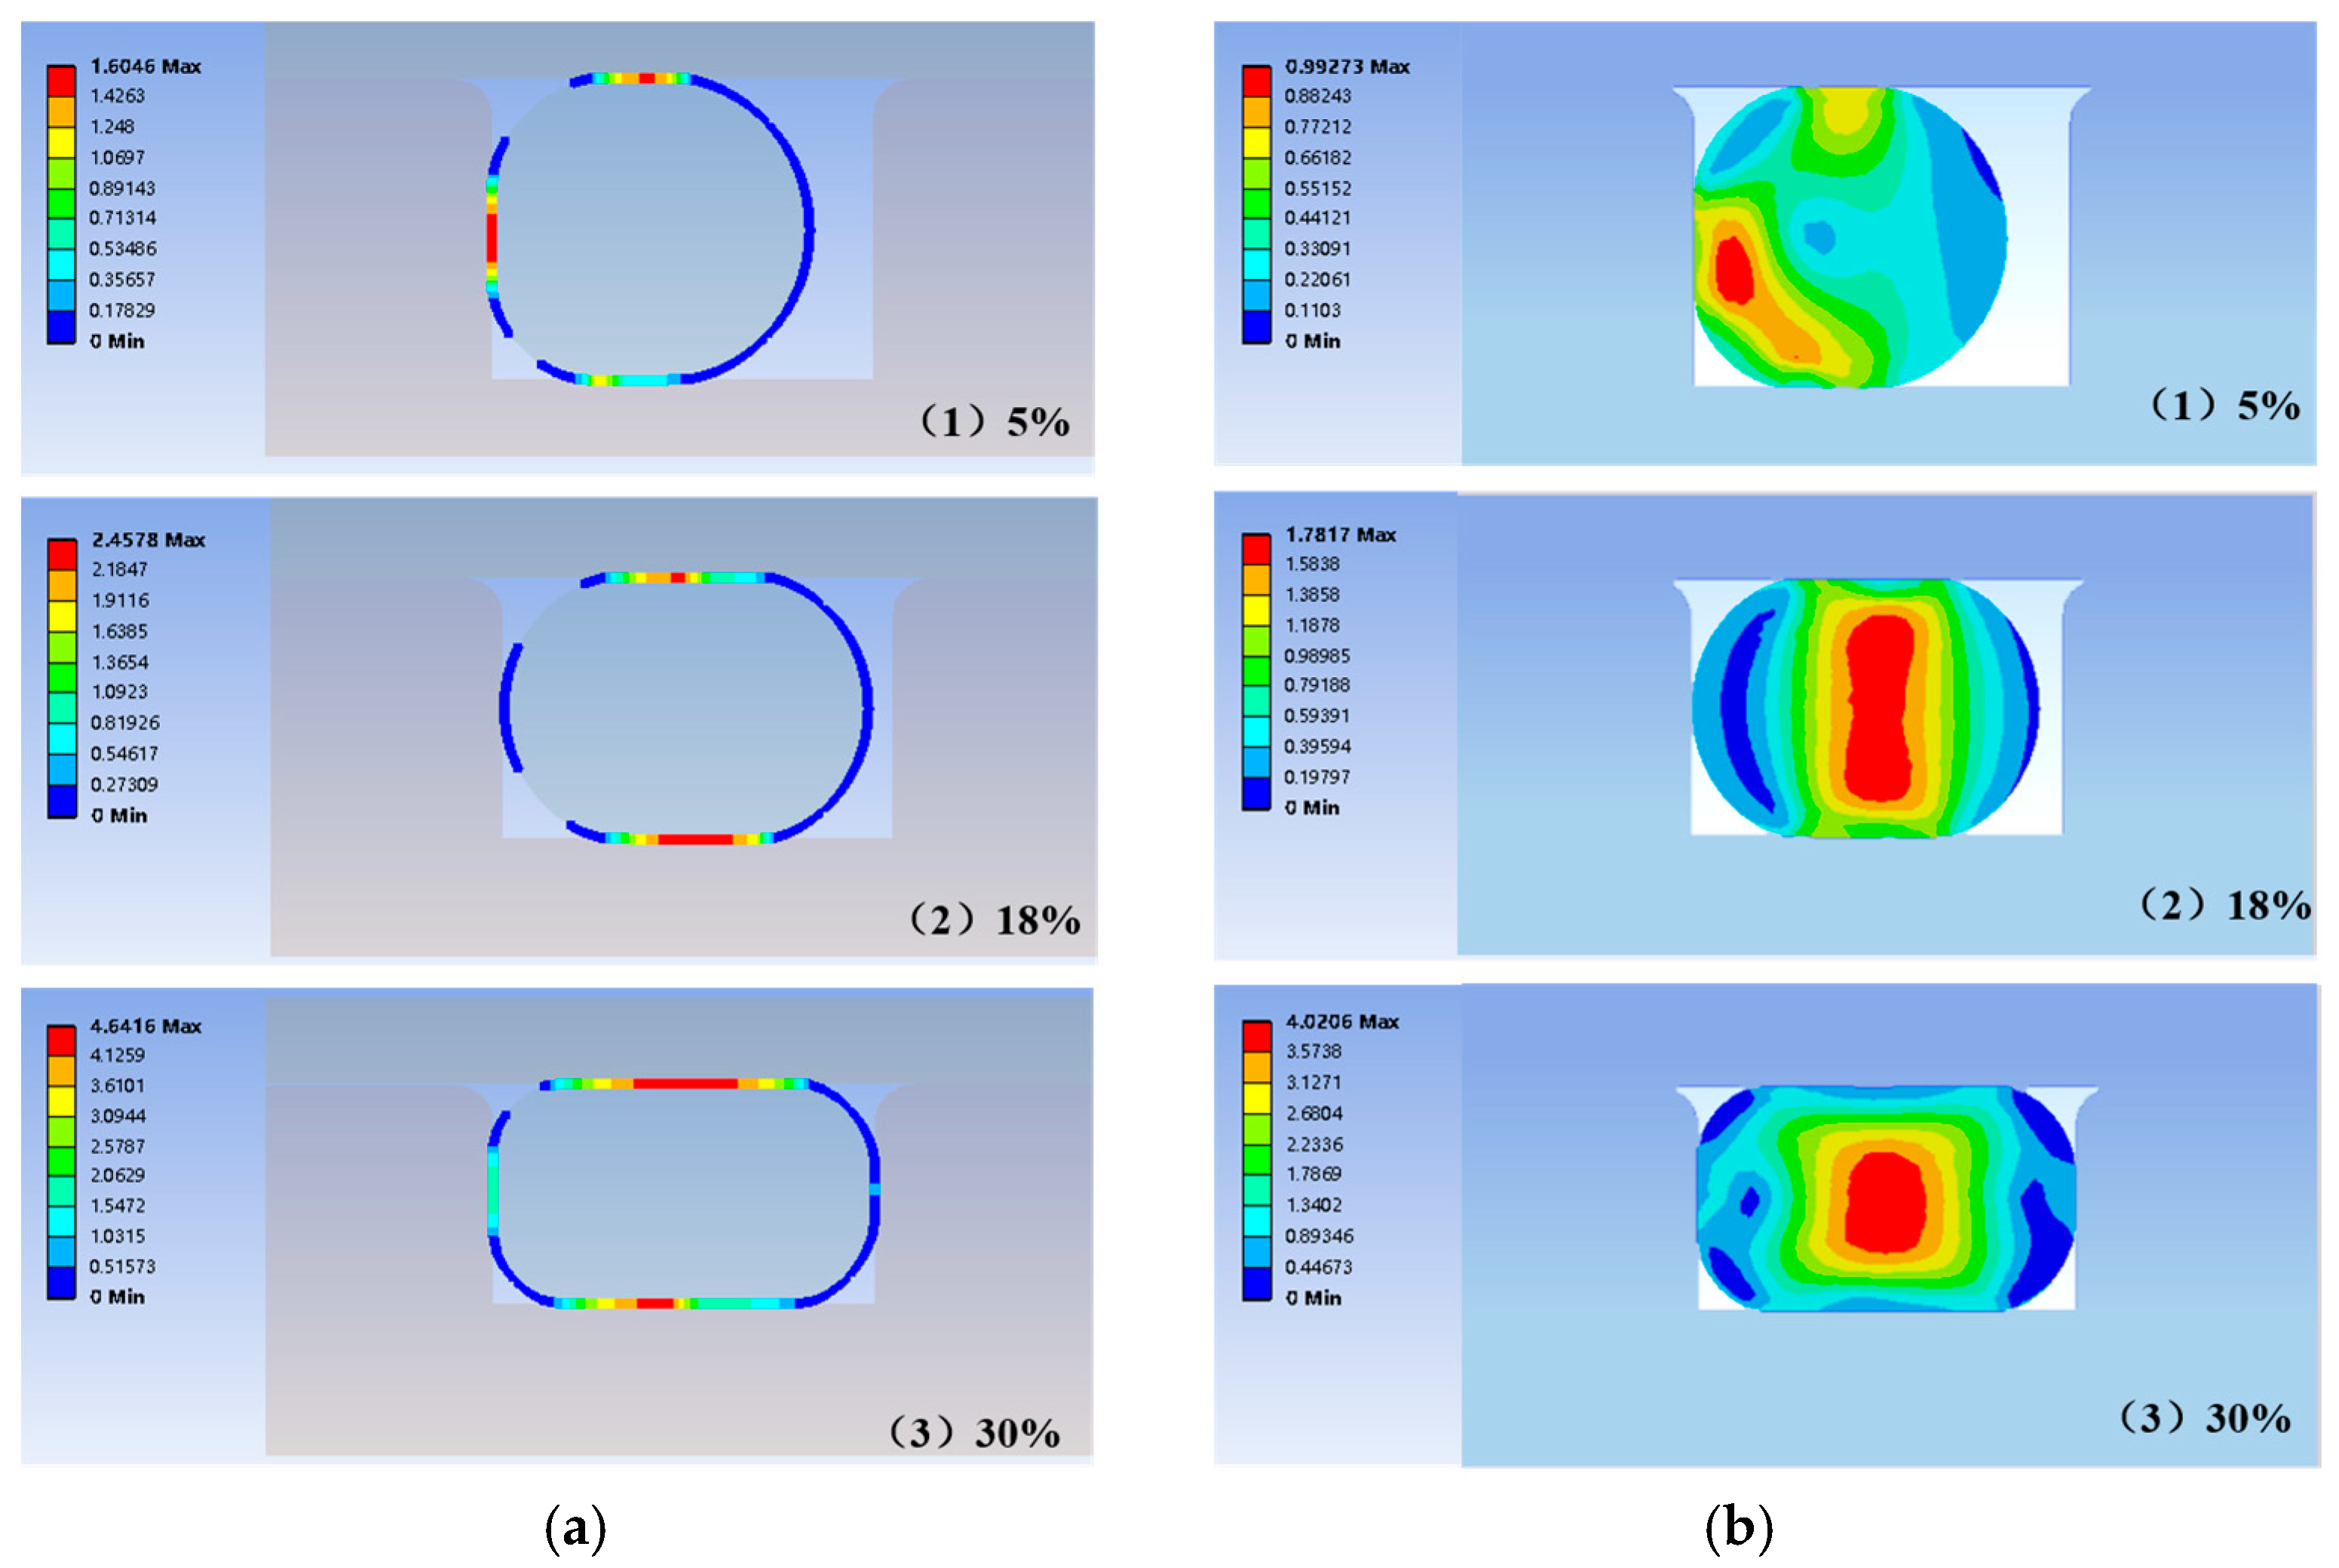
4.1. Effect of Different Compression Ratios

The simulation analyses of O-rings were conducted to assess the sealing performance under different groove depths and compression ratios. The specific simulation parameters are shown in Table 2. The roughness of the material is 1.6 μm.

4.1.1. Results of Macro-Comprehensive Numerical Analysis

The variation of maximum contact stress and maximum Von Mises stress under different compression ratios is shown in Figure 8. It can be observed that as the compression ratio increases, both the maximum contact stress and the maximum Von Mises stress gradually increase. After the compression ratio exceeds 18%, the maximum contact stress increases rapidly. However, the maximum Von Mises stress also increases rapidly, which makes the O-ring more prone to failure.
The distributions of contact stress and Von Mises stress under different compression ratios are depicted in Figure 9. From the contact stress distribution, it can be observed that when the compression ratio is small, the contact stress of the seal is primarily affected by the medium pressure. The main contact sealing surfaces are the contact area between the seal and the left sidewall of the groove, as well as the contact area between the seal and the upper flange. As the compression ratio increases, the contact sealing surface of the sealing structure gradually shifts to the contact areas between the O-ring and the bottom of the grooves in both the upper and lower flanges.
From the Von Mises stress distribution, it can be seen that when the compression ratio is small, the seal is mainly affected by the medium pressure, with stress concentration located at the contact area between the seal and the left sidewall of the groove. As the compression ratio increases, the influence of the compression ratio becomes more significant, and the stress begins to concentrate on both the upper and lower sides, forming a dumbbell shape. With further increases in the compression ratio, the stress concentration shifts toward the center, expands to both sides, and continues to increase. It is concluded that the dumbbell-shaped regions and the central region of the O-ring are prone to failure.
In this study, the finite element analysis mainly focused on contact stress distribution under different compression ratios at room temperature to guide sealing structure selection for aging tests. Due to the current lack of comprehensive nonlinear and temperature-dependent material models, direct numerical comparison with experimental aging data was not performed. The distribution of the contact stress and Von Mises stress are generally consistent with the reported studies [42,43], which to some extent validates the effectiveness of our results.

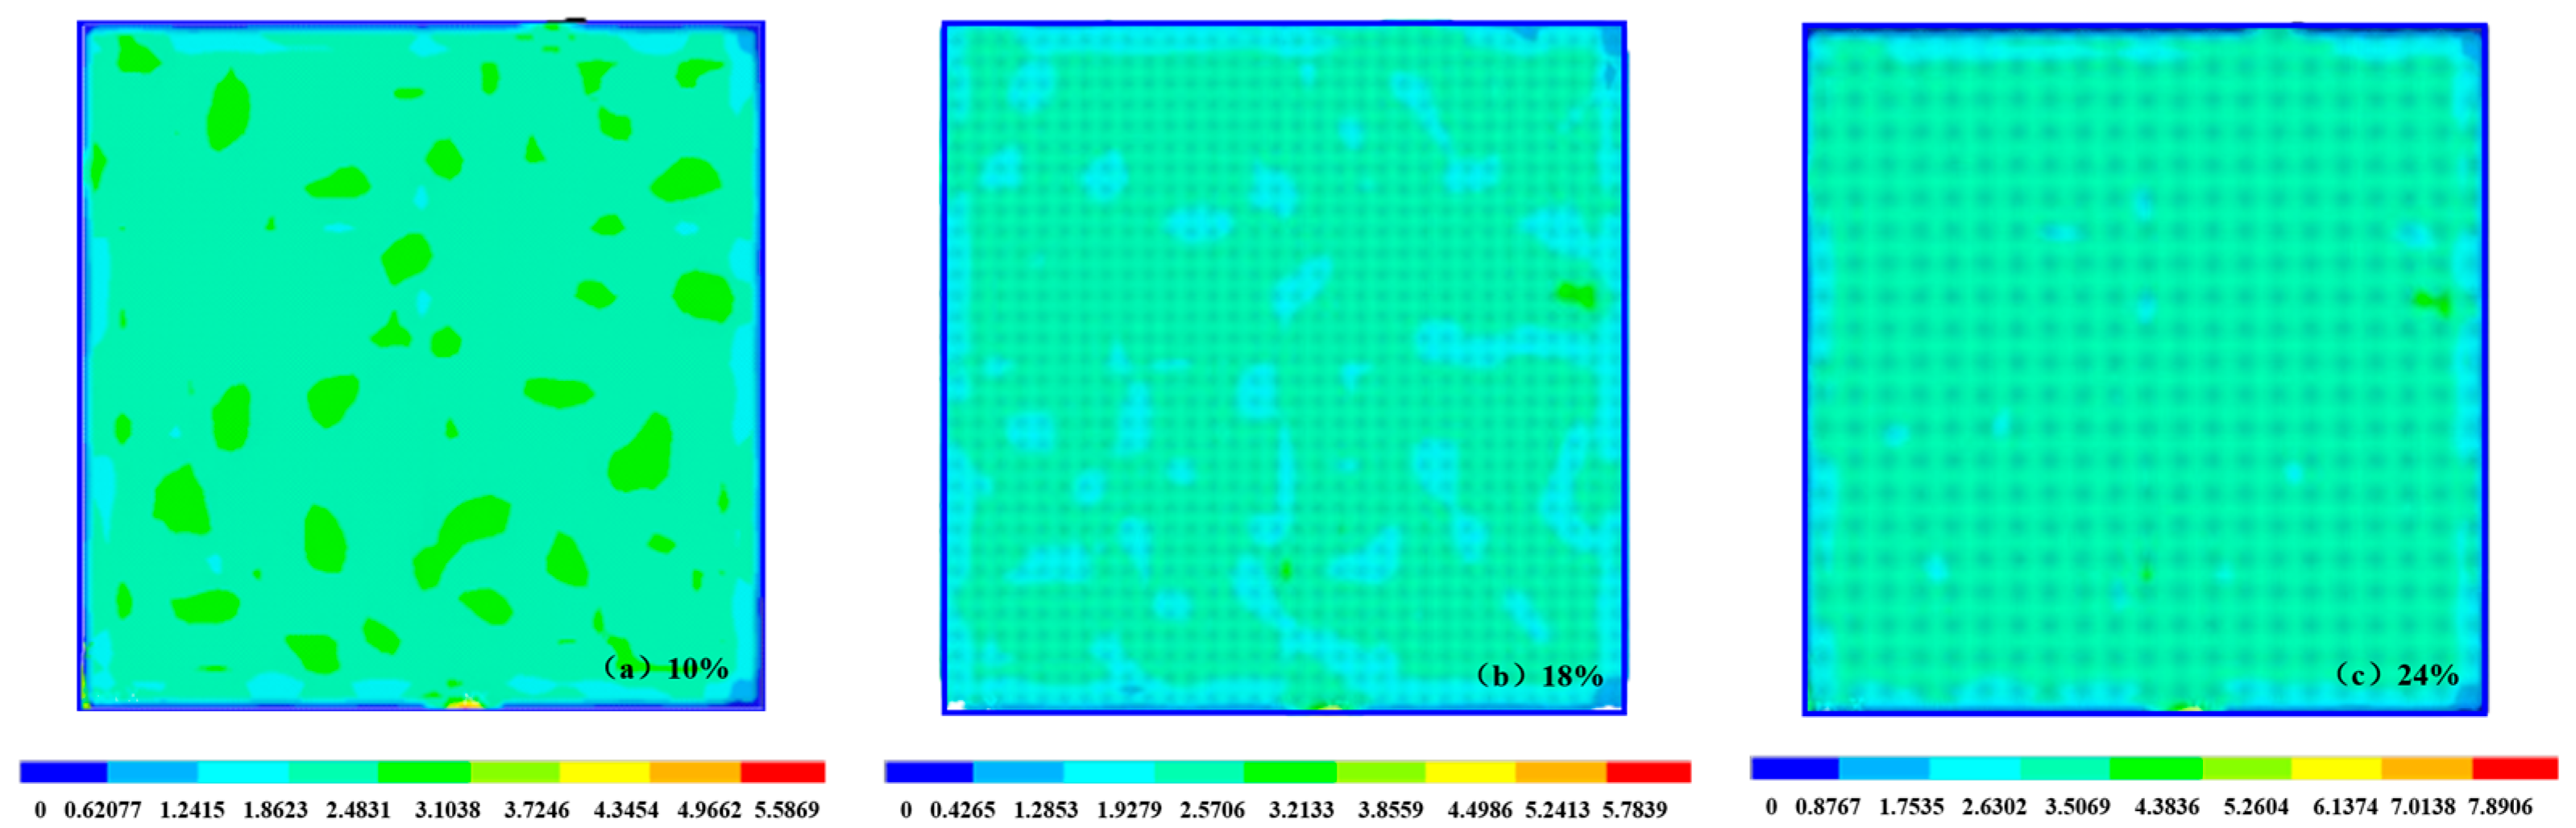
4.1.2. Results of Micro-Comprehensive Numerical Analysis

The variation of the maximum and minimum contact stresses at the microscopic roughness peaks with compression ratios is shown in Figure 10. It can be observed that both the maximum and minimum microscopic contact stresses follow the same trend, increasing with the compression ratio. Moreover, when the compression ratio exceeds 18%, the rate of increase becomes more significant. Additionally, when the compression ratio is 5%, the minimum contact stress on the microscopic surface is 0.2 MPa, which is less than the medium pressure of 0.6 MPa, thus failing to meet the sealing requirements.
The distribution of the microscopic roughness peak contact stress at different compression ratios is illustrated in Figure 11. It shows that, even with the same roughness parameters, the macroscopic maximum contact stress on the sealing surface differs due to the varying compression ratios, which results in differences in the microscopic contact stress distribution. As the compression ratio gradually increases, the microscopic roughness peak contact stress also increases, and the distribution becomes more uniform.
Based on the macro–micro comprehensive numerical analysis results, it can be found that a compression ratio exceeding 10% ensures the sealing pressure. After the compression ratio exceeds 18%, the distribution of the microscopic roughness peak contact stress becomes more uniform, and the maximum contact stress increases rapidly. However, the maximum Von Mises stress also increases rapidly, making the O-ring more prone to damage. An appropriate compression ratio should ensure that the contact stress is greater than the medium pressure, while also minimizing the Von Mises stress. In the subsequent aging tests, sealing structures with compression ratios of 28.6% and 18% will be selected for aging testing.

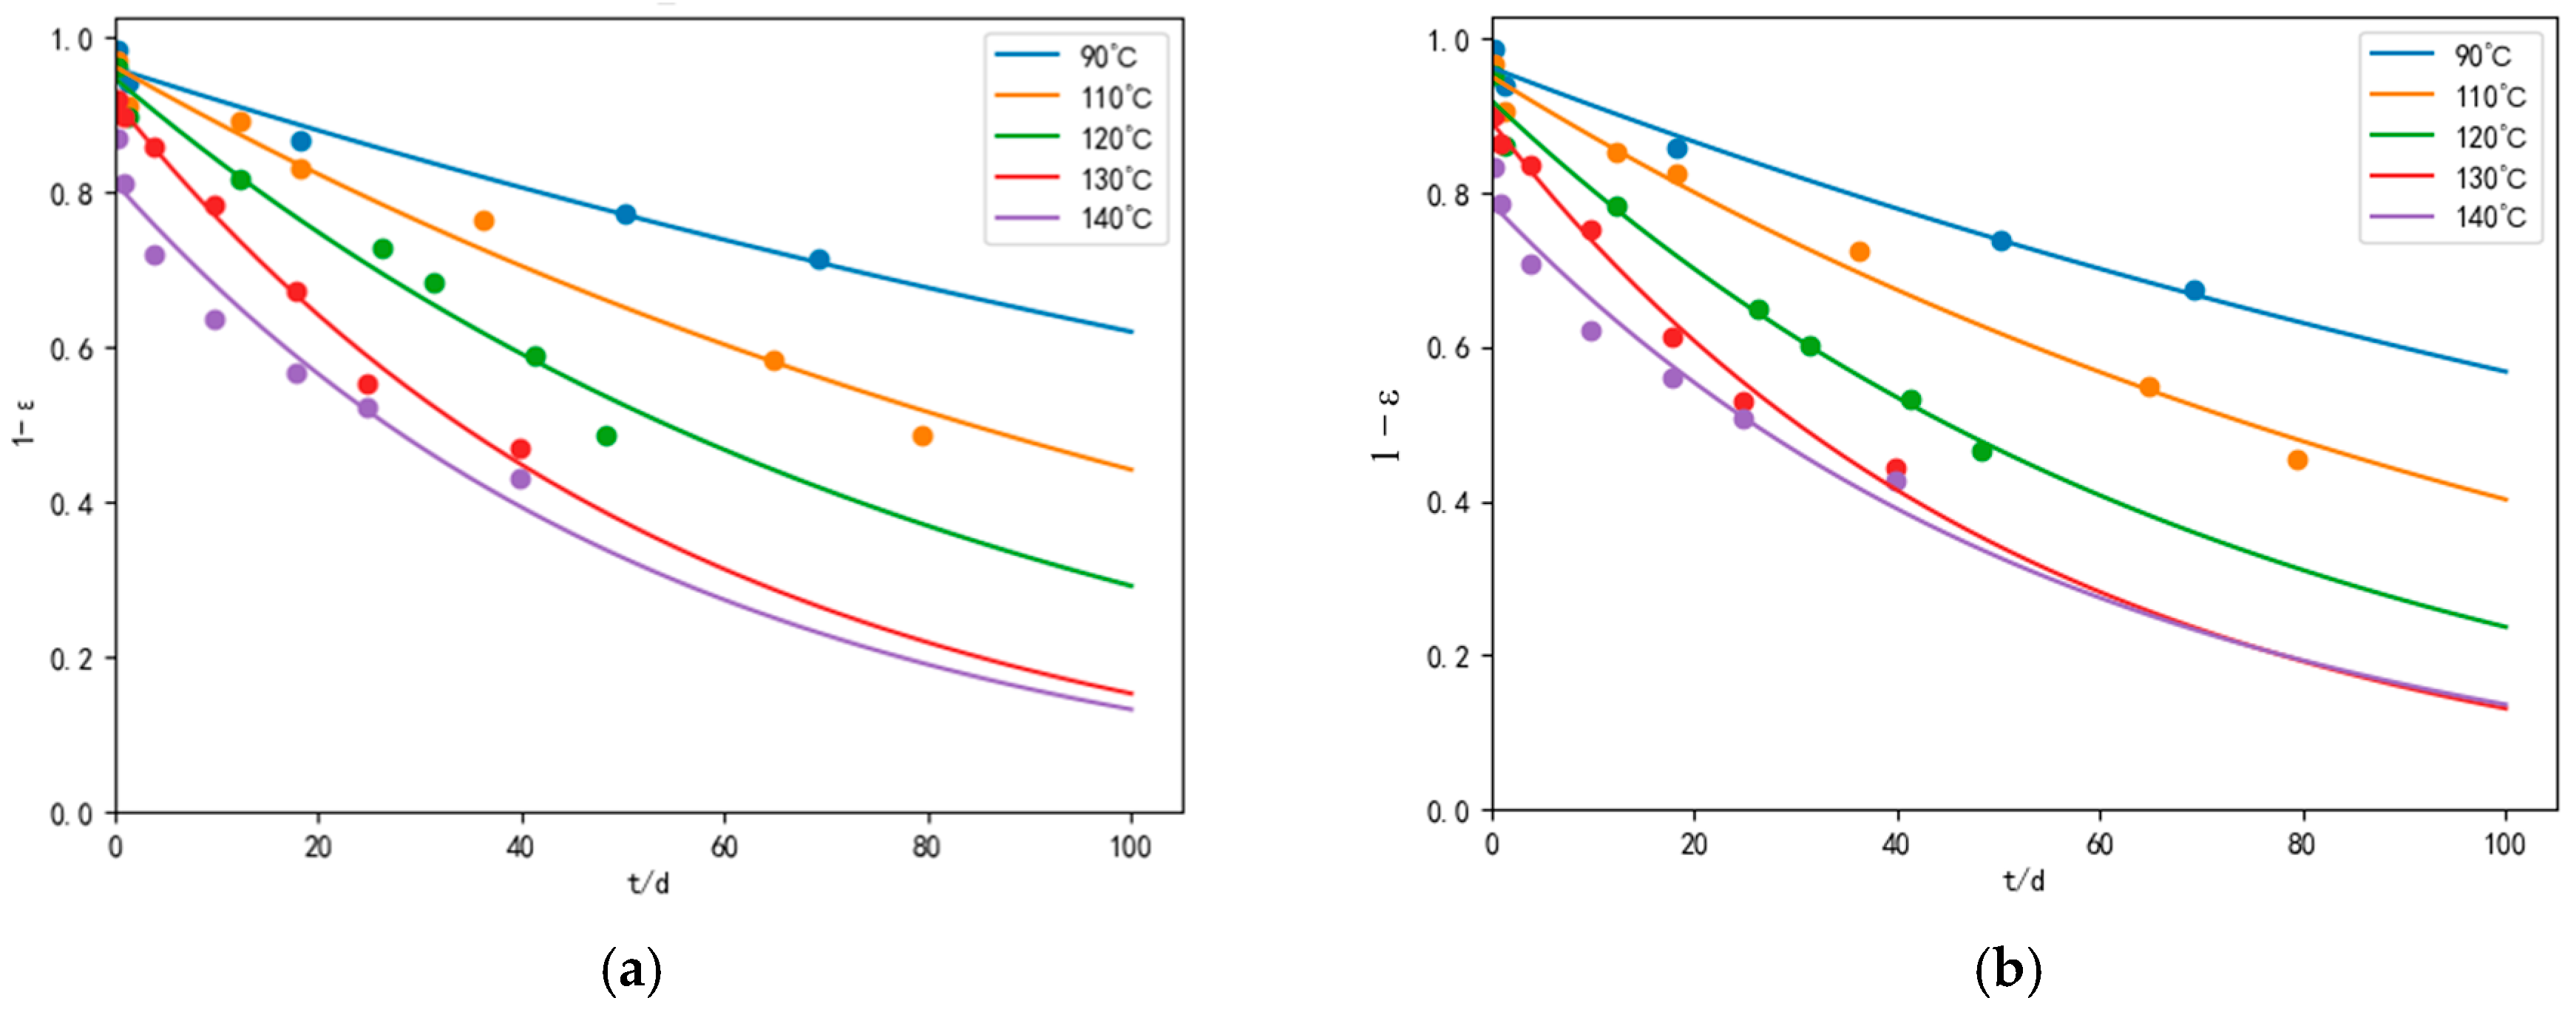
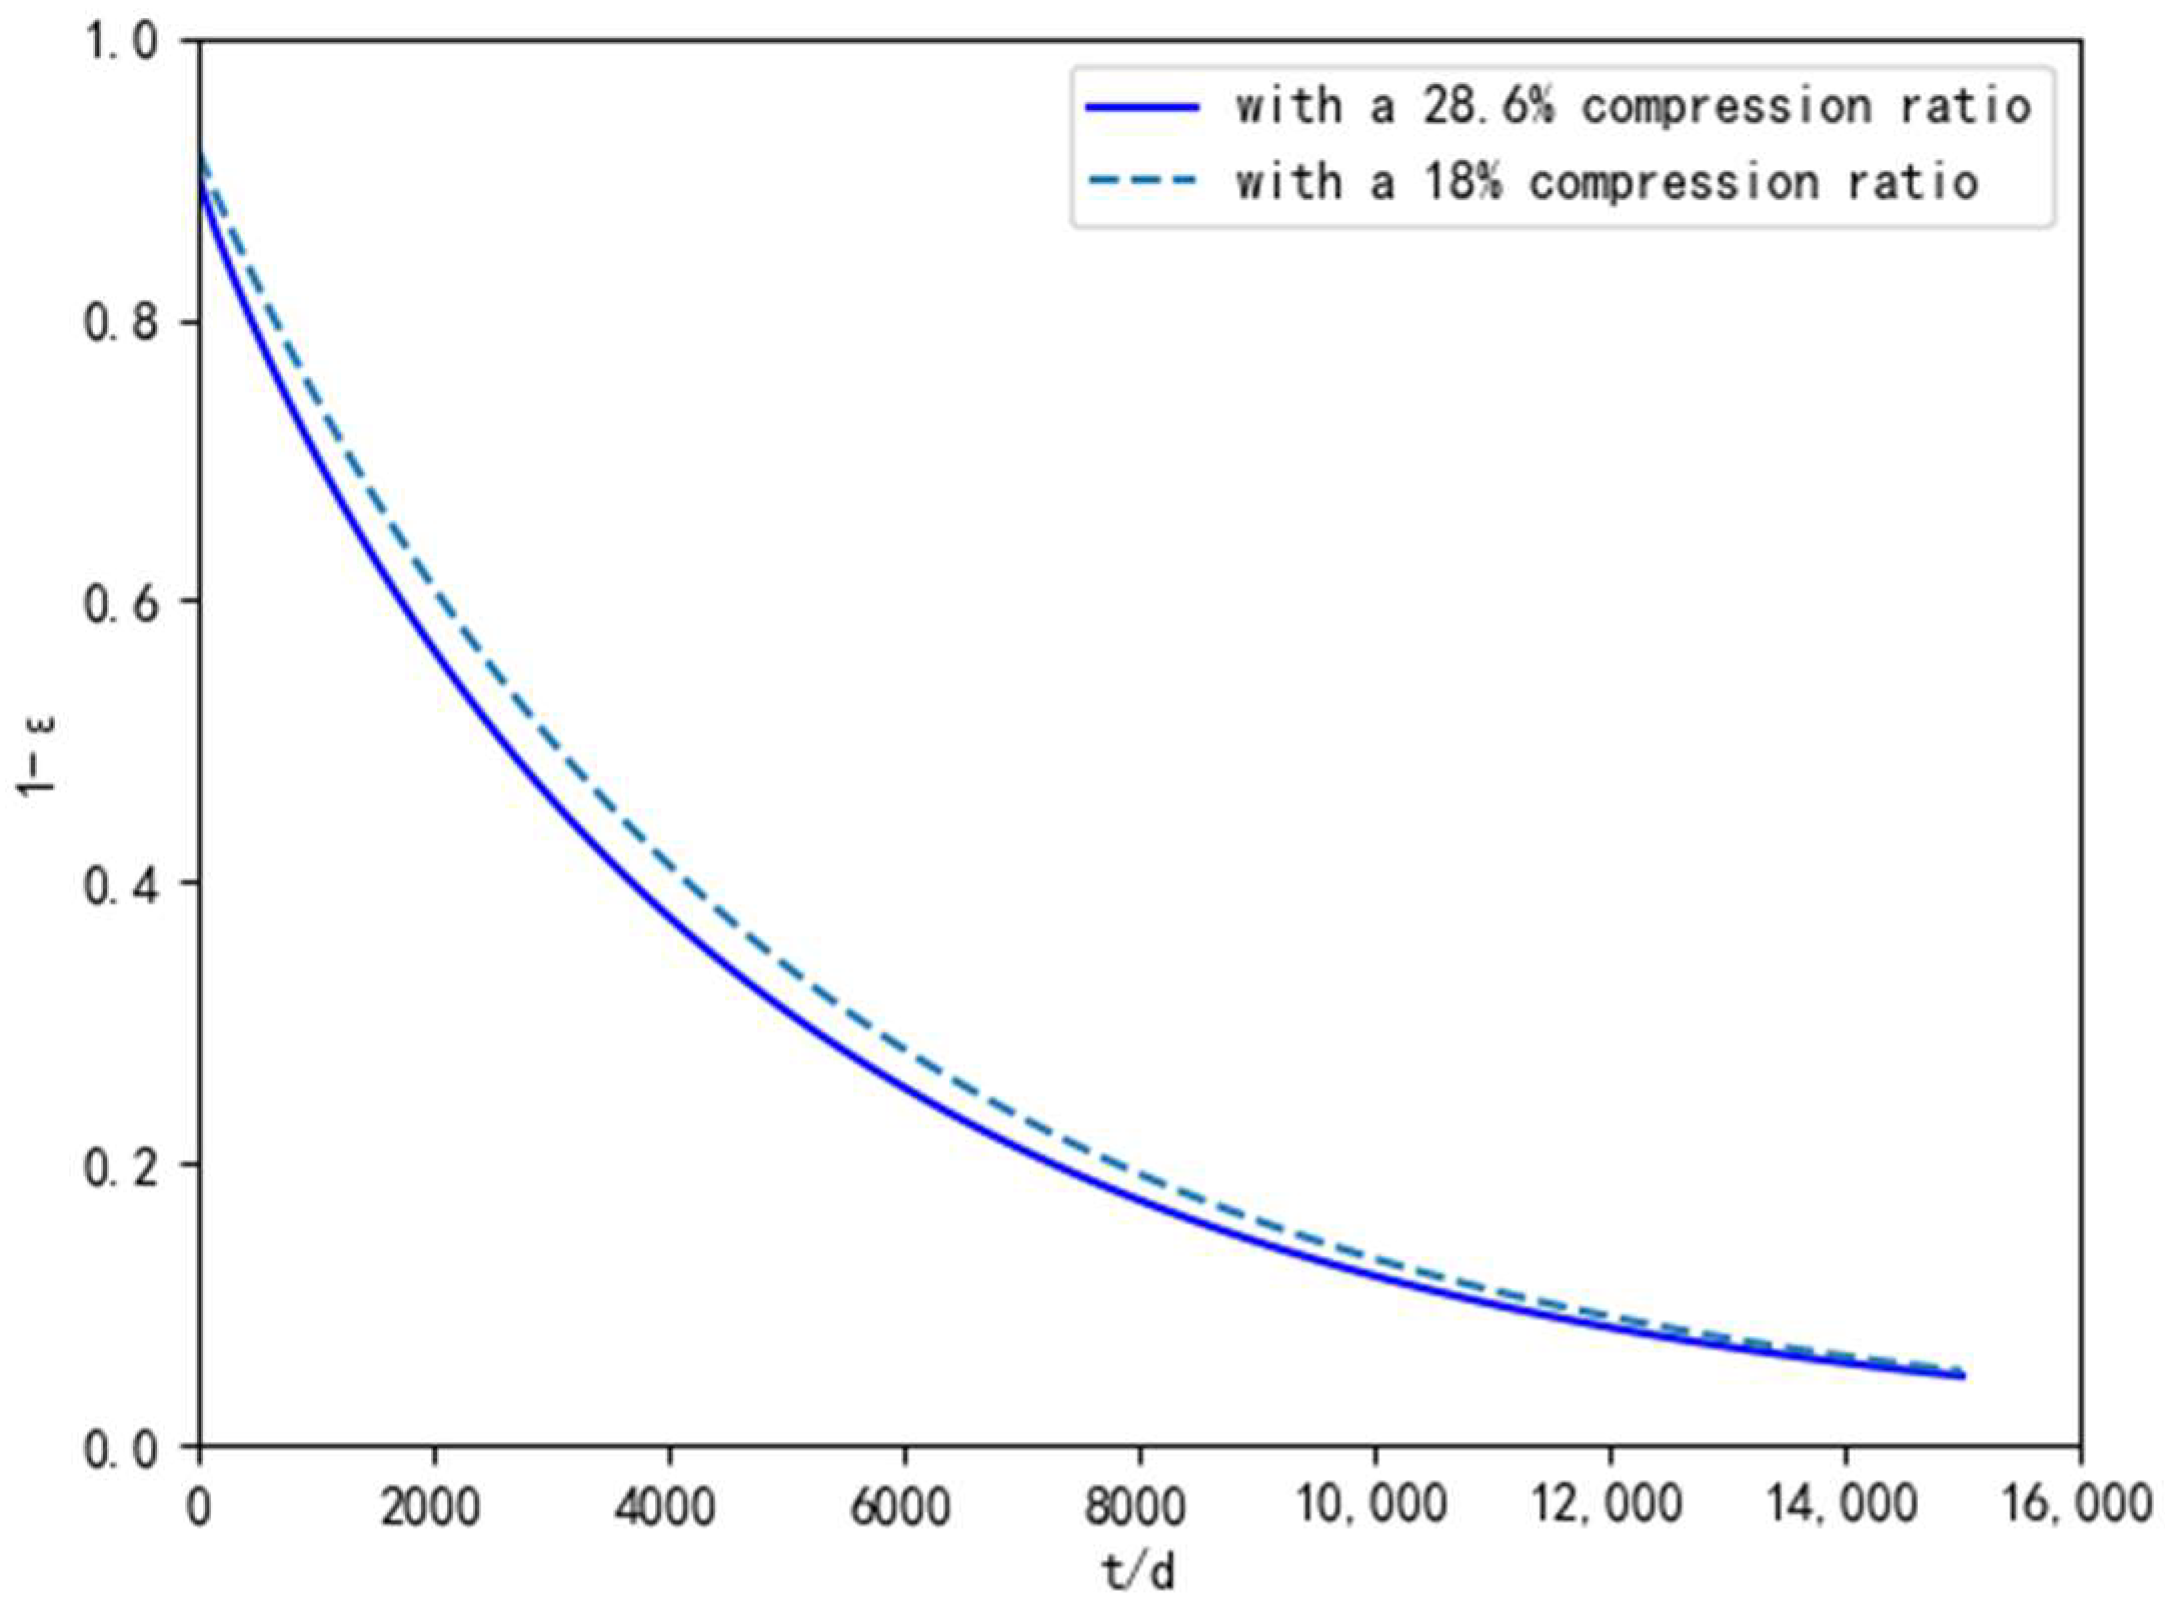
4.2. The Degradation Model of the Seal’s Performance

Accelerated thermal aging tests were conducted to investigate the sealing performance of EPDM under two sealing structures at five temperatures of 90 °C, 110 °C, 120 °C, 130 °C, and 140 °C. The results of the accelerated thermal aging tests were applied to obtain the degradation model of the seal’s performance.

4.2.1. Parameter Regression of the Degradation Model

The least squares method is used to fit and solve Equation (5) in order to obtain the performance degradation trajectory of the sealing ring at each temperature. The value of parameter α in Equation (5) is estimated using the successive approximation method. The approximation criterion is to adjust the estimated value of parameter α to two decimal places, at which point the value of I in the following expression is minimized.
I = i = 1 n j = 1 m k = 1 p Y i j k Y i j k ^ 2
Y i j k ^ = B ^ × e K i ^ t i j α
In the equation, Y i j k ^ represents the predicted value of the compression set retention rate for the k-th measurement of the j-th test sample at the test temperature T i °C, while Y i j k represents the experimental value of the compression set retention rate for the k-th measurement of the j-th test sample at the test temperature T i °C. In our tests, the values of n, m, and p are 5, 9, and 20, respectively.
After iterative analysis, the aging coefficients of the sealing ring for the two structures are α = 0.9636 and α = 0.9090, respectively. Based on the experimental data, linear regression analysis is performed using the least squares method to obtain the experimental constant ln(B) and aging rate constant K at each temperature, as listed in Table 3. As shown in the table, the correlation coefficients are all close to 1, indicating that the fitted equation is valid.
The degradation trajectory of the sealing ring at each test temperature is illustrated in Figure 12. The dots in different colors represent experimental data points at different temperatures. It can be found that as the temperature gradually increases, the degradation of the sealing ring accelerates. Moreover, the predicted results are in good agreement with the experimental results.
In this study, thermal aging tests were conducted on two EPDM sealing structures with compression ratios of 28.6% and 18% under a working pressure of 0.6 MPa. To enhance the verifiability of the results, two representative studies on the thermal aging behavior and lifetime prediction of EPDM were consulted. Although differences exist in test conditions—such as specimen geometry, structural form, loading conditions, and environmental temperature—the observed trends in this study are generally consistent with the literature [44,45]. One study [44] used compression set analysis to estimate a service life of approximately 8.4 years at 20 °C for a commercial EPDM spacer composite. Another study [45] reported that after aging at 100 °C for 672 h, commercial EPDM exhibited increased hardness, modulus, and tensile strength, while elongation at break and damping performance significantly declined—demonstrating typical degradation behavior during thermal aging. Despite differences in structural configuration and applied load, these studies confirm the degradation trend of EPDM under thermal aging, aligning with our findings.
Moreover, the lifetime prediction model developed in this study was compared with the experimental results, and the comparison shows that the model captures the aging trend well under the tested conditions, validating its effectiveness and applicability. Given that the lifetime of sealing materials is influenced by multiple coupled factors, such as temperature, oxygen availability, material formulation, compression ratio, sealing structure, specimen size, and diffusion-limited oxidation (DLO), future work will focus on expanding the experimental matrix and refining the model to improve its generalizability and comparability across different studies.

4.2.2. Aging Life Prediction Model

Using the degradation trajectory of the sealing ring at each test temperature, an aging life model of the sealing ring for a specific temperature can be further derived. Based on Equation (7), the logarithm of the aging rate constant K has a linear relationship with the reciprocal of the temperature T. By performing a simple linear fitting, the aging rate constant K at different temperatures can be obtained, as listed in Table 4. Since all the correlation coefficients in the table are greater than the tabulated value, the fitted equation is valid.
The relationship between the aging rate constant and temperature is shown in Figure 13. Based on this simple linear model, the aging rate constant K at any given temperature can be determined. In Equation (3), B ^ = i = 1 n B n , where n is the number of test temperatures. Accordingly, the degradation trajectory and aging life prediction model of the sealing ring at a specific temperature can be obtained.
The degradation curves of the compression set retention rate of the sealing ring with aging time for the two sealing structures at a temperature of 60 °C are shown in Figure 14. The results show that at a usage temperature of 60 °C, under the same failure criterion, the service life of the sealing structure with an 18% compression ratio is longer than that of the 28.6% compression ratio one.

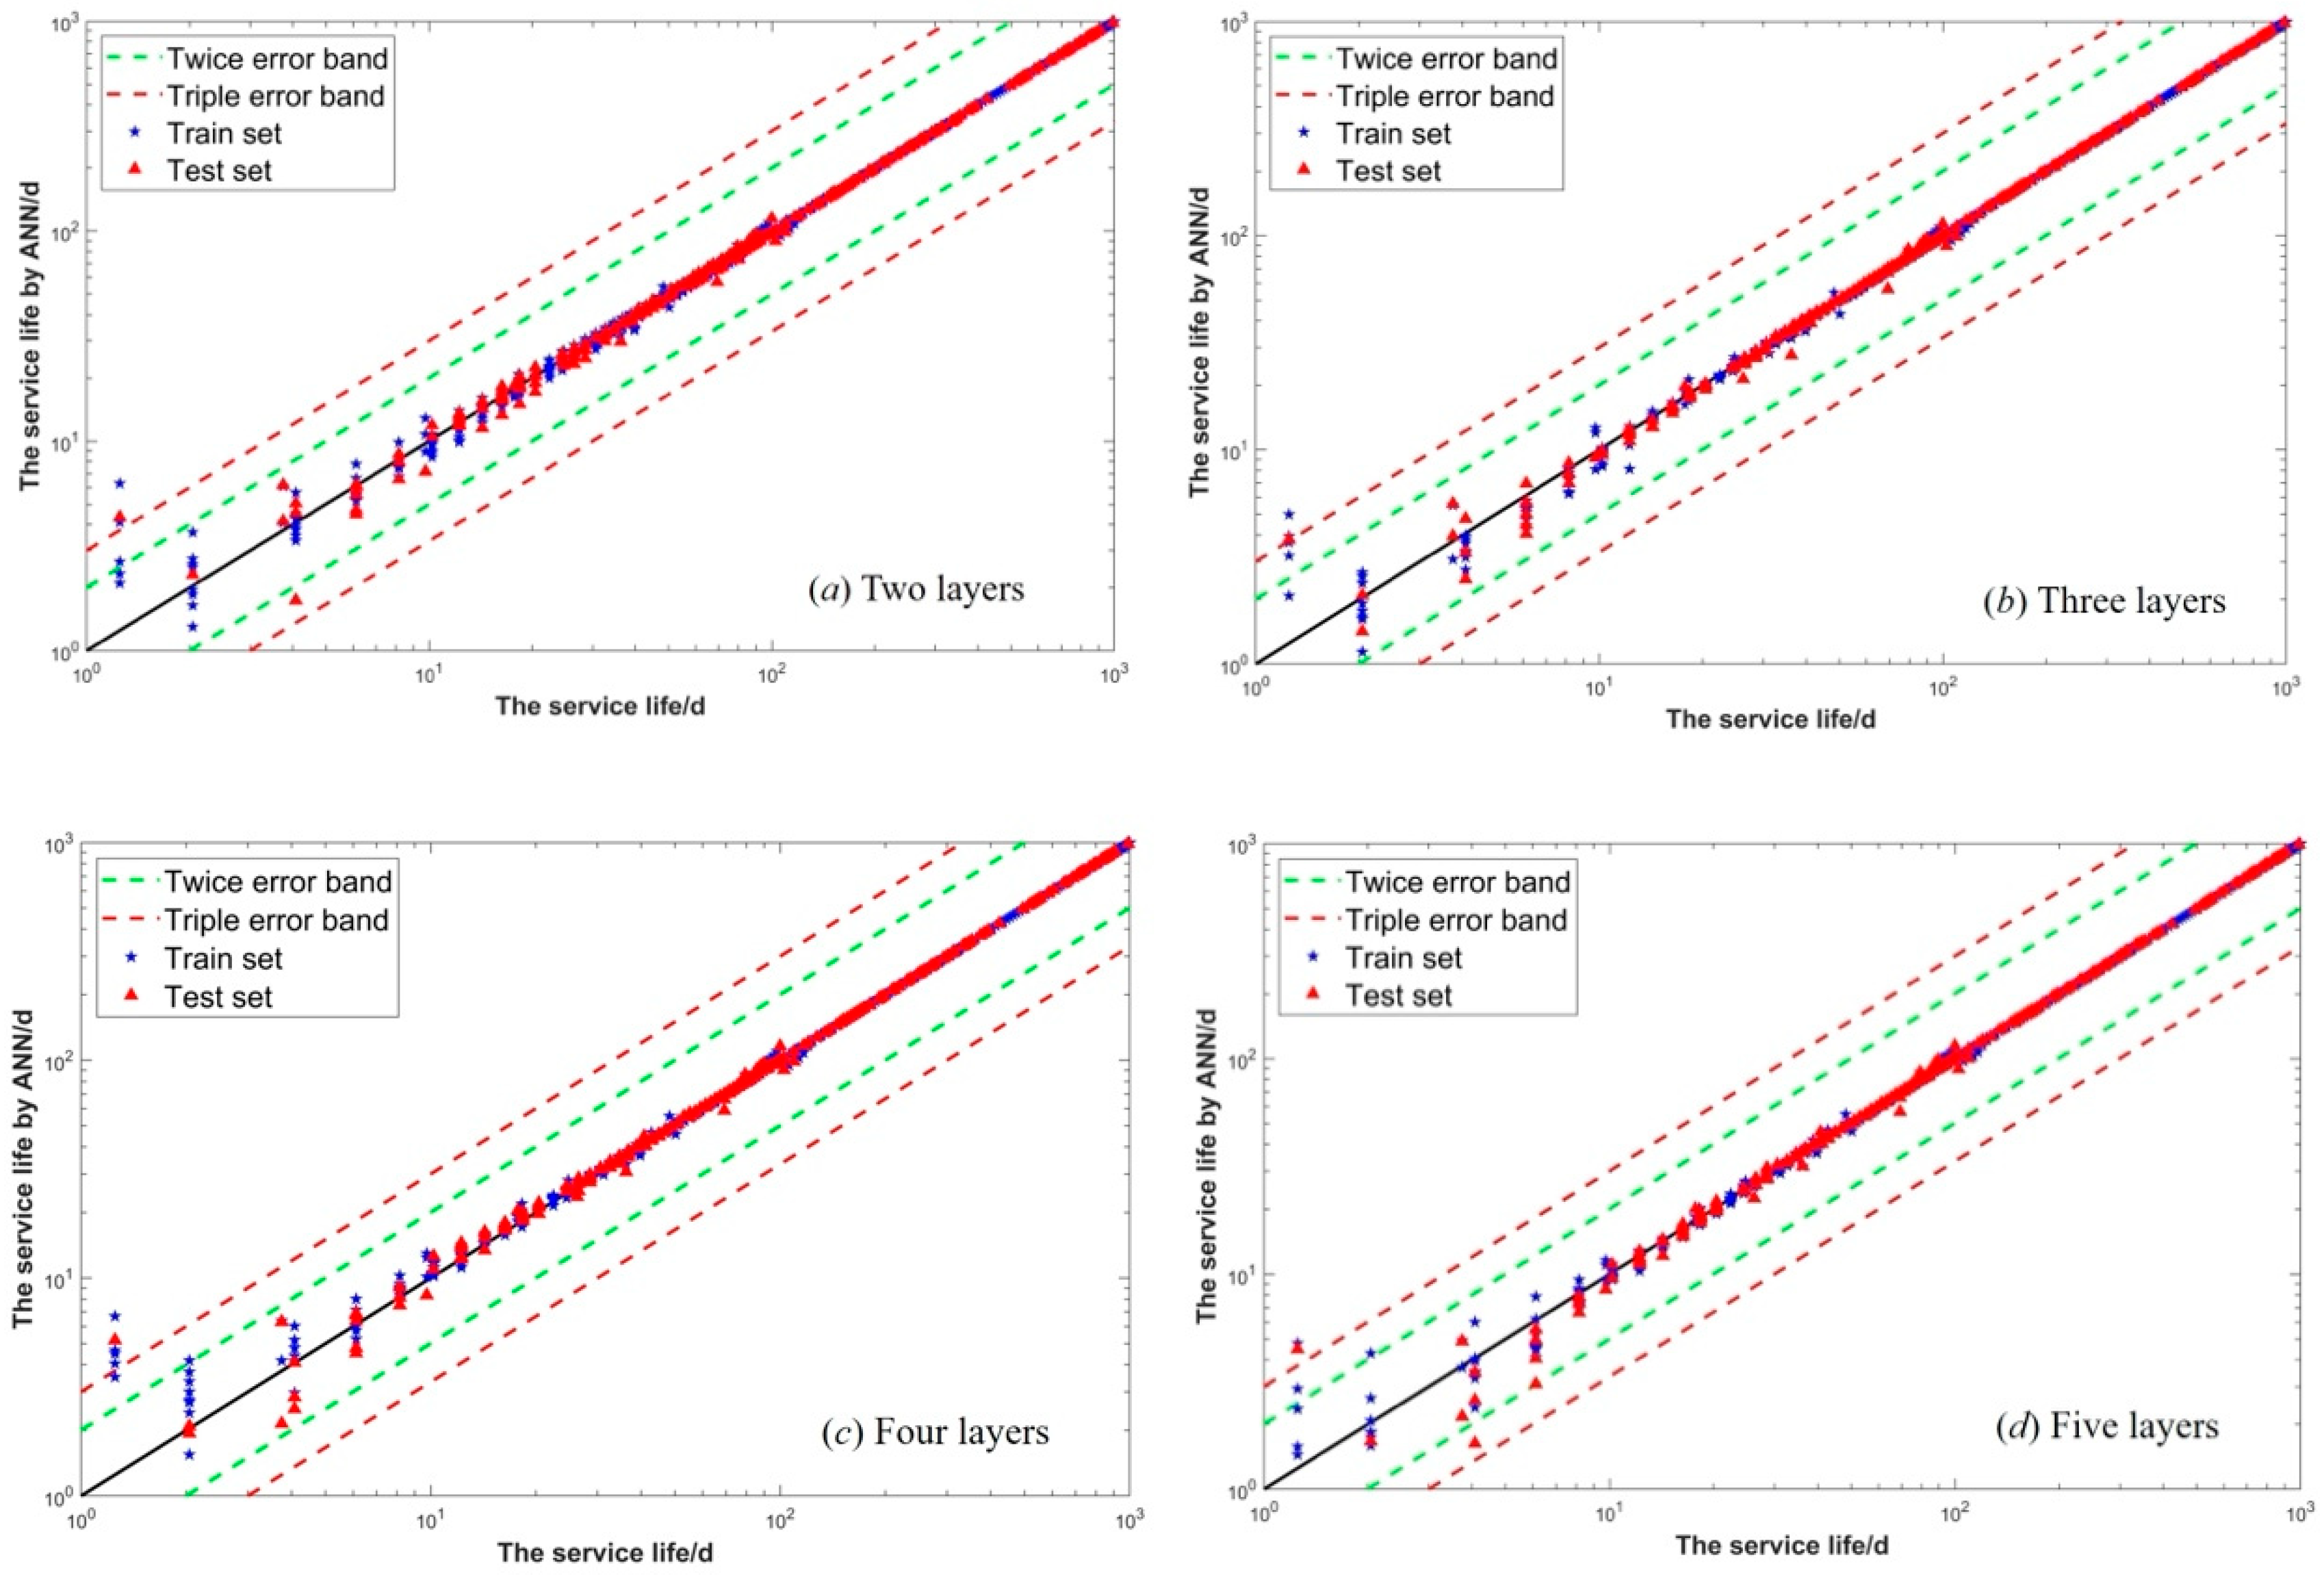
4.3. ANN-Based Aging Life Prediction Result

In the design of the ANN, the number of hidden layers is typically chosen to be between two and four. Increasing the number of hidden layers can enhance the model’s expressive power, enabling it to learn more complex feature patterns. However, as the number of layers increases, the training time also increases, which may lead to issues, such as vanishing gradients, exploding gradients, and a higher likelihood of overfitting, which can reduce the model’s generalization ability and affect its performance on new data. In predicting the aging life of O-rings, the impact of different hidden layer numbers (2, 3, 4, and 5) on ANN prediction accuracy was evaluated, as shown in Figure 15. The error bands for the test set predictions with different hidden layer numbers and the evaluation metrics are listed in Table 5. It is indicated that the ANN performance was optimal when four hidden layers were used. In this case, the RMSE and R2 of the test set predictions were 1.9185 and 0.9999, respectively.
In terms of the number of neurons, the number of neurons in the first hidden layer plays a decisive role in the prediction performance of the ANN. We investigated the range of 20 to 100 neurons in the first layer. As shown in Figure 16, the performance was optimal when the first layer contained 24 neurons, with the RMSE and R2 of the target values in the test set being 1.8538 and 0.9999, respectively. The same method was then applied to study the number of neurons in the other three layers. The optimal structural parameters for the aging life prediction model of the O-ring under different working conditions and selected compression ratios are summarized in Table 6.
After obtaining the optimal structural parameters of the ANN model, we analyzed the prediction results of the previously randomly divided test set. The error band plot of the test set prediction results is shown in Figure 17. From the figure, it can be observed that most of the predicted data points from the optimized machine learning model are located near the y = x diagonal. This indicates that the optimized machine learning model, based on the O-ring performance degradation model, achieves good predictive performance for O-ring aging life under different operating conditions and selected compression ratios.

5. Conclusions

This study presents an aging life evaluation method for O-rings using an ANN model combined with a performance degradation model. The research begins with an analysis of the effects of compression ratios on the sealing performance of EPDM O-rings, achieved through comprehensive macro–micro numerical simulations. Accelerated aging tests were then conducted under five different temperature conditions, leading to the development of a performance degradation model for O-rings based on a dynamic curve model. A regression analysis was performed to create an aging life prediction model for O-rings under actual operating temperatures. By expanding aging data by the obtained performance degradation model, an aging life prediction method for sealing rings based on the ANN model was proposed and trained. This method offers an effective tool for designing and predicting the performance of sealing structures. The main conclusions are summarized as follows:
(1) The comprehensive macro–micro numerical simulation was constructed to evaluate the performance of the O-rings. The results indicated that selecting an optimal compression ratio and sealing structure with lower Von Mises stress can enhance sealing performance.
(2) The developed performance degradation model successfully predicted the aging life of O-rings under varying operating conditions and compression sets. The computed results are in good agreement with the experimental results.
(3) An ANN model based on the O-ring performance degradation model was established. Through detailed analysis and discussion, the optimal hyper-parameters for the ANN model were determined. The predictive model achieved an RMSE of 1.8264, an R2 of 0.9999, and a MAPE of 8.05% on the test dataset. These results indicate that the proposed method can accurately predict the O-ring aging life under different operating conditions and selected compression sets.

Author Contributions

Conceptualization, X.W.; methodology, X.W. and Y.H.; software, J.Z.; validation, Z.W. and W.H.; formal analysis, X.W.; investigation, J.Z. and Z.W.; resources, C.S.; data curation, Y.H. and C.S.; writing—original draft preparation, X.W., Y.H. and Z.W.; writing—review and editing, W.H. and C.S.; visualization, J.Z.; supervision, W.H.; project administration, X.W. All authors have read and agreed to the published version of the manuscript.

Funding

This research received no external funding.

Data Availability Statement

The data from this research cannot be publicly shared due to the nature of the study.

Conflicts of Interest

The authors declare no conflict of interest.

References

  1. Mahankar, P.S.; Dhoble, A.S. Review of hydraulic seal failures due to effect of medium to high temperature. Eng. Fail. Anal. 2021, 127, 105552. [Google Scholar] [CrossRef]
  2. Nikas, G.K. Eighty years of research on hydraulic reciprocating seals: Review of tribological studies and related topics since the 1930s. Proc. Inst. Mech. Eng. Part J. J. Eng. Tribol. 2010, 224, 1–23. [Google Scholar] [CrossRef]
  3. Han, C.; Zhang, J.; Liang, Z. Thermal failure of rubber bushing of a positive displacement motor: A study based on thermo-mechanical coupling. Appl. Therm. Eng. 2014, 67, 489–493. [Google Scholar] [CrossRef]
  4. Han, C.; Zhang, H.; Zhang, J. Structural design and sealing performance analysis of biomimetic sealing ring. Appl. Bionics Biomech. 2015, 2015, 358417. [Google Scholar] [CrossRef]
  5. Patel, H.; Salehi, S.; Teodoriu, C.; Ahmed, R. Performance evaluation and parametric study of elastomer seal in conventional hanger assembly. J. Pet. Sci. Eng. 2019, 175, 246–254. [Google Scholar] [CrossRef]
  6. Patel, H.; Salehi, S.; Ahmed, R.; Teodoriu, C. Review of elastomer seal assemblies in oil & gas wells: Performance evaluation, failure mechanisms, and gaps in industry standards. J. Pet. Sci. Eng. 2019, 179, 1046–1062. [Google Scholar]
  7. Jovanović, S.; Samaržija-Jovanović, S.; Marković, G.; Jovanović, V.; Adamović, T.; Marinović-Cincović, M. Mechanical properties and thermal aging behaviour of polyisoprene/polybutadiene/styrene-butadiene rubber ternary blend reinforced with carbon black. Compos. Part B Eng. 2016, 98, 126–133. [Google Scholar] [CrossRef]
  8. Kömmling, A.; Jaunich, M.; Wolff, D. Effects of heterogeneous aging in compressed HNBR and EPDM O-ring seals. Polym. Degrad. Stab. 2016, 126, 39–46. [Google Scholar] [CrossRef]
  9. Zeng, W.; Xue, Y.; Sun, Y.; Zhao, J.; Xie, H.; Ren, T. Sealing reliability assessment of deep-water oil and nature gas pipeline connector considering thermo-mechanical coupling. Proc. Inst. Mech. Eng. Part M. J. Eng. Marit. Environ. 2022, 236, 196–208. [Google Scholar] [CrossRef]
  10. Li, C.; Ding, Y.; Yang, Z.; Yuan, Z.; Ye, L. Compressive stress-thermo oxidative ageing behaviour and mechanism of EPDM rubber gaskets for sealing resilience assessment. Polym. Test. 2020, 84, 106366. [Google Scholar] [CrossRef]
  11. Zhang, J.; Xie, J. Investigation of Static and Dynamic Seal Performances of a Rubber O-Ring. J. Tribol. 2018, 140, 042202. [Google Scholar] [CrossRef]
  12. Tong, G.; Zhu, X.; Liu, Y.; Lv, F.; Lu, X. Research on the Sealing Mechanism of Split-Liner High-Pressure Hydrogen Storage Cylinders. Processes 2024, 12, 554. [Google Scholar] [CrossRef]
  13. Wang, S.; Liu, P.; Li, D.; Dong, Z.; Li, G. Simulation and experimental study on sealing characteristics of hydro-pneumatic spring GS seal rings. Appl. Sci. 2023, 13, 11703. [Google Scholar] [CrossRef]
  14. Li, J.W.; Chen, G.Q.; Yang, L.; Wang, Y. Failure analysis and structural optimization of high-pressure reciprocating Y-Shaped sealing ring. J. Fail. Anal. Prev. 2024, 24, 1957–1975. [Google Scholar] [CrossRef]
  15. Zhang, L.; Wei, X. A novel structure of rubber ring for hydraulic buffer seal based on numerical simulation. Appl. Sci. 2021, 11, 2036. [Google Scholar] [CrossRef]
  16. Luo, Y.; Dong, Y.; Li, Y.; Hu, T.; Guo, Y.; Qian, C.; Zheng, H. Reliability analysis of critical systems in a fuel booster pump using advanced simulation techniques. Materials 2022, 15, 1989. [Google Scholar] [CrossRef]
  17. Zhu, M.; Ma, D.; Zhou, Y.; Huang, H.; Shao, Z.; Wu, F.; Li, B. The change of sealing property in the aging process of NBR sealing equipment based on finite element analysis. Coatings 2024, 14, 1178. [Google Scholar] [CrossRef]
  18. Yang, H.; Yao, X.F.; Ke, Y.C.; Ma, Y.J.; Liu, Y.H. Constitutive behaviors and mechanical characterizations of fabric reinforced rubber composites. Compos. Struct. 2016, 152, 117–123. [Google Scholar] [CrossRef]
  19. Jaunich, M.; Kömmling, A.; Horn, J.; Völzke, H.; Wolff, D. Long-term performance of elastomer seals: From aging tests to lifetime estimations.Pressure Vessels and Piping Conference. Am. Soc. Mech. Eng. 2018, 51708, V007T07A038. [Google Scholar]
  20. Zeng, C.; Liu, Y.; Lin, L.; Luo, H.; Lin, W.; Xiao, T.; Wang, P. Experimental research on aging and operating life of O-ring used in GIS. In Proceedings of the 4th International Conference on Electric Power Equipment-Switching Technology, Xi’an, China, 22–25 October 2017; IEEE: Piscataway, NJ, USA, 2017; pp. 857–862. [Google Scholar]
  21. Kömmling, A.; Jaunich, M.; Pourmand, P.; Wolff, D.; Hedenqvist, M. Analysis of O-ring seal failure under static conditions and determination of end-of-lifetime criterion. Polymers 2019, 11, 1251. [Google Scholar] [CrossRef]
  22. Wu, D.; Wang, S.; Wang, X. A novel stress distribution analytical model of O-ring seals under different properties of materials. J. Mech. Sci. Technol. 2017, 31, 289–296. [Google Scholar] [CrossRef]
  23. Guo, L.; Zeng, Y.; Huang, J.; Wang, Z.; Li, J.; Han, X.; Xia, C.; Qian, L. Fatigue optimization of rotary control head rubber core based on steady sealing. Eng. Fail. Anal. 2022, 132, 105935. [Google Scholar] [CrossRef]
  24. Cheng, H.; Chen, X.; Chen, X.; Liu, H. Research on key factors of sealing performance of combined sealing ring. Appl. Sci. 2022, 12, 714. [Google Scholar] [CrossRef]
  25. Das, S.K.; Biswal, R.K.; Sivakugan, N.; Das, B. Classification of slopes and prediction of factor of safety using differential evolution neural networks. Environ. Earth Sci. 2011, 64, 201–210. [Google Scholar] [CrossRef]
  26. Joshi, R.; Kumar, K.; Adhikari, V.P.S. Modelling suspended sediment concentration using Artificial Neural Networks for Gangotri glacier. Hydrol. Process. 2016, 30, 1354–1366. [Google Scholar] [CrossRef]
  27. Kumar, S.; Basudhar, P.K. A neural network model for slope stability computations. Geotech. Lett. 2018, 8, 149–154. [Google Scholar] [CrossRef]
  28. Erofeev, A.; Orlov, D.; Ryzhov, A.; Koroteev, D. Prediction of porosity and permeability alteration based on machine learning algorithms. Transp. Porous Media 2019, 128, 677–700. [Google Scholar] [CrossRef]
  29. Zhan, Z.; He, X.; Tang, D.; Dang, L.; Li, A.; Xia, Q.; Berto, F.; Li, H. Recent developments and future trends in fatigue life assessment of additively manufactured metals with particular emphasis on machine learning modeling. Fatigue Fract. Eng. Mater. Struct. 2023, 46, 4425–4464. [Google Scholar] [CrossRef]
  30. Zhu, J.-A.; Jia, Y.; Lei, J.; Liu, Z. Deep learning approach to mechanical property prediction of single-network hydrogel. Mathematics 2021, 9, 2804. [Google Scholar] [CrossRef]
  31. Zhan, Z.; Ao, N.; Hu, Y.; Liu, C. Defect-induced fatigue scattering and assessment of additively manufactured 300M-AerMet100 steel: An investigation based on experiments and machine learning. Eng. Fract. Mech. 2022, 264, 108352. [Google Scholar] [CrossRef]
  32. Zhan, Z.; Li, H. A novel approach based on the elastoplastic fatigue damage and machine learning models for life prediction of aerospace alloy parts fabricated by additive manufacturing. Int. J. Fatigue 2021, 145, 106089. [Google Scholar] [CrossRef]
  33. Zhou, W.; Xie, Z. Sealing rubber ring design based on machine learning algorithm combined progressive optimization method. Tribol. Int. 2025, 201, 110173. [Google Scholar] [CrossRef]
  34. Jiao, K.; Yun, F.; Hao, X.; Wang, G.; Yao, S.; Jia, P.; Wang, X.; Wang, L. A fast GA-ANN model and application in multi-objective optimization of the sealing ring for the subsea pipeline connector with regard of the penetration load. J. Mech. Sci. Technol. 2024, 38, 309–322. [Google Scholar] [CrossRef]
  35. Pokharel, A. Application of Supervised Machine Learning Algorithms for Developing Service Life Prediction Model of Sewer Pipes. Ph.D. Thesis, The University of Texas at Arlington, Arlington, TX, USA, 2021. [Google Scholar]
  36. Bao, H.; Wu, S.; Wu, Z.; Kang, G.; Peng, X.; Withers, P.J. A machine-learning fatigue life prediction approach of additively manufactured metals. Eng. Fract. Mech. 2021, 242, 107508. [Google Scholar] [CrossRef]
  37. Manesh, K.K.; Ramamoorthy, B.; Singaperumal, M. Numerical generation of anisotropic 3D non-Gaussian engineering surfaces with specified 3D surface roughness parameters. Wear 2010, 268, 1371–1379. [Google Scholar] [CrossRef]
  38. Mukhopadhyay, A. Friction and wear characteristics of indegenous EPDM rubber under dry sliding condition. Asian Rev. Mech. Eng. 2014, 3, 19–25. [Google Scholar] [CrossRef]
  39. Zhao, L.H.; Wei, X.B.; Li, X.G. The analysis on the tribological properties of CR/EPDM blends with chrome-plated steel under dry sliding. Adv. Mater. Res. 2013, 774, 99–102. [Google Scholar] [CrossRef]
  40. Liu, J.; Li, X.; Xu, L.; He, T. Service lifetime estimation of EPDM rubber based on accelerated aging tests. J. Mater. Eng. Perform. 2017, 26, 1735–1740. [Google Scholar] [CrossRef]
  41. GB/T 20028-2005; Rubber, Vulcanized or Thermos-Plastic-Estimation of Life-Time and Maximum Temperature of Use from an Arrhenius plot. China Standard Press: Beijing, China, 2005.
  42. Zhou, C.; Zheng, J.; Gu, C.; Zhao, Y.; Liu, P. Sealing performance analysis of rubber O-ring in high-pressure gaseous hydrogen based on finite element method. Int. J. Hydrogen Energy 2017, 42, 11996–12004. [Google Scholar] [CrossRef]
  43. Song, W.; Cui, W. Finite element analysis of large-sized O-rings used in deep-ocean pressure chambers. Adv. Mech. Eng. 2021, 13, 16878140211040672. [Google Scholar] [CrossRef]
  44. Xie, Z.; Chen, J.; Zhang, K. Lifetime prediction of EPDM sealing materials with thermal aging under constant compression. J. Phys. Conf. Ser. 2024, 2842, 012008. [Google Scholar] [CrossRef]
  45. Zhou, Y.; Qiu, L.; Xu, Z.; Huang, S.; Nie, J.; Yin, H.; Zhao, Z. Thermal oxidative aging and service life prediction of commercial ethylene–propylene–diene monomer spacer damping composites for high–voltage transmission lines. Polymers 2024, 16, 1186. [Google Scholar] [CrossRef] [PubMed]
Figure 1. Workflow of simulation analysis for typical engineering sealing structures.
Aerospace 12 00570 g001
Figure 2. The maximum contact stress and Von Mises stress of three different mesh densities.
Aerospace 12 00570 g002
Figure 3. The mesh of the (a) macro- and (b) microscopic model.
Aerospace 12 00570 g003
Figure 4. Schematic diagram of a typical ANN model structure.
Aerospace 12 00570 g004
Figure 5. Correlation between different features.
Aerospace 12 00570 g005
Figure 6. The O-ring seal and test fixture of the accelerated thermal aging test.
Aerospace 12 00570 g006
Figure 7. Placement of test specimens during the accelerated thermal aging test.
Aerospace 12 00570 g007
Figure 8. The variation of maximum contact stress and maximum Von Mises stress under different compression ratios.
Aerospace 12 00570 g008
Figure 9. The distributions of (a) contact stress and (b)Von Mises stress under different compression ratios.
Aerospace 12 00570 g009
Figure 10. The distributions of the maximum and minimum contact stresses at the microscopic roughness peaks under different compression ratios.
Aerospace 12 00570 g010
Figure 11. The distribution of the microscopic roughness peak contact stress at (a) 10%, (b) 18%, and (c) 24% compression ratios.
Aerospace 12 00570 g011
Figure 12. The degradation trajectory of the sealing (a) for sealing structure with a 28.6% compression ratio and (b) with an 18% compression ratio at each test temperature.
Aerospace 12 00570 g012
Figure 13. The relationship between the aging rate constant and temperature of the sealing for the sealing structure (a) with a 28.6% compression ratio and (b) with an 18% compression ratio.
Aerospace 12 00570 g013
Figure 14. The degradation curve of the two sealing structures with aging times at 60 °C.
Aerospace 12 00570 g014
Figure 15. ANN prediction results with different numbers of hidden layers: (a) two layers; (b) three layers; (c) four layers; (d) five layers.
Aerospace 12 00570 g015
Figure 16. RMSE and R2 variations with the number of neurons in the first hidden layer.
Aerospace 12 00570 g016
Figure 17. Error band of the optimized test set prediction results.
Aerospace 12 00570 g017
Table 1. The parameters of the accelerated thermal aging experiment.
Sample
Material
Compression RatioSealing DimensionAging Temperature
EDMP28.6%Φ100 × 8.4 mm90 °C, 110 °C, 120 °C, 130 °C, 140 °C
EDMP18%Φ100 × 8.4 mm90 °C, 110 °C, 120 °C, 130 °C, 140 °C
Table 2. The parameters of the specific simulation parameters.
NumberCompression ValueSealing DimensionEnvironment Condition
Groove Width
(mm)
Groove Depth
(mm)
Compression
Ratios
Diameter
(mm)
Temperature
(°C)
Pressure
(MPa)
1108.05%8.4250.6
27.610%
36.918%
46.424%
55.930%
Table 3. The parameters of the degradation model in Equation (5).
Compression RatiosTemperatureBKCorrelation Coefficient
28.6%900.95950.00440.9773
1100.96130.00780.9764
1200.94610.01180.9652
1300.91750.01790.9898
1400.81200.01810.9398
18%900.96230.00530.9834
1100.95070.00860.9851
1200.91950.01360.9819
1300.89170.01920.9873
1400.78600.01750.9508
Table 4. The parameters of the degradation model in Equation (7).
Sealing StructurelnA E R T Correlation Coefficient
with a 28.6% compression ratio−4616.69317.27830.9700
with an 18% compression ratio−4050.07935.91910.9367
Table 5. The RMSE and R2 of the ANN test set prediction results with different numbers of hidden layers.
The Number of Hidden LayersNumber of Neurons in Each Hidden LayerRMSER2
260, 602.27340.9998
360, 60, 602.23590.9998
460, 60, 60, 601.91850.9999
560, 60, 60, 60, 602.01590.9999
Table 6. The RMSE, R2, and MAPE of the ANN test set prediction results with different numbers of hidden layers.
Activation
Function
Number of Hidden
Layers
Number of Neurons in Each Hidden LayerRMSER2MAPE
ReLU424, 91, 85, 711.82640.99998.05%
Disclaimer/Publisher’s Note: The statements, opinions and data contained in all publications are solely those of the individual author(s) and contributor(s) and not of MDPI and/or the editor(s). MDPI and/or the editor(s) disclaim responsibility for any injury to people or property resulting from any ideas, methods, instructions or products referred to in the content.

