Article

Urban Air Mobility Vertiport’s Capacity Simulation and Analysis

by
Antoni Kopyt
* and
Sebastian Dylicki
Faculty of Power and Aeronautical Engineering, Warsaw University of Technology, Nowowiejska 24, 00-665 Warsaw, Poland
*
Author to whom correspondence should be addressed.
Aerospace 2025, 12(6), 560; https://doi.org/10.3390/aerospace12060560
Submission received: 25 April 2025 / Revised: 16 June 2025 / Accepted: 18 June 2025 / Published: 19 June 2025
(This article belongs to the Special Issue Operational Requirements for Urban Air Traffic Management)

Abstract

This study shows a comprehensive simulation to assess and enhance the throughput capacity of unmanned air system vertiports, one of the most essential elements of urban air mobility ecosystems. The framework integrates dynamic grid-based spatial management, probabilistic mission duration algorithms, and EASA-compliant operational protocols to address the infrastructural and logistical demands of high-density UAS operations. It was focused on two use cases—high-frequency food delivery utilizing small UASs and extended-range package logistics with larger UASs—and the model incorporates adaptive vertiport zoning strategies, segregating operations into dedicated sectors for battery charging, swapping, and cargo handling to enable parallel processing and mitigate congestion. The simulation evaluates critical variables such as vertiport dimensions, UAS fleet composition, and mission duration ranges while emphasizing scalability, safety, and compliance with evolving regulatory standards. By examining the interplay between infrastructure design, operational workflows, and resource allocation, the research provides a versatile tool for urban planners and policymakers to optimize vertiport layouts and traffic management protocols. Its modular architecture supports future extensions. This work underscores the necessity of adaptive, data-driven planning to harmonize vertiport functionality with the dynamic demands of urban air mobility, ensuring interoperability, safety, and long-term scalability.

1. Introduction

Urban air mobility (UAM) and various unmanned aerial system (UAS) logistics are rapidly evolving [1,2,3,4,5,6,7,8], which requires efficient infrastructure to manage increasing volumes of autonomous aerial vehicles. The future of UASs will be shaped by rapid technological advancements in battery performance and autonomous flight capabilities, as well as by developments in infrastructure and regulatory frameworks [7,8,9]. Although many innovative applications—such as air taxis and UAS deliveries—are still nascent, significant investments are already being made to build the underlying technology and operational support systems. Stakeholders are encouraged to concentrate on practical, high-impact deployments that enhance productivity across industries ranging from agriculture and construction to logistics and surveillance. These strategic initiatives, combined with efforts to shape policy and public acceptance, set the stage for UASs to become a transformative force in the global economy [4,7,9,10,11,12].

2. Literature Review

Several recent studies have documented the pace and scope of UAM and UAS growth. Uber’s forecasts a multi-trillion-dollar market for urban air taxi services by 2050 [1], while the document Safety Challenges for Integrating U-Space in Urban Environments analyzes safety frameworks necessary to support this expansion [2]. The Concept of Operations for ATM service to passengers in an intermodal transport system presents a concept for UAM vertiport networks that balances accessibility with airspace constraints [3], and i the paper - Commercial Drones Are Here: The Future of Unmanned Aerial Systems reviews commercial drone deployments in logistics [4]. Regulatory guidance from the EASA emphasizes vertiport design standards and performance requirements [4], explores the multimodal integration of UAM with existing transit systems [5].
Network topology studies show that thoughtfully placed vertiports can relieve ground traffic bottlenecks and improve overall resilience [13]. Dmytro Zhyriakov and co-authors in Urban Air Mobility, Personal Drones, and the Safety of Occupants—A Comprehensive Review discuss equity considerations in UAM deployment to ensure underserved communities benefit from new aerial corridors [10]. Cohesion between vertiports and aeronautical data systems is vital for high-density operations, as demonstrated by Goyal and colleagues [14]. Karolin Schweiger et al. compare centralized versus decentralized UAS traffic management approaches and find that distributed control architectures often outperform monolithic systems in scalability and fault tolerance [15].
Vertiports—dedicated areas for VTOL operations—are recognized as the linchpin of scalable UAM services. David P. Thipphavong in Urban Air Mobility Airspace Integration Concepts and Considerations outlines capacity simulation methodologies for vertiports under varying traffic loads [16], and Safety Challenges for Integrating U-Space in Urban Environments evaluates safety procedures in high-density vertiport zones [2]. Best practices include structured safety areas, visual aids, lighting systems, and standards for load-bearing and obstacle clearance [6,11]. These elements collectively ensure reliability and regulatory compliance for both human-piloted and autonomous VTOL vehicles.

3. Urban Air Mobility Challenges

In modern cities, the evolution of urban air mobility offers an exciting pathway to transform urban services and distribution logistics. The integration of hundreds, or even thousands, of UASs into the cityscape not only paves the way for innovative applications such as rapid parcel delivery and environmental monitoring but also introduces significant challenges [7,14,15,17]. One of the most crucial among these challenges is ensuring the safety of operations in dense air traffic, maintaining robust communication systems, and addressing the impact on the quality of life of residents [14,15,18].

3.1. Technical and Infrastructural Challenges

Implementing UAM in a real environment requires addressing several critical issues. The challenge with fully simulating UAM consists of multiple elements that need to be resolved. Safety is the most important parameter that must be held on a non-negotiable level. To maintain the safety factor as low as possible, a set of issues must be addressed individually. Below is a list of the main elements of UAM that should be implemented into the simulation environment before the large-scale scenarios are implemented in a real environment [12,14,16].
  • High Air Traffic Density: The introduction of many UASs creates an unprecedented intensity in urban airspace. Each UAS contributes to the overall traffic load, potentially increasing collision risks and introducing complexities in airspace management, especially where they coexist with conventional aircraft [14,15,19,20,21].
  • Advanced Hardware and Communication Systems: Seamless and safe UAS operation demands highly reliable hardware systems. This includes redundant monitoring systems, robust control algorithms, and state-of-the-art sensor arrays that track the position, status, and potential anomalies in real time. The integration of these components is central to ensuring that UASs can safely execute their missions even in busy air corridors [15,22,23].
  • Safety Protocols: Safety is the cornerstone of any UAM system. Both physical and cyber safety measures must be prioritized. Physical safety protocols focus on minimizing risks of mid-air collisions and system failures, while cybersecurity protocols are vital for protecting the UAS against potential hacking or system intrusions. Rapid response strategies and real-time monitoring systems are essential components of a safe and resilient UAM network [14,15,23,24,25,26].
  • Noise Management: With UASs potentially operating around the clock, the noise generated by their engines and rotors can become a serious concern for urban inhabitants. Engineers and urban planners must collaborate to develop noise-reduction technologies, such as quieter propulsion systems and optimized flight paths, and designate operational zones that keep disruptive noise away from residential areas [14,15,27,28,29].
  • Air Traffic Management: Integrating UAS operations into existing air traffic systems requires a sophisticated coordination mechanism. New traffic management algorithms grounded in artificial intelligence can bridge the gap between traditional air traffic control measures and the dynamic requirements of a densely populated UAS network. This integrated approach ensures that all aerial vehicles operate harmoniously and safely [14,15,19,26].

3.2. Safety as the Cornerstone of UAM

Ensuring continuous operational safety is an unyielding requirement in UAM. To achieve this, it is crucial to implement a multi-layered approach [10,14,24,26]. System redundancy is the backbone of operational reliability, ensuring fail-safes are always available. Critical systems must include redundancies that confirm a safety net for any malfunction. These redundancies guarantee that other systems can take over immediately in case of a hardware malfunction or a communication breakdown [14,30]. Continuous observation is used to oversee every aspect of flight operations. Having advanced monitoring systems that continuously assess flight characteristics and operating status is essential. These technologies provide prompt responses and real-time modifications in the event of unforeseen circumstances [14,31]. Cybersecurity measures comprise the digital shield that safeguards UAM infrastructure. Given the dependence on digital communication and control, robust cybersecurity measures must be in place to protect against hacking attempts and interference that could compromise the integrity of the UAM system [32].

3.3. Managing Air Traffic and Operational Infrastructure

Incorporating a heavy UAS presence in urban airspace requires rethinking traditional air traffic management. Coordination among UASs, conventional aircraft, and ground-based control systems is essential. Collaboration with regulatory authorities, such as the European Union Aviation Safety Agency (EASA), helps to develop and enforce standards that ensure safe operations. Predictive algorithms and real-time data analytics further enhance the safe integration of various aerial vehicles [32,33,34].

3.4. Environmental Impact and Noise Considerations

Beyond traffic management and technical specifications, a significant challenge of extensive UAS deployment is the environmental impact [32,33,34]—especially related to noise. As the number of UASs increases, so does the cumulative noise level, which can impact the daily lives of city dwellers. Addressing this issue involves [5,33,35]
  • Technological Innovation: Developing quieter propulsion systems and aerodynamic designs is crucial for reducing noise emissions.
  • Urban Zoning: Careful planning to assign UAS operation zones away from densely populated residential areas can help mitigate adverse noise impacts.

3.5. Vertiport Analysis: Capacity and New Definitions

A critical component of the UAM ecosystem lies in developing and analyzing vertiports—the designated platforms for UAS takeoffs, landings, and docking operations. Traditionally, vertiports have been designed with eVTOL (electric vertical take-off and landing) aircraft in mind. However, redefining and recalibrating these landing sites is necessary for food delivery or other small-scale services. Key considerations include
  • Infrastructure Sizing: Determining optimal dimensions and the spatial layout for smaller vertiports that align with the operational needs of tiny UASs.
  • Operational Throughput: Calculating the maximum number of simultaneous operations that a given vertiport can safely handle, taking into account rigorous safety protocols and efficient turnaround processes.
  • System Integration: Ensuring seamless communication between vertiports and UAS traffic management systems is paramount for minimizing risks and ensuring smooth operations [25,33,34].
While existing EASA definitions provide a foundational framework [4], tailoring these guidelines to accommodate the specific demands of new service applications, like food delivery, requires further refinement and dedicated analysis. The successful integration of UASs into the urban framework through UAM holds tremendous promise for revolutionizing city services, logistics, and even emergency response. However, this integration must be approached rigorously in terms of safety, advanced technology, and environmental well-being. Balancing the challenges of high air traffic density, advanced hardware requirements, safety protocols, and noise control remains formidable. Not least, the analysis of vertiport capacities and the development of specialized definitions for these hubs, especially for applications beyond traditional VTOL systems, are critical for unlocking the full potential of UAM. As our cities evolve into complex ecosystems where the sky becomes as busy as the streets below, ongoing research and interdisciplinary collaboration will be essential. Further exploration into dynamic air traffic algorithms, next-generation sensor technologies, and adaptive infrastructure will illuminate the path forward, ensuring that the promise of UAM is realized in a manner that is both efficient and safe. This article provides a detailed overview of the engineering challenges of deploying numerous UASs in urban environments. It invites further discussion and research into refining vertiport designs, enhancing real-time traffic management, and ensuring the sustainability of these emerging urban air networks.

4. Research Objectives

As urban air mobility evolves, a critical challenge lies in establishing infrastructures that can efficiently support multiple UAS operations. One promising solution is developing a simulation environment—a virtual testbed where engineers can model and evaluate how a vertiport functions. This simulation is not merely an abstract study; it provides a controlled setting where a vertiport’s capacity, layout, and traffic rules can be rigorously tested. By adjusting parameters and variables, the simulation will enable testing different UAS types, ensuring that the operational design meets real-world demands.
The research aimed to build a robust simulation environment that mirrors the complexity of real-world vertiport operations. In this virtual space, engineers could determine the throughput of a vertiport and experiment with various architectural designs. The simulation will allow us to test diverse traffic management strategies by imposing specific air traffic rules, considering factors such as landing patterns, safe takeoff and landing corridors, and the overall spatial dynamics of an urban setting. This controlled setting would help to identify potential bottlenecks and suggest solutions to optimize operations while ensuring safety and efficiency in the first place.
The objectives of this project are clearly defined and translated into the following actionable goals: Firstly, the weights and dimensions of UASs were parameterized to accurately reflect the broad range of available unmanned aerial vehicle designs. Vertiport sizes and geometric configurations were also parameterized in parallel, ensuring that the virtual infrastructure mimics potential real-world constructions. Within those assumptions, the simulations could be derived from essential UAS characteristics—including endurance, mass, and overall dimensions—to provide a solid foundation for the simulation model. Additionally, it is planned to assume or accurately identify service durations for critical operations such as unloading, battery replacement, and charging, which are vital for planning quick turnaround times.
Moreover, the simulation scenarios will be developed to cover distinct operational cases. One scenario will focus on food delivery services, where small vertiports and small UASs are utilized to achieve rapid turnaround and high-frequency operations. Another scenario will center on package delivery, which involves larger vertiports and UASs requiring extended turnaround times. Finally, the simulation results, including spatial and operational constraints, will be plotted to comprehensively analyze how different configurations perform under varying conditions.
In summary, creating a robust simulation environment for testing vertiport operations aims to bridge the gap between theoretical planning and practical application in urban air mobility. This platform will assist in fine-tuning the design and operational rules of vertiports and provide valuable insights into the performance dynamics of a wide range of UASs. Through a detailed parameterization of UAS features and vertiport infrastructures, alongside realistic service duration assumptions and tailored operational scenarios, our simulation will pave the way for more resilient and efficient urban UAS operations. The outcomes of this project will inform future design strategies and operational planning, ensuring that emerging services—from food delivery to package logistics—are supported by infrastructures that are safe, efficient, and adaptable to growing urban demands. This comprehensive simulation project sets the stage for pioneering research in UAM by testing crucial aspects of vertiport functionality and UAS performance. As it continues to refine these models, further investigations may explore the integration of adaptive traffic algorithms, real-time monitoring systems, and dynamic infrastructure management, adding deeper layers of reliability and efficiency to the next generation of urban airborne services.

5. Methodology

The simulation was implemented in MATLAB, version R2022b and operates in discrete time. It incorporates the following principles:
  • Grid-based placement: UASs are positioned on a grid within a circular vertiport to avoid collisions.
  • Finite state machines: UASs switch between ground and air states depending on timers.
  • Service modeling: Turnaround times are assigned based on UAS and operation types.
  • Randomized missions: Flight times are randomized within realistic bounds.
  • Dynamic updates: Visualization and UAS states update continuously.
The next step was to implement the vertiport zoning strategy. The vertiport area was experimentally divided into three equal zones to explore efficiency gains further, each assigned to a specific operation. This modular zoning allows for parallel processing of UAS activities and minimizes congestion:
  • Zone 1—Battery Charging: UASs land to recharge their onboard batteries.
  • Zone 2—Battery Swapping: UASs undergo rapid battery exchange procedures.
  • Zone 3—Cargo Handling: UASs unload completed deliveries and are reloaded with new cargo before take-off.
This experimental setup allows independent UAS actions to occur simultaneously across the three zones, providing insights into the benefits of task-specific zoning on overall vertiport throughput.

6. Simulation Workflow

The simulation begins by initializing all relevant parameters, including UAS specifications and vertiport dimensions. The vertiport is assumed to be a circle. However, this assumption could be changed if necessary. Once these foundational values are established, a grid of valid landing positions is generated within the vertiport to determine where and which UAS can safely land, since the simulation takes into account two types of UASs, namely small ones, of the size required for food delivery, and large ones for bigger package deliveries. UASs were spawned dynamically as the simulation progressed while maintaining a minimum separation distance to avoid potential collisions based on each UAS’s wingspan. Each UAS was then assigned a specific type of service, after which its take-off and landing cycles were simulated to mimic real operational conditions. Throughout the simulation, the states of the UAS were continuously monitored and visualized to provide a clear picture of their behavior over time. The outcome of the simulation was the cumulative UAS that a certain vertiport can serve, the average rate expressed in the UAS per minute, and the peak rate. The parameters that were parametrized and can be modified were
  • Vertiport diameter.
  • Percentage of large UAS.
  • Separation as a percentage of wingspan between the UAS used to initiate the grid.
  • Flight mission durations.
  • Percentage of UAS leaving the airspace.
  • Time after which the UAS permanently leave the airspace.
Small UASs are considered to have a wingspan of 2 [ m ] and large UASs have a wingspan of 6 [ m ]. Each UAS is assumed to be perfectly circular, since the analysis is an extended 2D analysis (due to two separate points of view). Two flight missions are available, namely short (30 min) and long (60 min). The duration of the mission is randomly selected from those available. The simulation is conveniently programmed, and adding or changing mission duration (or expanding the complexity) should not cause any concerns. To simulate conditions where the UAS leaves the vertiport and lands somewhere else, a parameter stating the percentage of the UAS leaving the airspace and the time after this occurs has been added. UASs that take off are still considered in the analysis but do not occupy more space since they will not land. This allows for the simulation of the addition of more UASs into operation, which starts from the ground. The same can be done in inversion, where UASs would appear mid-air, as if they were approaching from other vertiports, but this would require a more complex simulation since the new UAS’s appearance on the vertiport would have to be limited due to EASA regulations [36,37].
The example results visible in Figure 1 and Figure 2 are for the following parameters:
  • Vertiport diameter: 60 m.
  • Large UASs stand for 10% of total UAS.
  • Short mission is assumed to be 30 min.
  • The long mission is assumed to be 60 min.
  • A total of 20% of UASs leave the simulation area 15 min after takeoff permanently.
  • Simulation time of 24 h.
In Figure 1 and Figure 2, the dots represent the UAS. Small dots represent small UASs, while large dots represent larger UASs. This applies to both the top and side views. The default simulation time step is constant and equals t s = 10 min. The simulation results are presented graphically in Figure 3 and Figure 4. Each scenario’s throughput is quantified by measuring the number of completed UAS missions within a set time frame (e.g., 10 h). Key visuals include
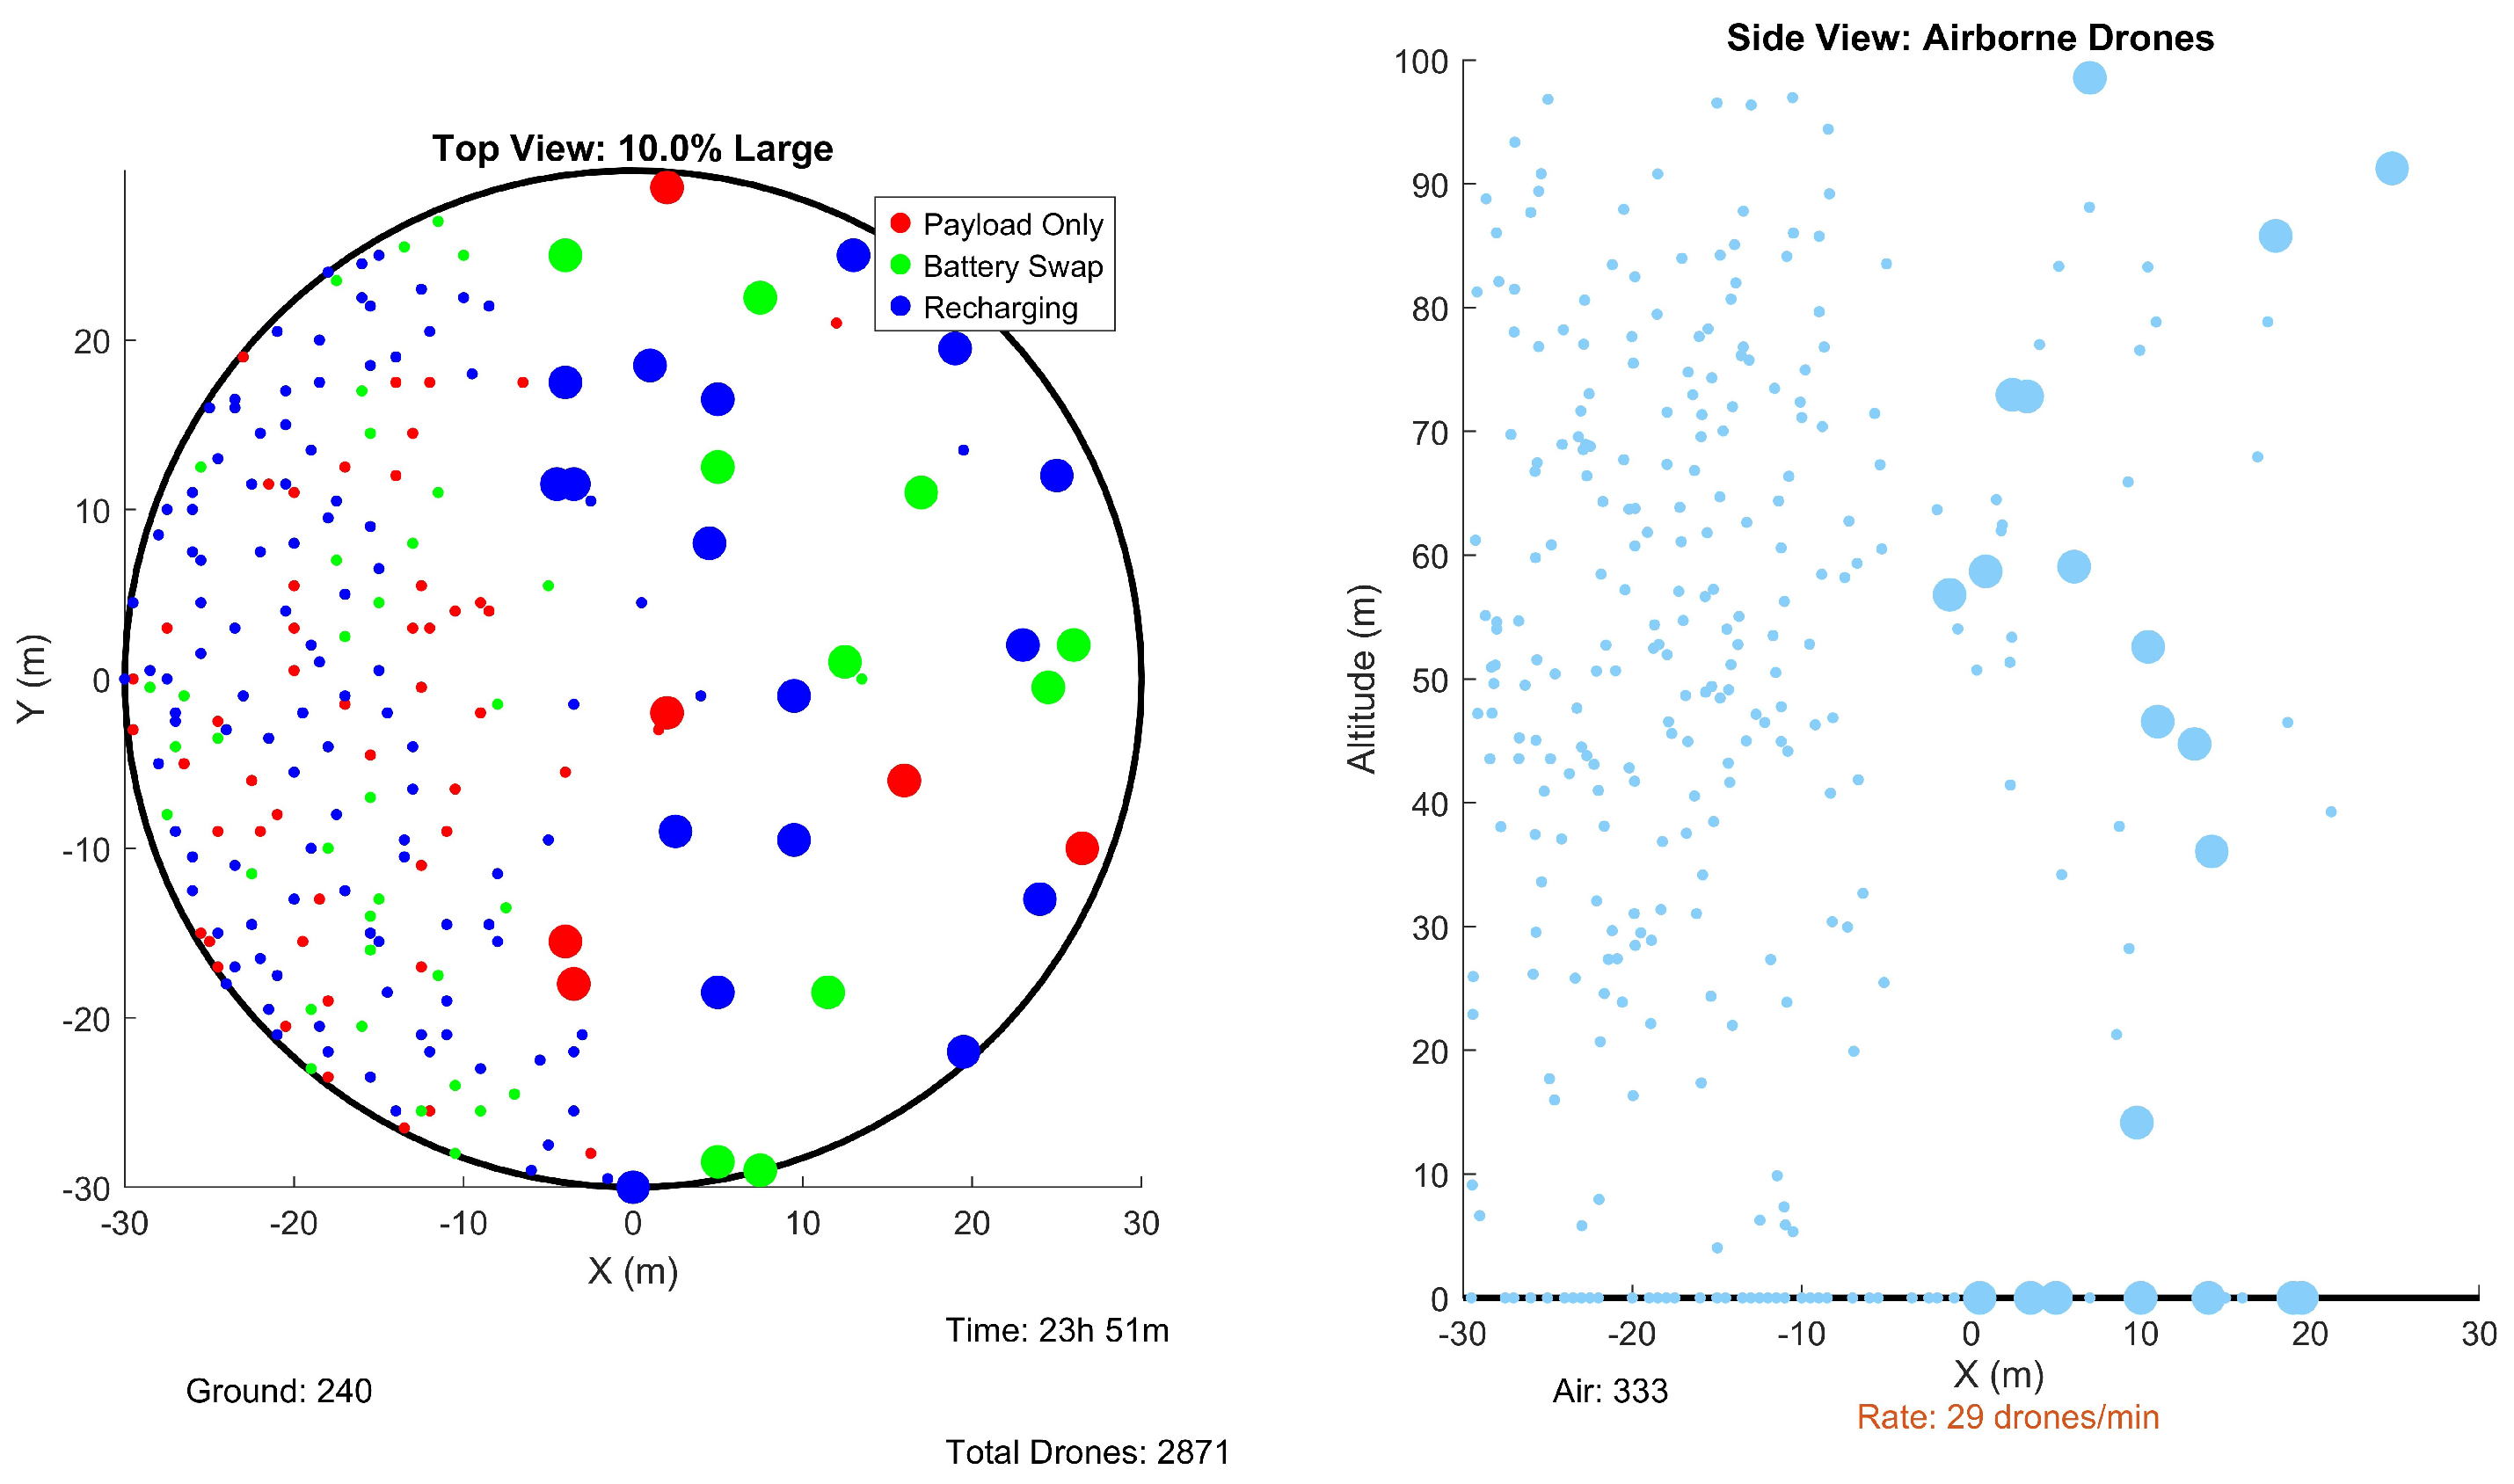
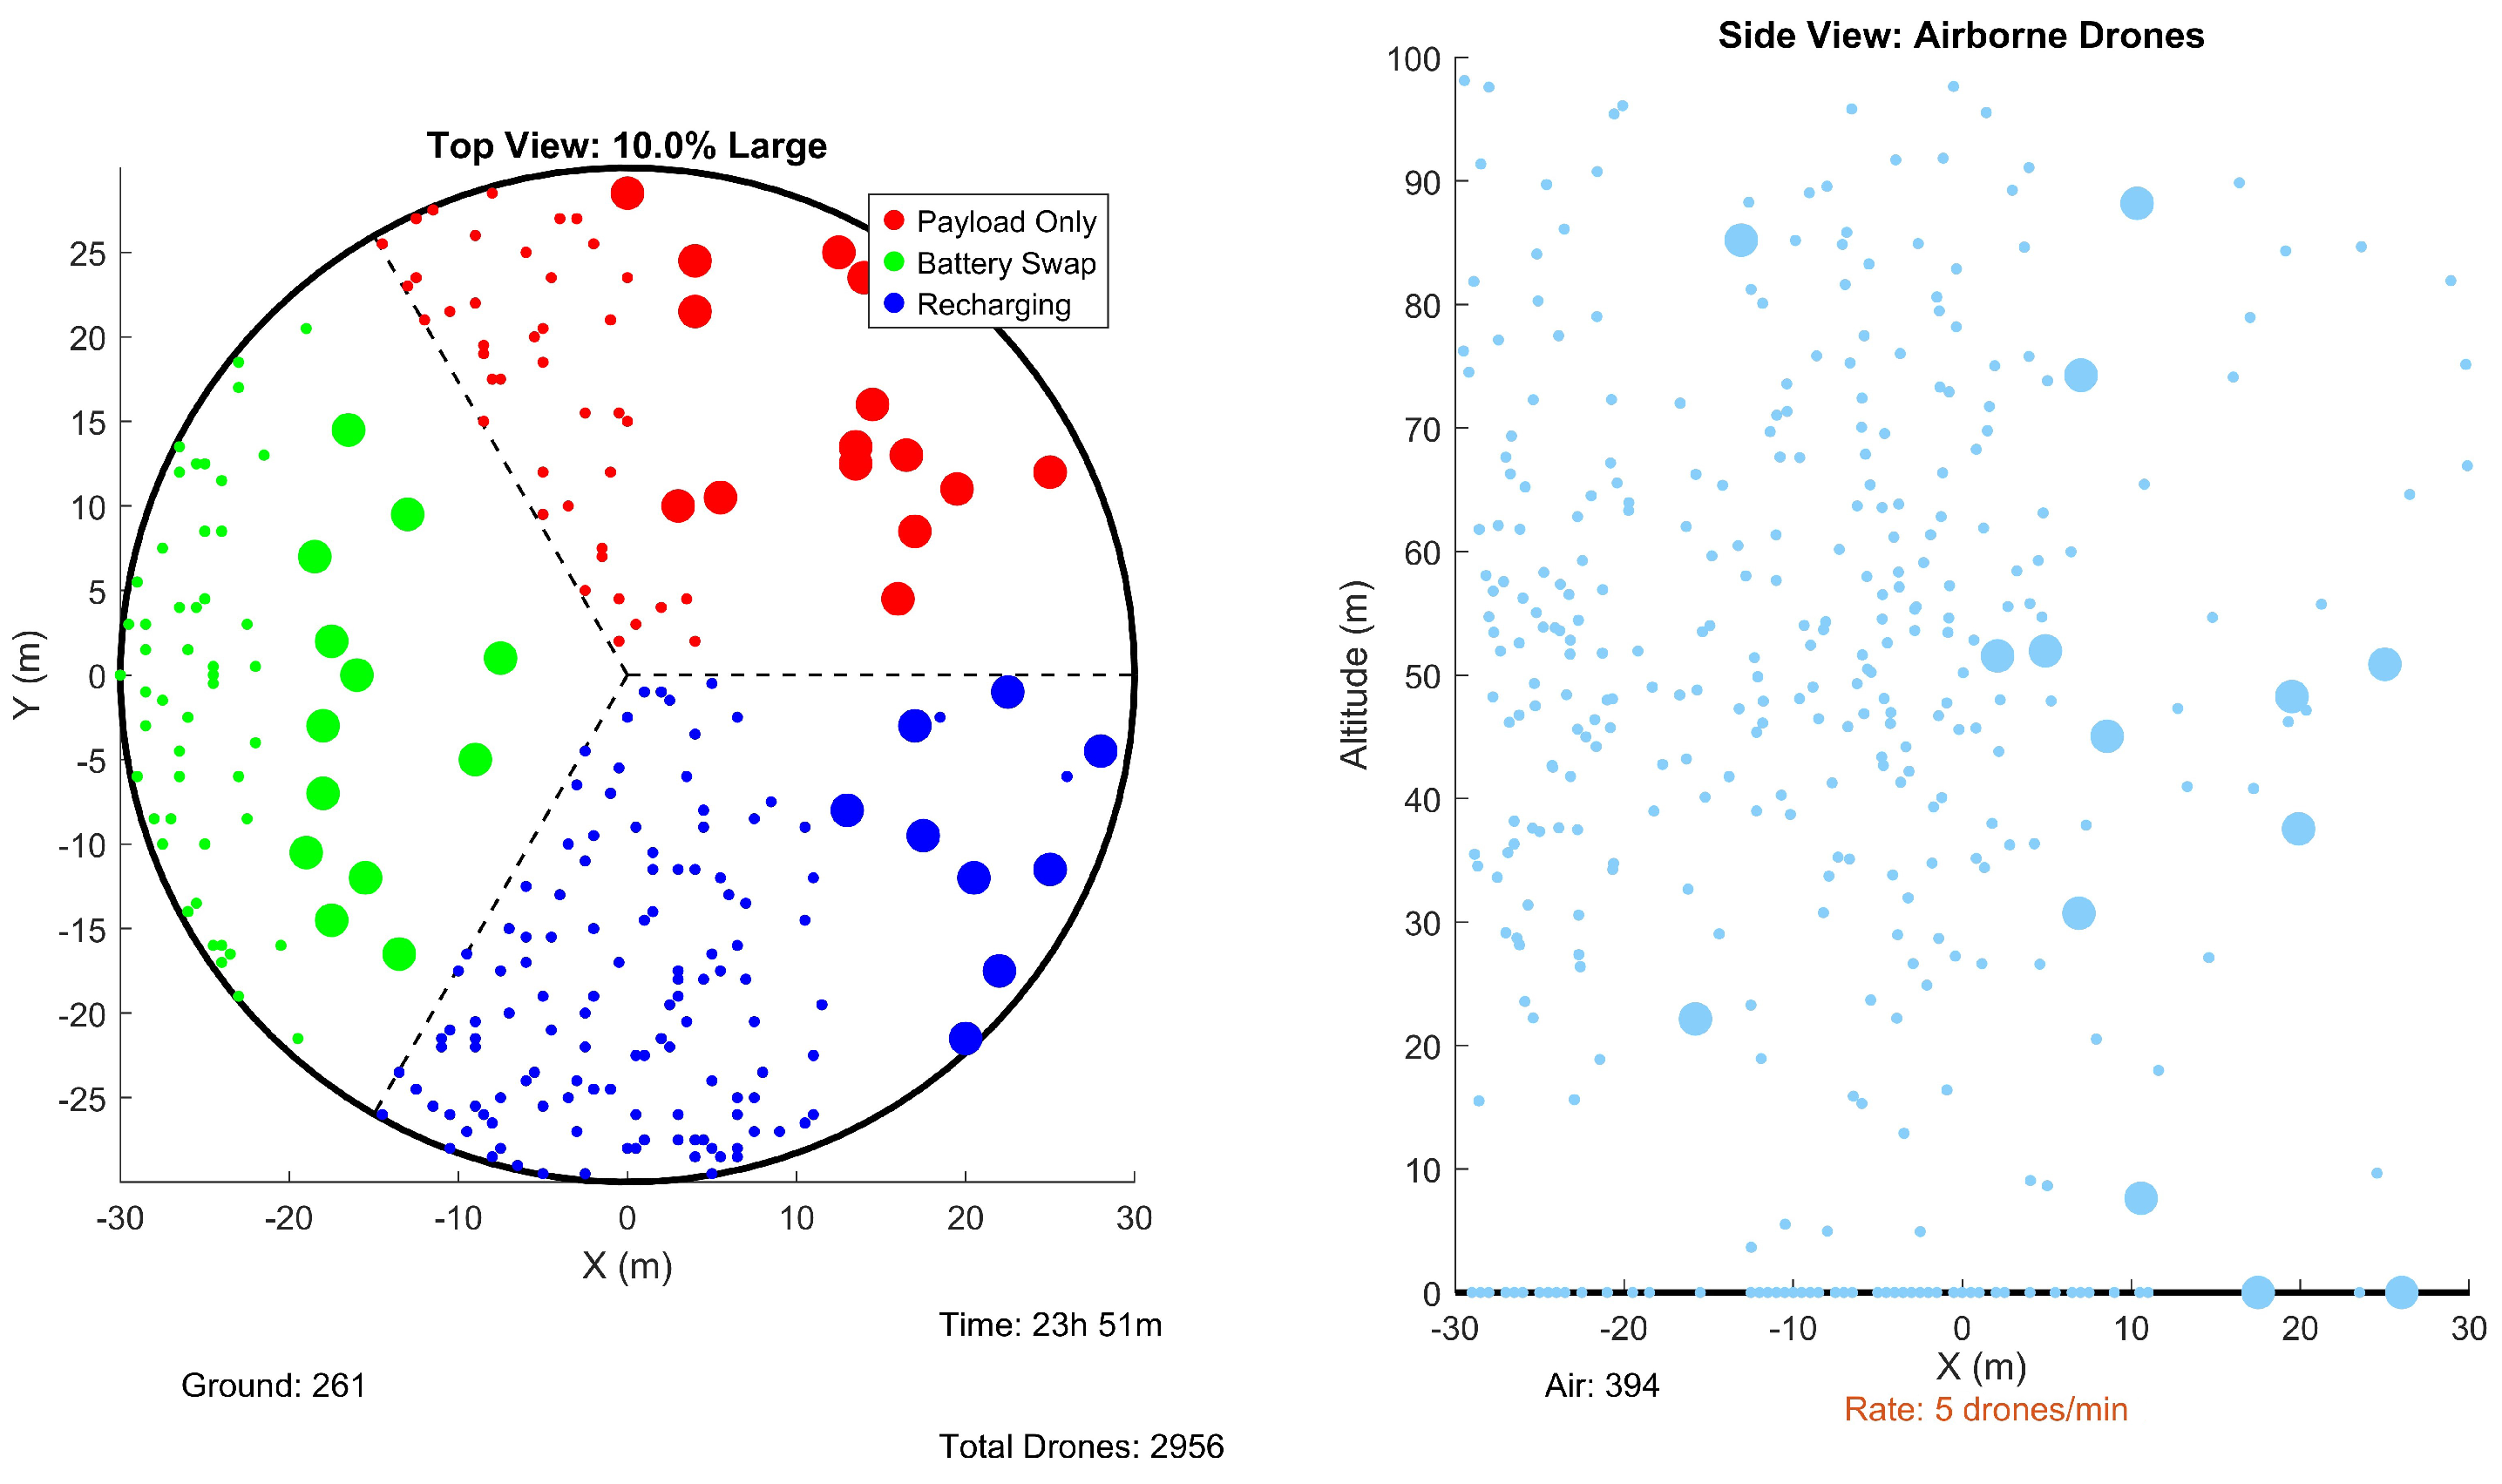
  • Top-down view of UAS distribution on the vertiport.
  • Altitude progression of UASs in flight.
  • Time series of active UASs (grounded vs. airborne).

7. Results and Visualization

7.1. Test Cases

The vertiport throughput has been analyzed for various configurations thanks to the programmed simulation. To be consistent, only the most impactful variables have been selected to be modified. Those are
  • Vertiport diameter D.
  • Simulation time t.
  • Large UAS percentage p.
The first three configurations vary in vertiport diameter. The next three vary in simulation time, and last but not least, the last three cases vary in large UAS percentage, keeping the other parameters constant. The other parameters, which can be modified, are constrained as follows:
  • A short mission is assumed as 30 [min].
  • A long mission is assumed as 60 [min].
  • A total of 20% of UASs leave the simulation area 15 min after takeoff permanently.

7.1.1. Vertiport Diameters

Three vertiport diameters have been selected based on Google imagery data measurements:
  • Small food delivery vertiport diameter D 1 = 15 [ m ].
  • Intermediate vertiport D 2 = 30 [ m ].
  • Large package delivery vertiport diameter D 3 = 60 [ m ].

7.1.2. Simulation Times

Three simulation times have been selected:
  • One day t 1 = 24 [ h ].
  • Twelve hours t 2 = 12 [ h ].
  • Rush hours t 3 = 4 [ h ].

7.1.3. Large UAS Percentage

Three large UAS percentages have been selected as follows:
  • No large UASs p 1 = 0 % .
  • The same amount of large and small UASs p 2 = 50 % .
  • Only large UASs p 3 = 100 % .
The data obtained in the simulation are also presented in the below tables, where all configurations are put together.

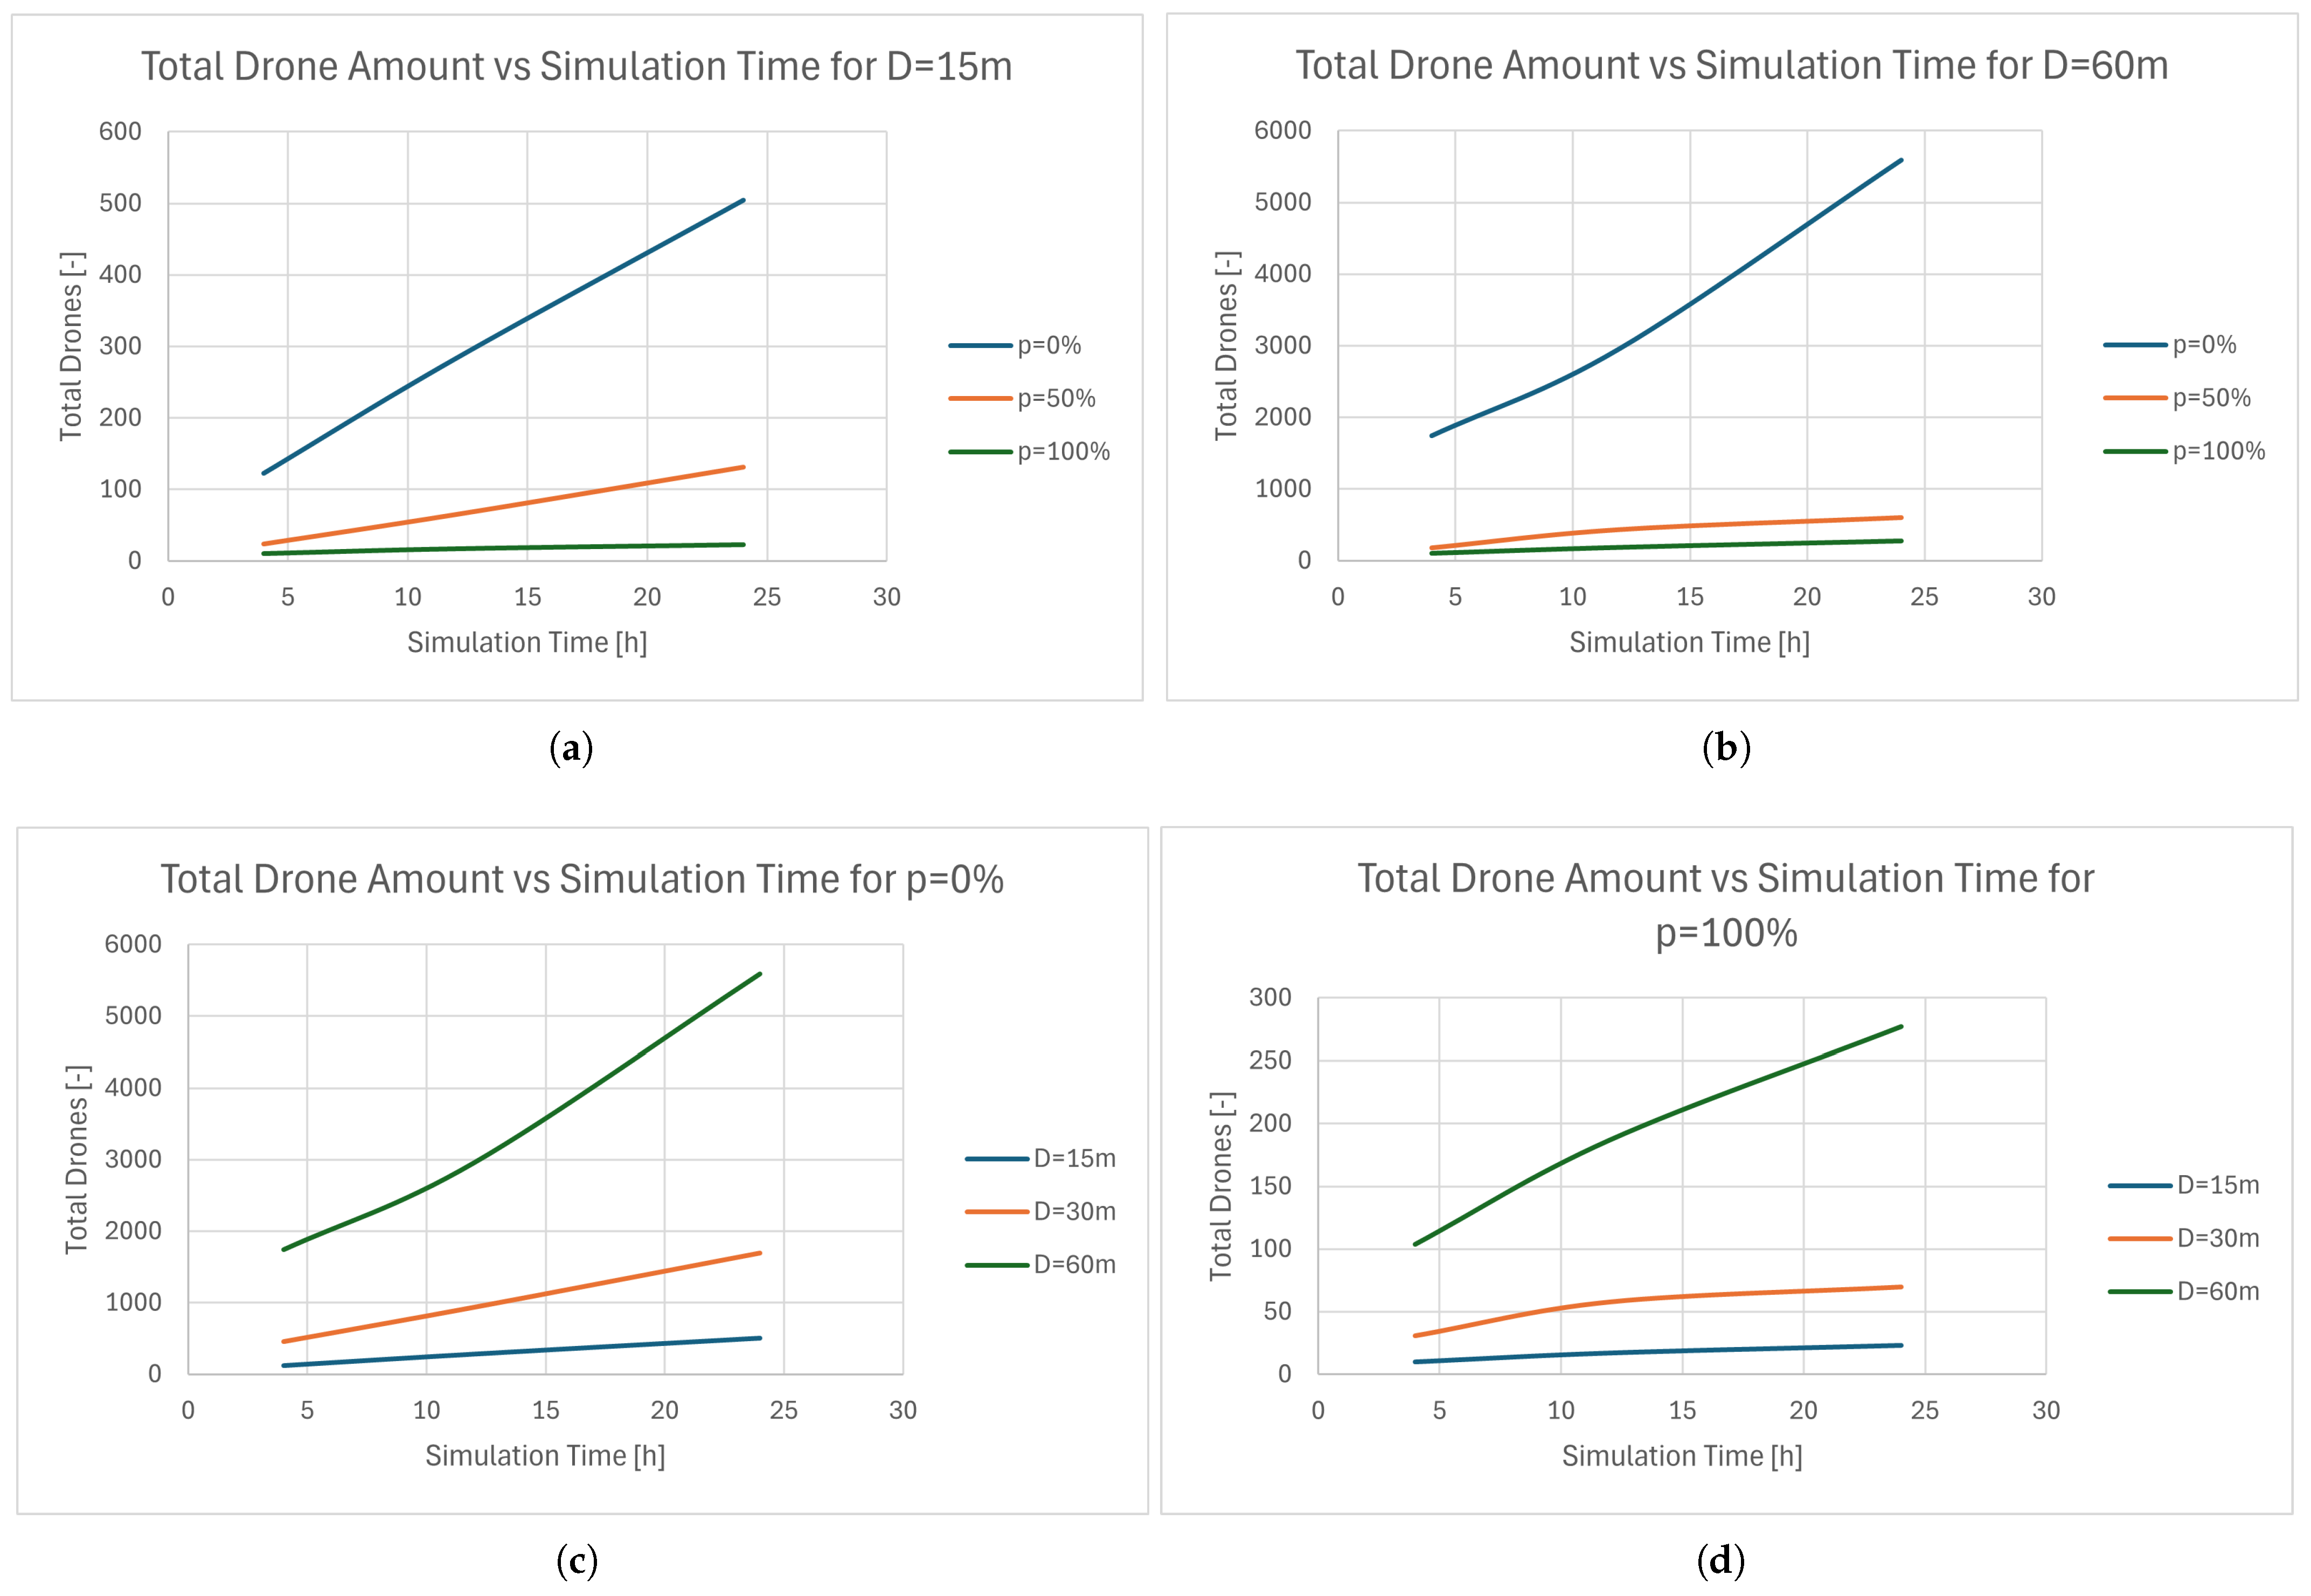
7.2. Results Analysis

Based on the results observed in Table 1 and Table 2, the alignment between the predicted and simulated outcomes confirms the validity of the model’s assumptions and its ability to replicate real-world dynamics. This consistency reinforces confidence in the simulation’s utility for assessing urban air mobility (UAM) systems under varied operational parameters. Based on data in Figure 5, the following can be concluded:
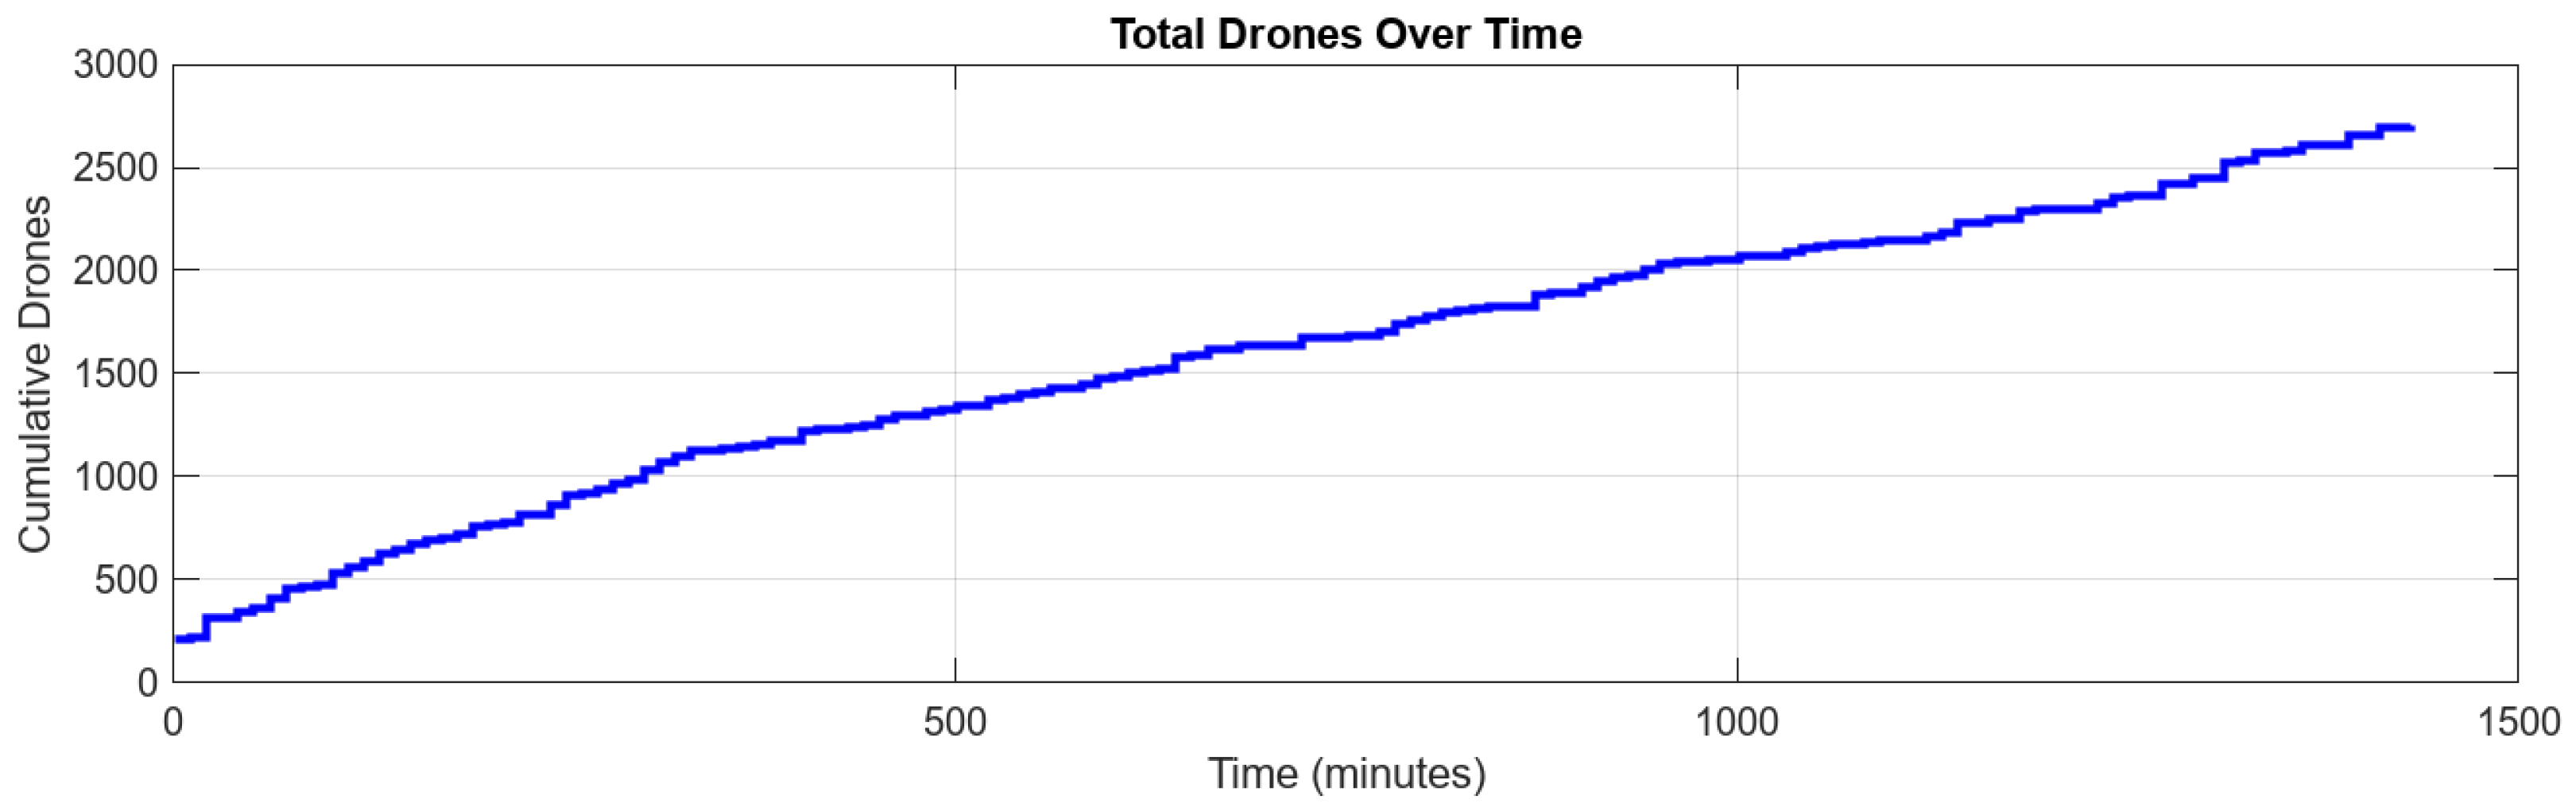
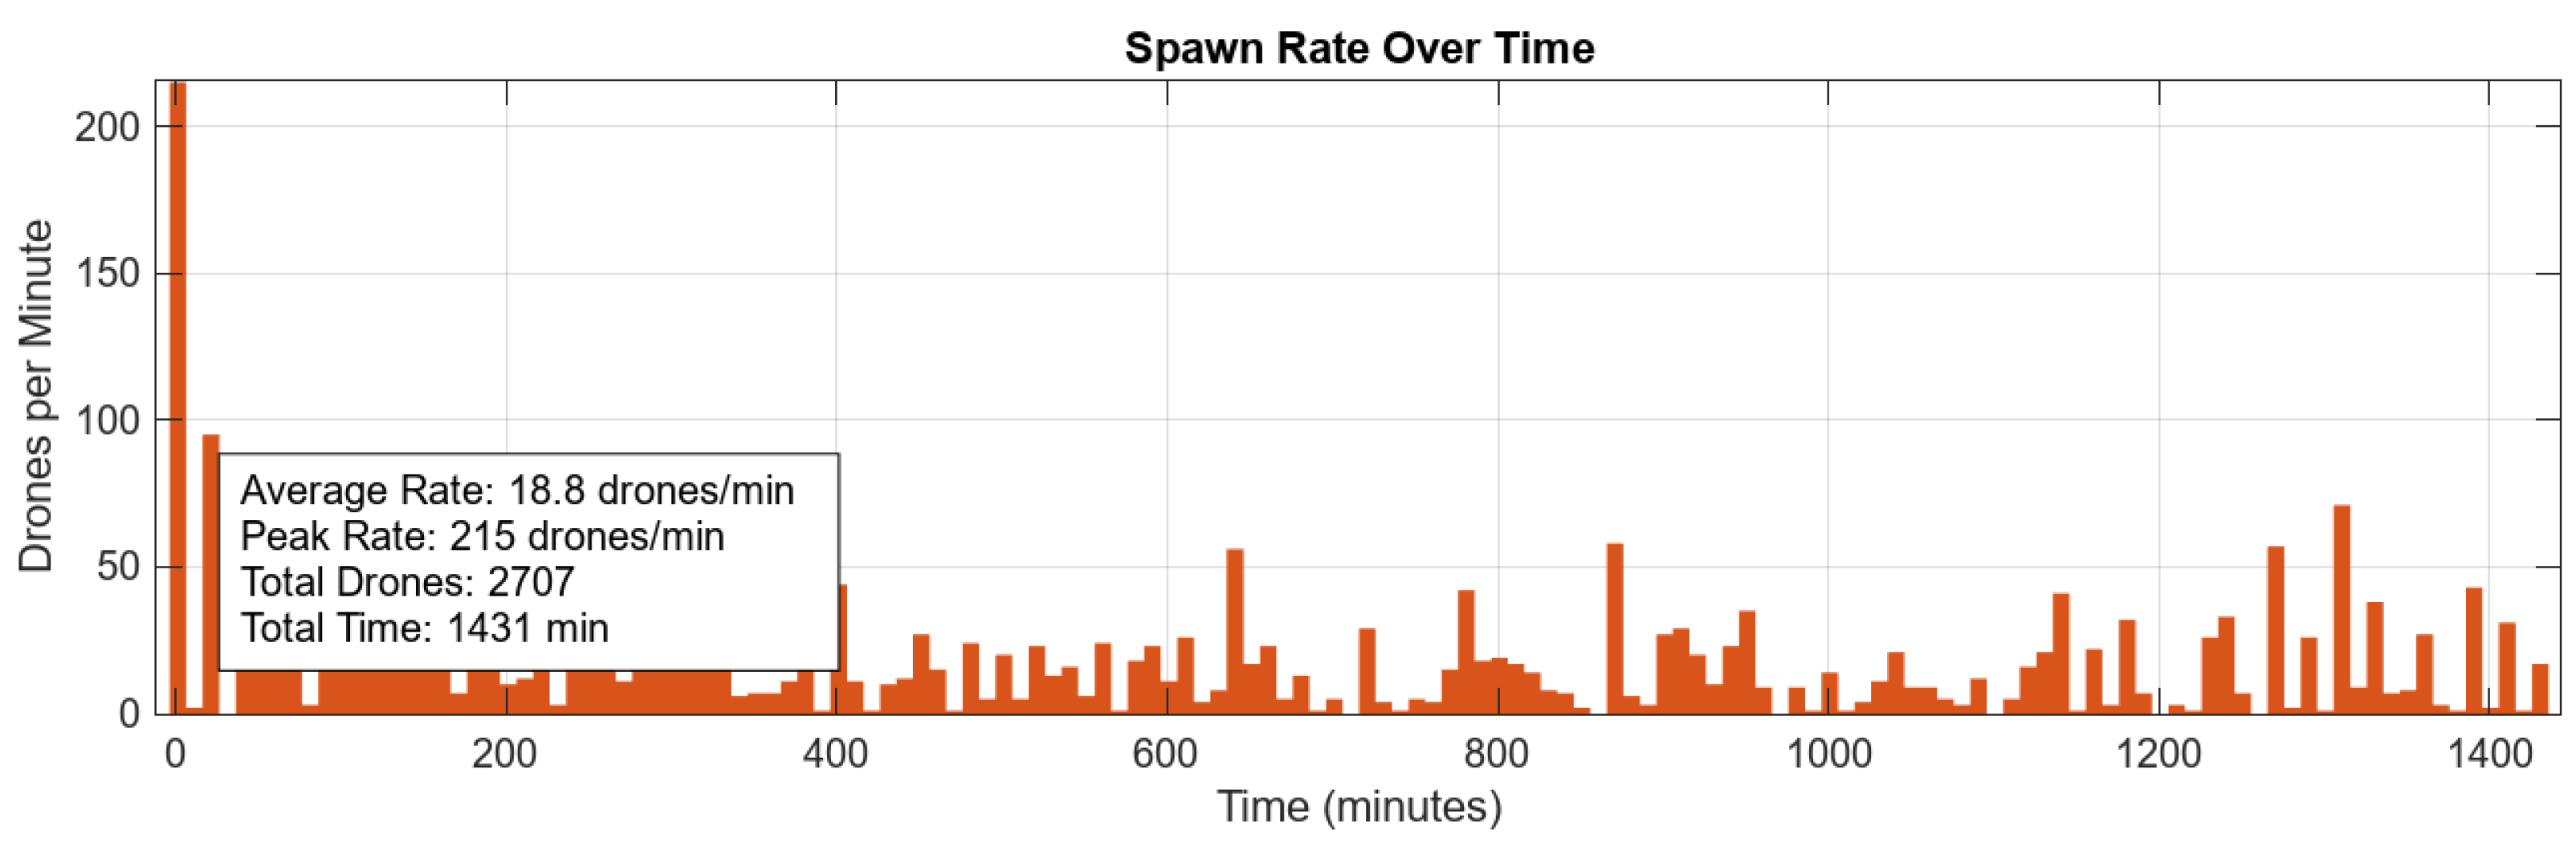
  • The total number of UASs increases over time.
  • The more smaller UASs (smaller p), the more total UASs overall.
  • The total number of UASs increases almost linearly for all UAS sizes, independently of vertiport diameter.
The observed trends, while partially aligning with intuitive expectations, serve primarily to validate the simulation’s robustness and reproducibility.
Figure 5 analyzes the temporal dynamics of the total unmanned aerial system (UAS) throughput relative to the geometric parameters of the vertiport through comparative scenario testing. The initial analysis (Figure 5a,b) examines scenarios with fixed vertiport diameters—15 m and 60 m, respectively—tracking temporal variations in total UAS numbers under distinct fleet compositions defined by large UAS proportions ( p = 0 % , 50 % , and 100 % ). Subsequent Figure 5c,d maintain constant fleet compositions ( p = 0 % and 100 % , respectively) while systematically adjusting vertiport diameters (15 m, 30 m, 60 m) to assess capacity impacts. This bifurcated analytical framework demonstrates how throughput characteristics emerge from interactions between physical infrastructure dimensions and operational fleet heterogeneity. Based on those results, a volume of UASs that could be operated in a certain vertiport can be estimated. Similarly, from the size of the vertiport, it may be concluded that the number of drones increases. However, it is necessary to investigate more deeply the other aspects of vertiports (loading, charging, etc.) to take those results as a recommendation. Nevertheless, this first approach gives a perspective regarding the quantity and volume of the problem.

8. Discussion

The quantitative relationships demonstrated, such as the inverse correlation between large-UAS prevalence (p) and throughput efficiency or the scalability benefits of increased vertiport diameters (D), provide empirical benchmarks for infrastructure planning and policy formulation. These findings underscore the importance of leveraging data-driven simulations to anticipate capacity constraints, optimize resource allocation, and mitigate operational risks in future UAM deployments. By grounding strategic decisions in validated metrics, stakeholders can ensure the development of resilient, high-capacity vertiport networks capable of meeting evolving urban air transportation demands. The empirical data from this analysis holds critical importance, as it provides a quantitative foundation for evaluating informed projections regarding the scalability, operational viability, and strategic planning of urban air mobility (UAM) systems. These metrics enable stakeholders to assess capacity requirements, infrastructure design trade-offs, and policy frameworks under realistic operational scenarios, ensuring that forward-looking decisions are grounded in actionable, evidence-based insights. The vertiport analysis should have gone deeper. For example, the larger the vertiport is, the more significant other factors may be that could change the analysis results. Having the vertiport too large may likely make it difficult to operate within this area effectively, especially in the context of battery changes or cargo loading/unloading. However, those aspects need to be developed in future steps.

Model Validity

The proposed simulation model has three main advantages. Firstly, its grid layout—specifically having areas provided for battery recharging and cargo processing—allows for close monitoring of vertiport procedures and simultaneously accommodates multiple processes without interference.
Secondly, the framework’s flexibility is increased through parameters that can be altered, including vertiport dimensions, fleet configuration, and mission scheduling. Such flexibility renders the model suitable for various applications, ranging from meal delivery companies to industrial logistics.
Finally, adherence to the EASA standards and integration of varied mission durations ensures compliance with regulatory requirements and effectively addresses the inherent uncertainty of urban air mobility conditions. One of the conclusions that arises is that vertiport operators face a dual optimization challenge: while infrastructure scaling benefits small-UAS efficiency, it yields progressively smaller returns when accommodating bulkier drones. Practical implementation strategies must couple diameter increases with fleet composition controls—for example, restricting large UAS allocations to under 40% in sub-30 m vertiports—to maintain viable throughput thresholds. The inherent conflict between fixed infrastructure limitations and variable operational requirements emphasizes the necessity for flexible regulatory frameworks in urban airspace management, especially given the growing emphasis on multifunctional aerial pathways in municipal planning. The reduced efficacy observed when scaling infrastructure for larger drones indicates that physical modifications alone cannot adequately address congestion challenges in dense operational environments, requiring instead the integration of advanced coordination systems such as real-time adaptive scheduling protocols.

9. Conclusions

This research successfully models vertiport operations in a flexible simulation framework. Although abstracted, it captures critical constraints and dynamics. It provides a basis for more advanced modeling involving real-world constraints, battery models, queuing systems, and vertiport scheduling algorithms. The following model of the vertiports and the method for its capacity calculation may be further used in wider simulations that consider either the city or logistic centers for delivery companies. Such a simulation tool allows users to define their needs and calculate and simulate their infrastructure. This methodology may be helpful for both sides of the UAM world in the future. One significant group contains U-space owners, regulatory authorities, aviation, and city authorities. They would need the information regarding the capacity of the vertiports and the needs and changes that must be made to update and rebuild the public infrastructure. On the other hand, companies and the logistics industry would need the tool and information based on input parameters to calculate their companies’ capacity and needs. That information could be crucial to developing effective vertiports and infrastructure during the transition from ground transport to air.
Nonetheless, the model has several limitations. The abstraction of a two-dimensional circle vertiport cannot address the three-dimensional effects of wake interference and ground effect physics, which may be essential for operations involving eVTOL aircraft nearby [6,7]. Minimizing battery-swapping and charging time to constants ignores variability as a function of changing state-of-charge levels or battery conditions. The available service logic also assumes perfect scheduling at each zone and ignores the possibility of unpredictable delays due to maintenance or inauspicious weather conditions.
The insightful analysis of the vertiport’s capacity and safety aspects has to be simulated before the large-scale simulations are introduced into the real scenarios. The presented research shows the importance of the simulation and research on each single element of the urban air mobility structure. The presented solution has to be developed further by more adequate and detailed modeling. It is also planned to incorporate the vertiport models and traffic management into the wider simulation that is being developed by the WUT team [38].

10. Future Work

Several improvements and extensions could be developed to optimize the presented simulation models further and enhance real-world vertiport infrastructure applications. Firstly, incorporating realistic energy models that account for battery degradation will offer a more accurate representation of UAS performance over extended periods. This improvement will allow for the prediction of the long-term operational sustainability of UAS fleets and make the recharging process more realistic. Additionally, the implementation of priority-based landing and service scheduling will be crucial. Such an approach can dynamically allocate landing slots and service windows based on urgency and UAS performance, reducing delays and streamlining operations. A further step involves integrating comprehensive airspace management systems with advanced path-finding algorithms. By doing so, developed simulations can more effectively coordinate traffic, optimize flight paths, and mitigate risks associated with dense UAS operations. Optimizing the layout of the vertiport remains a key area of focus as well. It is anticipated that throughput and safety will be improved by rethinking spatial arrangements and operational flows, ensuring that the vertiport can accommodate a diverse range of UAS sizes and service requirements. Beyond these immediate technical enhancements, the paper also explores innovative ideas for the physical arrangement of vertiports. One proposal involves designing the vertiport in a spiral configuration, which could facilitate a more efficient distribution of landing and takeoff operations. One of the examples that could be developed is a torus or doughnut-shaped configuration, which features an open center to allow for a convenient ingress of service personnel and maintenance crews. Not only does the shape of the vertiport need to be optimized but it has to include other factors such as accessibility to UASs, loading/unloading packages, etc.
The absence of realistic energy consumption and degradation models may lead to optimistic throughput estimates for long-mission UASs. Similarly, the model does not explicitly simulate communication or sense-and-avoid system performance, which are essential for safety in high-density operations. Finally, the reliance on synthetic demand (percentages of large vs. small UASs) rather than empirical traffic data limits the precision of throughput projections.
To improve the developed simulation tool and models, the following actions should be performed in the future:
  • Pilot Field Trials [39]: Conduct a small-scale vertiport operation utilizing standard equipment to measure actual turnaround times, traffic behavior, and reactions to congestion and compare them against results obtained through simulations.
  • Calibration of Historical Data: Use operation logs from existing drone delivery operations (e.g., logistics companies [40]) to calibrate mission duration distributions and service time parameters.
  • Hardware-in-the-Loop (HIL) Testing [41]: Integrate actual unmanned aerial system (UAS) communication and collision-avoidance elements in the simulated system to assess the effects of latency or inaccuracies of the control algorithms on the functional performance of vertiports.
  • Sensitivity Analyses [42]: Systematically vary uncertain parameters, e.g., descent rates and battery exchange times, and compare the resulting data with the available limited empirical data to test the robustness of the model.
By addressing these weaknesses and conducting targeted validation, the simulation can evolve from a conceptual planning tool into a decision support system for vertiport designers, regulators, and operators. These proposed improvements and design ideas would refine the simulation parameters and point toward novel real-world implementations. Each concept will require detailed prototyping and testing to evaluate its practical benefits in the context of next-generation urban air mobility systems.

Author Contributions

Conceptualization, A.K.; project lead, A.K.; methodology and concept, A.K., simulation software, S.D.; validation, A.K. and S.D.; investigation, A.K. and S.D.; visualization, A.K. and S.D.; project administration, A.K. All authors have read and agreed to the published version of the manuscript.

Funding

This research received no external funding.

Data Availability Statement

No data availability.

Conflicts of Interest

The authors declare no conflicts of interest.

References

  1. Uber. Introducing Uber Copter, Technical Report. Available online: https://www.uber.com/blog/new-york-city/uber-copter (accessed on 20 April 2025).
  2. Castro, D.G.; García, E.V. Safety Challenges for Integrating U-Space in Urban Environments. In Proceedings of the 2021 International Conference on Unmanned Aircraft Systems (ICUAS), Athens, Greece, 15–18 June 2021; pp. 1258–1267, ISSN 2575-7296. [Google Scholar] [CrossRef]
  3. Meincke, P.; Duca, G.; Ciaburri, M.; Russo, R.; Enei, R.; Proietti, S.; Dziugiel, B.; Mączka, M.; Stańczyk, A. Concept of Operations for ATM Service to Passengers in Intermodal Transport System; Technical Report; SESAR: Brussels, Belgium, 2022. [Google Scholar]
  4. Cohn, P.; Green, A.; Langstaff, M.; Roller, M. Commercial Drones Are Here: The Future of Unmanned Aerial Systems. Available online: https://www.scribd.com/document/725004715/commercial-drones-are-here-the-future-of-unmanned-aerial-systems (accessed on 20 April 2025).
  5. Sengupta, D.; Das, S.K. Urban Air Mobility: Vision, Challenges and Opportunities. In Proceedings of the 2023 IEEE 24th International Conference on High Performance Switching and Routing (HPSR), Albuquerque, NM, USA, 5–7 June 2023; pp. 1–6. [Google Scholar] [CrossRef]
  6. Liu, Z.; Nie, L.; Xu, G.; Li, Y.; Guan, X. Multi-Objective Design of UAS Air Route Network Based on a Hierarchical Location–Allocation Model. Sustainability 2023, 15, 16521. [Google Scholar] [CrossRef]
  7. Watts, A.C.; Ambrosia, V.G.; Hinkley, E.A. Unmanned Aircraft Systems in Remote Sensing and Scientific Research: Classification and Considerations of Use. Remote Sens. 2012, 4, 1671–1692. [Google Scholar] [CrossRef]
  8. Tmušić, G.; Manfreda, S.; Aasen, H.; James, M.R.; Gonçalves, G.; Ben-Dor, E.; Brook, A.; Polinova, M.; Arranz, J.J.; Mészáros, J.; et al. Current Practices in UAS-based Environmental Monitoring. Remote Sens. 2020, 12, 1001. [Google Scholar] [CrossRef]
  9. Goyal, R.; Reiche, C.; Fernando, C.; Cohen, A. Advanced Air Mobility: Demand Analysis and Market Potential of the Airport Shuttle and Air Taxi Markets. Sustainability 2021, 13, 7421. [Google Scholar] [CrossRef]
  10. Zhyriakov, D.; Ptak, M.; Sawicki, M. Urban Air Mobility, Personal Drones, and the Safety of Occupants—A Comprehensive Review. J. Sens. Actuator Netw. 2025, 14, 39. [Google Scholar] [CrossRef]
  11. Schweiger, K.; Preis, L. Urban Air Mobility: Systematic Review of Scientific Publications and Regulations for Vertiport Design and Operations. Drones 2022, 6, 179. [Google Scholar] [CrossRef]
  12. Biehle, T. Social Sustainable Urban Air Mobility in Europe. Sustainability 2022, 14, 9312. [Google Scholar] [CrossRef]
  13. Song, K.H.; Lee, H. Network Topology-Driven Vertiport Placement Strategy: Integrating Urban Air Mobility with the Seoul Metropolitan Railway System. Appl. Sci. 2025, 15, 3965. [Google Scholar] [CrossRef]
  14. Goyal, R.; Reiche, C.; Fernando, C.; Serrao, J.; Kimmel, S.; Cohen, A.; Shaheen, S. Urban Air Mobility (UAM) Market Study. Available online: https://ntrs.nasa.gov/citations/20190001472 (accessed on 20 April 2025).
  15. Cohen, A.P.; Shaheen, S.A.; Farrar, E.M. Urban Air Mobility: History, Ecosystem, Market Potential, and Challenges. IEEE Trans. Intell. Transp. Syst. 2021, 22, 6074–6087. [Google Scholar] [CrossRef]
  16. Thipphavong, D.P.; Apaza, R.; Barmore, B.; Battiste, V.; Burian, B.; Dao, Q.; Feary, M.; Go, S.; Goodrich, K.H.; Homola, J.; et al. Urban Air Mobility Airspace Integration Concepts and Considerations. In Proceedings of the 2018 Aviation Technology, Integration, and Operations Conference, Atlanta, Georgia, 25–29 June 2018; AIAA AVIATION Forum, American Institute of Aeronautics and Astronautics: Moffett Field, CA, USA, 2018. [Google Scholar] [CrossRef]
  17. Yan, Y.; Wang, K.; Qu, X. Urban air mobility (UAM) and ground transportation integration: A survey. Front. Eng. Manag. 2024, 11, 734–758. [Google Scholar] [CrossRef]
  18. Sengupta, R.; Bulusu, V.; Mballo, C.E.; Onat, E.; Cao, S. Urban Air Mobility Research Challenges and Opportunities. Annu. Rev. Control. Robot. Auton. Syst. 2025, 8, 407–431. [Google Scholar] [CrossRef]
  19. Schuchardt, B.I.; Geister, D.; Lüken, T.; Knabe, F.; Metz, I.C.; Peinecke, N.; Schweiger, K. Air Traffic Management as a Vital Part of Urban Air Mobility—A Review of DLR’s Research Work from 1995 to 2022. Aerospace 2023, 10, 81. [Google Scholar] [CrossRef]
  20. InPost, S.A. Annual Report 2022. Technical Report. 2023. Available online: https://inpost.eu/sites/default/files/2023-03/InPost%20IAR%202022.pdf (accessed on 20 April 2025).
  21. Stava Report on Food Delivery Market in Poland 2023. Technical Report. 2023. Available online: https://stava-reports.s3.eu-central-1.amazonaws.com/Raport+Stava+o+rynku+dowozo%CC%81w+jedzenia+2023.pdf (accessed on 20 April 2025).
  22. Arafat, M.Y.; Pan, S. Urban Air Mobility Communications and Networking: Recent Advances, Techniques, and Challenges. Drones 2024, 8, 702. [Google Scholar] [CrossRef]
  23. Moradi, N.; Wang, C.; Mafakheri, F. Urban Air Mobility for Last-Mile Transportation: A Review. Vehicles 2024, 6, 1383–1414. [Google Scholar] [CrossRef]
  24. Charnsethikul, C.; Silva, J.M.; Verhagen, W.J.C.; Das, R. Urban Air Mobility Aircraft Operations in Urban Environments: A Review of Potential Safety Risks. Aerospace 2025, 12, 306. [Google Scholar] [CrossRef]
  25. Straubinger, A.; Rothfeld, R.; Shamiyeh, M.; Büchter, K.D.; Kaiser, J.; Plötner, K.O. An Overview of Current Research and Developments in Urban Air Mobility—Setting the Scene for UAM Introduction. J. Air Transp. Manag. 2020, 87, 101852. [Google Scholar] [CrossRef]
  26. Polish Air Navigation Services Agency. PansaUTM. 2023. Available online: https://utm.pansa.pl/ (accessed on 20 April 2025).
  27. Sarhan, S.; Rinaldi, M.; Primatesta, S.; Guglieri, G. Noise-Aware UAV Path Planning in Urban Environment with Reinforcement Learning. Eng. Proc. 2025, 90, 3. [Google Scholar] [CrossRef]
  28. European Union. Report from the Commission to the European Parliament and the Council on the Implementation of the Environmental Noise Directive in accordance with Article 11 of Directive 2002/49/EC. 2023. Available online: https://eur-lex.europa.eu/legal-content/EN/TXT/?uri=celex:52011DC0321 (accessed on 15 April 2025).
  29. WHO EURO. Burden of Disease from Environmental Noise: Quantification of Healthy Life Years Lost in Europe. 2011. Available online: https://www.who.int/publications/i/item/burden-of-disease-from-environmental-noise-quantification-of-healthy-life-years-lost-in-europe (accessed on 10 April 2025).
  30. Wei, Q.; Gao, Z.; Clarke, J.P.; Topcu, U. Risk-aware Urban Air Mobility Network Design with Overflow Redundancy. arXiv 2023, arXiv:2306.05581. [Google Scholar] [CrossRef]
  31. Baek, H.Y.; Kim, J.H. Prediction of Urban Air Mobility and Drone Accident Rates and the Role of Urban Management Systems. Urban Sci. 2025, 9, 24. [Google Scholar] [CrossRef]
  32. Lee, C.W.; Madnick, S. Cybersafety Approach to Cybersecurity Analysis and Mitigation for Mobility-as-a-Service and Internet of Vehicles. Electronics 2021, 10, 1220. [Google Scholar] [CrossRef]
  33. Polska Agencja Żeglugi Powietrznej. Co Może Grozić za Naruszanie Przepisów Określających Zasady Wykonywania Lotów Dronami? Available online: https://www.pansa.pl/co-moze-grozic-za-naruszanie-przepisow-okreslajacych-zasady-wykonywania-lotow-dronami/ (accessed on 9 April 2025).
  34. Urban Air Mobility Concept of Operations. Available online: https://nari.arc.nasa.gov/sites/default/files/attachments/UAM_ConOps_v1.0.pdf (accessed on 10 April 2025).
  35. Agouridas, V.; Biermann, F.; Czaya, A.; Richter, D.; Stemmler, J.; Stęchły, J.; Witkowska-Konieczny, A.; Kumar, R.; Patatouka, E. Practitioner Briefing Urban Air Mobility and Sustainable Urban Mobility Planning. 2021. Available online: https://urban-mobility-observatory.transport.ec.europa.eu/system/files/2023-11/urban_air_mobility_and_sump.pdf (accessed on 13 April 2025).
  36. Arnedo, M. 10.3.4: Classification of the Airspace According to ICAO. Available online: https://eng.libretexts.org/Bookshelves/Aerospace_Engineering/Fundamentals_of_Aerospace_Engineering_(Arnedo)/10%3A_Air_navigation-_ATM/10.03%3A_Airspace_Management_(ASM)/10.3.04%3A_Classification_of_the_airspace_according_to_ICAO (accessed on 13 April 2025).
  37. Vertiports-Urban-Environment. European Union Aviation Safety Agency: The European Union Authority for Aviation Safety. 2022. Available online: https://www.easa.europa.eu/pl/light/topics/vertiports-urban-environment (accessed on 13 April 2025).
  38. Kopyt, A.; Sochacki, M.; Kaczmarek, K. Tool for Analysis of Traffic of Vertical Take-off and Landing Aircraft in Urban Agglomerations. J. Theor. Appl. Mech. 2024, 63, 103–113. [Google Scholar] [CrossRef]
  39. ISPRA; CEDRE; UAS Italian Fire Brigade Service; Brittany Fire Brigades. D5.3 Report on Field Trials and Lessons Learnt. 2023. Available online: https://wwz.cedre.fr/en/content/download/11175/file/D5.3-Summaryreportdef.pdf (accessed on 13 April 2025).
  40. GIS Support. Dane Statystyczne GUS. 2022. Available online: https://gis-support.pl/baza-wiedzy-2/dane-do-pobrania/dane-statystyczne-gus/ (accessed on 13 April 2025).
  41. Ledin, J.A. Hardware-in-the-Loop Simulation. 1999. Available online: https://idsc.ethz.ch/content/dam/ethz/special-interest/mavt/dynamic-systems-n-control/idsc-dam/Lectures/Embedded-Control-Systems/AdditionalMaterial/Applications/APP_Hardware-in-the-Loop_Simulation.pdf (accessed on 13 April 2025).
  42. skybrary.aero. Guidance Material: Sensitivity Analysis. p. 18. Available online: https://skybrary.aero/sites/default/files/bookshelf/33474.pdf (accessed on 13 April 2025).
Figure 1. An implementation of the initial vertiport design.
Aerospace 12 00560 g001
Figure 2. An example implementation of the vertiport zoning strategy.
Aerospace 12 00560 g002
Figure 3. Total UASs over time example graph for the zoned vertiport.
Aerospace 12 00560 g003
Figure 4. Spawn rate over time example graph for the zoned vertiport.
Aerospace 12 00560 g004
Figure 5. Total UAS amount vs. simulation time for the smallest and biggest in diameter analyzed vertiports. (a,b) present constant vertical diameters, and (c,d) present a constant UAS size (parameter p—large UAS percentage parameter).
Aerospace 12 00560 g005
Table 1. Tested configurations together with input parameters and results.
ConfigurationInputOutput
D [m]t [h]p [%]Total UASAverage Rate [UAS/min]Peak Rate [UAS/min]
11524100230.24
21524501310.96
3152405043.523
41512100170.24
5151250650.98
6151202833.927
7154100100.44
815450241.010
915401235.129
103024100700.516
113024502611.814
1230240169811.896
133012100580.816
143012501602.220
153012093813.079
16304100311.314
1730450733.014
18304045619.0110
1960241002771.955
206024505994.261
2160240559438.8441
2260121001872.653
236012504326.099
2460120295941.1414
256041001044.353
26604501797.563
276040174272.6446
Table 2. Averaged results based on all 27 configurations.
D [m]Total UAS [-]Average Rate [UAS/min]Peak Rate [UAS/min]
15131213
30416642
60134120187
t [h]Total UAS [-]Average Rate [UAS/min]Peak Rate [UAS/min]
43051383
12567880
241017780
p [%]Total UAS [-]Average Rate [UAS/min]Peak Rate [UAS/min]
0158923185
50214333
10086124
Average670981
Disclaimer/Publisher’s Note: The statements, opinions and data contained in all publications are solely those of the individual author(s) and contributor(s) and not of MDPI and/or the editor(s). MDPI and/or the editor(s) disclaim responsibility for any injury to people or property resulting from any ideas, methods, instructions or products referred to in the content.

