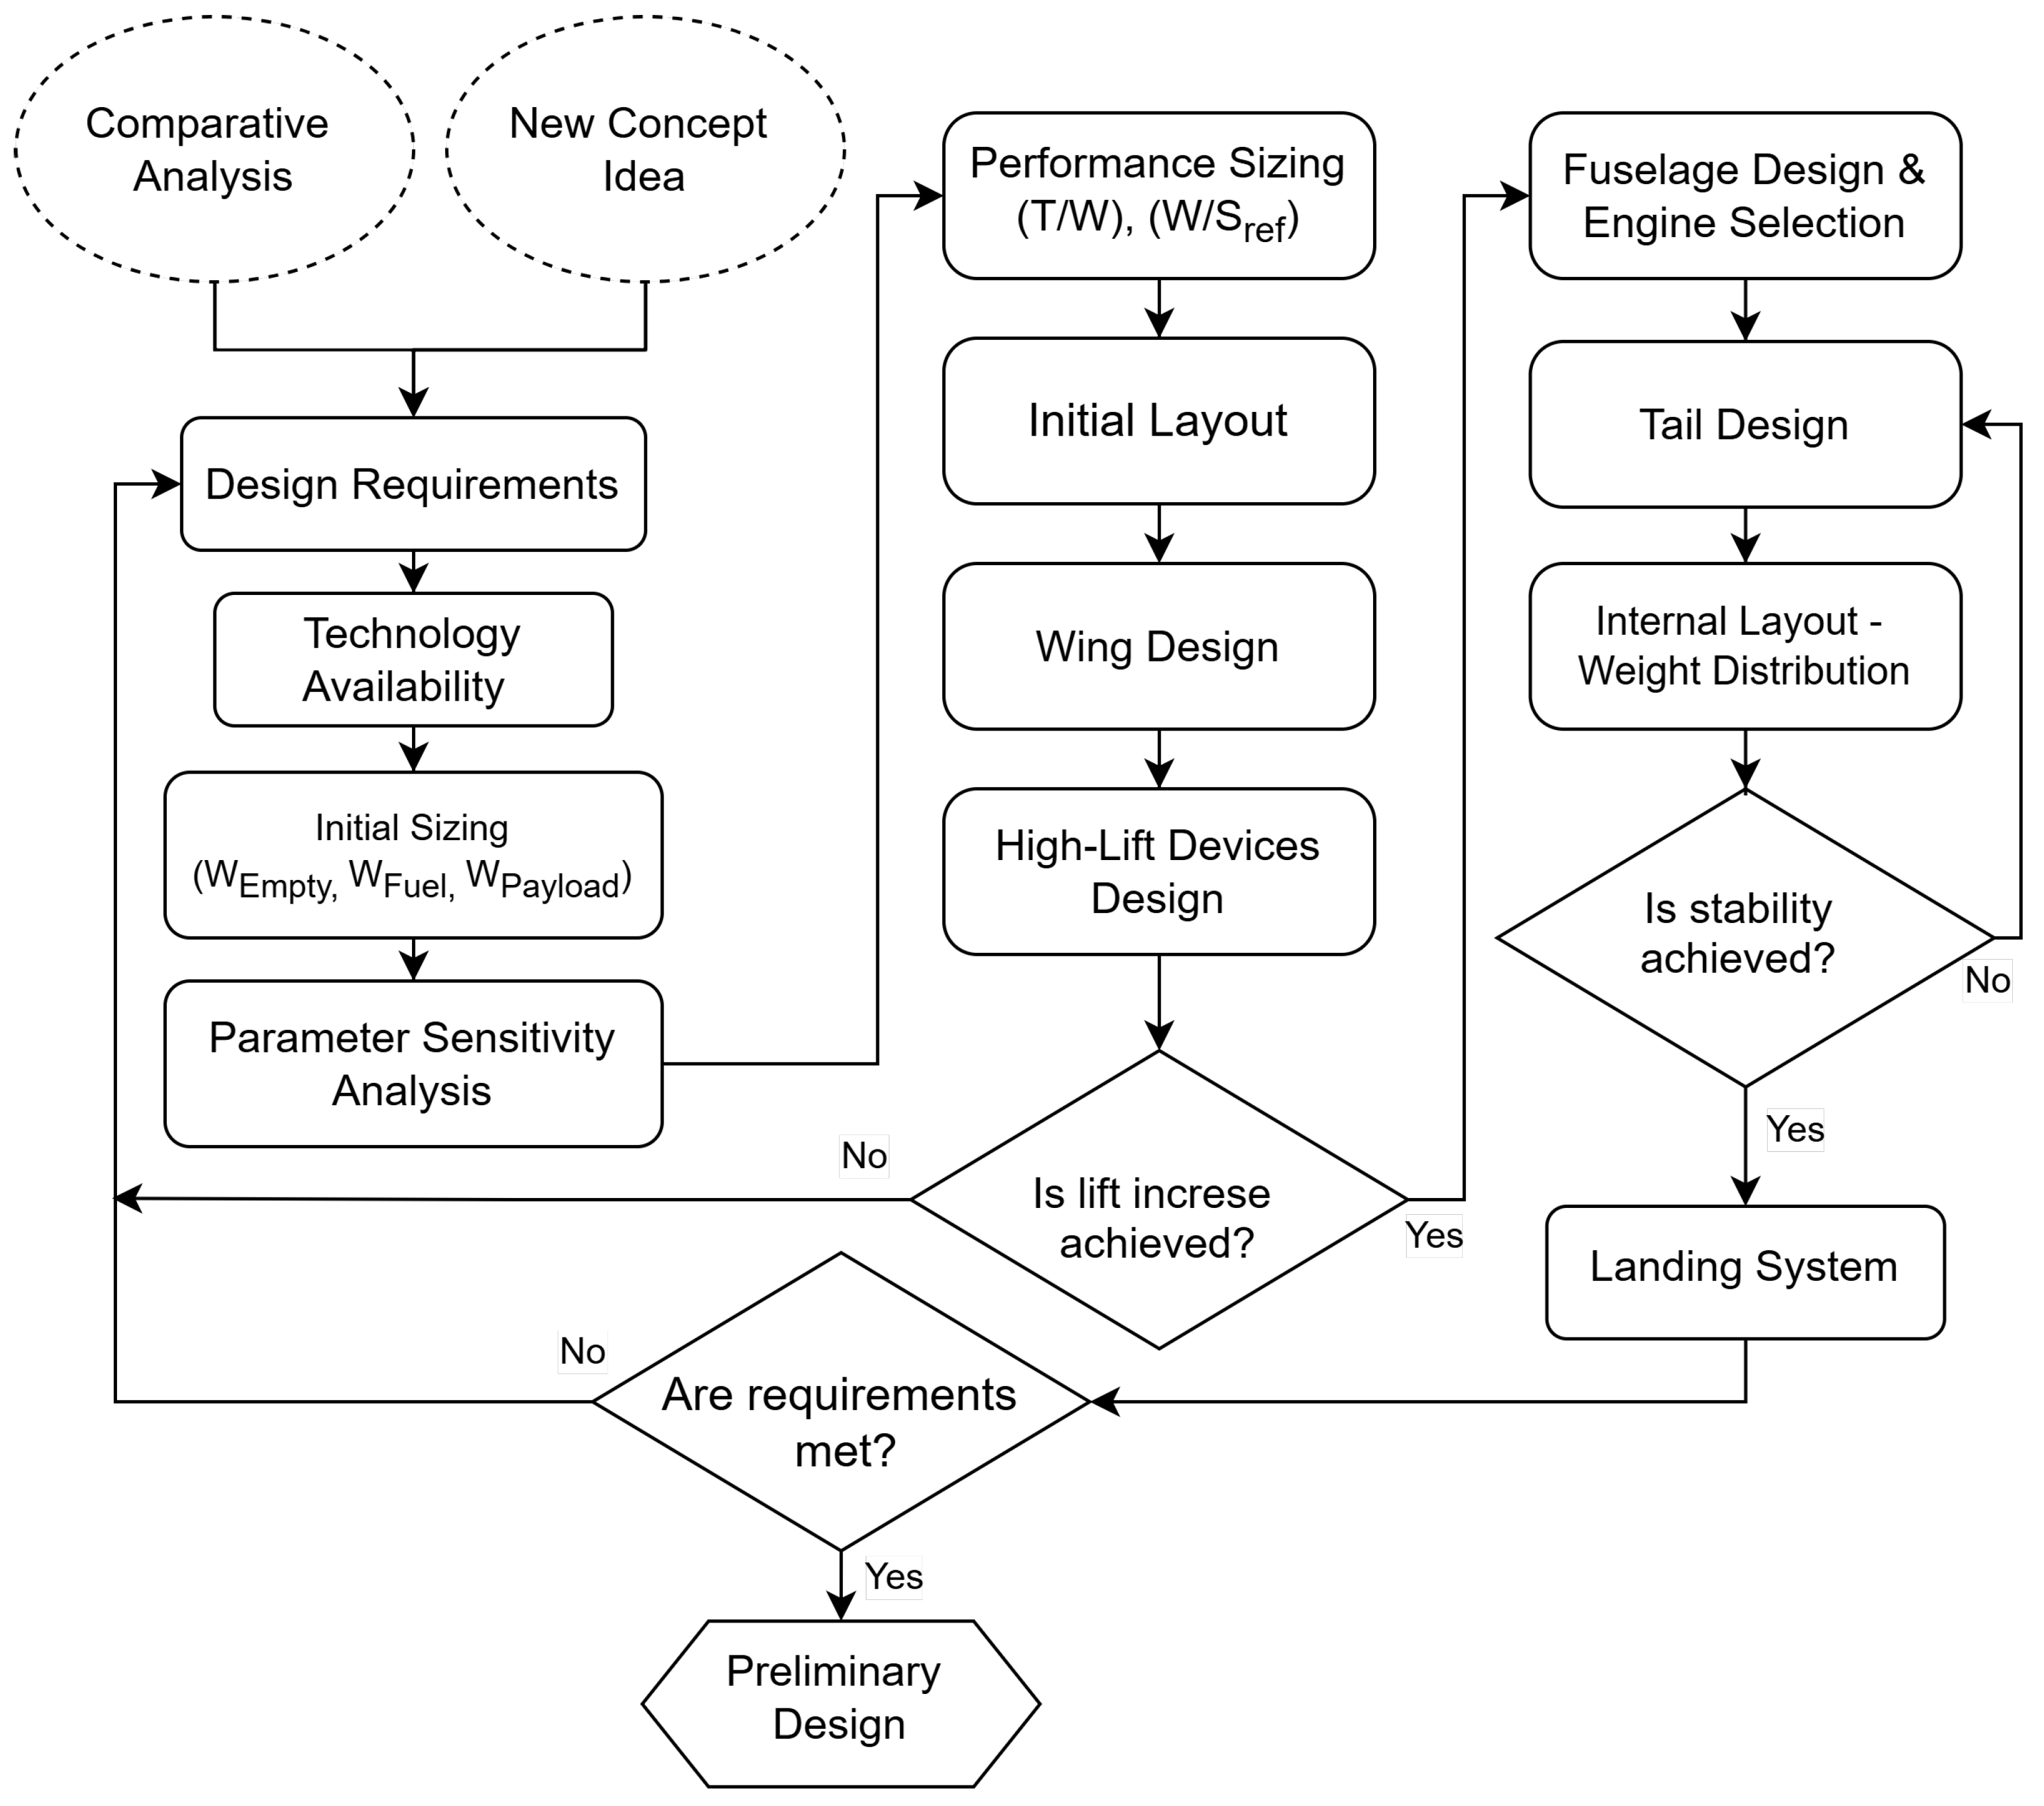
Figure 1.
Flowchart of the conceptual design process followed in this study.
Figure 1.
Flowchart of the conceptual design process followed in this study.
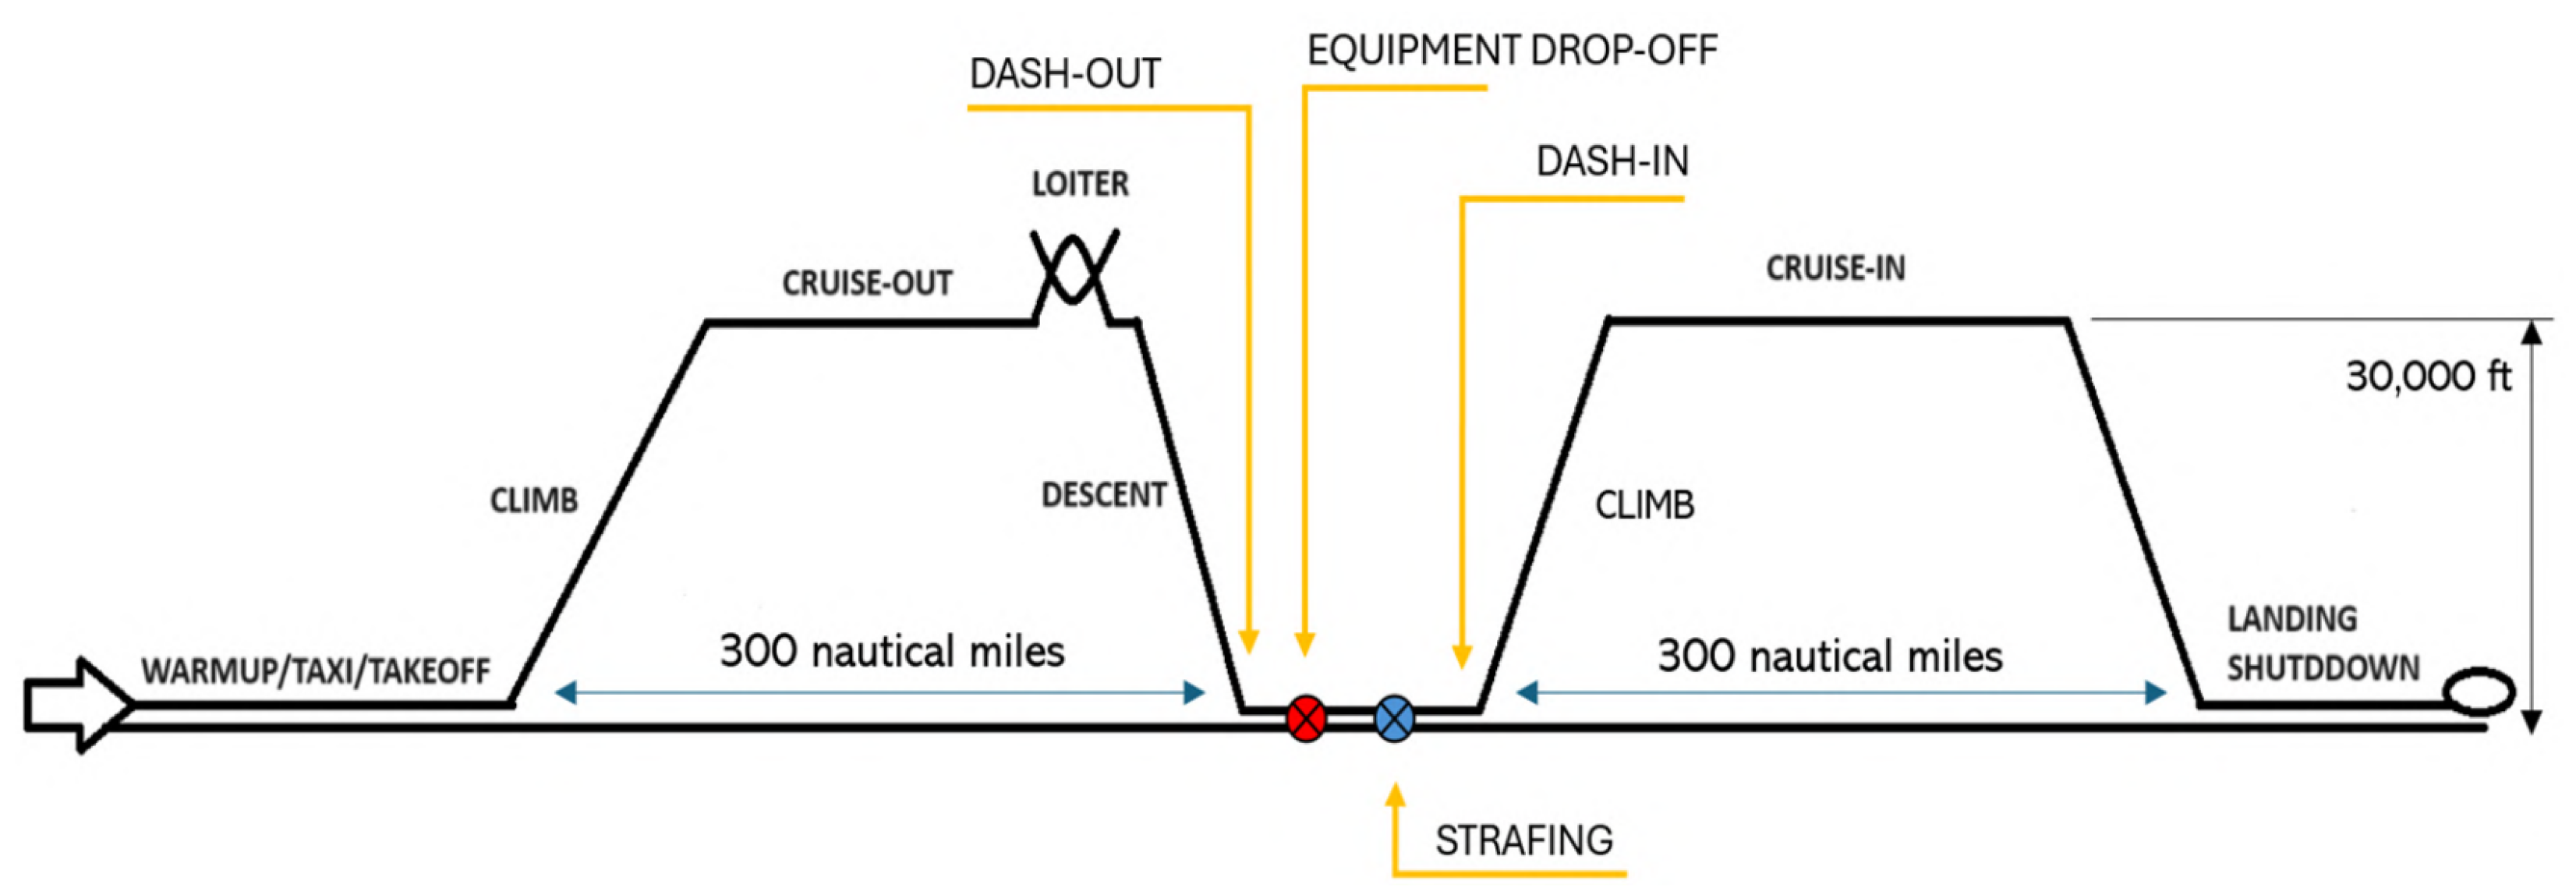
Figure 2.
The scheme of the UCAV’s mission profile.
Figure 2.
The scheme of the UCAV’s mission profile.
Figure 3.
Acceptable values of (W/S) and (T/W) without considering the climb rate performance restrictions.
Figure 3.
Acceptable values of (W/S) and (T/W) without considering the climb rate performance restrictions.
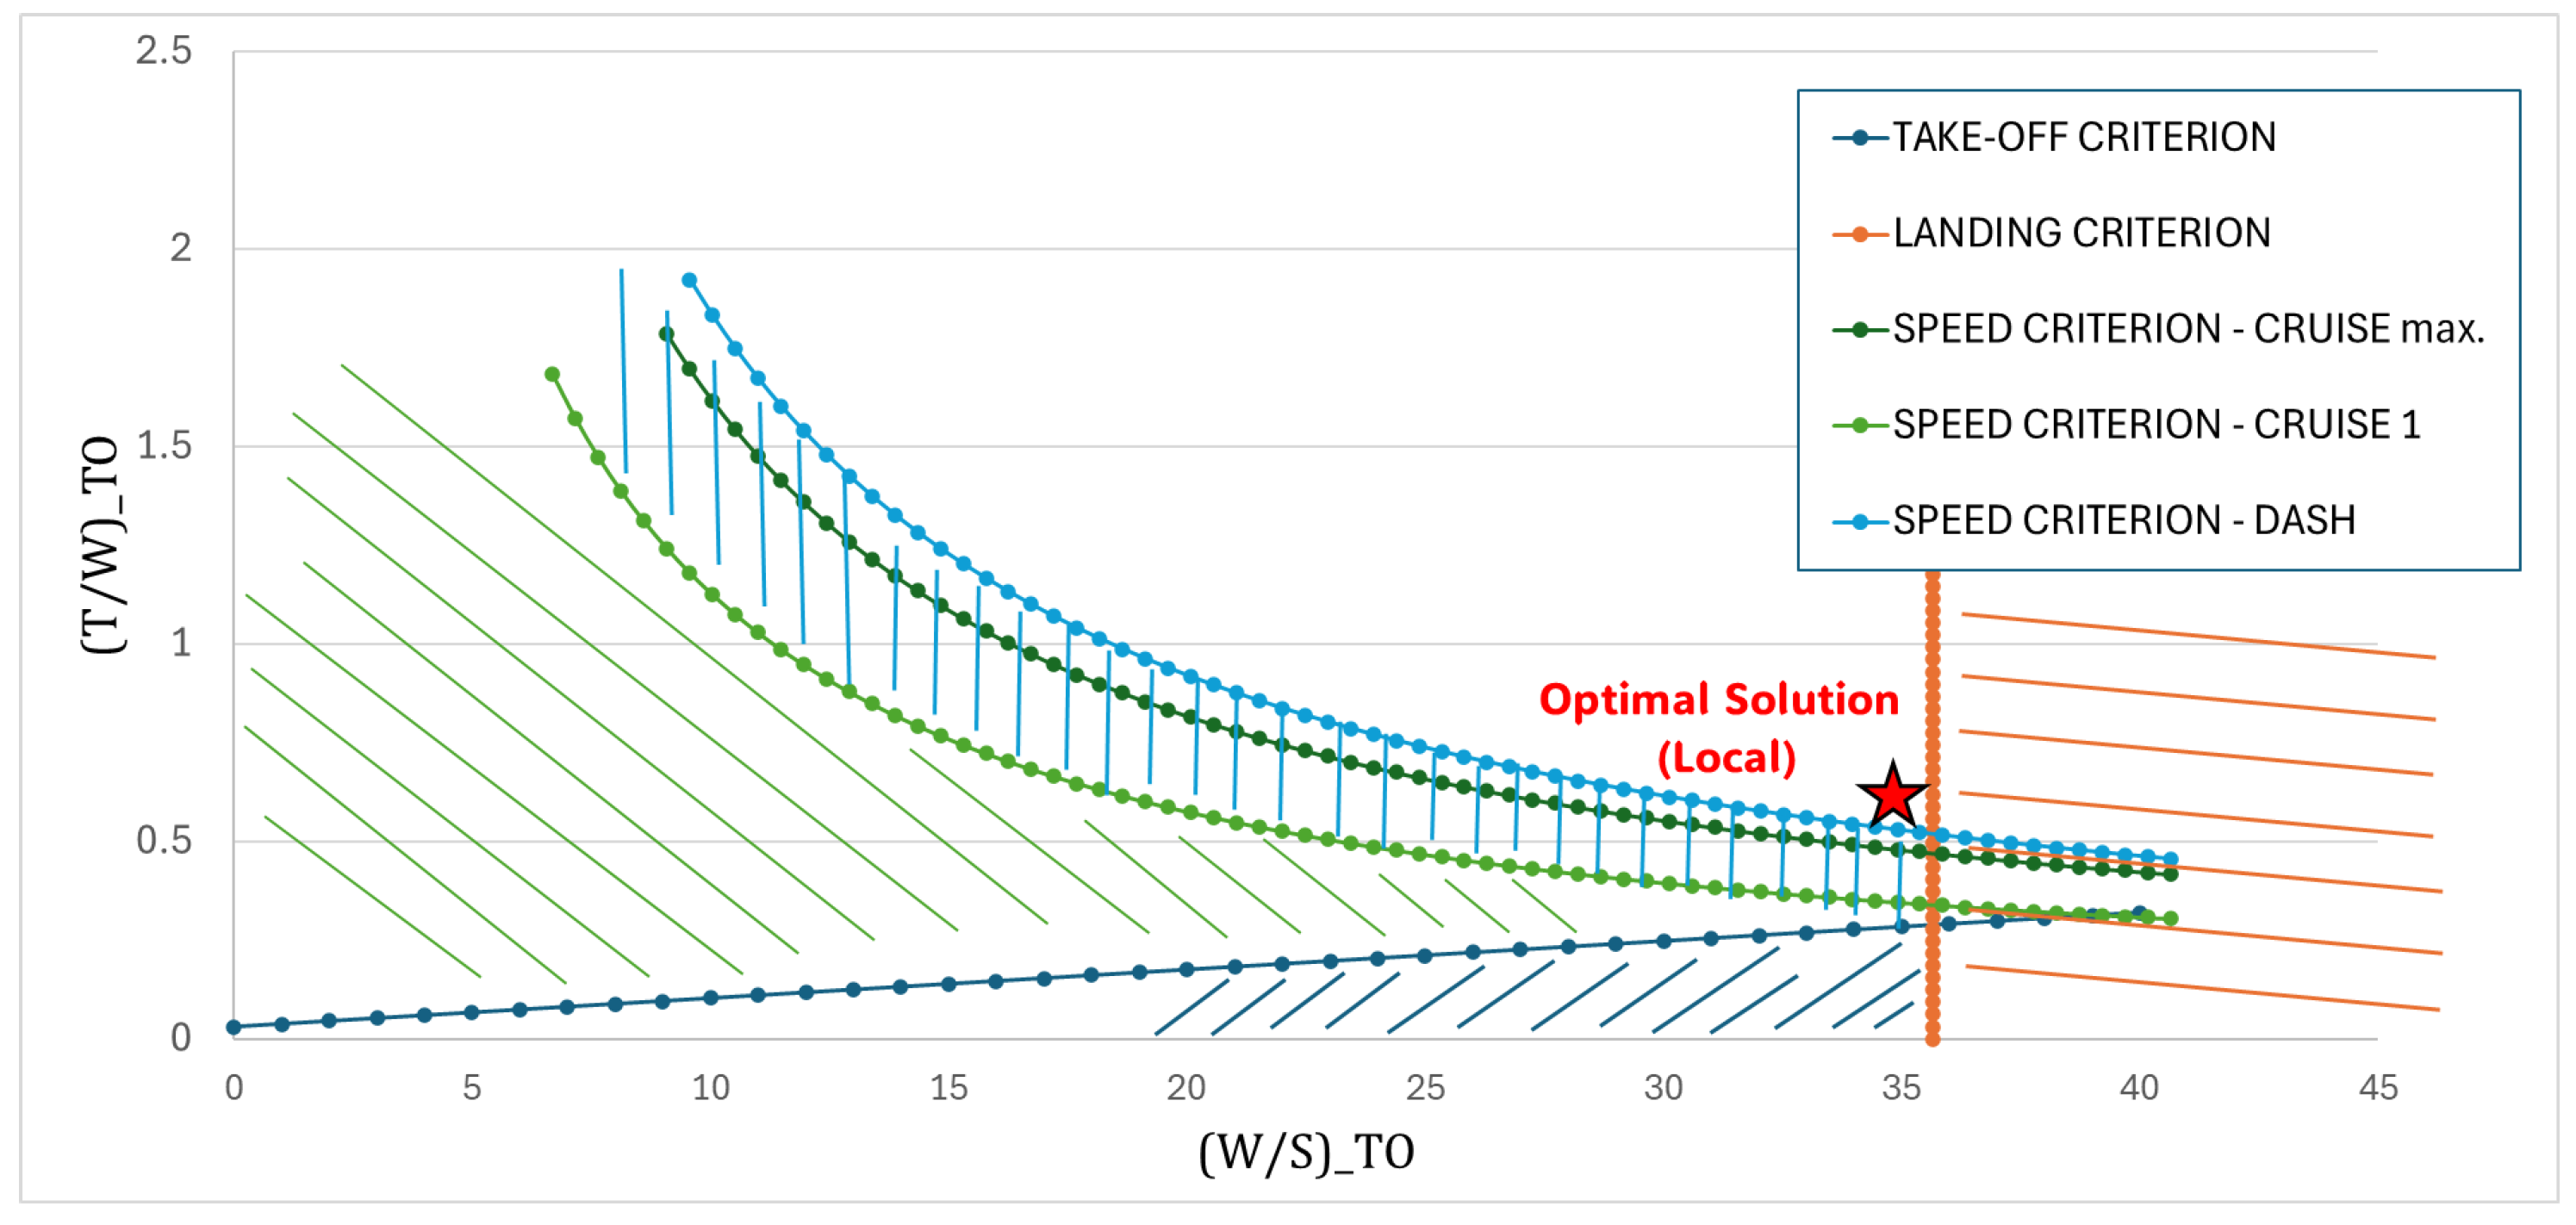
Figure 4.
Acceptable values of (W/S) and (T/W) ratios and the optimal solution for the UCAV.
Figure 4.
Acceptable values of (W/S) and (T/W) ratios and the optimal solution for the UCAV.
Figure 5.
Aerodynamic properties of proposed airfoils in a cruise-simulated flow phase, produced in XFLR5 software (version 6.61).
Figure 5.
Aerodynamic properties of proposed airfoils in a cruise-simulated flow phase, produced in XFLR5 software (version 6.61).
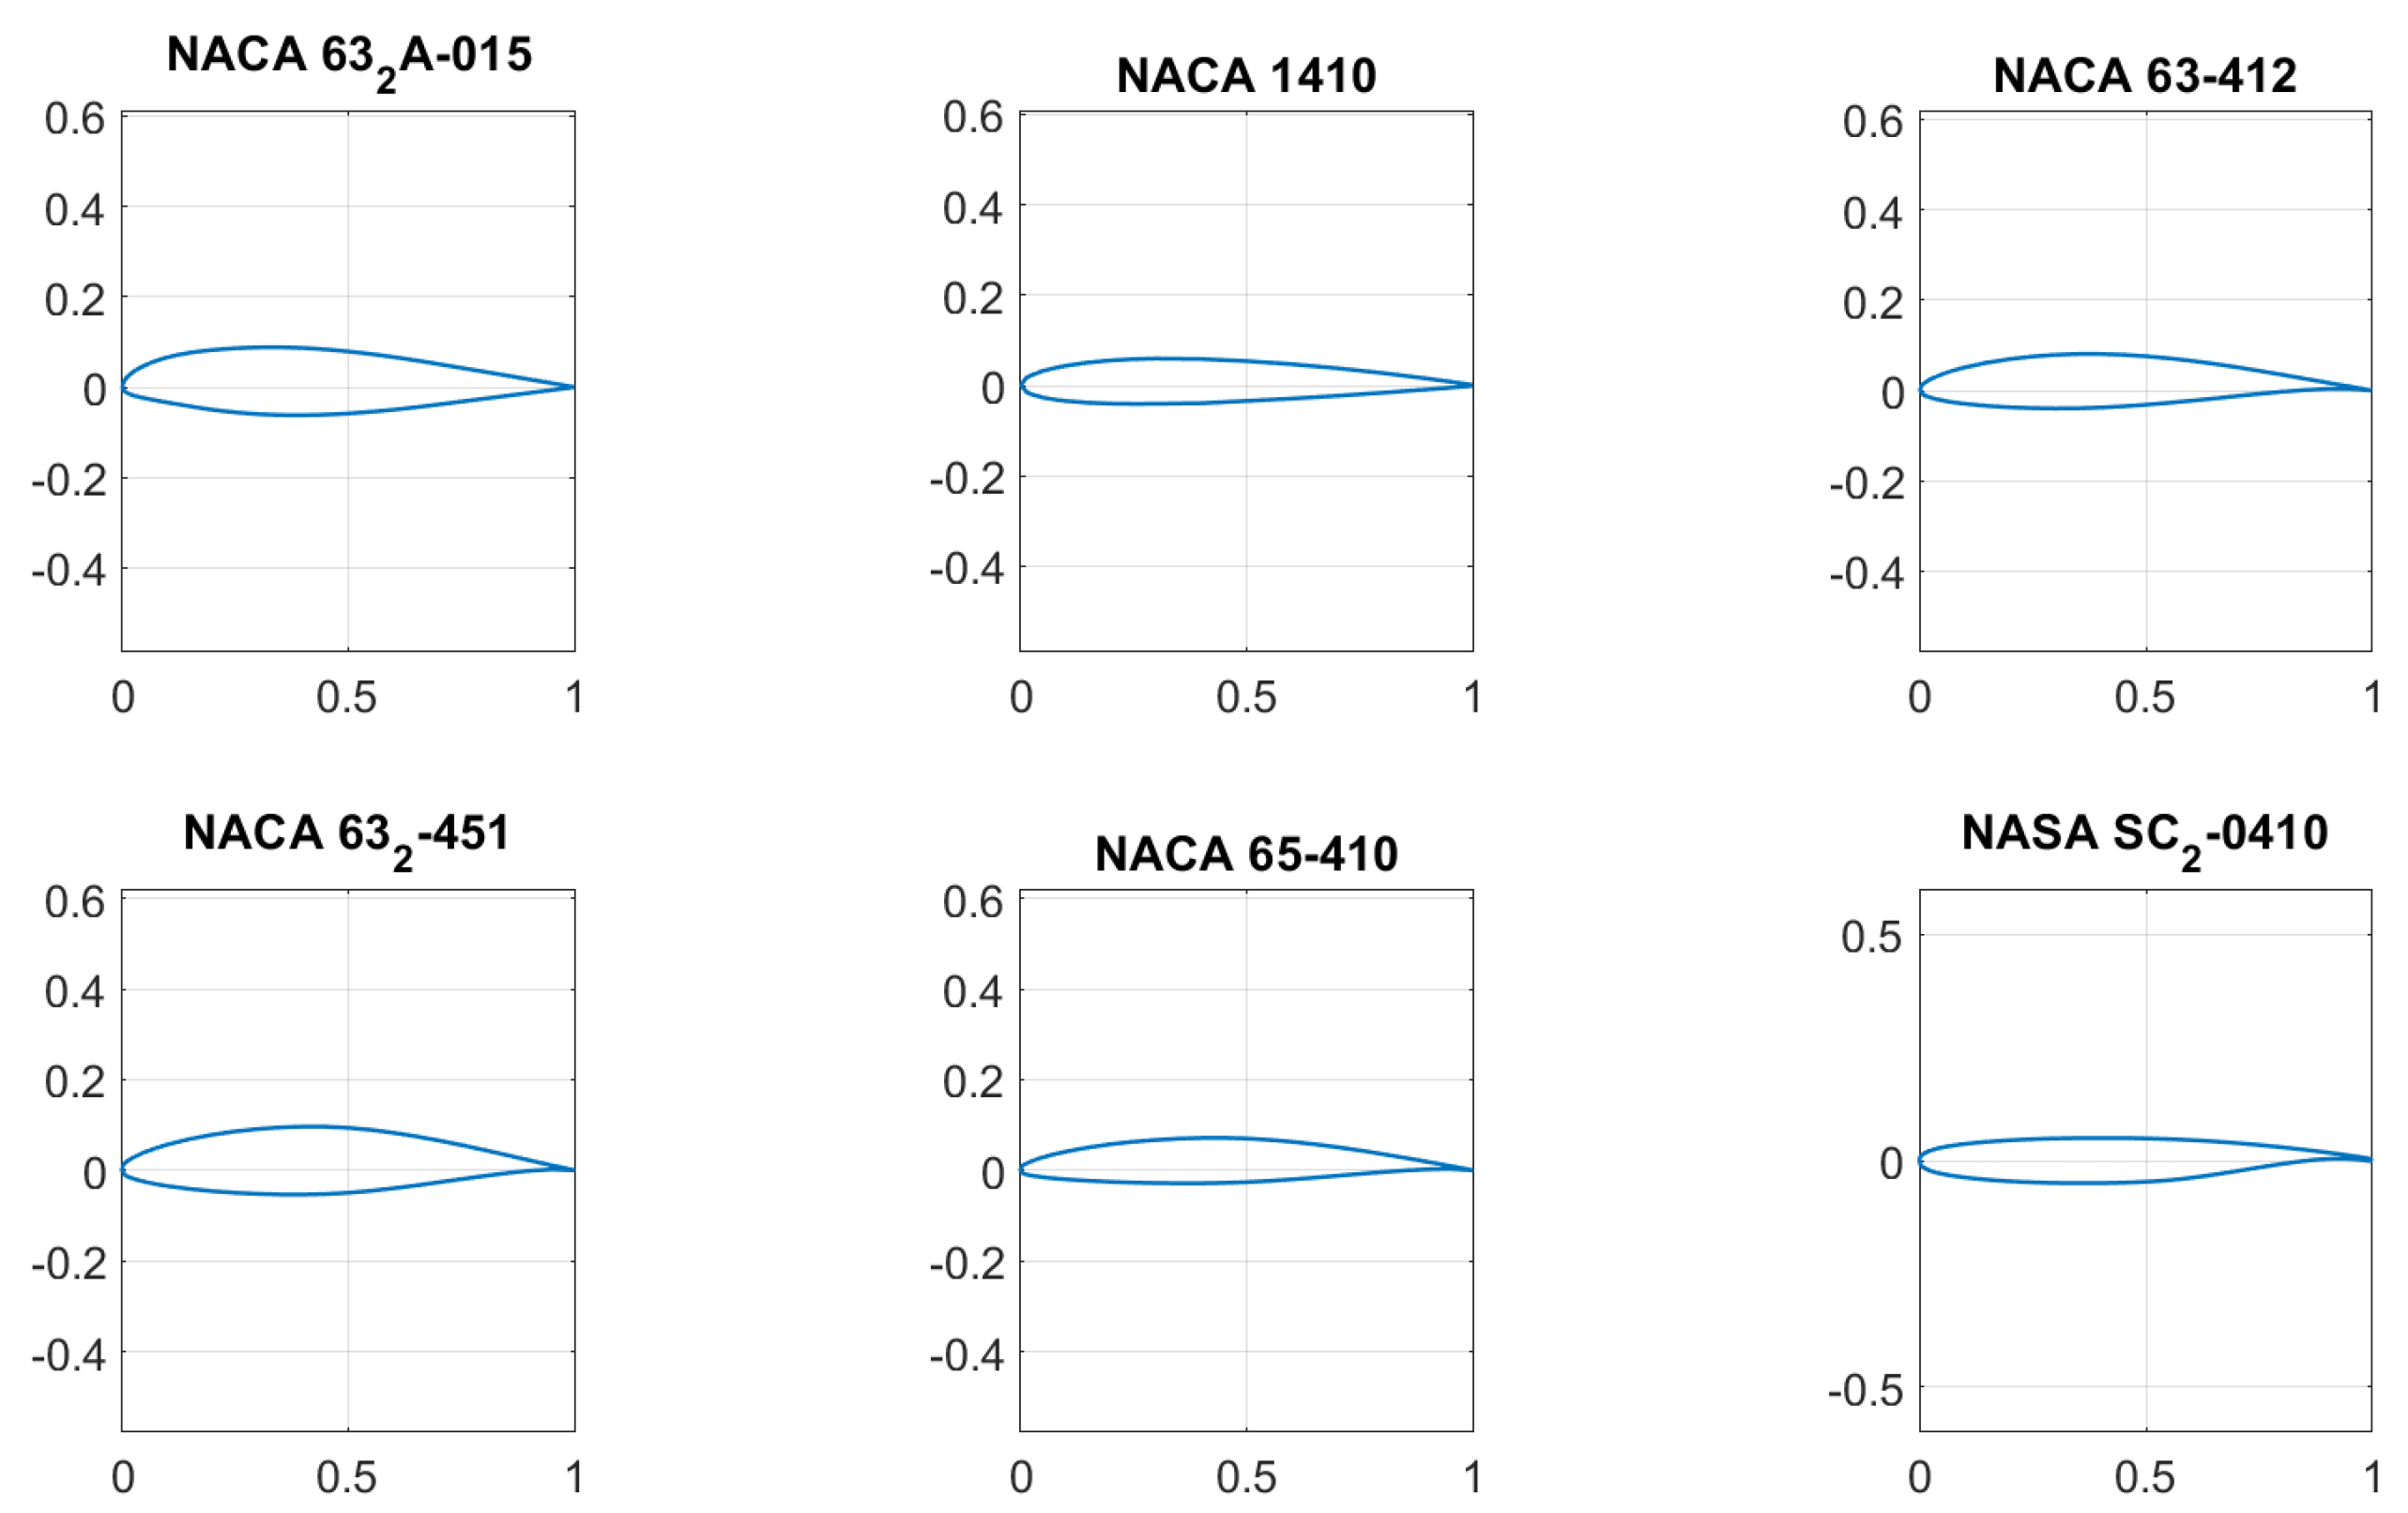
Figure 6.
Plots of the six candidate airfoils in
Table 12.
Figure 6.
Plots of the six candidate airfoils in
Table 12.
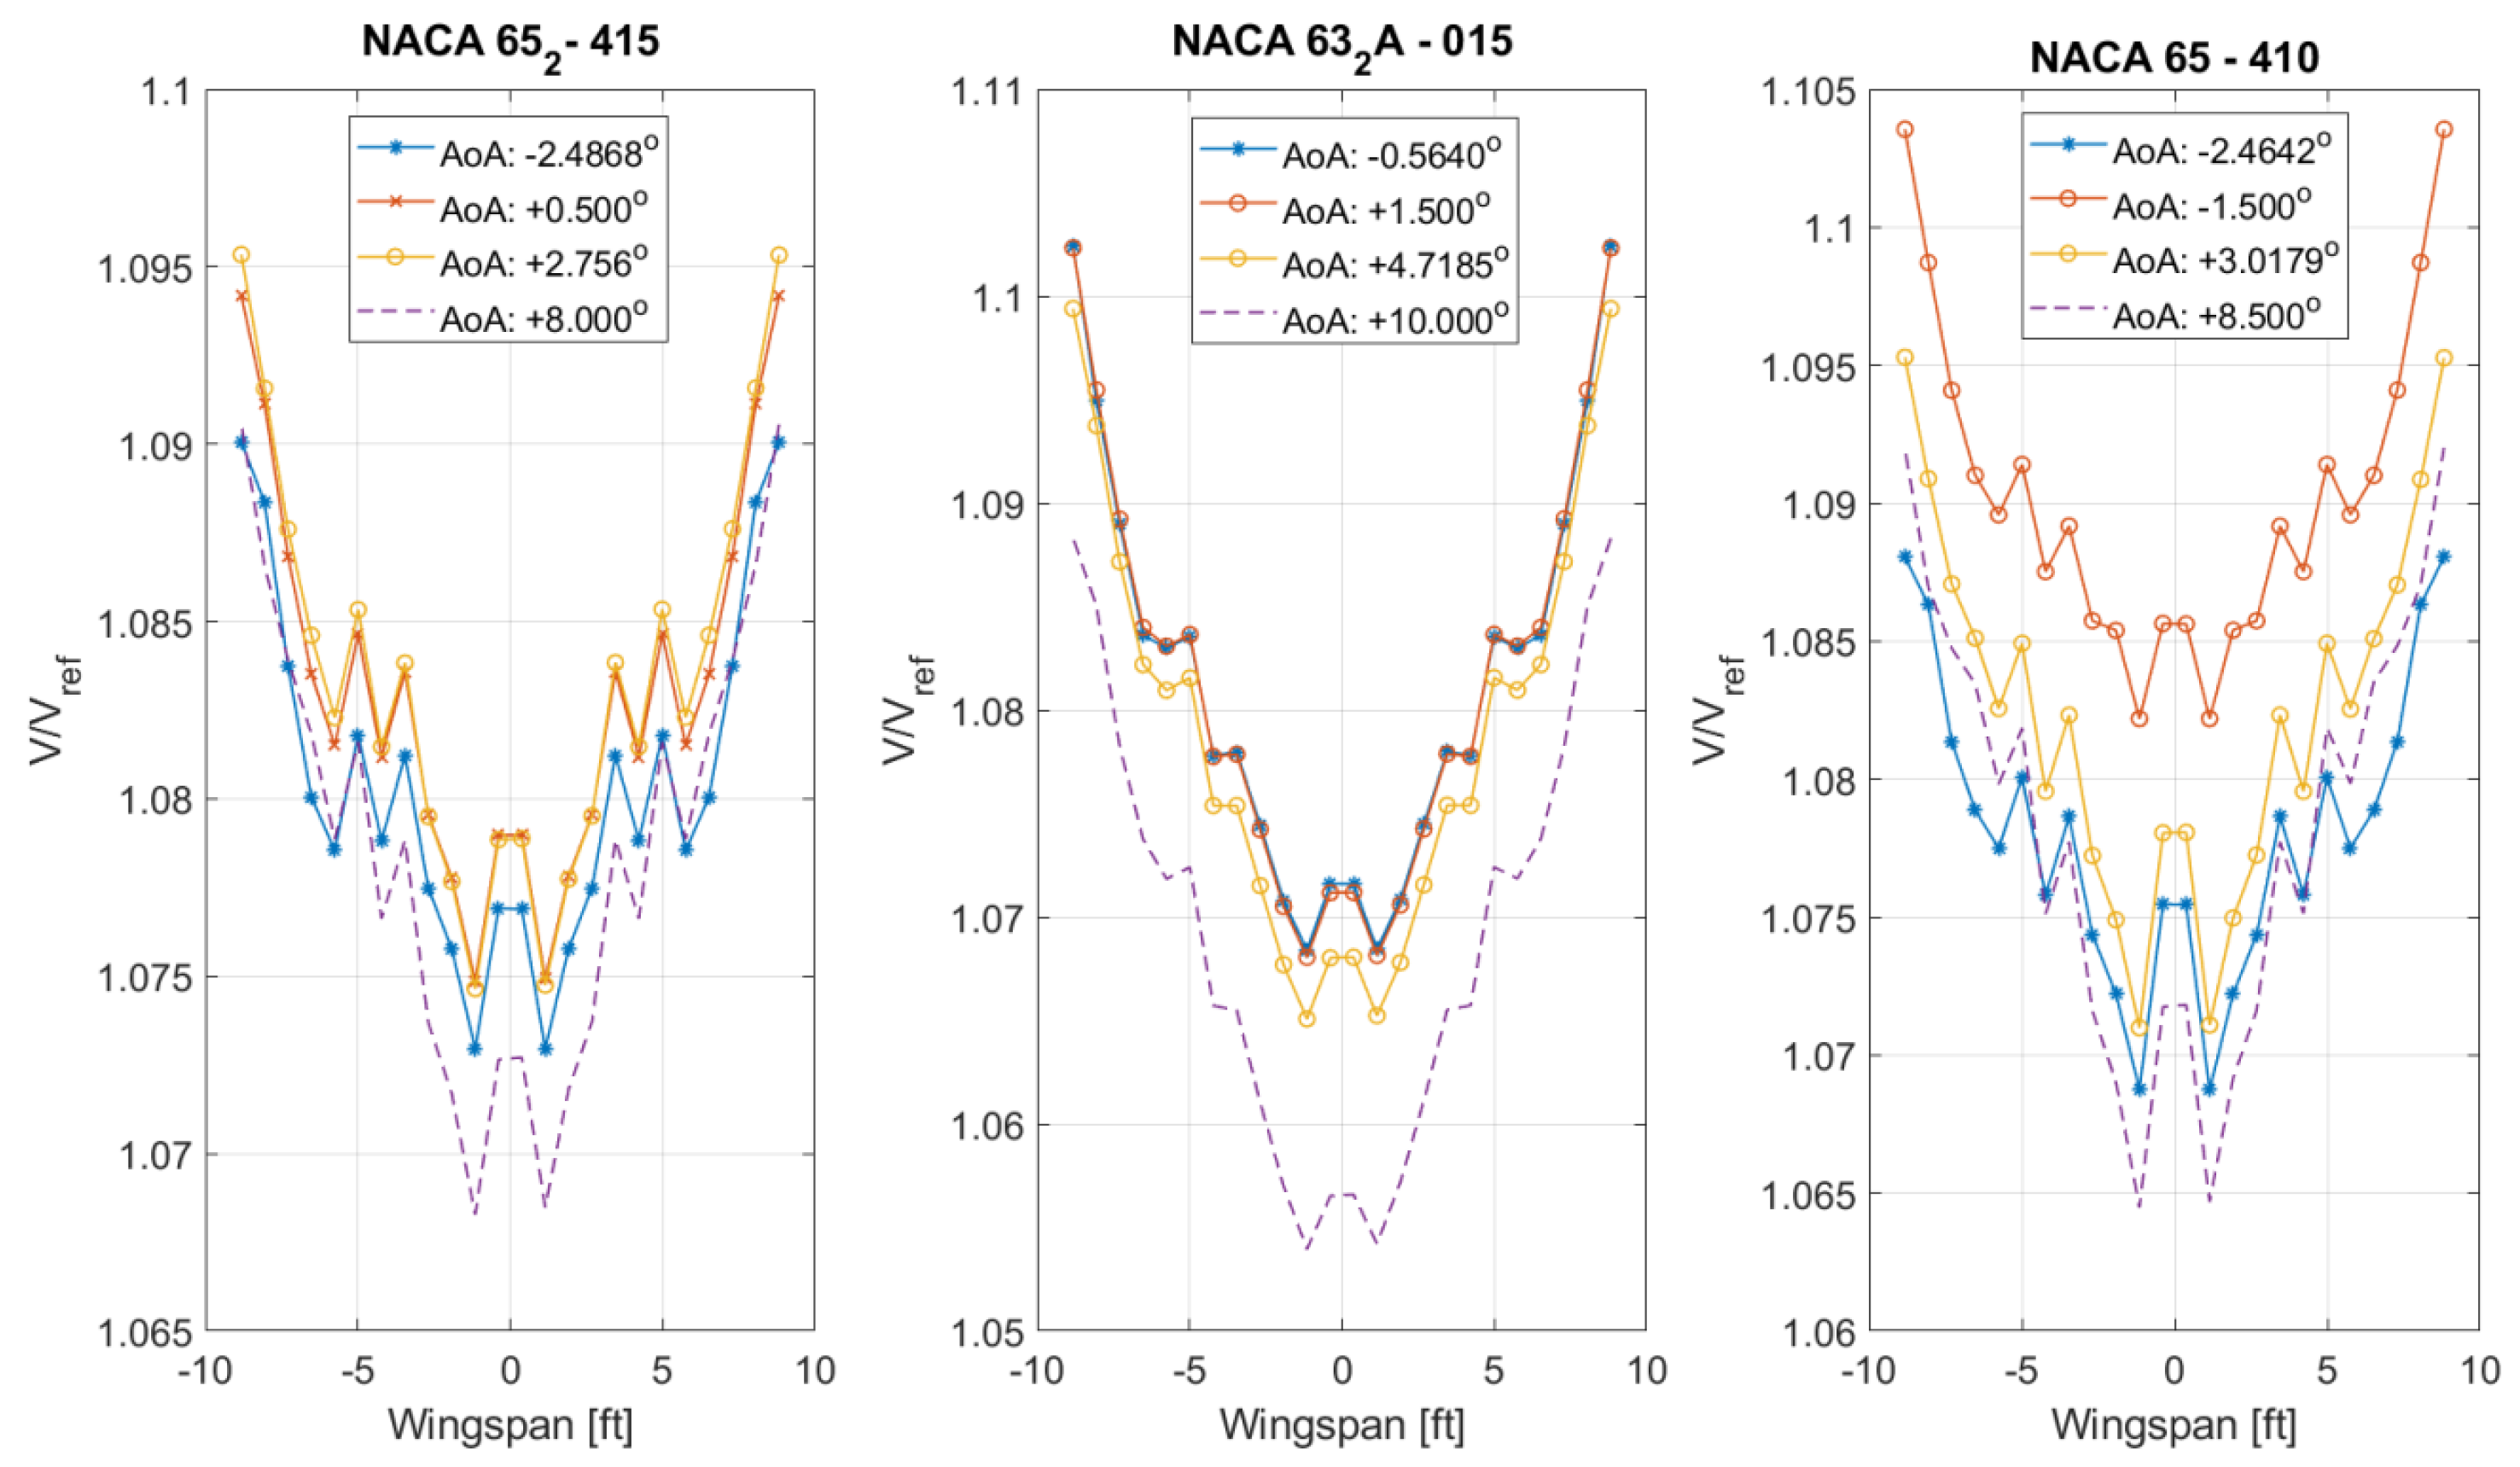
Figure 7.
Local velocity versus reference (infinite) velocity around each airfoil during dash (: 11%, : 10%).
Figure 7.
Local velocity versus reference (infinite) velocity around each airfoil during dash (: 11%, : 10%).
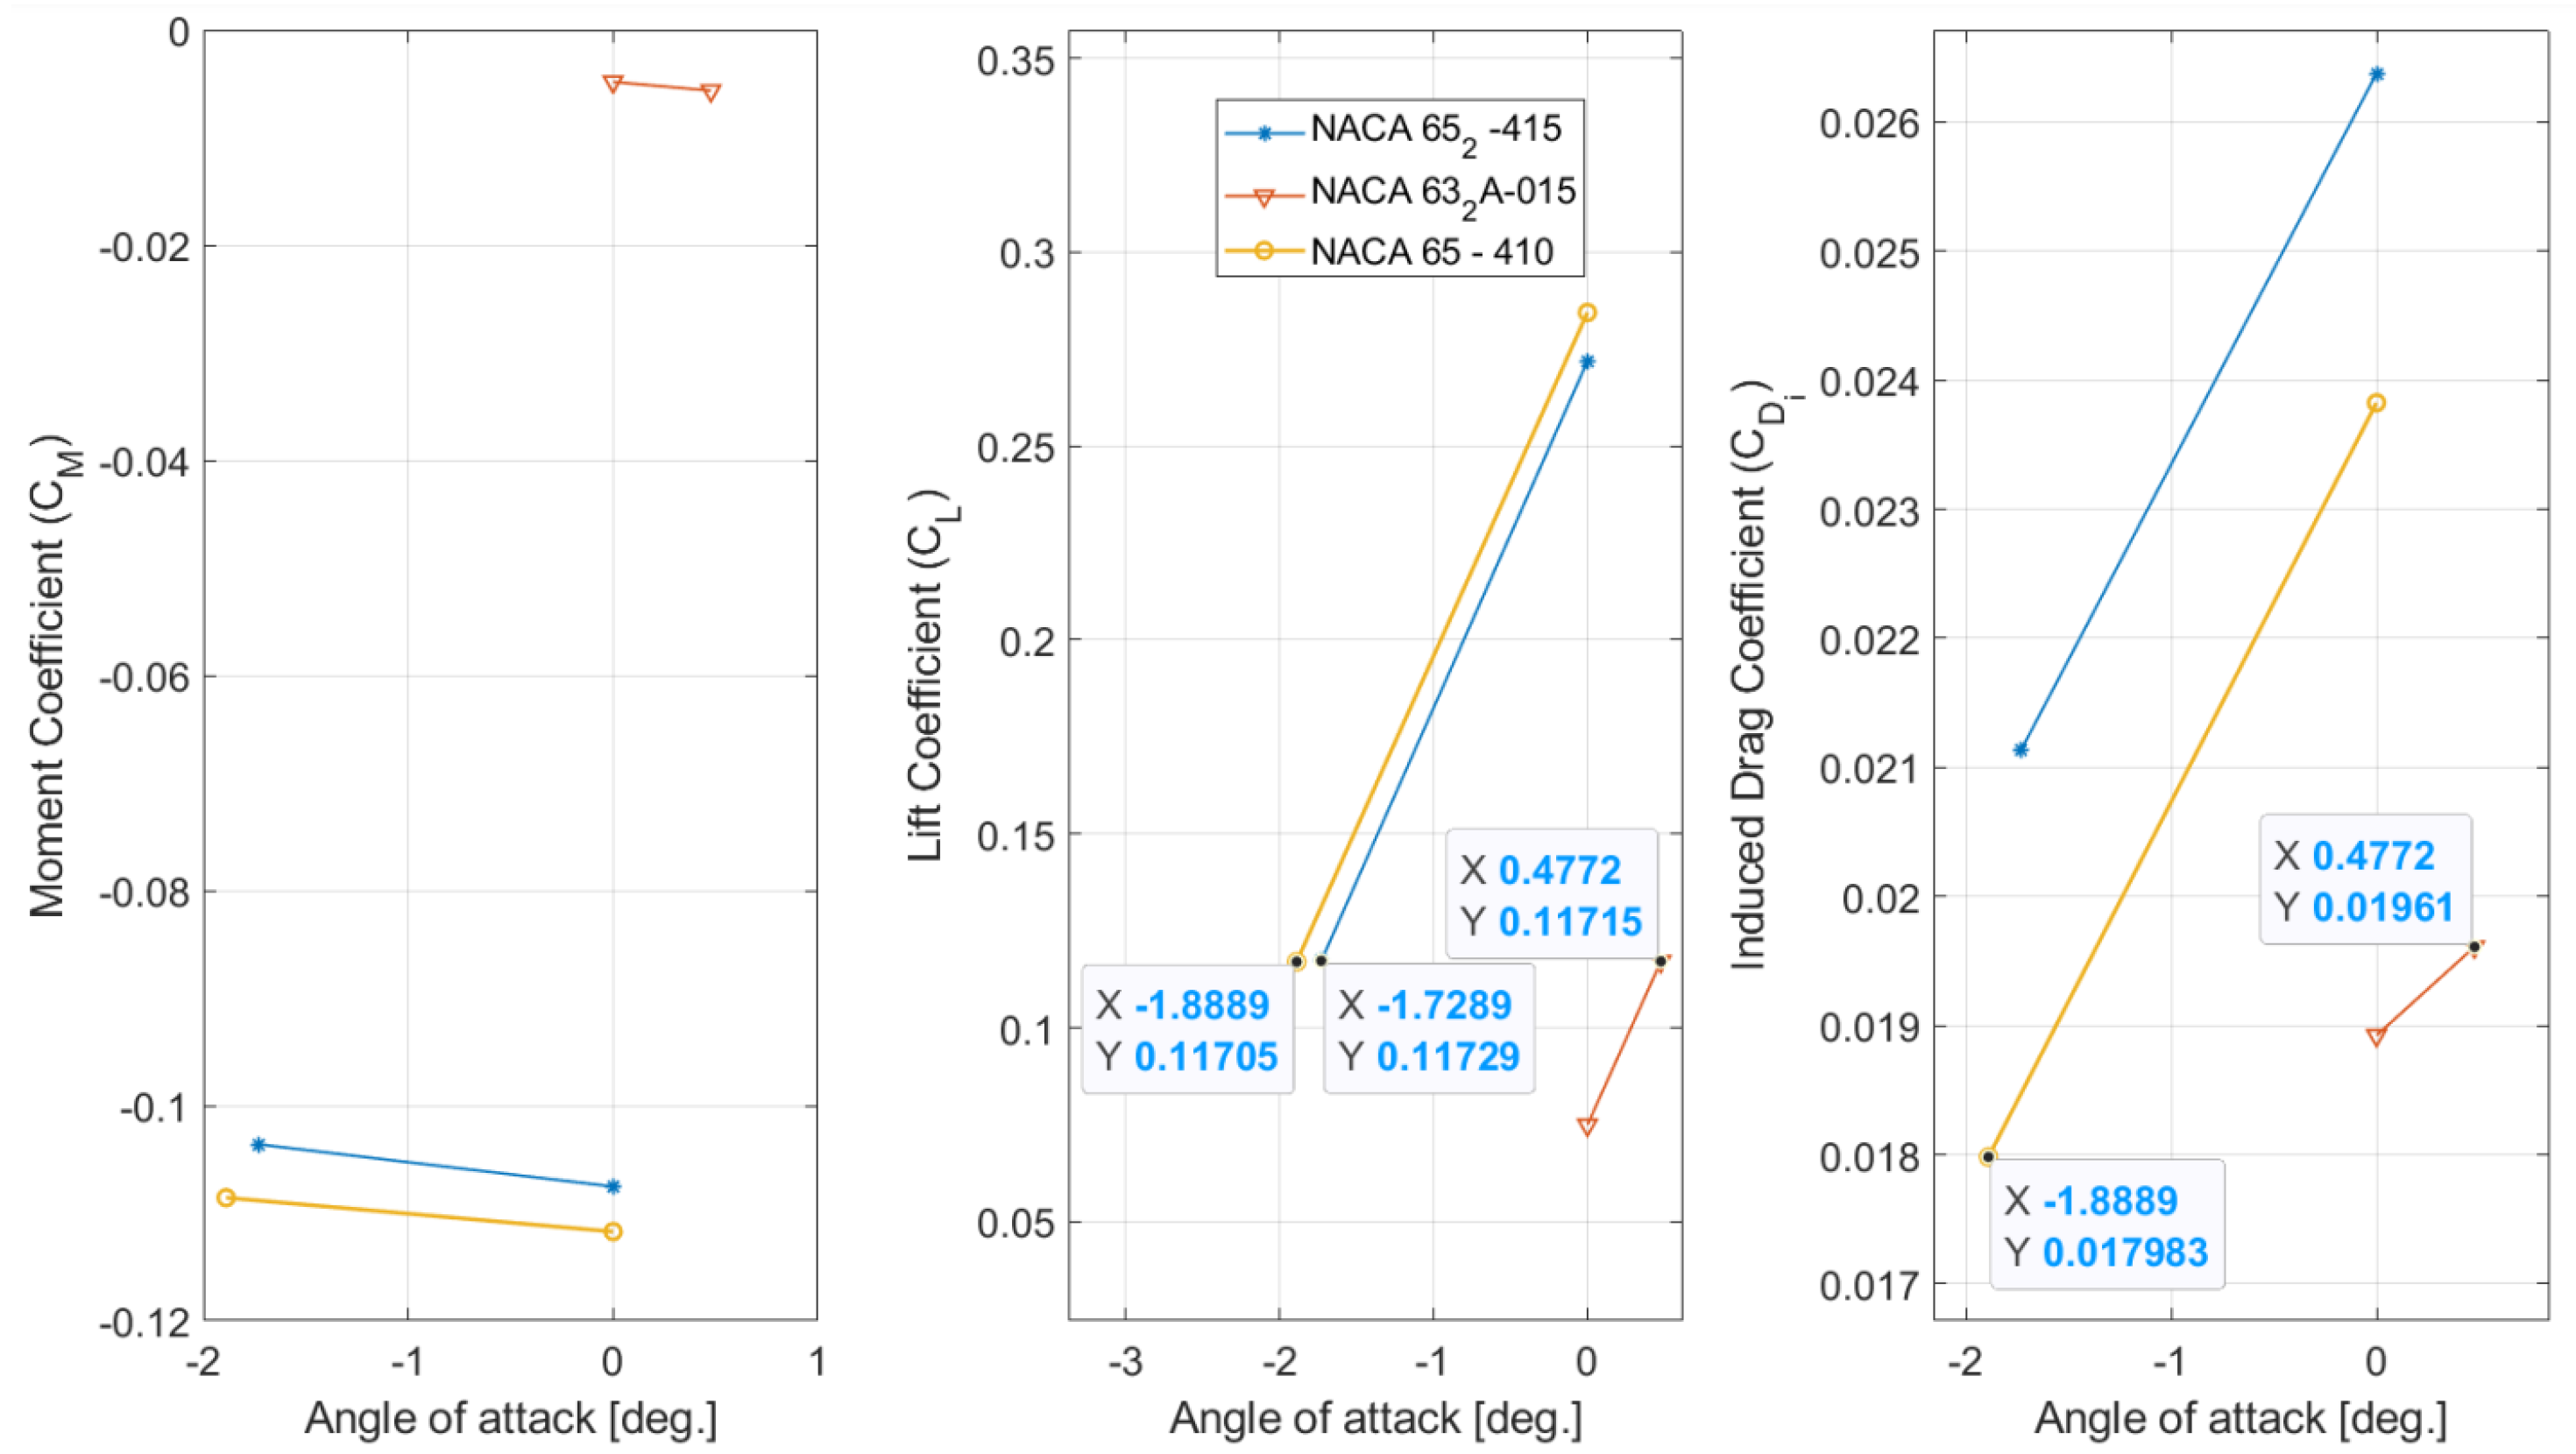
Figure 8.
Moment, lift and drag coefficients as a function of aoa for the three candidate wings at cruise.
Figure 8.
Moment, lift and drag coefficients as a function of aoa for the three candidate wings at cruise.
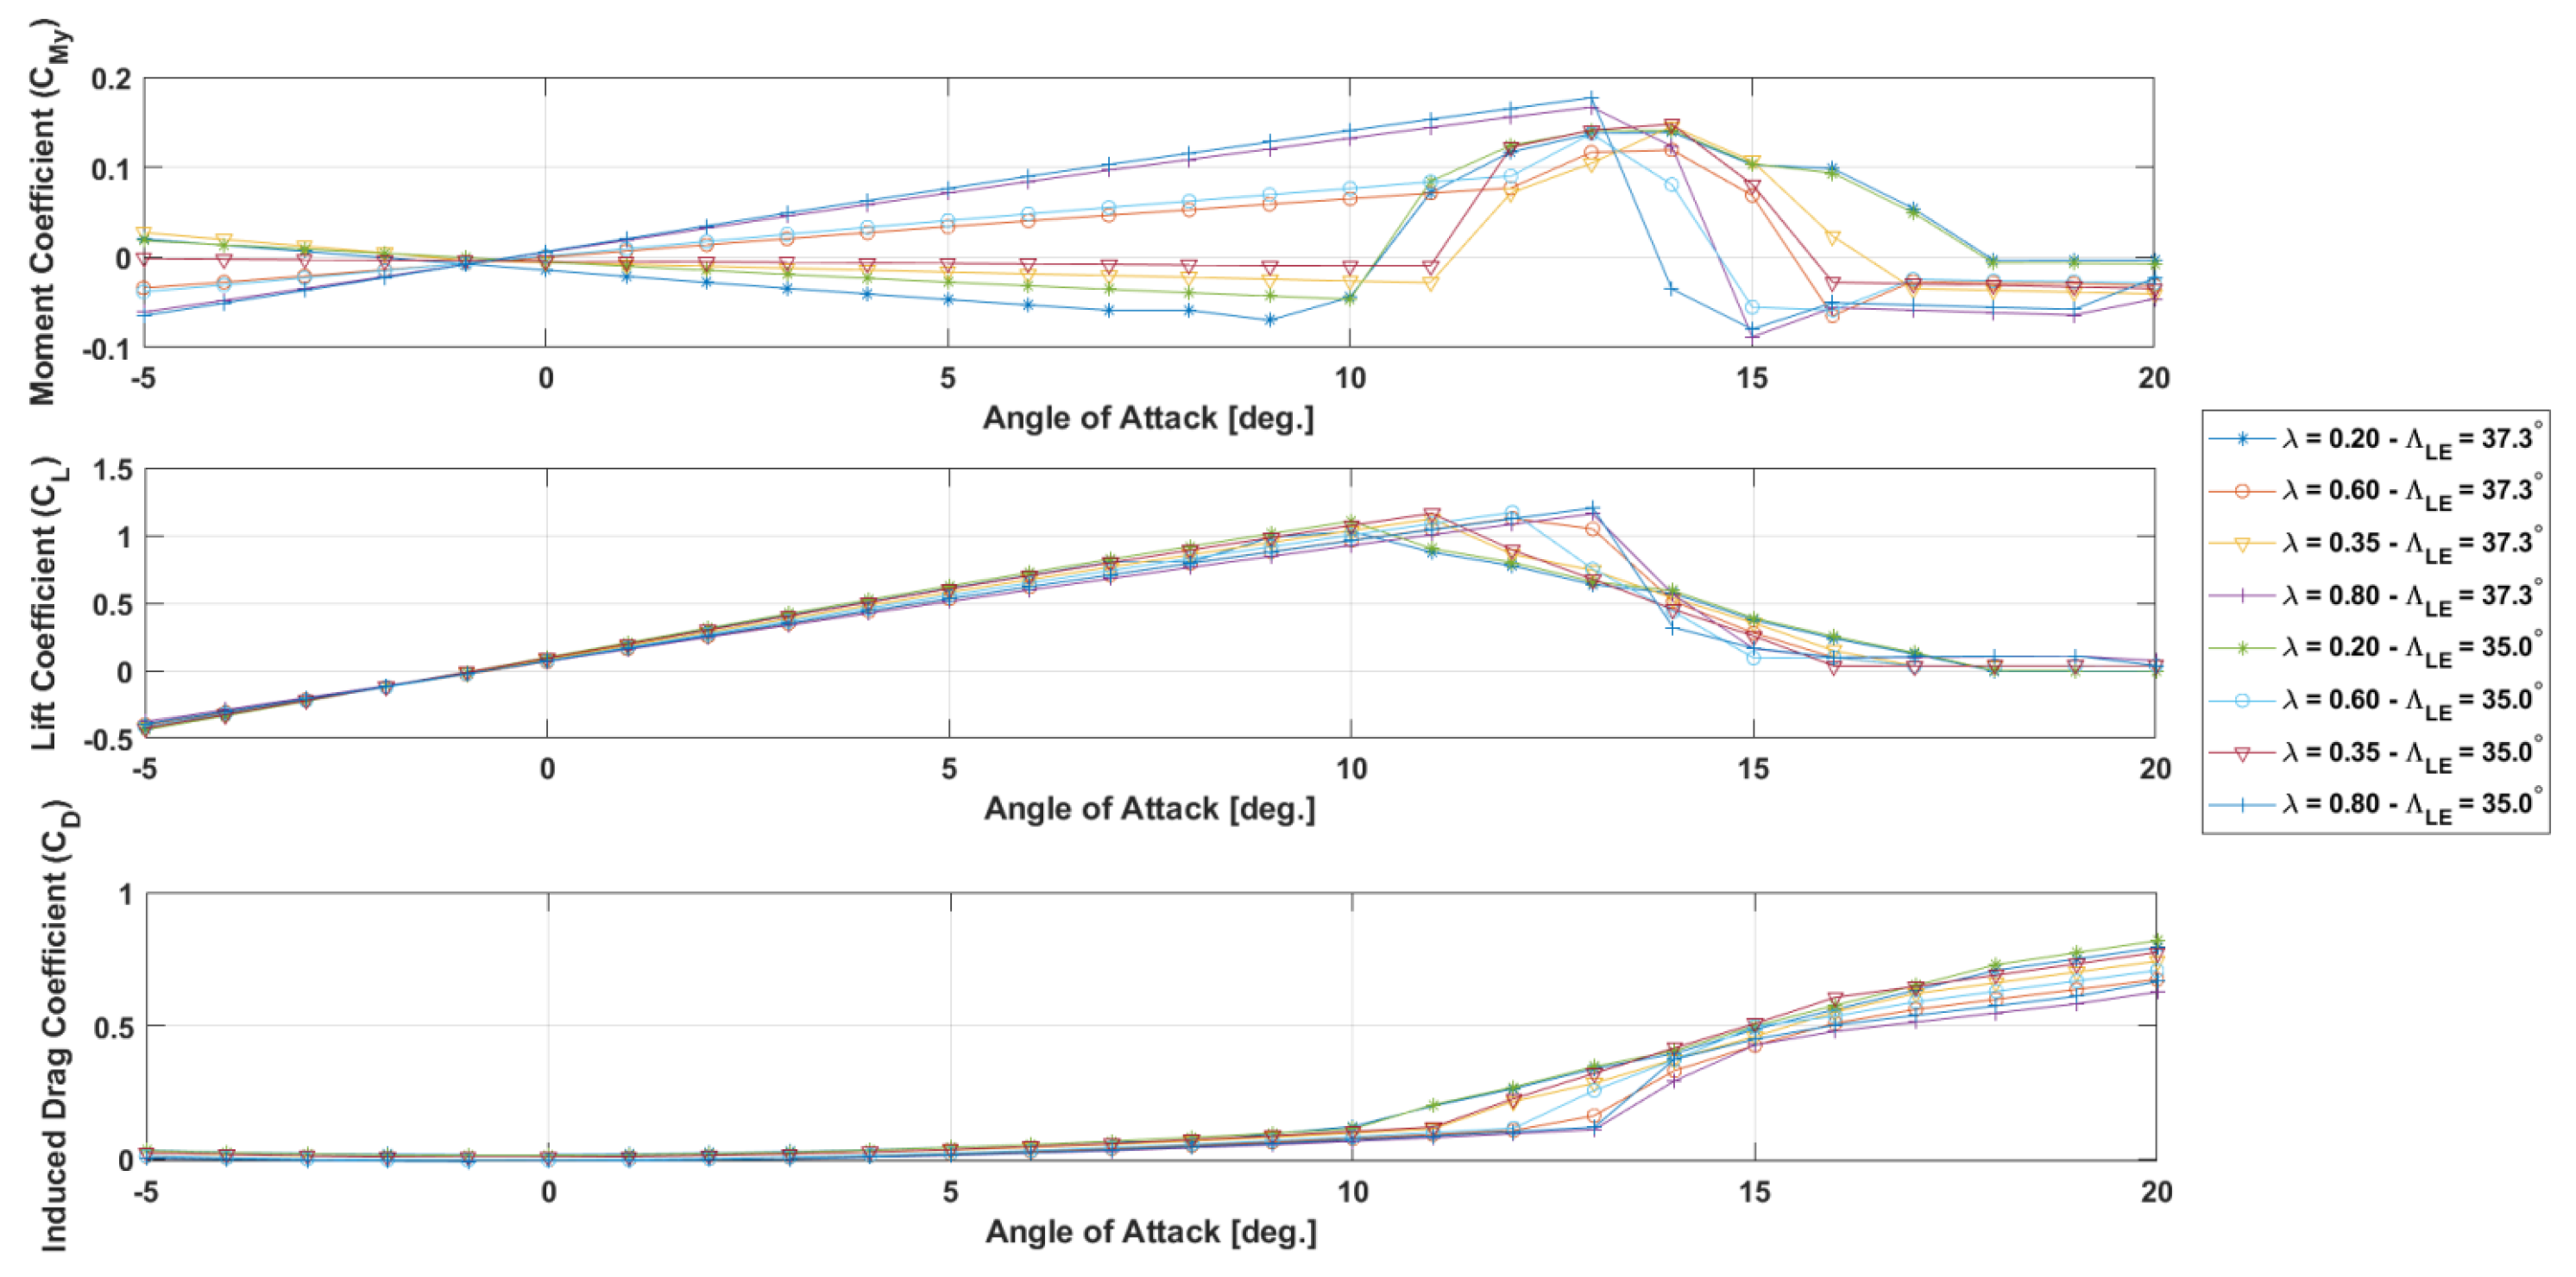
Figure 9.
Comparison between lift, drag, and moment coefficients for all 8 configurations of the wing at cruise.
Figure 9.
Comparison between lift, drag, and moment coefficients for all 8 configurations of the wing at cruise.
Figure 10.
Wing load factor and sectional lift distribution for all wing configurations, cruise conditions in OpenVSP.
Figure 10.
Wing load factor and sectional lift distribution for all wing configurations, cruise conditions in OpenVSP.
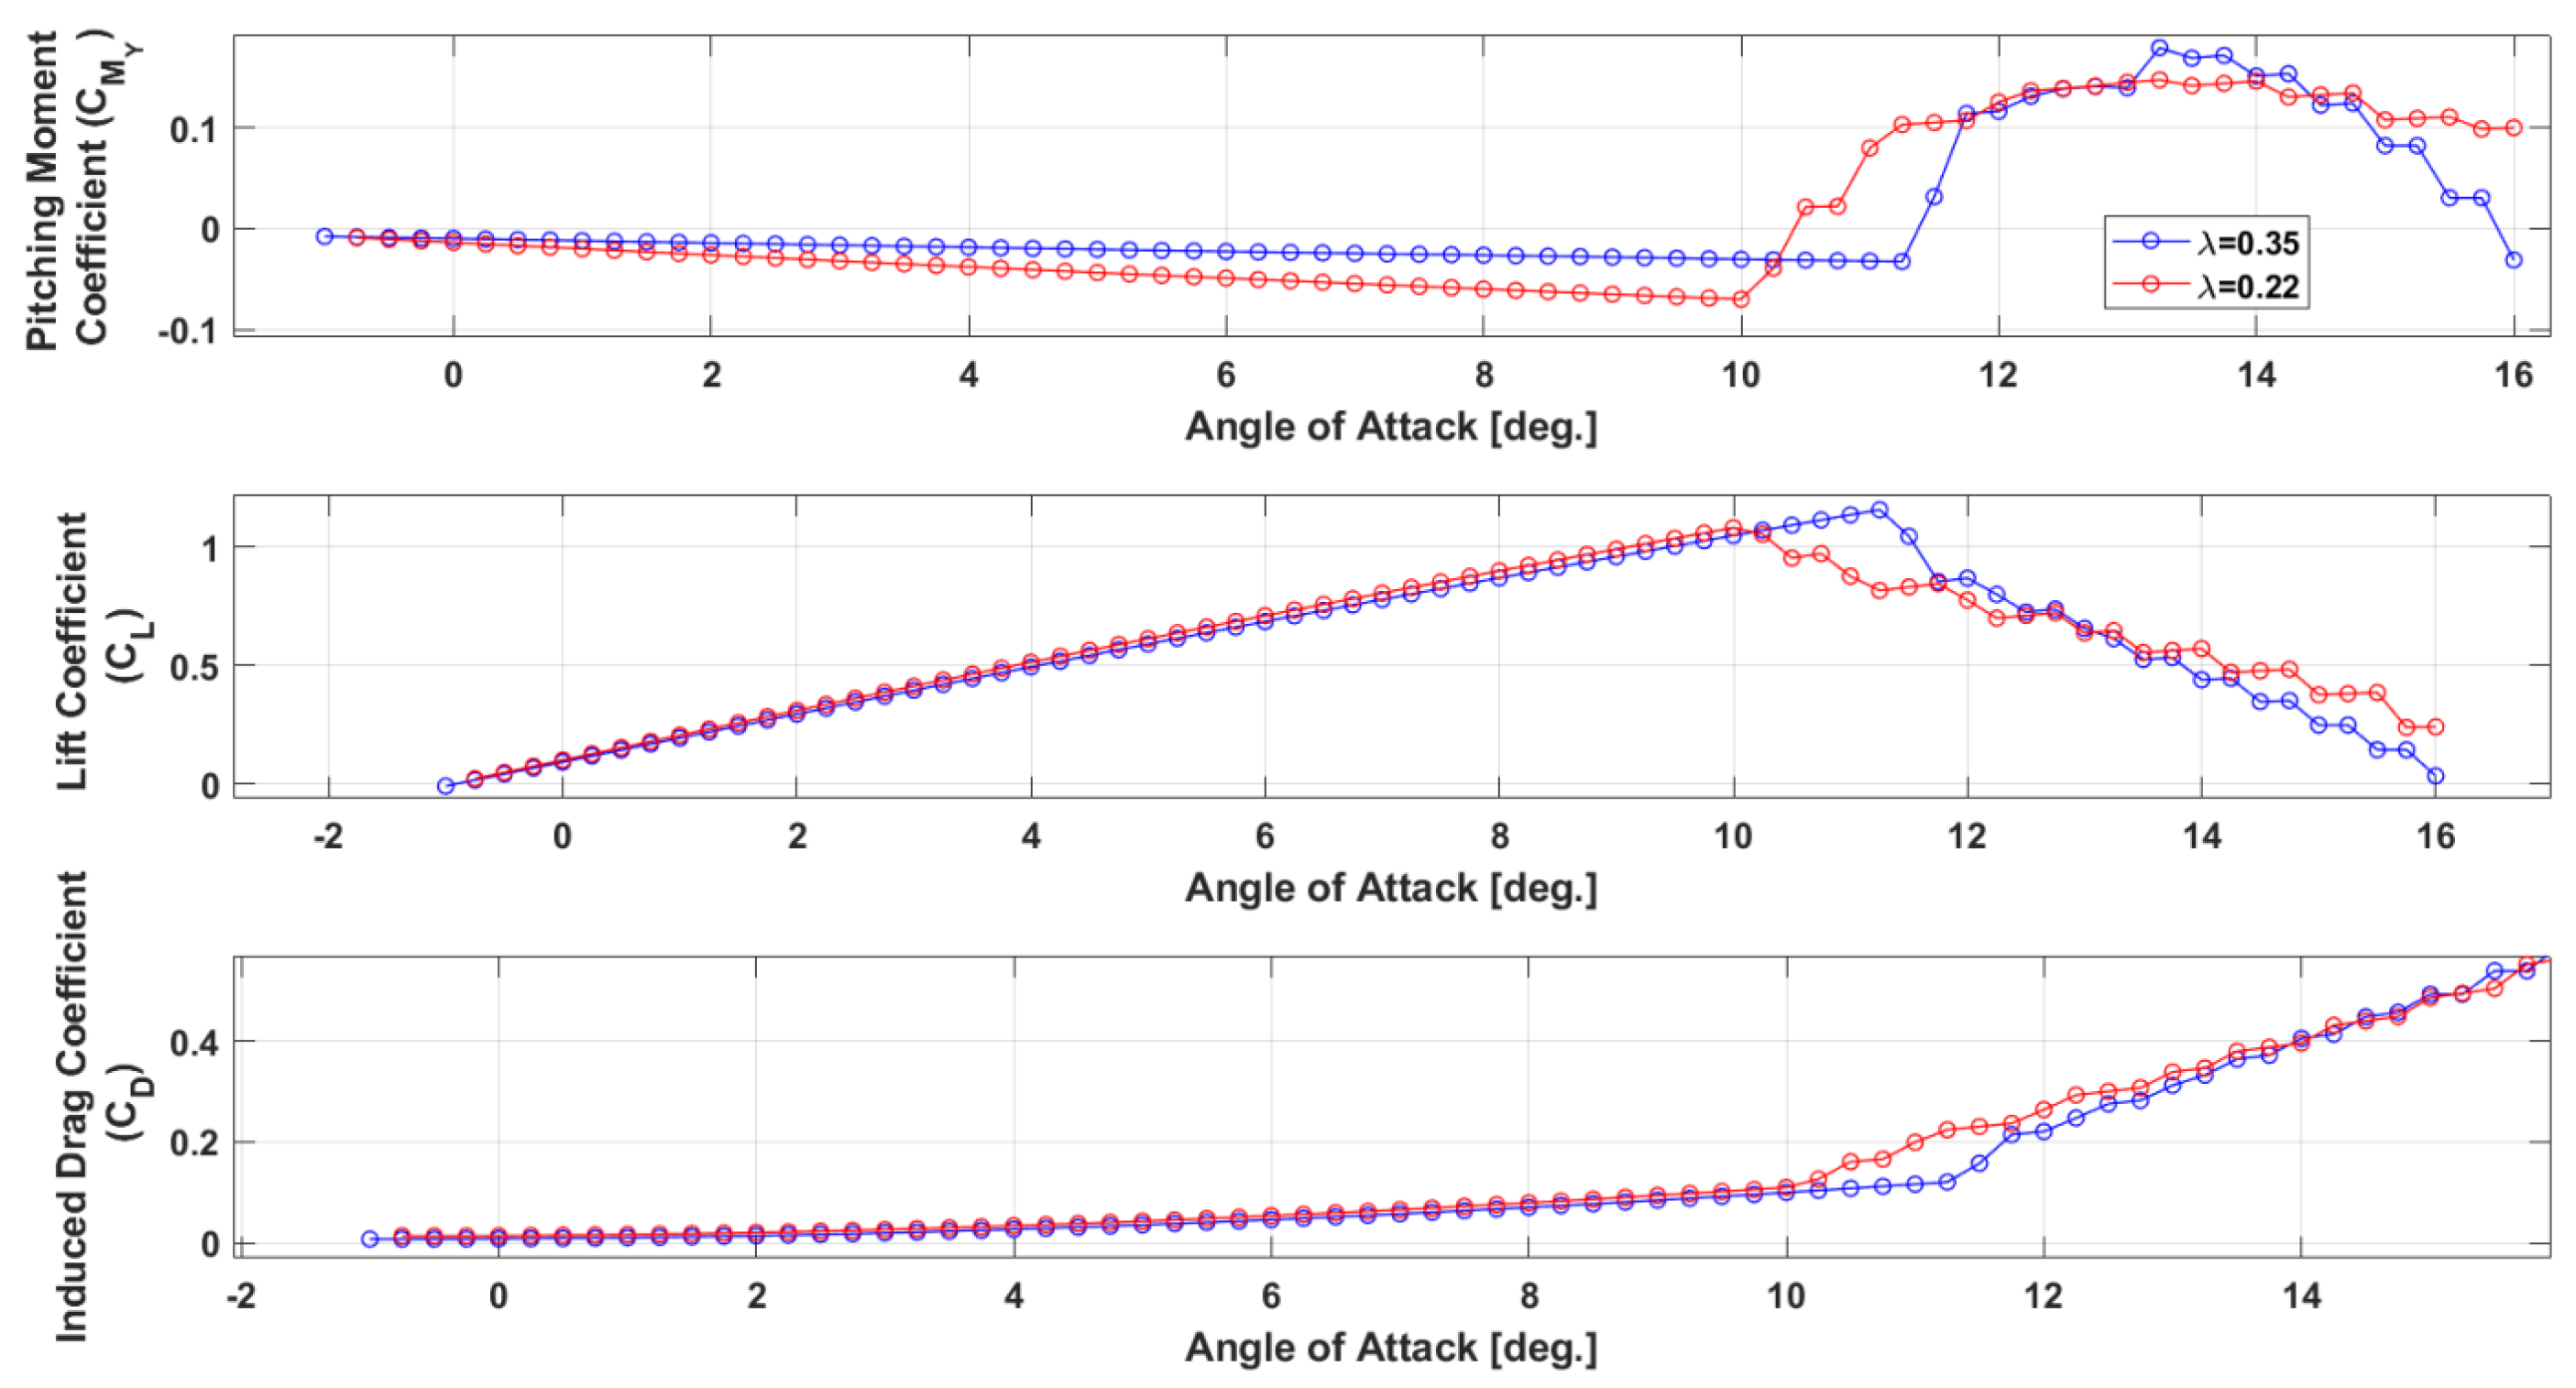
Figure 11.
Wing moment, lift, and induced drag coefficient comparison for two cases of taper ratio (twist angle: , ).
Figure 11.
Wing moment, lift, and induced drag coefficient comparison for two cases of taper ratio (twist angle: , ).
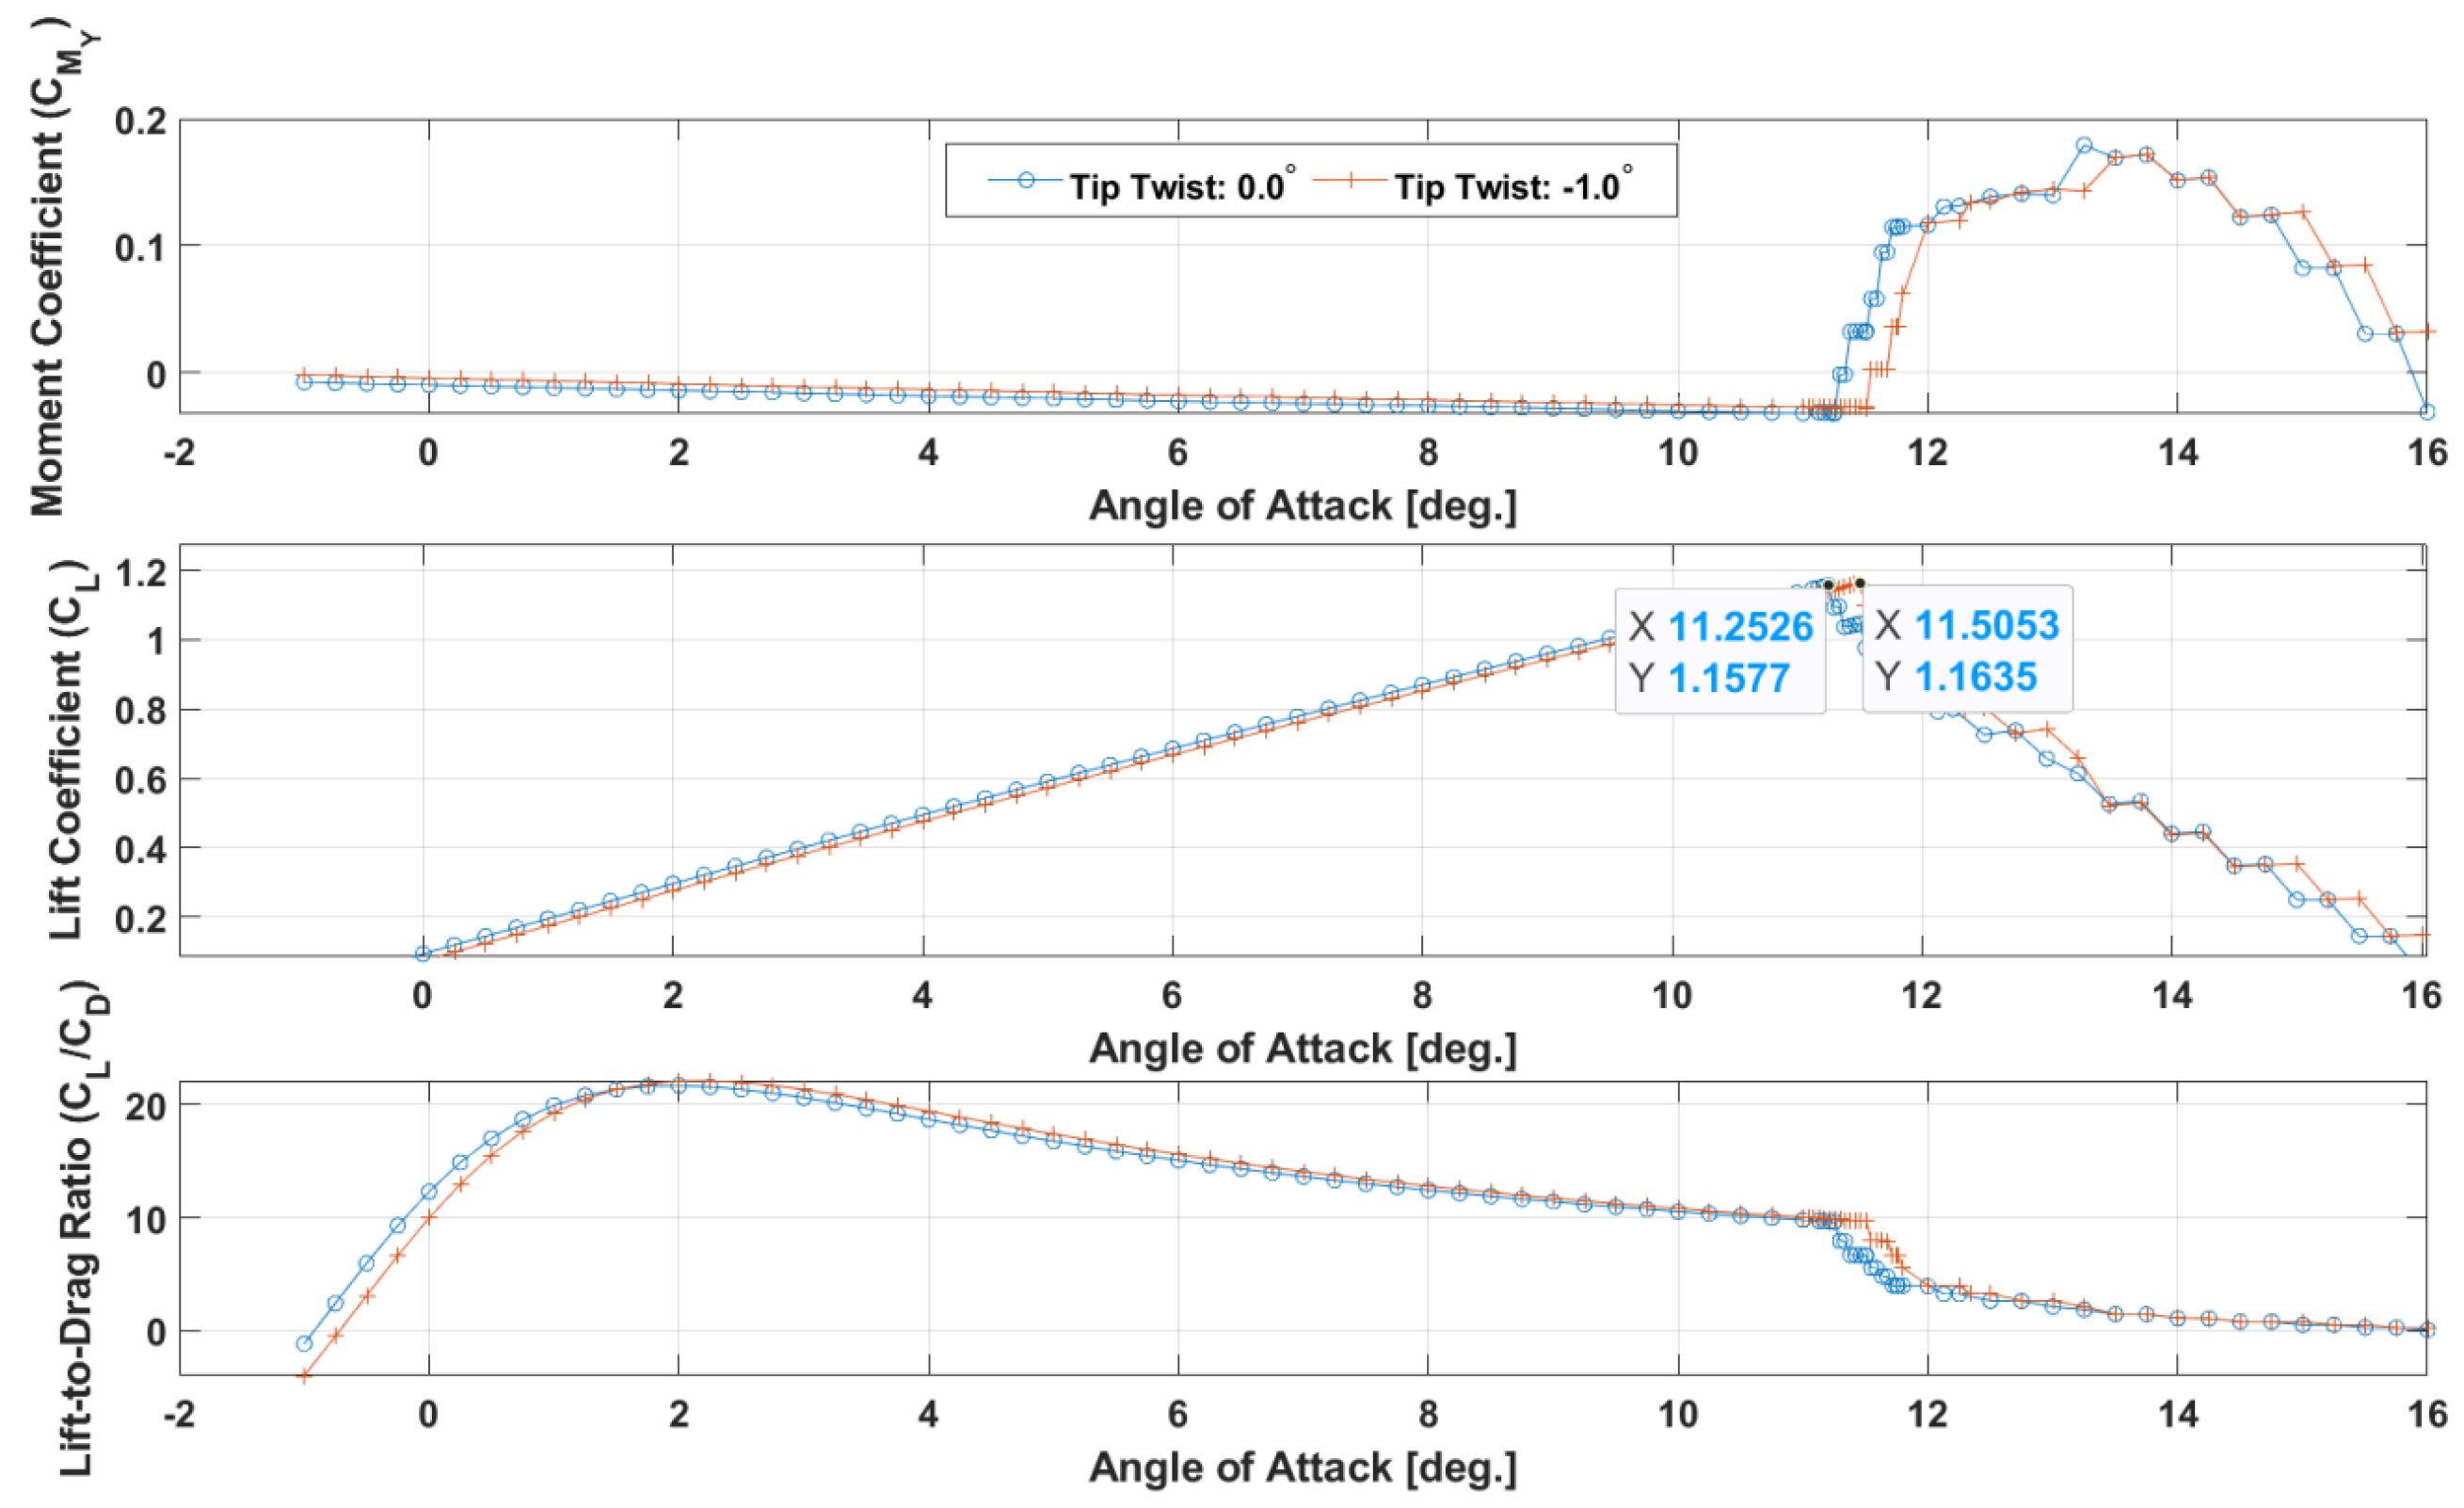
Figure 12.
Wing moment, lift, and induced drag coefficient comparison for two cases of tip twist (, ).
Figure 12.
Wing moment, lift, and induced drag coefficient comparison for two cases of tip twist (, ).
Figure 13.
Load factor and sectional lift coefficient across the wingspan during stall for two cases of wing twist (, ).
Figure 13.
Load factor and sectional lift coefficient across the wingspan during stall for two cases of wing twist (, ).
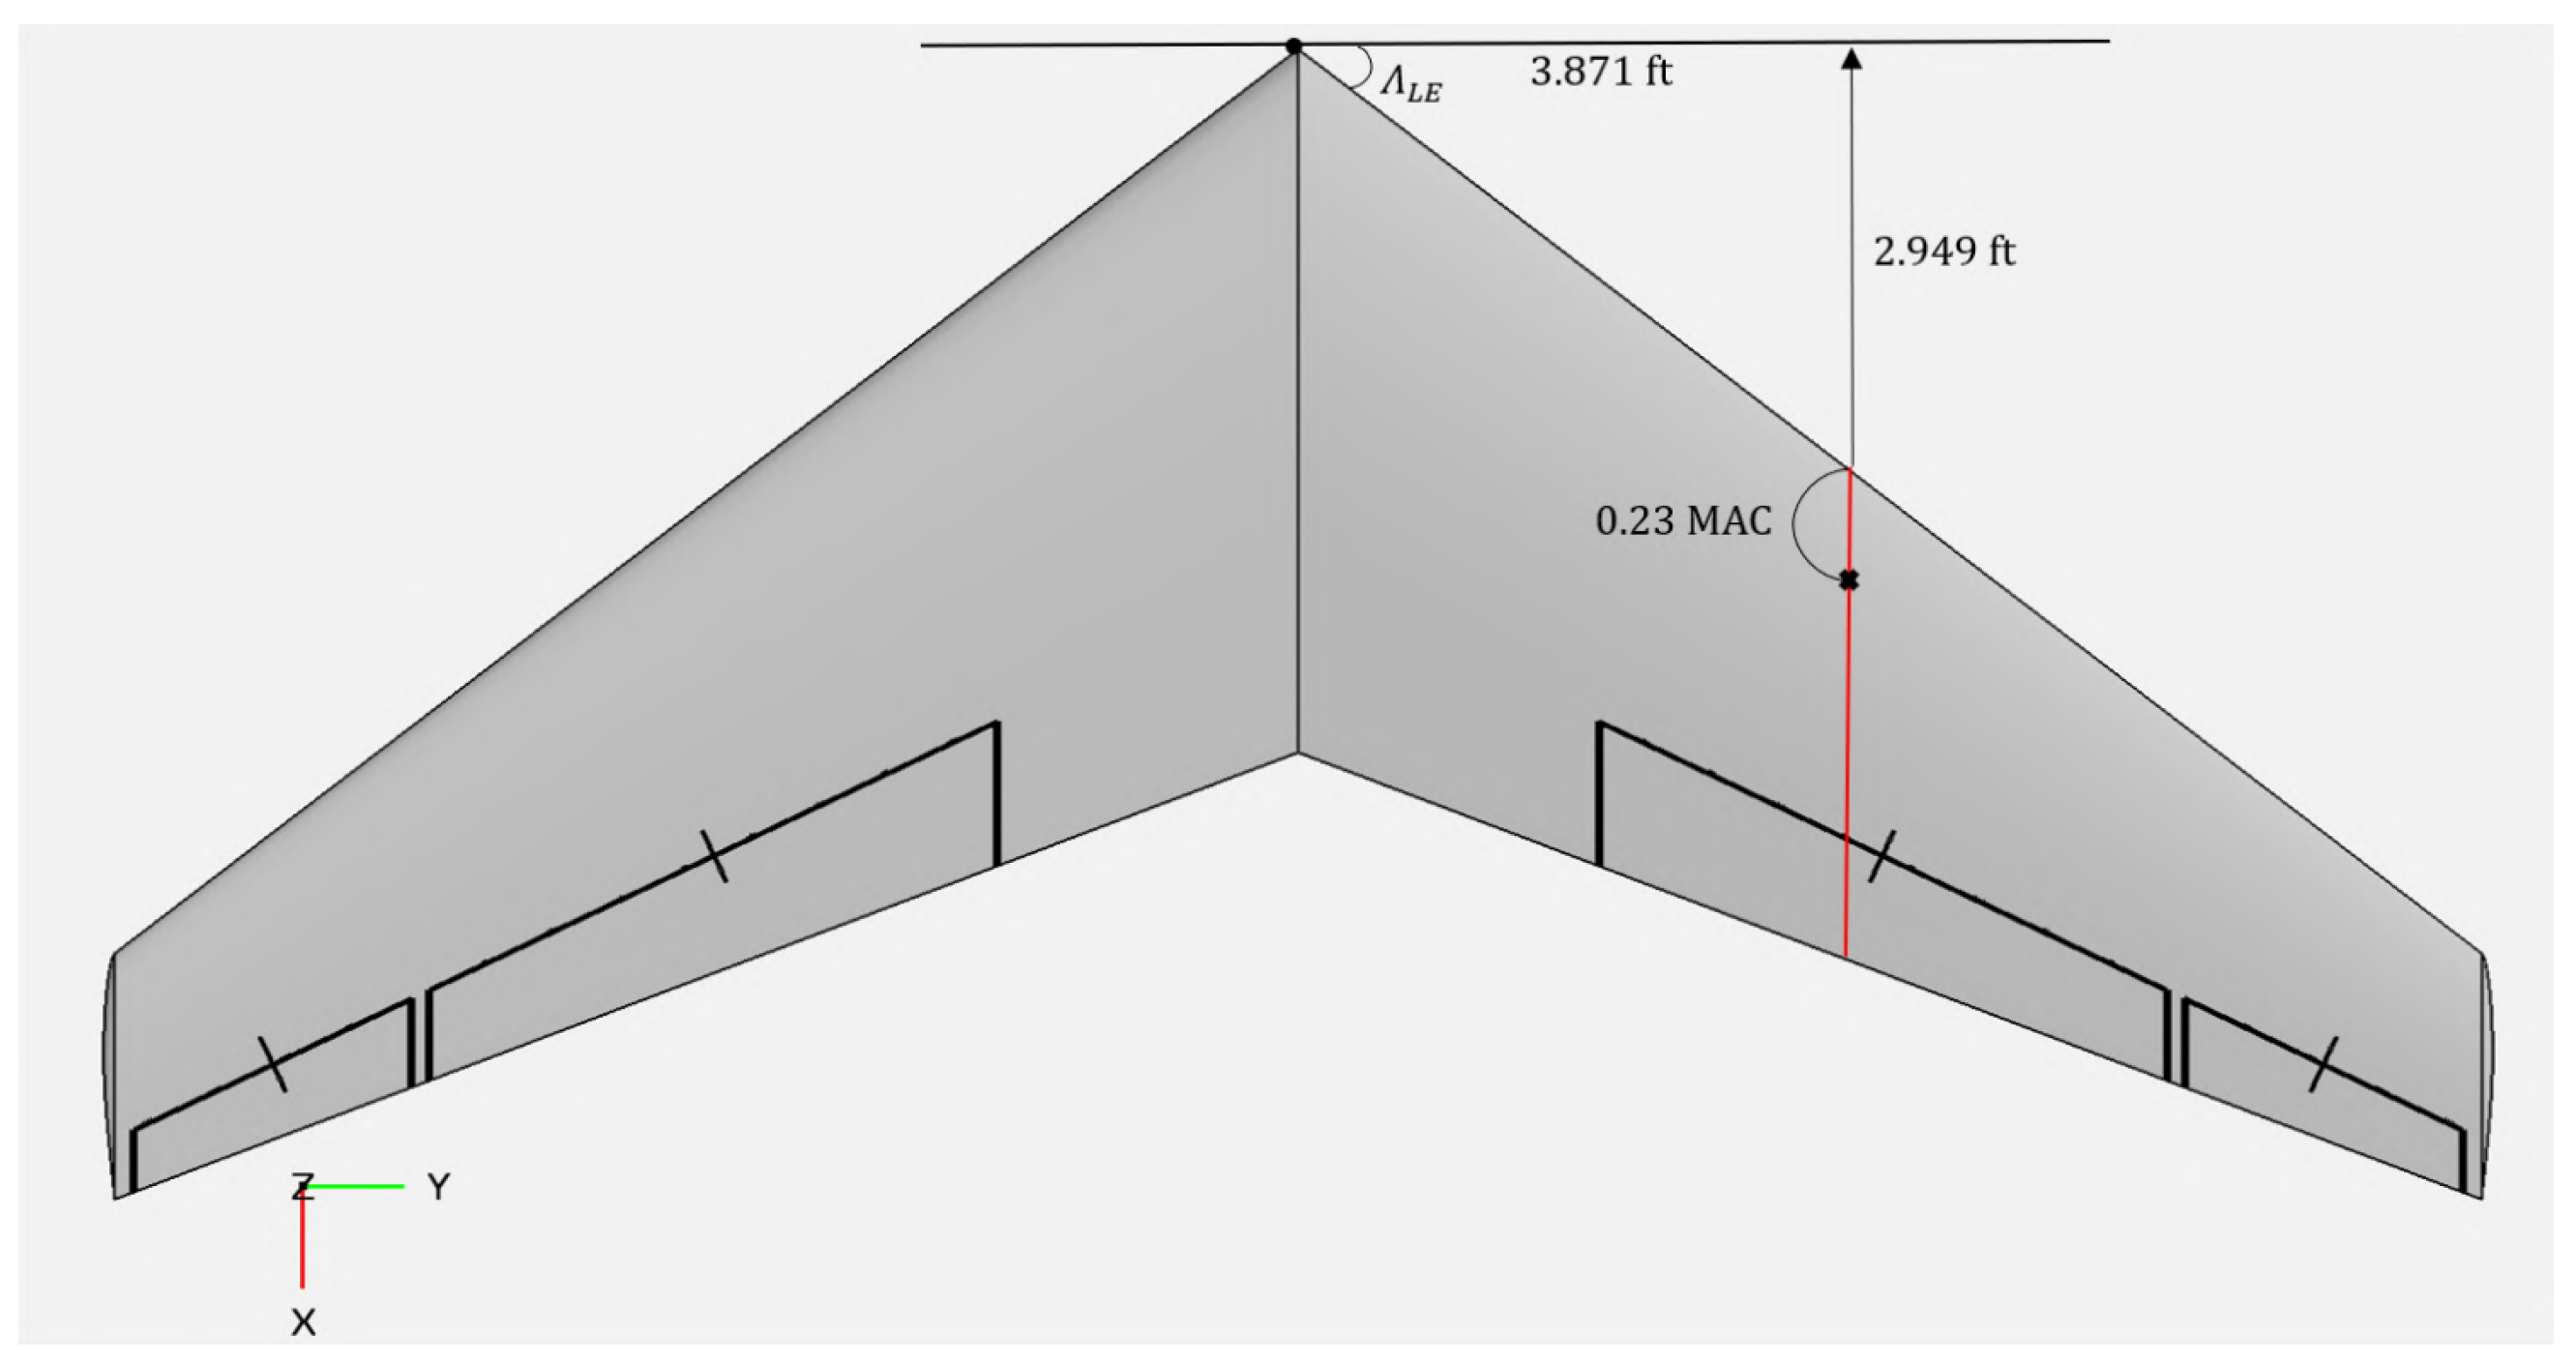
Figure 14.
Wing top-view: Wing/fuselage aerodynamic center distances with respect to the wing geometry.
Figure 14.
Wing top-view: Wing/fuselage aerodynamic center distances with respect to the wing geometry.
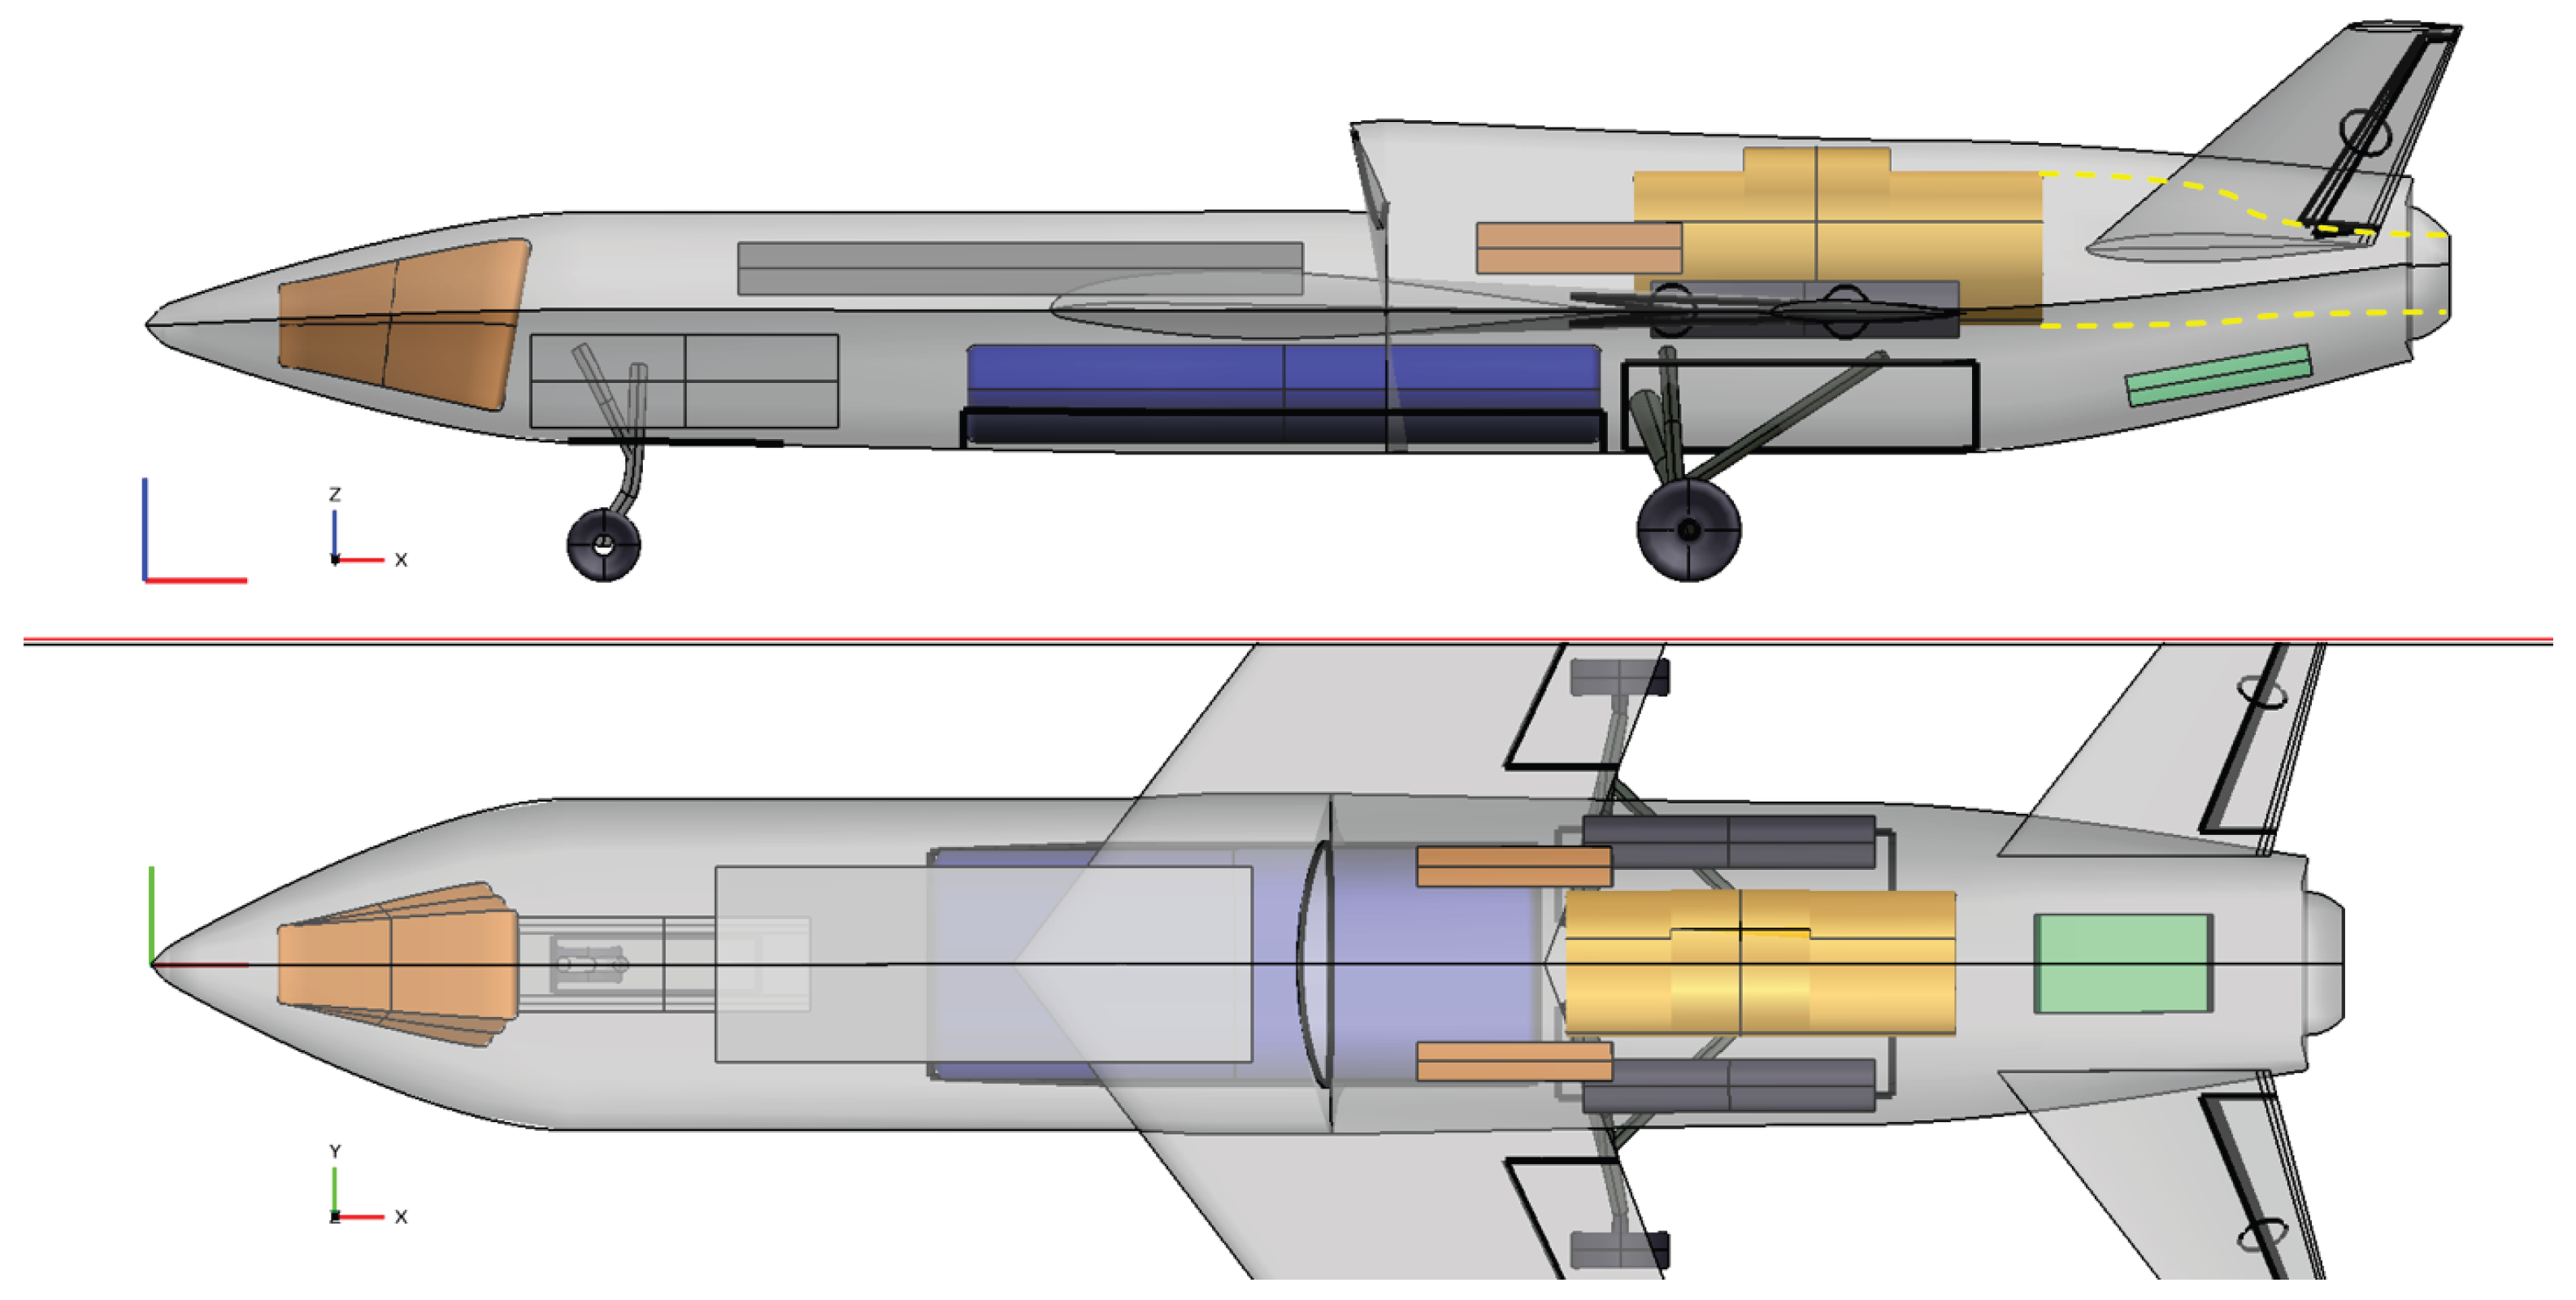
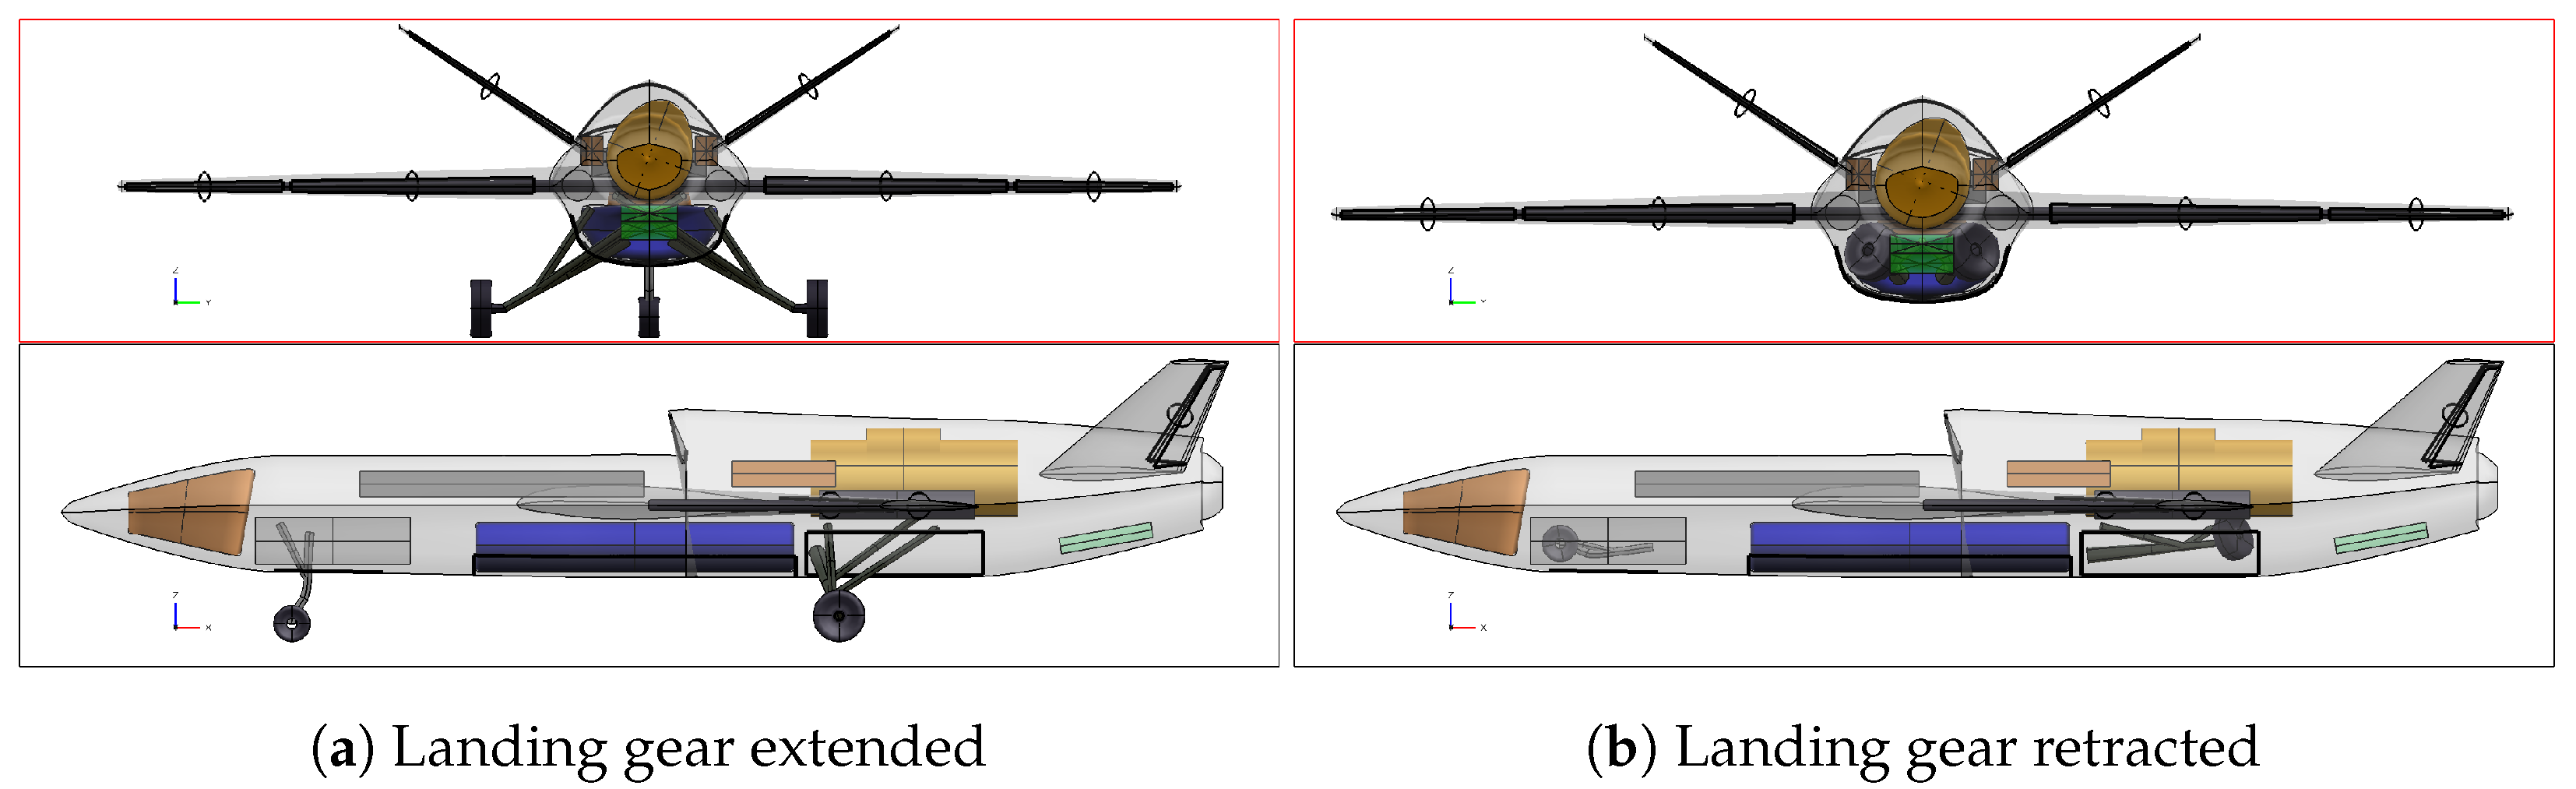
Figure 15.
Transparent side-view and top-view of the UCAV highlighting the internal layout with landing gear extended.
Figure 15.
Transparent side-view and top-view of the UCAV highlighting the internal layout with landing gear extended.
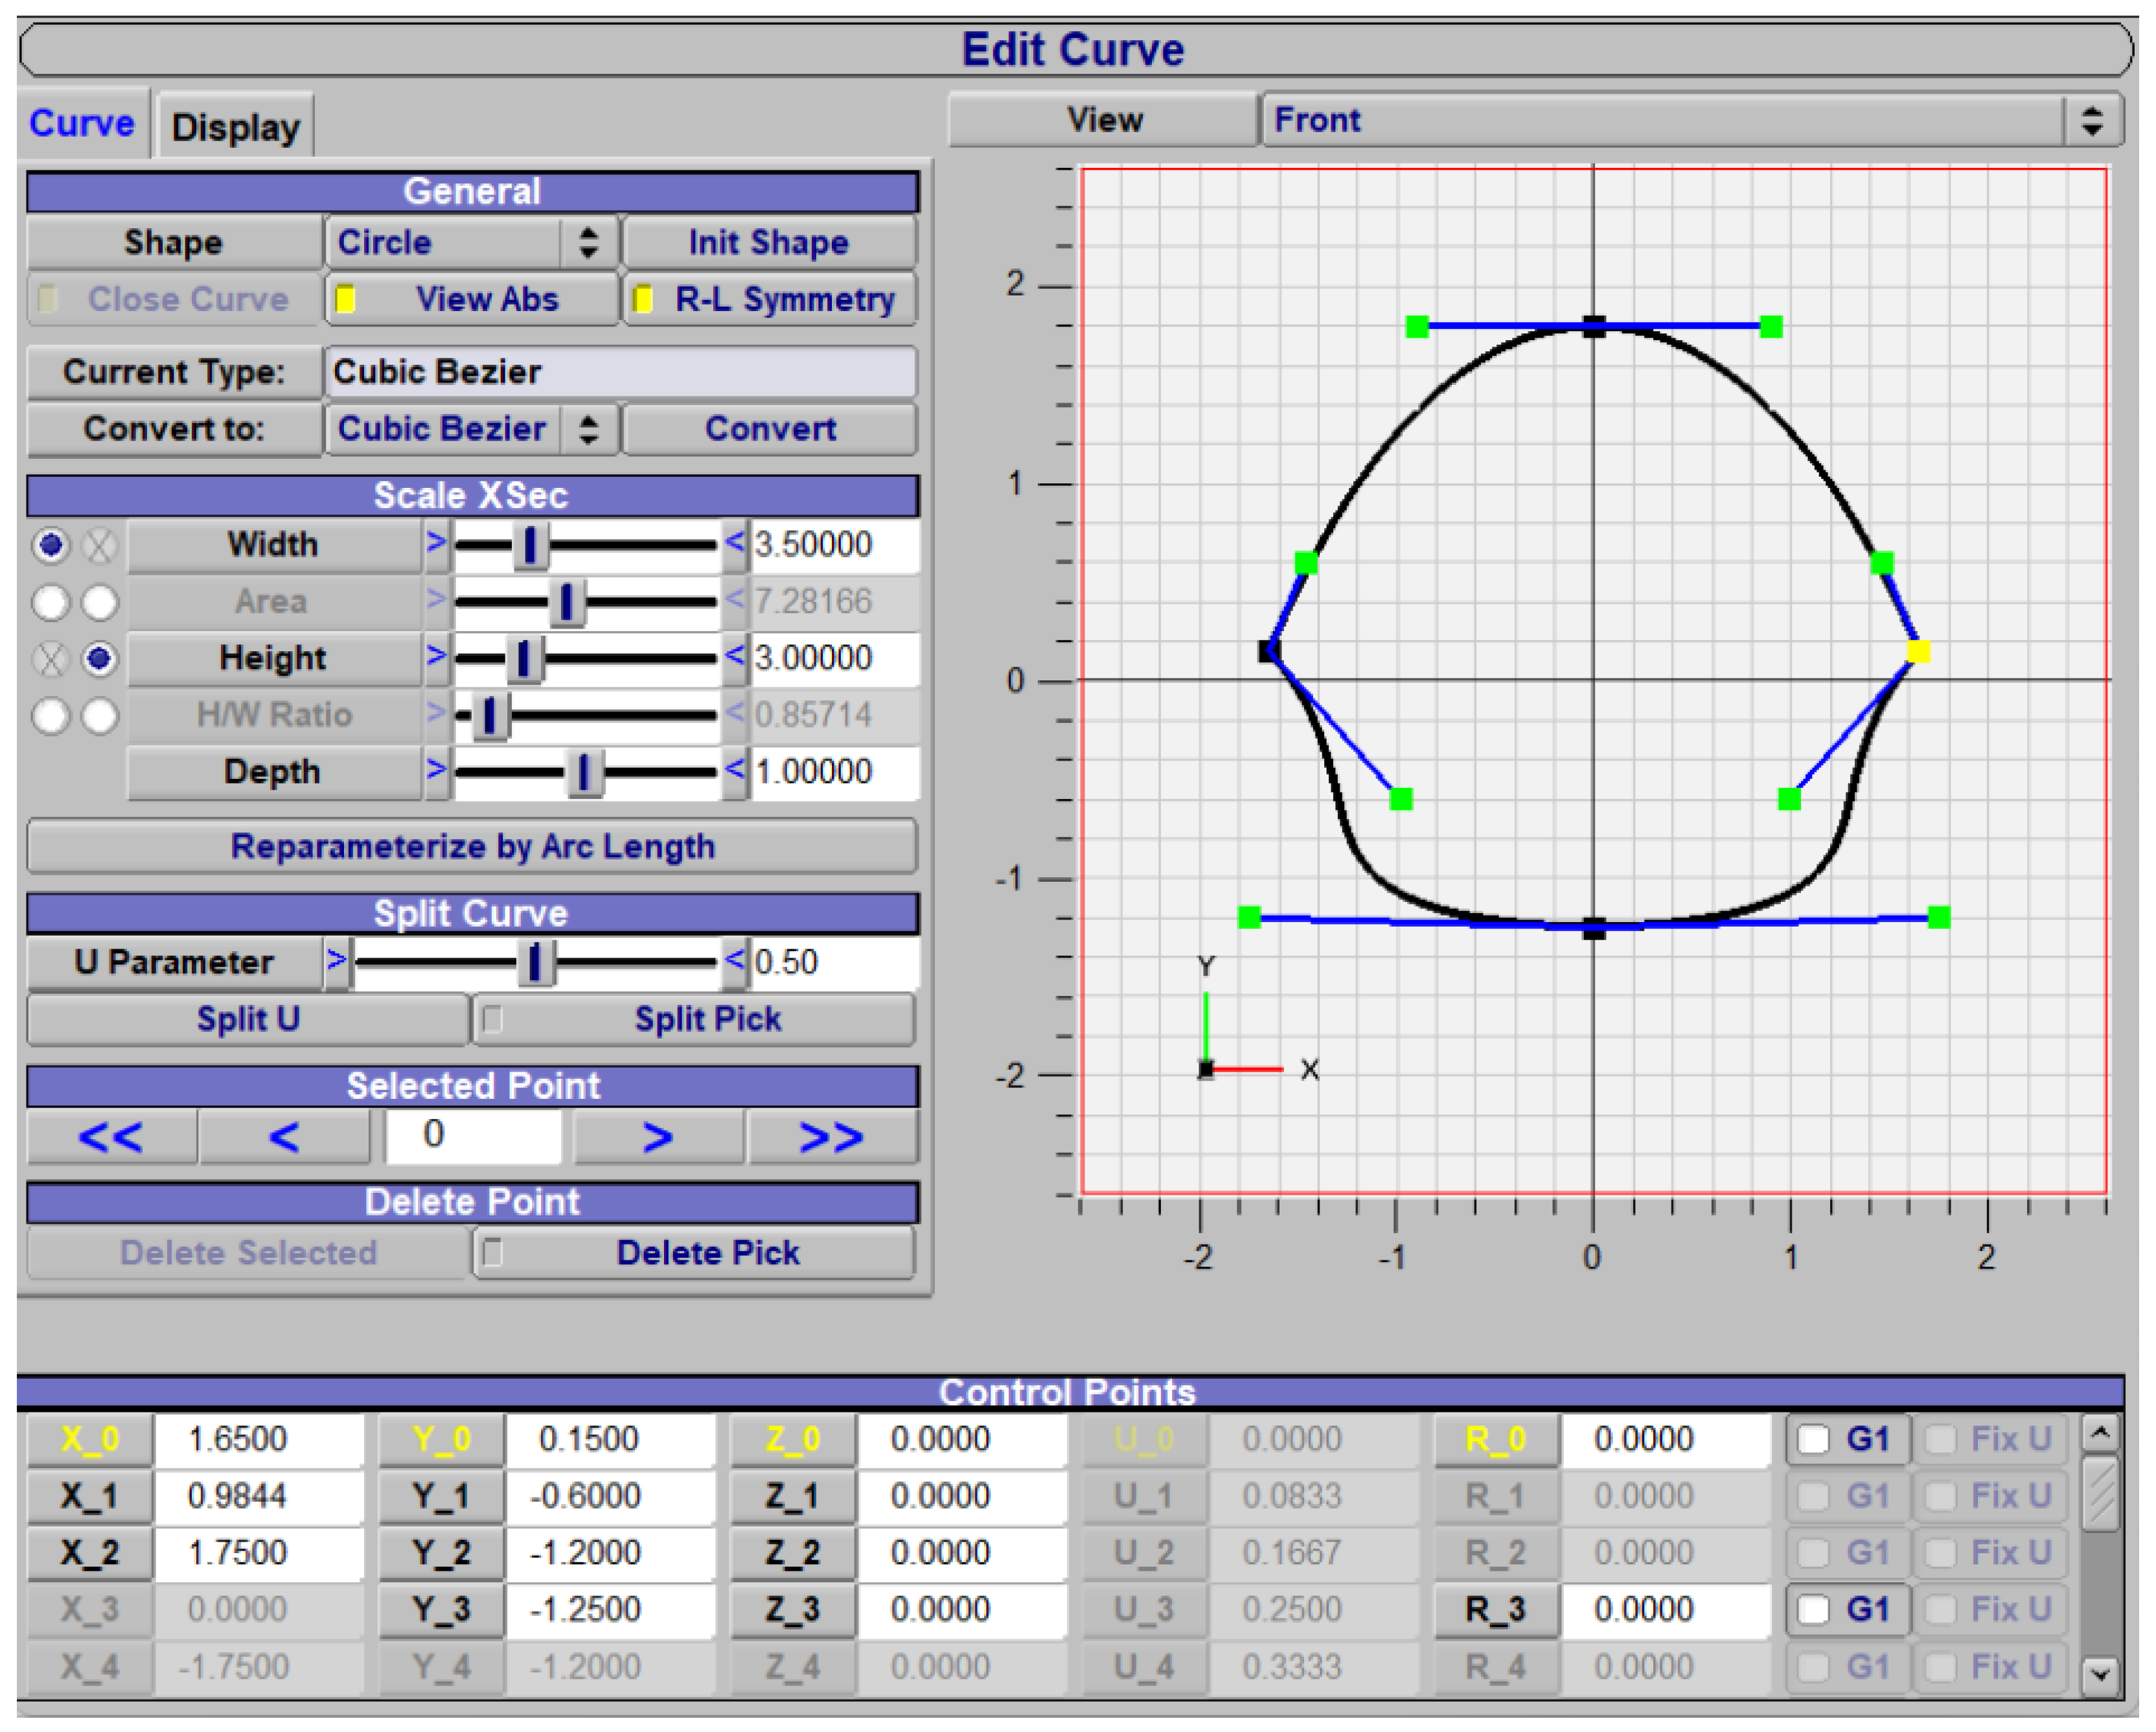
Figure 16.
Fuselage cross-section at the tail attachment—Geometry editor in OpenVSP Software.
Figure 16.
Fuselage cross-section at the tail attachment—Geometry editor in OpenVSP Software.
Figure 17.
Adjustment from a conventional (blue tail) to a V-tail (gray tail) configuration in OpenVSP.
Figure 17.
Adjustment from a conventional (blue tail) to a V-tail (gray tail) configuration in OpenVSP.
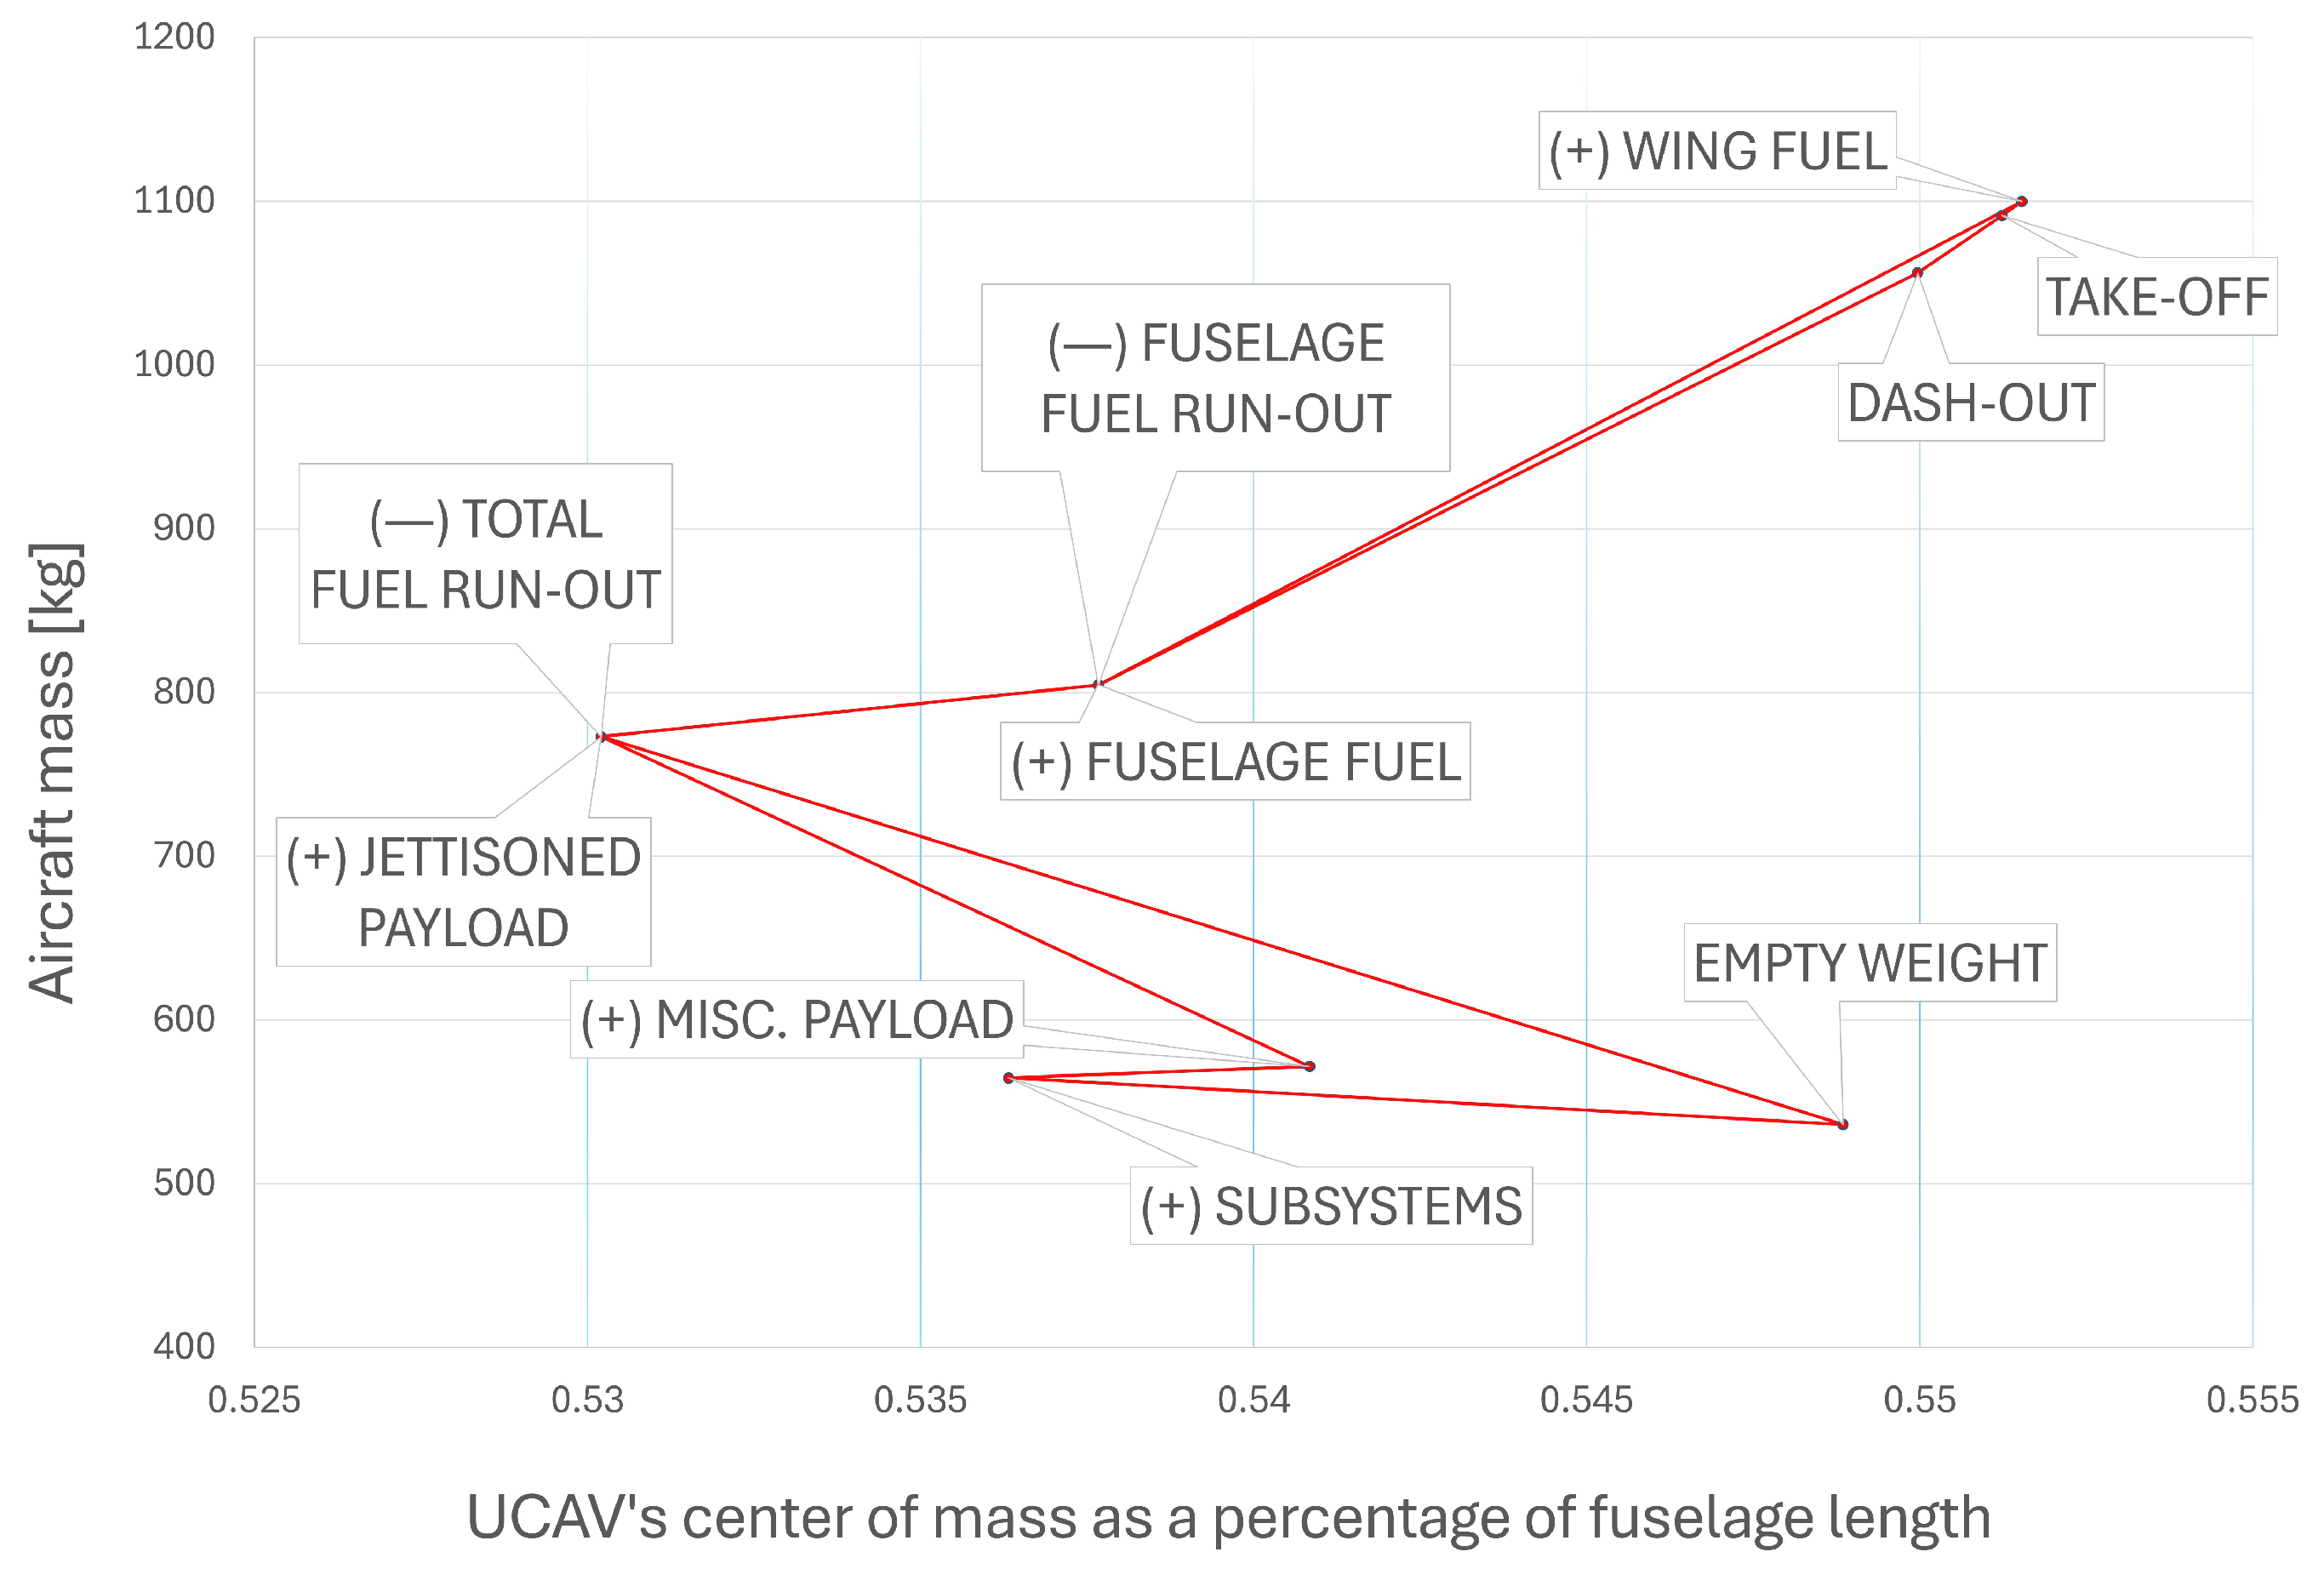
Figure 18.
Center of mass movement along the longitudinal axis of the UCAV during all ground loading and flight phases—Case #1: Disposed Payload.
Figure 18.
Center of mass movement along the longitudinal axis of the UCAV during all ground loading and flight phases—Case #1: Disposed Payload.
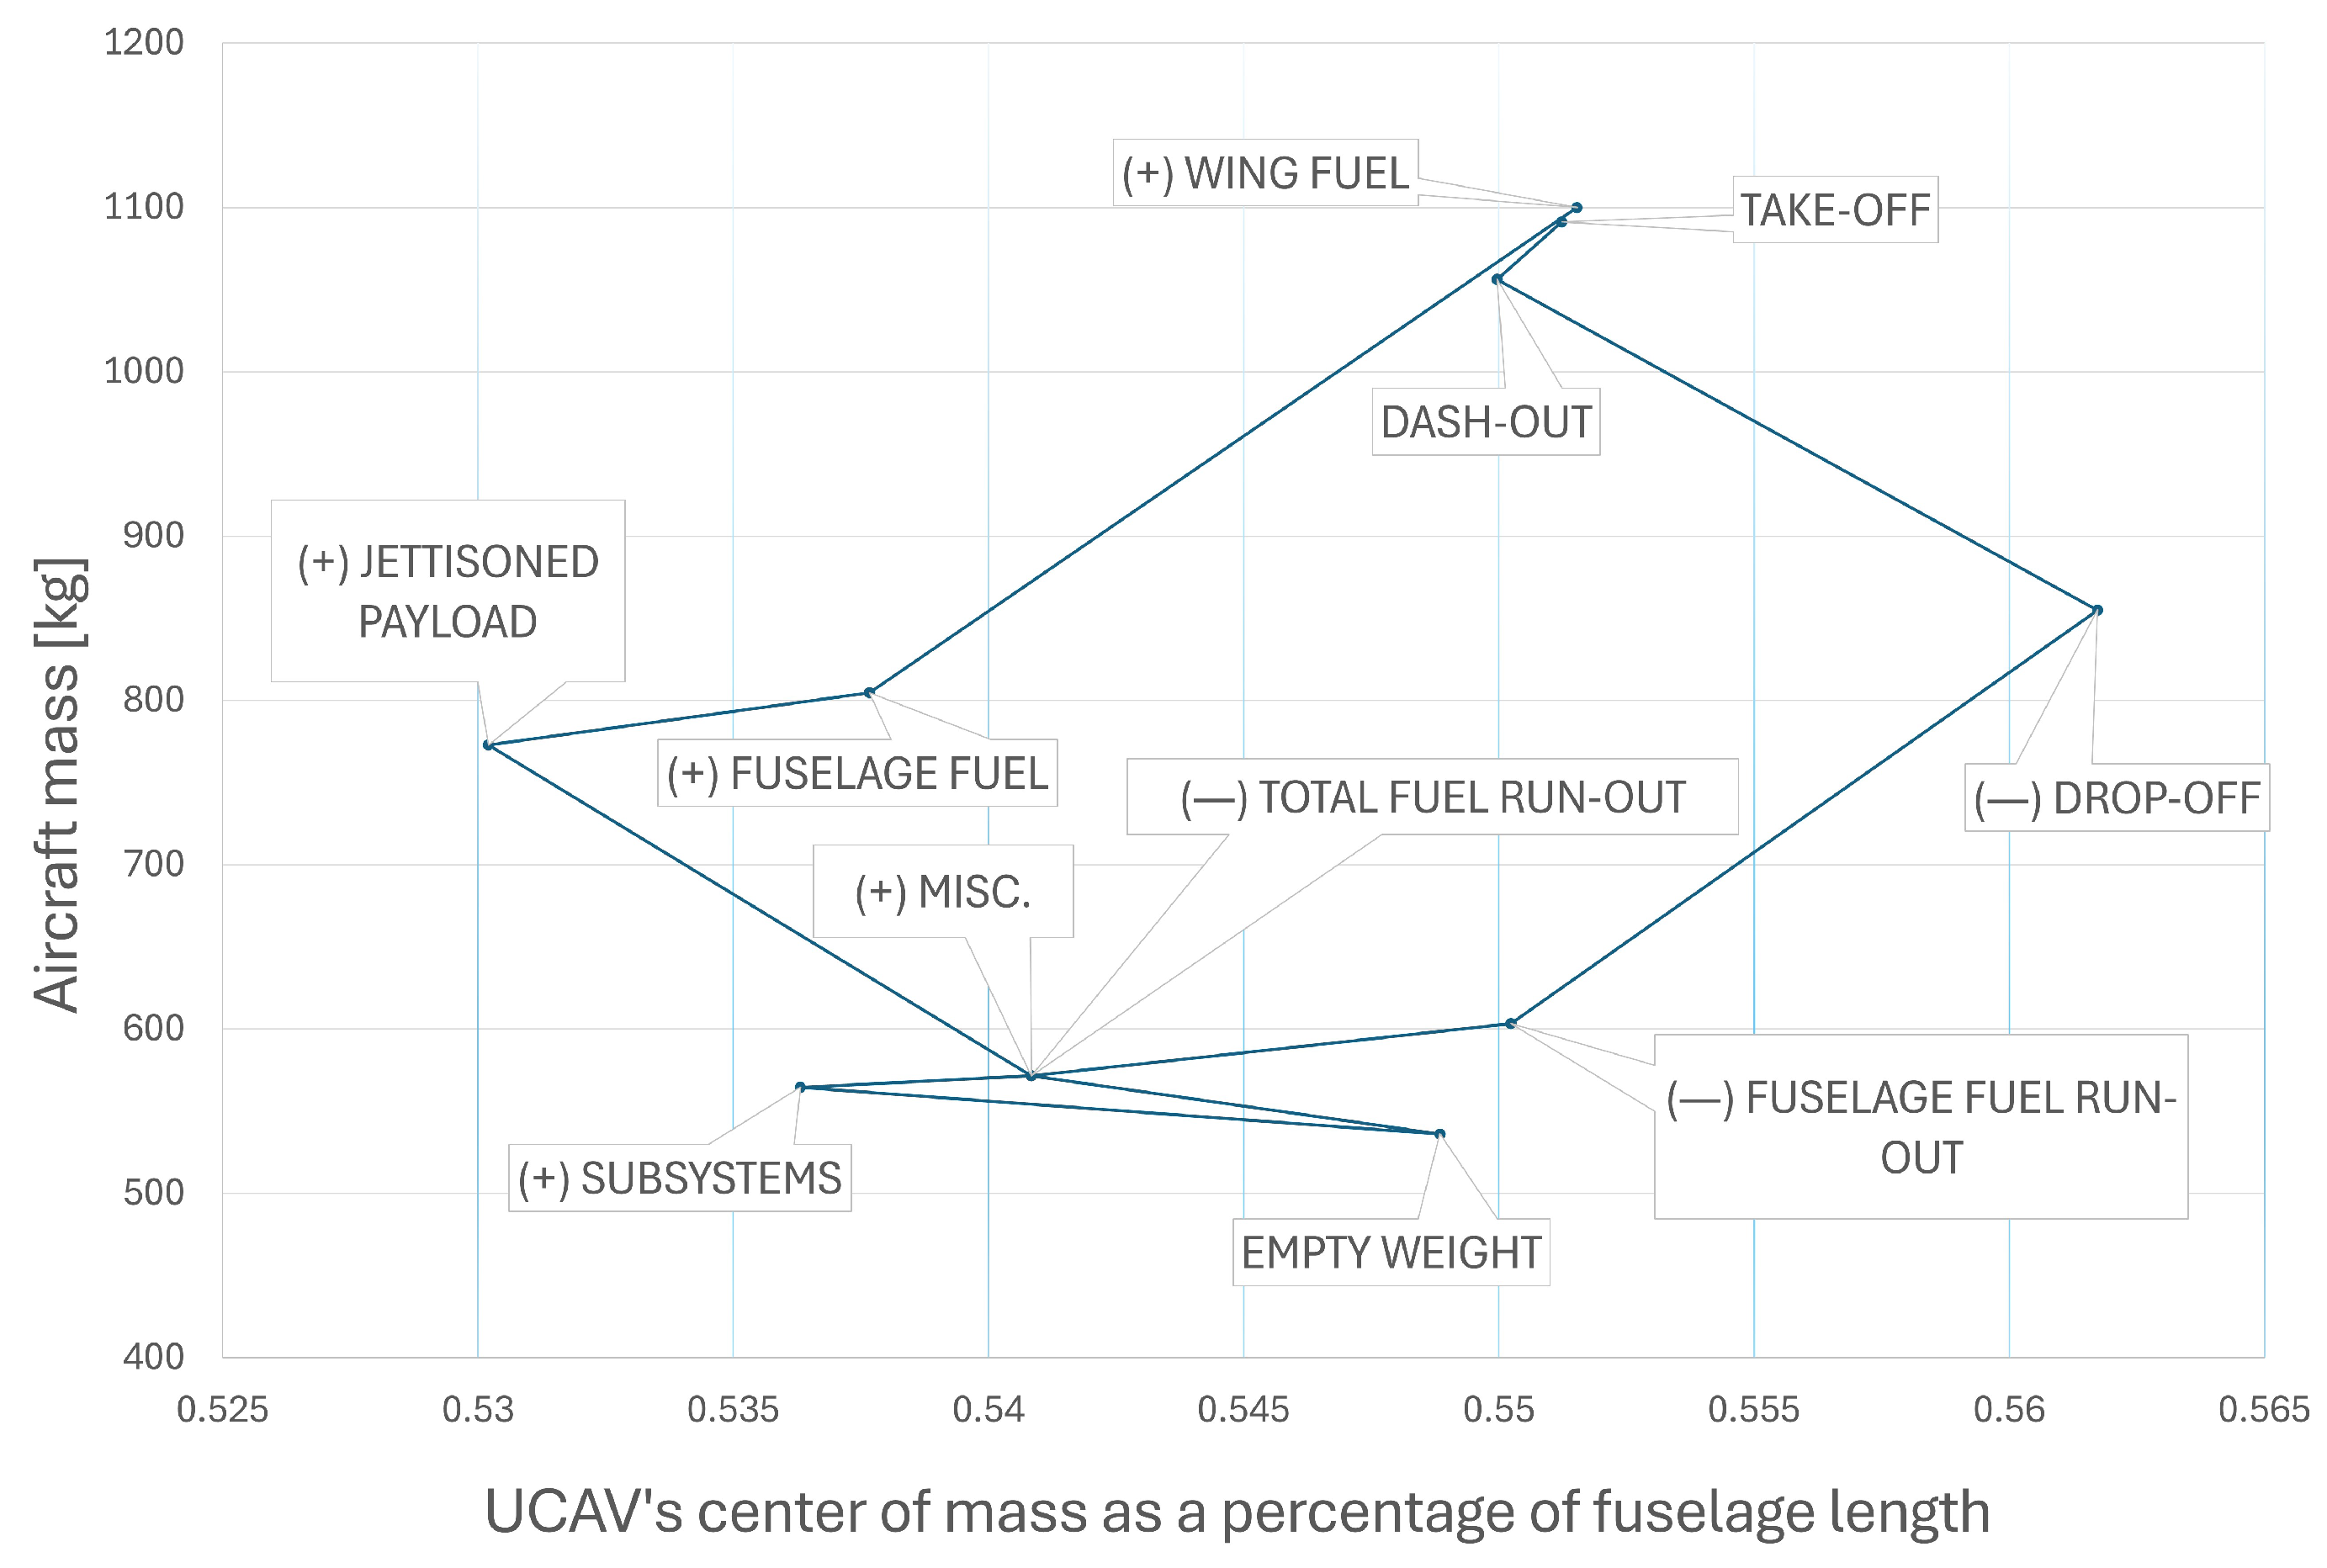
Figure 19.
Center of mass movement along the longitudinal axis of the UCAV during all ground loading and flight phases—Case #2: Kept Payload.
Figure 19.
Center of mass movement along the longitudinal axis of the UCAV during all ground loading and flight phases—Case #2: Kept Payload.
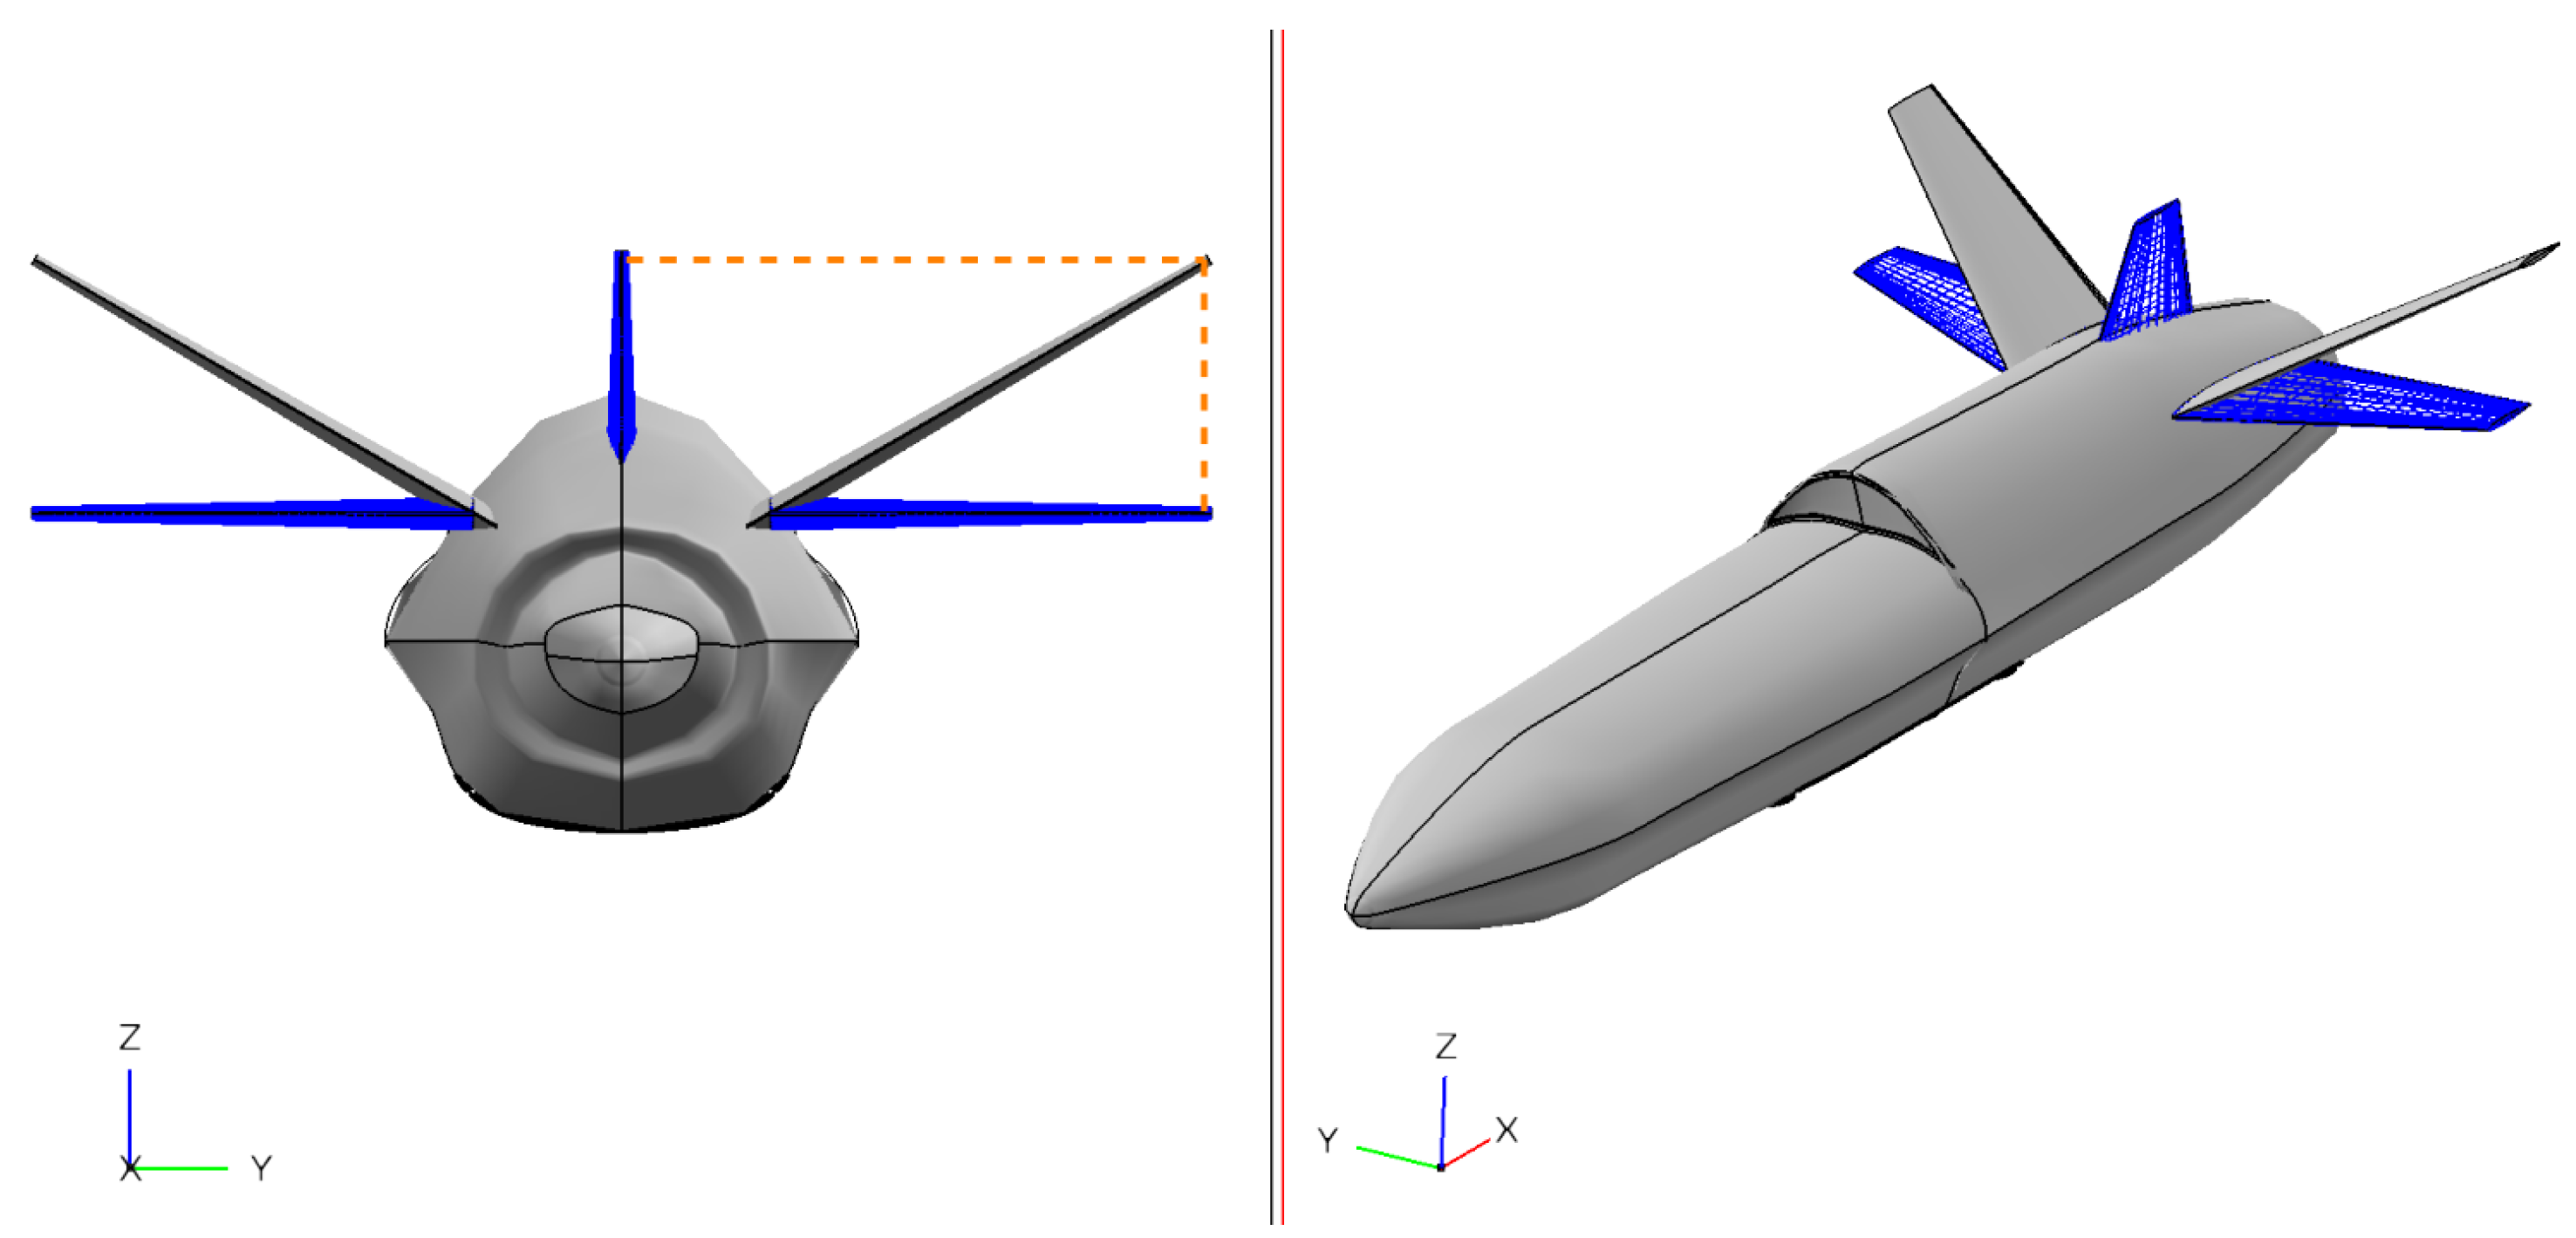
Figure 20.
Left and rear view of the designed UCAV.
Figure 20.
Left and rear view of the designed UCAV.
Figure 21.
External image of the designed UCAV “Tísis” designed in SolidWorks 2025 (SP2).
Figure 21.
External image of the designed UCAV “Tísis” designed in SolidWorks 2025 (SP2).
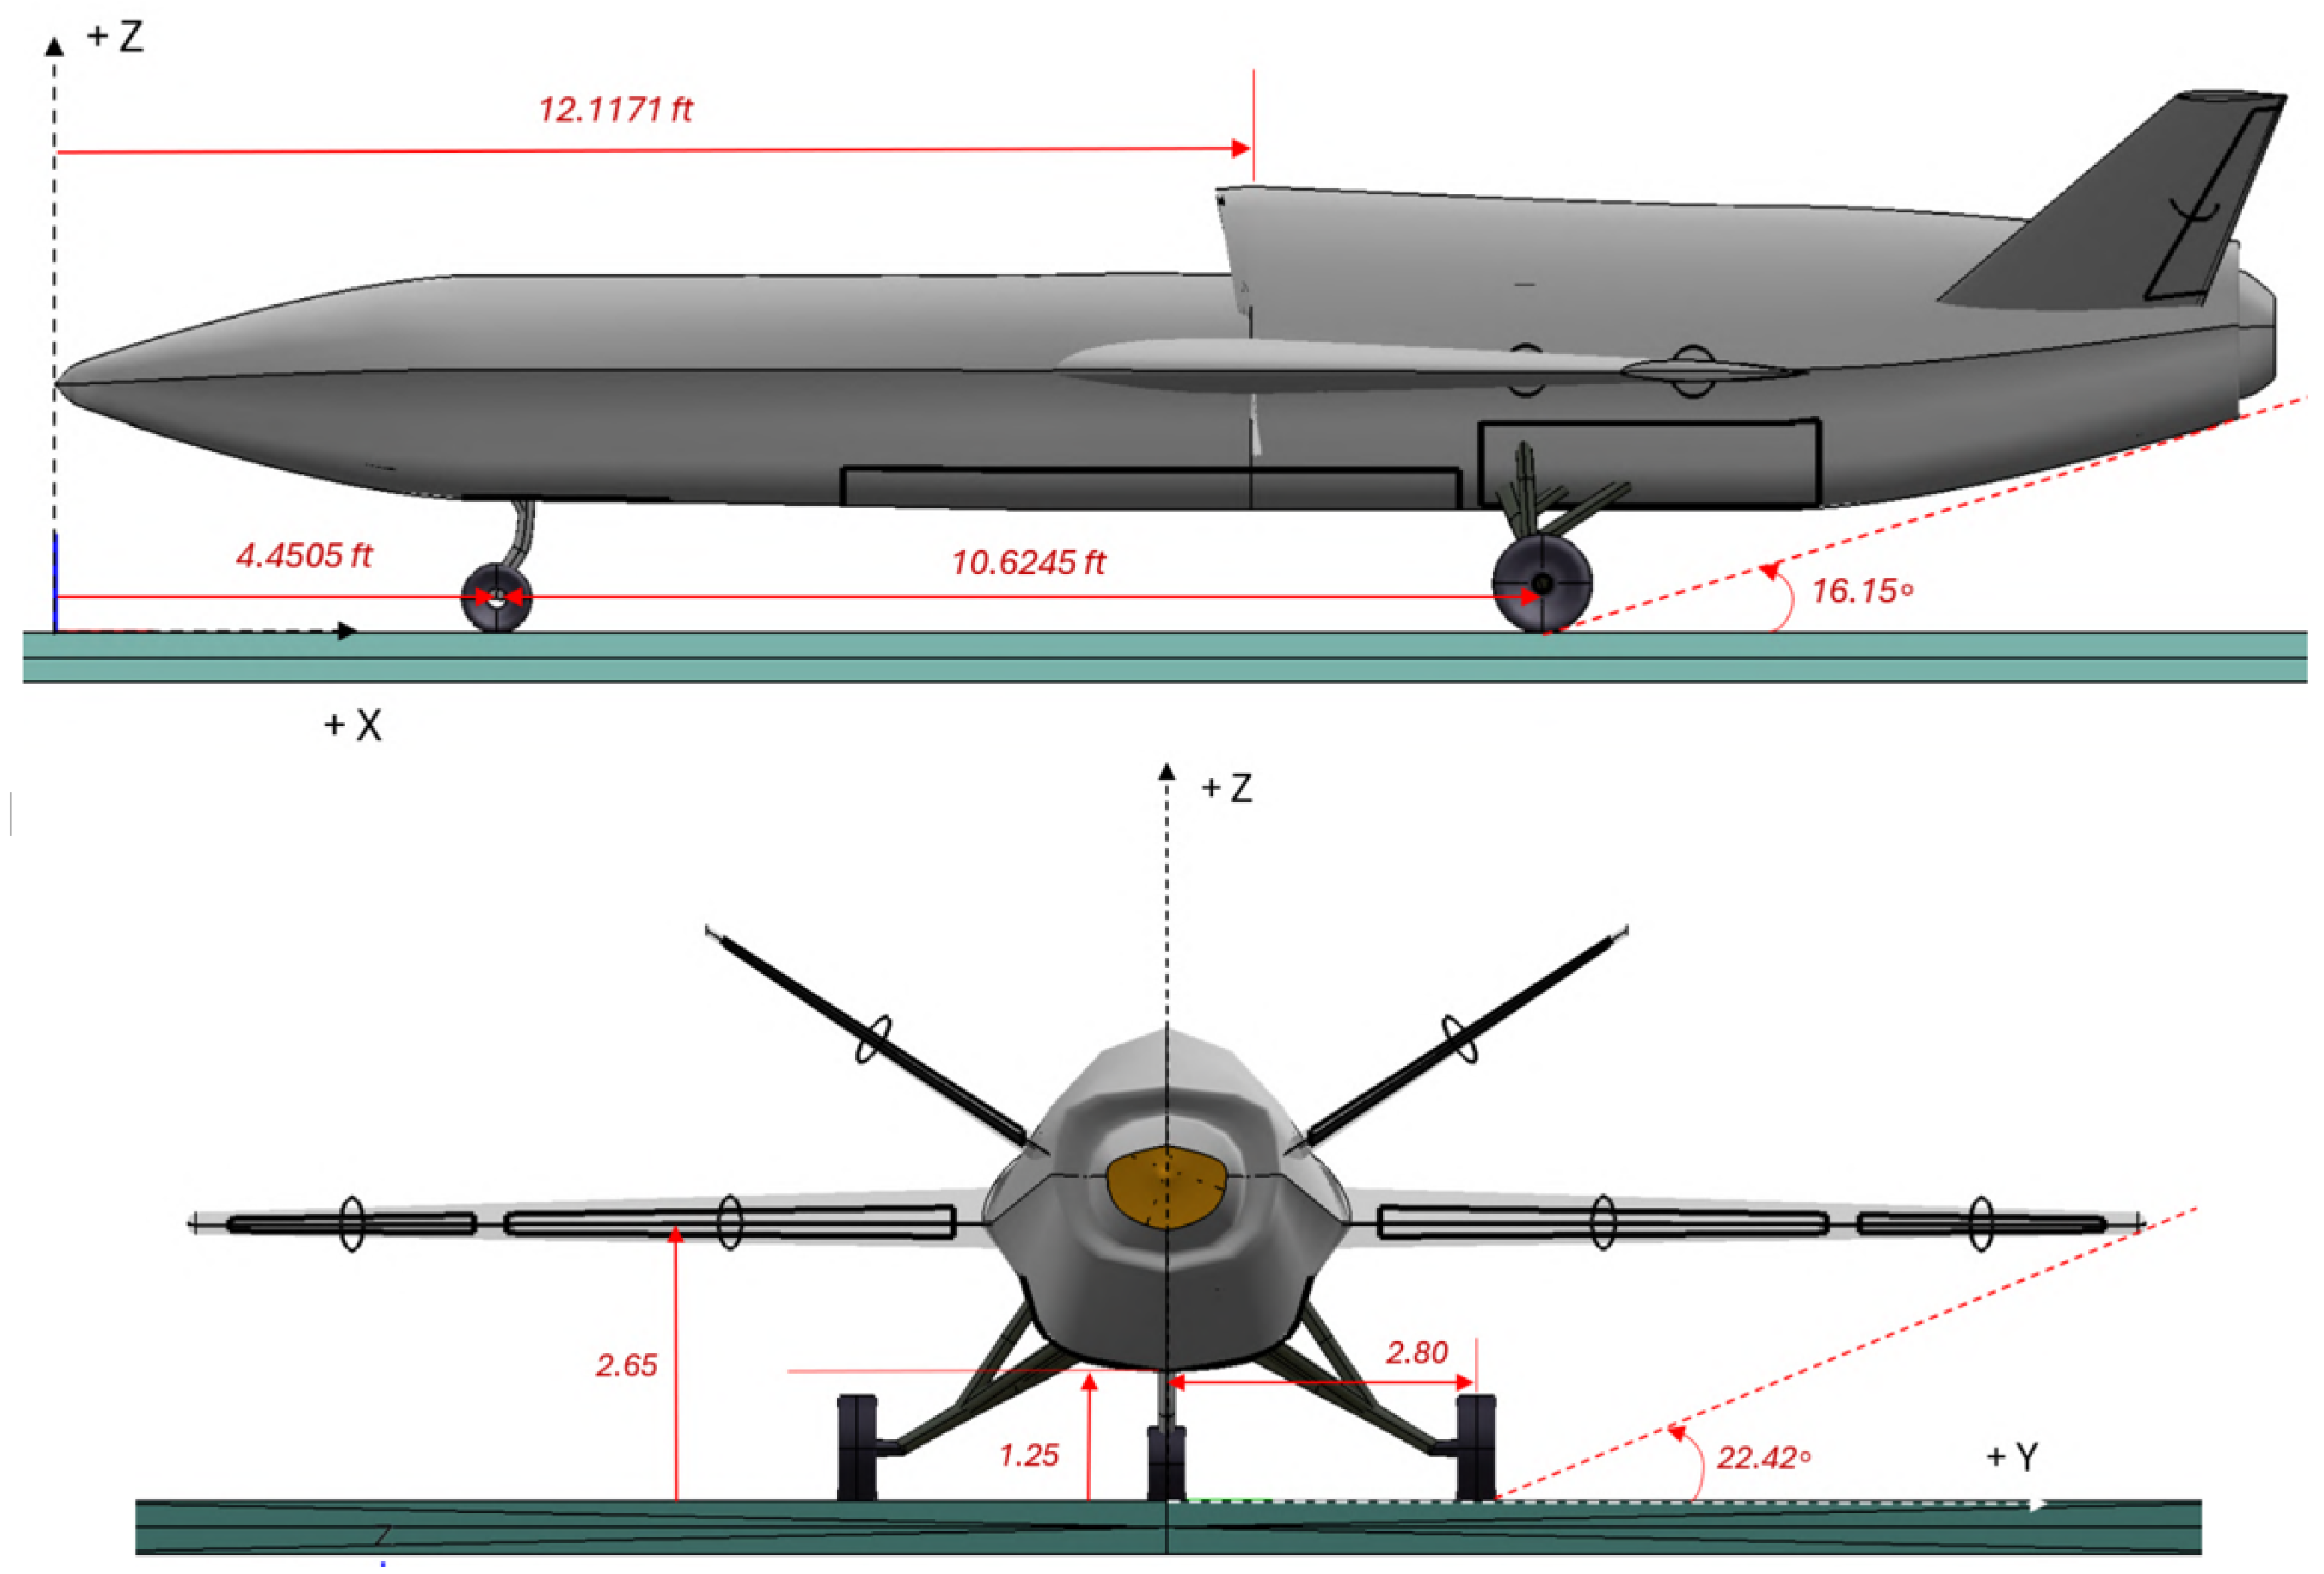
Figure 22.
Left and rear view of the UCAV with dimensions.
Figure 22.
Left and rear view of the UCAV with dimensions.
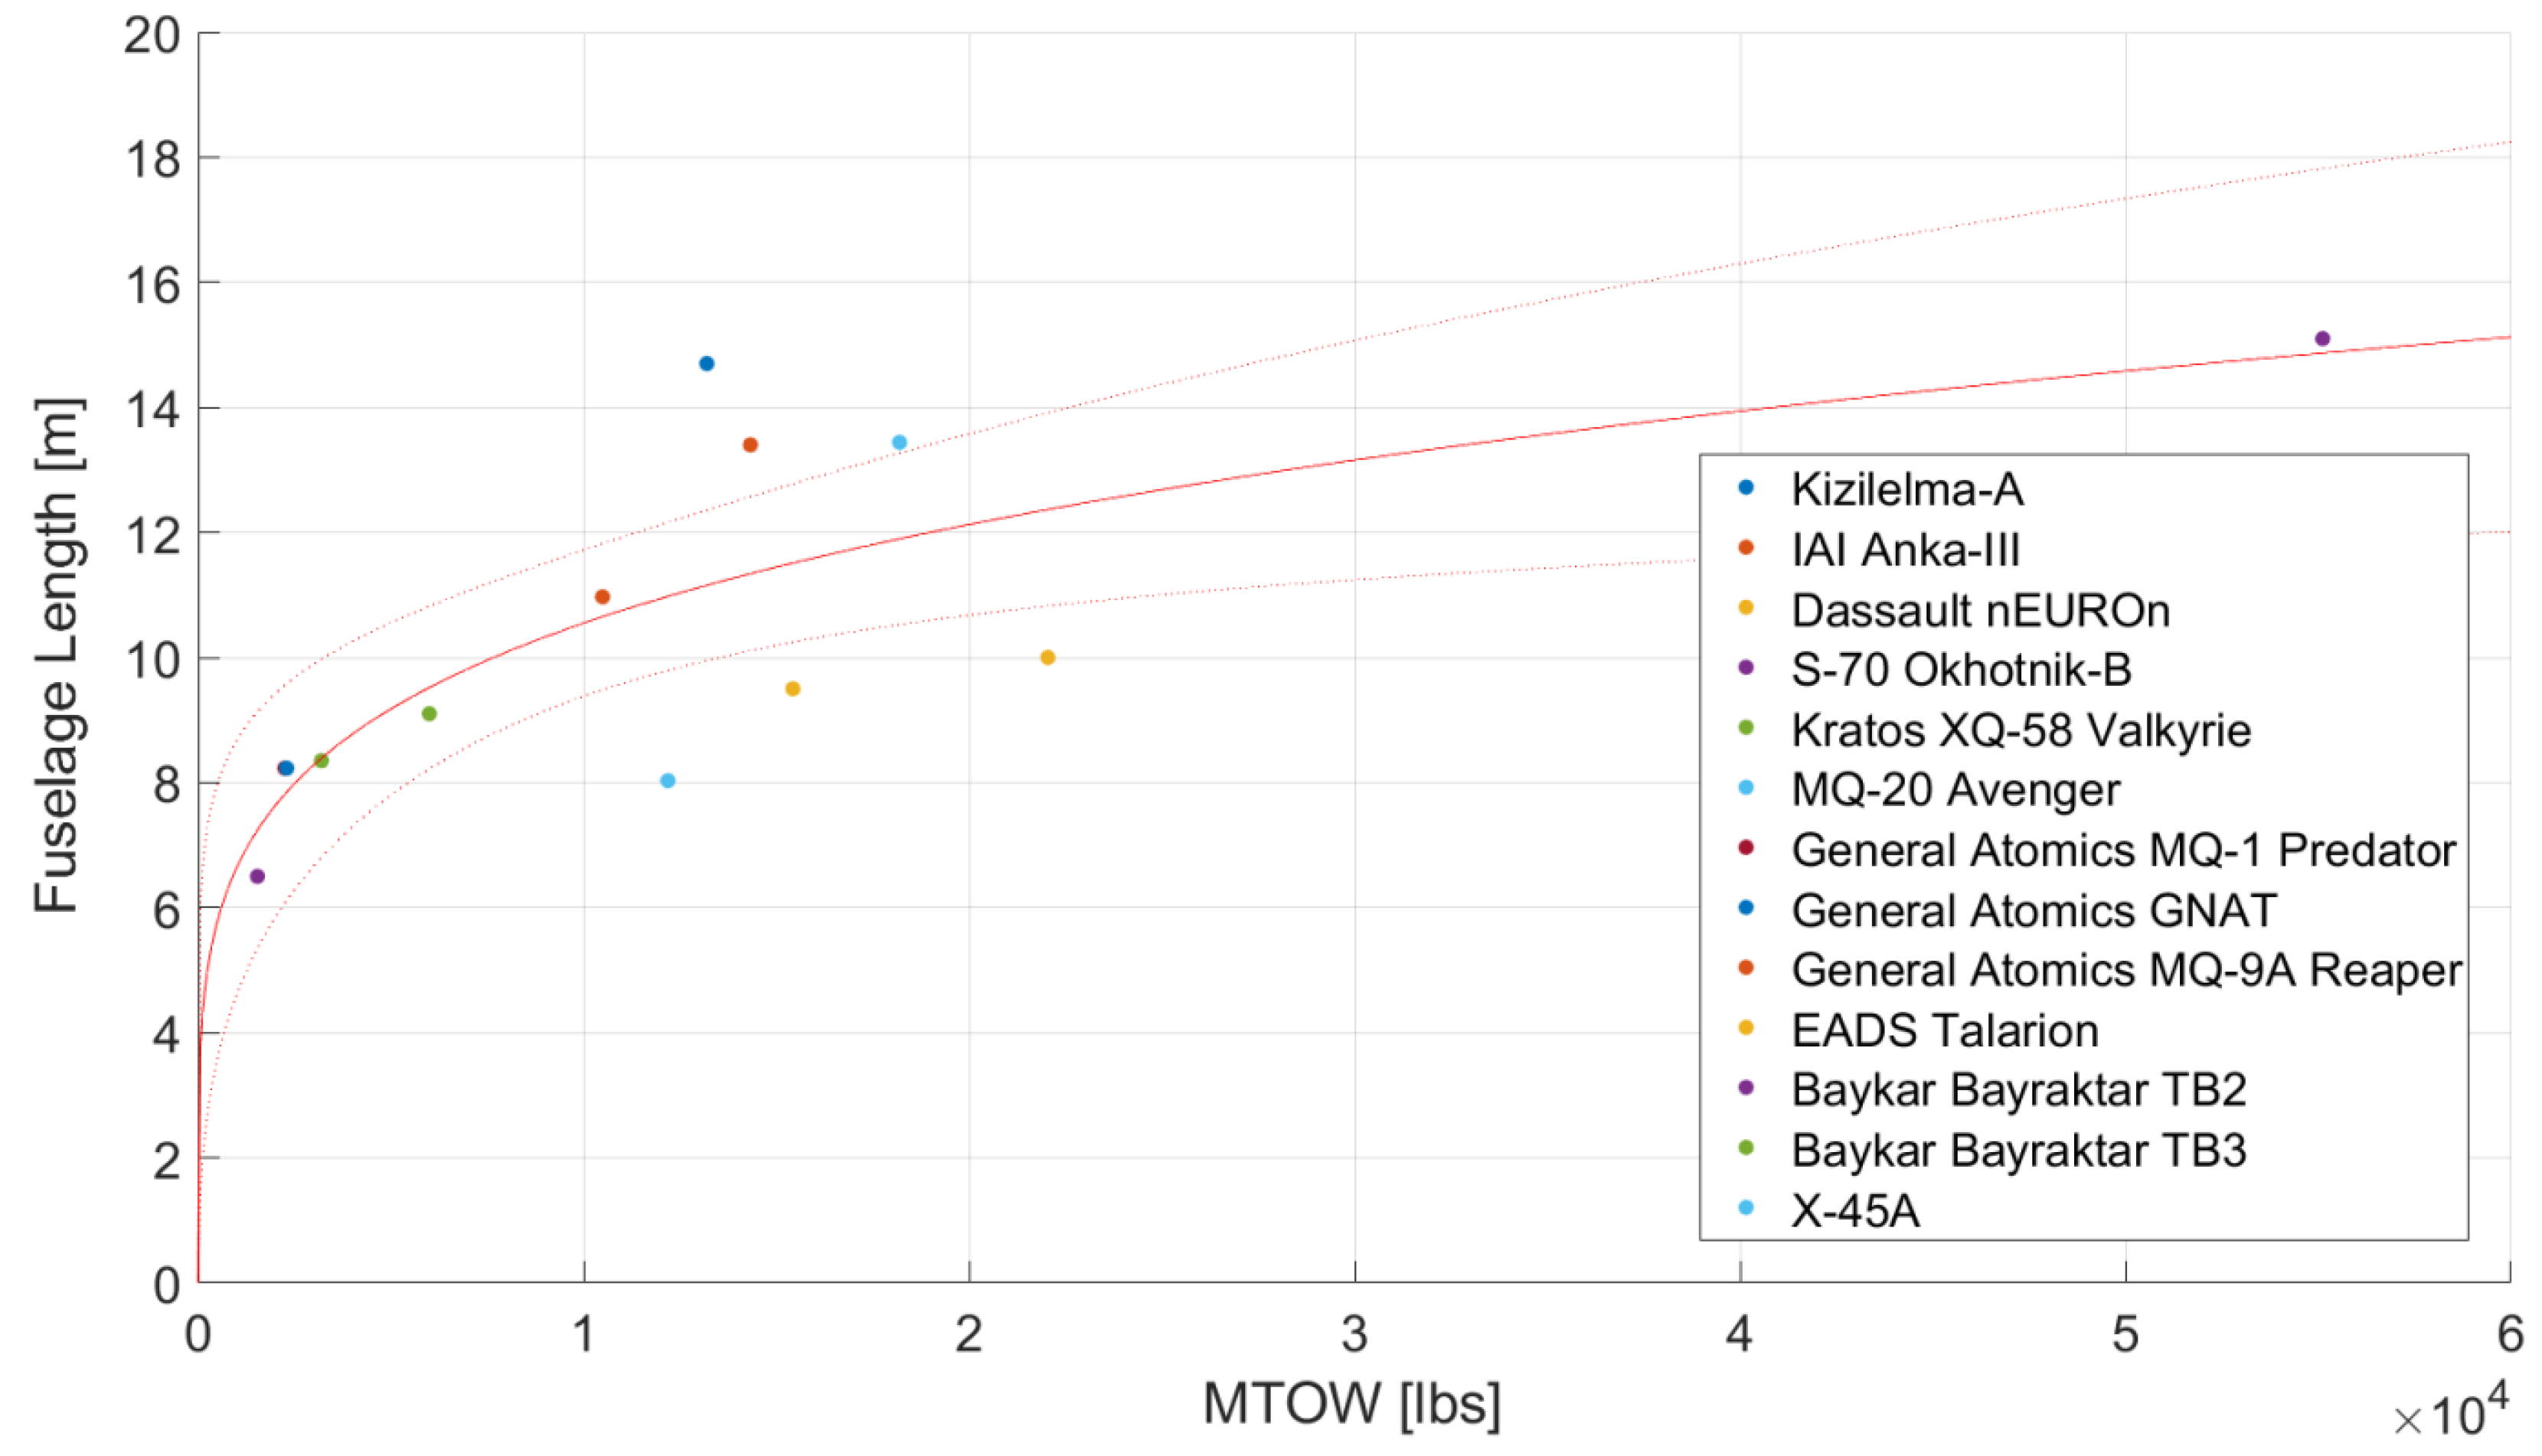
Table 1.
Specifications of existing developmental UCAV models.
Table 1.
Specifications of existing developmental UCAV models.
| Model | Configuration | MTOW [lb] | Empty Weight [lb] | Max. Speed [kts] | Payload [lb] | Percentage of MTOW | Length-to-Wingspan Ratio |
|---|
| Anka-III [3] | Flying Wing | 14,330 | - | 425–450 | 1653 | 11.5% | 1.22 |
| CATS Warrior [4] | Conventional | 4630 | - | Mach 0.9 | - | - | |
| Kizilelma-A [5] | Canard | 13,200 | - | 590 | 3300 | 25% | 1.51 |
| MQ-28 Ghost Bat [6,7,8] | Conventional | - | - | 600 | - | - | 1.60 |
| nEUROn [9] | Flying Wing | 15,432 | 10,803 | 529 | 1014 | 6.6% | 0.76 |
| S-70 Okhotnik-B [10,11,12] | Flying Wing | 55,116 | - | 540 | 4410–6172 * | 8.0–11.2% | 0.79 |
| X-45A [13,14] | Hybrid | - | 8000 | 533 | - | - | 0.78 |
| XQ-58 Valkyrie [15,16,17] | Conventional | 6000 | 2500 | 566 | 1200 | 20% | 1.20 |
Table 2.
Initial design requirements for the “Tísis” UCAV.
Table 2.
Initial design requirements for the “Tísis” UCAV.
| Parameter | Target Quantity | Note |
|---|
| Gross Weight | 1000 kg ± 10% | Initial Requirement |
| Empty Weight | - | To Be Determined |
| Dash Ceiling | 5000 ft | - |
| Cruise Ceiling | 30,000 ft | - |
| Dash Speed | Mach 0.90 | At Dashing Altitude |
| Cruise Speed | Mach 0.80 | At Service Altitude |
| Range | 300 Nautical Miles | - |
| Loitering Endurance | 20 min | - |
| Payload Weight | >20% | Percentage of MTOW |
| Take-off Groundrun Distance | ≤1000 ft | MIL-STD-3013A |
| Total Landing Distance | ≤1000 ft | MIL-STD-3013A |
| Climb Duration | 10 min | Clean Configuration |
| Engine Type | Turbofan | - |
Table 3.
Considered quantities for the initial sizing in all mission phases.
Table 3.
Considered quantities for the initial sizing in all mission phases.
| i. | Mission Phase | (lbs/hr/lbf) | | Fuel Ratio |
|---|
| 1 | Engine Warm-up | - | - | 0.99 |
| 2 | Taxiing | - | - | 0.99 |
| 3 | Take-off | - | - | 0.99 |
| 4 | Climb | - | - | 0.97 |
| 5 | Cruise-out | 0.7392 | 5.50 | 0.952 |
| 6 | Loiter | 0.7000 | 9.00 | 0.9619 |
| 7 * | Descend-1 | - | - | 1.00 |
| 8 * | Dash-out | 0.8000 | 5.50 | 0.9884 |
| 9 | Drop-off | - | - | 1.00 |
| 10 | Strafing | 0.9000 | 4.00 | 0.9814 |
| 11 | Dash-in | 0.8000 | 5.50 | 0.9884 |
| 12 | Climb | - | - | 0.97 |
| 13 | Cruise-in | 0.7392 | 5.50 | 0.9511 |
| 14 | Descend-2 | - | - | 0.9925 |
| 15 | Landing and Engine Switch-off | - | - | 0.995 |
Table 4.
Initial sizing results for 3 cases of MTOW.
Table 4.
Initial sizing results for 3 cases of MTOW.
| | Run 1 | Run 2 | Run 3 |
|---|
| | [lb] | [kg] | [lb] | [kg] | [lb] | [kg] |
|---|
| | | | | | |
| | | | | | |
| | | | | | |
| | | | | | |
| | | |
Table 5.
Concentrated results of the parameter sensitivity analysis.
Table 5.
Concentrated results of the parameter sensitivity analysis.
| Parameter | Breguet Partials (lbs/Unit) |
|---|
| Range Case | Endurance Case |
|---|
| Range R [nautical miles] | Cruise-out | | – |
| Cruise-in | | |
| Dash-out | | |
| Dash-in | | |
| Endurance E [hours] | Loitering | – | |
Specific Fuel Consumption
[lb/lbf/h] | Cruise-out | | – |
| Cruise-in | | |
| Dash-out | | |
| Dash-in | | |
| Loitering | – | |
| (L/D) | Cruise-out | | – |
| Cruise-in | | |
| Dash-out | | |
| Dash-in | | |
| Loitering | – | |
Table 6.
Standard values of the increase in parasite drag coefficient and the change in Oswald’s coefficient with deployed HLD and landing gear [
21].
Table 6.
Standard values of the increase in parasite drag coefficient and the change in Oswald’s coefficient with deployed HLD and landing gear [
21].
| Layout | | Oswald’s Coefficient e |
|---|
| Clean Flight | 0.0 | 0.85 |
| HLD—Take-Off Configuration | 0.010–0.020 | 0.80 |
| HLD—Landing Configuration | 0.055–0.075 | 0.75 |
| Landing Gear Deployed | 0.015–0.025 | No effect |
Table 7.
Estimated increase in parasitic drag coefficient due to compressibility [
21].
Table 7.
Estimated increase in parasitic drag coefficient due to compressibility [
21].
| Flight Speed (knots) | Altitude (feet) | |
|---|
| 481.65 (Mach 0.80) | 30,000 | 0.0010 |
| 595.42 (Mach 0.90) | 5000 | 0.0025 |
Table 8.
Drag polars and Oswald’s coefficient for all flight phases of interest.
Table 8.
Drag polars and Oswald’s coefficient for all flight phases of interest.
| Phase | Oswald’s Coefficient e | Drag Polars |
|---|
| |
|---|
| Take–Off | 0.80 | 0.0536 | 0.0796 |
| Landing | 0.75 | 0.0686 | 0.0849 |
| Cruise | 0.85 | 0.0196 | 0.0749 |
| Dash | 0.85 | 0.0211 | 0.0749 |
Table 9.
Minimum required wing reference area and engine thrust along with the prevailing (T/W) and (W/) ratios.
Table 9.
Minimum required wing reference area and engine thrust along with the prevailing (T/W) and (W/) ratios.
| Iteration | | | | |
|---|
| Input | Calculated | [] | [] |
|---|
| #1 | 0.6928 | 50.0000 | 35.6428 | 1680.22 | 68.04 |
| #2 | 0.6119 | 35.6428 | 35.6428 | 1483.95 | 68.04 |
Table 10.
Reviewed candidate LBR turbofan engines for the UCAV.
Table 10.
Reviewed candidate LBR turbofan engines for the UCAV.
| Engine Model | Specifications |
|---|
| Length (in.) | Diameter (in.) | Max. Thrust (lbf) | Dry Weight (lb) | SFC (lb/lbf/h) | Bypass Ratio |
|---|
| GE-Honda HF120 [23] | 59.5 | 30.51 | 2095 | 466 | <0.7 | 2.9:1 |
| PBS TJ200 [24] | 27.74 | 9.68 | 512.5 | 61.73 | – | – |
| PW615 [25] | 49.5 | 30.0 | 1460 | 308.6 | – | 2.8:1 |
| PW617 [26] | 54.0 | 30.0 | 1891 | 379.2 | – | 2.7:1 |
| Williams FJ33-5A [27] | 47.9 | 24.75 | 1846 | 319 | 0.486 | – |
| Jahesh-200 [28] | – | – | 1543.2 | 459.3 | ∼0.486 | - |
Table 11.
Ideal lift coefficient at cruise and maximum required lift coefficient for the UCAV.
Table 11.
Ideal lift coefficient at cruise and maximum required lift coefficient for the UCAV.
| Lift Coefficient | Mean Quantity |
|---|
| Cruise-Out | Cruise-In | Dash-Out | Dash-In |
|---|
| Aircraft ideal () | | | | |
| Wing ideal () | | | | |
| Airfoil ideal () | 0.1300 | | | |
| Aircraft Max. () | |
| Wing Max. () | |
| Airfoil Gross Max. () | |
| Lift-coefficient change due to HLD () | |
| Maximum lift coefficient () | 1.5392 |
Table 12.
Prevailing candidate airfoils’ aerodynamic performance produced by XFLR5 during cruise. The stall quality is described when simulated in the ‘approach’ conditions.
Table 12.
Prevailing candidate airfoils’ aerodynamic performance produced by XFLR5 during cruise. The stall quality is described when simulated in the ‘approach’ conditions.
| Airfoil | | | | | | | Stall Quality |
|---|
| NACA 1410 | 0.00505 | | | | 132.32 | 6.34 rad−1 | Moderate |
| NACA (A)-015 | 0.00448 | | | | 125.38 | 6.09 rad−1 | Docile |
| NACA 63-412 | 0.00413 | | | | 123.99 | | Docile |
| NACA 652-415 | 0.00361 | | | | 142.06 | | Docile |
| NACA 65-410 | 0.00435 | | | | 127.03 | | Docile |
| NASA SC2-0410 | 0.00497 | | | | 116.73 | | Sharp |
Table 13.
The aoa where each wing produces the ideal lift coefficient during dash and cruise.
Table 13.
The aoa where each wing produces the ideal lift coefficient during dash and cruise.
| Wing | aoa at Dash | aoa at Cruise |
|---|
| () | () |
|---|
| NACA 65-410 | | |
| NACA 65(2)-415 | | |
| NACA 63(2)A-015 | | |
Table 14.
Concentrated main wing specifications.
Table 14.
Concentrated main wing specifications.
| Wing Parameter | Nomenclature | Value |
|---|
| Aspect Ratio | AR | 5.0 |
| Leading Edge Sweep Angle | | 37.3° |
| Quarter Chord Sweep Angle | | 33.6° |
| Taper Ratio | | 0.35 |
| Wing Span | b | 18.444 ft |
| Mean Geometric Chord | C or | 3.689 ft |
| Mean Aerodynamic Chord | MAC | 3.974 ft |
| Wing Reference Area | | |
| Root Chord | | 5.465 ft |
| Tip Chord | | 1.913 ft |
| Max. Thickness-to-Chord Ratio (Root) | | 0.12 |
| Max. Thickness-to-Chord Ratio (Tip) | | 0.11 |
| Airfoil Section | – | NACA A-015 |
| High-Lift Devices’ Specifications |
| Type | – | Single-slotted flaps |
| Flap-to-Wing Chord Ratio | | 0.25 |
| Span | | (0.68–0.22)·b/2 |
| Deflection at Take-off | | |
| Max. Deflection | | |
Table 15.
Concentrated V-tail specifications.
Table 15.
Concentrated V-tail specifications.
| Parameter | Nomenclature | Quantity |
|---|
| V-tail MGC | | 1.958 ft |
| V-tail MAC | | 2.078 ft |
| Tail span | | 7.85 ft |
| Tail projection span | | 6.546 ft |
| Tail fin span | | 3.925 ft |
| Root chord | | 2.797 ft |
| Tip Chord | | 1.118 ft |
| Taper ratio | | 0.40 |
| Tail incidence | | |
| Planform area | | |
| V-tail aspect ratio | | 2.79 |
| Dihedral angle | | |
| Airfoil section | − | NACA 63A-010 |
| V-tail sweep angle | | |
| Thickness-to-chord ratio | | 10% |
| 9% |
| Tail type | − | Fixed or adjustable |
Table 16.
Center of mass estimation for all individual components—final iteration.
Table 16.
Center of mass estimation for all individual components—final iteration.
| UAV Component | Weight Fraction (100% ) | Mass [lb] | Relative Distance from Reference Point (%) |
|---|
| Engine | 13.15% | 319 | 72% |
| Fuel | Wing-stored | 26.85% | 651.13 | 58.93% |
| Fuselage-stored | 2.88% | 69.74 | 72% |
| Payload | Subsystems | 2.58% | 62.65 | 30% |
| Disposable | 18.30% | 443.80 | 50% |
| Miscellaneous | 0.65% | 15.66 | 90% |
| Fuselage | 8.36% | 202.81 | 55% |
| Main Wing | 6.00% | 145.51 | 59.37% |
| Tail | 0.63% | 15.11 | 91.84% |
| Landing System | 4.00% | 97.00 | 55% |
| Standard Equipment | 16.53% | 400.93 | 38% |
Table 17.
Landing system geometry restriction angles.
Table 17.
Landing system geometry restriction angles.
| Angle | Nomenclature | Calculated Value | Restriction |
|---|
| Overturn Angle | | | ≥ |
| (Stringiest) | | ≤ |
| | ≥ |
| Tip-back Angle | | | ≥ |
| Tail-strike Angle | | | ≥ |
| Wing-strike Angle | | | ≥ |
Table 18.
UCAV specifications.
Table 18.
UCAV specifications.
| Parameter | Quantity |
|---|
| Wing Configuration | Conventional |
| Wing Type | Fixed |
| High-lift Devices | Single-slot TE Flaps |
| Wing’s Geometrical Specifications | See Table 14 |
| HLD Geometrical Specifications | See Table 14 |
| Tail Configuration | V-Tail |
| Tail’s Geometrical Specifications | See Table 15 |
| Fuselage Length (ft) | 22.50 |
| Fuselage Width (ft) | 3.50 |
| Landing System Configuration | Tricycle |


