1. Introduction
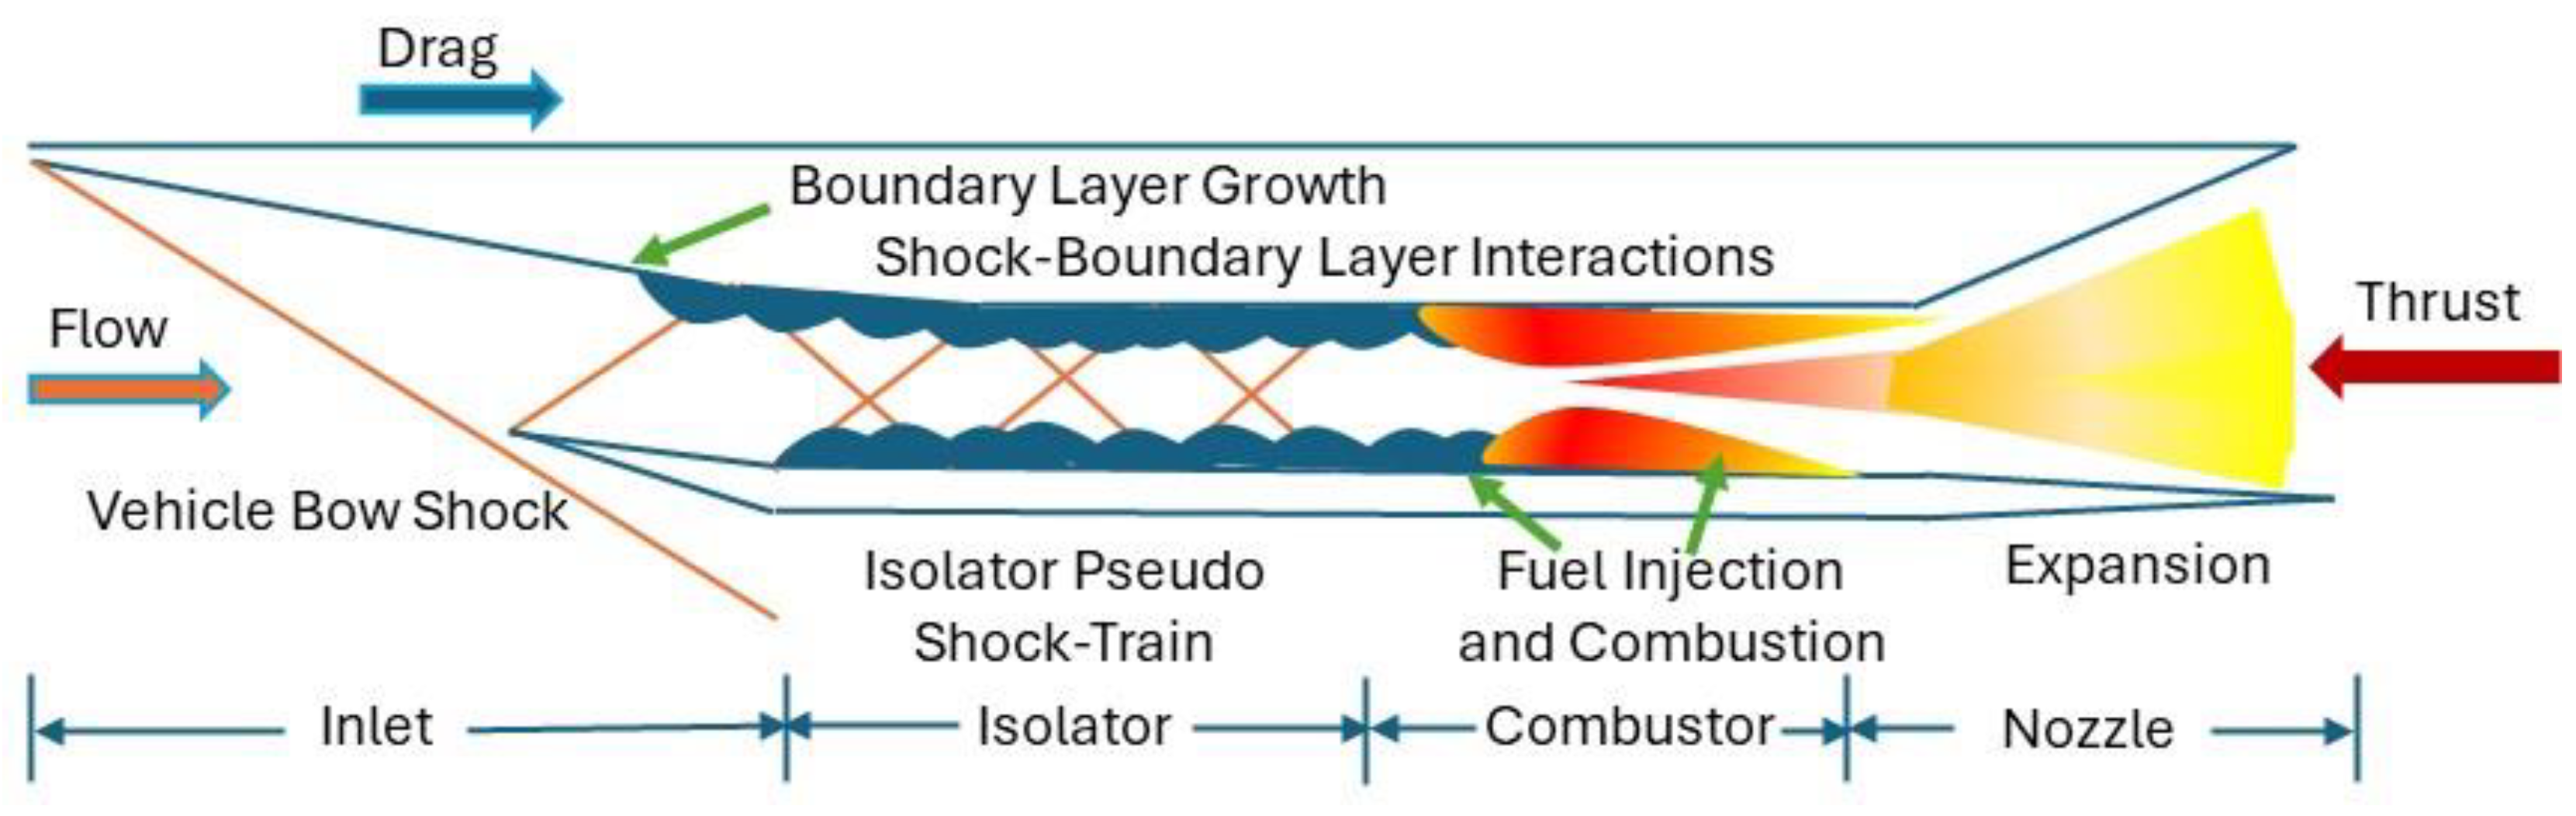
A dual-mode scramjet engine is composed of four main components: inlet, isolator, combustor, and exit nozzle. The inlet captures the air mass for the engine and conditions (compresses) the flow for subsequent combustion. The role of the isolator is to separate the combustion effects (i.e., combustion-induced pressure rise) from the inlet, providing sufficient margin to prevent engine unstart [
1]. The combustor contains the fuel injection devices through which fuel is introduced and subsequently mixed with the incoming air, enabling combustion. Finally, the nozzle expands the resulting exhaust gases to produce thrust for the vehicle. A cut view of a scramjet flow path is shown in
Figure 1. At low hypersonic Mach numbers, the heat release associated with the combustion process can lead to (or at least approach) thermal choking of the engine flow, resulting in elevated pressure levels in the combustor. The adverse pressure gradient that forms under these conditions leads to the formation of a pre-combustion shock train within the isolator. This flow is characterized by regions of massive flow separation due to the adverse pressure gradient and the multiple shock–boundary layer interactions that result from this shock system. The isolator length required to contain the pressure rise induced by the combustion processes is of critical importance for the engine design, since this drives the size and weight of the isolator section [
2,
3]. The shock pattern that develops in the isolator for given isolator inflow conditions varies as a function of the ratio of the backpressure to the inflow static pressure. At a high backpressure ratio, the boundary layer separates, and a pattern of oblique shocks form a shock train within the isolator. Complex flow fields have been investigated both numerically and experimentally [
4,
5,
6].
The complicated flow field in a scramjet isolator has been the subject of intense interest and study for several decades. In addition, many features of this flow field also occur in supersonic wind tunnel nozzles and diffusers, and those cases have been studied for even longer. The literature on these topics is rich and includes several detailed reviews [
7], but many key features are not well understood.
Figure 2 illustrates the main features of such a flow in a nominally steady situation, and the most common nomenclature is also listed. The top portion of the figure shows contours of density gradient magnitude in the center plane of a duct with a rectangular cross-section. The corresponding static pressure variation along the length of this duct is shown in the lower part of
Figure 2, showing the shock-train region followed by the mixing region.
A key feature of these flows that has great scientific and practical interest is the sudden unsteady disruption of the flow leading to scramjet isolator, inlet, or wind tunnel “unstart”. In each case, the designed flow pattern changes drastically, so that operability is put at risk and the intended performance can incur drastic loss. Therefore, addressing isolator unstart is very important for estimation of the operability of dual-mode ramjets/scramjets. One explanation for the unstart mechanism is the unexpected changes in wall and boundary conditions, including the following:
An increase in pressure downstream of the inlet/isolator that cannot be supported by the inlet/isolator shock system;
Pressure perturbations due to combustion dynamics downstream depending on the Mach number.
Distortion of the incoming inlet flow due to unexpected changes in the angle of attack or the ingestion of exhaust gases;
Changes in wall conditions, such as removal of or damage to thermal protection coating, which create cavities causing shock waves and hot spots;
The incoming Mach number dropping below the starting value, thereby effectively decreasing the throat area to a value below that which would choke the throat.
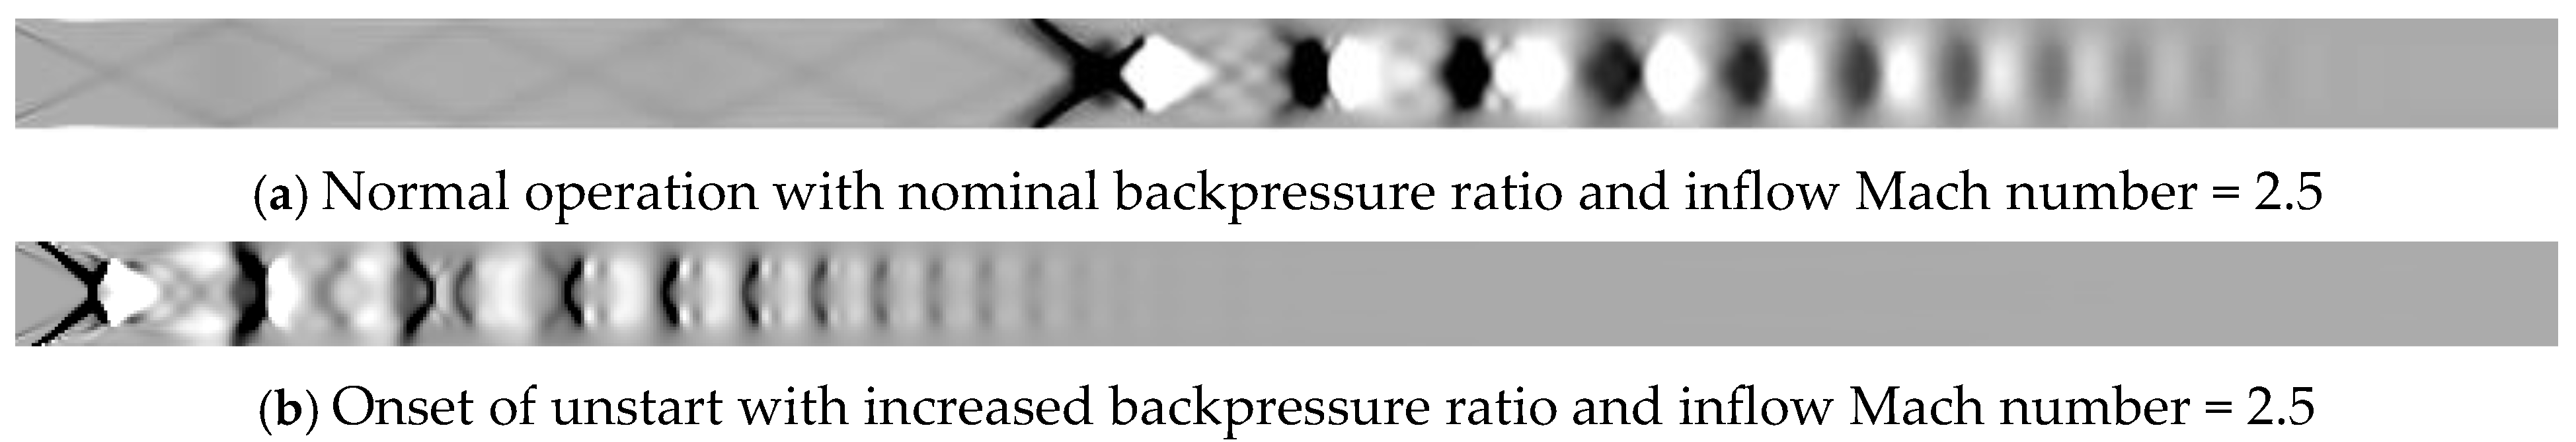
As an example, the visual demonstration of pseudo-normal shock train in the nozzle–isolator assembly (that was utilized in this work) is shown in
Figure 3, for both a started case and a case with onset of unstart. These figures show divergence of the velocity contours at the sidewall of the three-dimensional rectangular isolator with an isolator entrance Mach number of 2.5. In
Figure 3a, the pseudo shock train is in the central region of the isolator whereas in
Figure 3b, the pseudo shock train has moved upstream to the extent that the foot of the leading oblique shock is at the isolator entrance. The shocks shown in this case are sharper and thinner than in the case shown in
Figure 3a. Additionally, the length of the pseudo shock train has reduced significantly. While not visible in these plots, there is significant stagnation pressure loss post the pseudo shock train in the case of
Figure 3b compared with the case in
Figure 3a. Each of these phenomena is an indicator that a slight change in inflow Mach number or backpressure can result in formation of normal shock at the isolator entrance, resulting in massive increase in static pressure, throttling of mass flow rate through the isolator, and maximum stagnation pressure loss, which could lead to isolator unstart.
Several experimental studies have aimed at understanding the mechanism of unstart. A model scramjet in a Mach 4 wind tunnel was used in reference [
8]. Reference [
9] used a similar experimental model in the same facility as [
8] and induced unstart by increasing the inlet ramp angle or closing the throttling flap. In another study [
10], a model inlet/isolator was mounted on the test-section floor of a Mach 4.9 wind tunnel and unstart was triggered by raising a mechanical flap located downstream of the isolator. References [
11,
12] investigated the unstart phenomena initiated by jet injection downstream of an inlet/isolator in a Mach 5 wind tunnel. In these studies, wall pressure measurement or planar visualization such as Schlieren photography and particle image velocimetry (PIV) were used to characterize the unstart dynamics. Despite being focused on isolator shock physics, the above-mentioned experimental research set-ups had isolator inflow Mach numbers higher than 2.5 and aspect ratios much smaller than 2:1, which are the Mach number and aspect ratio for a dual-model ramjet/scramjet operation.
Computational fluid dynamics simulations (such as [
13,
14,
15,
16,
17]) have been used to study isolator flow physics and the unstart phenomenon, to carry out performance estimates for scramjet engines, and more recently, to design experiments to study various components including isolator dynamics [
17]. RANS has been utilized as a practical method for this purpose while LES and DNS have occasionally been utilized for understanding/evaluation of specific phenomena not captured by RANS. This is especially true with hypersonic air-breathing propulsion systems due to the environment, scale, and duration limitations of ground-test facilities [
17].
It is reasonable to state that there are several major gaps in understanding how changes in operational variables at the isolator boundaries quantitatively impact isolator operability metrics and unstart physics. The research presented in this paper aims to address these gaps by achieving the following:
In this article, NASA LaRC IDRL has been utilized as the demonstration case. In this case, inflow Mach number and backpressure ratio were identified as the varying operational parameters.
As mentioned earlier, onset of unstart and potential loss of isolator operability in the full scramjet flow path during flight can occur due to additional factors including pressure perturbations at the isolator exit due to combustion dynamics, distortion of the incoming inlet flow due to an unexpected change in the angle of attack or the ingestion of exhaust gases, and/or changes in wall conditions such as damage to or removal of thermal protection coating. These effects are not included in the present study as it focuses on the isolator alone. However, determination of the effects of variance in operating conditions and accounting for these in CFD-based workflow processes can provide strong support for the uncertainty propagation and quantification process for scramjet isolator operability, as well as for assessing empirical/semi-empirical models of controller calibration for scramjet-powered flight vehicles.
2. Technical Approach
A. Documentation of “onset of unstart” Metrics
The unstart phenomenon has been recognized for decades and yet, there has been a lack of quantifiable metrics for and a consistent definition of unstart. In the available literature, it is referred to as “unstart event or process”, “onset of unstart”, or “beginning of unstart”. There are varied definitions of unstart including “pressure-determined unstart” versus “Schlieren-determined onset of unstart”, and “pseudo shock train” vs. “separated (side-wall boundary) shock”. Occasionally, fully supersonic and high-compression systems have been studied for the unstart characterization, which are far from the operability limits of the dual-mode scramjet engines. In terms of nomenclature, unstart is not limited to a specific system or subsystem. For instance, unstart has been used to describe limiting mass flow rate (due to formation of normal shock—the strongest shock formation resulting in throat-like formation anywhere in the flowpath) in scramjet inlets (called inlet unstart) [
18,
19,
20], high-speed wind-tunnels [
21], and in scramjet isolators [
22]. In each case, unstart is an undesirable phenomenon since it causes reduction in total pressure recovery, mass flow rate of air through the flowpath of the system or subsystem, massive boundary-layer separation, and oscillations in pressure. In the case of propulsion systems, it results in significant reduction in thrust production. For the purposes of the current application, which is an isolator for a dual-mode scramjet, metrics for onset of unstart are defined via the following physical quantities:
Shock positions and/or shock speeds;
Boundary-layer separation region;
Shock-train region (or length) with (1) variation of pressure in the axial direction and (2) variation of pressure over time;
Mach stem height;
Corner separation.
By monitoring the above-mentioned metrics and their inter-dependency for many isolators across a range of starting Mach numbers and aspect ratios, it may be possible to build universal criteria based upon above-mentioned metrics, which can be utilized for vehicle design as well as calibration curves for scramjet controller for in-flight operation.
B. Demonstration Case
An important decision in this study was the selection of a suitable test case to use to validate and refine the methods developed. In a scramjet, an inlet precedes the isolator and the flow at the isolator entrance has multiple aspects including Mach number, temperature profile, velocity, and pressure, which can change when the vehicle is flying at different speeds, altitudes, and/or angles of attack. However, most experimental ground-test facilities utilize a nozzle to generate high-speed flow at the isolator entrance. Therefore, the inflow variables at the isolator entrance can be limited in comparison with the flight vehicle. Moreover, many experimental ground-test facilities maintain tight control over the nozzle outflow conditions; therefore, the variability of inflow at the isolator entrance and the number of uncertain variables at the inflow differ greatly from flight applications.
For demonstration purposes, the NASA Langley IDRL experiment [
2,
3] was identified. This facility is known as a direct-connect facility; a nozzle provided supersonic flow at the isolator entrance. The Isolator Dynamics Research Laboratory (IDRL) at LaRC set up experiments with the goal to validate CFD models used to characterize the flow paths of scramjet isolators. The principal elements of the IDRL are the Mach 2.5 converging–diverging nozzle, the isolator section, and the backpressure plug, as shown in
Figure 4.
Following the nozzle, there is the 24-inch-long isolator test section, which is designed with a 1-inch by 2-inch cross-sectional flow area. The isolator test section is mechanically backpressured by a pressure plug to produce a backpressure isolator. The test section was fabricated with side walls to measure wall pressures. In this case, the ratio of supply pressure (Pa) and backpressure (Pb), known as the backpressure ratio (Pb/Pa), and Mach number at the isolator entrance are identified as two major variables impacting the shock–boundary layer interactions, which can vary during the operation of the isolator. In flight applications, backpressure ratio can surge due to thermal choking by heat release in the combustor, and inflow Mach number can vary significantly even when there are small changes in the angle of attack. Therefore, these two variables can have direct effects on the isolator’s shock physics. During the flight of an airbreathing hypersonic vehicle, there may be additional variable operating conditions such as vehicle velocity, flight path angle, angle of attack, and rate of change of angle of attack, among others. Similarly, there could be additional operating conditions in freejet test facilities such as flow distortion, temperature, and pressure perturbations at the isolator exit if the combustor is involved. These additional variables can also impact the onset of unstart. However, the current research focused on understanding isolator dynamics only when tested in a direct-connect facility and therefore, only the effects of backpressure ratio and inflow Mach number were evaluated.
C. VULCAN-CFD
The CFD simulations were carried out in VULCAN-CFD [
16], which is a Navier–Stokes flow solver for structured, cell-centered, multi-block grids that is maintained and distributed by the Hypersonic Air Breathing Propulsion Branch of the NASA Langley Research Center; the computational cost of propulsion flow analysis is reduced using special turbulent wall treatments, multigrid methods for elliptic and space marching schemes, and conditioning of the governing equations to reduce numerical stiffness. VULCAN-CFD can simulate two-dimensional, axi-symmetric, or three-dimensional problems on structured multi-block grid systems. A variety of PDE-based turbulence models are available (including explicit algebraic Reynolds stress models) for Reynolds-averaged simulations, one-equation and algebraic sub-grid closures (including dynamic variants) are available for large eddy simulations, and hybrid Reynolds-averaged/large eddy simulation capabilities are also present. A variety of robust upwind-biased algorithms exist for Reynolds-averaged simulations, and a low-dissipation numerical framework is available for scale-resolving simulations. VULCAN-CFD offers significant geometric flexibility; boundary conditions can be imposed on any boundary or boundary subset, and the code has continuous as well as non-continuous block-to-block interface capabilities. VULCAN-CFD also utilizes a flexible thermodynamic and kinetic model specification framework based on user-specified databases (many of these are standard formats utilized by the propulsion community). The working fluid can be simulated as a calorically perfect single component gas, a mixture of thermally perfect gases (with or without chemical reactions), or a mixture of gases in thermodynamic non-equilibrium (with or without chemical reactions). Chemical reactions can be simulated with both equilibrium chemistry and finite-rate reaction kinetics.
It has become increasingly accepted that RANS turbulence closure models demonstrate significant variability in terms of predictions of shock physics and shock–boundary layer interactions [
23,
24]. With this knowledge, the selection of turbulence closure model was made by comparison of calculated wall pressure values (at the top wall centerline and side wall centerline) with the time-averaged measured values as shown in reference [
17]. Wilcox’s 1998 turbulence closure model [
25] is a two-equation model (including equations for turbulent kinetic energy, k and specific dissipation rate, omega), which has been found to predict the behavior of attached compressible boundary layers subjected to adverse pressure gradients more accurately than the traditional turbulence kinetic energy-dissipation rate models. In Wilcox’s 1998 turbulence closure model, closure coefficients are functions of the flow variables. Due to these reasons, Wilcox 1998 was found to be most suited for the isolator dynamics calculations.
The solution methodology for these computational simulations was as follows. Incomplete LU (ILU) decomposition scheme was used with a CFL number of 100 for pseudo time marching. The low dissipation flux splitting scheme (LDFSS) described by Edwards [
26] was utilized for evaluation of inviscid fluxes with reconstruction of cell interface variables achieved via the Monotone Upstream-Centered Scheme for Conservation Laws (MUSCL). Flow variables were reconstructed by the MUSCL scheme. Koren’s flux limiter scheme was used to suppress spurious oscillations during this reconstruction process. The viscous fluxes were evaluated using a 2nd-order accurate central difference scheme. Sutherland’s law for kinematic viscosity was used with laminar and turbulent Prandtl numbers kept constant at 0.72 and 0.9, respectively.
3. Results and Discussion
A. Baseline Calculations of the IDRL Experiment
The IDRL back-pressured isolator was 24 inch long, 2 inch wide, and 1 inch high. The structured mesh dimensions for this isolator were 1000 × 80 × 104. The streamwise spacing was held fixed at 0.02 × isolator height (h) for the front half of the isolator to resolve the region where the shock train was expected to reside and was stretched in the second half of the isolator to a value of 0.05 h at the isolator exit. The maximum grid spacing in the vertical (y) and spanwise (z) directions was 0.02 h (adjacent to the planes of symmetry). The grid was split into a total of 1488 grid blocks with 95 percent load balance on 720 processors. The baseline case was identical to the earlier CFD calculations from the work of Baurle, Middleton, and Wilson, 2013 [
17] and Baurle and Axdahl [
27], except for backpressure ratio, which was 0.360 in the current work. The computational simulations included the following features:
3D RANS calculations with VULCAN-CFD. A quarter of the full test setup was performed with periodic boundary conditions applied on the lateral boundaries;
Grid sensitivity studies performed with three structured grids (Grid 1: 1.3 million, Grid 2: 10 million, and Grid 3: 85 million). It was found in a previous work [
28] that grid resolution with Grid 2: 10 million structured produced the same results as Grid 3: 85 million structured mesh, within measurement error;
Sutherland viscosity models;
A cross section of (1 × 2) was examined.
As noted earlier, multiple boundary conditions for this set-up have been published but, in this work, the boundary conditions for computational investigations were obtained from those published in Acharya et al. [
28,
29]. Also, the facility nozzle was not modeled in this work as the nozzle dimensions and geometry were not available. Due to the absence of a nozzle in this work, isentropic relations were utilized to calculate the total pressure and temperature at the nozzle exit by using the plenum conditions reported in earlier work. The nozzle exit conditions served as isolator entrance conditions in this current work. Likewise, backpressure of 304.51 kPa was obtained from measurements (by averaging the 20 surface pressure measurements taken around the periphery of the isolator duct at the x = 22 h station) when a pressure plug was used at the isolator exit. It should be noted here that RANS captured the time-averaged state of the fluid dynamics in the isolator, which was consistent with the measured values, which were the time-averaged values of wall pressure obtained from sensors mounted at multiple locations. The experimental configuration utilized in this work was designed to provide steady-state operation, but the implementation of a pressure plug to generate backpressure at the isolator exit could have contributed to initial transience and low-amplitude oscillations throughout the steady-state operation. Additionally, formation of flow reversal and separation due to shock–boundary-layer interactions can result in self-excited oscillatory behavior of the flow-field, which is also time-dependent. However, the comparisons shown in this work were made between the time-averaged measured and time-averaged computed wall pressures. For this reason, RANS was utilized for simulation of the time-averaged flow field in this isolator.
All variables were consistent between the two, other than the minor variation in total temperature at the entry. The initial and boundary conditions are shown in
Table 1. Both the entrance and exit boundary conditions for the isolator were varied so that Mach number and backpressure ratio (P
b/P
a) varied between 2.0 and 2.5, and 0.335 to 0.381, respectively. Density was calculated from the Mach number and static pressure at the inflow, using Mach number definition.
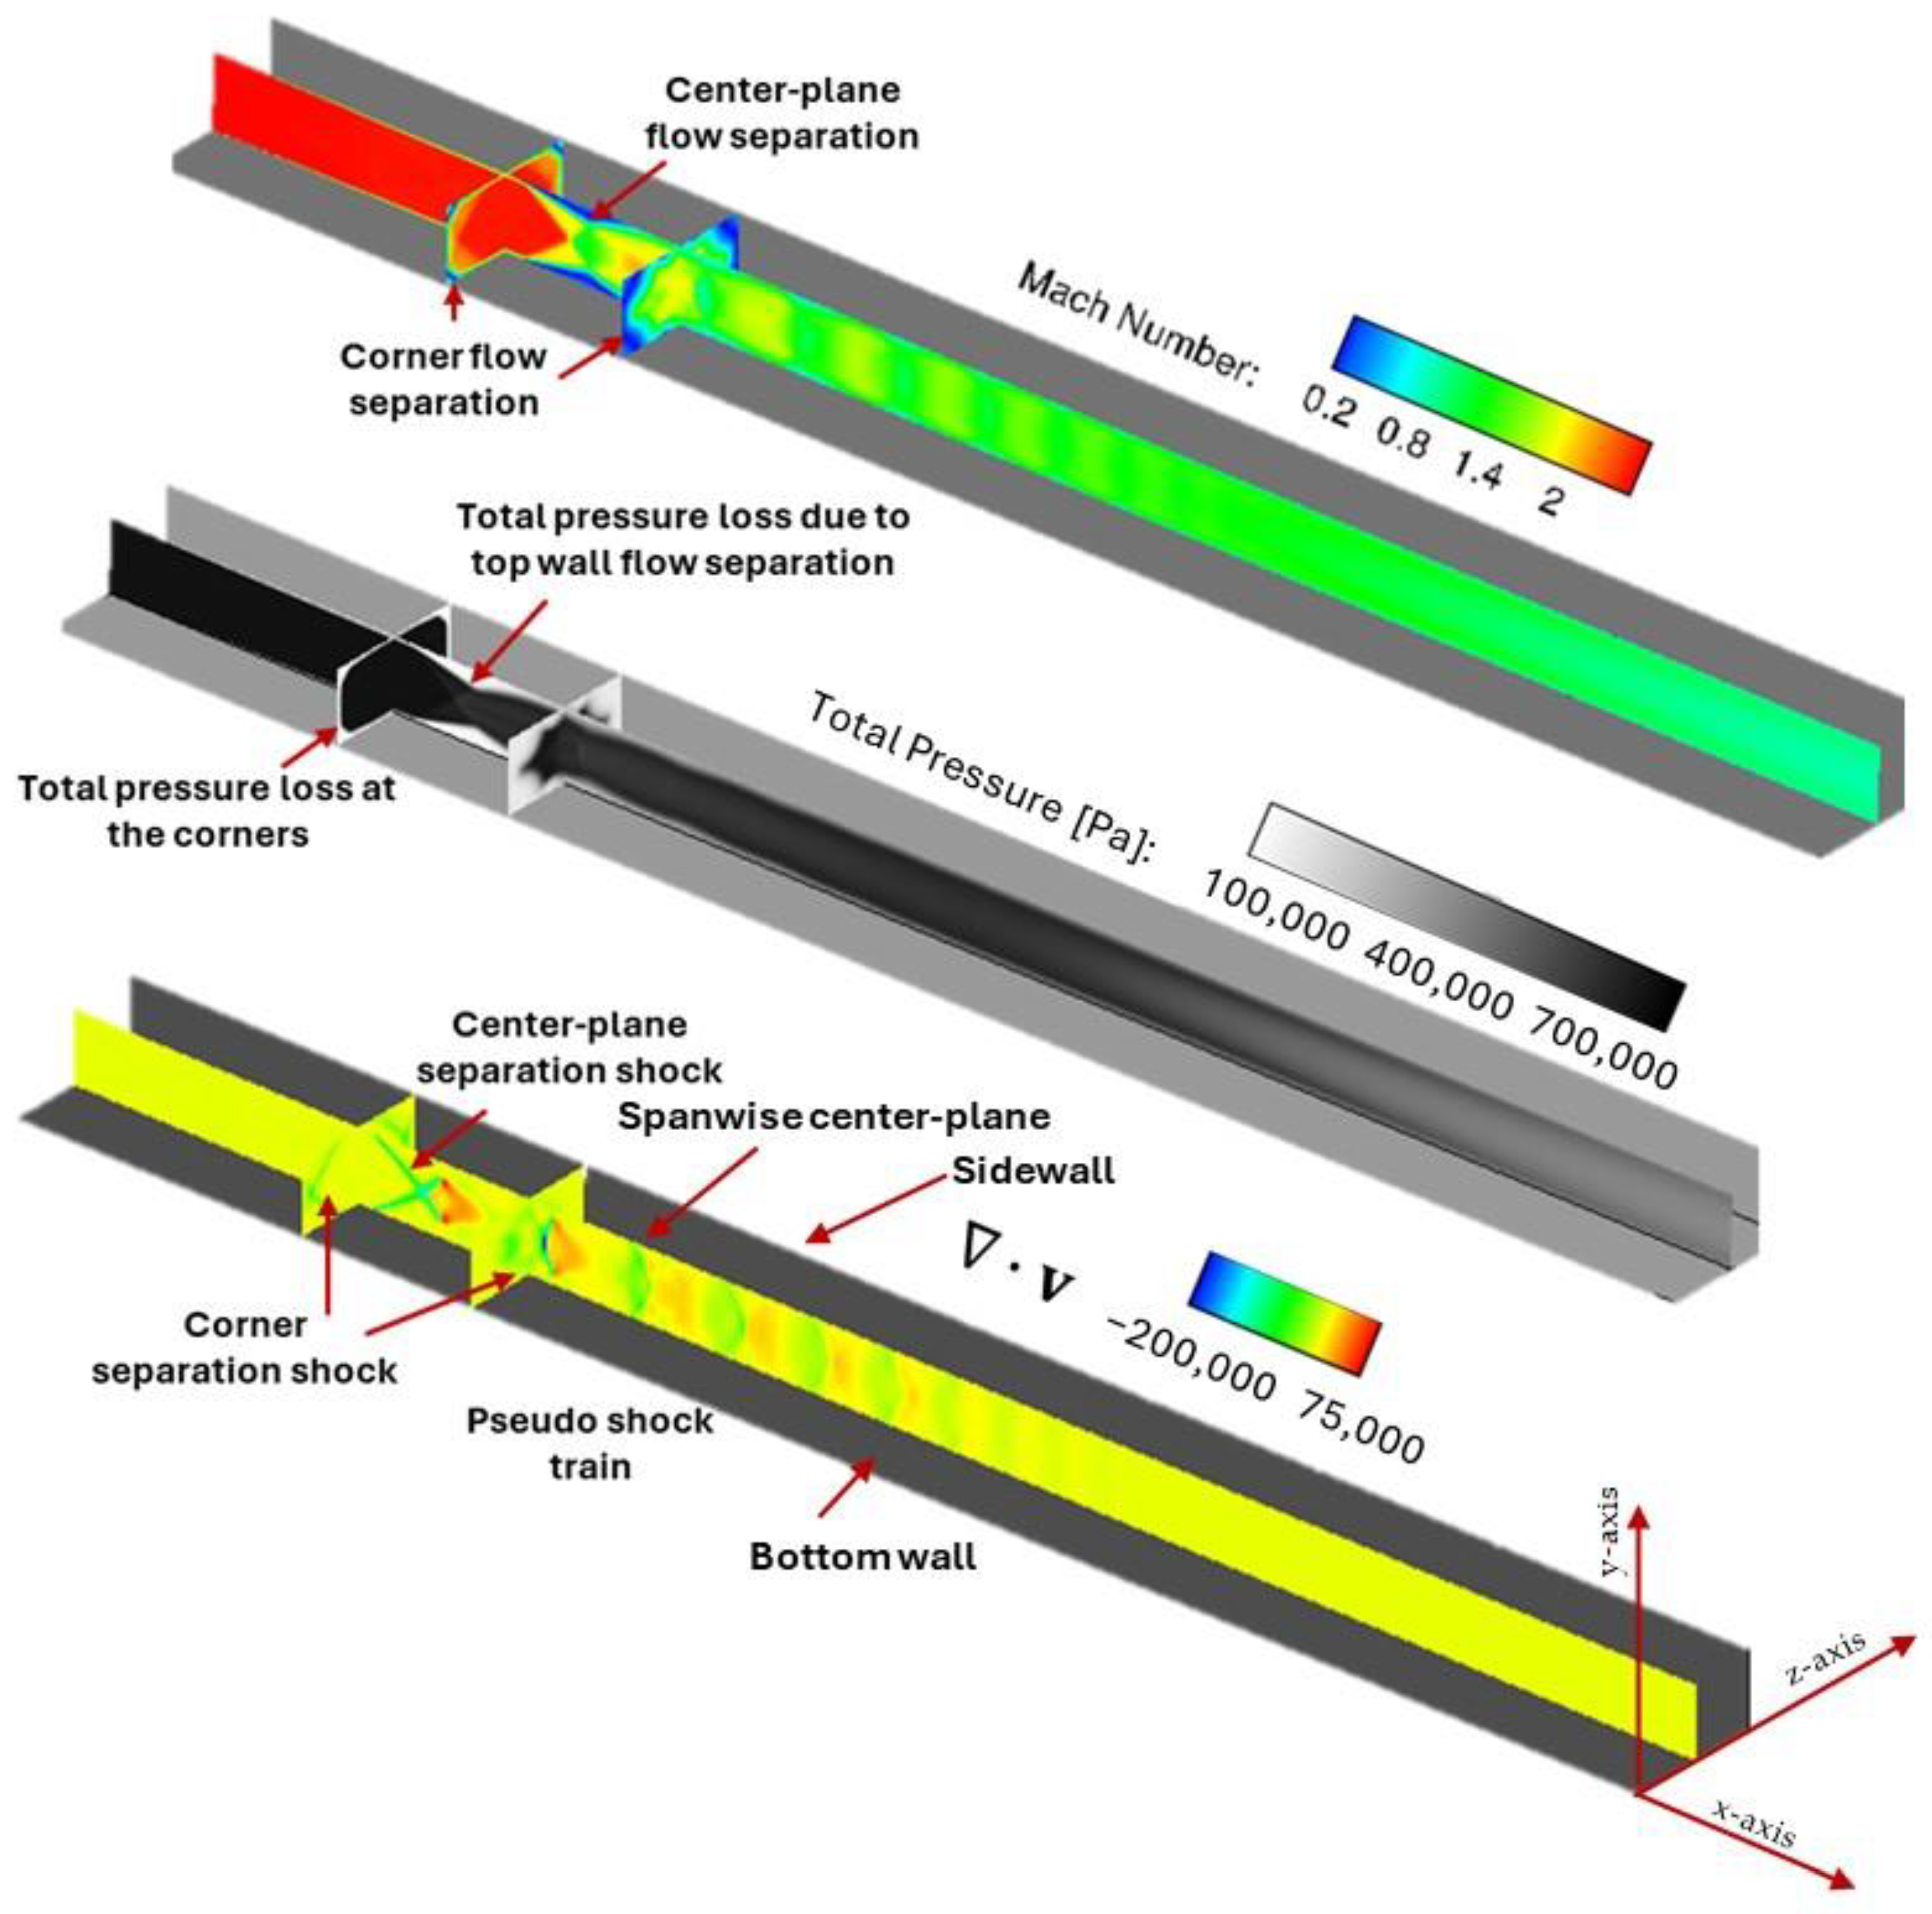
Contour plots of Mach number, total pressure, and divergence of velocity for the nominal operating conditions are shown in
Figure 5. Divergence of velocity is directly connected to the density gradient magnitudes as well as the transient change in density, which is why it has been utilized to show corner and center-plane shocks and pseudo shock train in the isolator. These results show the pseudo shock train inside the isolator, corner shock at the intersection of side-wall and top-wall, and center-plane separation shock, which are extremely relevant for studying the physics of isolator unstart. These calculations were performed for a backpressure ratio (P
b/P
a) of 0.360 with Mach 2.5 at the isolator entrance. The contours show that corner wall separation began before the center-plane flow separation occurred. Both phenomena caused flow blockage and therefore result in the formation of shocks, total pressure loss is used. In this case, the flow near the exit of the isolator remained supersonic despite the formation of the pseudo shock train, which changed depending upon the backpressure ratio and inflow Mach number. The lower plot in the figure shows the divergence of velocity contours; the spanwise center plane, side wall, and bottom wall are indicated. The top wall (not shown in the plot) was opposite the bottom wall. Transverse center planes were perpendicular to the spanwise center planes at y = 0 m. As shown in the subsequent results, the flow phenomena in this isolator are three-dimensional.
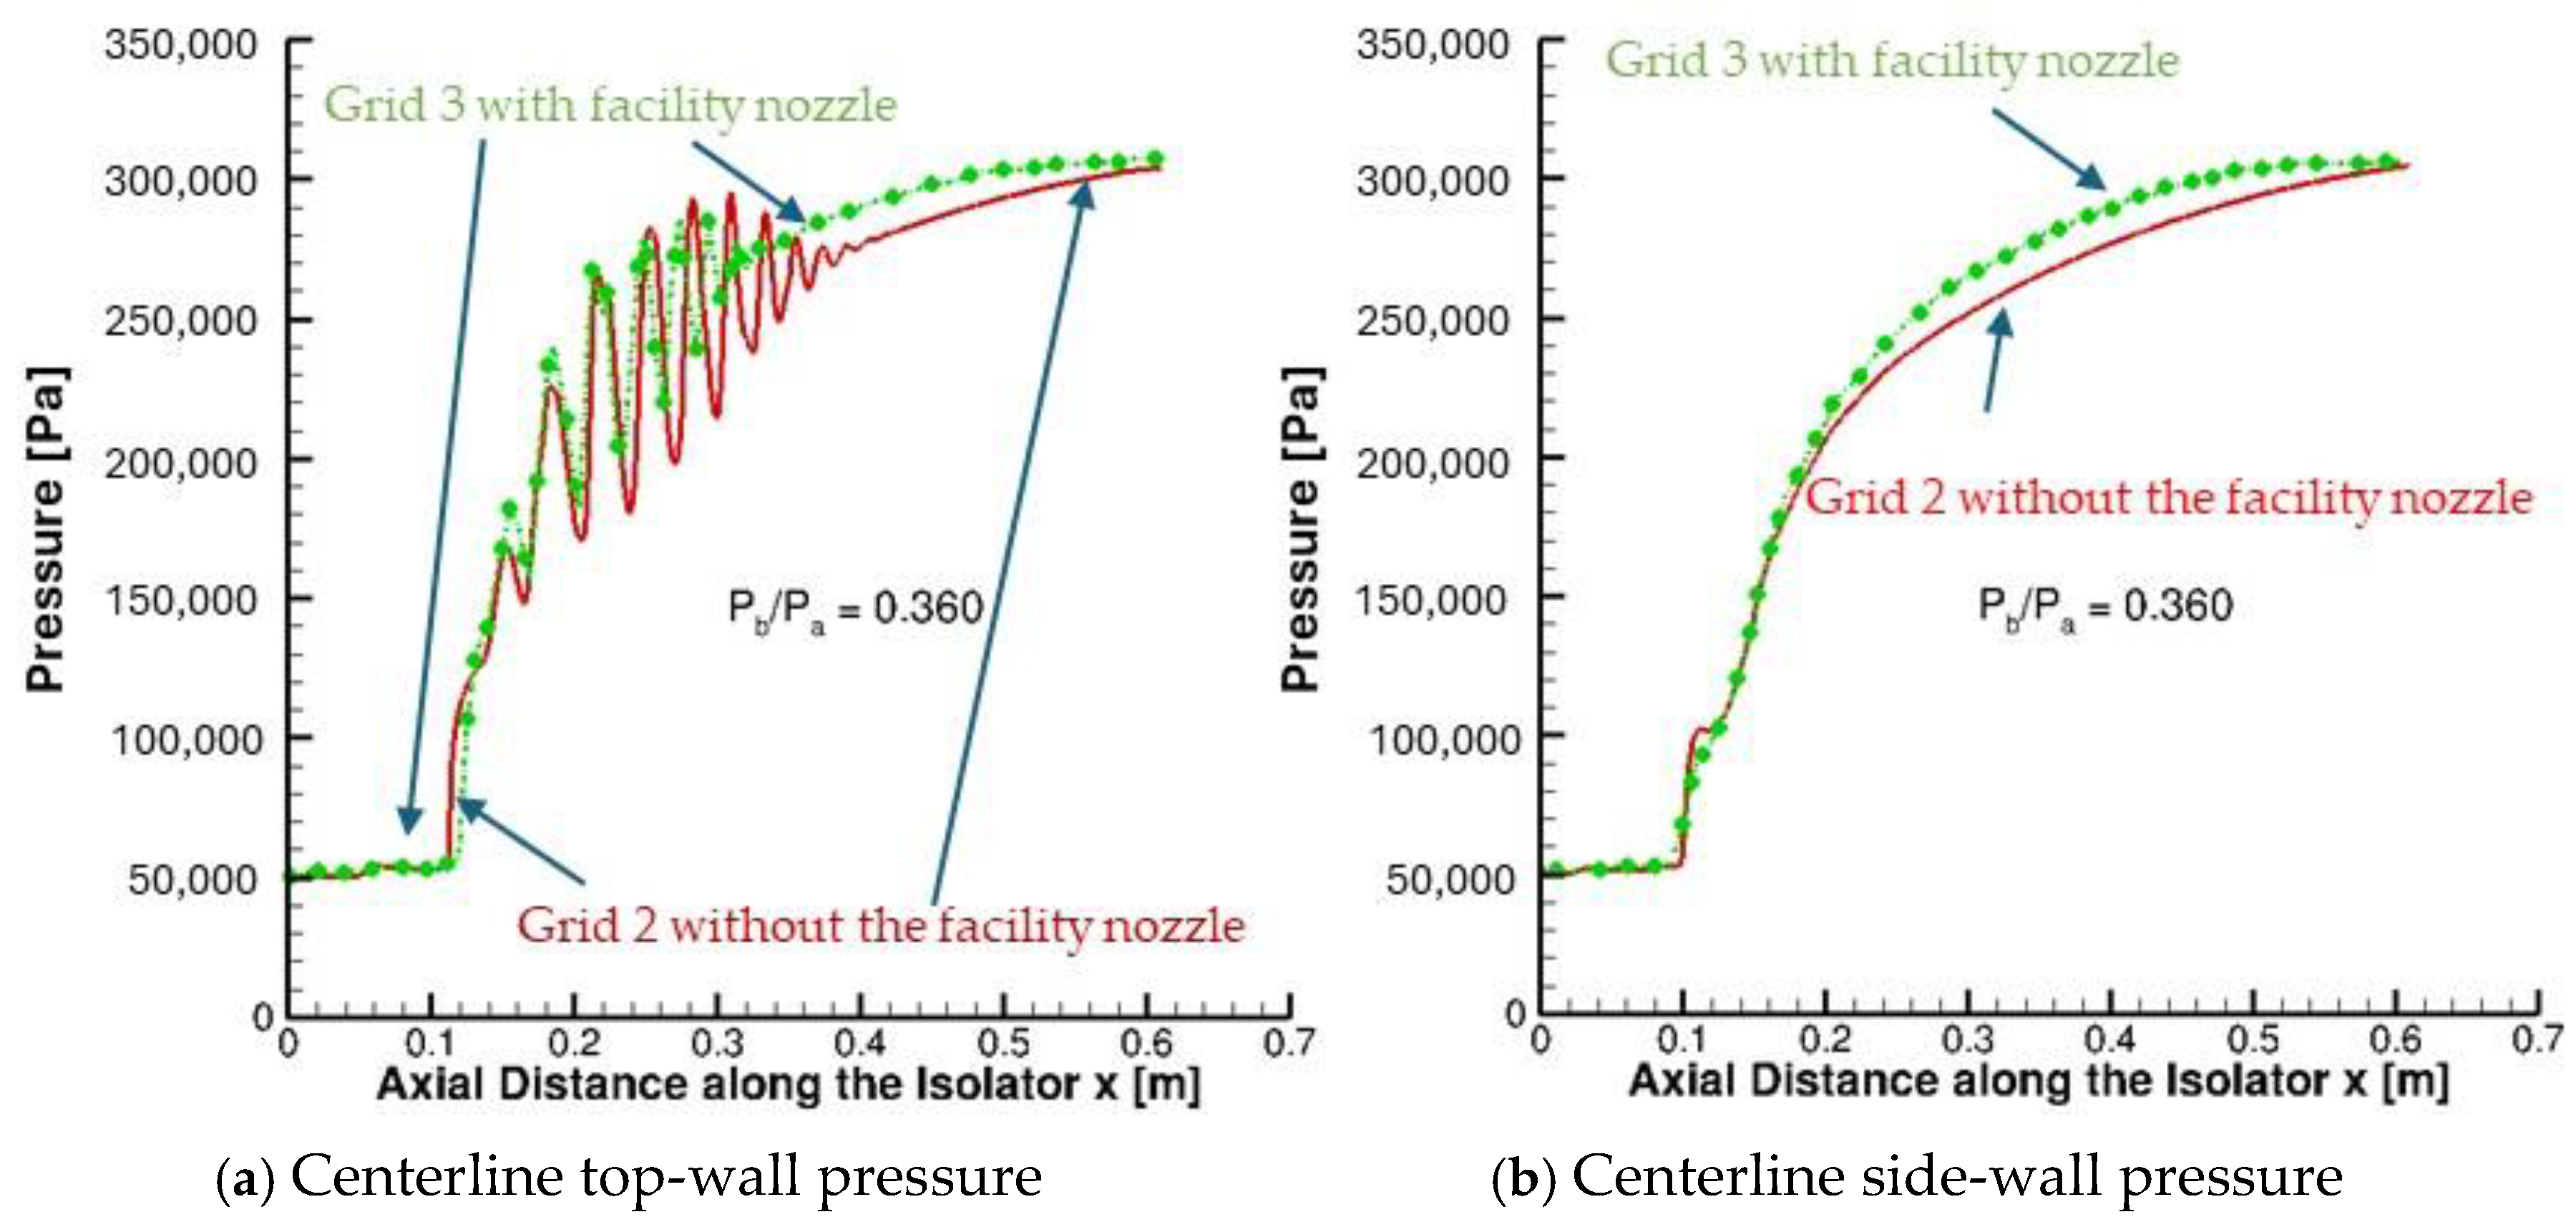
A comparison of centerline top-wall and side-wall surface pressure calculations from Grid 2 of the calculations in this work and Grid 3 from earlier work by Acharya et al. [
28] are shown in
Figure 6. This case is identical to the experimental set-up reported in Baurle and Axdahl [
27], except the backpressure ratio, which was lower in their work than in the work of Acharya et al. [
28]. An analysis of the computational results was performed for both the side-wall and top-wall centerlines. Since the isolator is a rectangular cross section duct, shock physics and fluid dynamic effects vary across three dimensions. In other words, the physical phenomena in the isolator are three-dimensional and therefore, the aerothermodynamic variables are distributed differently on the top wall and the side wall. The location of the foot of the pseudo shock train, the maximum pressure rise, and the pseudo shock train’s length (which have been identified as a significant metrics for the onset of unstart) from CFD calculations using the Wilcox 1998 turbulence closure model were compared with the measured experimental data. As mentioned earlier in this article, both the Grid 2 and Grid 3 results compared well with the measured data, and therefore, it was determined that Grid 2 with ~10 million grid points is appropriate for this demonstration. The Wilcox 1998 turbulence closure model refers to turbulence closure via formulation of two equations for turbulent kinetic energy, k and specific dissipation rate, omega. As mentioned earlier, this model has been found to predict the behavior of attached compressible boundary layers subjected to adverse pressure gradients more accurately than traditional turbulence kinetic energy dissipation rate models [
25].
There were close similarities between top-wall and side-wall pressure distributions, as shown in
Figure 6a and
Figure 6b, respectively. Specifically, the location of leading shocks on both the top-wall centerline and side-wall centerline matched, the length of the pseudo shock train matched closely, and the pressure increase also matched closely between the calculated and measured pressures, showing that Wilcox 1998 turbulence closure with Grid 2 was adequate for this case.
B. Determination of Effects of Backpressure Ratio on Unstart Metrics
As mentioned earlier, the ratio of plenum pressure (Pa) and back pressure (Pb) (hereby referred to as the backpressure ratio), the incoming flow Mach number from nozzle, and the wall thermal conditions were the experimental variables in the IDRL simulation. As the baseline calculations and measurements were performed for conditions far from unstart, VULCAN-CFD was utilized to answer some of the following questions:
What are the nominal values of these operating variables when the isolator shows onset of unstart?
How do the metrics of unstart unravel when isolator backpressure ratio and inflow Mach number are successively increased?
The work presented here examines the impact of both operating variables.
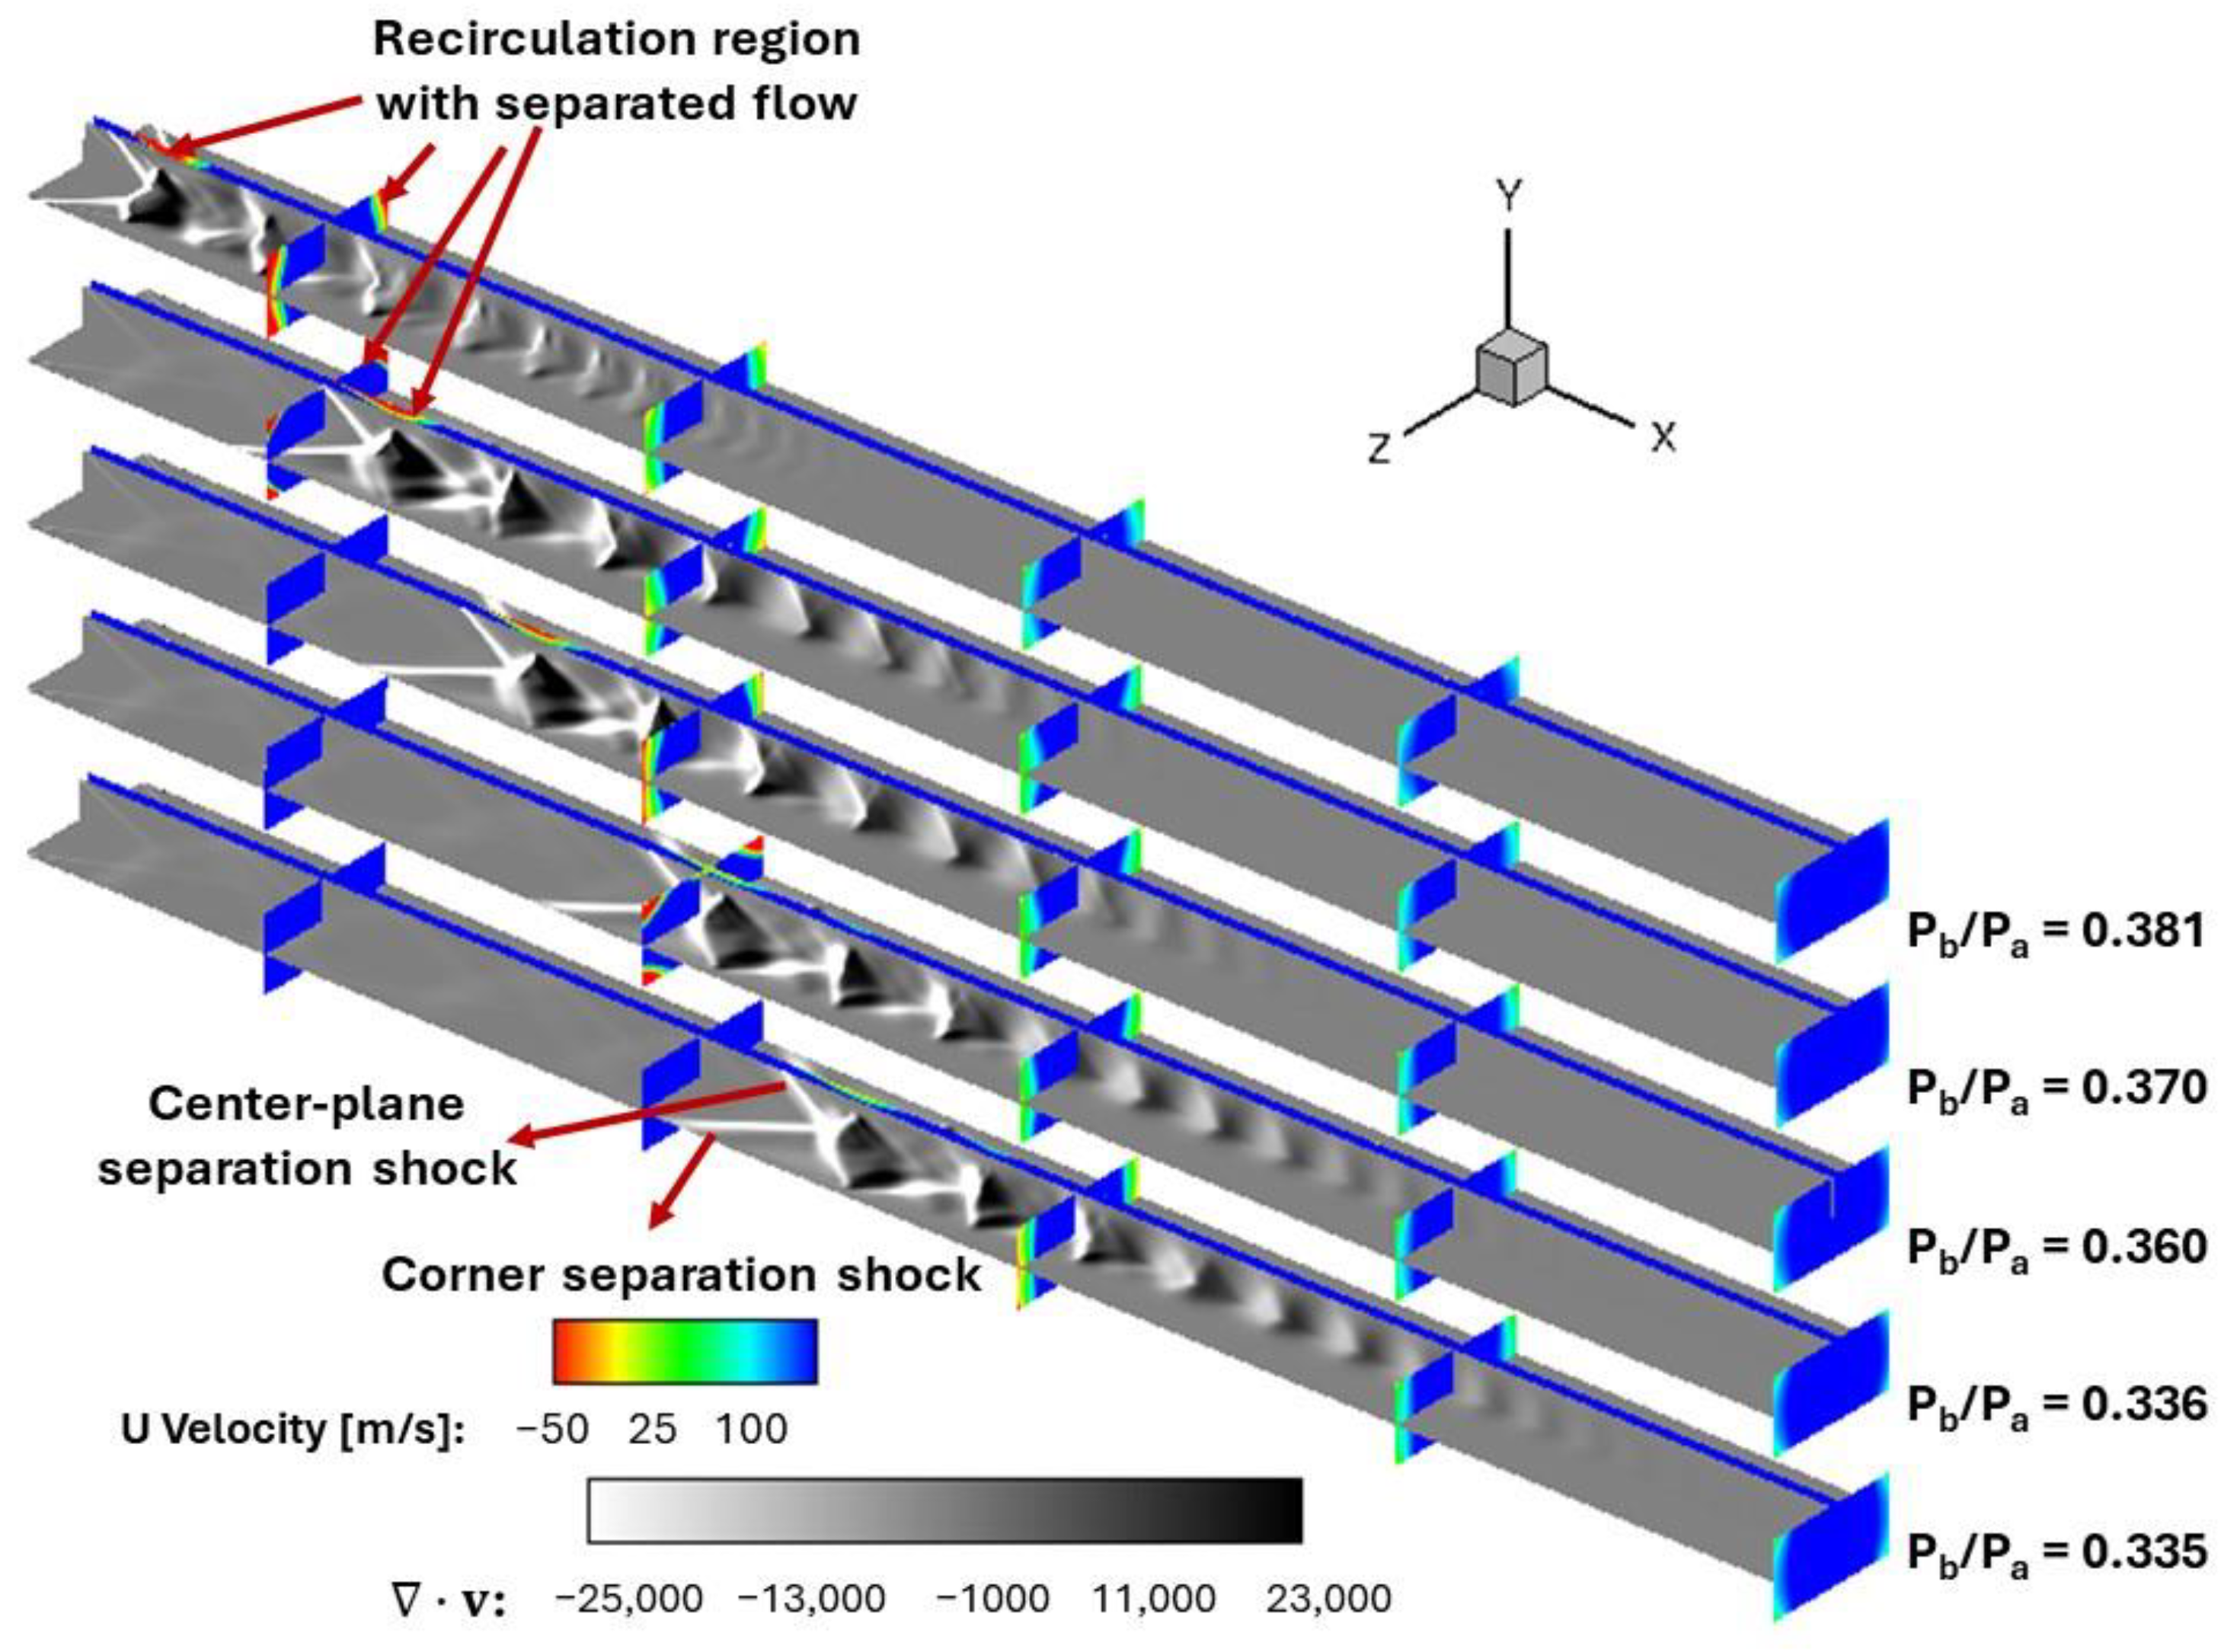
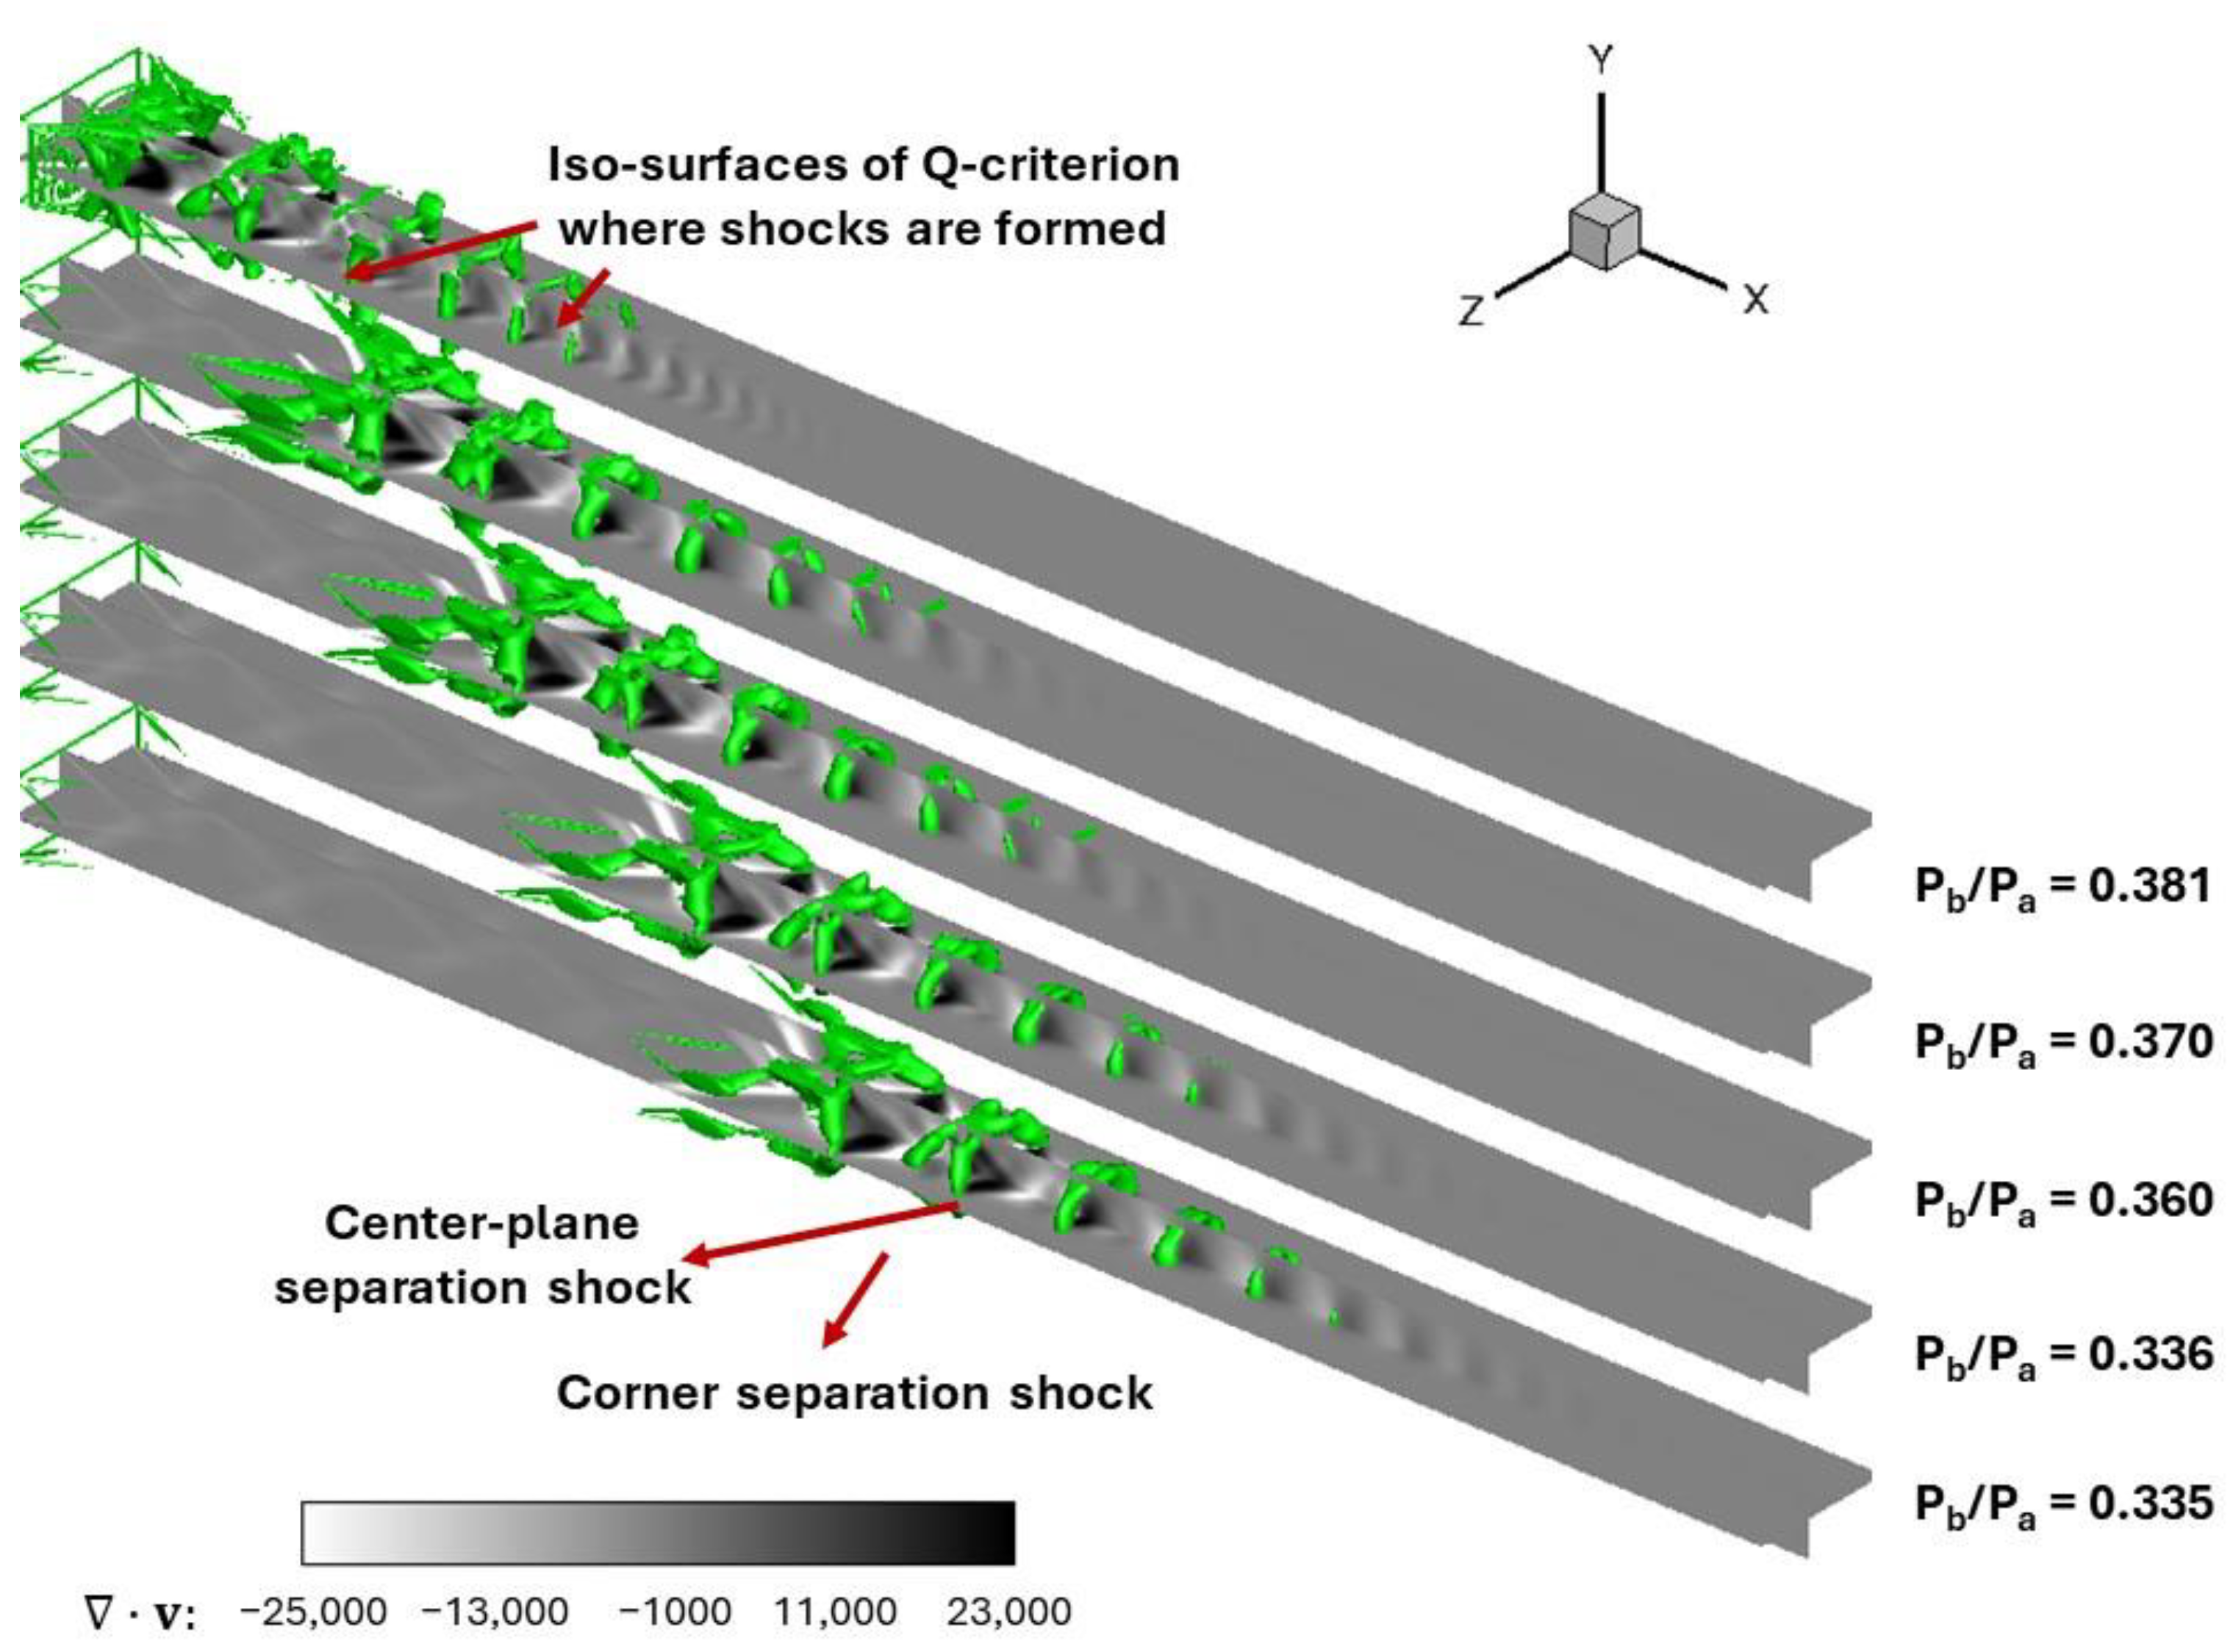
The impact of backpressure ratio on the shock physics in the isolator is shown in
Figure 7 and
Figure 8. The backpressure ratio was varied between 0.335 and 0.381 by changing only the static pressure at the isolator exit and keeping all other boundary conditions constant. The contours in
Figure 7 show the divergence of velocity along the center plane of the isolator, and the
x-planes show the streamwise velocity contours at multiple axial locations. The contours in
Figure 8 show Q-criterion iso-surfaces demonstrating evolution of a vortex structure in addition to the shock structure. The Q criterion is the second invariant of the velocity gradient tensor, which measures the relative magnitudes of rotation and strain. These contours show that the vorticity production increased quite significantly as the backpressure ratio gradually increased with the pseudo shock train. Flow separation at both the corner and the center plane occurred near the isolator entrance; this may be disadvantageous for operation of the isolator.
A comparison of static pressure along the centerline of the top wall and centerline of the side wall is shown in
Figure 9. In these plots, the
x-axis shows non-dimensional axial distance where the dimensional axial distance (x) is divided by half the width of the isolator (h). Both plots confirm the observations from the contour plots. These contour plots demonstrate that in addition to the leading shock location, the shock-train length reduces, and the Mach stem height increases significantly with the backpressure ratio. The difference between the two plots demonstrates that pressure fluctuations are dominant in the transverse direction (top-wall figure) and less significant in the spanwise direction (side-wall figure). It should be noted that the case with backpressure ratio of 0.335 is same as the experimental case used for validation of the computational results [
26]. In
Figure 9a,b, the foot of the leading shock along the centerlines of top-wall and side-wall are located at x/h = 9.5 when the backpressure ratio is equal to 0.335, which is very close to the measured value of x/h~9.5 as reported by Baurle and Axdahl [
26]. The close comparisons shown in both
Figure 6 and
Figure 9 affirm that the mesh and computational domain (without the facility nozzle) utilized for current purposes the yielded favorable comparisons with the time-averaged top-wall and side-wall surface pressure measurements from the IDRL test with a 1 × 2 cross section.
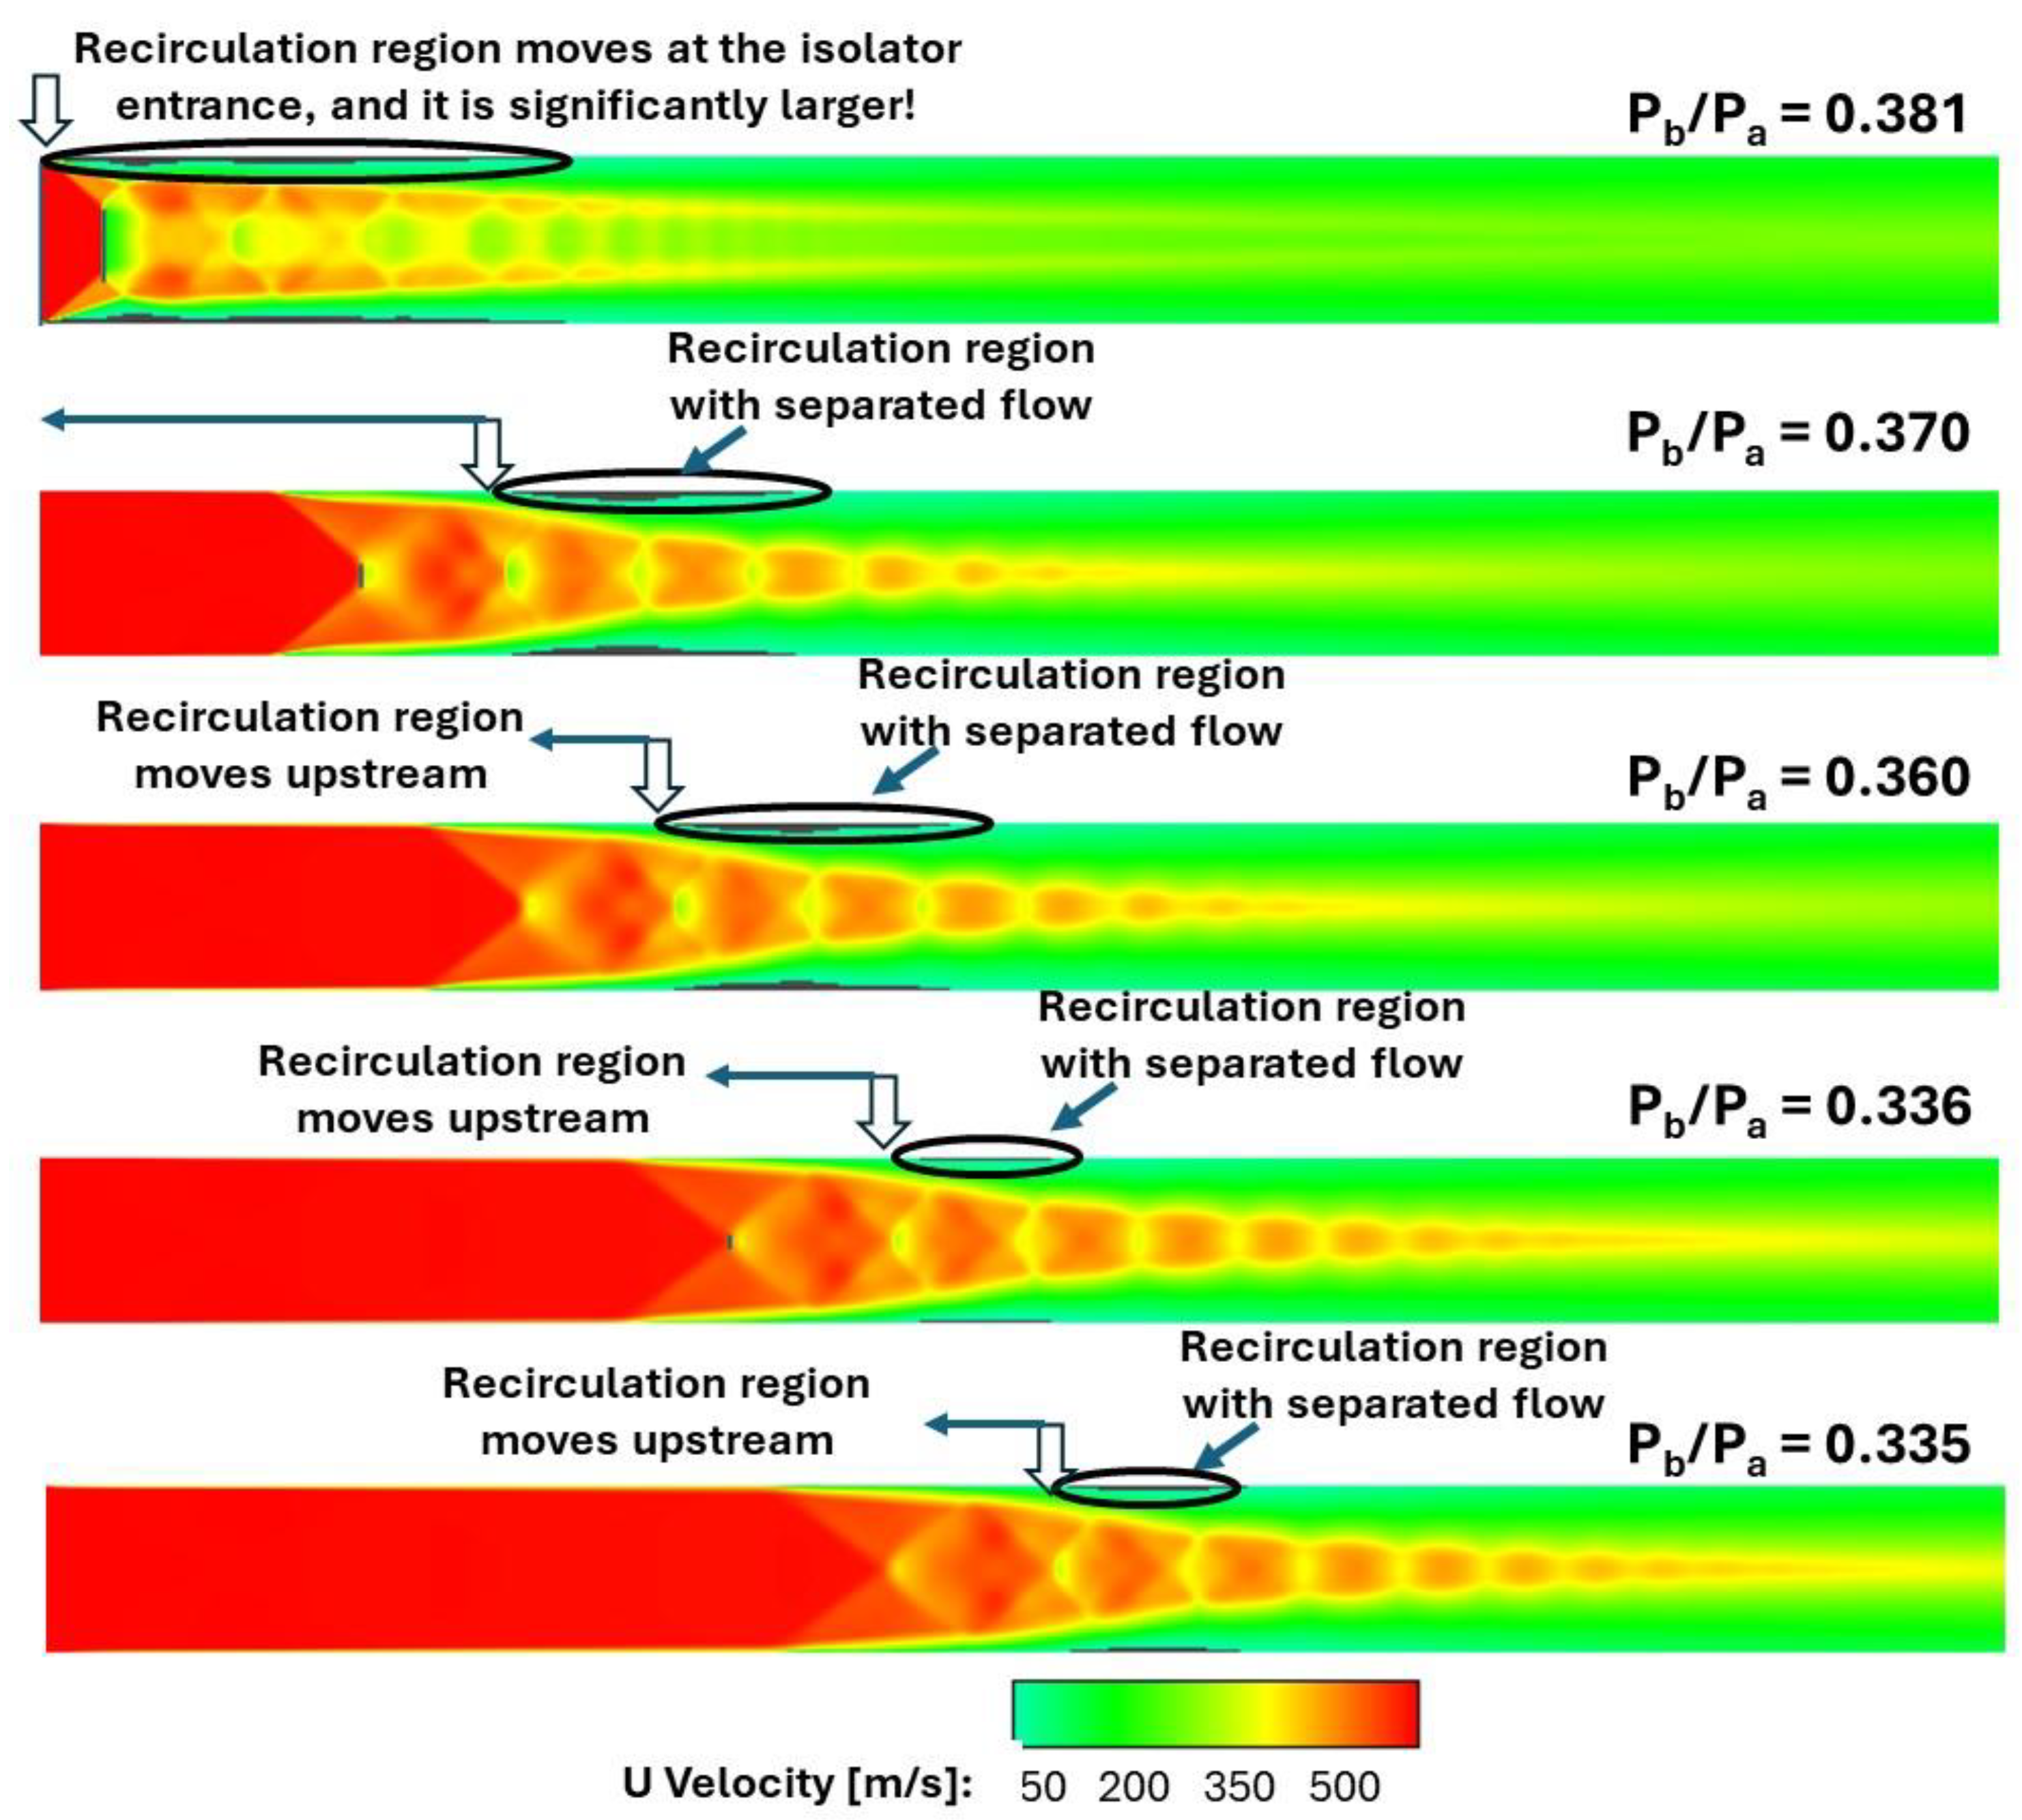
The impact of backpressure ratio on the spanwise center plane (y = 0 plane) in the isolator is shown in
Figure 10. In this figure, the axial velocity contours near the side wall show that the flow separation region increased significantly with the backpressure ratio, settling at the isolator entrance when its value was 0.381. At this backpressure ratio, the Mach stem height was nearly equal to the height and width of the isolator, increasing the odds of planar shock formation if the backpressure were to increase further. The separation shocks due to this phenomenon impacted on the isolator flow as well. This plot is relevant in defining the nominal case for onset of unstart.
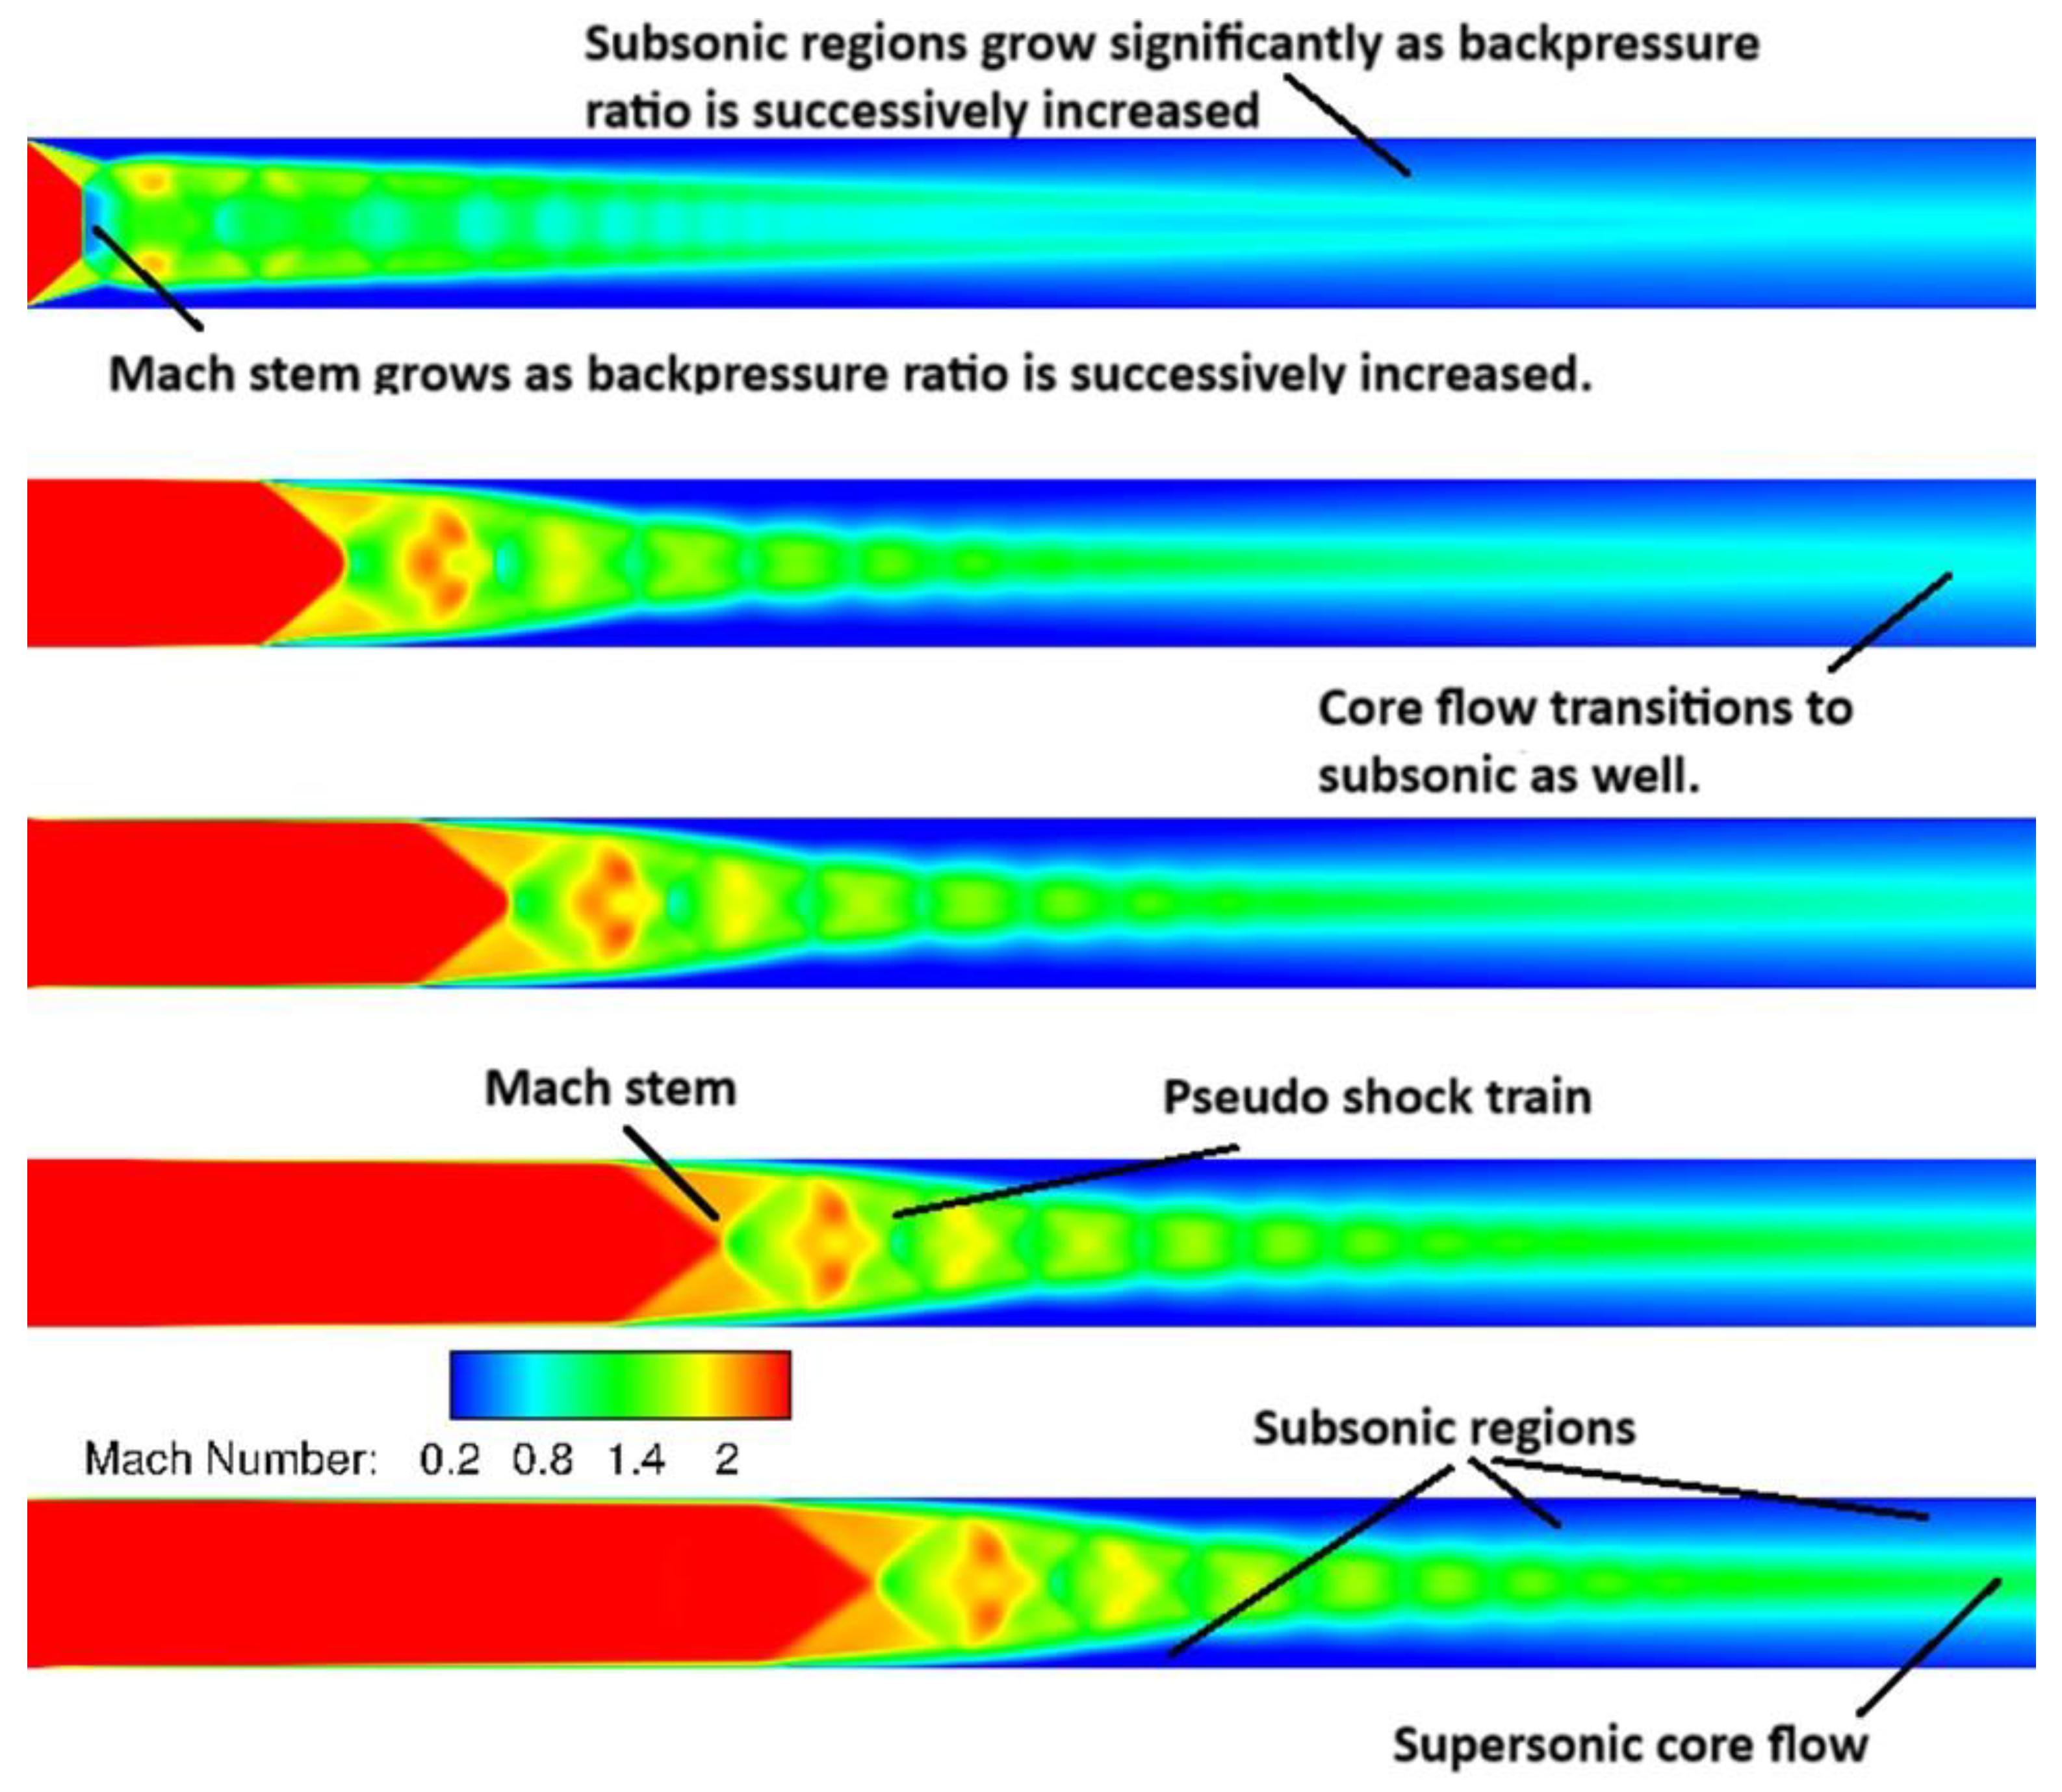
Figure 11 shows the Mach number contours with successively increasing backpressure ratio. The isolator flow transitions from supersonic flow in this plane at the isolator exit (and entrance to combustor) to subsonic flow at the isolator exit, showing how the backpressure ratio can affect the transition from scramjet to ramjet mode. Subsonic regions increase significantly with increasing backpressure ratio, as shown in
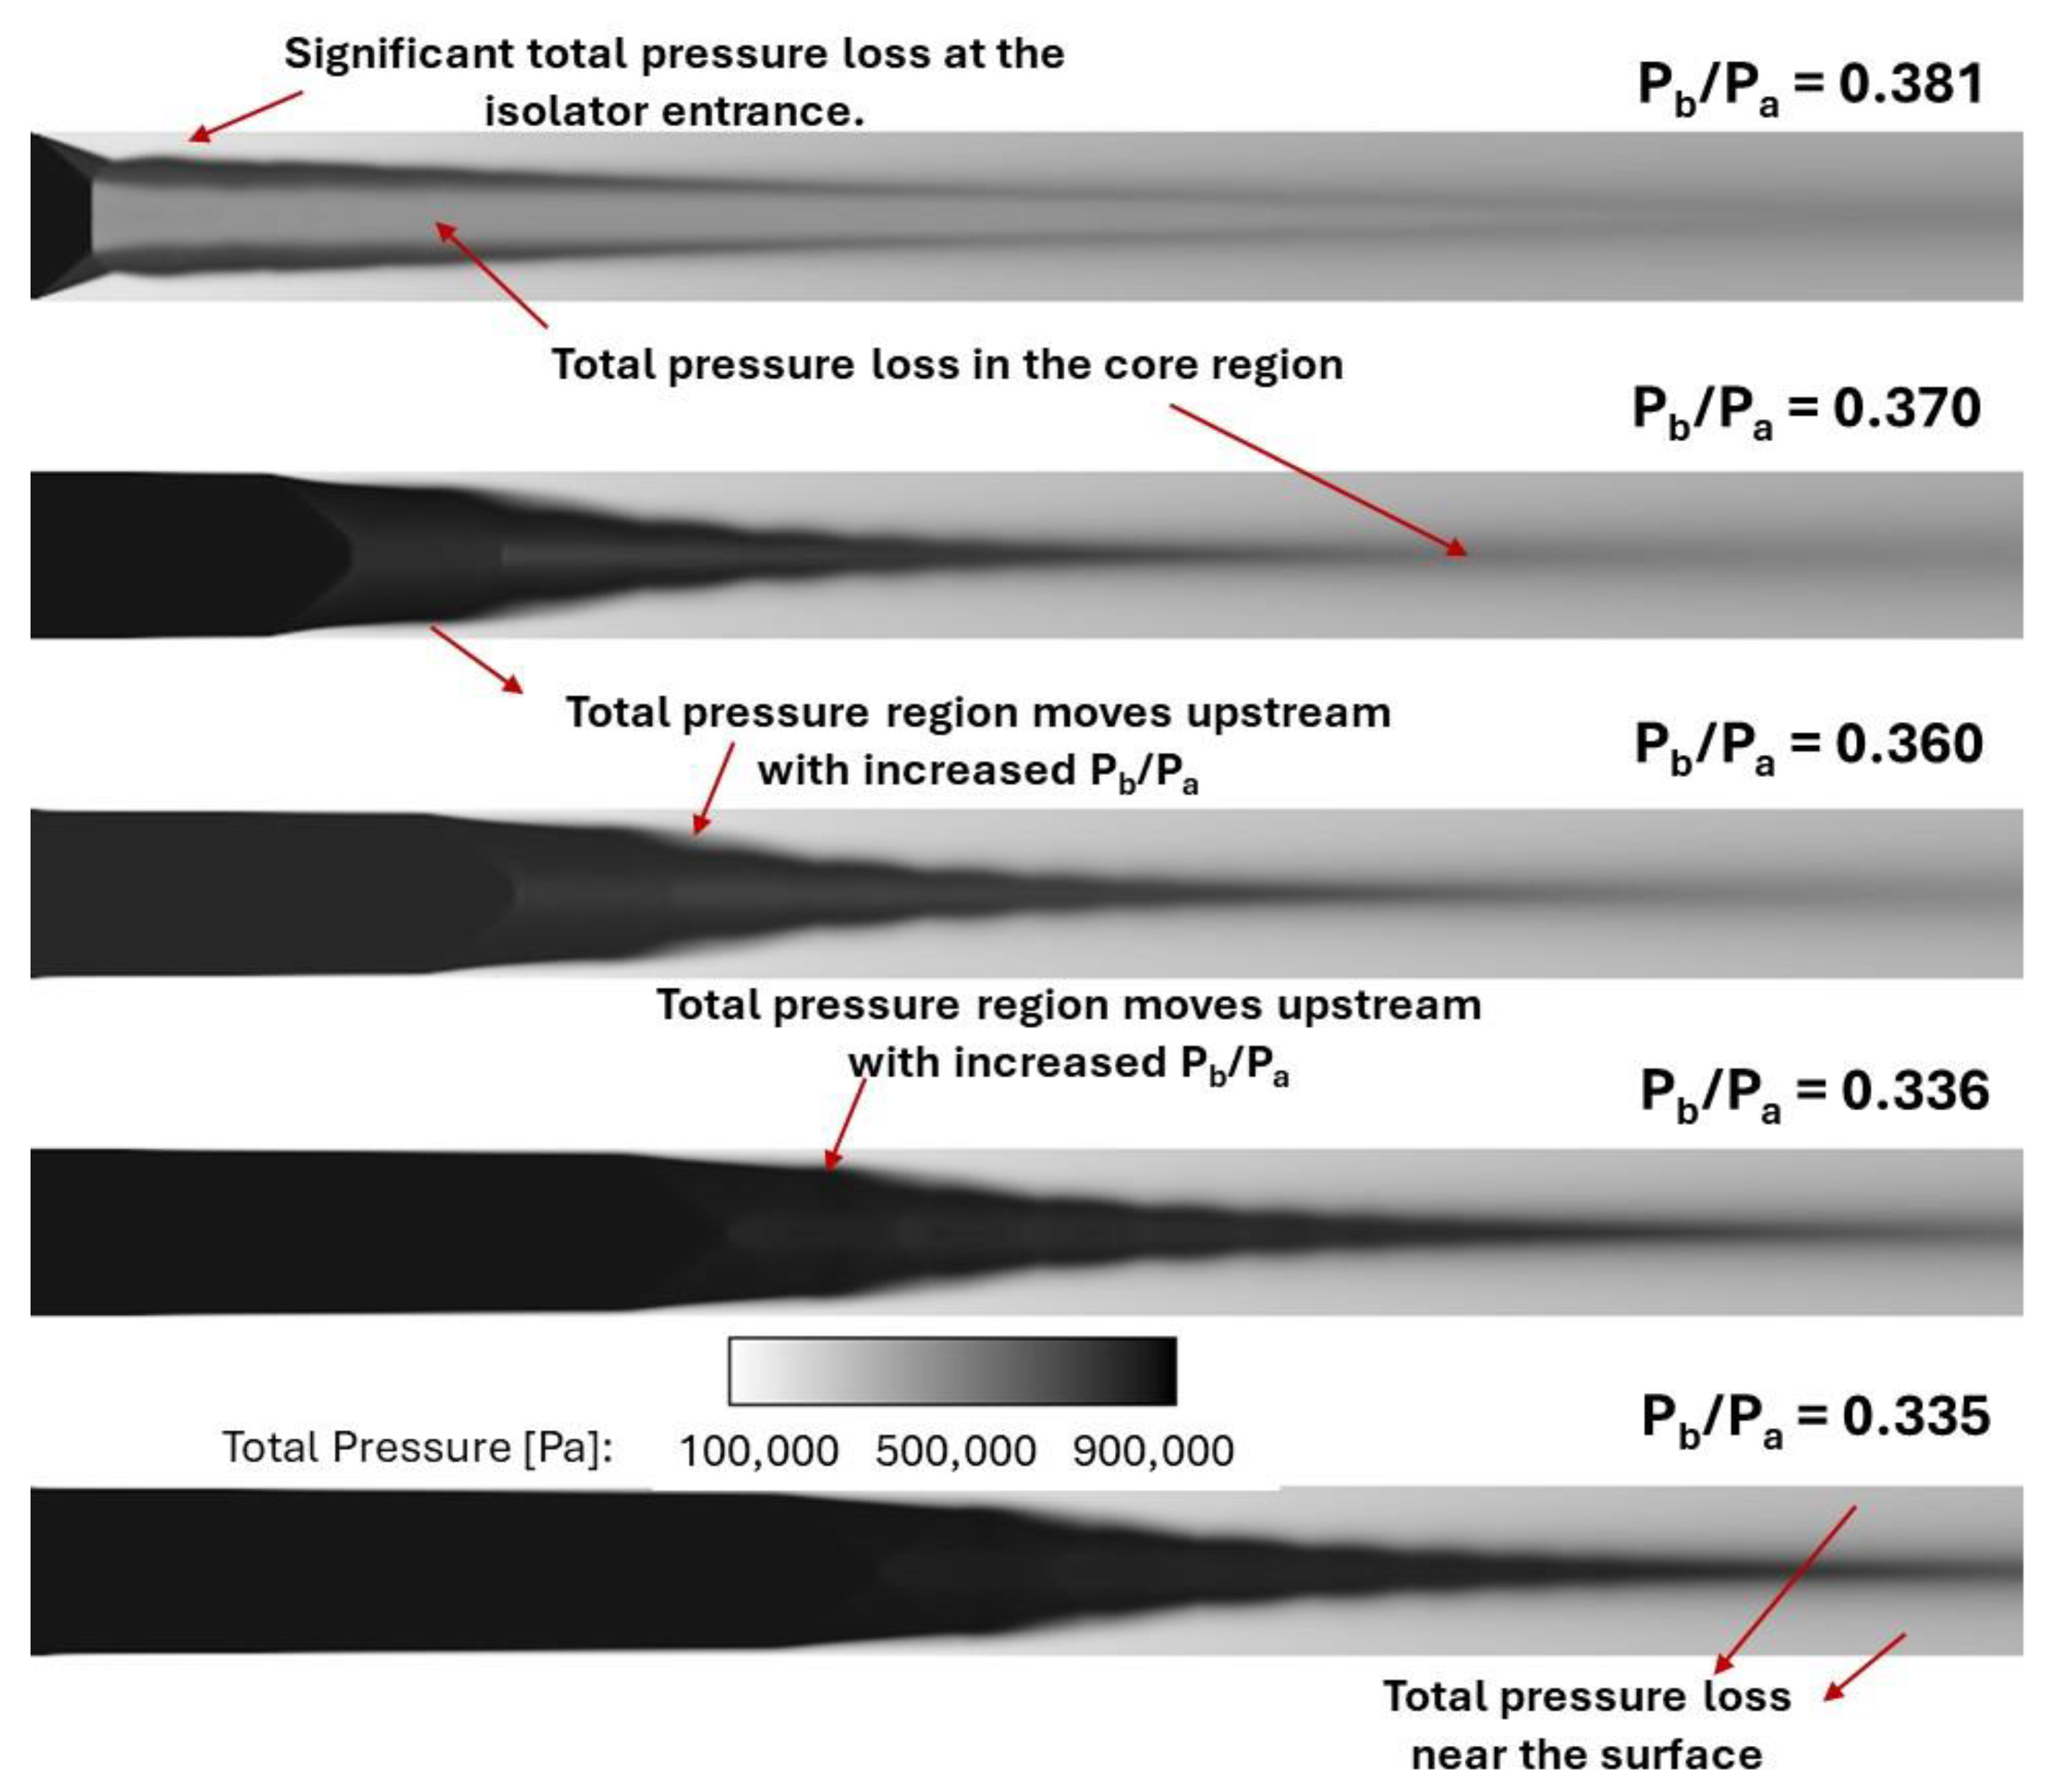
Figure 11. A very important performance variable for scramjet isolator performance is the total pressure loss, which is shown in
Figure 12. While there was some total pressure loss at any backpressure ratio, this became extremely significant when the backpressure ratio increased to the value of 0.381. In addition, these results demonstrate transition of flow entering exiting the isolator from supersonic to subsonic, resulting in mode transition of the combustion (if located after the isolator) from supersonic combustion (i.e., scramjet mode) to subsonic combustion (i.e., ramjet mode), leading to significant loss in efficiency and operability at higher Mach numbers.
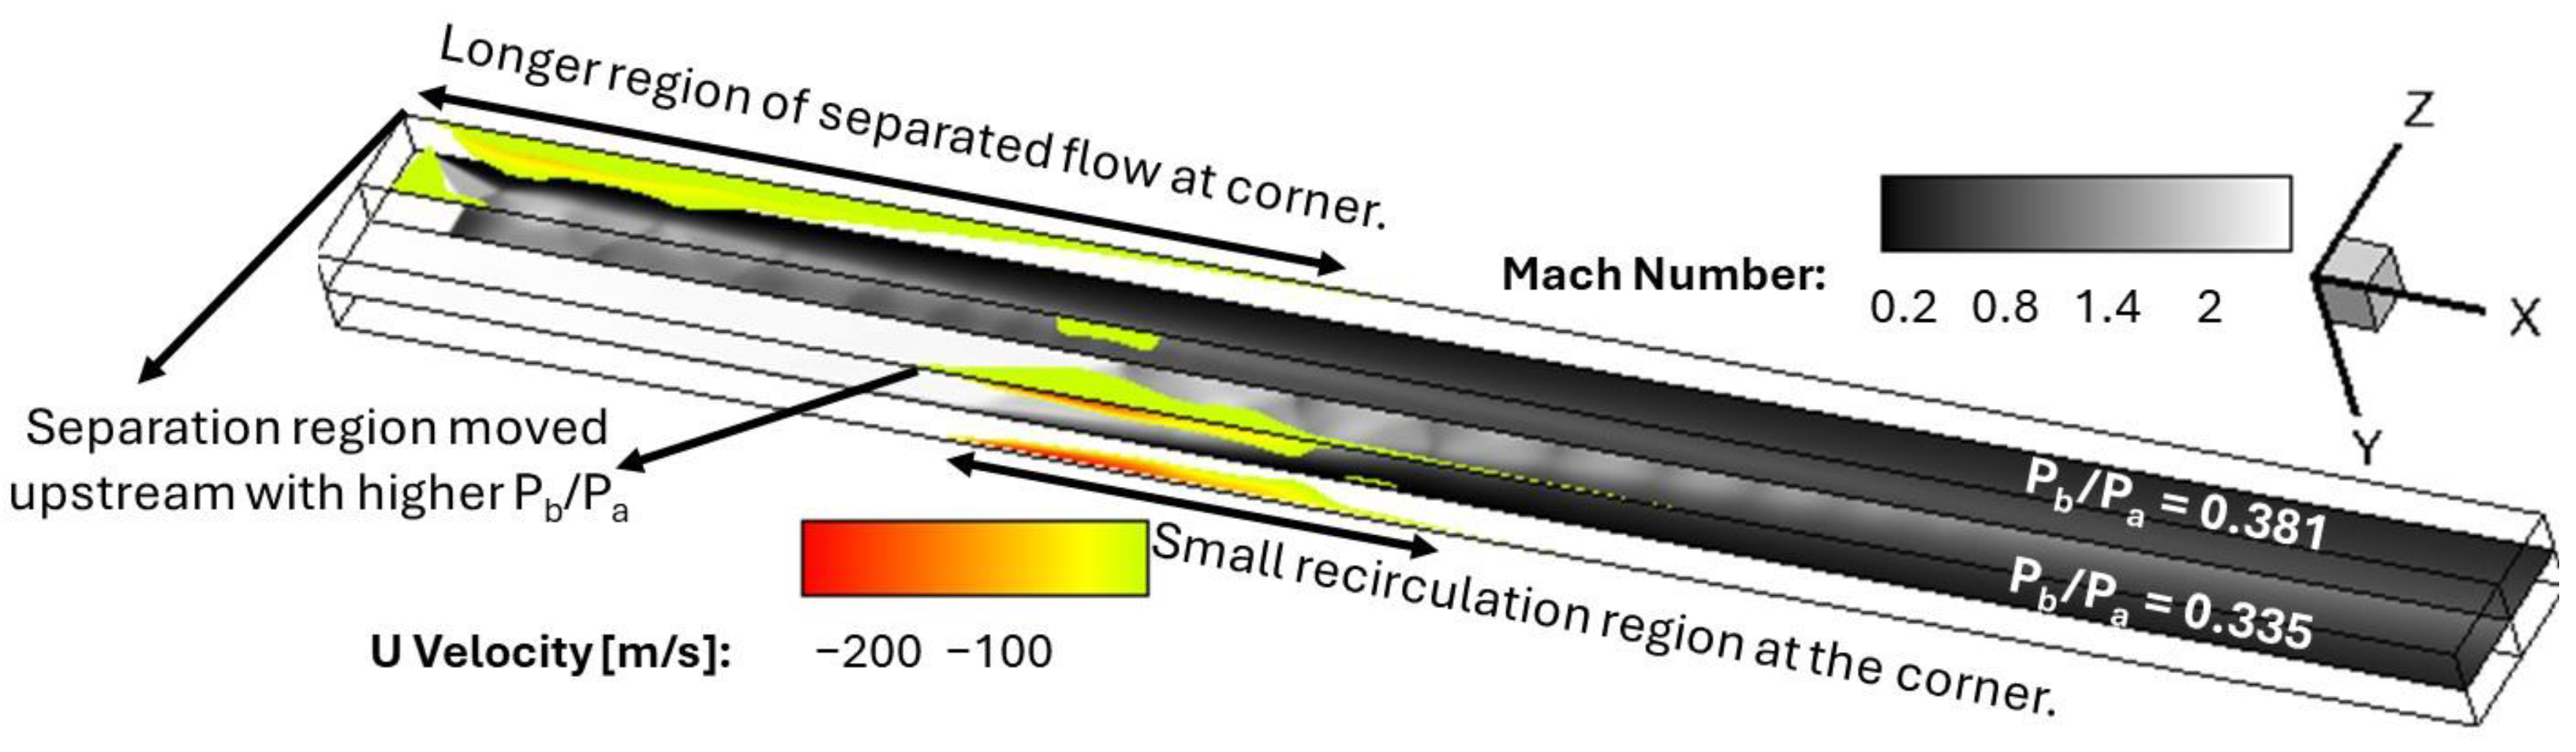
Mach number and streamwise velocity contours in a side-by-side comparison of backpressure ratios of 0.335 and 0.381 are shown in
Figure 13. The figure shows an isometric view of the isolator, with the top-right portion displaying results obtained with a backpressure ratio of 0.381 and the bottom-left portion displaying results obtained with a backpressure ratio of 0.335. With a 13.7% change in backpressure, the shock physics in the isolator changed significantly with longer regions of separated flow (shown in color) at the corner between the top wall and side wall. The separation region moved towards the isolator entrance with the higher backpressure ratio. The grey contours in this figure show the Mach number distribution with backpressure ratios of 0.335 (bottom) and 0.381 (top).
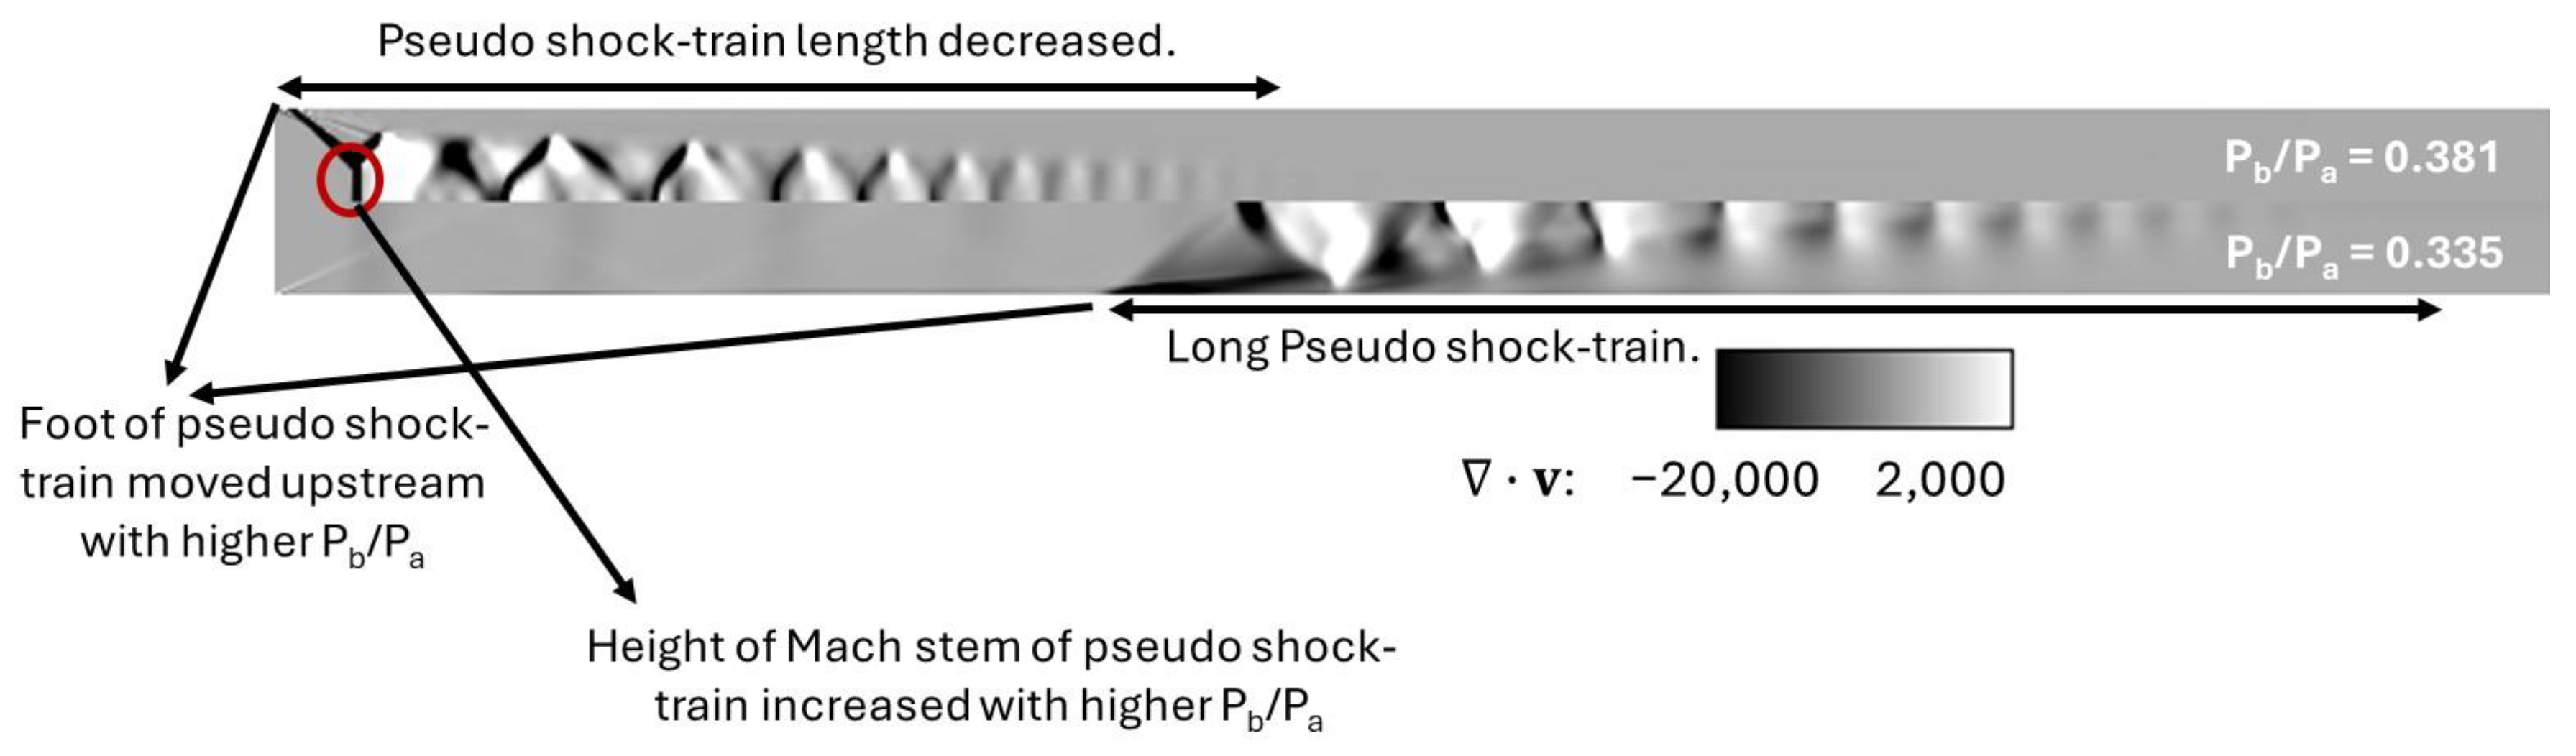
Figure 14 shows a comparison of the divergence of velocity contours between the lowest and highest backpressure ratios. These results show the significant contrast in Mach stem height and length of the pseudo shock-train as the backpressure ratio is gradually increases to a value of 0.381.
Figure 15 shows significant total pressure loss with a higher backpressure ratio.
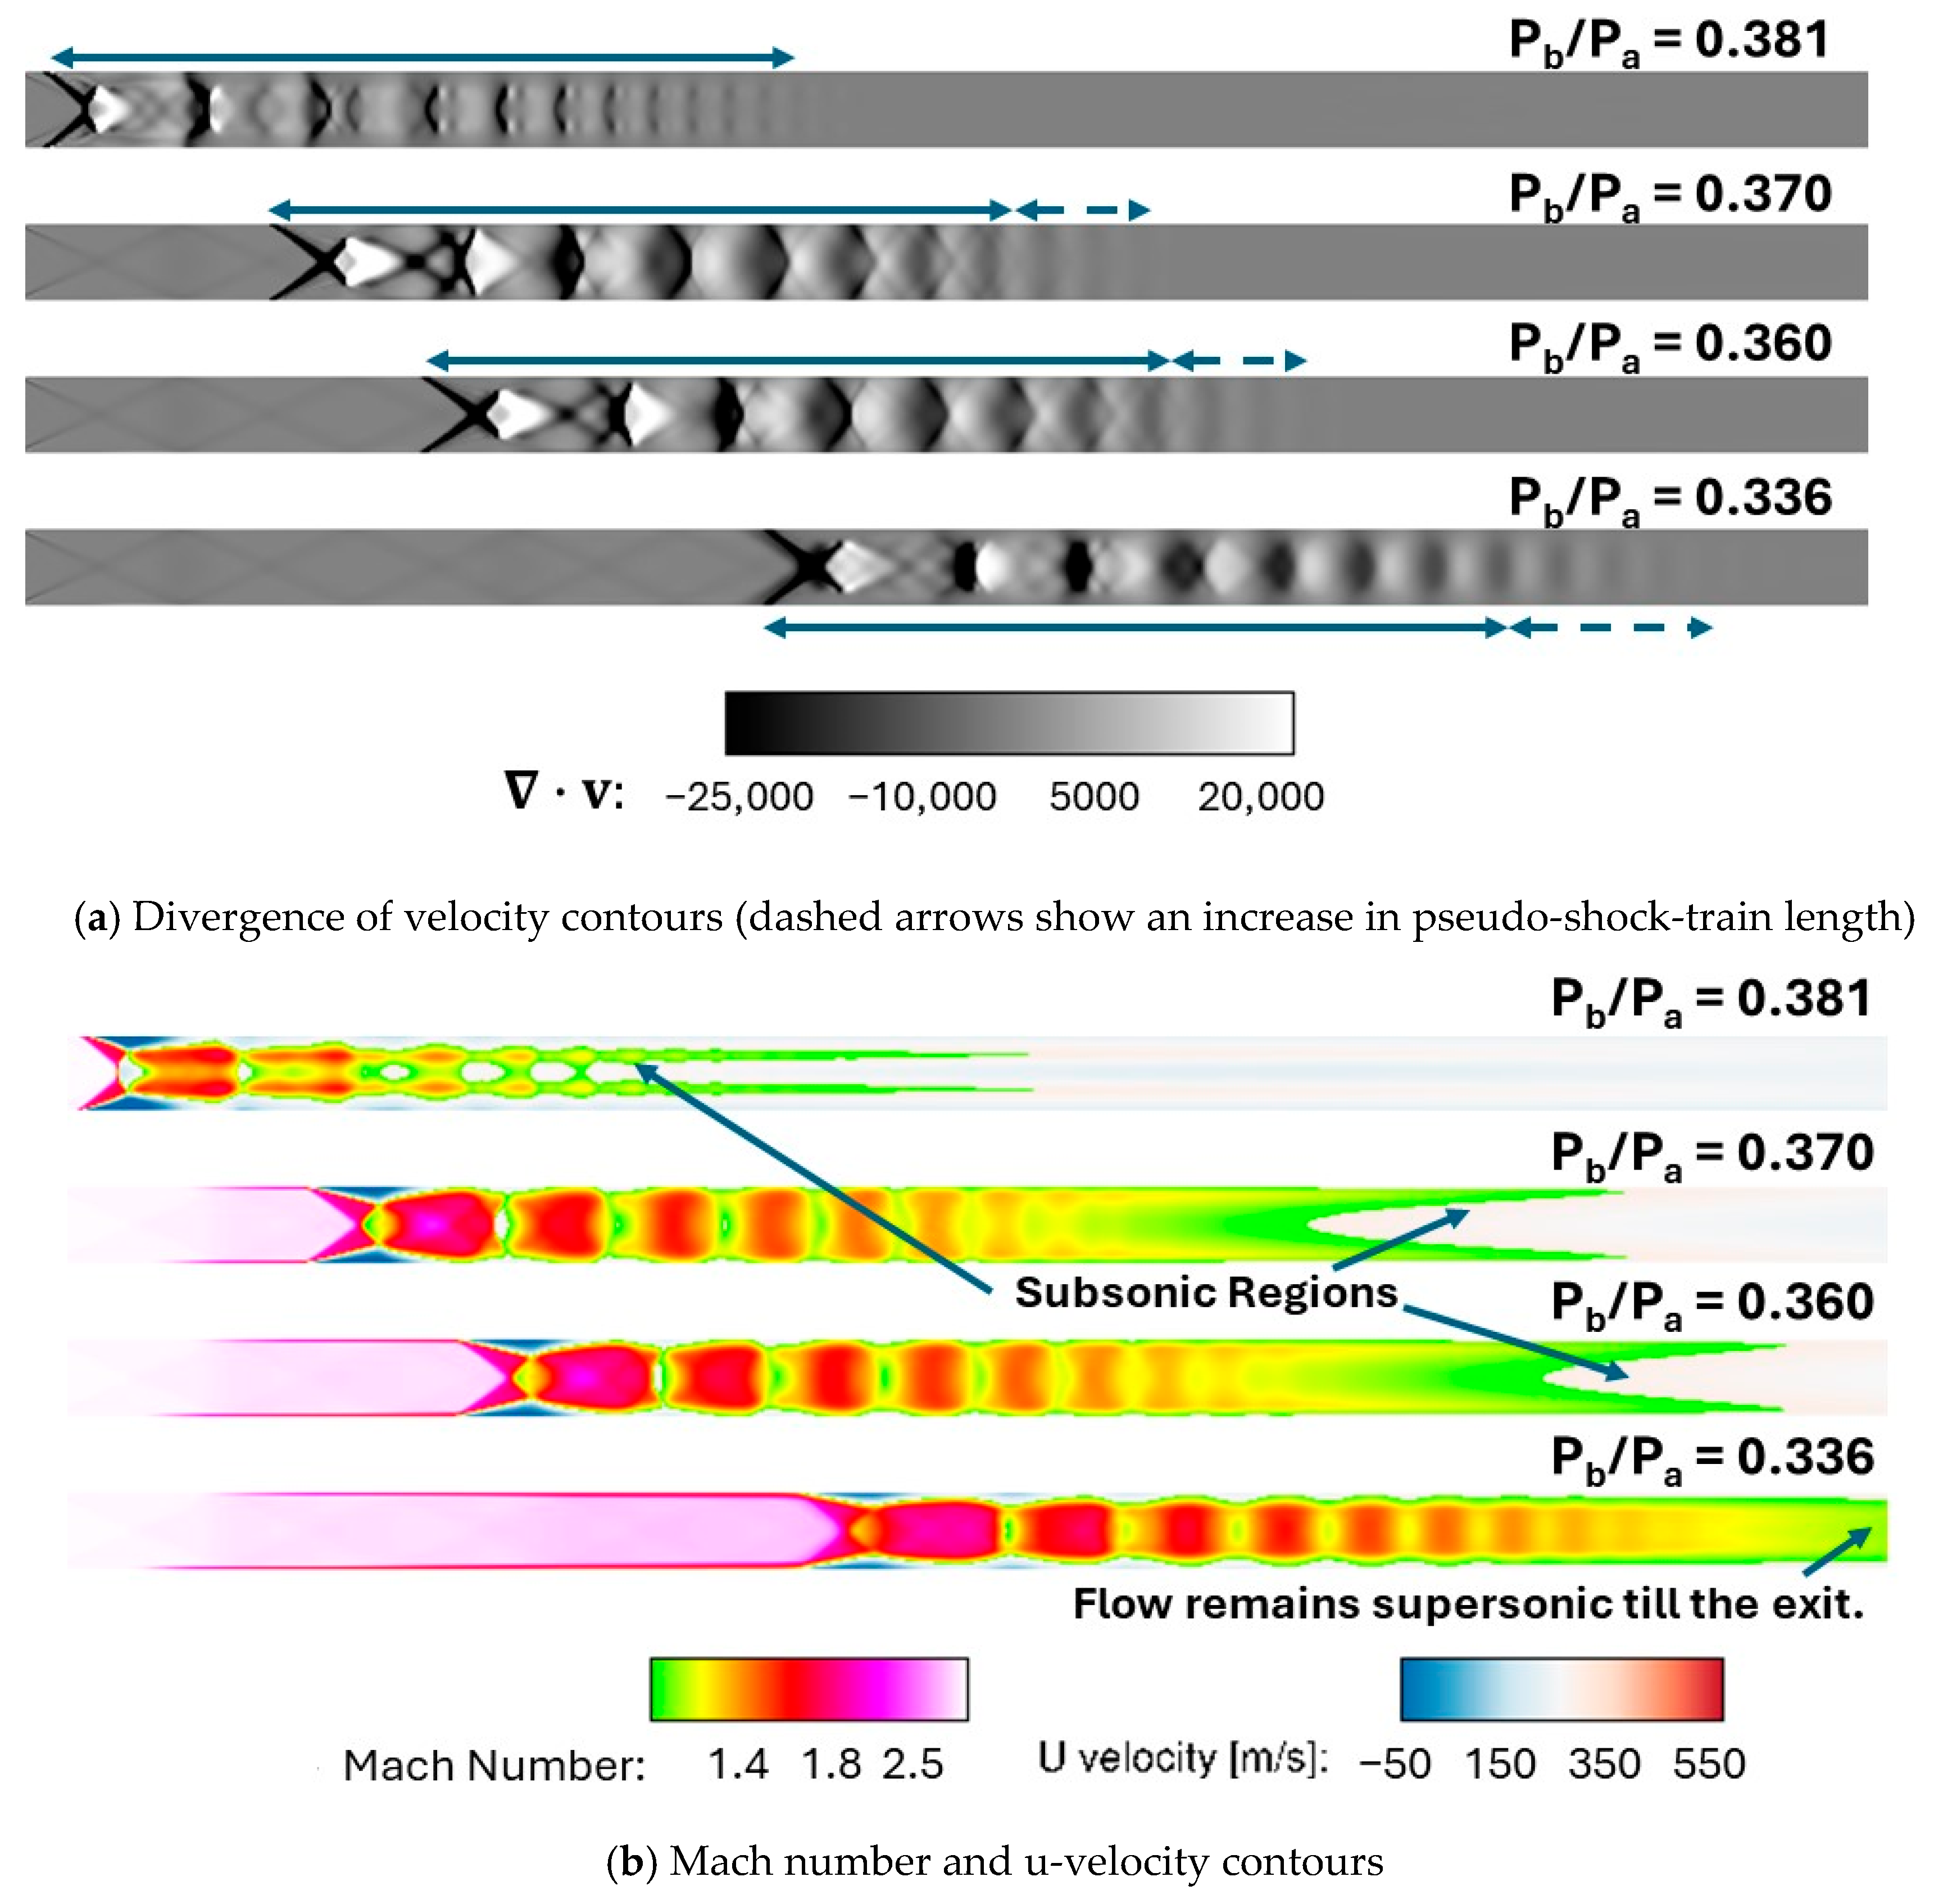
The divergence of velocity contours in the spanwise center plane (z = 0) is shown in
Figure 16a and the Mach number and streamwise velocity contours are shown in
Figure 16b, for increasing values of backpressure ratio between 0.336 and 0.381. With a 13.7% change in backpressure, the shock physics in the isolator change significantly the shorter pseudo-shock-train length, with the leading shock having moved to the entrance of the isolator with the higher backpressure. The Mach number contours shown in
Figure 16b demonstrate that the flow becomes subsonic at backpressure ratios of 0.360 and higher, while it remains supersonic at the isolator exit when the backpressure ratio is 0.336.
From the above calculations, the nominal case of the backpressure ratio for onset of isolator unstart and operability was analyzed. Flow separation causes flow instabilities, and compression of core flow. When the flow separation region expands and moves close to the isolator entrance, the compression of core flow can result in transition of oblique shocks into normal shock, as evidence by significant growth in the Mach stem height. While the unstart has not yet occurred, these phenomena are indicators that unstart process may begin. Once both the leading shock and the separation region are at the isolator exit, it can be argued that onset of the isolator unstart phenomenon has begun. It is interesting to note that the backpressure ratio and the onset of unstart metrics such as leading shock location have a non-linear relationship. A second interesting metric for performance assessment is operability. The location of the leading shock foot on both the transverse and spanwise center planes are far from the isolator entrance for backpressure ratio values below 0.381, but the flow following the pseudo-shock-train reduces the Mach number to below 1.0 for all values except when the backpressure ratio is below 0.336, for the values analyzed in this paper. If the requirement for the operation of this isolator is to operate in scramjet mode (i.e., flow exiting the isolator is supersonic), then backpressure values above 0.360 are not suitable even if they do not pose the threat of unstart.
These calculations demonstrate that the isolator operability can potentially shift from started to unstarted or from scramjet to ramjet mode with small variations in operating conditions. As a reminder, backpressure at the isolator exit can increase due to multiple factors related to the heat release in the combustor.
C. Determination of Effects of Mach Number on Unstart Metrics
The inflow Mach number can vary significantly due to small changes in inlet dimensions from the design stage to the build stage. It can also vary if the same inlet is utilized with variations in the angle of attack during the flight of a scramjet-powered vehicle. In addition to the backpressure ratio, inflow Mach number can have strong and direct effects on isolator shock physics. To evaluate and quantify the impact of variance in Mach number at the isolator entrance, computational studies were performed that included varying the inflow Mach number at the isolator entrance. During this process, total pressure was kept at a constant value, meaning that the static pressure, density, and inflow velocity were varied. In practical applications, change in the inflow Mach number may potentially be combined with change in total pressure; however, to isolate the effects of changes in inflow Mach number on the flow phenomena inside the isolator, only one variable was changed.
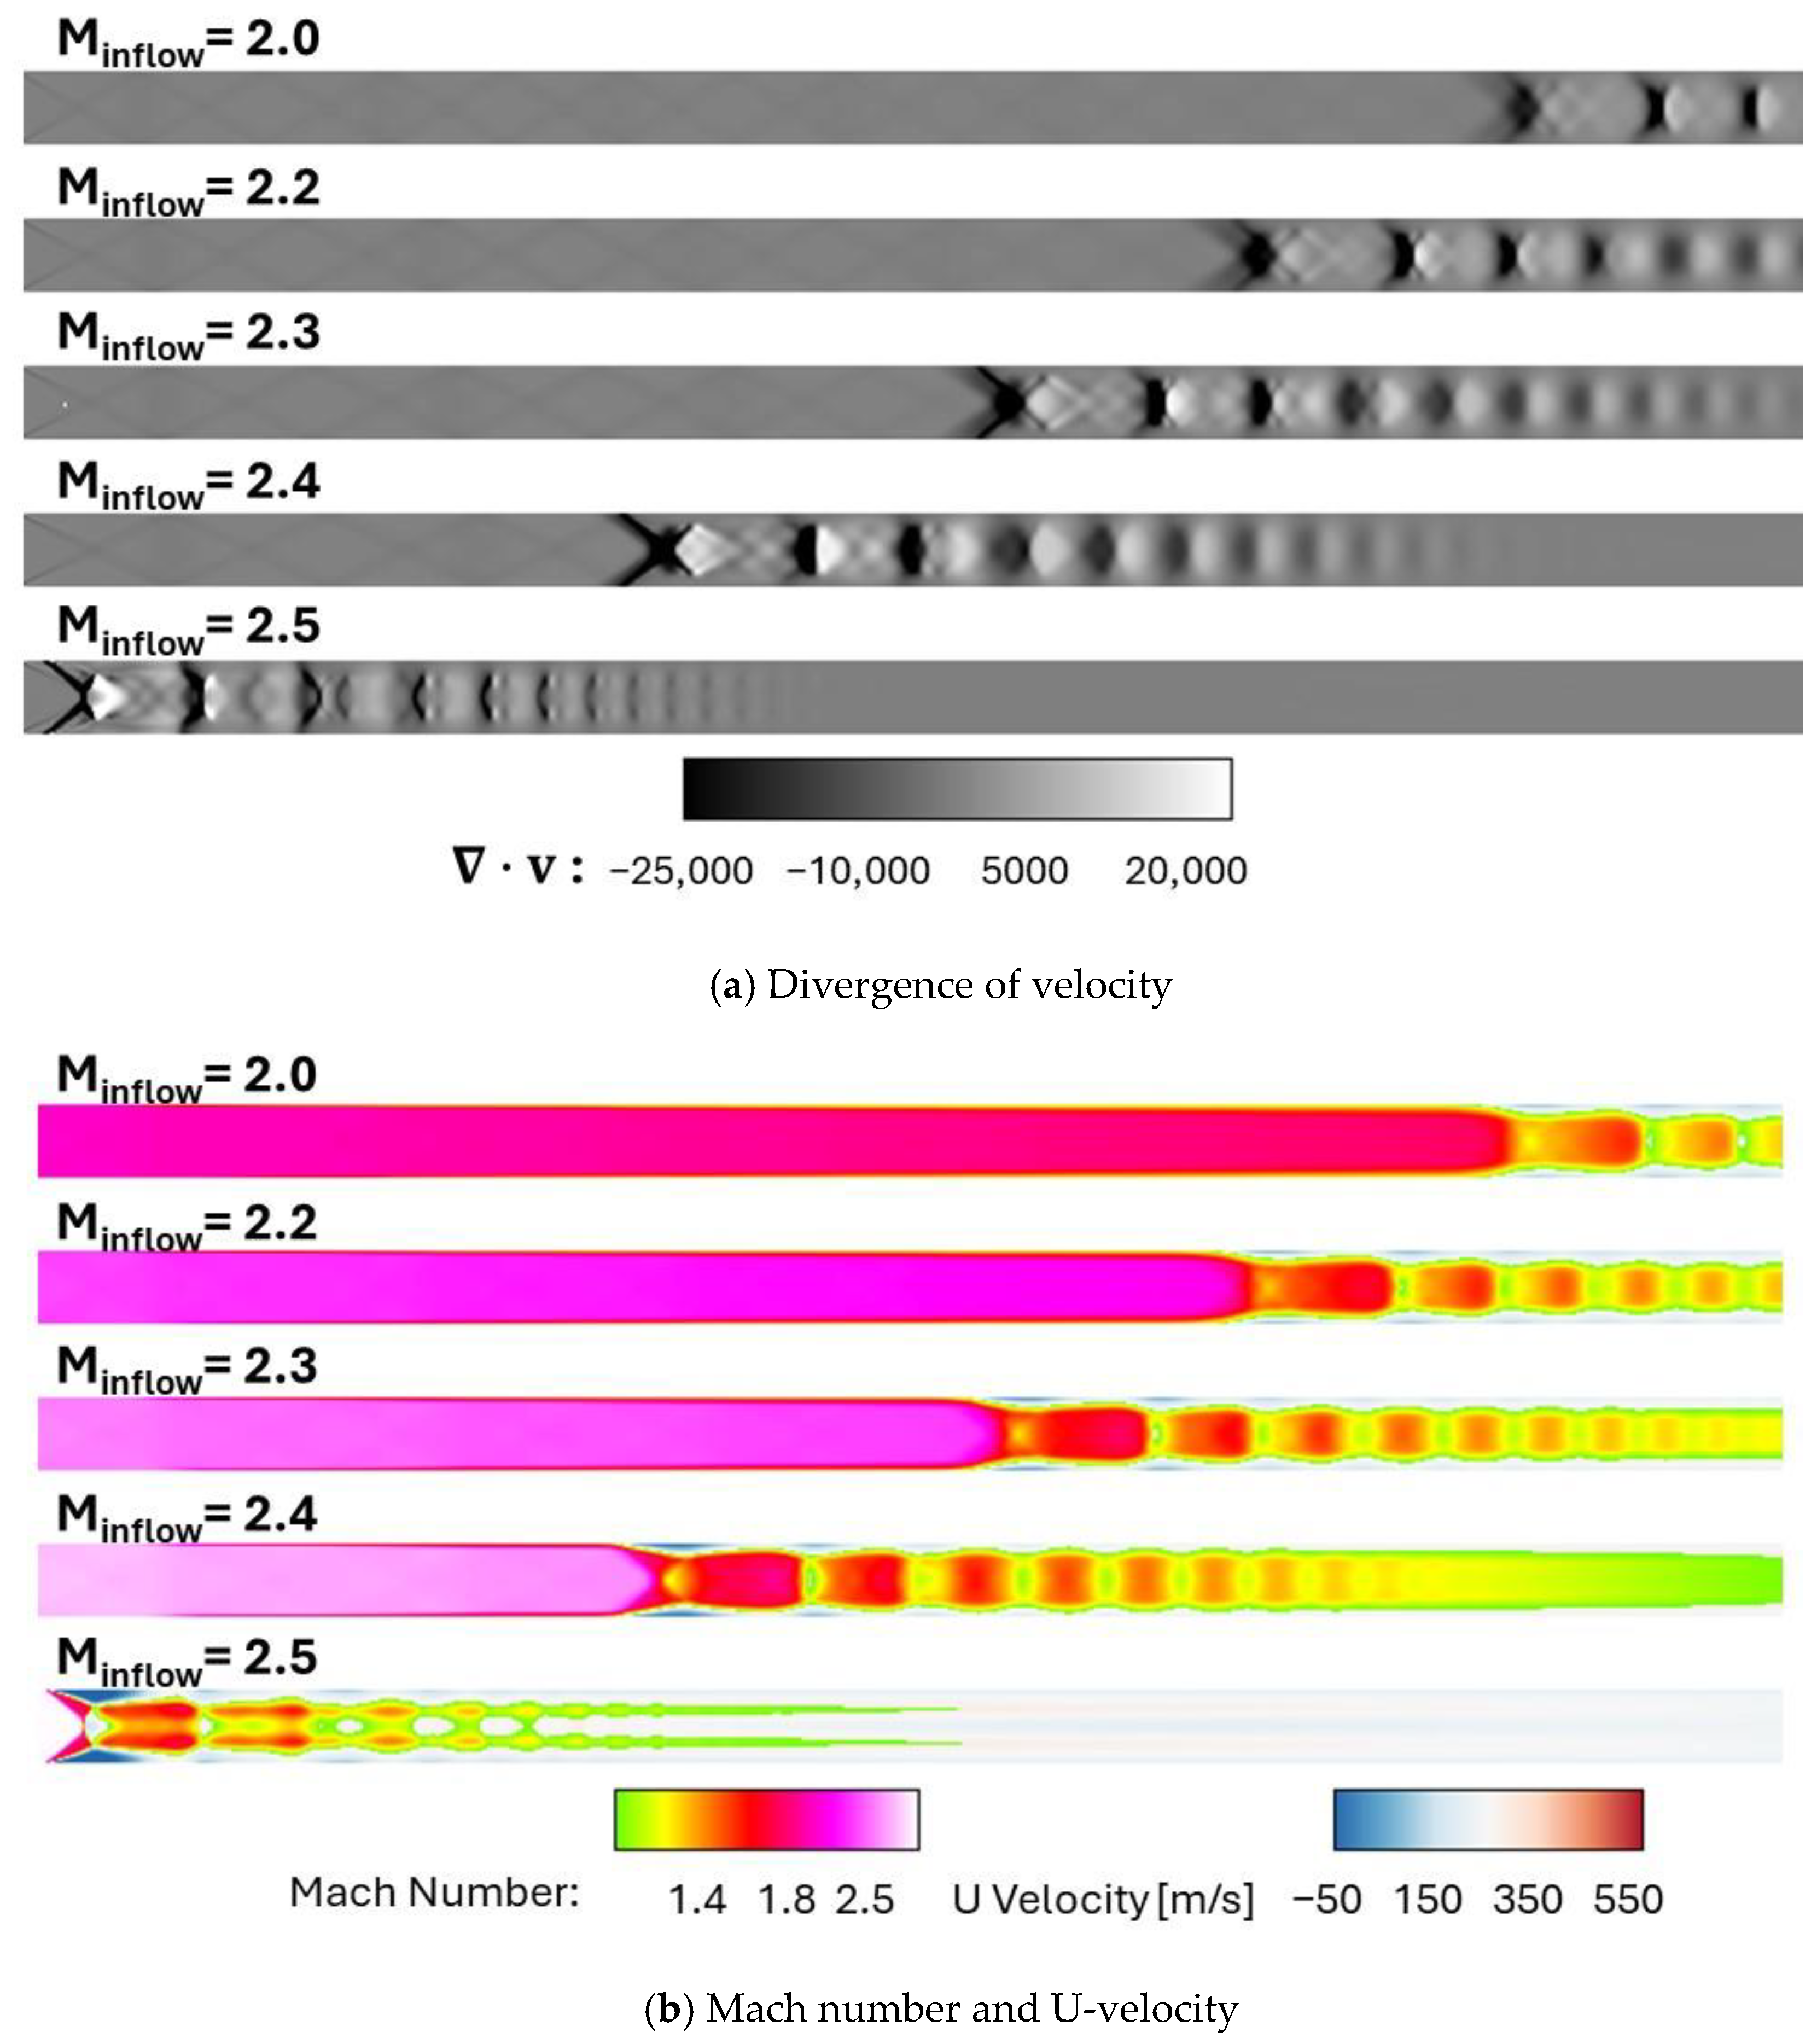
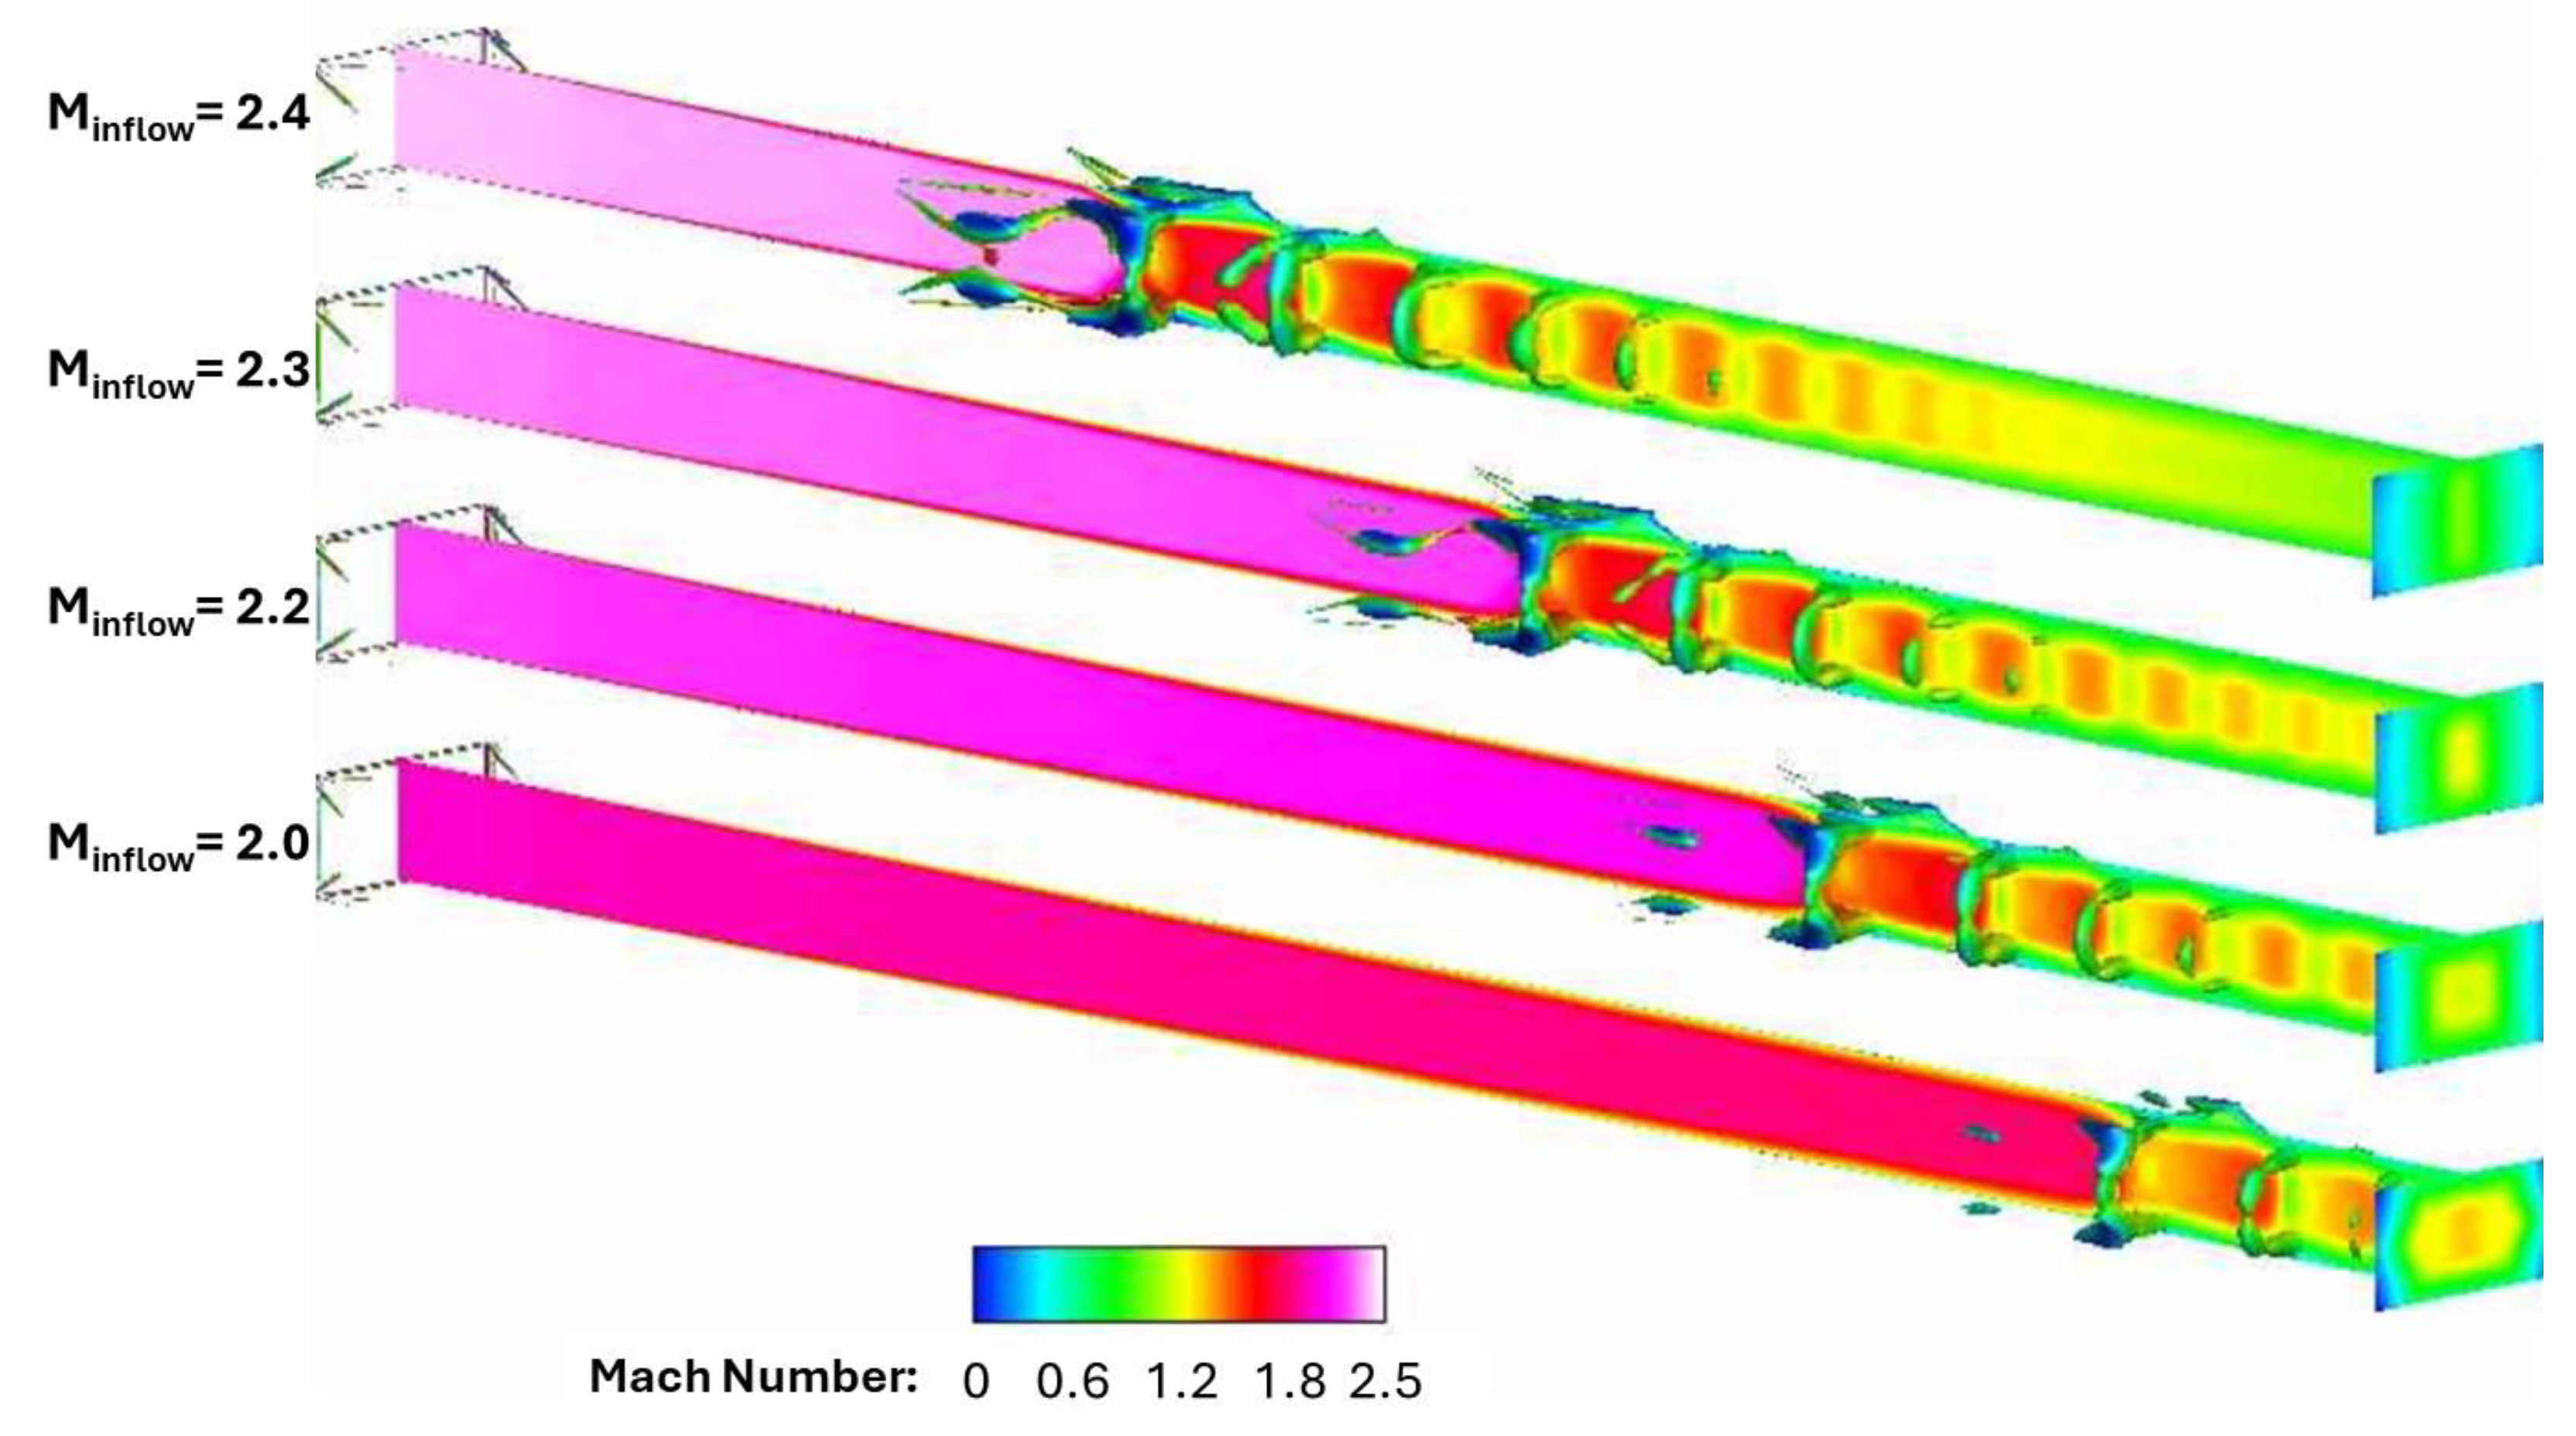
The impact of inflow Mach number on the shock physics in the isolator is shown in
Figure 17 and
Figure 18. The contours in
Figure 17a show the divergence of velocity along the spanwise center plane (z = 0) of the isolator. The contours in
Figure 17b show Mach number and streamwise velocity contours (in blue-red) along the spanwise center plane (z = 0) of the isolator. In these cases, a backpressure ratio of 0.381 was maintained to assess whether unstart could be avoided while also maintaining operability with a small decrease in inflow Mach number. The contours in
Figure 18 show iso-surfaces of a positive Q criterion in addition to the shock structure. These contours show that the vorticity production reduces quite significantly as the inflow Mach number gradually increases with the pseudo shock train, with flow separation on both corner and center plane occurring near the isolator exit, which can be disadvantageous for operation of the combustor because the pseudo shock train does not subside when exiting the isolator. Interestingly, a comparison between the results with inflow Mach number of 2.5 and 2.4 at a backpressure ratio of 0.381 showed surprising results that despite the flow entering at a lower Mach number, the flow following the pseudo shock train remained supersonic while keeping the pseudo shock train far from both ends of the isolator. A 4% decrease in inflow Mach number resulted in significant enhancements in the operability of the isolator, to provide supersonic air to the combustor while also keeping the isolator away from onset of unstart.
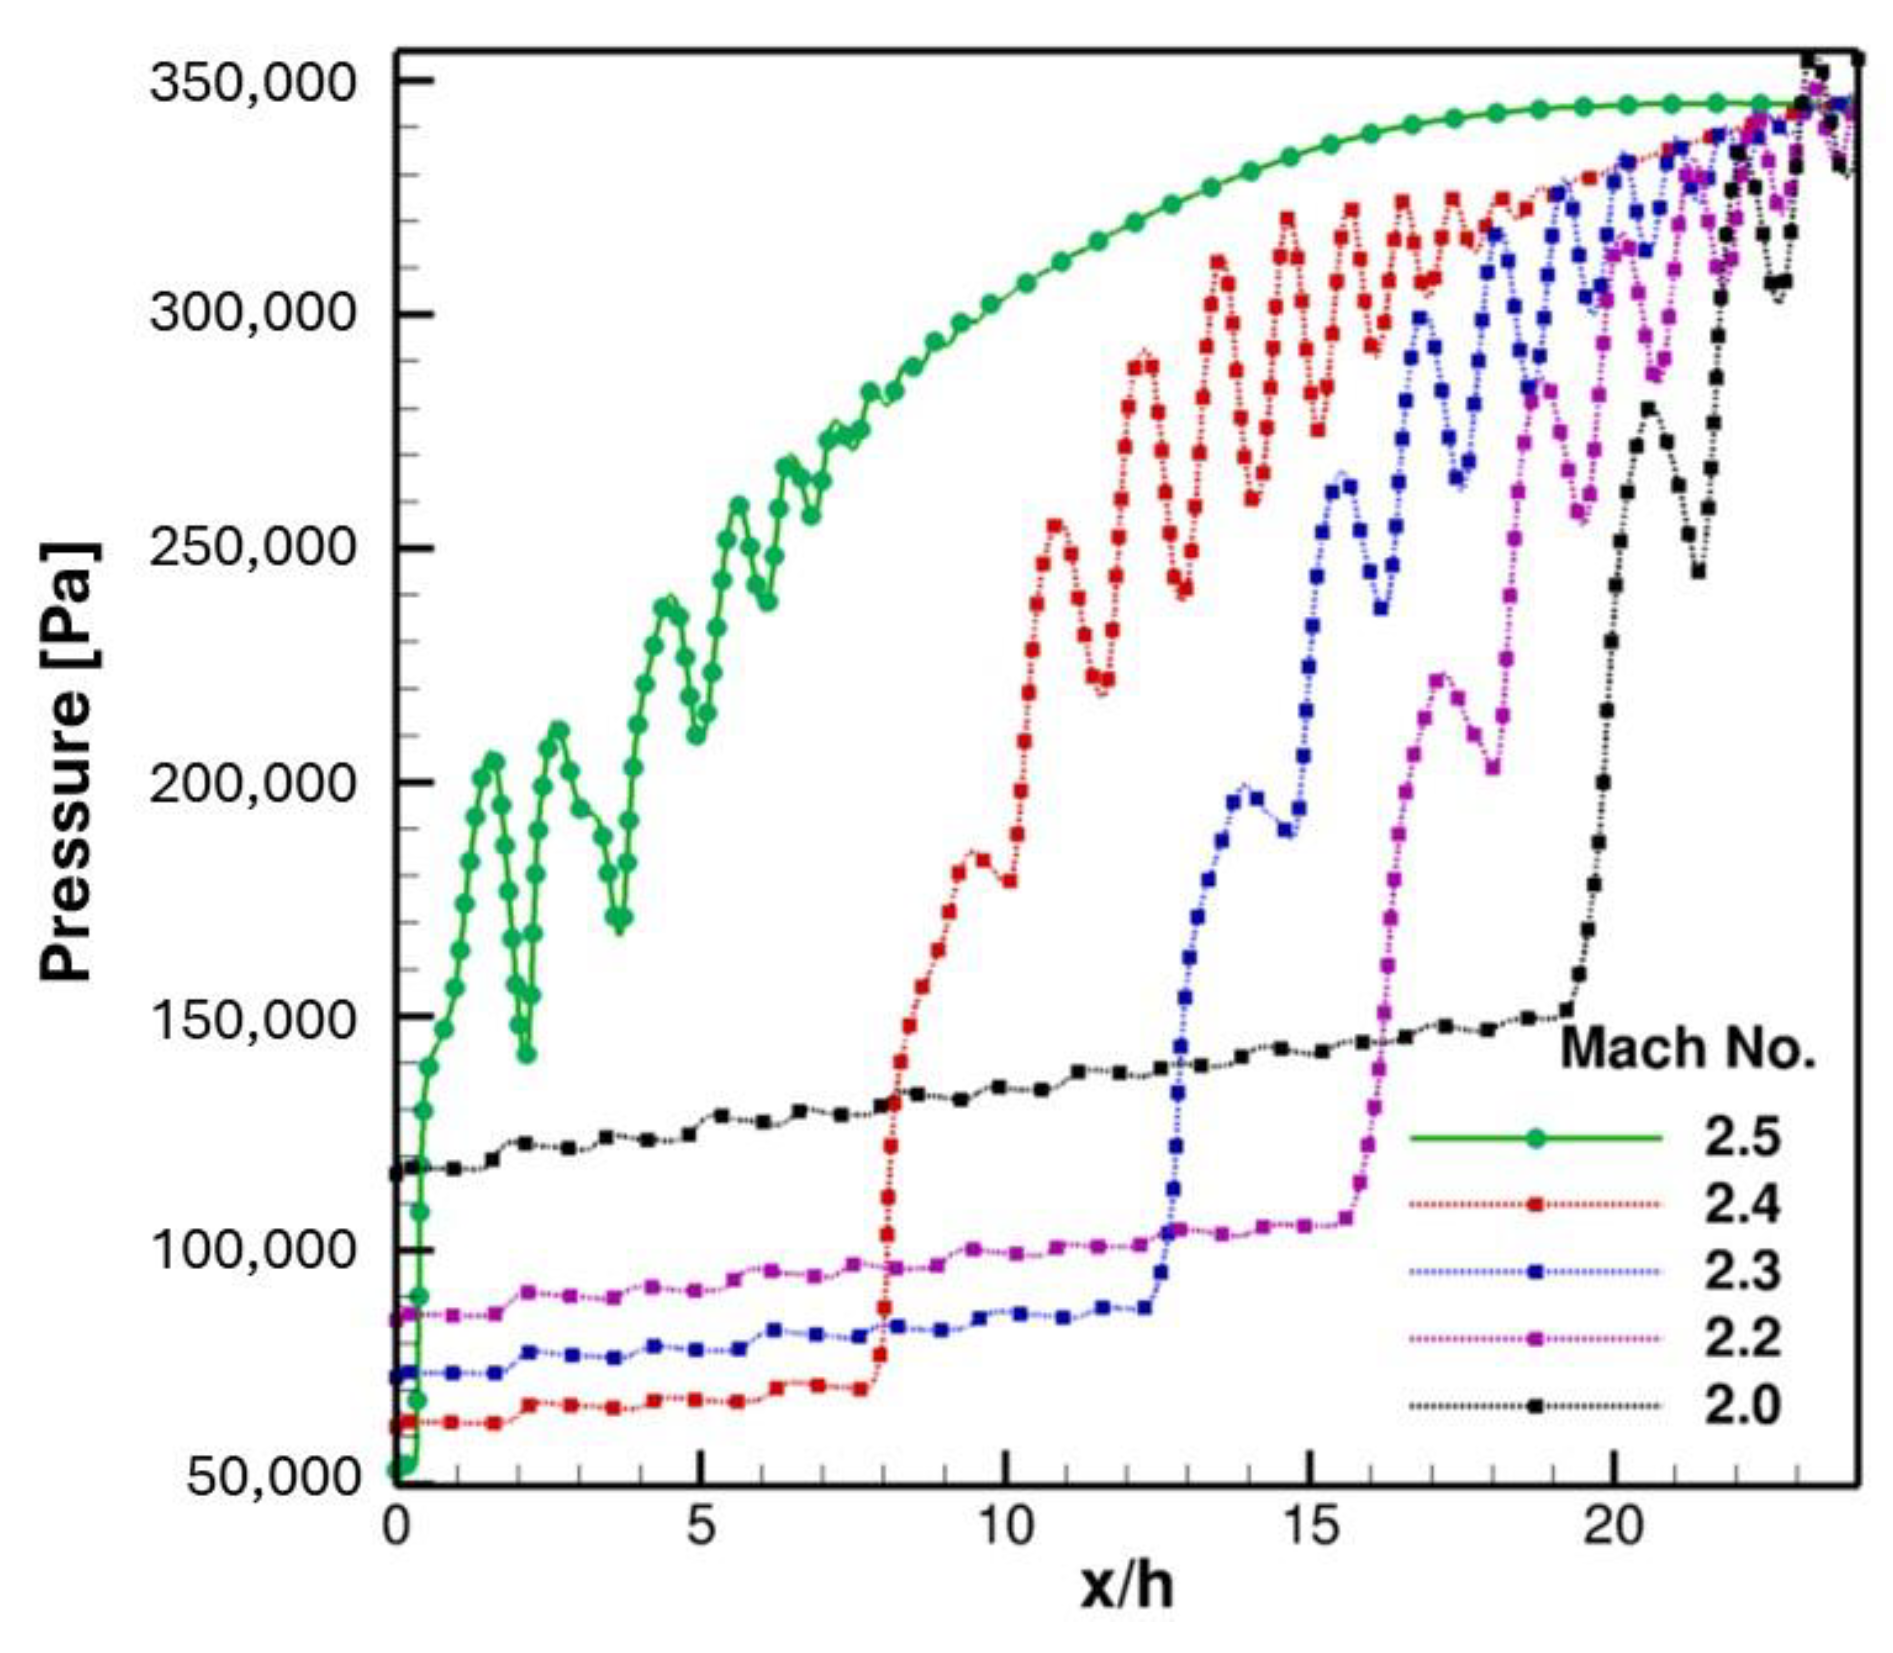
The center-line pressure distribution at the top wall is shown in
Figure 19 for inflow Mach numbers ranging from 2.5 to 2.0 and a backpressure ratio of 0.381. These results show that when inflow Mach number is reduced, the inflow static pressure increases. Decreasing the inflow Mach number to 2.3 or lower resulted in the pseudo shock train not ending at the isolator exit, therefore adversely affecting combustor operability. It is possible to conclude that the magnitude of inflow Mach number reduction while ensuring operability is directly dependent upon the backpressure ratio, as isolator operability is highly sensitive to inflow Mach number.
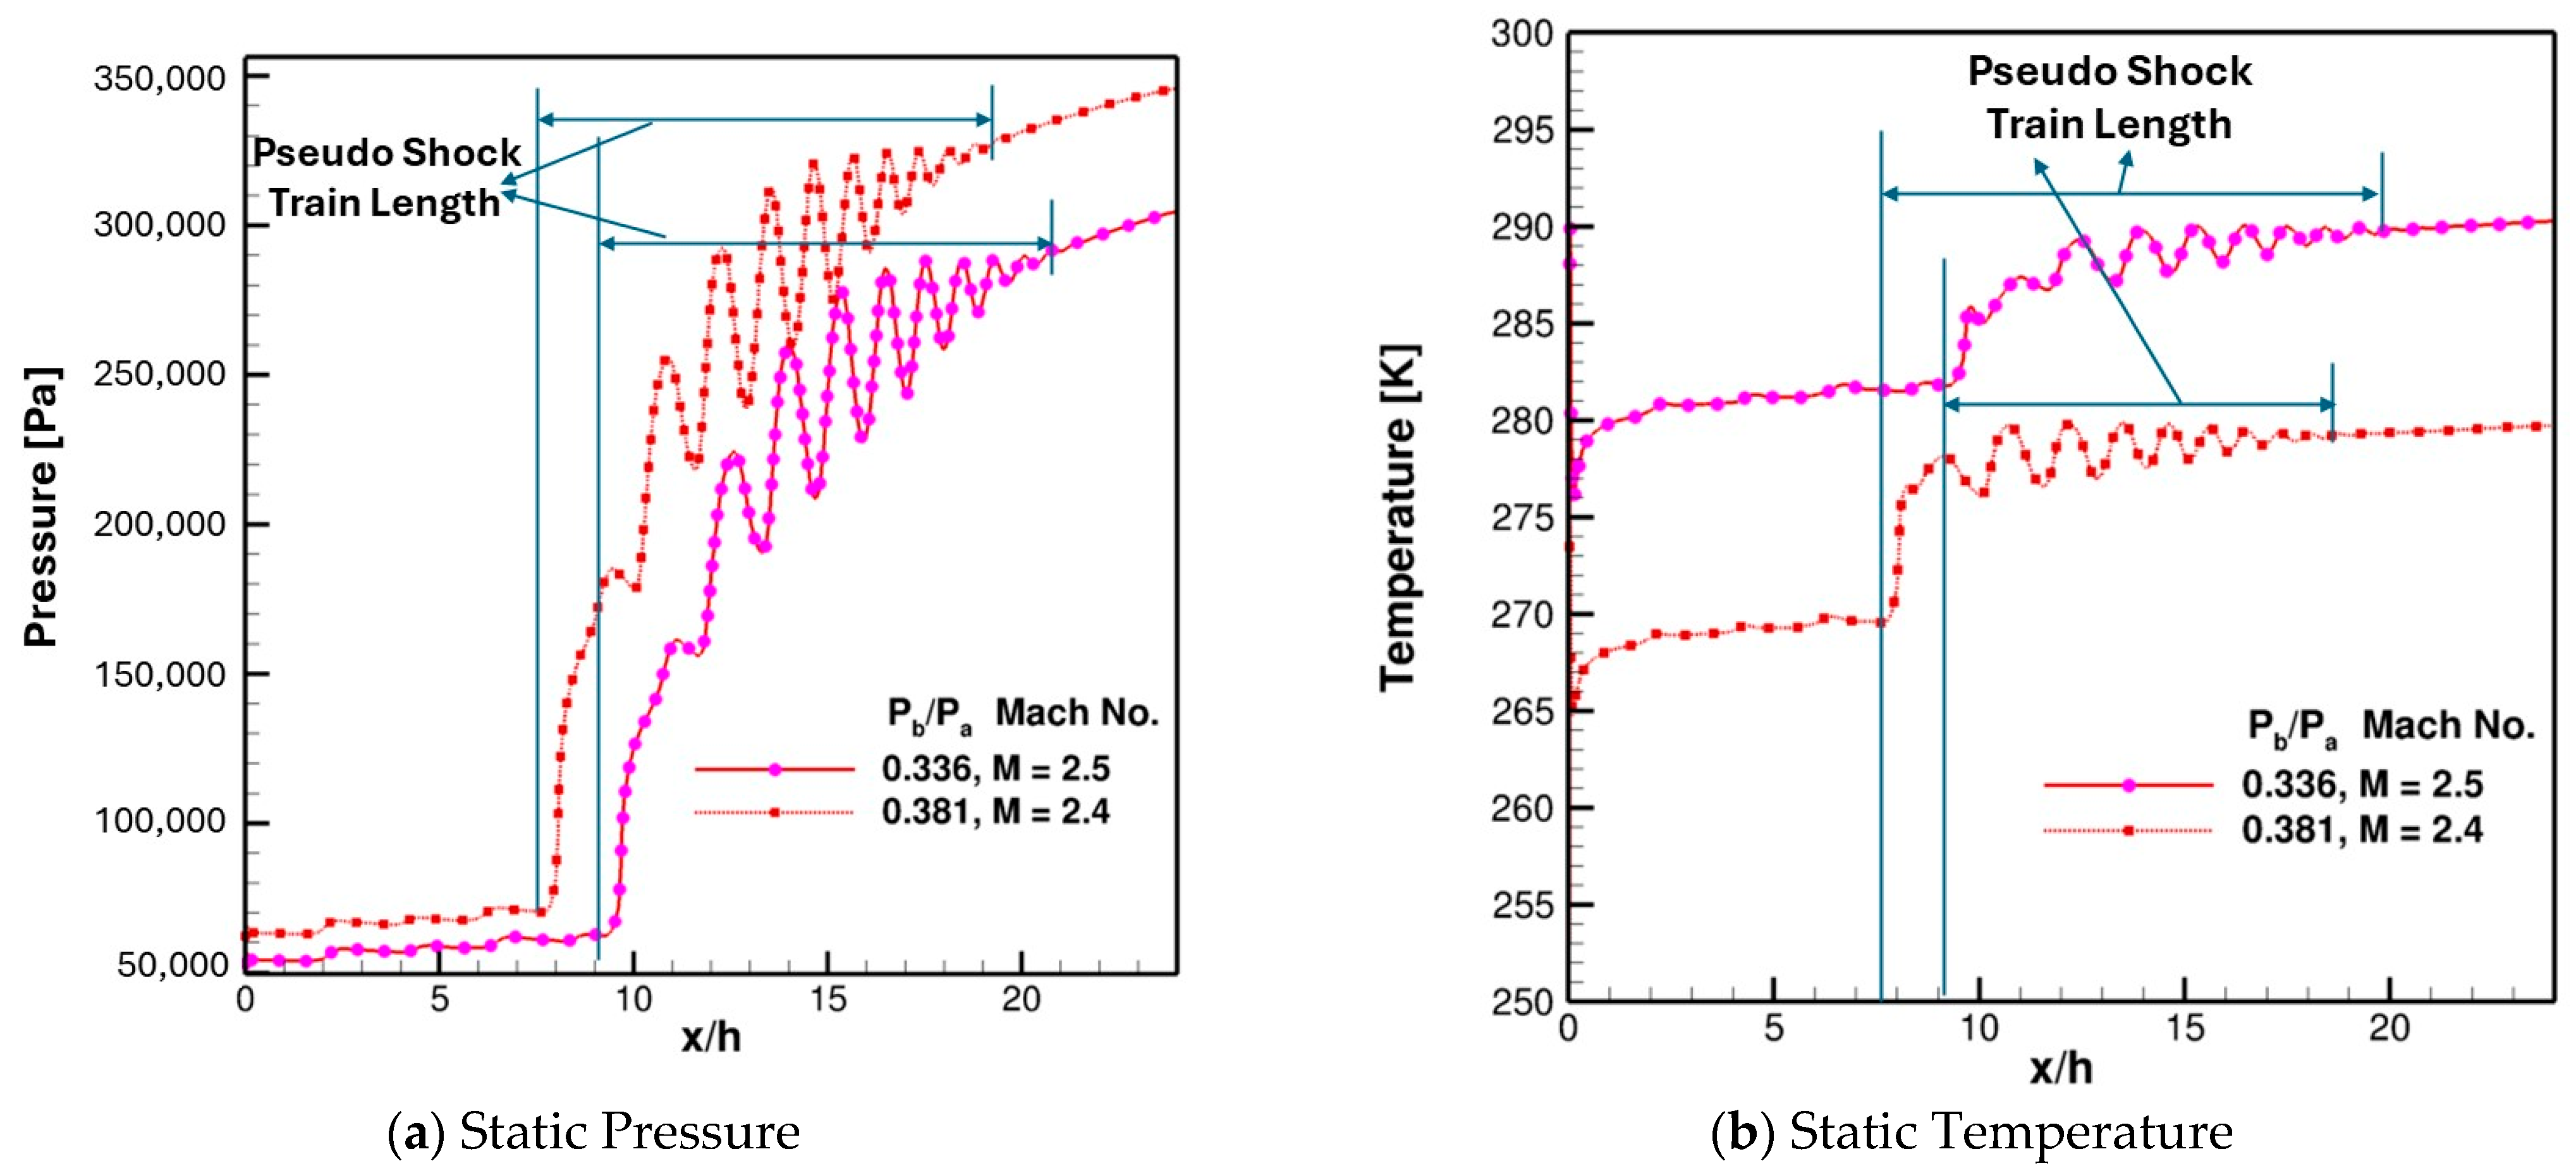
The above analyses show that there are two combinations of inflow Mach number and backpressure ratio that ensure that isolator is not at the risk of unstart and which can also provide operability. These values are backpressure ratios of 0.336 and 0.381 with inflow Mach numbers of 2.5 and 2.4, respectively. To compare these two conditions, center-line pressure distributions at the top wall under these operating conditions are shown in
Figure 20a, and static temperature distributions are shown in
Figure 20b. A side-by-side comparison of divergence of velocity contours in the transverse center plane of the isolator is shown in
Figure 21. These results regarding static pressure, static temperature, and divergence of velocity contours show that both cases provide similar shock-train lengths and comparable performance.
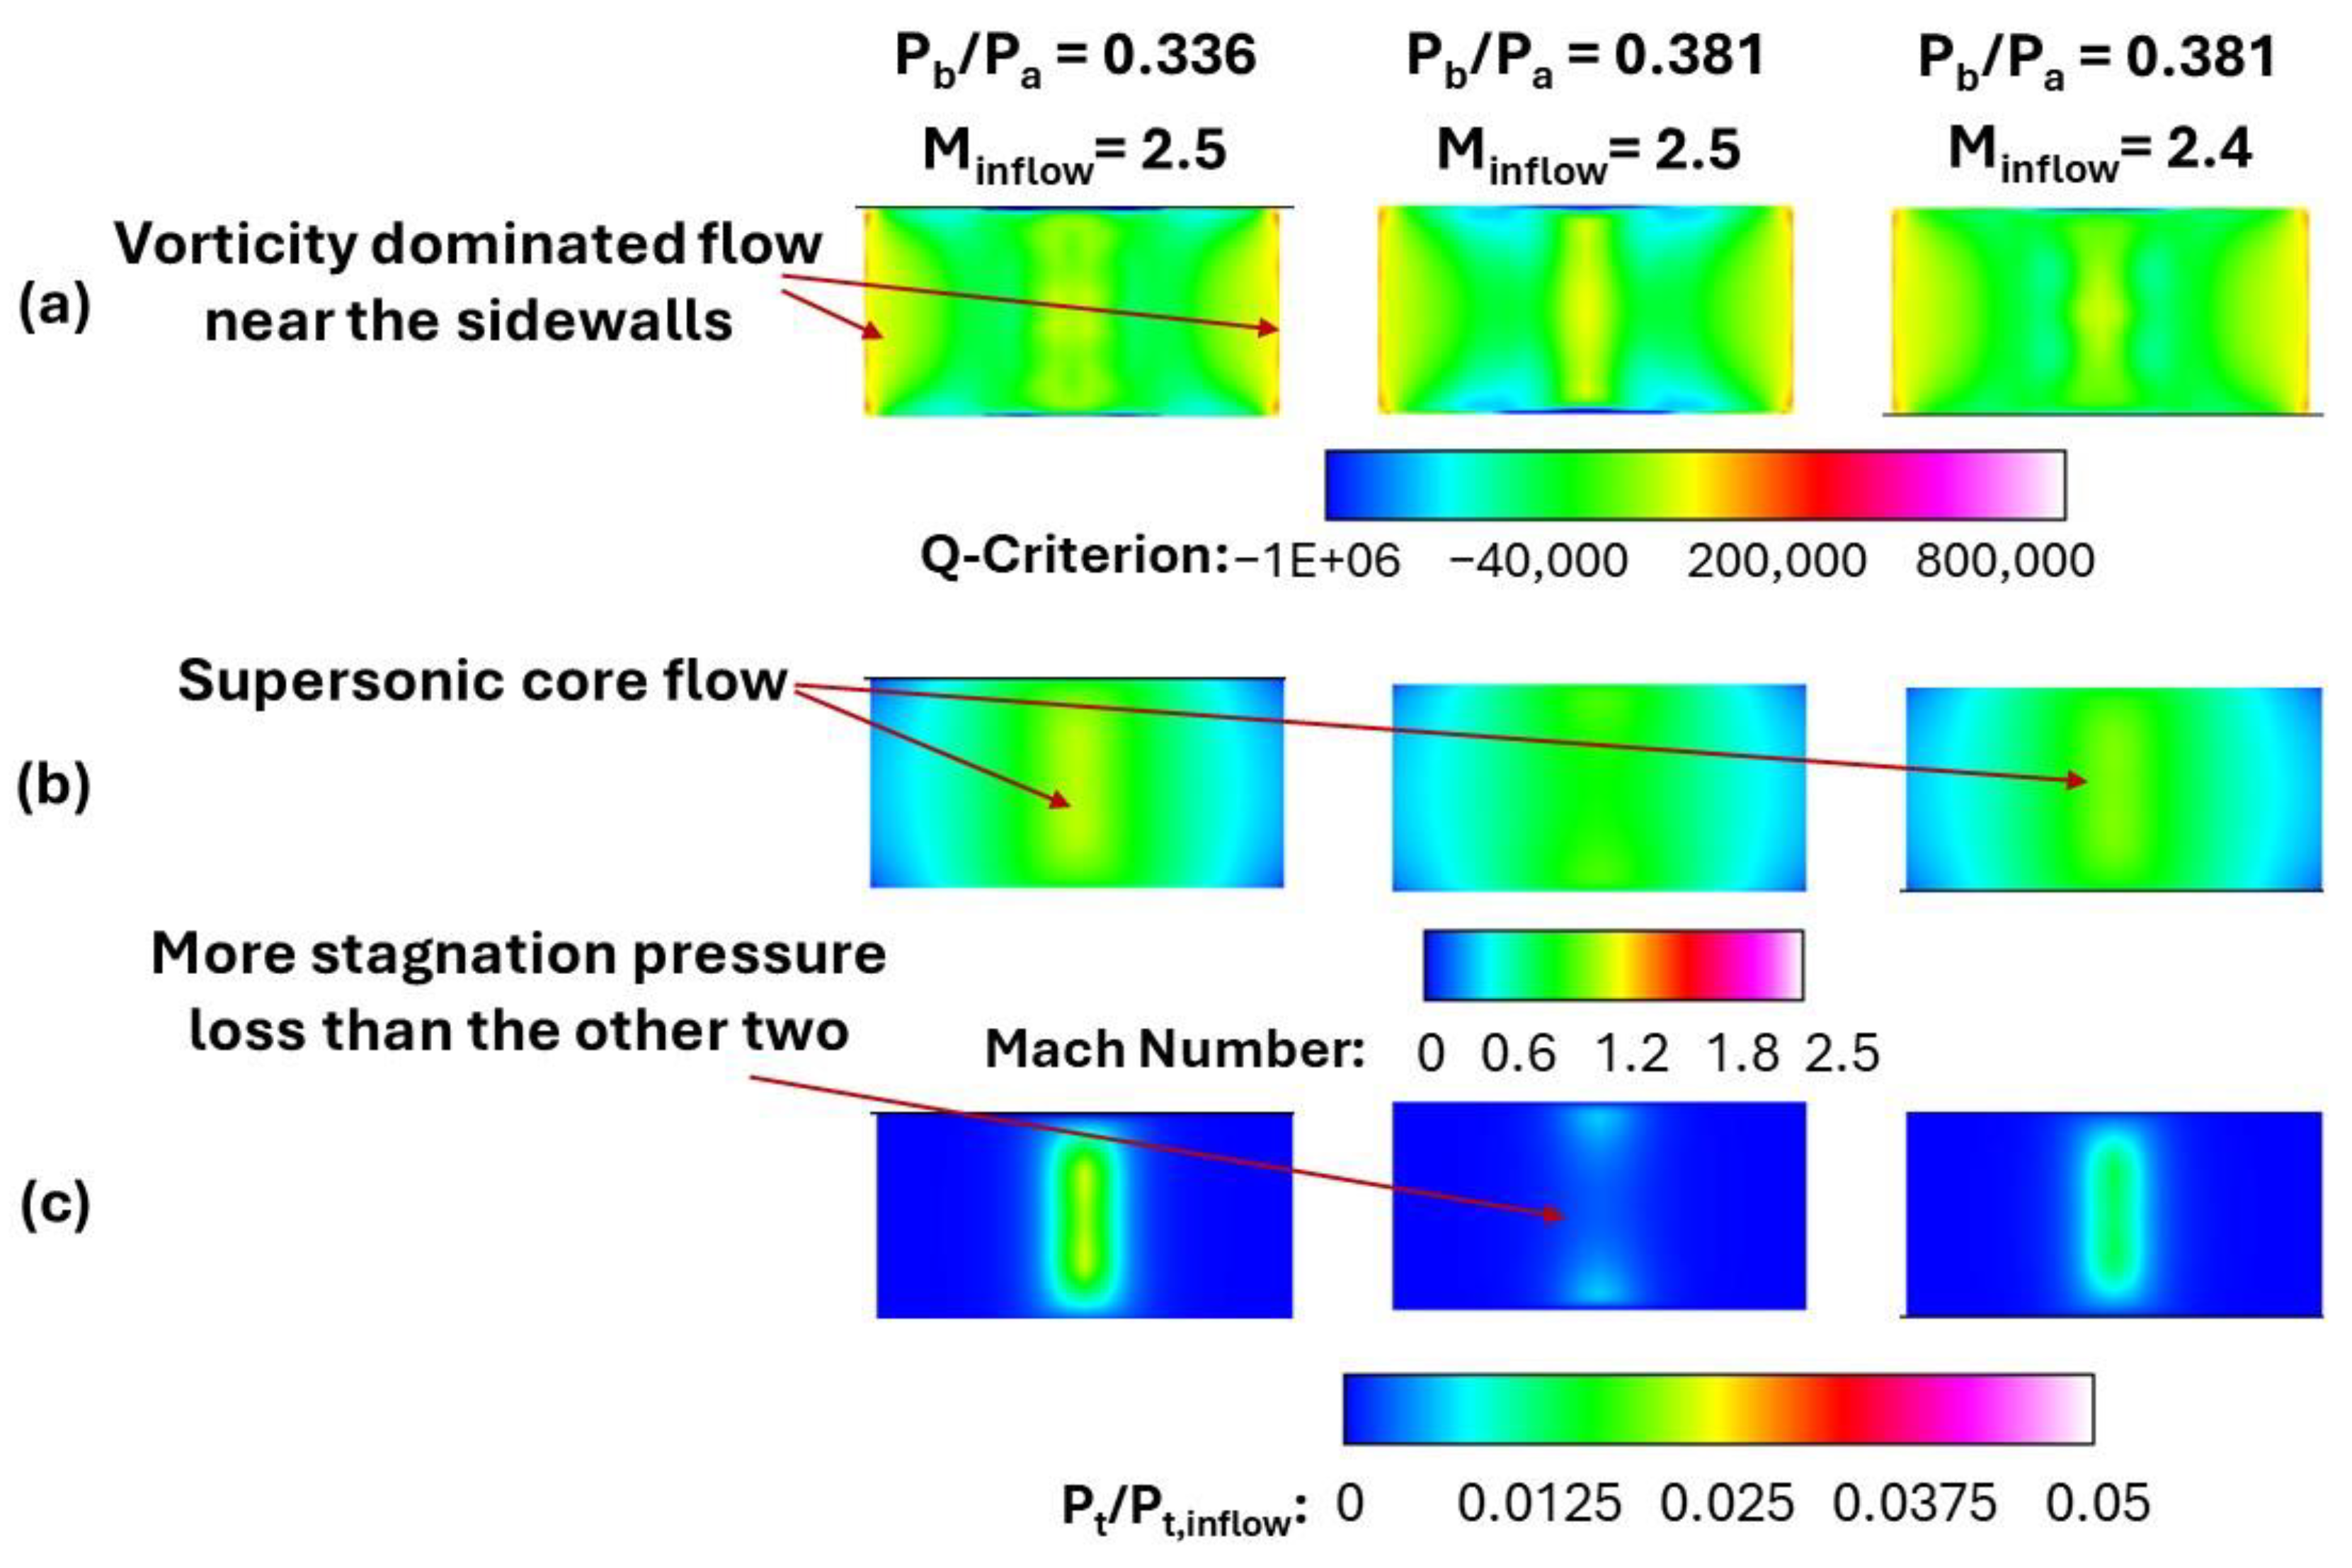
To further compare these two conditions, the Q criterion at the exit plane of the isolator is shown in
Figure 22a. In addition, results for a backpressure ratio of 0.381 and inflow Mach number 2.5 are also shown in this plot. A positive Q-criterion value indicates that the magnitude of vorticity is greater than the magnitude of strain, suggesting a vortex. A negative Q-criterion value indicates that the magnitude of strain is greater than the magnitude of vorticity, meaning that the flow is dominated by stretching and compression instead of rotation or vorticity. As shown in these plots, vorticity production is dominant near the side walls and in the core flow, while the top wall shows that stretching and compression dominate the flow. These results show that flow stretching and compression increase when the backpressure ratio increases to 0.381 when the inflow Mach number is 2.5. Mach number contours at the isolator exit plane show that there is significant variation of flow in the spanwise direction (i.e., along the width of the isolator) and the flow is supersonic only at the core region (central part of the cross-section) in the cases when backpressure ratios are 0.336 and 0.381 with inflow Mach numbers of 2.5 and 2.4, respectively. Likewise, the total pressure contours at the exit plane normalized by the inflow total pressure show significant total pressure loss but a similar pattern for each of the two cases. Even though the spanwise and transverse center-plane contours as well as the top-wall and side-wall static pressure distributions show that the flow remained supersonic with these two operating conditions, it can be observed that only the small core region included supersonic flow, while the Mach number away from the core reduced to below 1. Similar behavior was observed with respect to the total pressure loss.
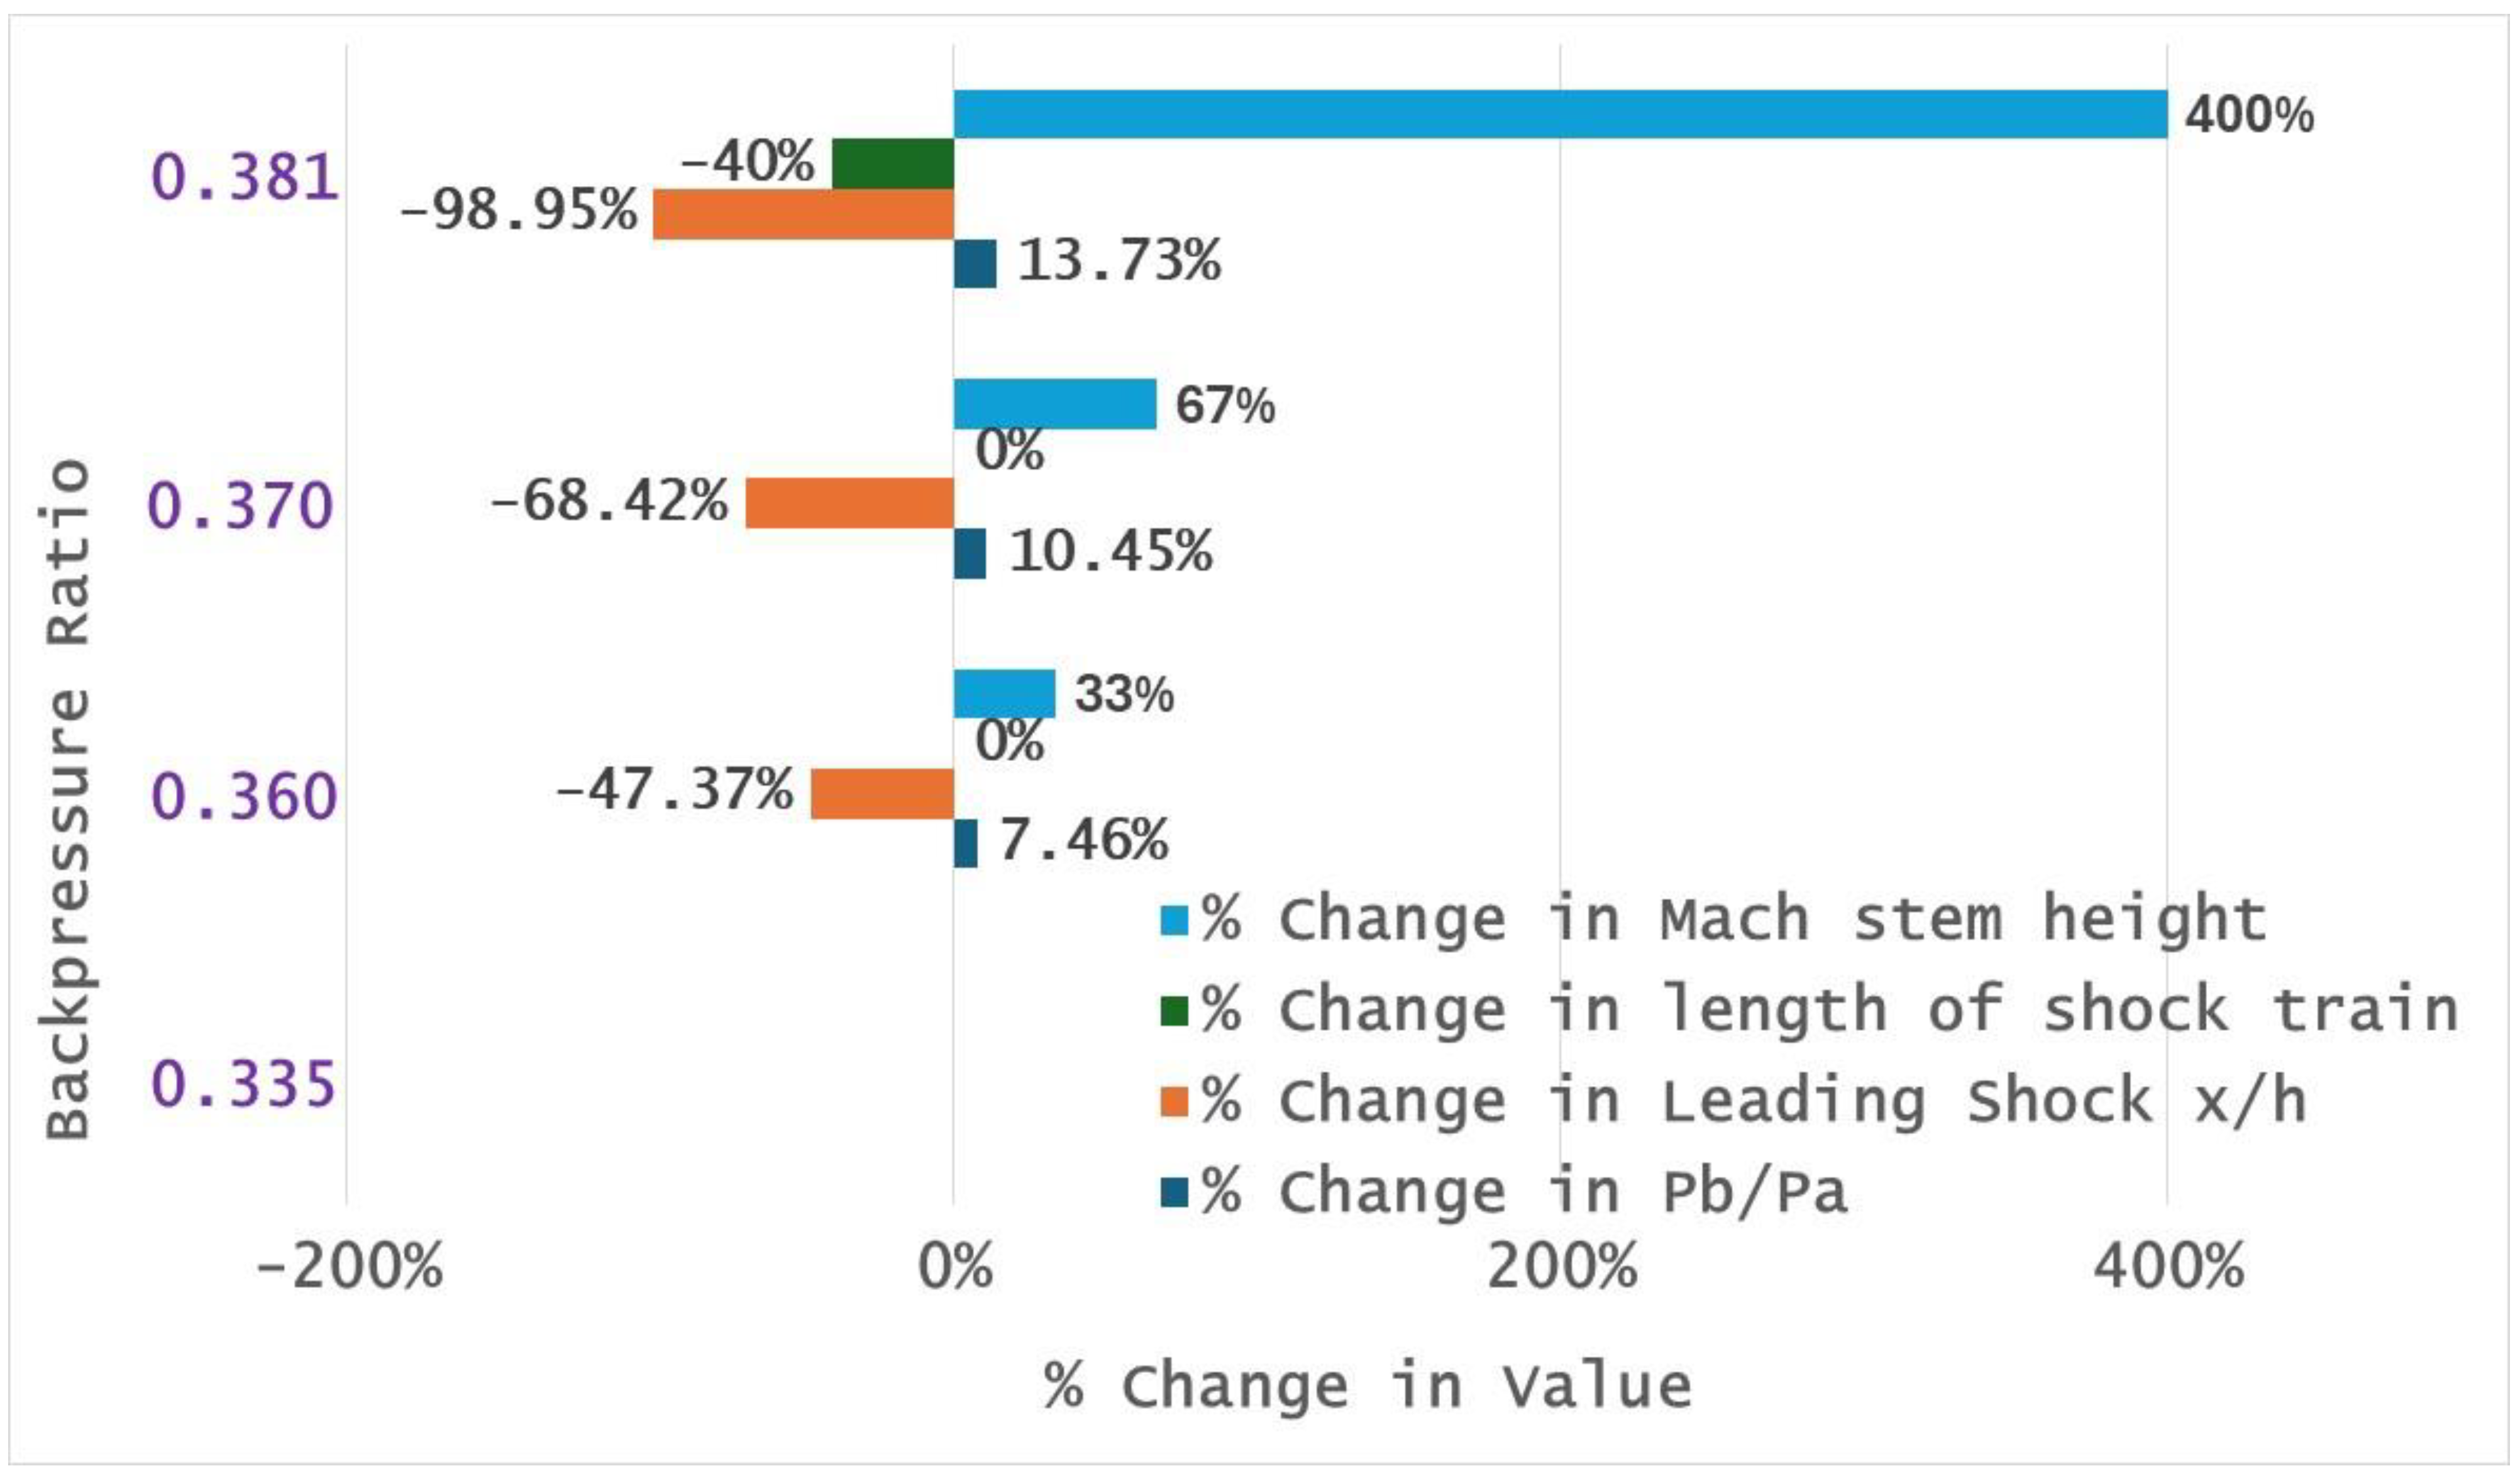
A summary of the effects of backpressure ratio and inflow Mach number on the onset of unstart metrics such as location of the leading shock (in terms of x/h), length of shock train (in terms of x/h), and Mach stem height (in terms of fraction of the isolator height) is shown in
Table 2 and
Table 3, with corresponding plots in
Figure 23 and
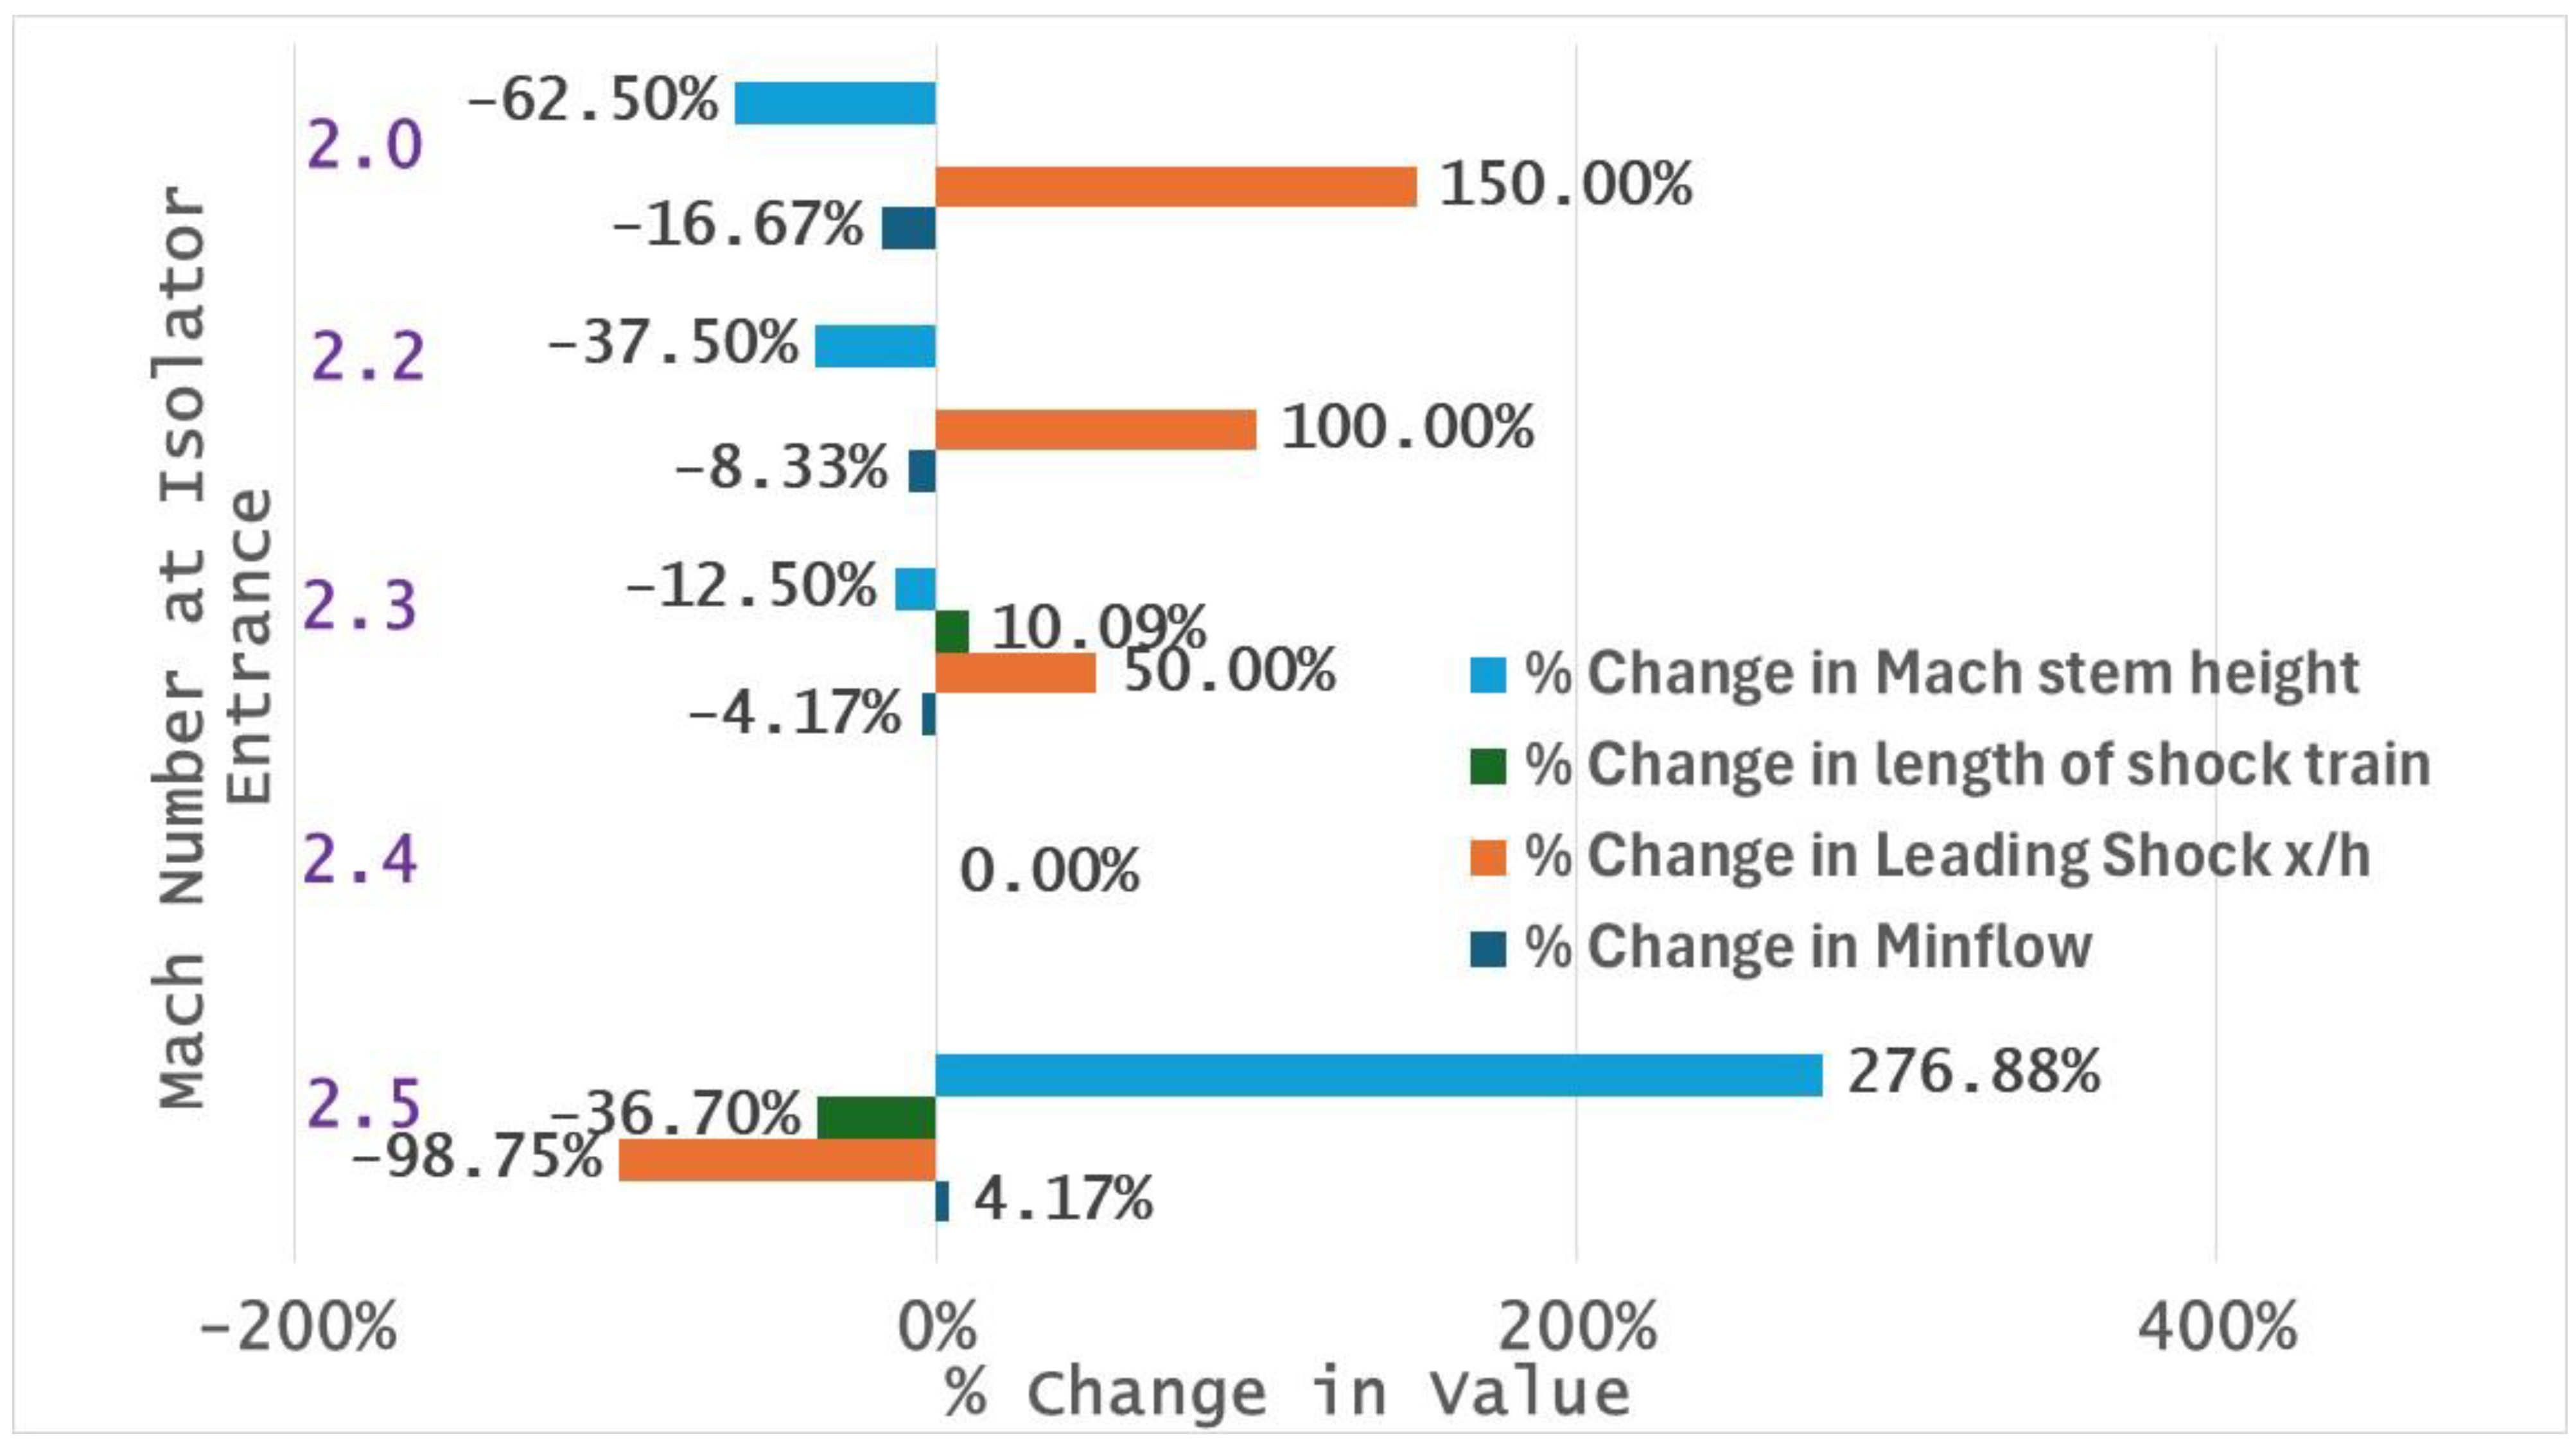
Figure 24. Regarding the sensitivity of onset of unstart metrics to isolator entrance Mach number, the percentage change in inflow Mach number and corresponding values of onset of unstart metrics have been normalized by the corresponding values at Minflow = 2.0.
The calculations show the two extremes and present several interesting conclusions, as follows.
Inflow Mach number has a stronger impact on pseudo shock train and shock–boundary layer interactions inside the isolator compared with the backpressure ratio.
- ○
By reducing the inflow Mach number by a mere 4%, the pseudo shock train can be positioned far from the isolator entrance, thereby reducing the risk of onset of unstart. For example, once the inflow Mach number is reduced from 2.5 to 2.4 (4%), the leading shock location changes from x/h = 0.1 to x/h = 8, which is as 99% change in the leading shock location.
- ○
Reducing the inflow Mach number by more than 4% can result in the pseudo shock train exiting the isolator exit and therefore, entering the combustor (which is typically located at the isolator exit), with adverse effects on combustor operation. For example, once the inflow Mach number is reduced from 2.5 to 2.3 (8%), the leading shock location changes from x/h = 0.1 to x/h = 12 and the end of pseudo shock train changes from x/h = 7.0 to x/h = 24, which means that it ends at the isolator exit, as the isolator length is x/h = 24.
Backpressure ratio significantly impacts pseudo shock train and shock–boundary layer interactions inside the isolator. However, its impact is weaker compared withthe inflow Mach number at the isolator entrance. For example, an increase of 13.73% in backpressure ratio from a value of 0.335 to 0.381 results in 99% change in leading shock location from x/h = 9.5 to x/h = 0.1. In comparison, such an effect can be generated by a 4% change in inflow Mach number from Minflow = 2.4 to Minflow = 2.5.
Vorticity production is dominant near the sidewalls, increasing significantly when the backpressure increases but reducing when the inflow Mach number is reduced by a small percentage.
There is significant variation in the flow characteristics (such as total pressure, Mach number) in the spanwise direction. While the core flow characteristics remain supersonic and total pressure loss is minimized when either the inflow Mach number or backpressure ratio is decreased, the flow away from the small core transitions to Mach numbers below 1 for all cases.
An important insight from the above research is that the length of the pseudo shock train decreases irregularly, and the Mach stem height increases discontinuously. When the backpressure ratio increases from 0.335 to 0.370, the length of the pseudo shock train does not change even though the leading shock location moves upstream towards the isolator entrance. However, when the backpressure ratio increases to 0.381, the length of the pseudo shock train decreases by 40% and the Mach stem height increases by 400%.
As the inflow Mach number decreases by 4% from a value of 2.5 to 2.4, the Mach step height reduces by 277% and the length of pseudo shock train increases by 37%.
These observations emphasize that monitoring the length of the pseudo shock train and height of the Mach stem are stronger indicators of onset of unstart than the location of the leading shock. This is an important conclusion for design of instrumentation and closed-loop adaptive feedback control systems for scramjet flight operations.


