
Unsteady Numerical Investigation into the Impact of Isolator Motion on High-Mach-Number Inlet Restart via Throat Adjustment


Abstract
1. Introduction
2. Variable Geometry Scheme for Inlet
2.1. Inlet Model
2.2. Throat Adjustment Mechanism
3. Numerical Method and Validation
3.1. Chimera Grid
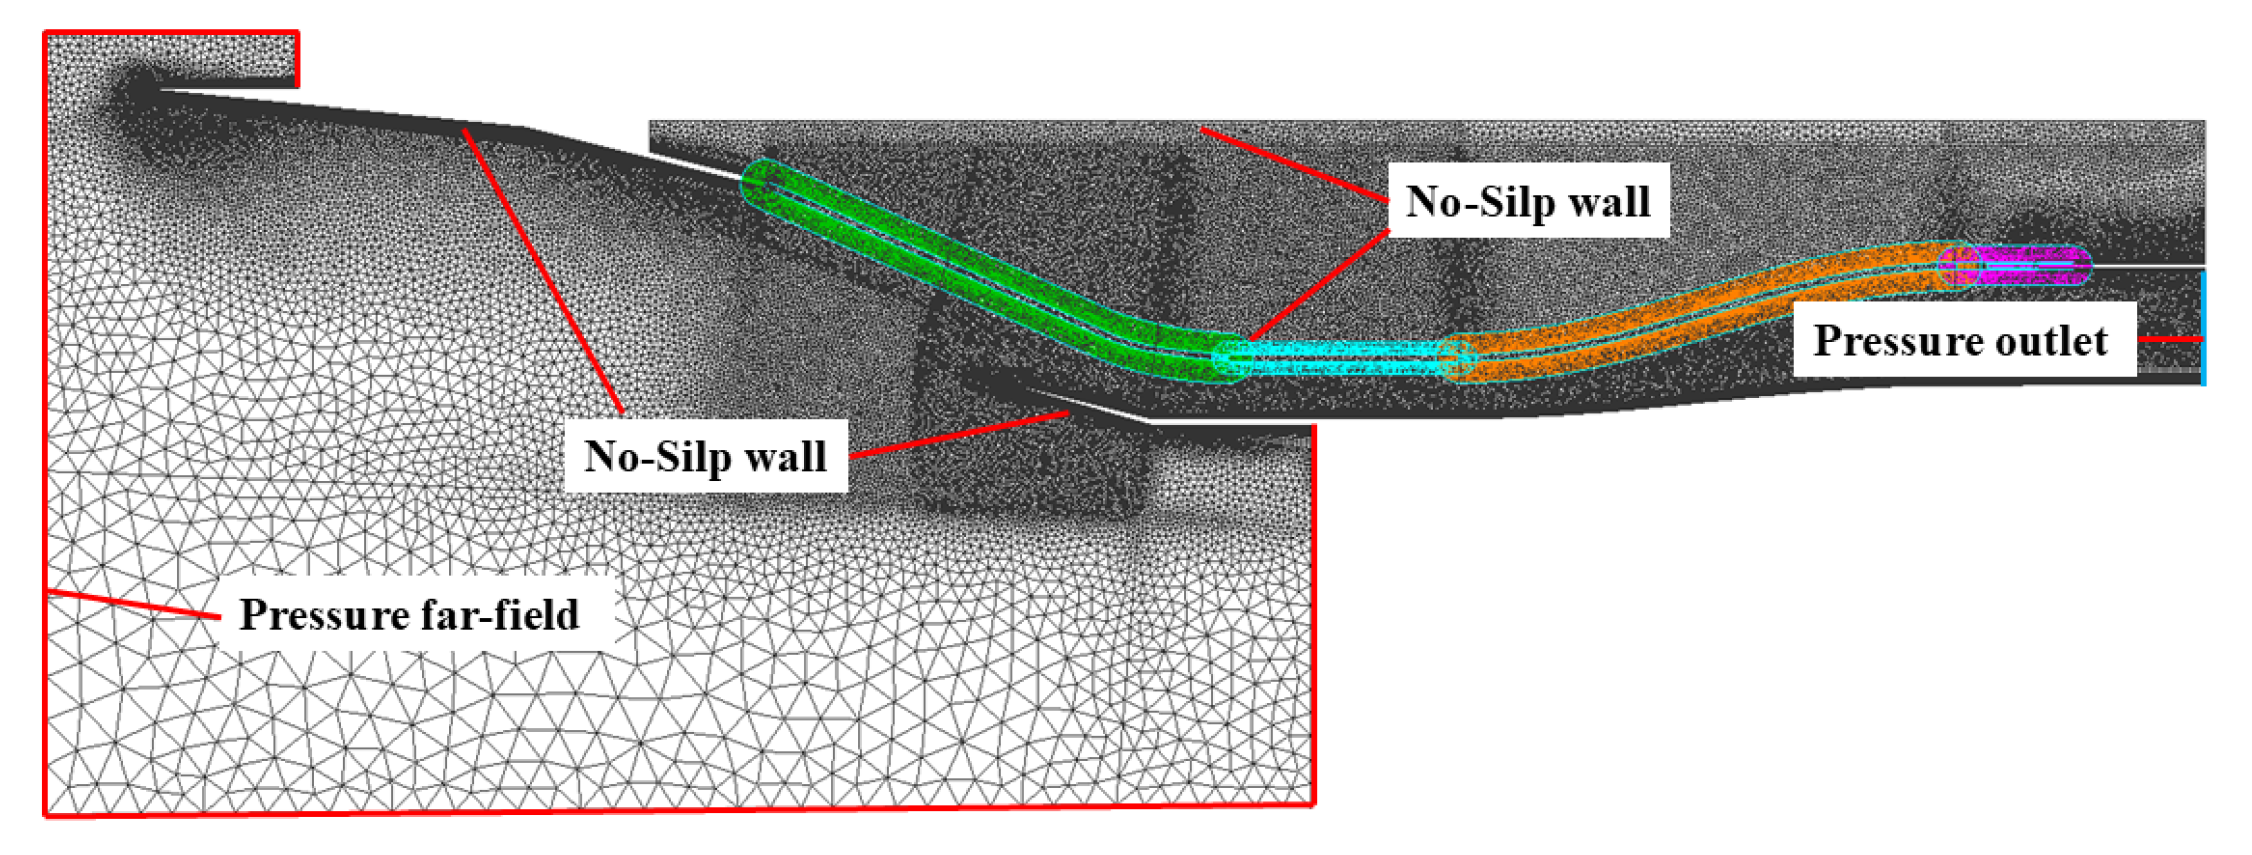
3.2. Numerical Simulation Setup
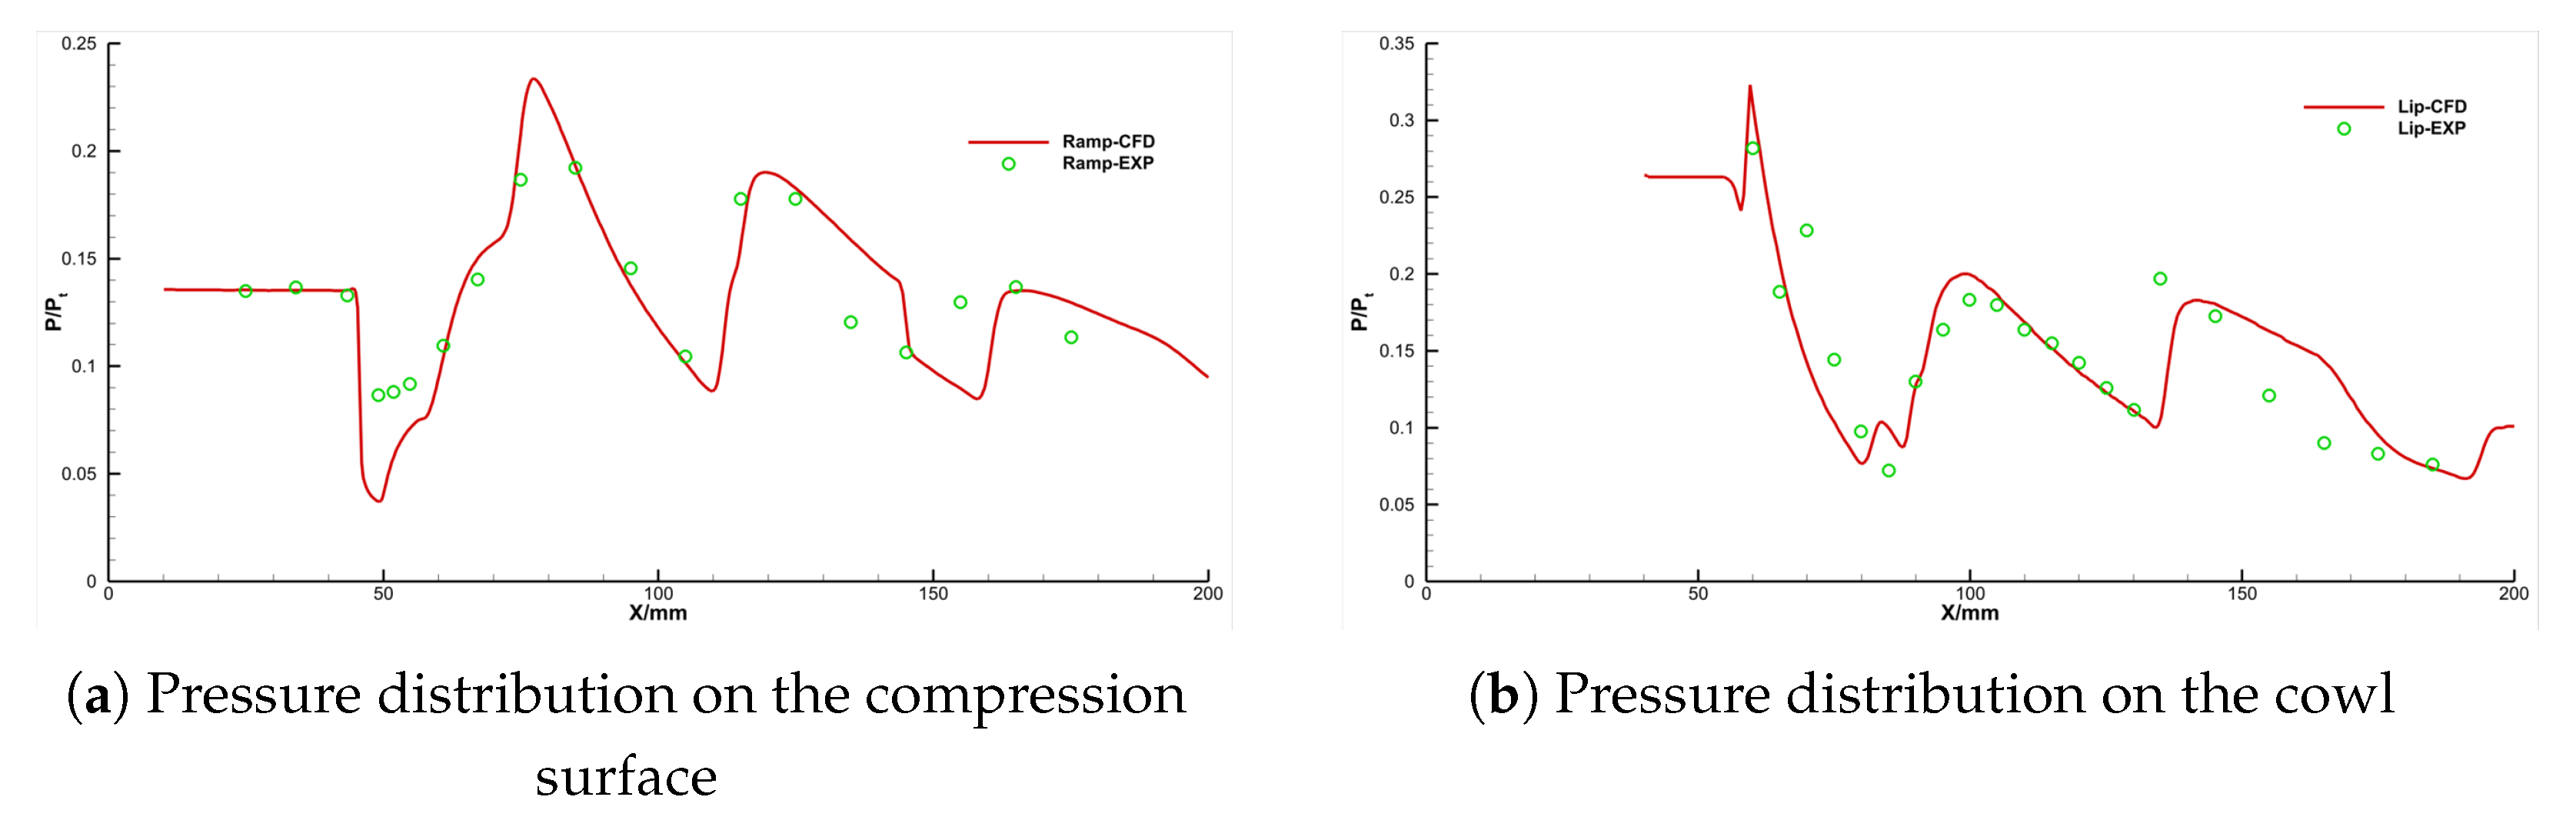
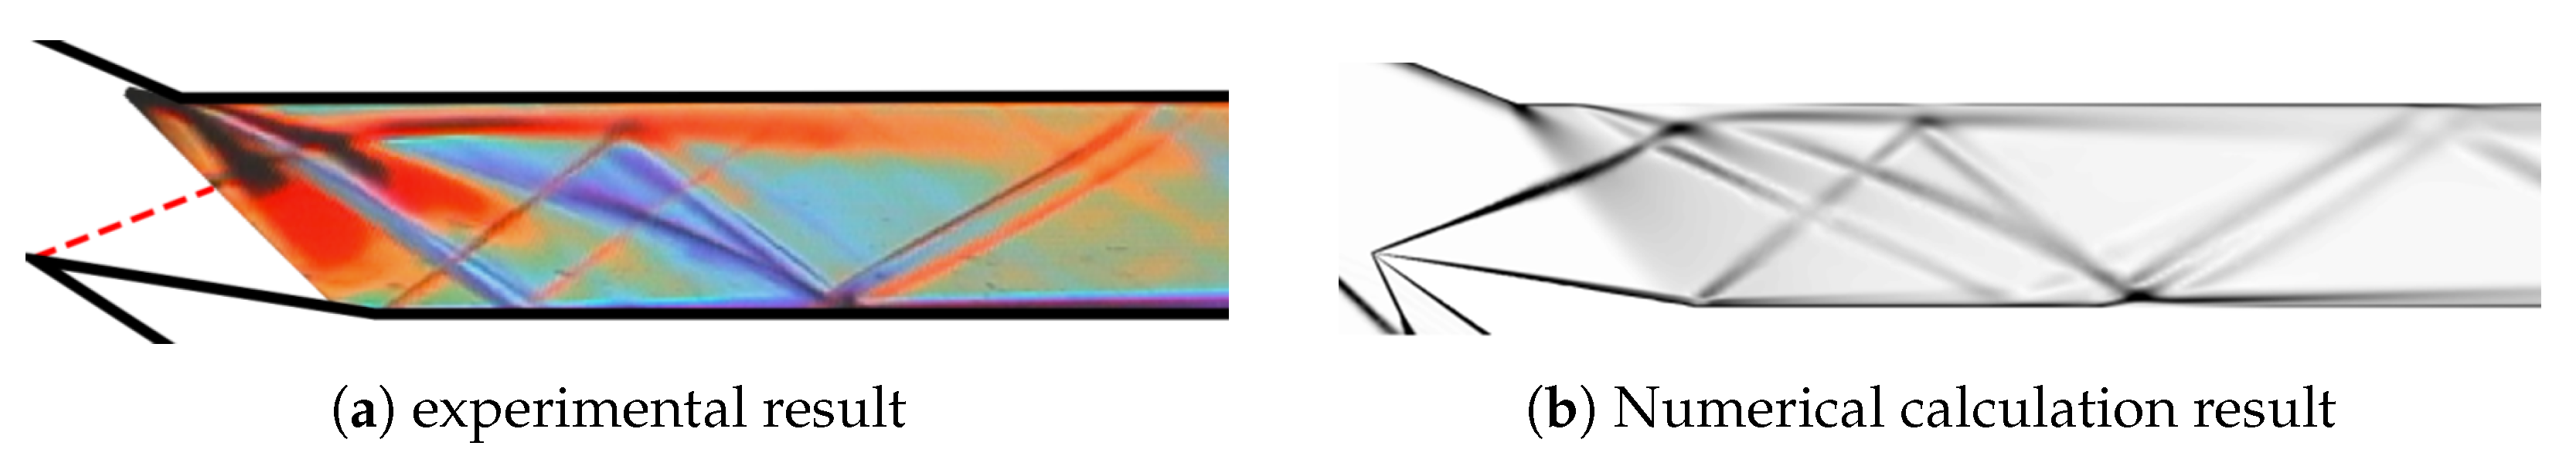
3.3. Validation
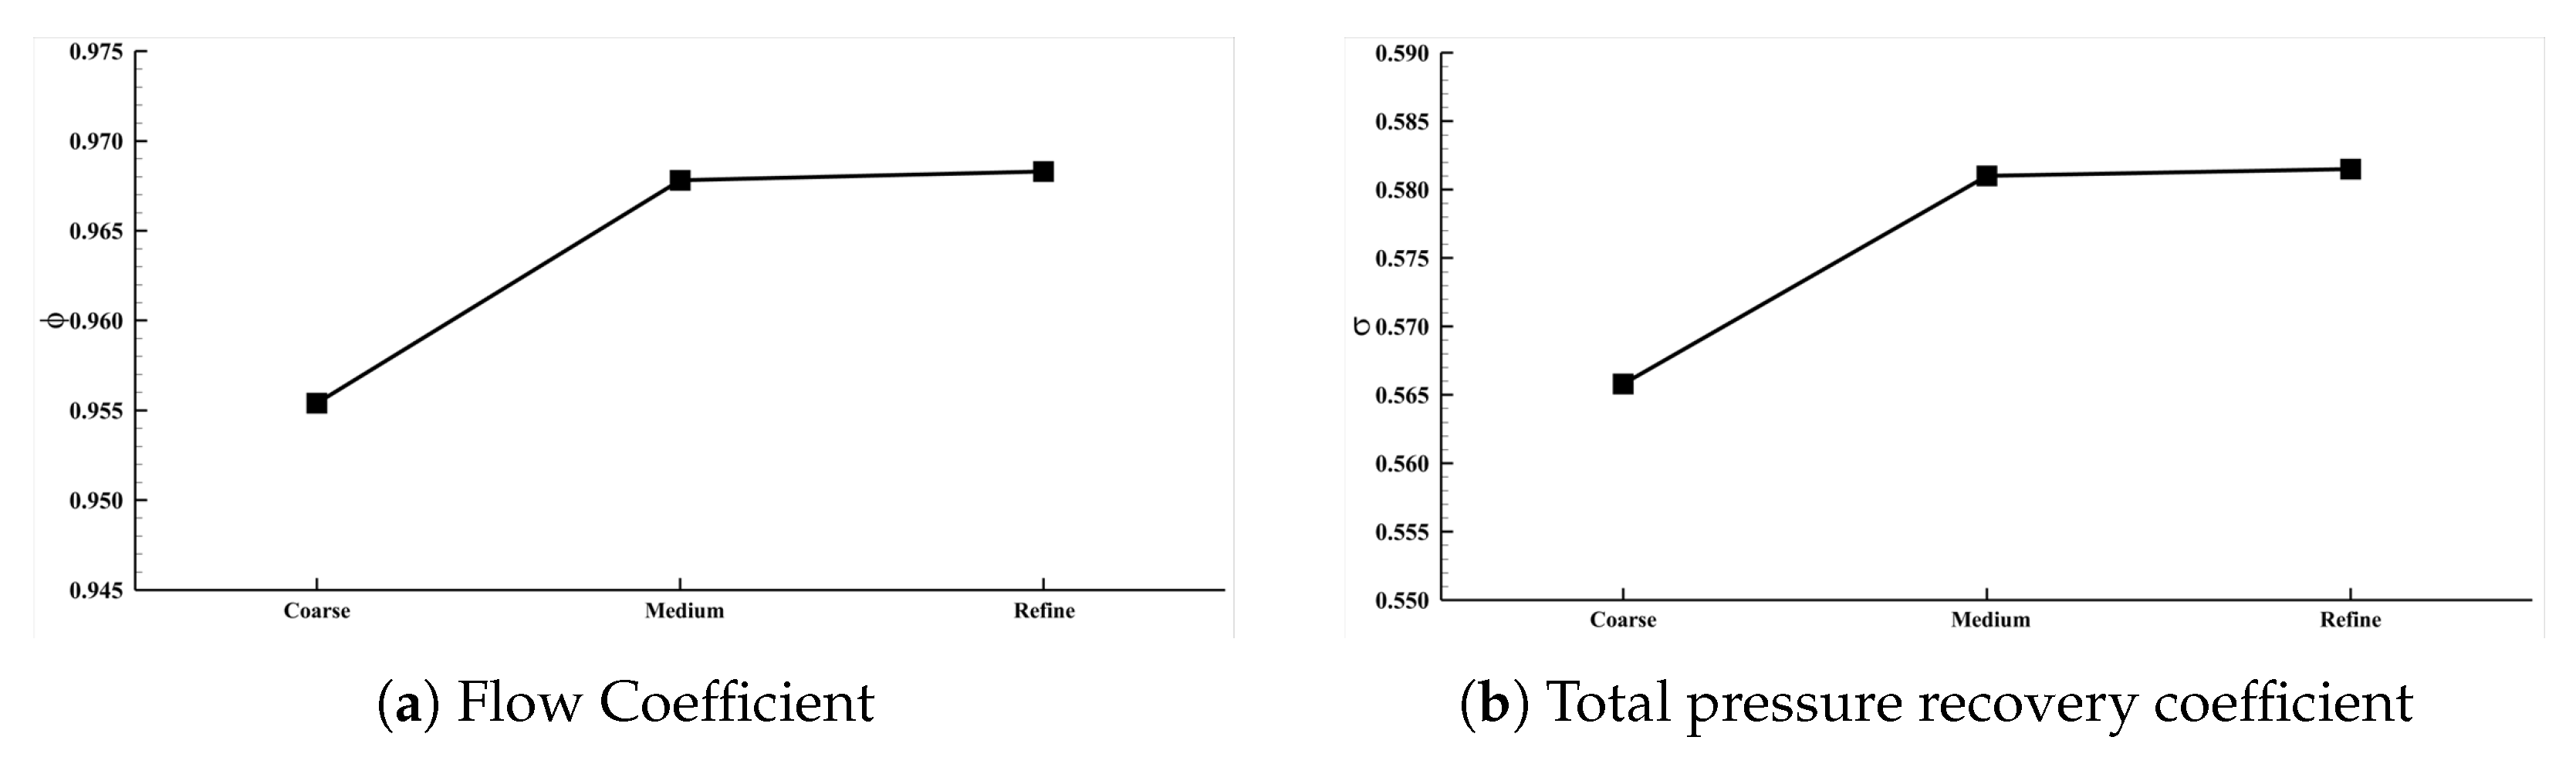
3.4. Grid Convergence Analysis
4. Research on the Restart of the Inlet Assisted by Adjusting the Throat
4.1. Self-Starting Performance of the Inlet
- Total pressure recovery coefficient :where is the total pressure at the inlet outlet obtained by the flow averaging method, and is the free-stream total pressure. This parameter quantifies the efficiency of pressure recovery through the inlet.
- Flow coefficient :where is the mass flow rate captured by the inlet, and is the free-stream mass flow rate through the inlet’s frontal area. This reflects the inlet’s ability to capture free-stream flow.
4.2. Research on Numerical Calculation of Throat Adjustment
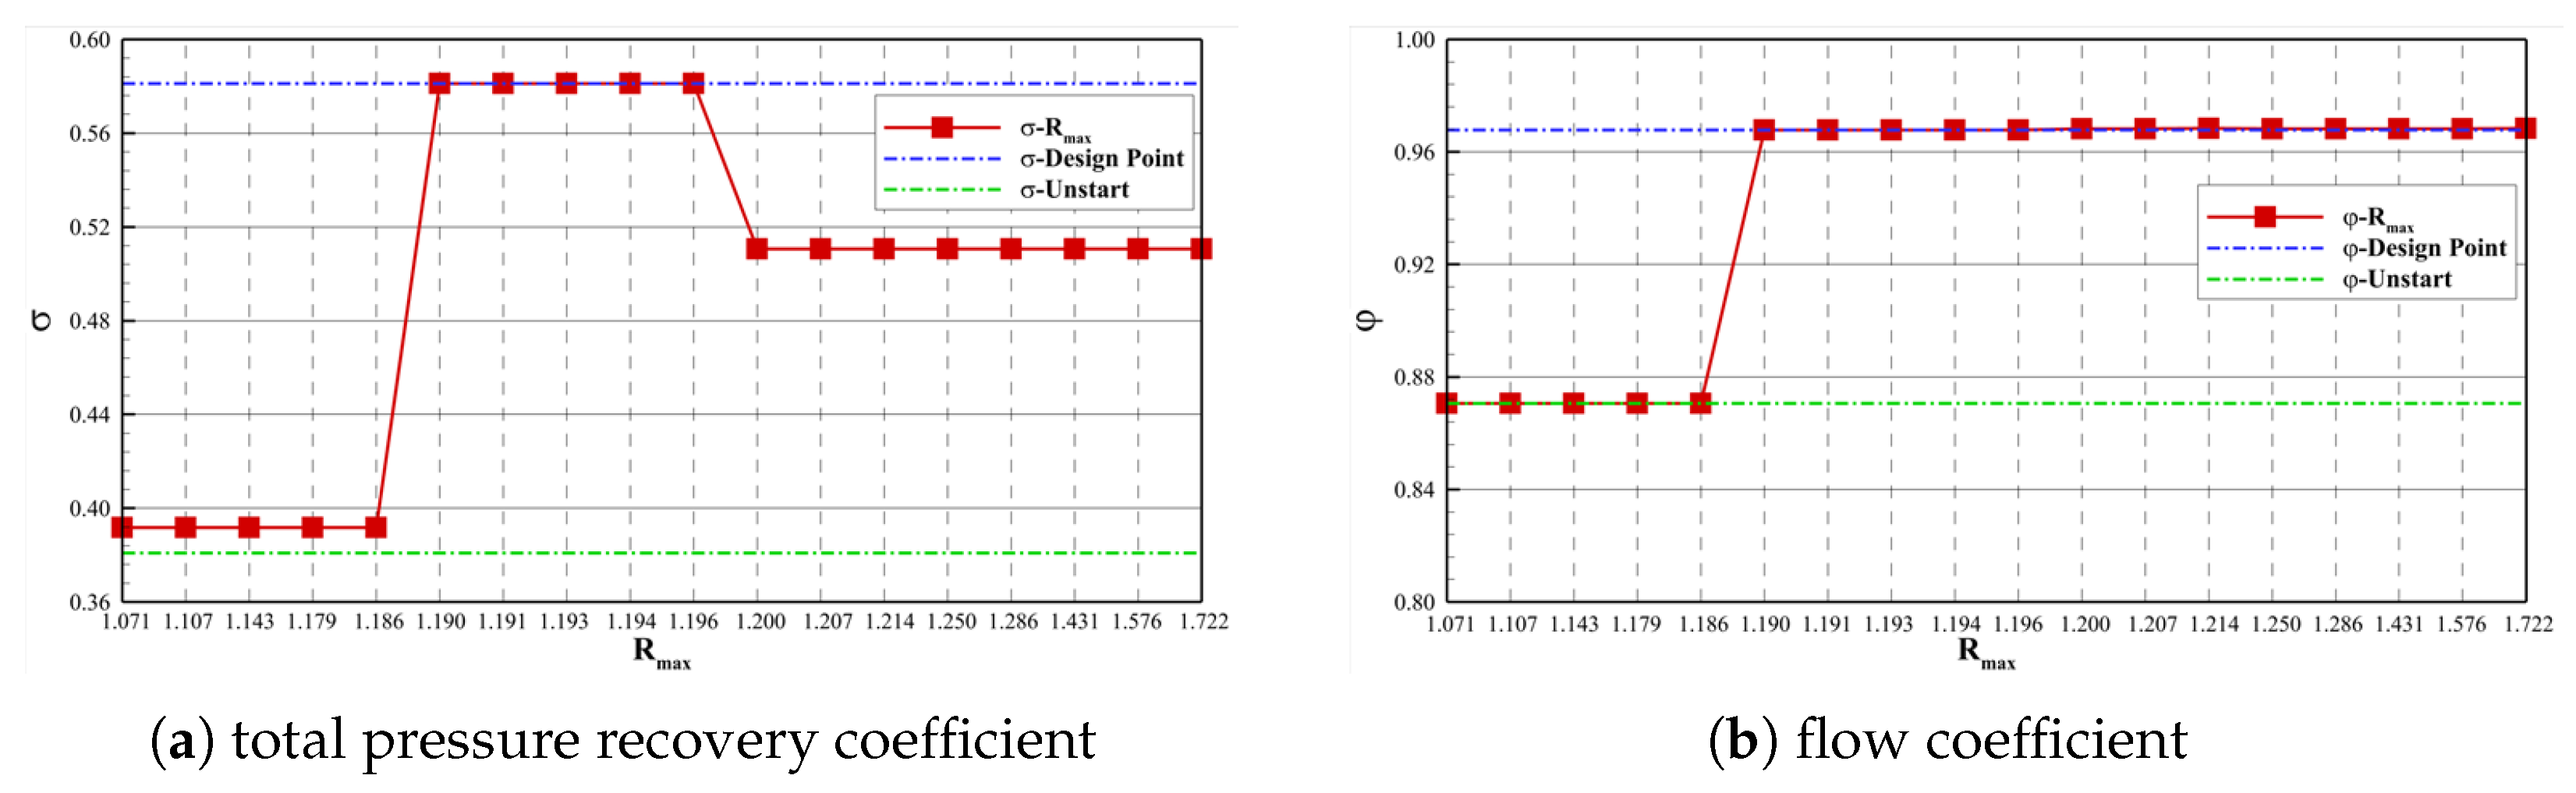
4.2.1. Influence of Throat Adjustment Height
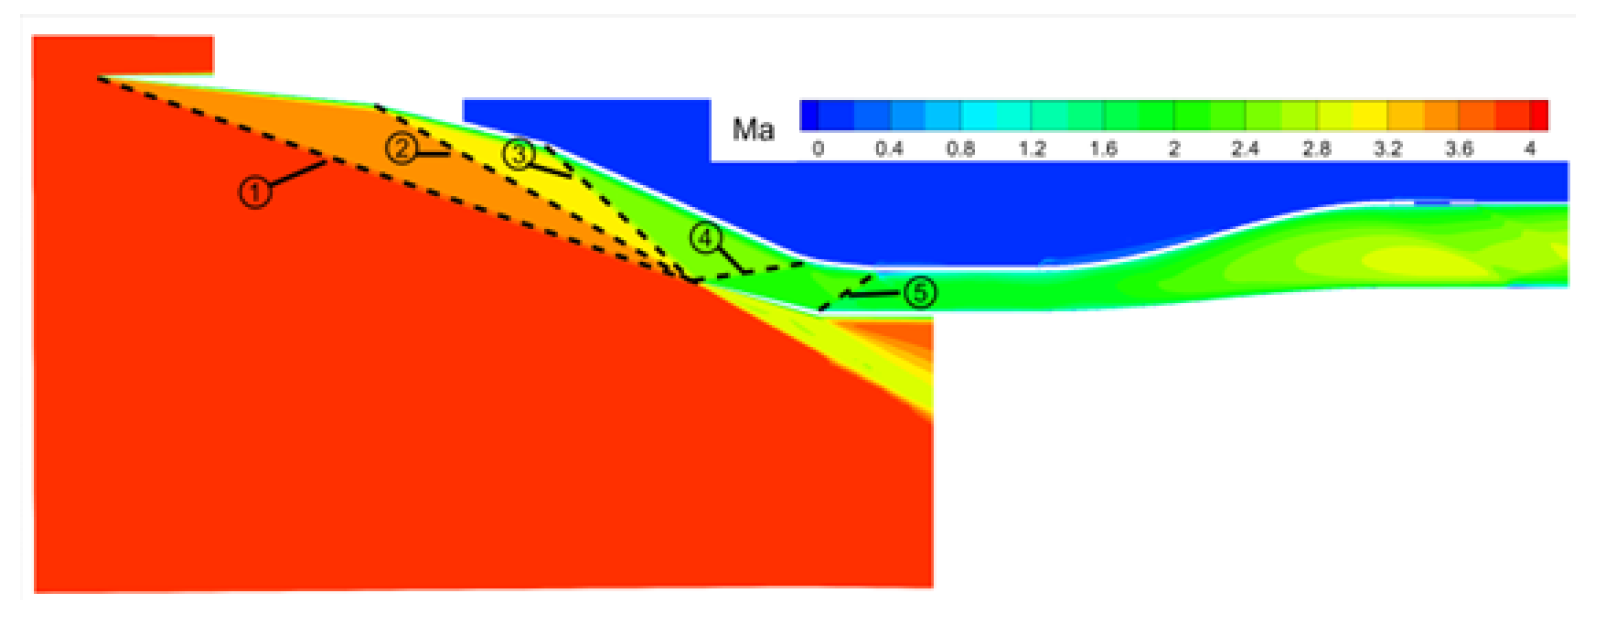
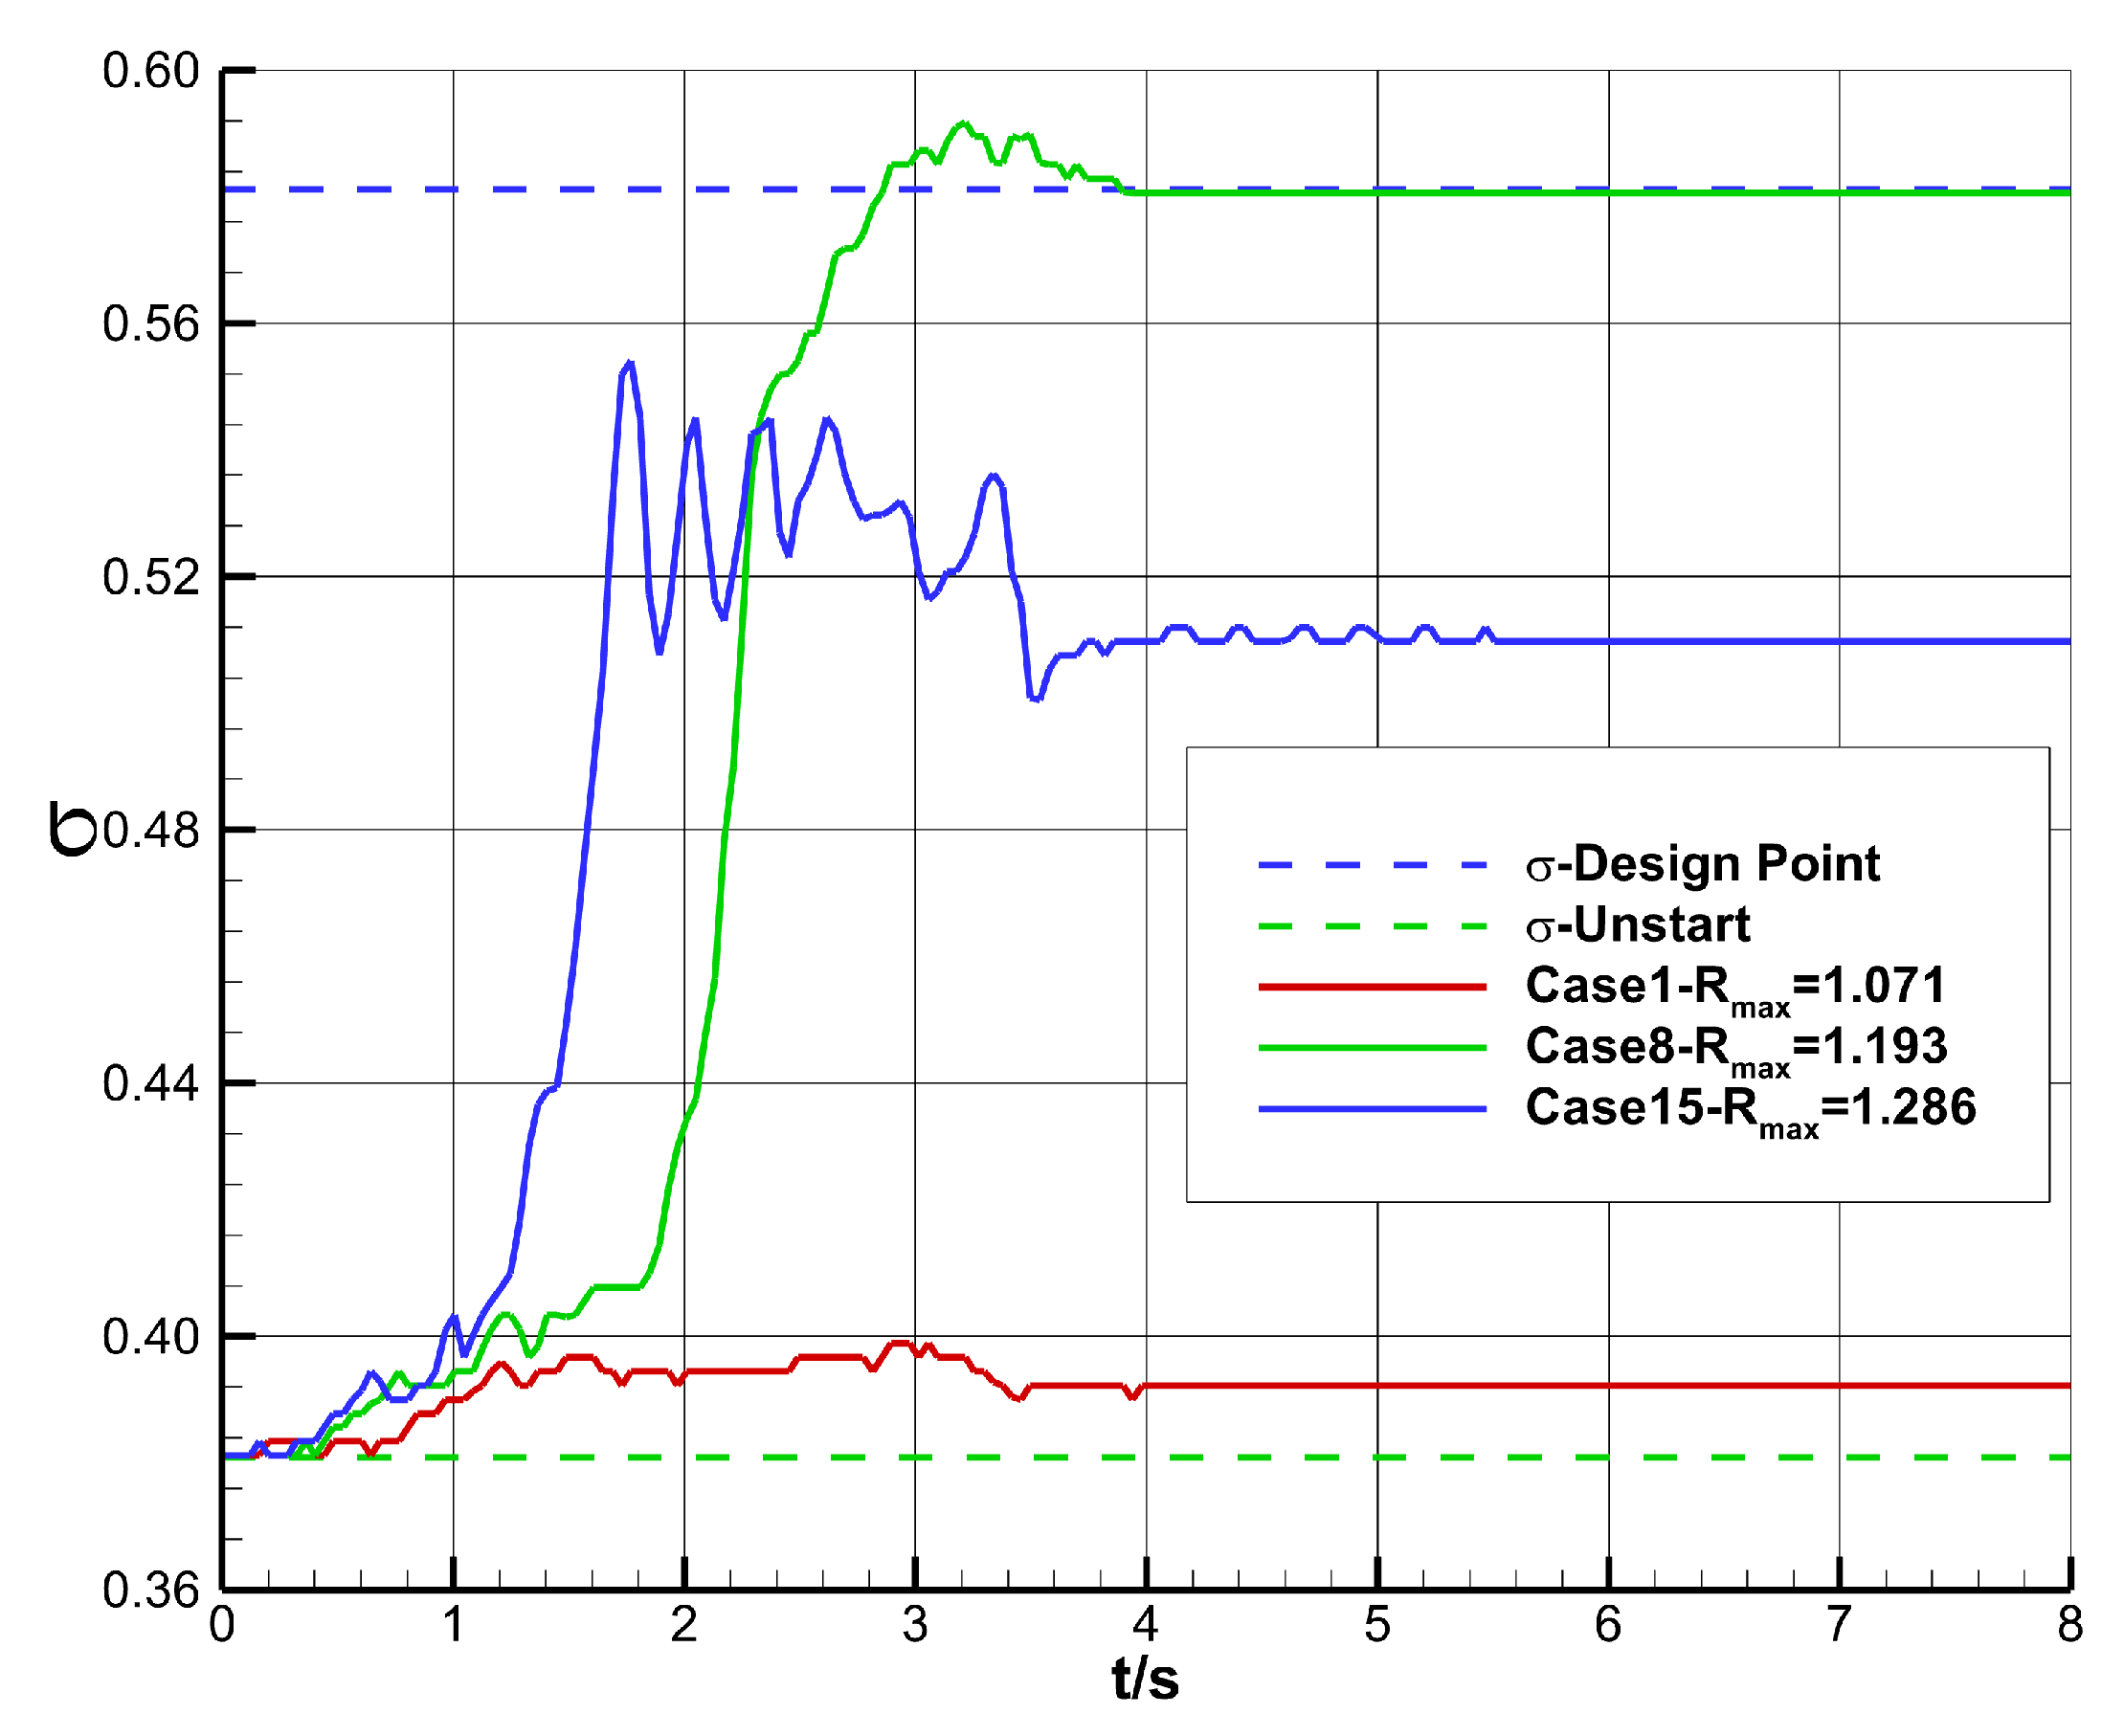
- Unstarted flow stateWhen the parameter , the inlet is incapable of restarting. As depicted in Figure 12, exemplified by Case 1, it demonstrates the temporal variation of the Mach number distribution within the inlet. At , it represents the initial non-started flow field of the inlet. At , the throat height reaches its peak value, alleviating the choking near the throat to a certain extent. However, choking persists near the inlet, the aerodynamic throat remains intact, and the captured mass flow rate of the inlet still exceeds the maximum flow rate that the inlet can accommodate at this instant. Thus, the spillage wave system structure in front of the inlet remains stable. At , the inlet profile returns to its original configuration, and the inlet fails to restart. Moreover, due to the attenuation of the compression/expansion wave system structure near the throat and the reduction in flow losses, the total pressure recovery coefficient increases compared to that prior to the geometric adjustment.Figure 12. Mach number contours during throat wall movement ().
![Aerospace 12 00450 g012]()
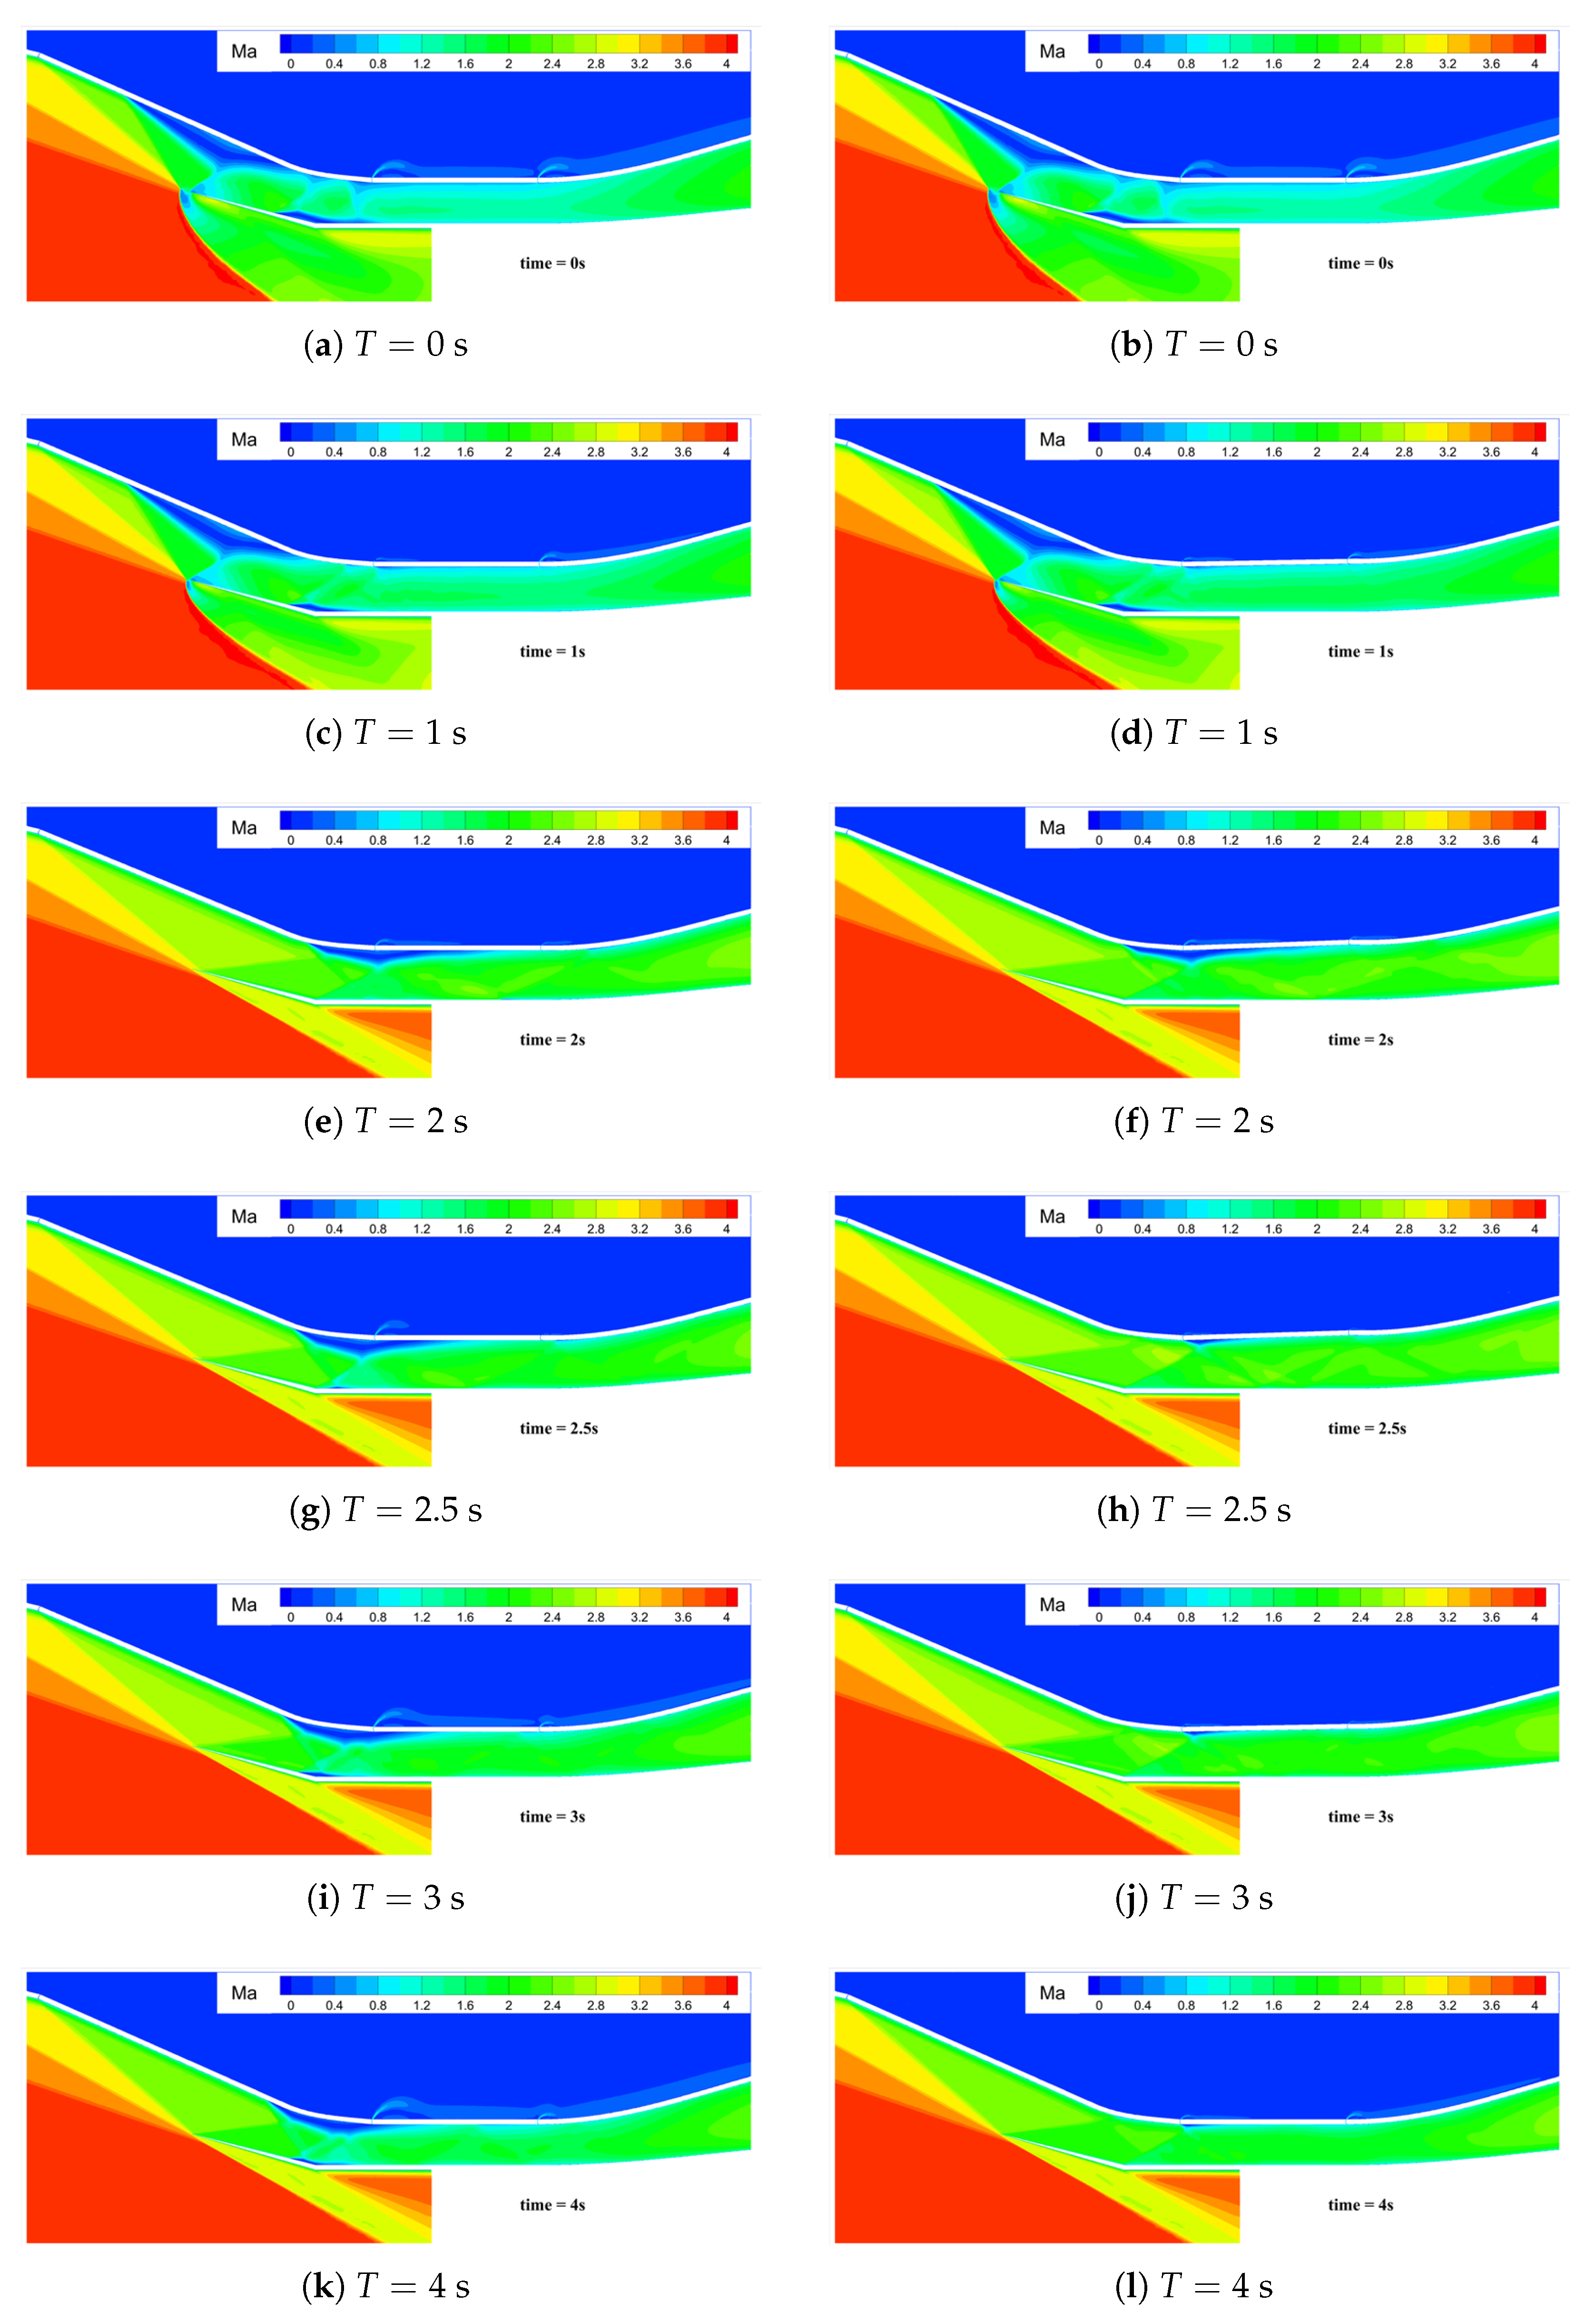
- Fully restarted flow stateWhen , the inlet fully restarts. As shown in Figure 13, taking Case 8 as an example, it depicts the temporal variation of the Mach number distribution in the inlet. From 0.0 to 2.0 s, as the throat height increases, flow choking gradually dissipates, and the spillage in front of the inlet progressively decreases. At , the inlet spillage completely vanishes. Simultaneously, the separation region gradually moves downstream. From 2.0 to 4.0 s, the throat height gradually decreases. Due to the enhanced flow capacity of the inlet, the separation region moves further downstream. At , the separation region is completely swallowed. However, at this moment, a small separation is observed at the shoulder position of the profile. This is because as the throat height increases, the third-stage compression angle decreases, leading to an increase in the Mach number in front of the corner shock wave ⑤ and an intensification of the shock wave intensity. Under the influence of this shock wave, a small separation occurs at the shoulder. Subsequently, as the throat height gradually decreases, the intensity of the corner shock wave ⑤ weakens, the separation region gradually shrinks, and the inlet restarts.Figure 13. Mach number contours during throat wall movement ().
![Aerospace 12 00450 g013]()
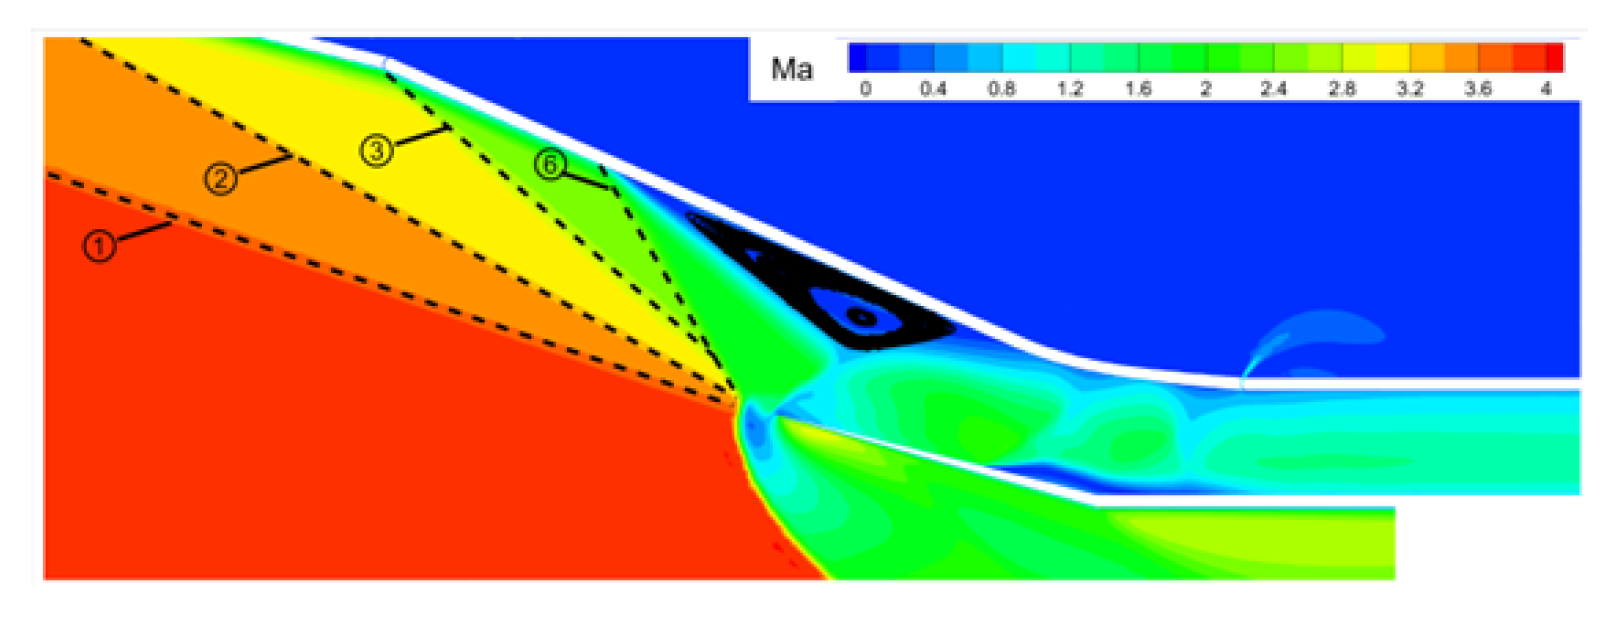
- Off-design flow state induced by the separation region in the internal contraction sectionWhen the parameter , the inlet experiences an off-design flow state induced by the separation region within the internal contraction section. The following delves into the reasons underlying the stable existence of this off-design flow state.Figure 14, exemplified by Case 15, depicts the time-dependent variation of the Mach number distribution in the inlet. Within the 0 to 2s interval, as the throat height gradually increases, the spillage in front of the lip vanishes completely at , and the separation region gradually migrates downstream. By , the separation region is fully engulfed. Influenced by the corner shock wave ⑤, a minor flow separation emerges at the shoulder of the profile. With a further increase in the throat height, the intensity of the corner shock wave ⑤ keeps growing. At , it becomes clear that the separation region expands substantially, resulting in the strengthening of the separation shock wave ⑥ The separation shock wave ⑥ triggers a small-scale flow separation near the corner of the cowl and intersects and interferes with the separation shock wave ⑦ at the corner, forming a local Mach-stem structure. At , the throat height reaches its peak, enhancing the inlet’s flow capacity and reducing the separation region on the compression surface to some extent. Nevertheless, at this moment, the separation shock wave ⑦ at the corner and the reattachment shock wave ⑧ are incident downstream of the separation region on the compression surface, preventing the separation region on the compression surface from further downstream movement. From 2.0 to 4.0 s, the throat height gradually decreases until it reverts to its original state. The pressure downstream of the throat rises, and the separation region on the compression surface is gradually pushed upstream into the internal contraction section. The separation shock wave ⑦ at the corner, the reattachment shock wave ⑧, and the corner shock wave ⑤ precisely align downstream of the separation region on the compression surface, thereby forming a stable self-sustaining wave system structure, as illustrated in Figure 14f.
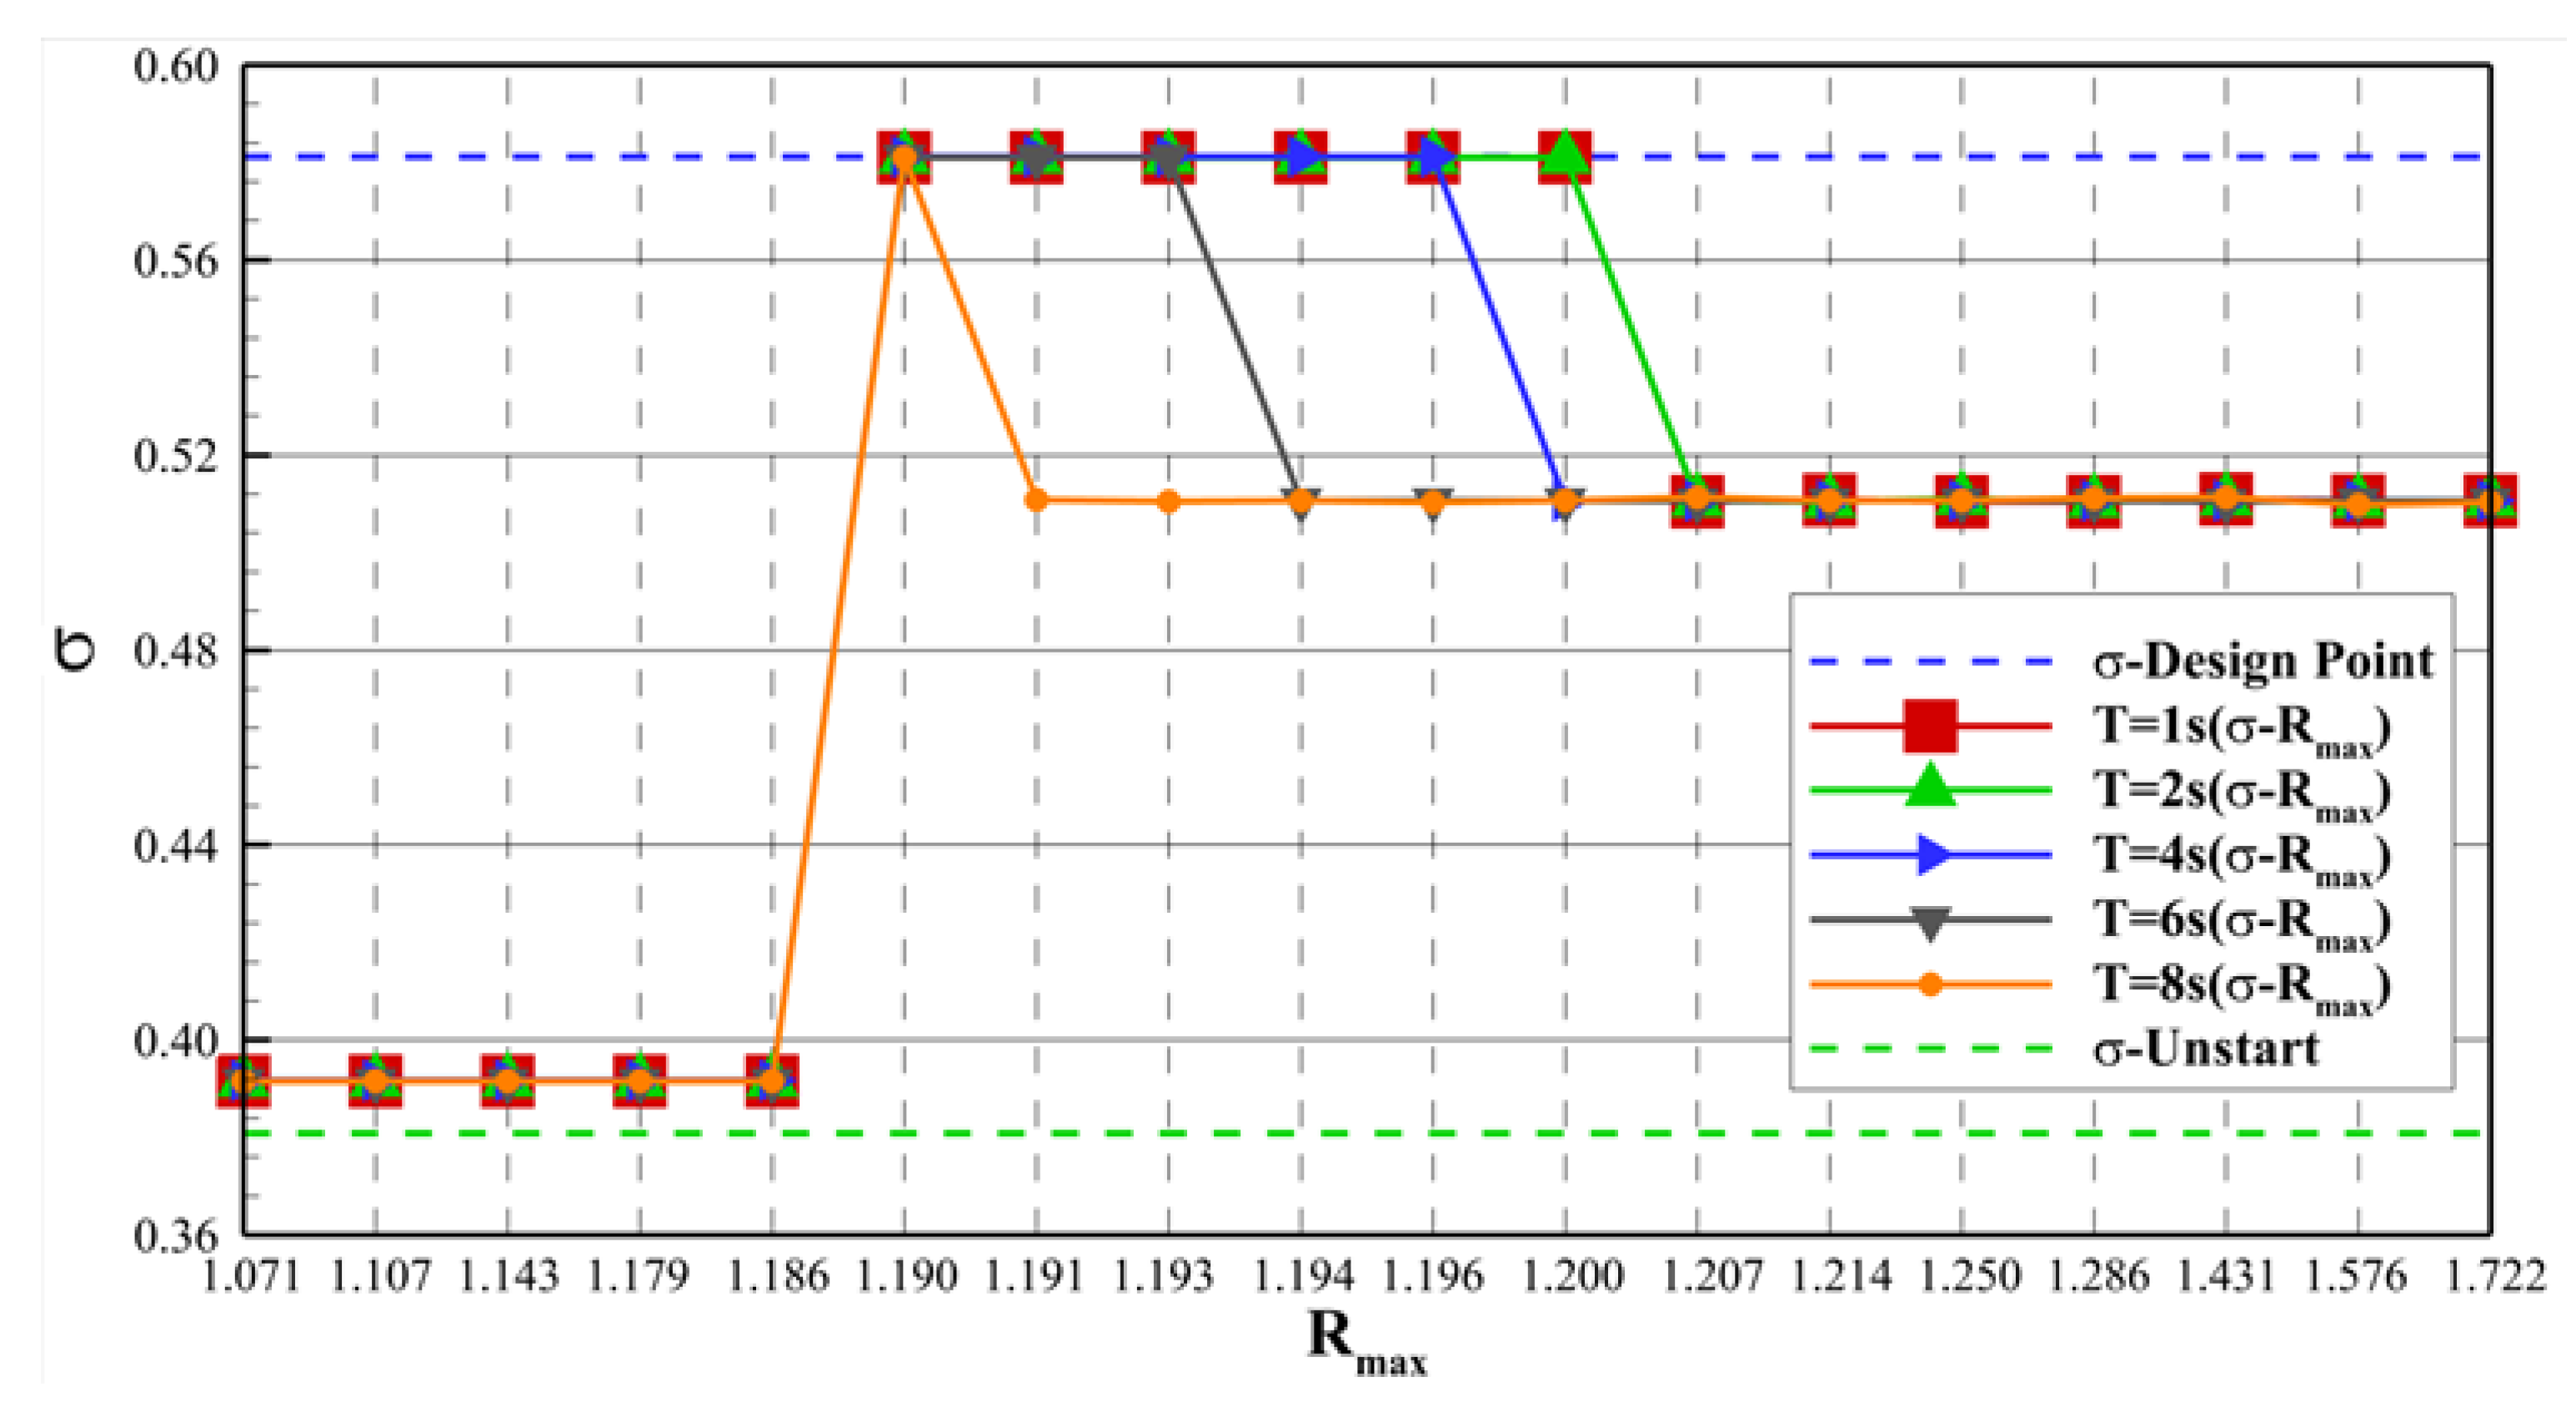
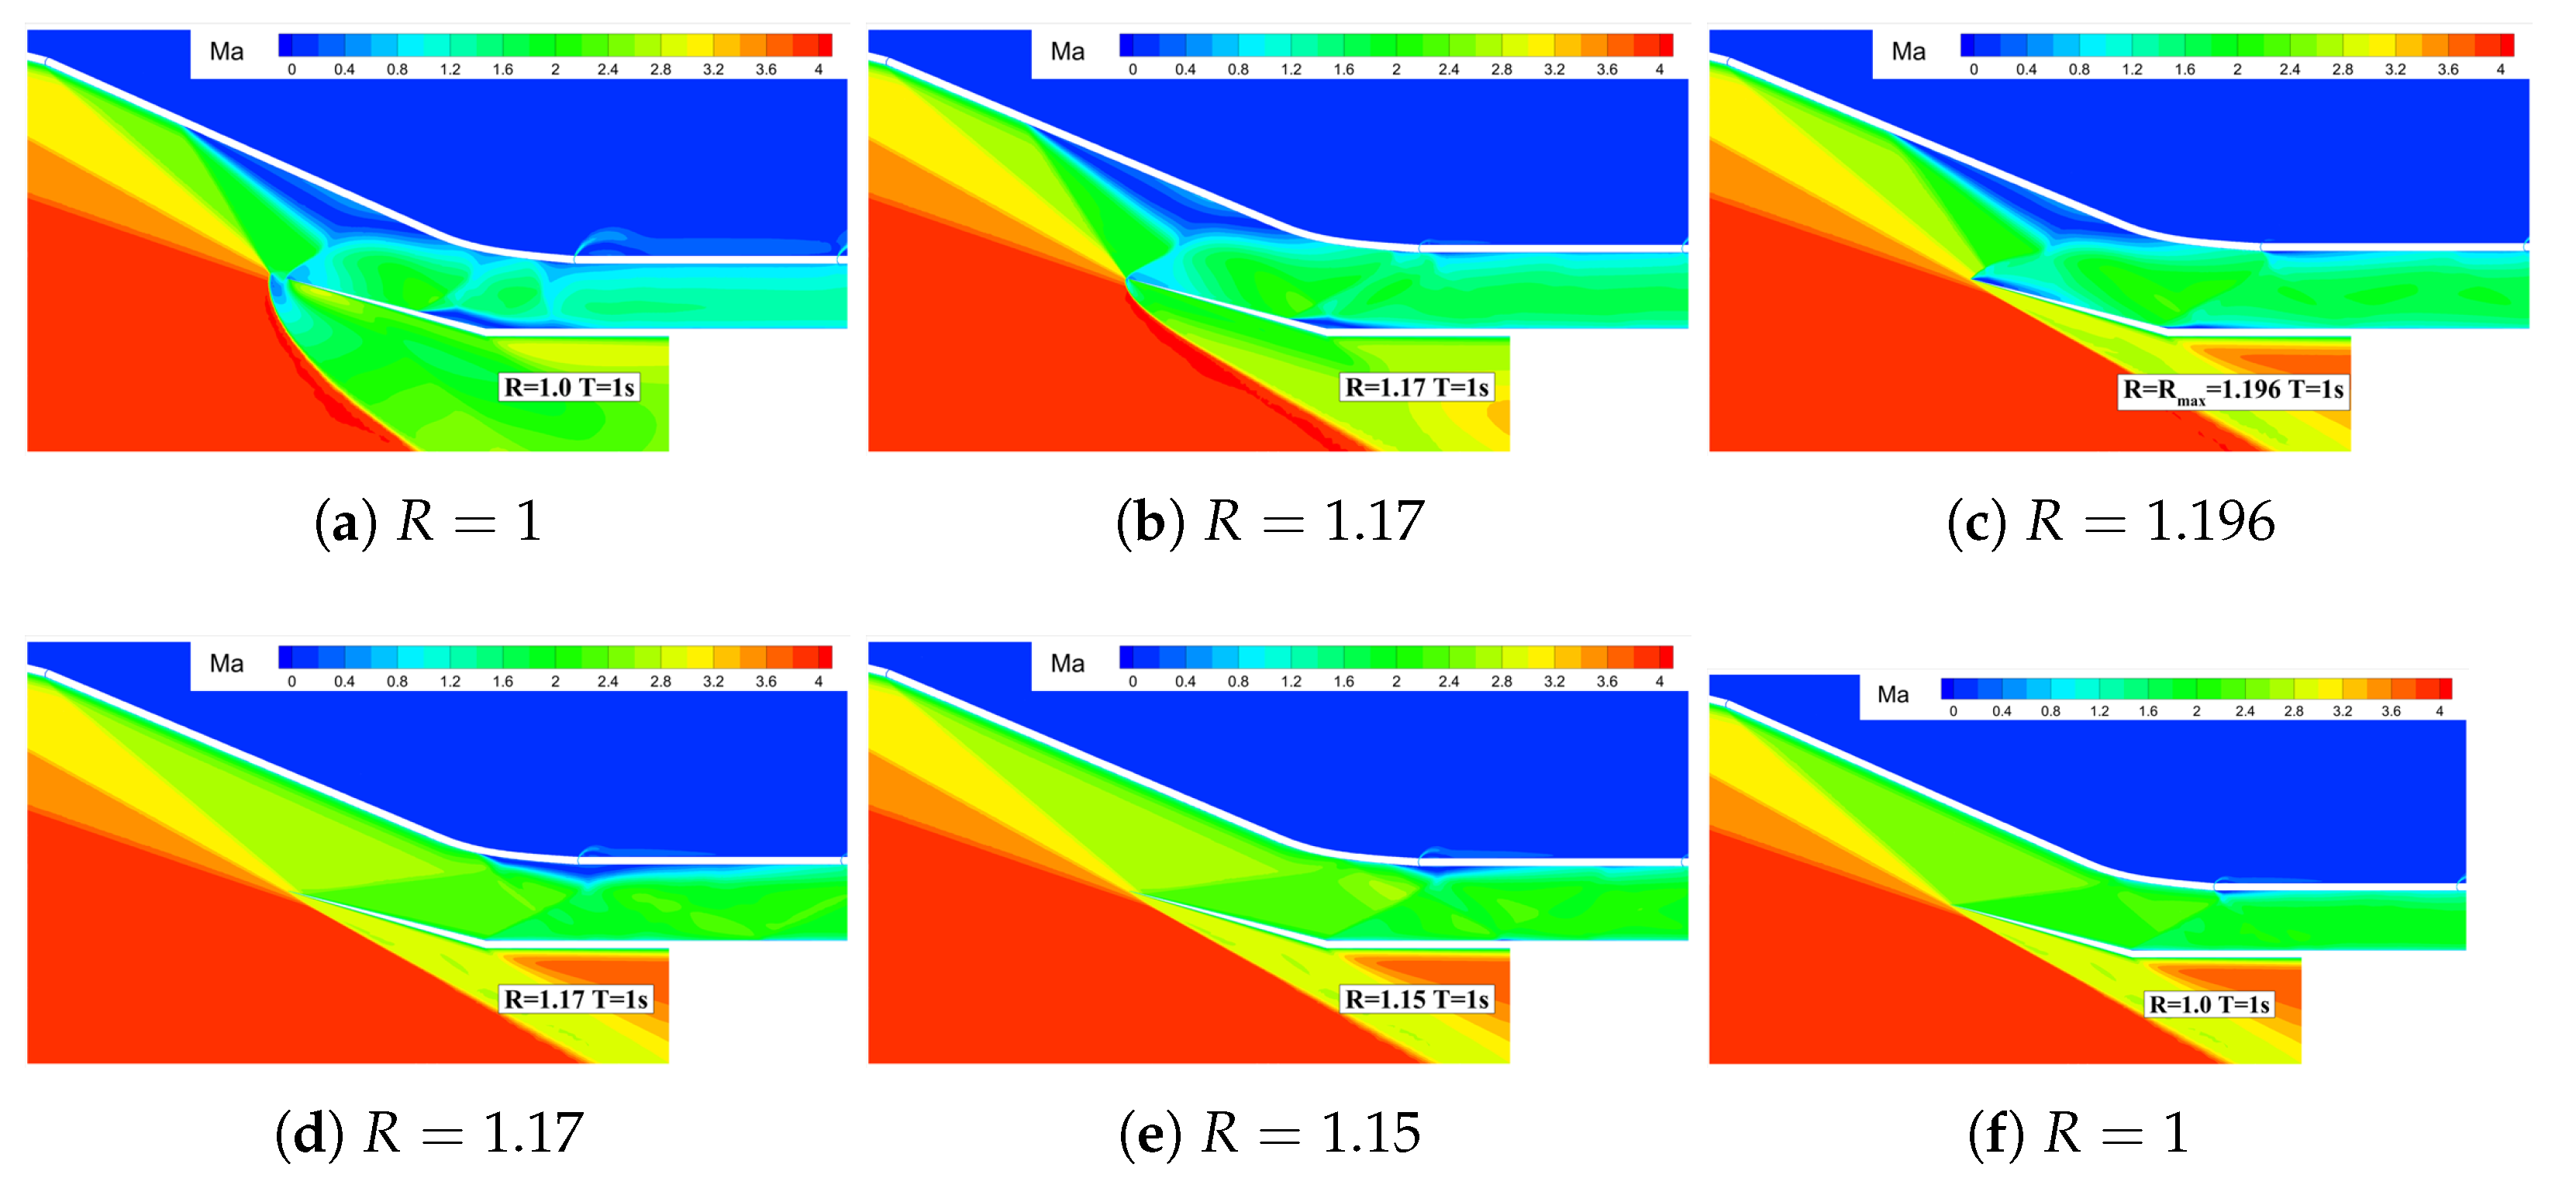
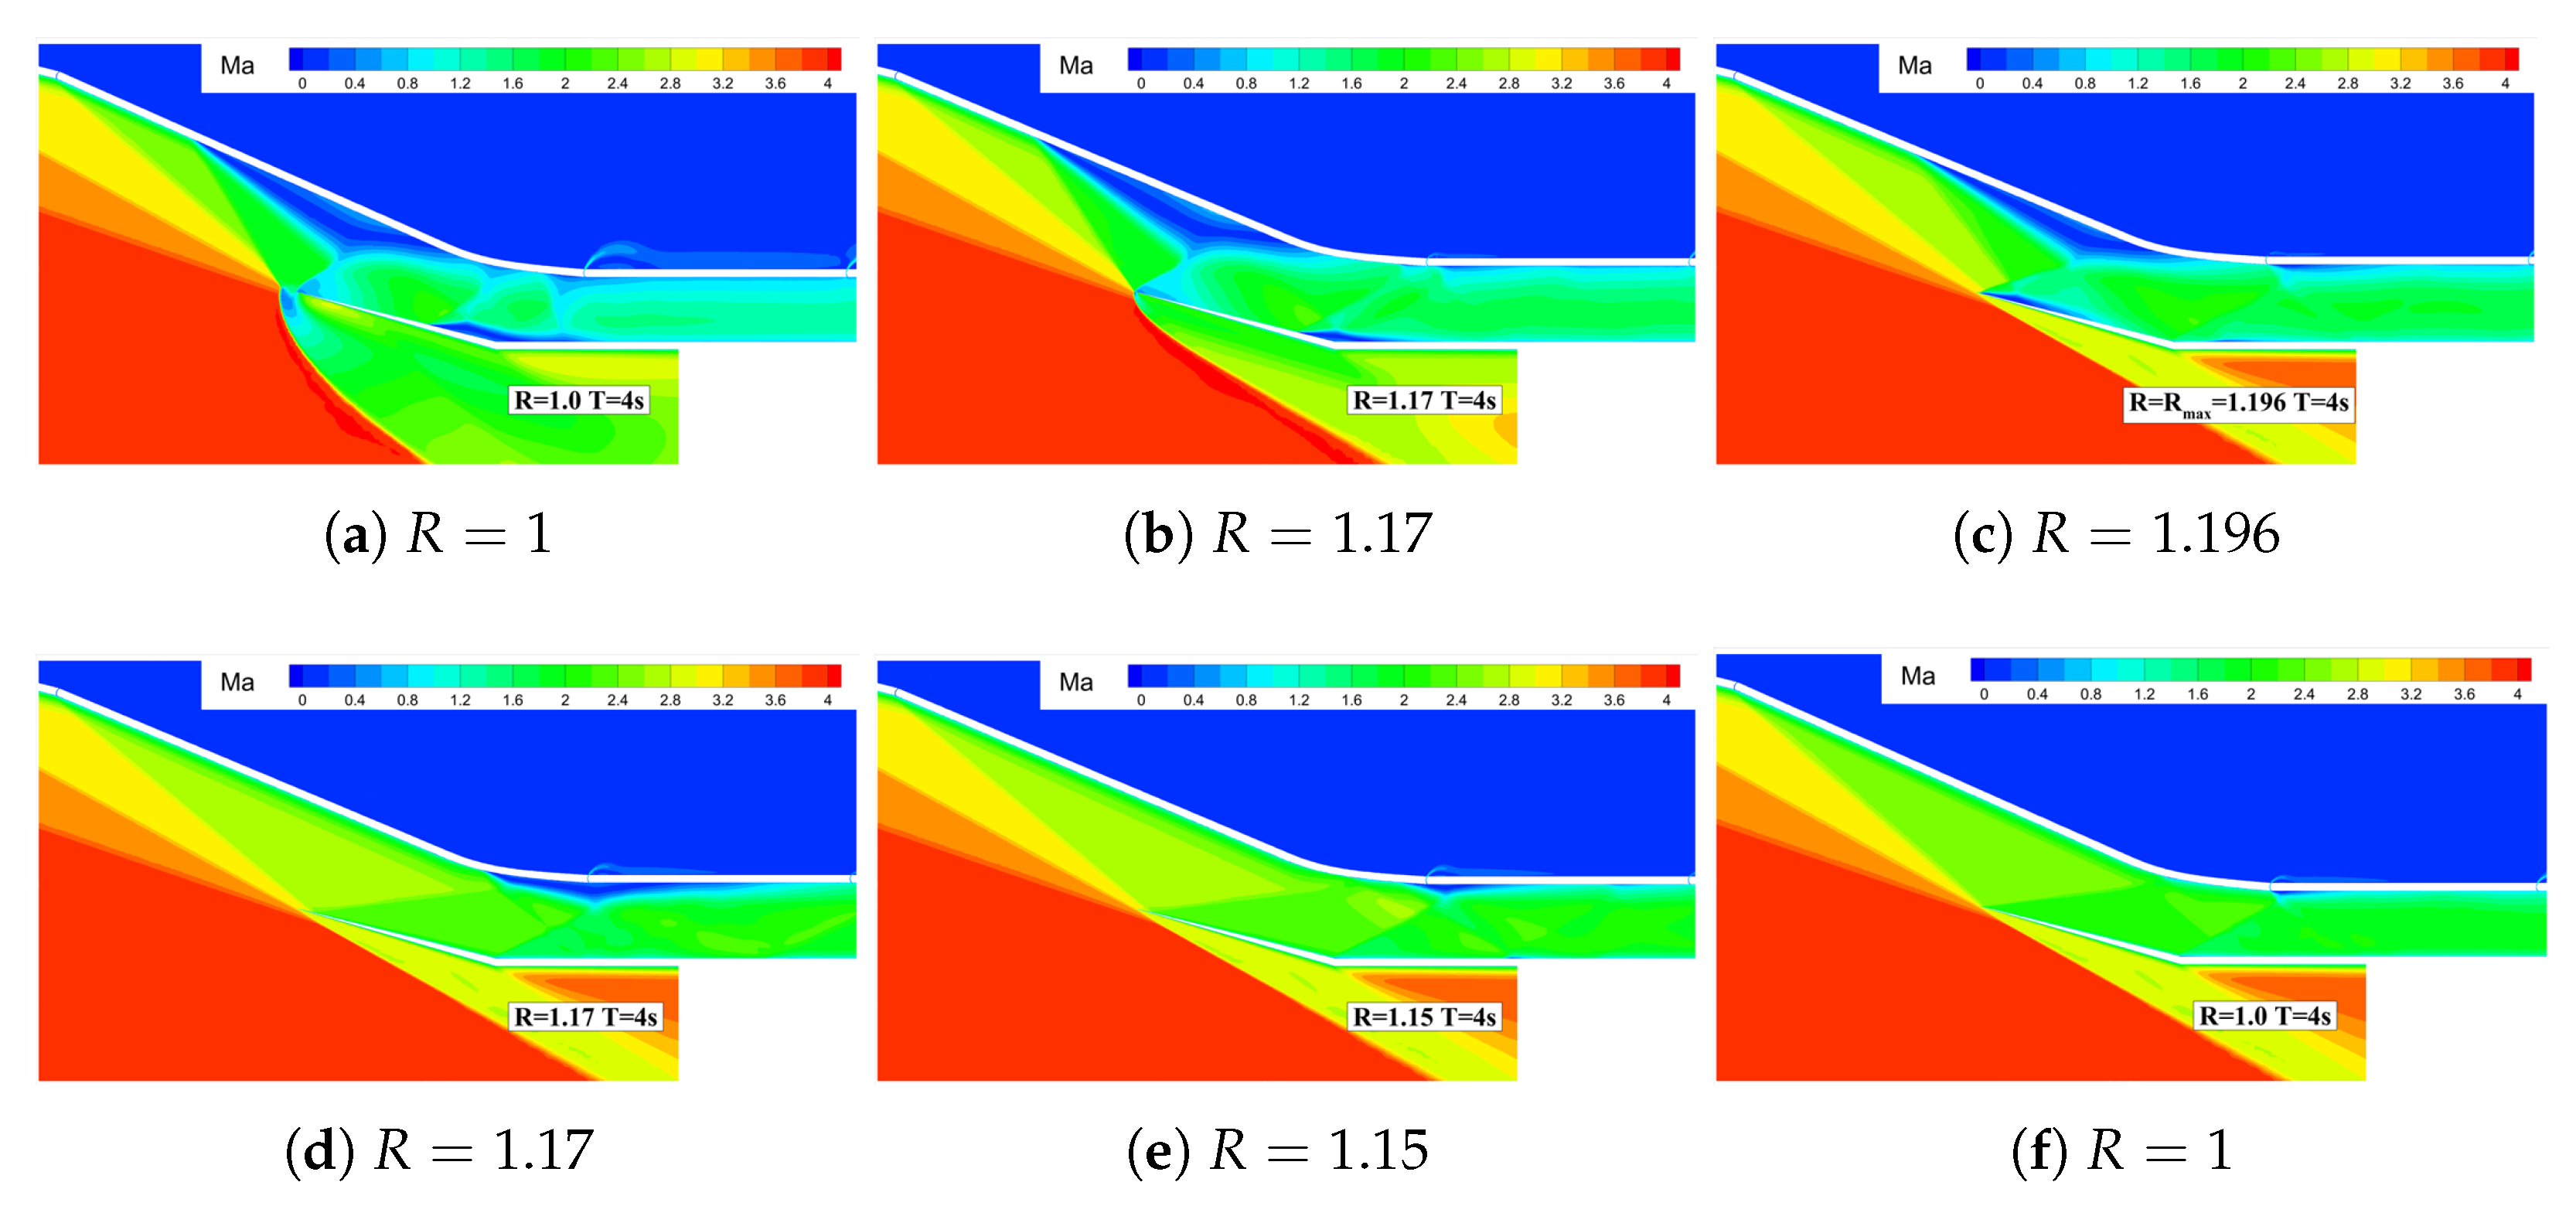
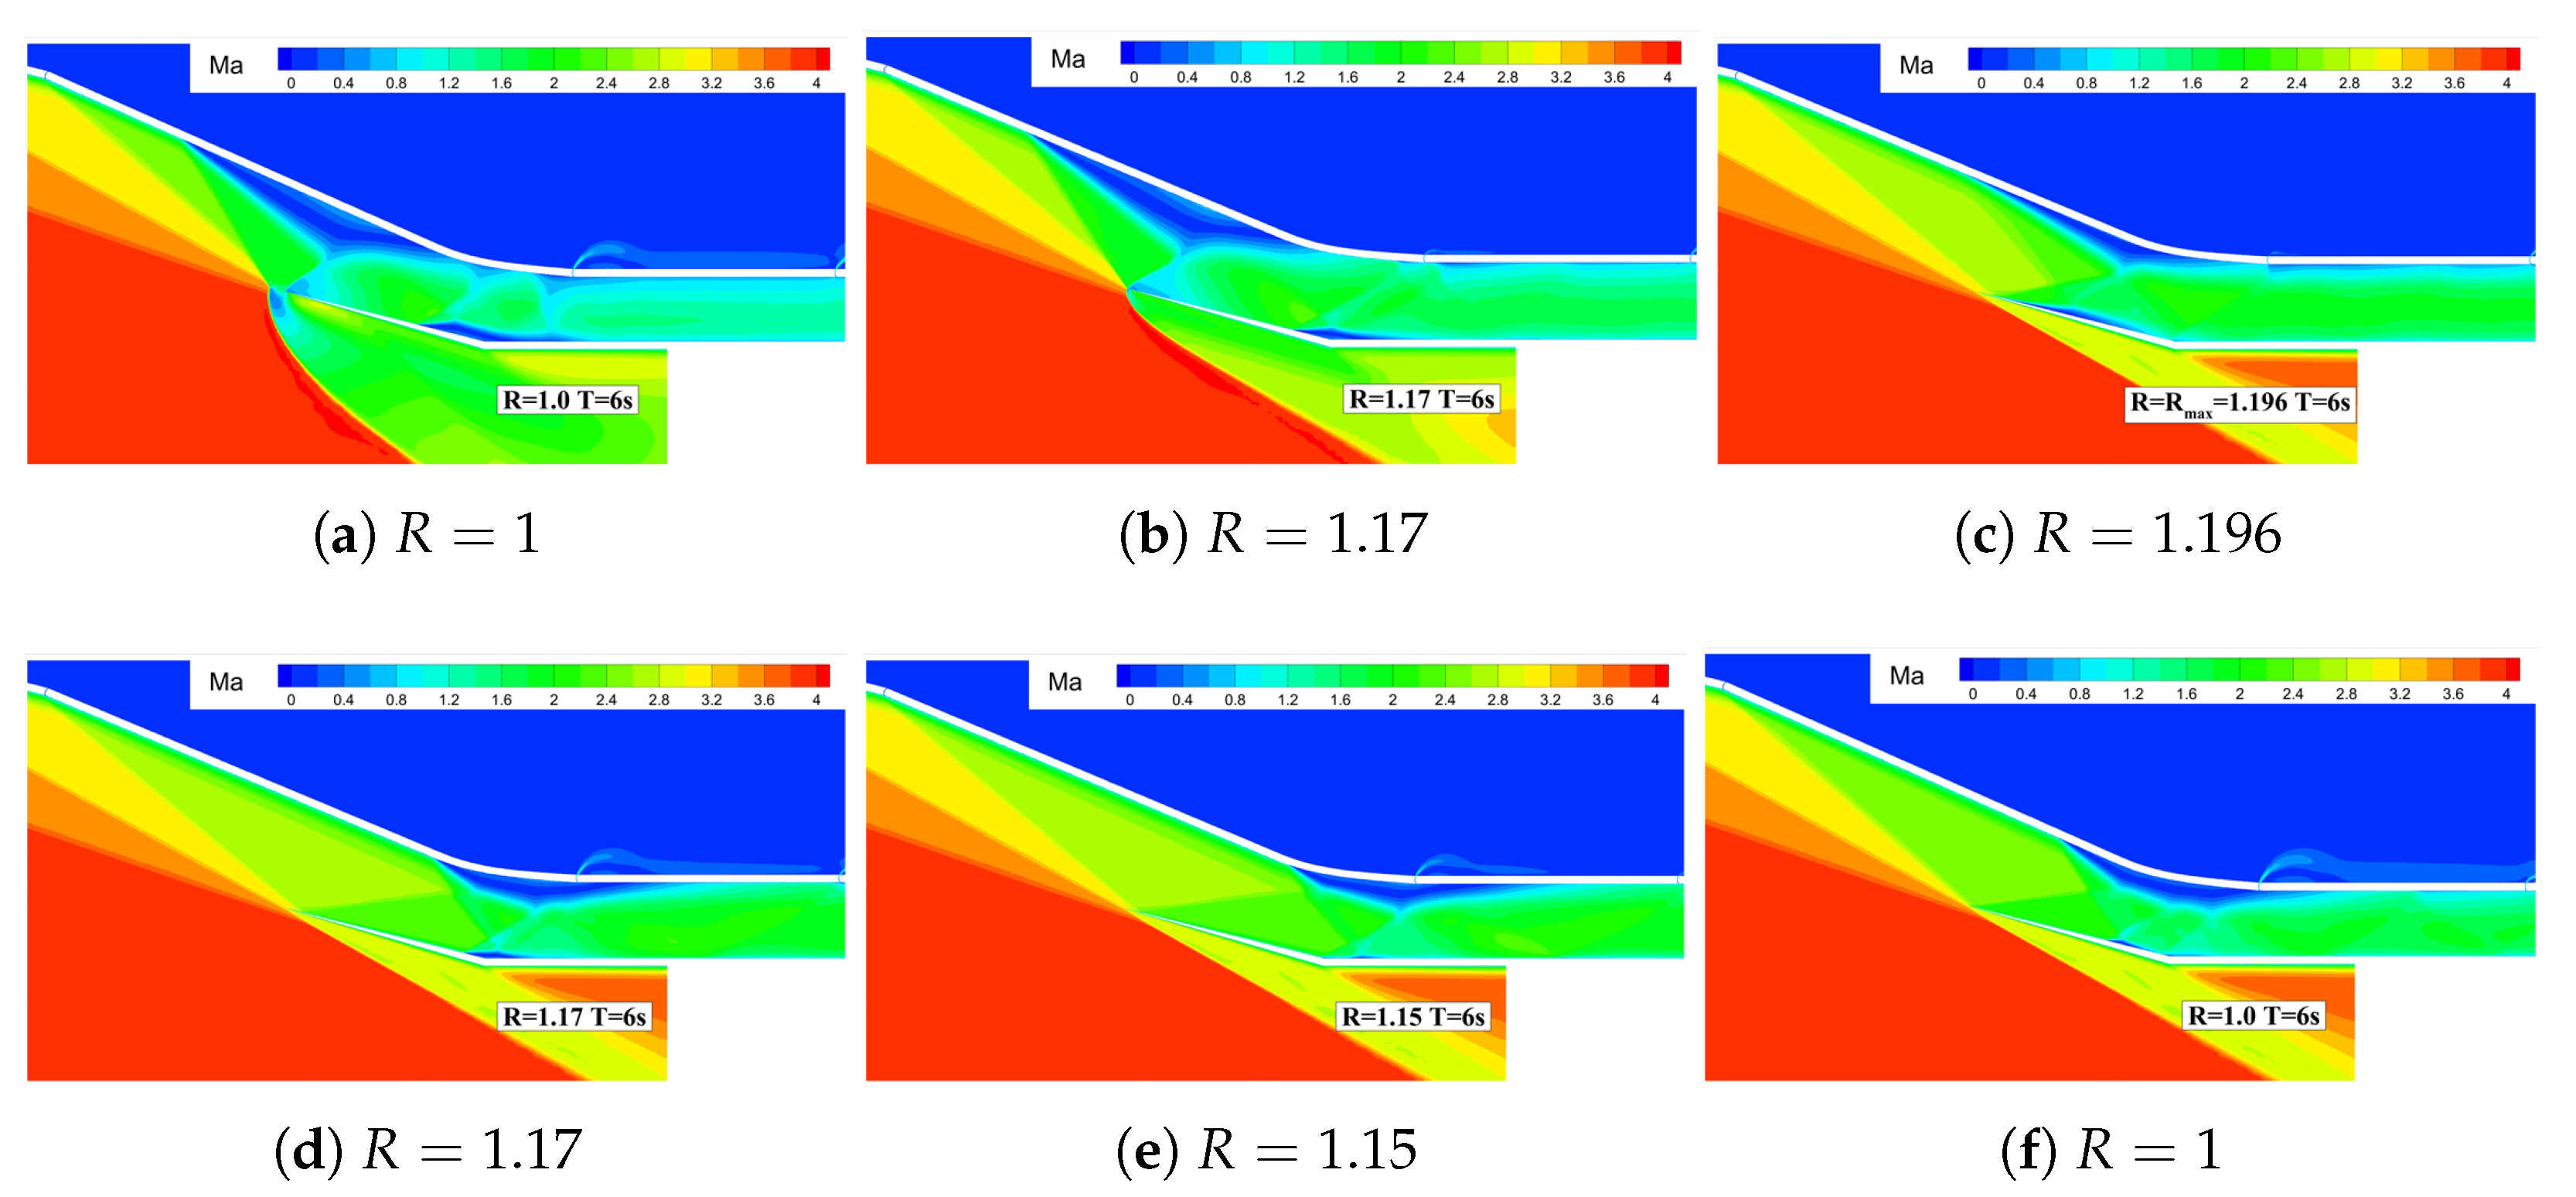
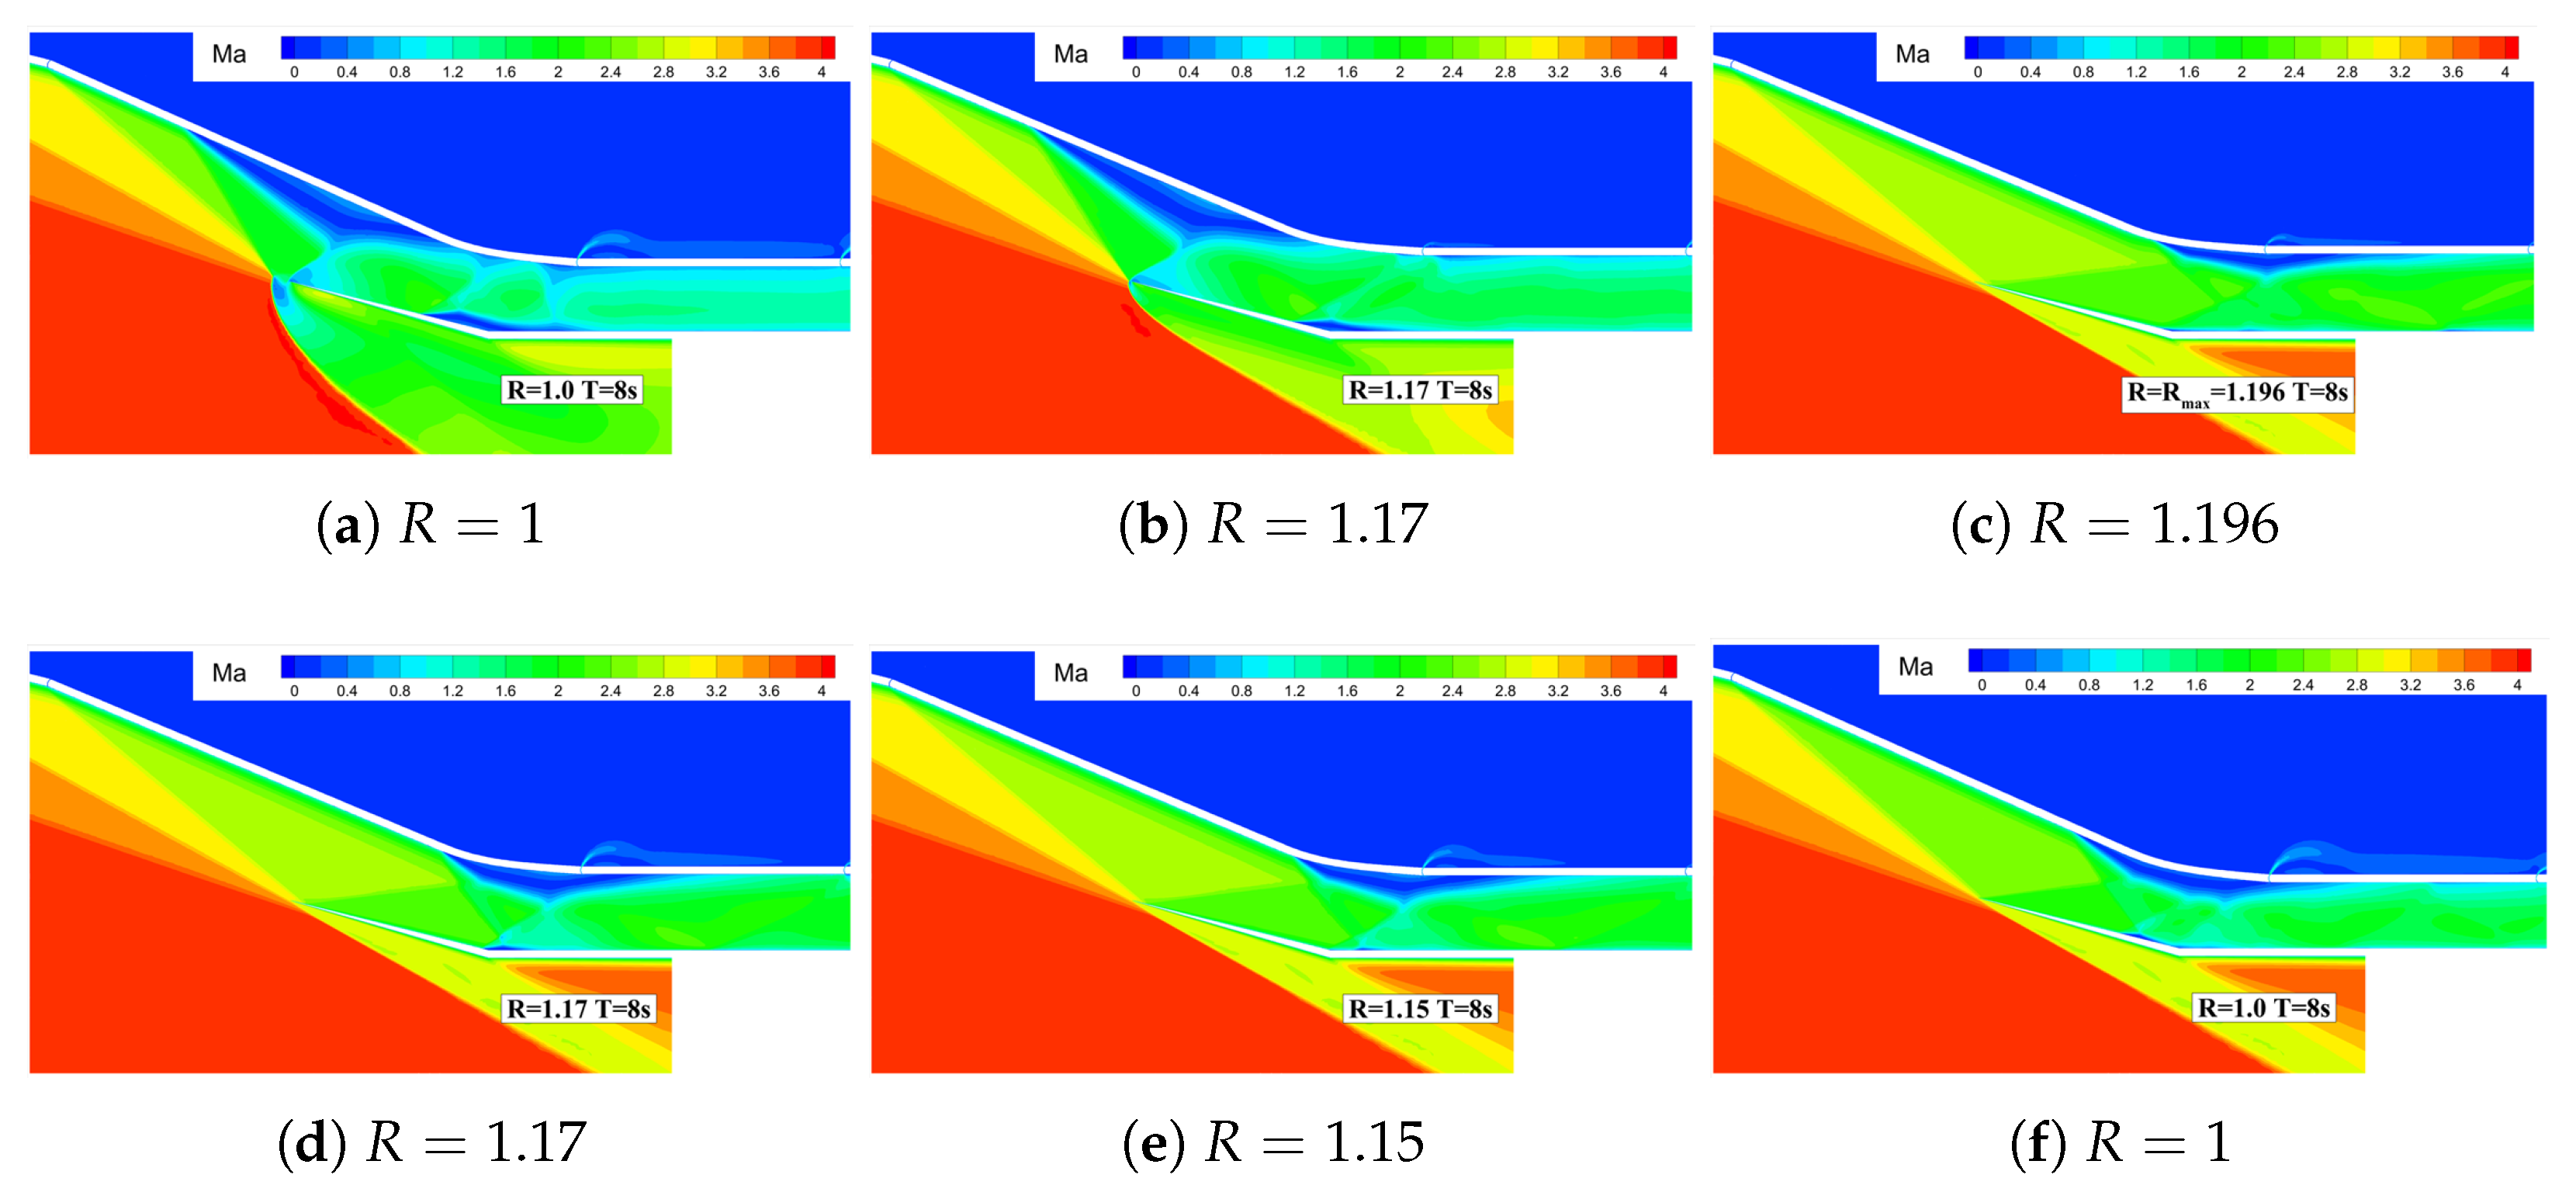
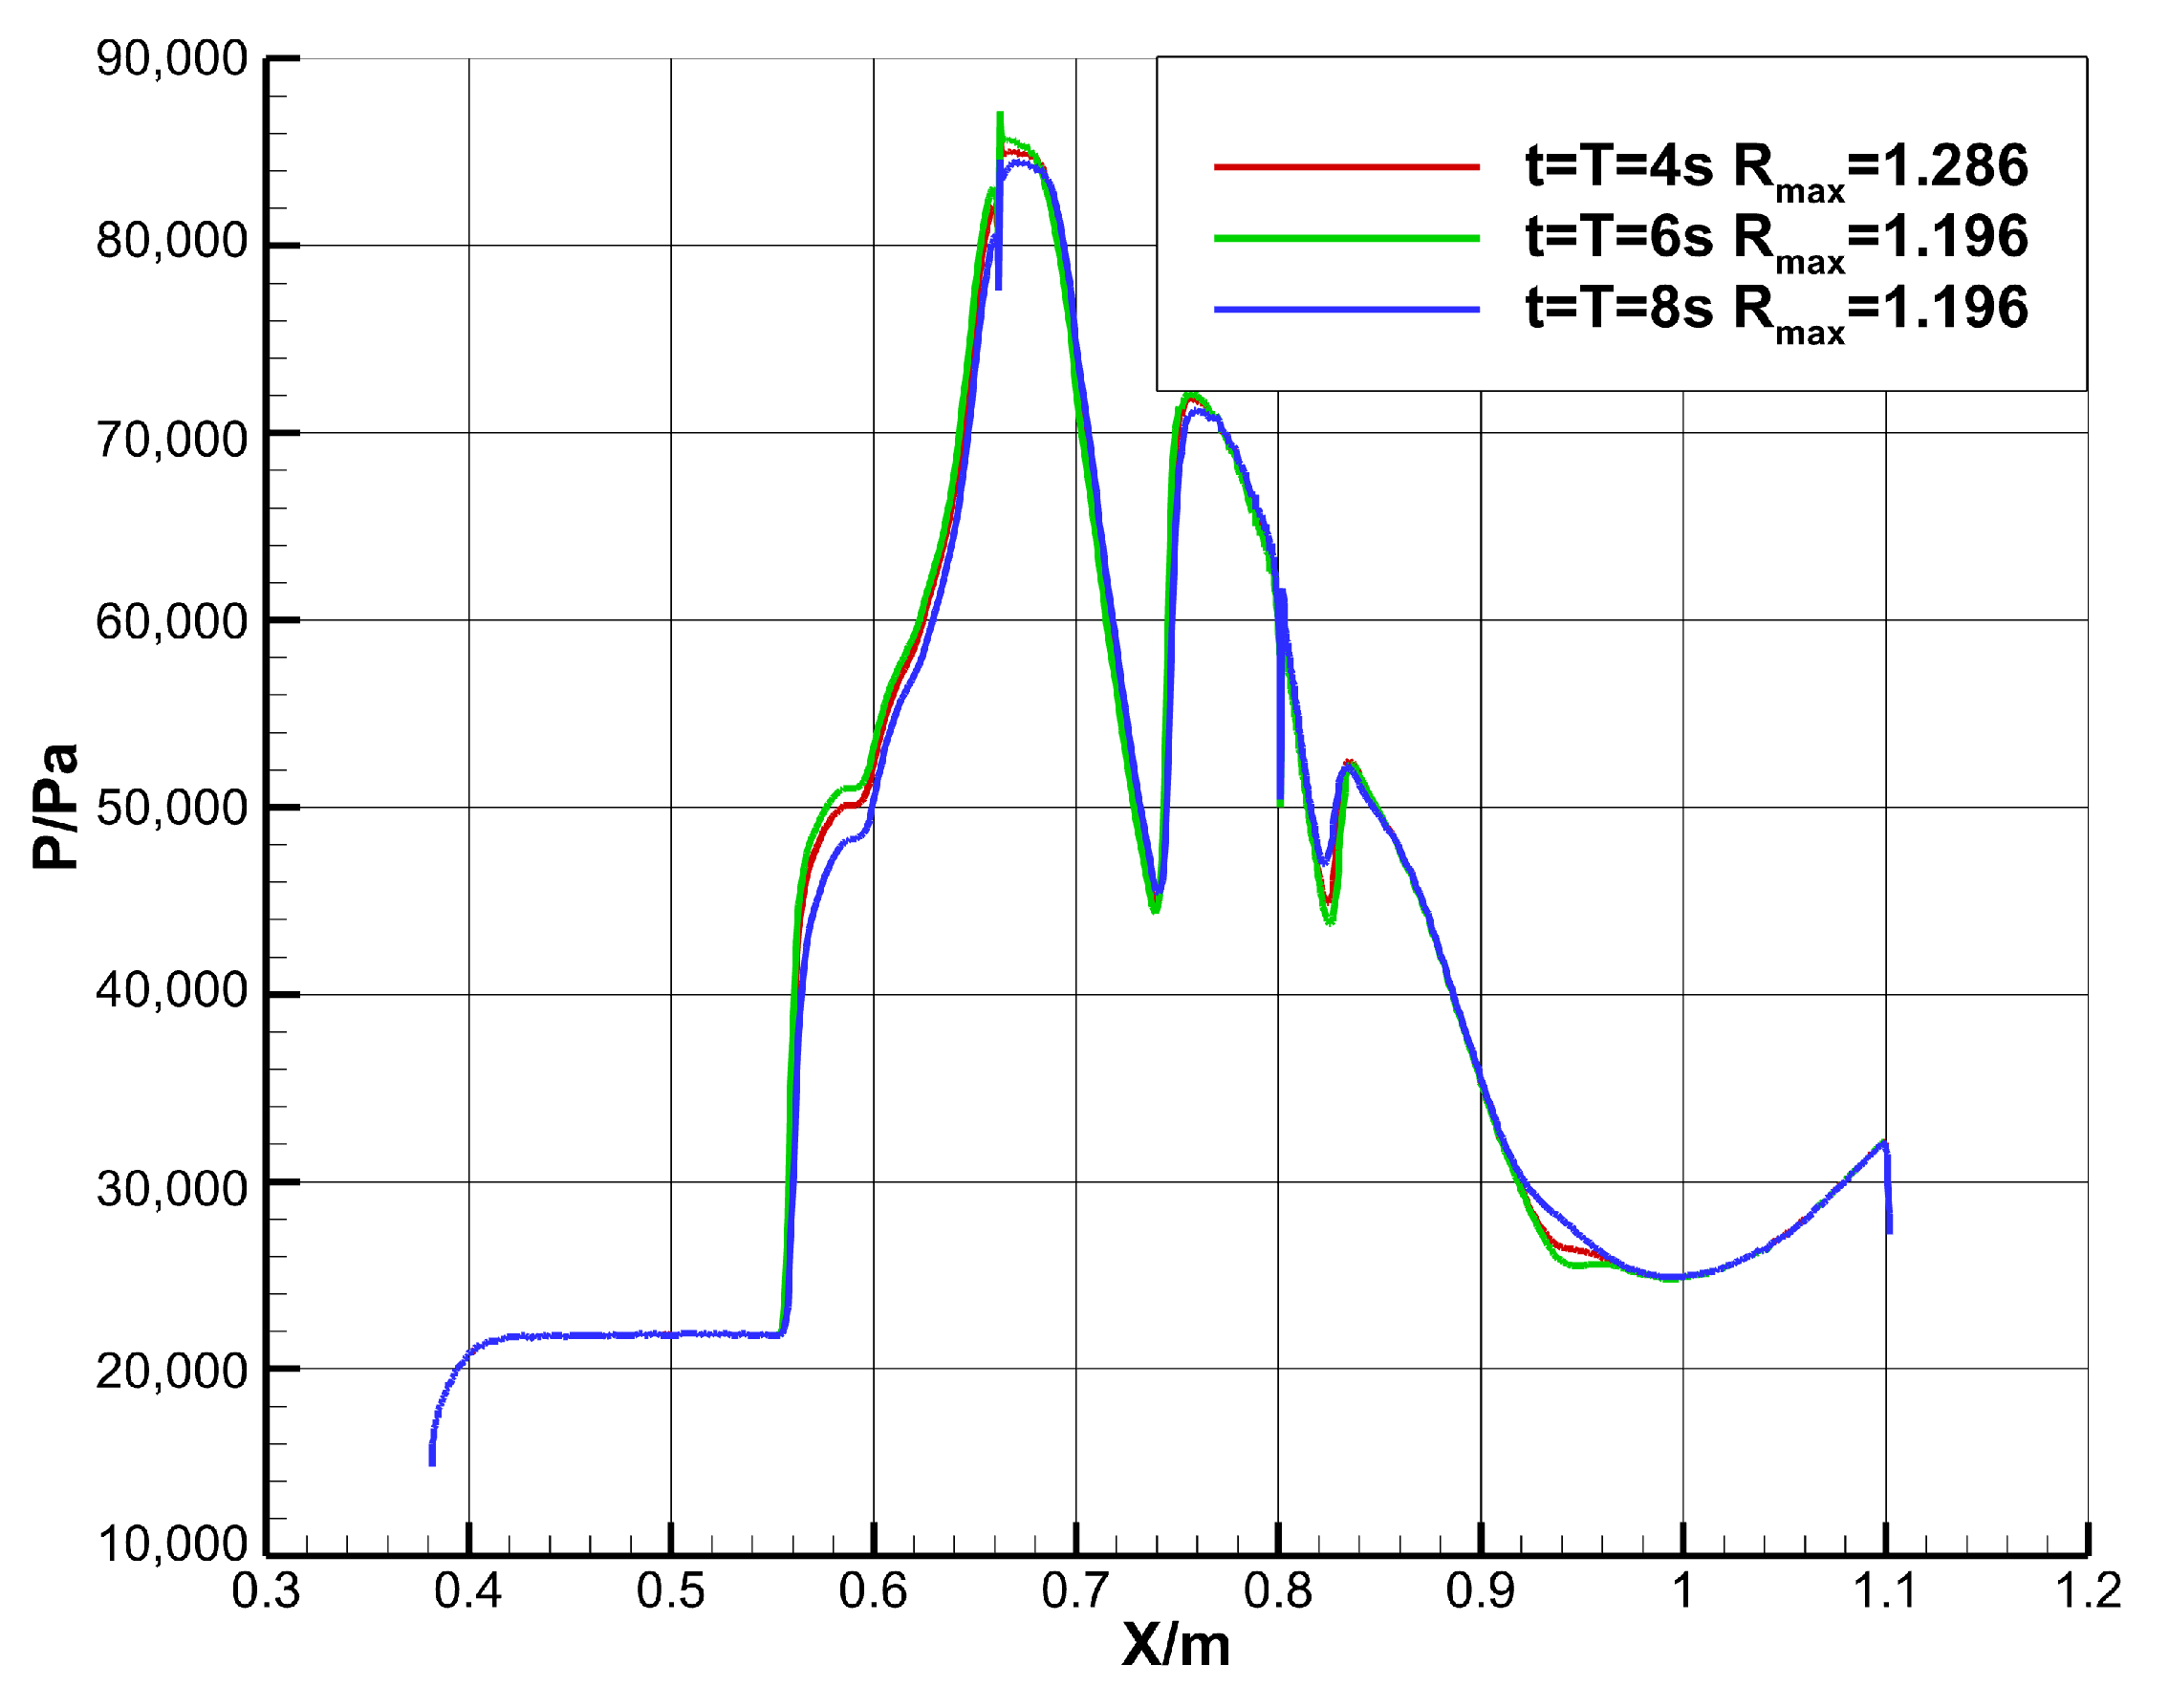
4.2.2. Influence of Geometric Adjustment Time
- When , although influenced by the corner shock wave, flow separation occurs at the shoulder position of the profile. As the relative height R gradually decreases, the intensity of the corner shock wave gradually weakens, and this separation region gradually shrinks until the inlet finally returns to the fully restarted state.
- When , due to the increase in the adjustment time, the flow separation at the shoulder position of the profile develops more fully. It can be observed that the separation region expands significantly and is gradually pushed upstream, finally forming the stable self-sustaining wave system structure described above, the off-design flow state induced by the separation region in the internal contraction section.
4.2.3. Influence of Throat Adjustment Angle
5. Conclusions
- (1)
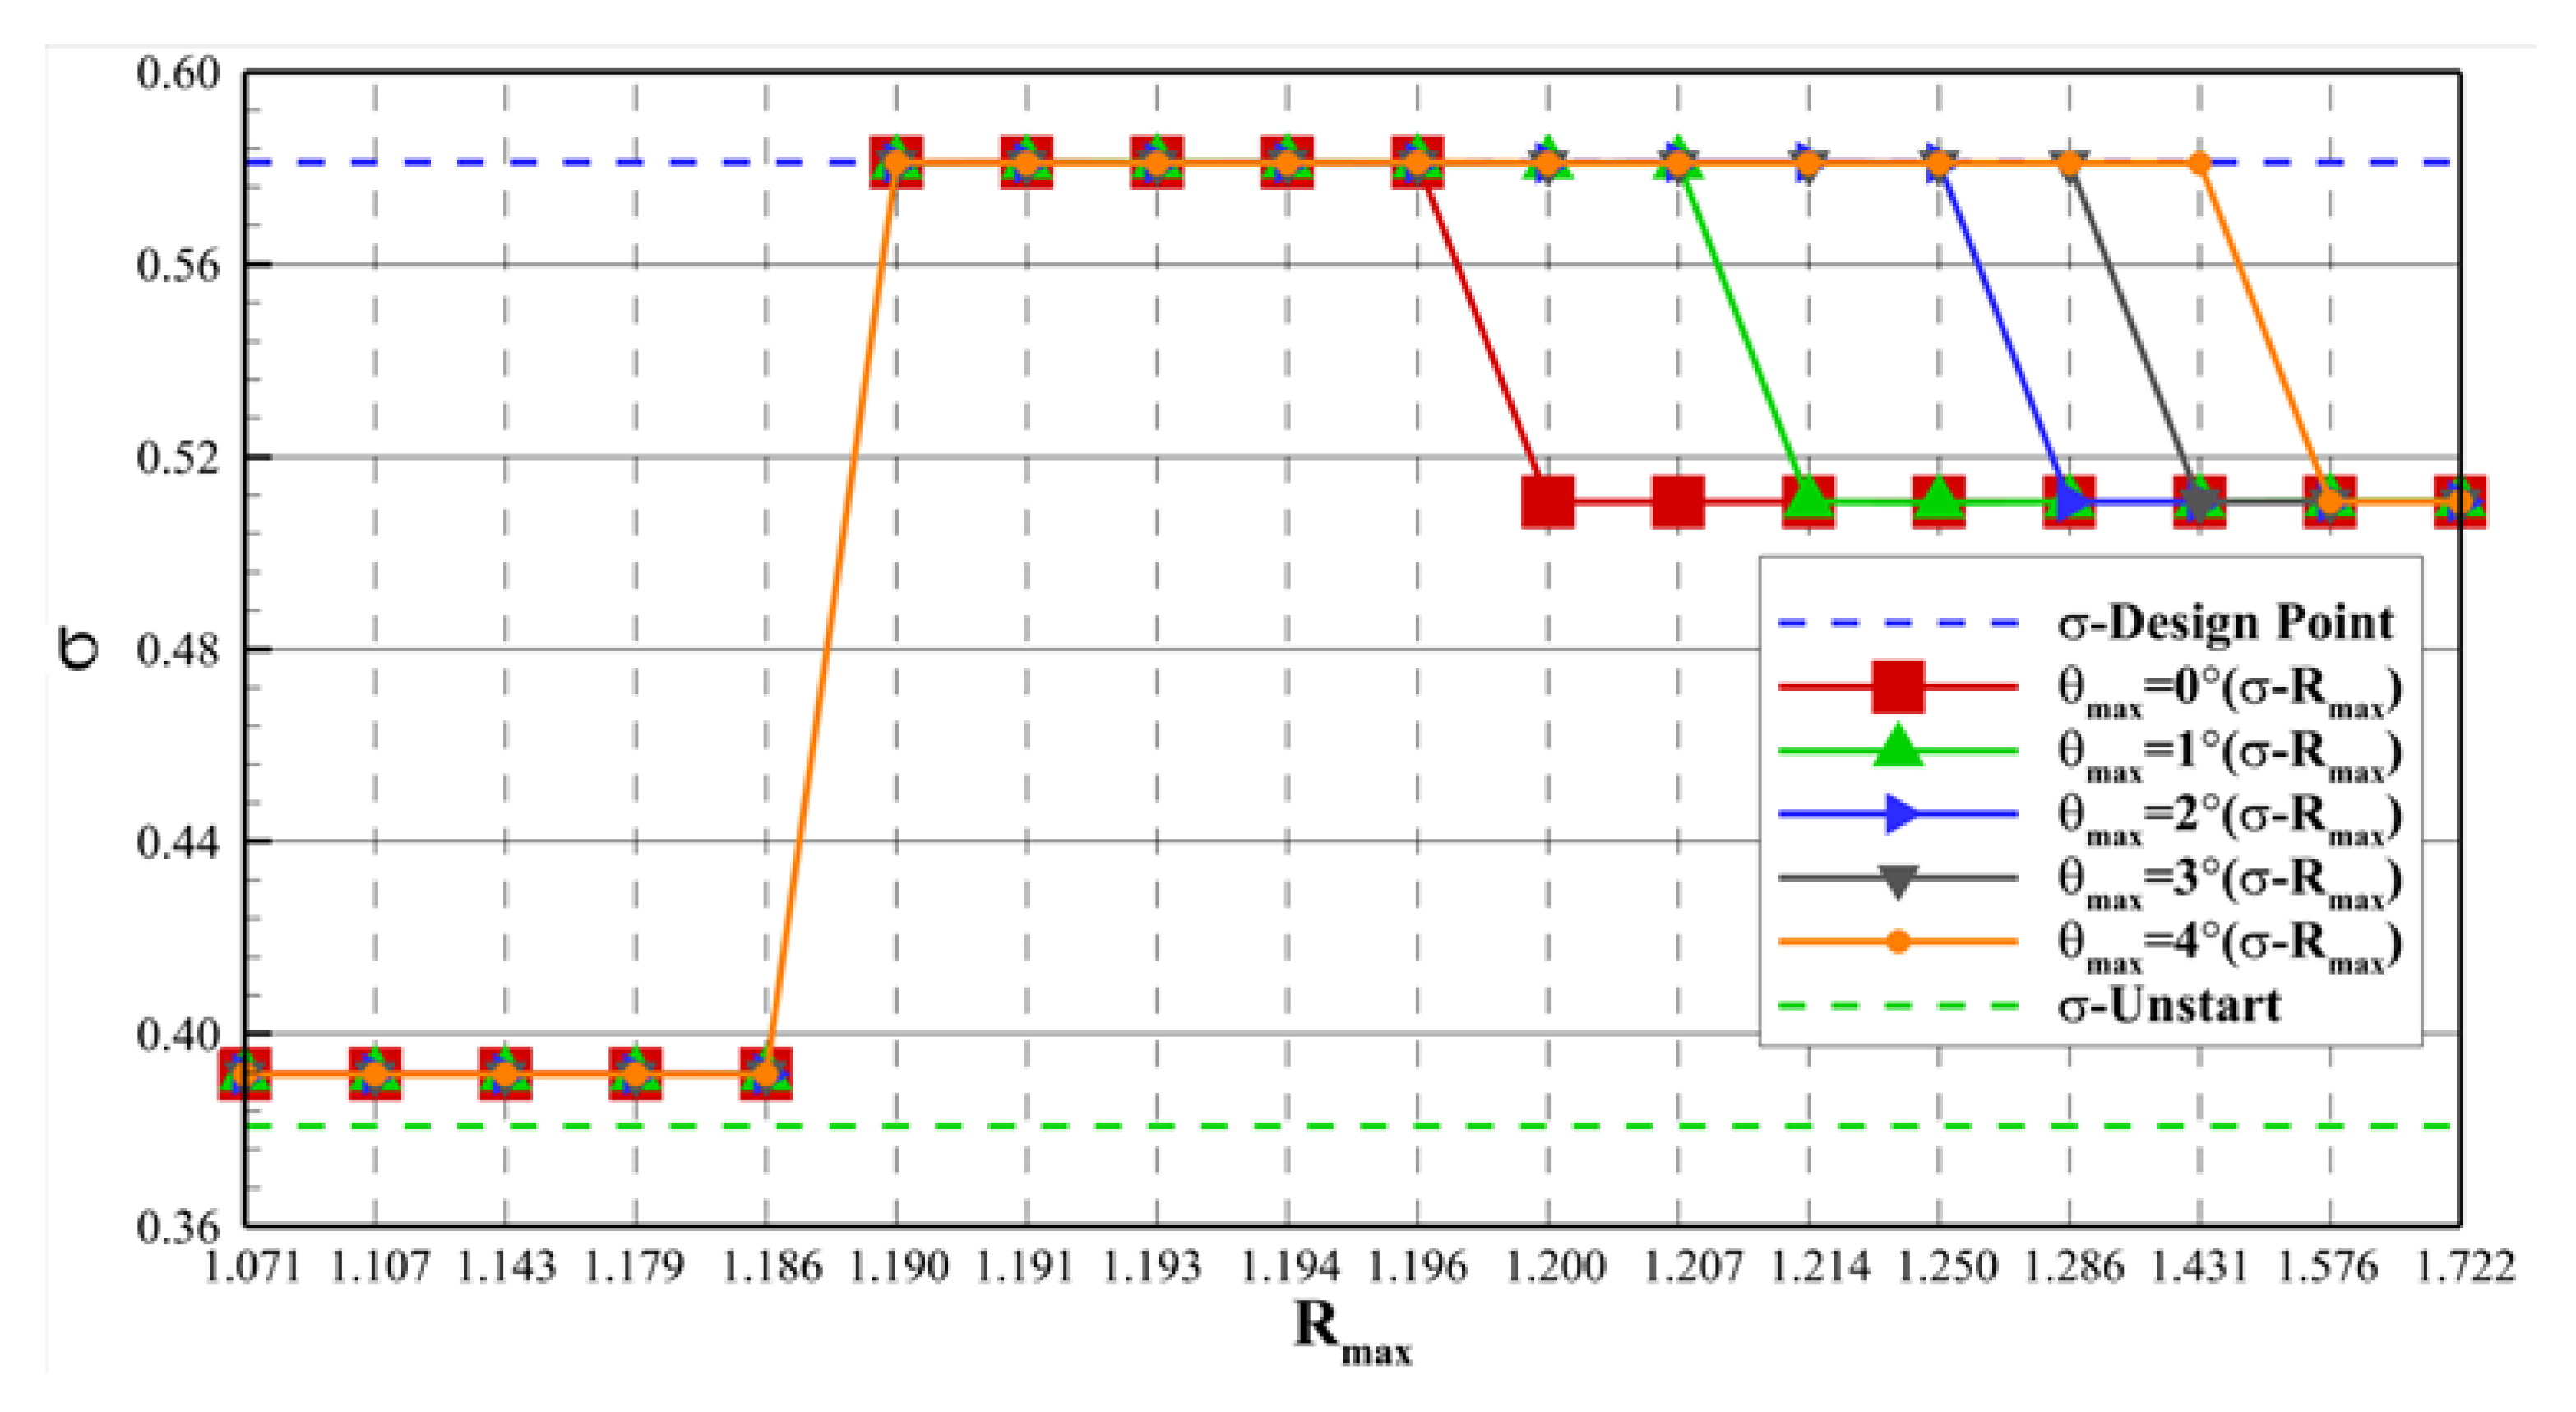
- Throat Adjustment Height: The throat adjustment height is crucial for the restart of high-Mach-number inlets. There are lower and upper critical heights. Only when the adjustment height is within the interval between these two critical values (1.190–1.196 in this research) can the inlet fully restart. Outside this interval, the inlet will be in an unstarted or off-design flow state, which deteriorates the total pressure recovery coefficient and flow coefficient at the inlet and outlet.
- (2)
- Geometric Adjustment Time: The geometric adjustment time has a significant influence on the inlet’s restart. As the adjustment time decreases, the lower critical height remains unchanged, while the upper critical height increases, and the adjustment interval for full restart expands. This is because different adjustment times lead to different degrees of flow separation development during the adjustment process, thereby affecting the final flow state of the inlet.
- (3)
- Throat Adjustment Angle: The throat adjustment angle also affects the inlet restart. As the adjustment angle increases, the lower critical height remains constant, the upper critical height rises, and the adjustment interval widens. The rotation of the isolator can mitigate the negative impact of the corner shock wave and reduce the resistance of the separation bubble on the compression surface moving downstream, which is beneficial to the full restart of the inlet.
Author Contributions
Funding
Data Availability Statement
Conflicts of Interest
References
- He, L.; Zhang, Q.; Yue, L.; Zhang, X.; Wang, W.; Tan, H. Unstart Characteristics of High Speed Inlet at Low Mach Number and Influence Law of Mach Number. J. Propuls. Technol. 2021, 42, 2207–2217. [Google Scholar]
- Zhang, X.; Xu, J.; Yv, K. Study of Oscillation Characteristics of Inlet with High Internal Contraction Ratio in Acceleration Process. J. Propuls. Technol. 2018, 39, 1494–1503. [Google Scholar]
- Rodi, P.E.; Emami, S.; Trexler, C.A. Unsteady pressure behavior in a ramjet/scramjet inlet. J. Propuls. Power 1996, 12, 486–493. [Google Scholar] [CrossRef]
- Kantrowitz, A.; Donaldson, C.D. Preliminary Investigation of Supersonic Diffusers. Tech. Rep. Arch. Image Libr. 1945, 72, 289–295. [Google Scholar]
- Kantrowitz, A. Preliminary Investigation of Supersonic Diffuser; National Advisory Committee for Aeronautics: Washington, DC, USA, 1945.
- Goldberg, T.; Hefner, J. Starting criterion for hypersonic inlets. J. Aircr. 1970, 7, 275–277. [Google Scholar] [CrossRef]
- Donde, P.; Marathe, A.; Sudhakar, K. Starting in Hypersonic Intakes. In Proceedings of the 42nd AIAA/ASME/SAE/ASEE Joint Propulsion Conference & Exhibit, Sacramento, CA, USA, 9–12 July 2006. [Google Scholar]
- Wang, C.; Cheng, K. Critical starting characteristics of hypersonic inlets. J. Aerosp. Power 2008, 23, 997–1002. [Google Scholar]
- Liang, D.; Yuan, H.; Zhang, X. Research on the Effects of Start Ability of Hypersonic Inlet. J. Astronaut. 2006, 27, 714–719. [Google Scholar]
- Haberle, J.; Gulhan, A. Investigation of the performance of a scramjet inlet at Ma 6 with boundary layer bleed. In Proceedings of the 14th AIAA/AHI Space Planes and Hypersonic Systems and Technologies Conference, Canberra, Australia, 6–9 November 2006. [Google Scholar]
- Yuan, H.; Liang, D. Effect of su-ction on starting of hypersonic inlet. J. Propuls. Technol. 2006, 27, 525–528. [Google Scholar]
- Bao, W.; Chang, J.; Niu, W.; Yu, D. Influence Factor Analysis of the MHD Controlled Scramjet Inlet Design. J. Aerosp. Power 2005, 20, 368–372. [Google Scholar]
- Jin, Y.; Yao, W. Numerical Investigation of an Active Jet Control Method for Hypersonic Inlet Restart. Trans. Nanjing Univ. Aeronaut. Astronaut. 2022, 39, 651–662. [Google Scholar]
- Haberle, J.; Gulhan, A. Boundary layer control for hypersonic airbreathing vehicles. In Proceedings of the 34th AIAA Fluid Dynamics Conference and Exhibit, Portland, OR, USA, 28 June–1 July 2004. [Google Scholar]
- Liu, Y.; Wang, L.; Qian, Z. Numerical investigation on the assistant restarting method of variable geometry for high Mach number inlet. Aerosp. Sci. Technol. 2018, 79, 647–657. [Google Scholar] [CrossRef]
- Jin, Y.; Sun, S.; Guo, Y. Dual solution internal flow phenomenon and throttling characteristics of a supersonic variable inlet. Acta Aeronaut. Et Astronaut. Sin. 2023, 44, 127134. [Google Scholar]
- Huebner, L.; Rock, K.; Ruf, E. Hyper-X Flight Engine Ground Testing for X-43 Flight Risk Reduction; Technical Report AIAA 2001-1809; American Institute of Aeronautics and Astronautics: Reston, VA, USA, 2001. [Google Scholar]
- Jin, Z.; Zhang, K.; Chen, W.; Liu, Y. Design andregulation of two-dimensional variable geometry hypersonic inlets. Acta Aeronaut. Astronaut. Sin. 2013, 34, 779–786. [Google Scholar]
- Jacobsen, L.; Tam, C.; Behdadnia, R. Starting and operation of a streamline-traced busemann inlet at Mach 4. In Proceedings of the 42nd AIAA/ASME/SAE/ASEE Joint Propulsion Conference & Exhibit, Sacramento, CA, USA, 9–12 July 2006. [Google Scholar]
- Chen, B.; Gu, L.; Gong, C. Study on variable geometry inlet of acceleration hypersonic vehicle. J. Solid Rocket Technol. 2013, 36, 431–436. [Google Scholar]
- Wang, D.; Zhuang, Y.; Tan, H. Design and simulation of a dual-channel variable geometry turbine based combined cycle inlet. J. Aerosp. Power 2015, 30, 2695–2704. [Google Scholar]
- Li, Y.; Liu, X.; Zhang, M. Design of a two dimensional variable geometry inlet with Mach number 2.5-7.0. J. Rocket Propolsion 2015, 41, 17–22. [Google Scholar]
- Jin, Y.; Sun, S.; Tan, H. Flow response hysteresis of throat regulation process of a two-dimensional mixed-compression supersonic inlet. Chin. J. Aeronaut. 2022, 35, 112–127. [Google Scholar] [CrossRef]
- Spalart, P.; Allmaras, S. A One-Equation Turbulence Model for Aerodynamic Flows; Technical Report AIAA-92-0439; American Institute of Aeronautics and Astronautics: Reston, VA, USA, 1992. [Google Scholar]
- Zhang, J.; Yuan, H.; Wang, Y.; Huang, G. Experiment and numerical investigation of flow control on a supersonic inlet diffuser. Aerosp. Sci. Technol. 2020, 106, 106182. [Google Scholar] [CrossRef]
- James, J.K.; Kim, H.D. Flow Characteristics of a Mixed Compression Hypersonic Intake. J. Appl. Fluid Mech. 2022, 15, 633–644. [Google Scholar]
- Herrmann, C.; Koschel, W. Experimental Investigation of the Internal Compression of a Hypersonic Intake. In Proceedings of the 38th AIAA/ASME/SAE/ASEE Joint Propulsion Conference & Exhibit, Indianapolis, IN, USA, 7–10 July 2022. [Google Scholar]
- Xu, Z.; Li, X.; Xiang, X.; Qian, Z. Numerical simulation study on boundary layer spillage slot flow control for GK01 hypersonic inlet. In Proceedings of the 15th Chinese Computational Fluid Dynamics Conference, Yantai, China, 1 August 2012. [Google Scholar]
- Qian, H.; Qian, Z. Implementation of Three Different Transi-tion Methods and Comparative Analysis of the Results Computed by OVERSET Software. In Proceedings of the 46th AIAA Fluid Dynamics Conference, Washington, DC, USA, 13–17 June 2016. [Google Scholar]
- Liu, Y.; Qian, Z.; Xiang, X. An analysis on typical influencing factors of wind tunnel experimental model of over-under TBCC inlet mode transition. J. Exp. Fluid Mech. 2019, 33, 18–27. [Google Scholar]


| Parameter | Valve |
|---|---|
| 5.79° | |
| 14.10° | |
| 23.89° | |
| 14.10° | |
| Point A (mm) | (236.53, 23.99) |
| Point B (mm) | (381.52, 60.42) |
| Point C (mm) | (661.88, 165.61) |
| Point D (mm) | (801.88, 165.61) |
| Point E (mm) | (1101.88, 110.00) |
| Point F (mm) | (1151.88, 110.00) |
| Point G (mm) | (509.87, 173.69) |
| Isolator length (mm) | 140 |
| Inlet total length (mm) | 1251.88 |
| Grid Density | Cell Number |
|---|---|
| Coarse | 100672 |
| Medium | 282828 |
| Refine | 420619 |
| Case | T | Case | T | ||||
|---|---|---|---|---|---|---|---|
| 1 | 4 s | 1.071 | 10 | 4 s | 1.196 | ||
| 2 | 4 s | 1.107 | 11 | 4 s | 1.200 | ||
| 3 | 4 s | 1.143 | 12 | 4 s | 1.207 | ||
| 4 | 4 s | 1.179 | 13 | 4 s | 1.214 | ||
| 5 | 4 s | 1.186 | 14 | 4 s | 1.250 | ||
| 6 | 4 s | 1.190 | 15 | 4 s | 1.286 | ||
| 7 | 4 s | 1.191 | 16 | 4 s | 1.431 | ||
| 8 | 4 s | 1.193 | 17 | 4 s | 1.576 | ||
| 9 | 4 s | 1.194 | 18 | 4 s | 1.722 |
Disclaimer/Publisher’s Note: The statements, opinions and data contained in all publications are solely those of the individual author(s) and contributor(s) and not of MDPI and/or the editor(s). MDPI and/or the editor(s) disclaim responsibility for any injury to people or property resulting from any ideas, methods, instructions or products referred to in the content. |
© 2025 by the authors. Licensee MDPI, Basel, Switzerland. This article is an open access article distributed under the terms and conditions of the Creative Commons Attribution (CC BY) license (https://creativecommons.org/licenses/by/4.0/).
Share and Cite
Tang, H.; Liu, Y.; Cao, Y.; Gao, L.; Qian, Z. Unsteady Numerical Investigation into the Impact of Isolator Motion on High-Mach-Number Inlet Restart via Throat Adjustment. Aerospace 2025, 12, 450. https://doi.org/10.3390/aerospace12050450
Tang H, Liu Y, Cao Y, Gao L, Qian Z. Unsteady Numerical Investigation into the Impact of Isolator Motion on High-Mach-Number Inlet Restart via Throat Adjustment. Aerospace. 2025; 12(5):450. https://doi.org/10.3390/aerospace12050450
Chicago/Turabian StyleTang, Hongyu, Yuan Liu, Yongfei Cao, Liangjie Gao, and Zhansen Qian. 2025. "Unsteady Numerical Investigation into the Impact of Isolator Motion on High-Mach-Number Inlet Restart via Throat Adjustment" Aerospace 12, no. 5: 450. https://doi.org/10.3390/aerospace12050450
APA StyleTang, H., Liu, Y., Cao, Y., Gao, L., & Qian, Z. (2025). Unsteady Numerical Investigation into the Impact of Isolator Motion on High-Mach-Number Inlet Restart via Throat Adjustment. Aerospace, 12(5), 450. https://doi.org/10.3390/aerospace12050450