Article

Numerical Analysis of Thermal Environment of Multi-Functional Vertical Arm Impacted by Gas of Launch Vehicle at Different Altitudes

School of Mechanical Engineering, Nanjing University of Science and Technology, Nanjing 210094, China
*
Author to whom correspondence should be addressed.
Aerospace 2025, 12(6), 467; https://doi.org/10.3390/aerospace12060467
Submission received: 1 March 2025 / Revised: 22 May 2025 / Accepted: 24 May 2025 / Published: 26 May 2025
(This article belongs to the Section Astronautics & Space Science)

Abstract

:
This paper investigates the heat distribution on the movable vertical arm of the CZ-12 launch vehicle within the rocket plume impact field in the three-horizontal test launch mode. A model for the different flight altitudes of rocket plume impact on the different angles of the vertical arm was established based on the three-dimensional Navier–Stokes equations and a realizable k ε turbulence model. The numerical results were compared with experimental data and schlieren images from literature to verify the effectiveness and accuracy of the established numerical model. The results show that when the flight altitude of the rocket is between 30 m and 40 m, the worst heat environment occurs on the front and bottom of the vertical arm. Before reaching a flight altitude of 30 m, a smaller rotation angle of the vertical arm leads to higher maximum temperatures at these two regions. After reaching a flight altitude of 40 m, a larger rotation angle of the vertical arm results in higher maximum temperatures. The top of the lower frame structure is not directly affected by the rocket plume before reaching a flight altitude of 30 m. After reaching a flight altitude of 40 m, a smaller rotation angle of the vertical arm results in higher heat loads on the frame. The results of this study can provide a basis for designing targeted thermal protection for vertical arms. They also contribute a new idea for reducing the thermal load on the vertical arm, which is to rotate the vertical arm to the appropriate angle according to the rocket takeoff altitude. Meanwhile, these research findings will supply a relative reference for researchers who are concerned about other facilities in the surrounding area.

1. Introduction

With the continuous progress of aerospace technology, the world’s aerospace industry is moving towards commercialization. This development has generated demand for intensive launch schedules. Many countries are developing new-generation launch vehicles that better suit these launch missions [1,2,3]. Faster and more efficient execution of aerospace launch tasks has become a critical competitive point for major commercial aerospace companies [4]. To enhance the efficiency of aerospace launches, some commercial aerospace companies have adopted the “three-horizontal” test launch mode. The assembly of the carrier rocket, the transportation process of the rocket, and various tests before the rocket launch are all completed when the rocket is in a horizontal state. This launch method offers significant advantages such as suitability for long-distance transportation, lower costs for launch site construction, and shorter occupation time for launch positions. These benefits make it well-suited for intensive launch tasks.
During the launch process of a launch vehicle, the high-temperature and high-speed gas flow expands rapidly into the external environment after passing through the rocket engine, continuously impacting ground launch facilities [5]. This causes deterioration of the pressure and heat environment on the ground, posing safety threats to ground launch equipment and even the launch vehicle itself [6,7,8]. For example, on 30 January 2007, the Zenit-3SL launch vehicle exploded immediately upon ignition at the launch pad, destroying both the rocket and the payload; on 1 September 2016, a Falcon 9 static fire test resulted in an explosion at the launch pad, damaging the launch platform; on 19 August 2024, a rocket engine at the Augsburg rocket factory exploded at the launch pad; on 19 September 2024, Rocket Lab’s Electron rocket aborted the launch due to a sensor triggering an abort command in the flight computer after ignition.
In the “three-horizontal” test launch mode, the vertical arm of the launch vehicle not only carries out the task of raising the launch vehicle from a horizontal to a vertical position but also typically integrates functions such as the rocket transport support frame, the umbilical tower for supporting cables and pipelines [9]. Therefore, during the launch of the launch vehicle, this vertical arm is affected by the impact of the rocket plume. At the same time, the vertical arm changes the geometric structure of the area impacted by the gas flow, thereby having a direct influence on the structure of the impact flow field [10,11]. The impact of the rocket plume on the vertical arm is complex. Limited sensor measurement points are insufficient to fully analyze the distribution of the gas flow impact on the vertical arm. However, during the rocket ignition and liftoff phase, the rocket plume is the primary factor affecting launch safety [12,13]. Therefore, conducting related CFD (Computational Fluid Dynamics) simulations is beneficial for analyzing the impact patterns of the gas flow on the vertical arm, allowing targeted protective measures to be taken for different parts of the vertical arm. This ensures that the vertical arm can withstand multiple uses [14], thereby enhancing the safety of the launch vehicle.
Several scholars have already conducted research on the impact of rocket plume on ground launch facilities: Harris et al. used a three-dimensional computational software (CR Tech’s Thermal Desktop-SINDA/FLUINT) to calculate the CFD flow field data during the SLS rocket launch and mapped the flow data on the deflection trough to simulate the ablation of high-temperature-resistant materials. The results showed that the surface thickness of the impacted material would decrease by approximately 0.25 inch [15]. Daniel et al. used the CEA calculation program to compute the exit conditions of the Ares V first-stage engine and further utilized CFD software (CRUNCH CFD & NASA Chemical Equilibrium) to calculate the pressure and temperature distribution of the gas jet on the deflection trough. The results showed that the CFD calculations were consistent with the simplified analytical results. Larger impact angles may lead to gas flow reflux [16]. Zhou Zhitan et al. conducted numerical calculations for the impact of the launch vehicle on the deflection trough at different impact angles and lift angles. The results showed that when the impact angle is around 25°, the gas flow deflection effect in the deflection trough is optimum. An appropriate lift angle at the outlet helps to reduce the gas reflux effect [17,18]. Xing Chenglong et al. conducted numerical simulations of the flow field caused by multiple jet streams during the launch of the launch vehicle. The computational model included a simplified rectangular launch service tower. Further analysis revealed the impact of the deflection trough and the launch service tower location on the acoustic environment of the flow field during the launch vehicle’s liftoff [19]. Zhao Chengeng et al. conducted numerical simulations of the gas flow field impacting the deflection trough at four different flight altitudes (H = 0 m, 0.2 m, 2 m, and 10 m) during the liftoff of a single-nozzle launch vehicle. On this basis, they considered the impact of lateral wind-induced drift of the launch vehicle and the afterburning of the gas flow on the flow field. The results showed that the drift of the launch vehicle reduces the stability of the gas deflection in the deflection trough. Considering the afterburning, the temperature of the gas flow field will further increase [20]. Lu Chenyu et al. conducted numerical simulations of the gas jet containing aluminum oxide solid particles during the launch of a solid–liquid hybrid launch vehicle. The results showed that the thermal environment on the launch pad is particularly harsh when the flight altitudes range from 3 to 20 m. Moreover, the drift of the rocket on the launch pad will exacerbate the thermal environment on the surface of the launch pad. Considering the rocket drift, the surface gas temperature at the impacted location on the launch pad will increase by 30% [21]. Su Yifei et al. conducted calculations of the gas impact-seawater spray cooling flow field on the sea launch platform for the CZ-8X launch vehicle at different flight altitudes. The results showed that the optimal spray velocity for the seawater spray cooling system is around 20 m/s. As the flight altitude of the launch vehicle increases, at 30 m, the gas flow will fully impact the deck surfaces near the launch platform, resulting in the worst thermal environment for the surrounding equipment [22].
The aforementioned studies indicate that the rocket plume impact on launch system facilities brings significant pressure and heat loads, and as the rocket’s flight altitude increases, the range of the launch pad impacted by the gas flow expands. Most of the previous studies focused primarily on the deflection trough directly below the launch vehicle, without considering that the impact area of the gas flow below the rocket will expand as the flight altitude increases. This expansion not only directly impacts the launch pad but also affects surrounding facilities such as the launch service tower and the vertical arms. The impact of the rocket plume on the launch service tower and vertical arms has been largely overlooked in the CFD domain. One important reason for this oversight is that as the rocket’s flight altitude increases, the grid scale and complexity required for calculating the impact of the rocket plume on the ground facilities become significantly higher. With the rapid advancement of modern computing technology, it has become possible to simulate larger-scale external flow fields of space launches, including the impact on the surrounding launch facilities, like the launch service tower.
This paper establishes a numerical model of the rocket plume impact on a multi-functional vertical arm during the launch process of the CZ-12 launch vehicle (which has a first-stage propulsion system consisting of four engines). The aim is to assist in the design of multi-functional vertical arms for aerospace launch missions. First, the simulation results were compared with experimental data to verify the reliability of the numerical model. Then, the model was used to numerically simulate the impact of the CZ-12 launch vehicle on multi-functional vertical arms with different deployment speeds at various flight altitudes. By analyzing the numerical calculation results, the differences in the pressure and heat environment of the multi-functional vertical arms at different deployment angles under different flight altitudes were obtained. These numerical results can provide a reference for the design and operational state determination of multi-functional vertical arms in launch vehicle missions.

2. Computational Model

2.1. Geometric Model

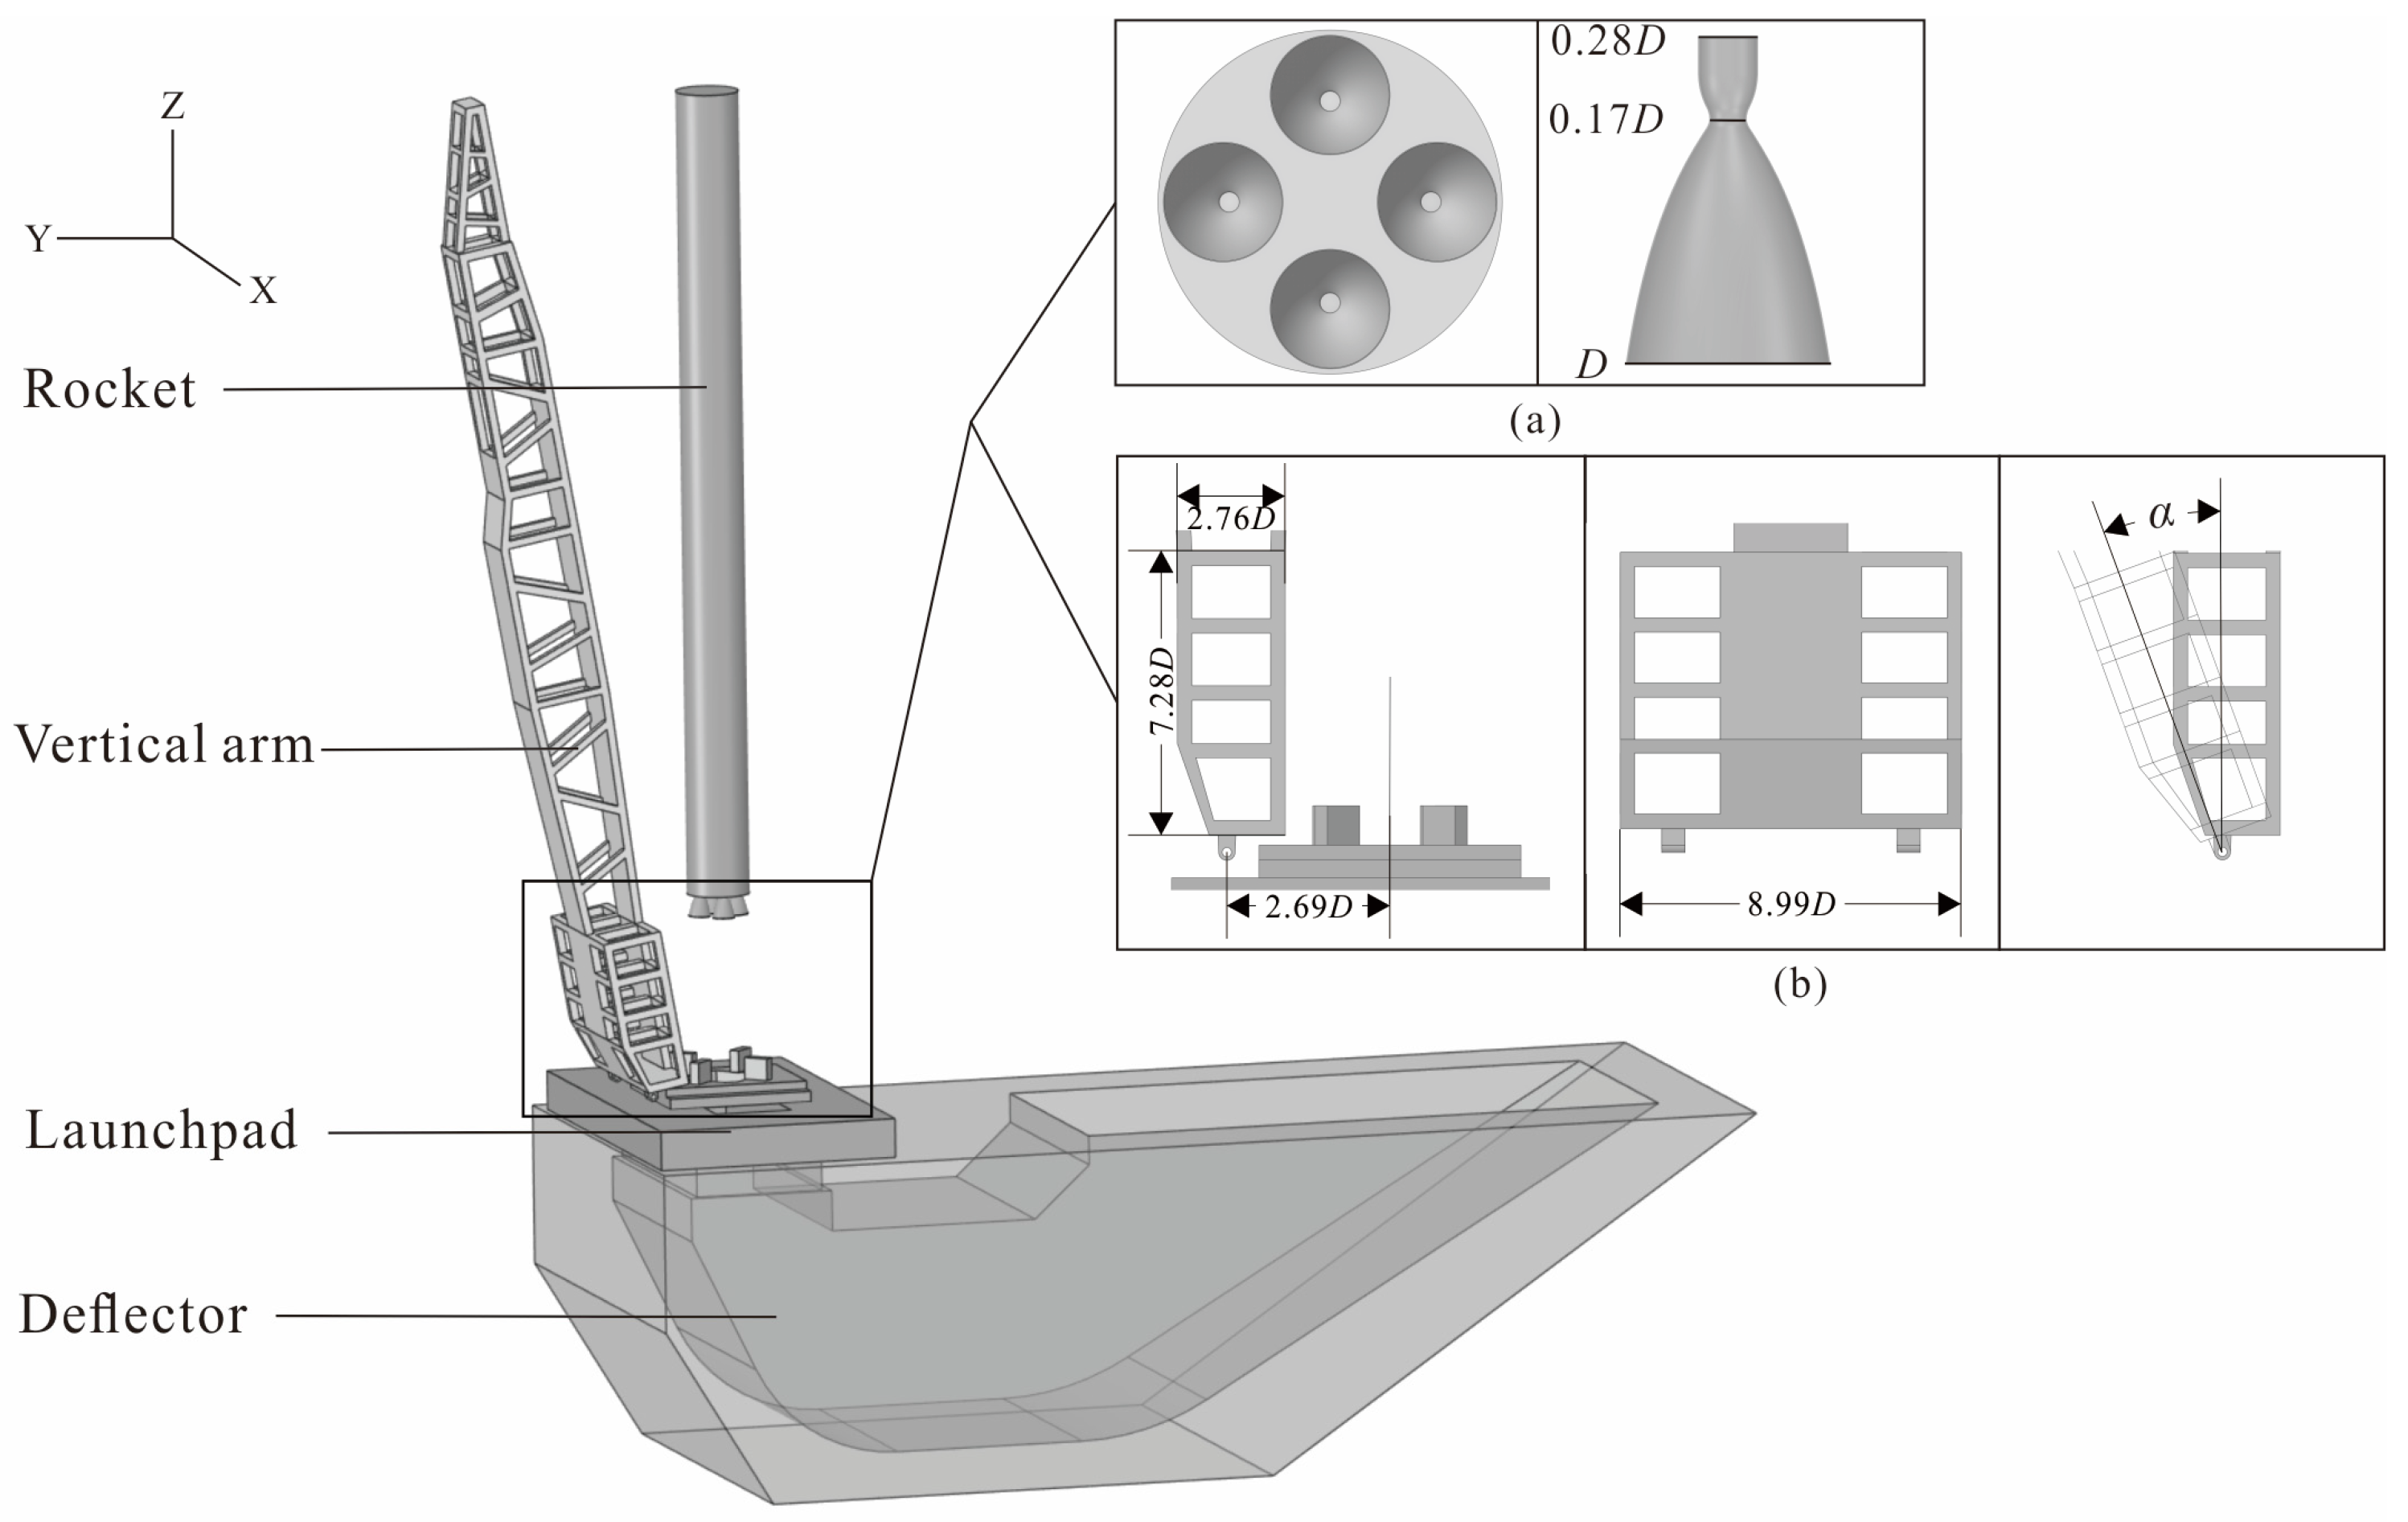
As shown in Figure 1, the launch vehicle is designed to be launched on a launch pad equipped with an L-shaped deflector, which has good gas flow deflection performance to minimize the impact of the launch vehicle’s gas flow field on ground equipment and the splashback of the gas flow onto the rocket body. After completing the test launch, the launch vehicle is horizontally transported to the launch pad using a multi-functional vertical arm and raised to a vertical launch-ready position. During launch, the vertical arm continuously deflects outward to mitigate the impact of the gas flow. The first-stage propulsion system of the launch vehicle consists of four identical engines. The nozzle entrance and throat diameters are 0.28D and 0.17D, respectively, where D is the exit diameter (see Figure 1a). The deflection trough entrance is located directly beneath the rocket, and the rocket is supported by four symmetrically distributed rectangular pads. The rotation center axis of the multi-functional vertical arm is located 2.69D away from the rocket’s central axis, and the angle between the vertical arm and the vertical direction is denoted as α. Figure 1b shows the dimensions and relative positions of the frame structure under the vertical arm. The three dimensions of the frame structure used to enhance the structural strength of the vertical arm are 7.28D, 2.76D, and 8.99D.

2.2. Mesh and Boundary Conditions

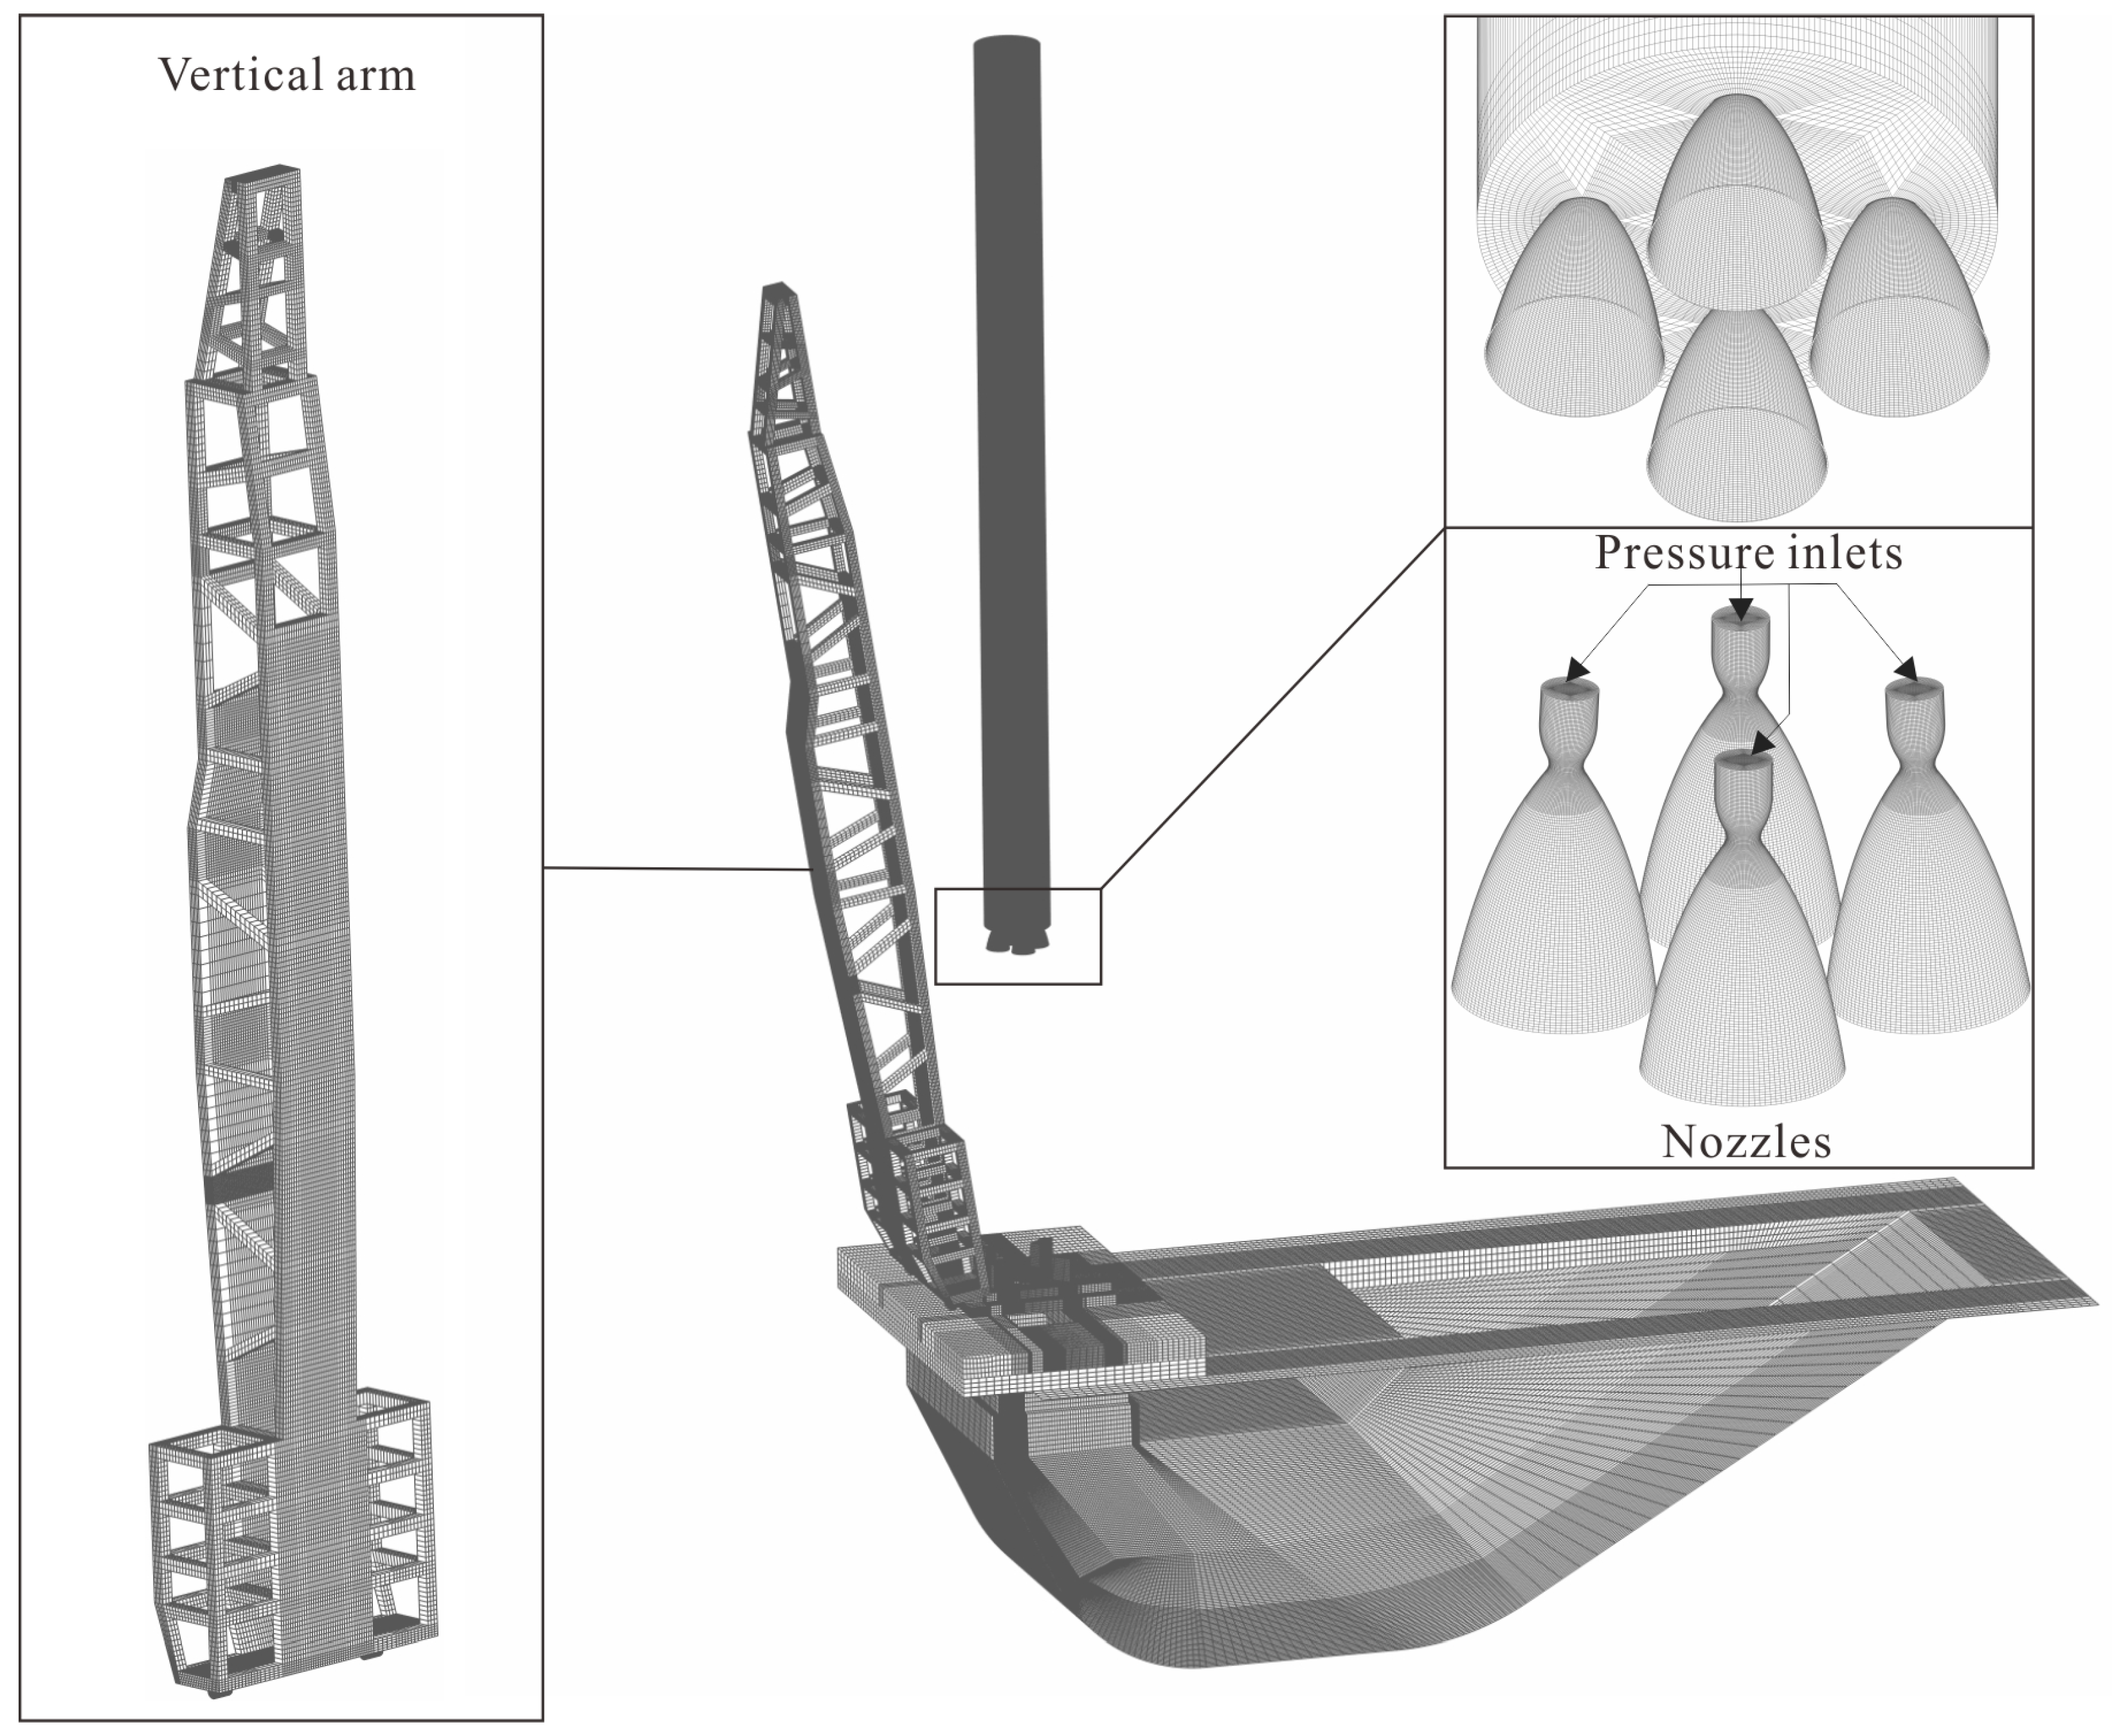
Due to the height of the vertical arm, the impact area of the gas flow increases with increasing rocket height. It is still necessary to consider the impact of the launch platform and the deflector on the flow field, requiring analysis of multiple scenarios at different rocket flight altitudes. Therefore, it is essential to control the number of cells of mesh. In performing numerical simulations of the launch vehicle on a launch pad with a vertical arm, a structured mesh is used to improve grid orthogonality (see Figure 2). The mesh is refined in the region of the rocket engines and the highly turbulent flow areas underneath, balancing computational precision and cost. Hexahedral structured mesh is used in simulations: 99.9995% of grid cells have a Jacobian determination of 2 × 2 × 2 greater than 0.75, and the minimum value of Jacobian determination is 0.45; 99.9813% of grid cells have a minimum dihedral angle greater than 58.5°; 97.3687% of grid cells have Eriksson skewness greater than 0.9, and the minimum value of Eriksson skewness is 0.645.
Mesh independence verification was performed for rocket flight altitudes ranging from 10 to 60 m. Taking the case of a rocket height of 20 m and a vertical arm inclination angle of α = 9° as an example, computations were carried out using 6.53 million, 9.50 million, 11.09 million, and 12.38 million cells of mesh. The temperature distribution of the gas flow on the lower part and the bottom surface of the vertical arm was extracted.
Figure 3a,b show the gas temperature distribution cloud maps for the lower part and the bottom surface of the vertical arm. Figure 3c,d are the temperature distribution curves along the black arrow lines in the temperature distribution cloud maps. Among them, the results of the 9.50 million, 11.09 million, and 12.38 million cells of mesh simulations are basically consistent, while the results of the 6.53 million cells of mesh simulation show slightly larger deviations. Therefore, in subsequent simulations involving the launch pad with the vertical arm, a grid size similar to the 9.50 million cells of mesh used for the 20 m rocket flight altitudes and α = 9° inclination angle condition will be employed.
All wall boundaries of the vertical arm, launch system, and launch vehicle are set as adiabatic walls. The total inlet temperature at the engine nozzle is set at 3800 K, provided during the design phase of the CZ-12. The gas composition is listed in Table 1, and the static pressure is 18.6 MPa. The average molecular weight of air is set to 28.85 kg/kmol. The initial air temperature in the computational domain is set to 300 K, and the air pressure and outlet pressure are set to 101,325 Pa. The corresponding relationships between the vertical arm angle and rocket height for different operating conditions are shown in Table 2. Working condition 2 corresponds to the state of the vertical arm during the first launch of the CZ-12 on the evening of 30 November 2024.

3. Numerical Method

3.1. Governing Equations

For the multi-component gas flow of the liquid launch vehicle and air, both satisfy the continuity assumption and the ideal gas equation of state [23]. The multi-component three-dimensional compressible Navier–Stokes (N–S) equations can be written as follows [22]:
t Ω U d Ω + Ω ( F c F v ) d S = Ω Q d Ω
where the volume of the control body is Ω and the boundary is of d Ω , and Q is the control body source term. U is the control body conservation variable, F c and F v are the convective and viscous fluxes across the control body boundary, and they are defined as follows [22]:
U = ρ ρ u ρ v ρ w E ,   F c = ρ V ρ u V + n x p ρ v V + n y p ρ w V + n z p ( E + p ) V ,   F v = 0 n x τ x x + n y τ x y + n z τ x z n x τ y x + n y τ y y + n z τ y z n x τ z x + n y τ z y + n z τ z z n x Θ x + n y Θ y + n z Θ z
In the above equations, ρ is the fluid density, p is the hydrostatic pressure, and E is the energy density per unit volume. V is the normal velocity of the control body unit, and u , v , and w are the velocity components in the x , y , and z directions, respectively. The relationship between them can be expressed as below:
V = u n x + v n y + w n z
Based on the Stokes assumption, the viscous stresses τ and Θ of the fluid are defined as follows [23]:
τ x x = 2 μ u x 2 3 μ ( u x + v y + w z ) τ y y = 2 μ v y 2 3 μ ( u x + v y + w z ) τ z z = 2 μ w z 2 3 μ ( u x + v y + w z )
τ x y = τ y x = μ ( u y + v x ) τ x z = τ z x = μ ( v z + w y ) τ y z = τ z y = μ ( u z + w x )
Θ x = u τ x x + v τ x y + w τ x z + K T x Θ y = u τ y x + v τ y y + w τ y z + K T x Θ z = u τ z x + v τ z y + w τ z z + K T x
In the above equations, μ is the dynamic viscosity coefficient, K is the heat transfer coefficient, T is the fluid temperature.

3.2. Spatial Discretization Schemes

The total temperature and total pressure at the entrance of the launch vehicle’s engine are high, and the exhaust jet is in a highly under-expanded supersonic flow state with a complex shock wave structure [24,25]. The second-order upwind Total Variation Diminishing (TVD) scheme is highly accurate for solving highly compressible flows, has strong shock-capturing capabilities, and possesses good robustness. Therefore, the second-order upwind TVD scheme is used to compute the gas jet flow field of the launch vehicle engines.
Using the finite volume method to discretize Equation (1) [25]:
d U d t = 1 Ω m = 1 N F F c F ν m Δ S m Q Ω
In the equations, N F is the number of control volume faces, and Δ S m is the length or area of the boundary, with m being the index of the boundary.
The second-order upwind Total Variation Diminishing (TVD) scheme is used to discretize the convective flux [25]:
1 V i , j , k V i , j , k U d V + F ˜ c i + 1 / 2 , j , k F ˜ c i 1 / 2 , j , k + F ˜ c i , j + 1 / 2 , k F ˜ c i , j 1 / 2 , k + F ˜ c i , j , k + 1 / 2 F ˜ c i , j , k 1 / 2 = 0
In the equations, the numerical circulation quantities are respectively as follows:
F ˜ c i + 1 / 2 , j , k = 1 2 F ˜ c i , j , k + F ˜ c i + 1 , j , k k = 1 m α ˜ k λ ˜ k e ˜ k A ˜ F ˜ c i , j + 1 / 2 , k = 1 2 F ˜ c i , j , k + F ˜ c i , j + 1 , k k = 1 m β ˜ k κ ˜ k e ˜ k B ˜ F ˜ c i , j , k + 1 / 2 = 1 2 F ˜ c i , j , k + F ˜ c i , j , k + 1 k = 1 m γ ˜ k ϑ ˜ k e ˜ k C ˜
In the equation, λ k , κ k , and ϑ k are the eigenvalues of the linearized replacement matrix, α k , β k , and γ k are the coefficients of the expansion terms of the linearized replacement matrix, e k A , e k B , and e k C are the eigenvectors of the linearized replacement matrix, and the viscous flux is dispersed using second-order center difference.

3.3. Turbulence Model

Although the k-ε SST turbulence model can more accurately predict flow separation phenomena. It is commonly used in aviation fields that require extremely high accuracy in turbulence solving, such as aircraft airfoils and turbine engines (turbine blade channel separation). For such studies, the size of mesh for the incoming far-field can be larger, requiring only finer mesh on the airfoil or engine blades and wall surfaces. But in the research context of this article, a considerable number of cells of mesh descriptions are required for the gas jet inside the nozzle. Subsequently, the gas flow is accelerated through the Laval nozzle at a speed exceeding 6 Ma. Therefore, a detailed mesh is also required for the entire area below the engine (the cells of mesh which increase with the rocket flight altitude). The computational cost of using the k-ε SST turbulence model is high and requires finer wall mesh. In this context of research, the realizable k-ε two-equation model provides better stability for the numerical solution of turbulence [26,27], accurately describing the diffusion of planar jets and providing better predictions for turbulent boundary layer flow situations [28]. This turbulence model is suitable for high-speed flow problems near walls [29,30,31]. The turbulence dissipation rate ε in the equation no longer includes the generation term G k in the turbulence kinetic energy equation. The coefficient C μ in the turbulent viscosity Equation μ t is related to the strain rate, which better describes the energy conversion process.
The turbulent kinetic energy equation is as follows [26]:
ρ k t + ρ k u i x i = x j μ + μ t σ k k x j + G k ρ ε
In the equations, μ represents the mixture viscosity, G k is the generation term of turbulent kinetic energy k due to the mean velocity gradient, with the constant coefficient σ k = 1.0 .
The turbulent dissipation rate ε equation is as follows [26]:
ρ ε t + ρ ε u i x i = x j μ + μ t σ ε ε x j + ρ C 1 E ε ρ C 2 ε 2 k + v ε
In the equation, the constant coefficient σ ε = 1.2 , C 1 = 1.44 , C 2 = 1.9 , and E is the average characteristic strain rate.

4. Model Verification

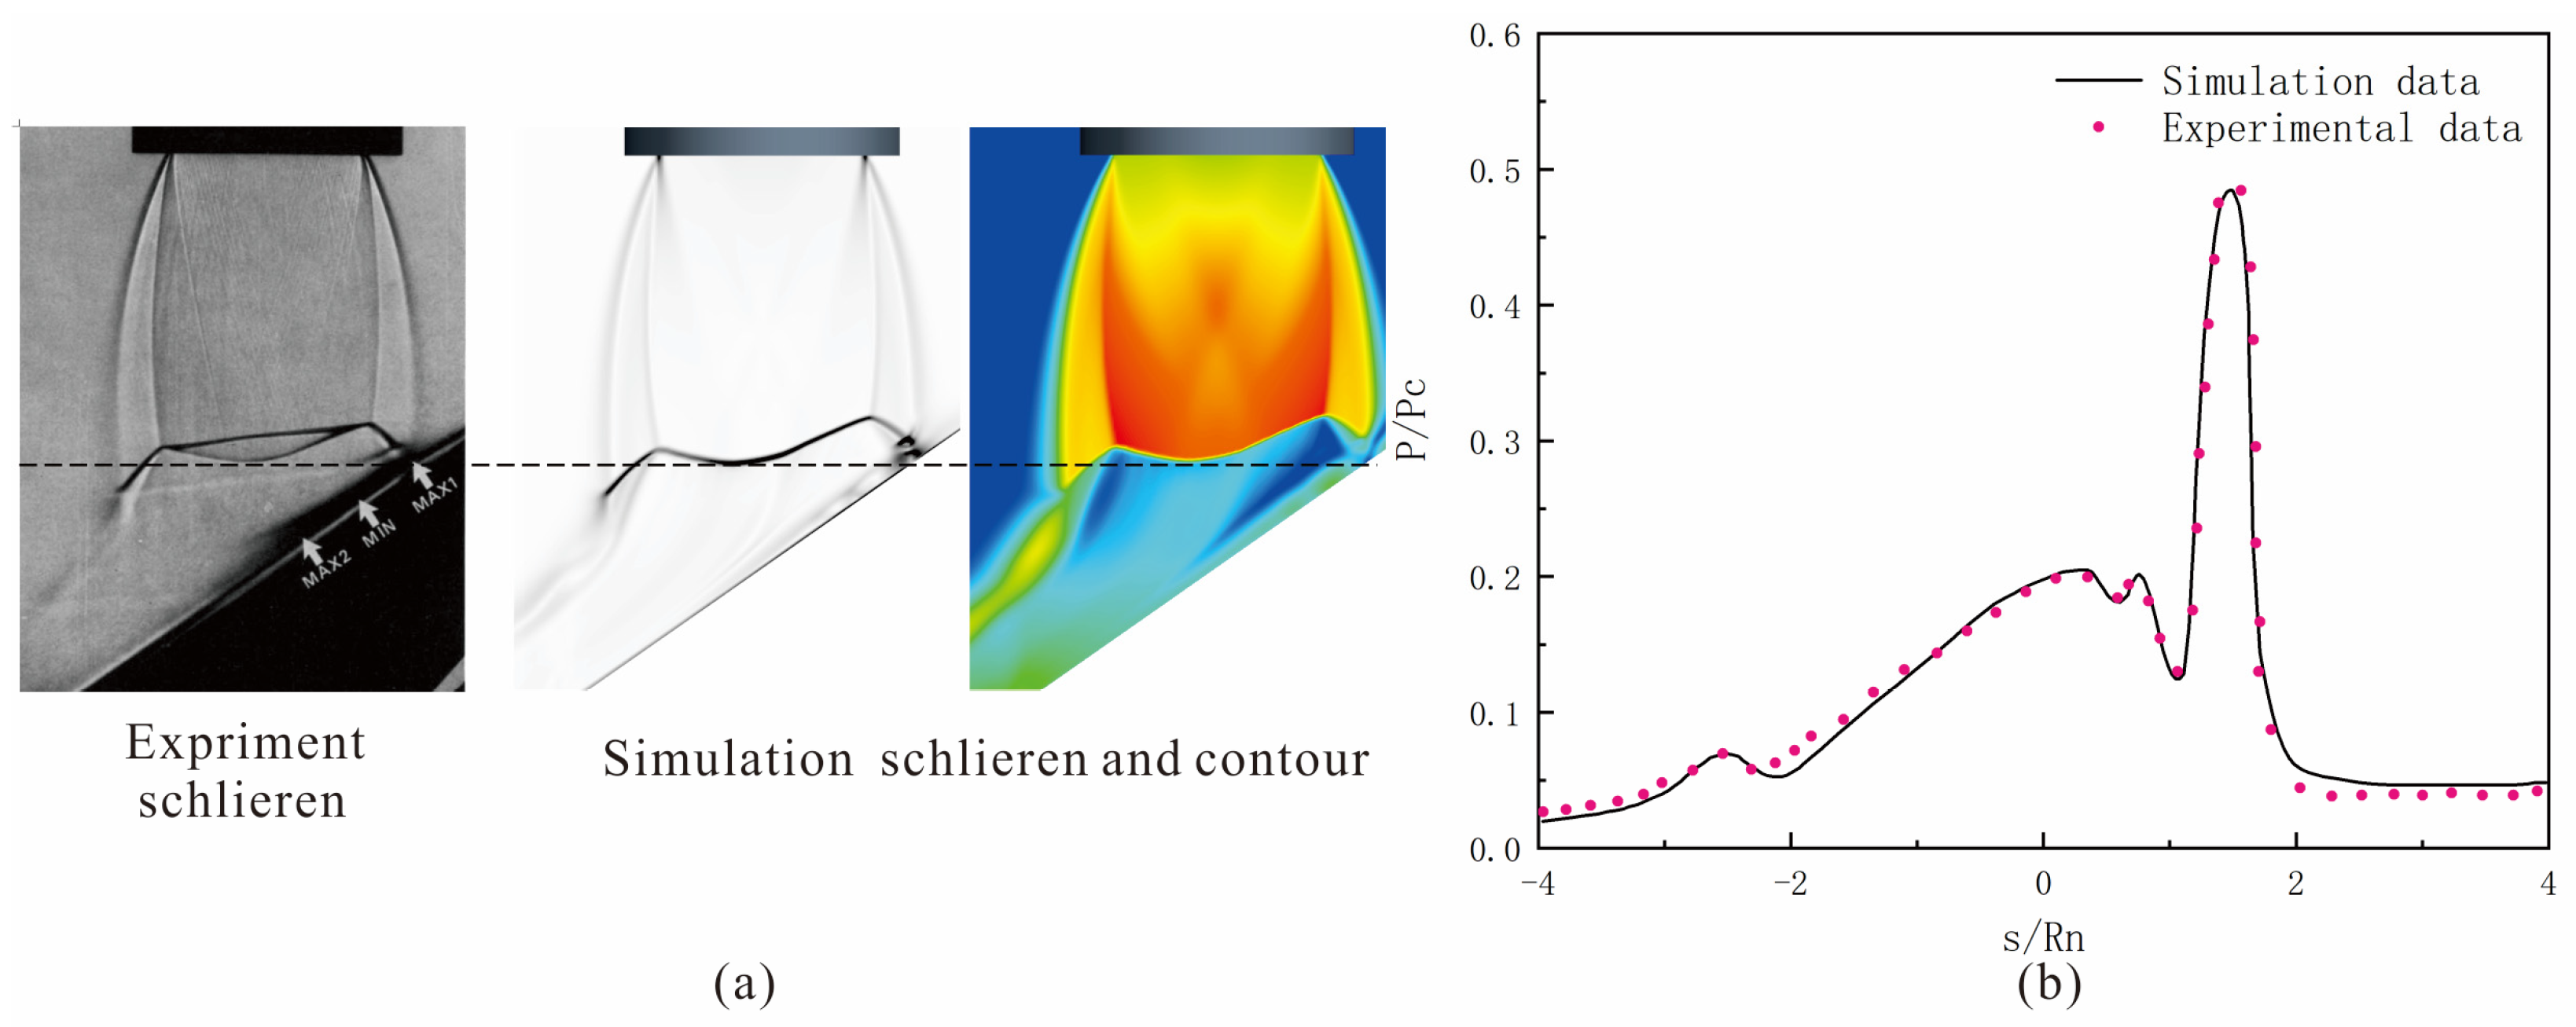
To verify the effectiveness and accuracy of the numerical method and turbulence model used in this paper, numerical simulations were conducted for the experiments by Lamount and Hunt [32]. The parameters are as follows: the nozzle exit radius R n = 15   mm , the flat plate diameter is 300 mm, the throat radius r = 10.7   mm , the distance from the center point of the nozzle exit plane to the flat plate is 4 R n , the angle between the flat plate and the nozzle axis θ = 55 ° , and the ratio of the pressure at the nozzle exit to the ambient pressure nearby is P R = 2.0 . Figure 4 shows the comparison between the experimental and computational results. Figure 4a compares the experimental schlieren image and the computed schlieren image and Mach number cloud map. The results show that the wave structures in the computed flow field are clear and highly consistent with the experimental schlieren image. Figure 4b compares the pressure distribution along the centerline of the flat plate between the experimental results and the computational results. Here, s is the distance from the pressure measurement point to the nozzle axis, and P c is the total pressure at the nozzle inlet. The results show that the pressure distribution from the computational results is highly consistent with the experimental results in the literature. In summary, the effectiveness of the numerical method and turbulence model used in this paper has been verified.

5. Results and Discussion

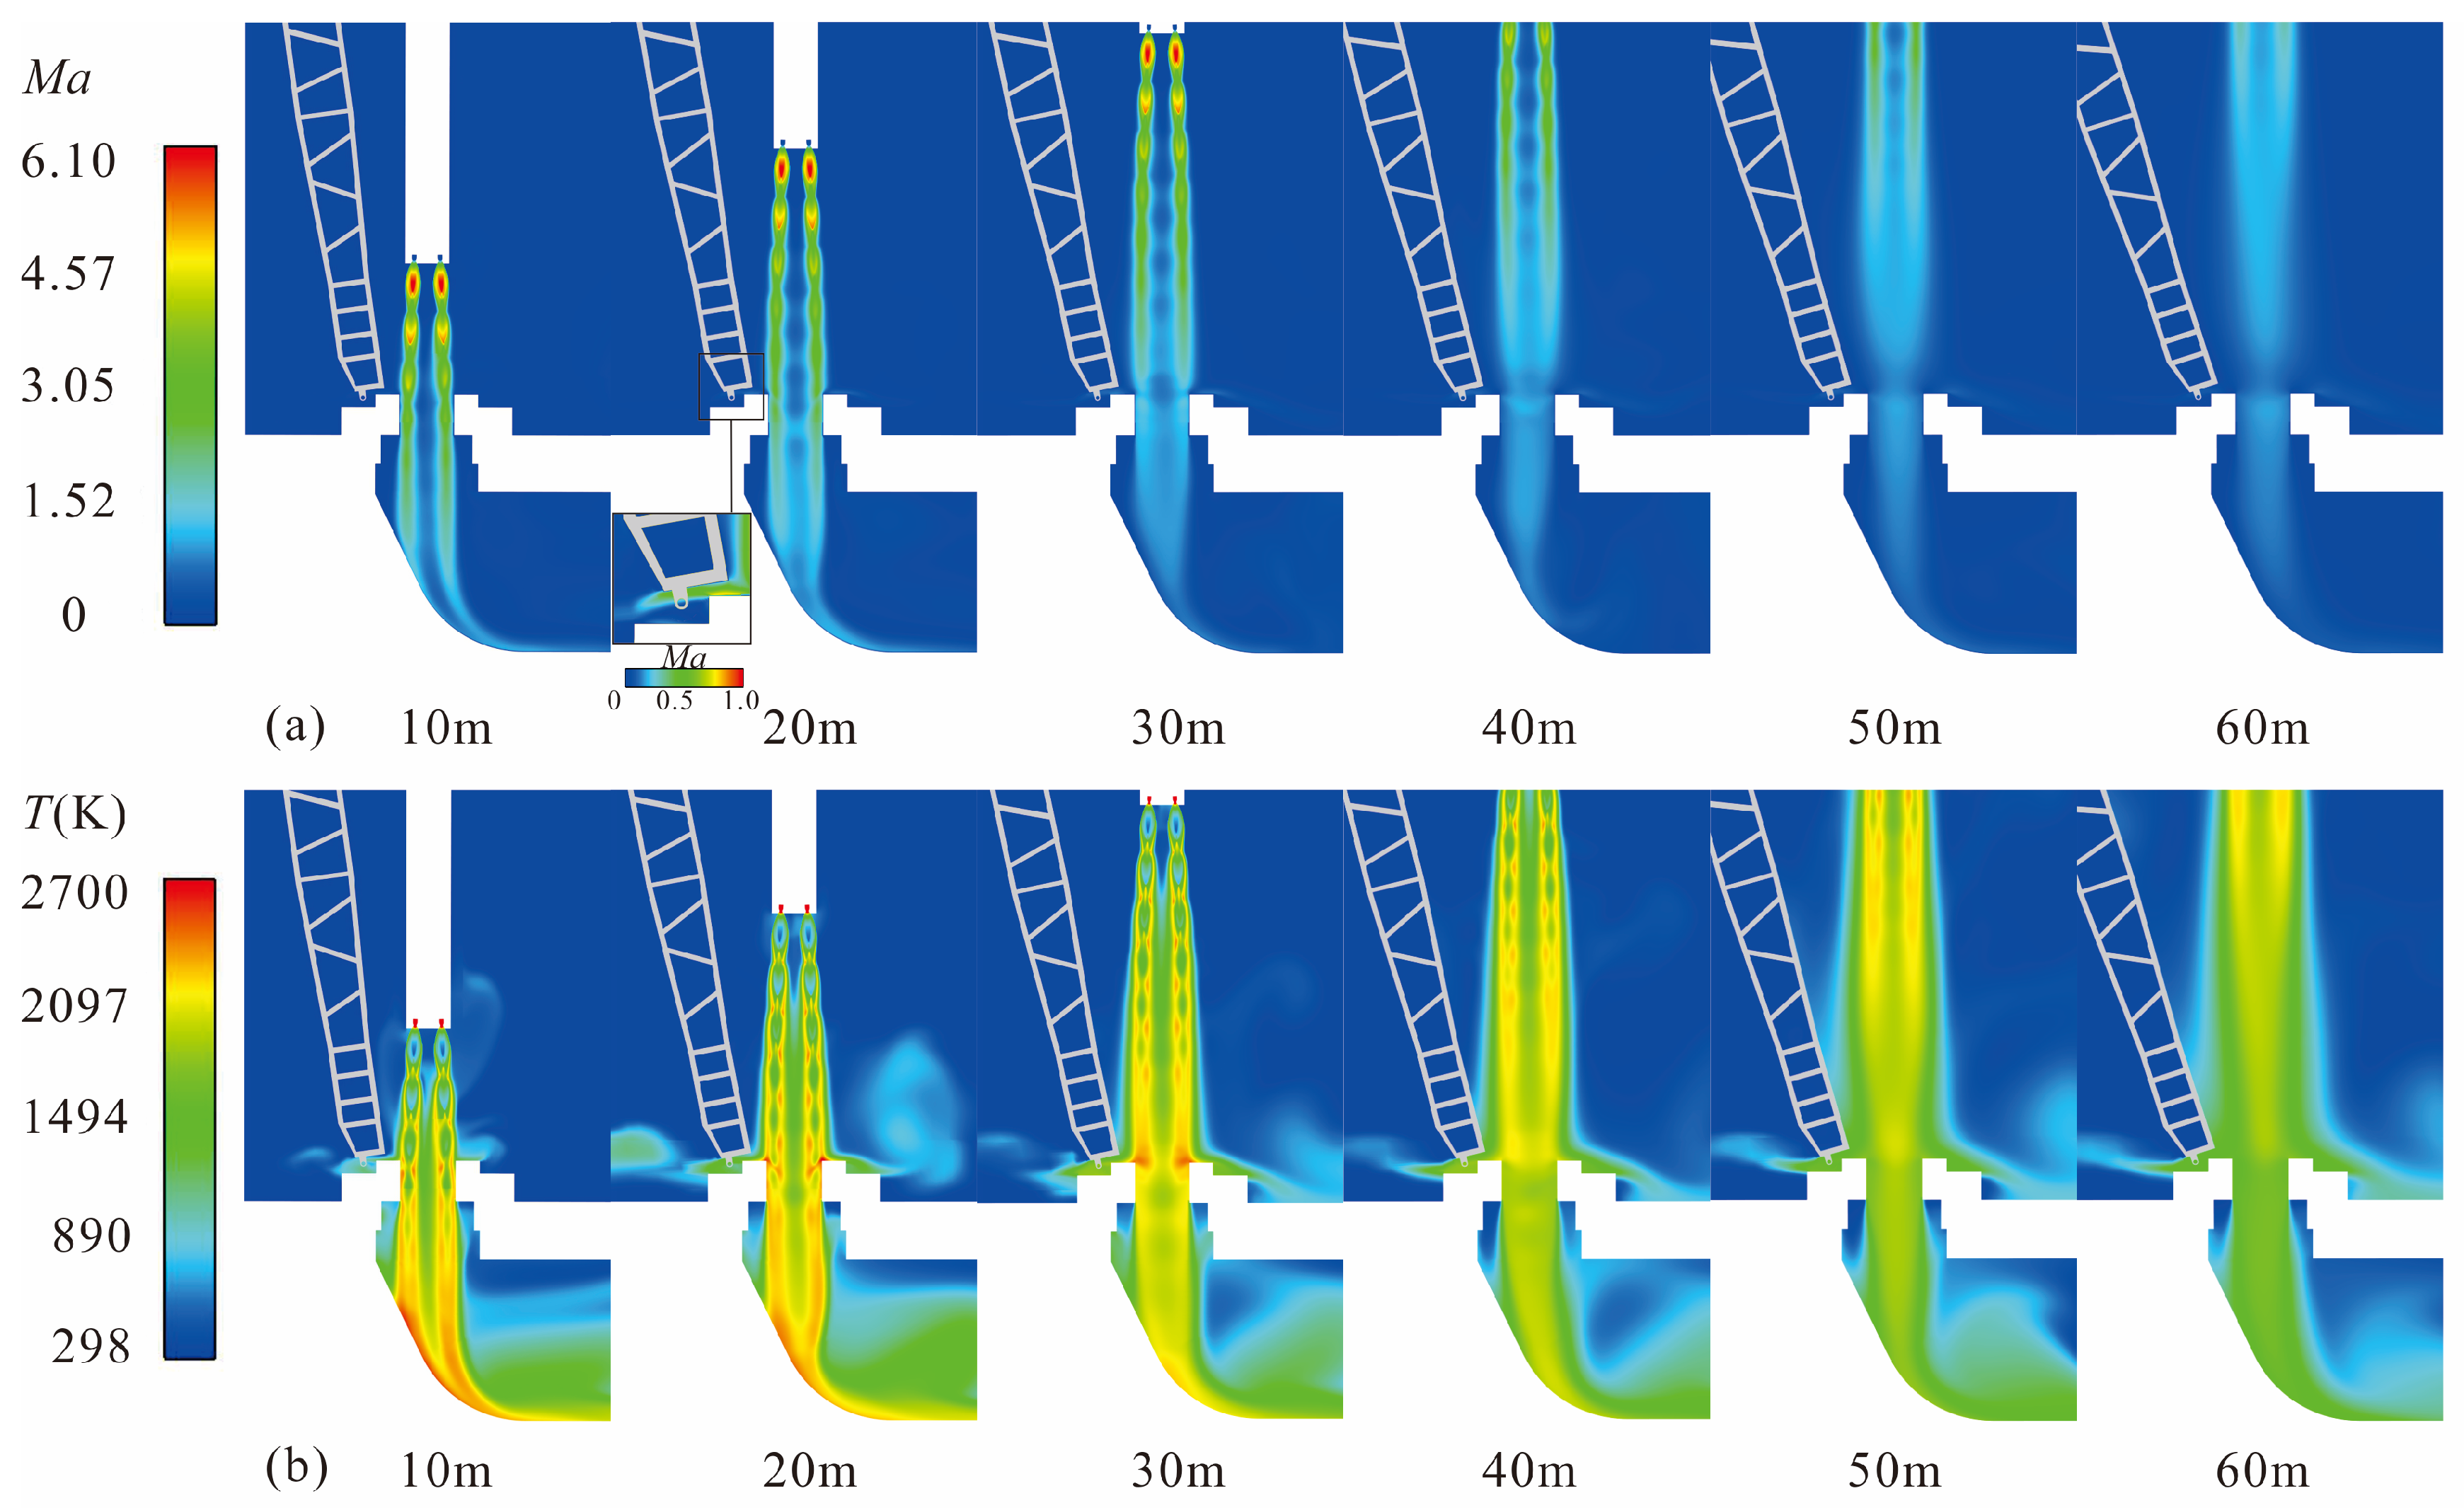
In order to accurately understand the pressure and thermal loads on the multifunctional vertical arm, the flow field results of six rocket flight altitudes (H) under working condition 2 were first extracted and analyzed. The Mach number is an important dimensionless quantity that can reflect the flow state of the wake of rocket engines. The contour Mach number cloud maps and temperature cloud maps of the rocket at various flight altitudes under working condition 2 are shown in Figure 5a,b, it visually represents the area where the rocket engines wake interacts with the multifunctional vertical arm.
The high-temperature and high-speed gas flow is discharged from the Laval nozzles, forming more than four clear Mach disks. Some of them flow into the deflection trough, while a small amount of gas flow hits the launch pad and stagnates, splashing back into the surrounding area including the bottom of the vertical arm. The interaction position between the wake of the rocket engine and the vertical arm changes with the increase of the rocket’s flight altitude. When H = 10 m, the Mach number cloud maps show that the engine wake is fully injected into the guide groove below the rocket, so there is almost no contact with the vertical arm. The temperature cloud maps also show that there is a certain gap between the high-temperature gas flow and the surface of the vertical arm, but it may cause an increase in temperature at the rotary shaft of the vertical arm.
When the launch vehicle rises to H = 20 m, the peripheral part of the rocket engines jet first strikes the surface of the launch pad and stops, and then splashes back to the bottom of the vertical arm under the action of the launch pad. The local enlarged cloud map of isosurface Mach number with H = 20 m shows that at this time, the front of the vertical arm (the side facing the rocket) has not been affected by the obvious engine jet, and the thermal environment at the bottom of the vertical arm is worse than that at the front of the vertical arm. This is consistent with the results of the temperature cloud map.
As the rocket rises further, when H = 30 m, in addition to splashing back to the bottom of the vertical arm through the launch pad surface, the rocket gas wake will directly impact the lower position of the front of the vertical arm (from the bottom of the vertical arm to the area with a height of 3D), resulting in the temperature rise of the two surfaces at the same time.
When the rocket flies at H = 40 m altitude, it can be seen that the influence range of the rocket gas wake on the front of the vertical arm will further increase. At this time, the area from the bottom of the front of the vertical arm to the height of 6D will be directly impacted by the gas wake. The Mach number cloud map shows that from this flight altitude, the core area of the rocket gas wake with high temperature and high speed will gradually be away from the launch platform and vertical arm.
When H = 50 m, the Mach number cloud map shows that the tail of the gas flow starts to separate from the vertical arm, but the temperature nephogram shows that the range of the front of the vertical arm impacted by the gas flow is still increasing, which will exceed 7.28D of the lower height of the vertical arm.
When the rocket moves further to H = 60 m, the Mach cloud map shows that the core area of the gas flow is completely separated from the launch platform and the vertical arm, and the temperature cloud map also shows that the range of the vertical arm directly impacted by the gas flow is slightly reduced. It can be concluded that when the flight altitude of the rocket is greater than H > 60 m, the pressure and heat effect of the rocket gas wake impacting the vertical arm will be further weakened; the calculation and analysis after H > 60 m will not be carried out in this paper. To sum up, during the whole launch process of the rocket, the flight altitude of the rocket with severe impact of the gas wake on the vertical arm is between H = 20 m and H = 50 m, which may vary slightly according to the rotation angle of the vertical arm.
According to the previous analysis, the thermal environment of the bottom part of the vertical arm, which is not directly impacted by the gas flow, may be worse than that of the front of the vertical arm. Therefore, the temperature distribution cloud maps of the bottom part of the vertical arm are extracted for further analysis.
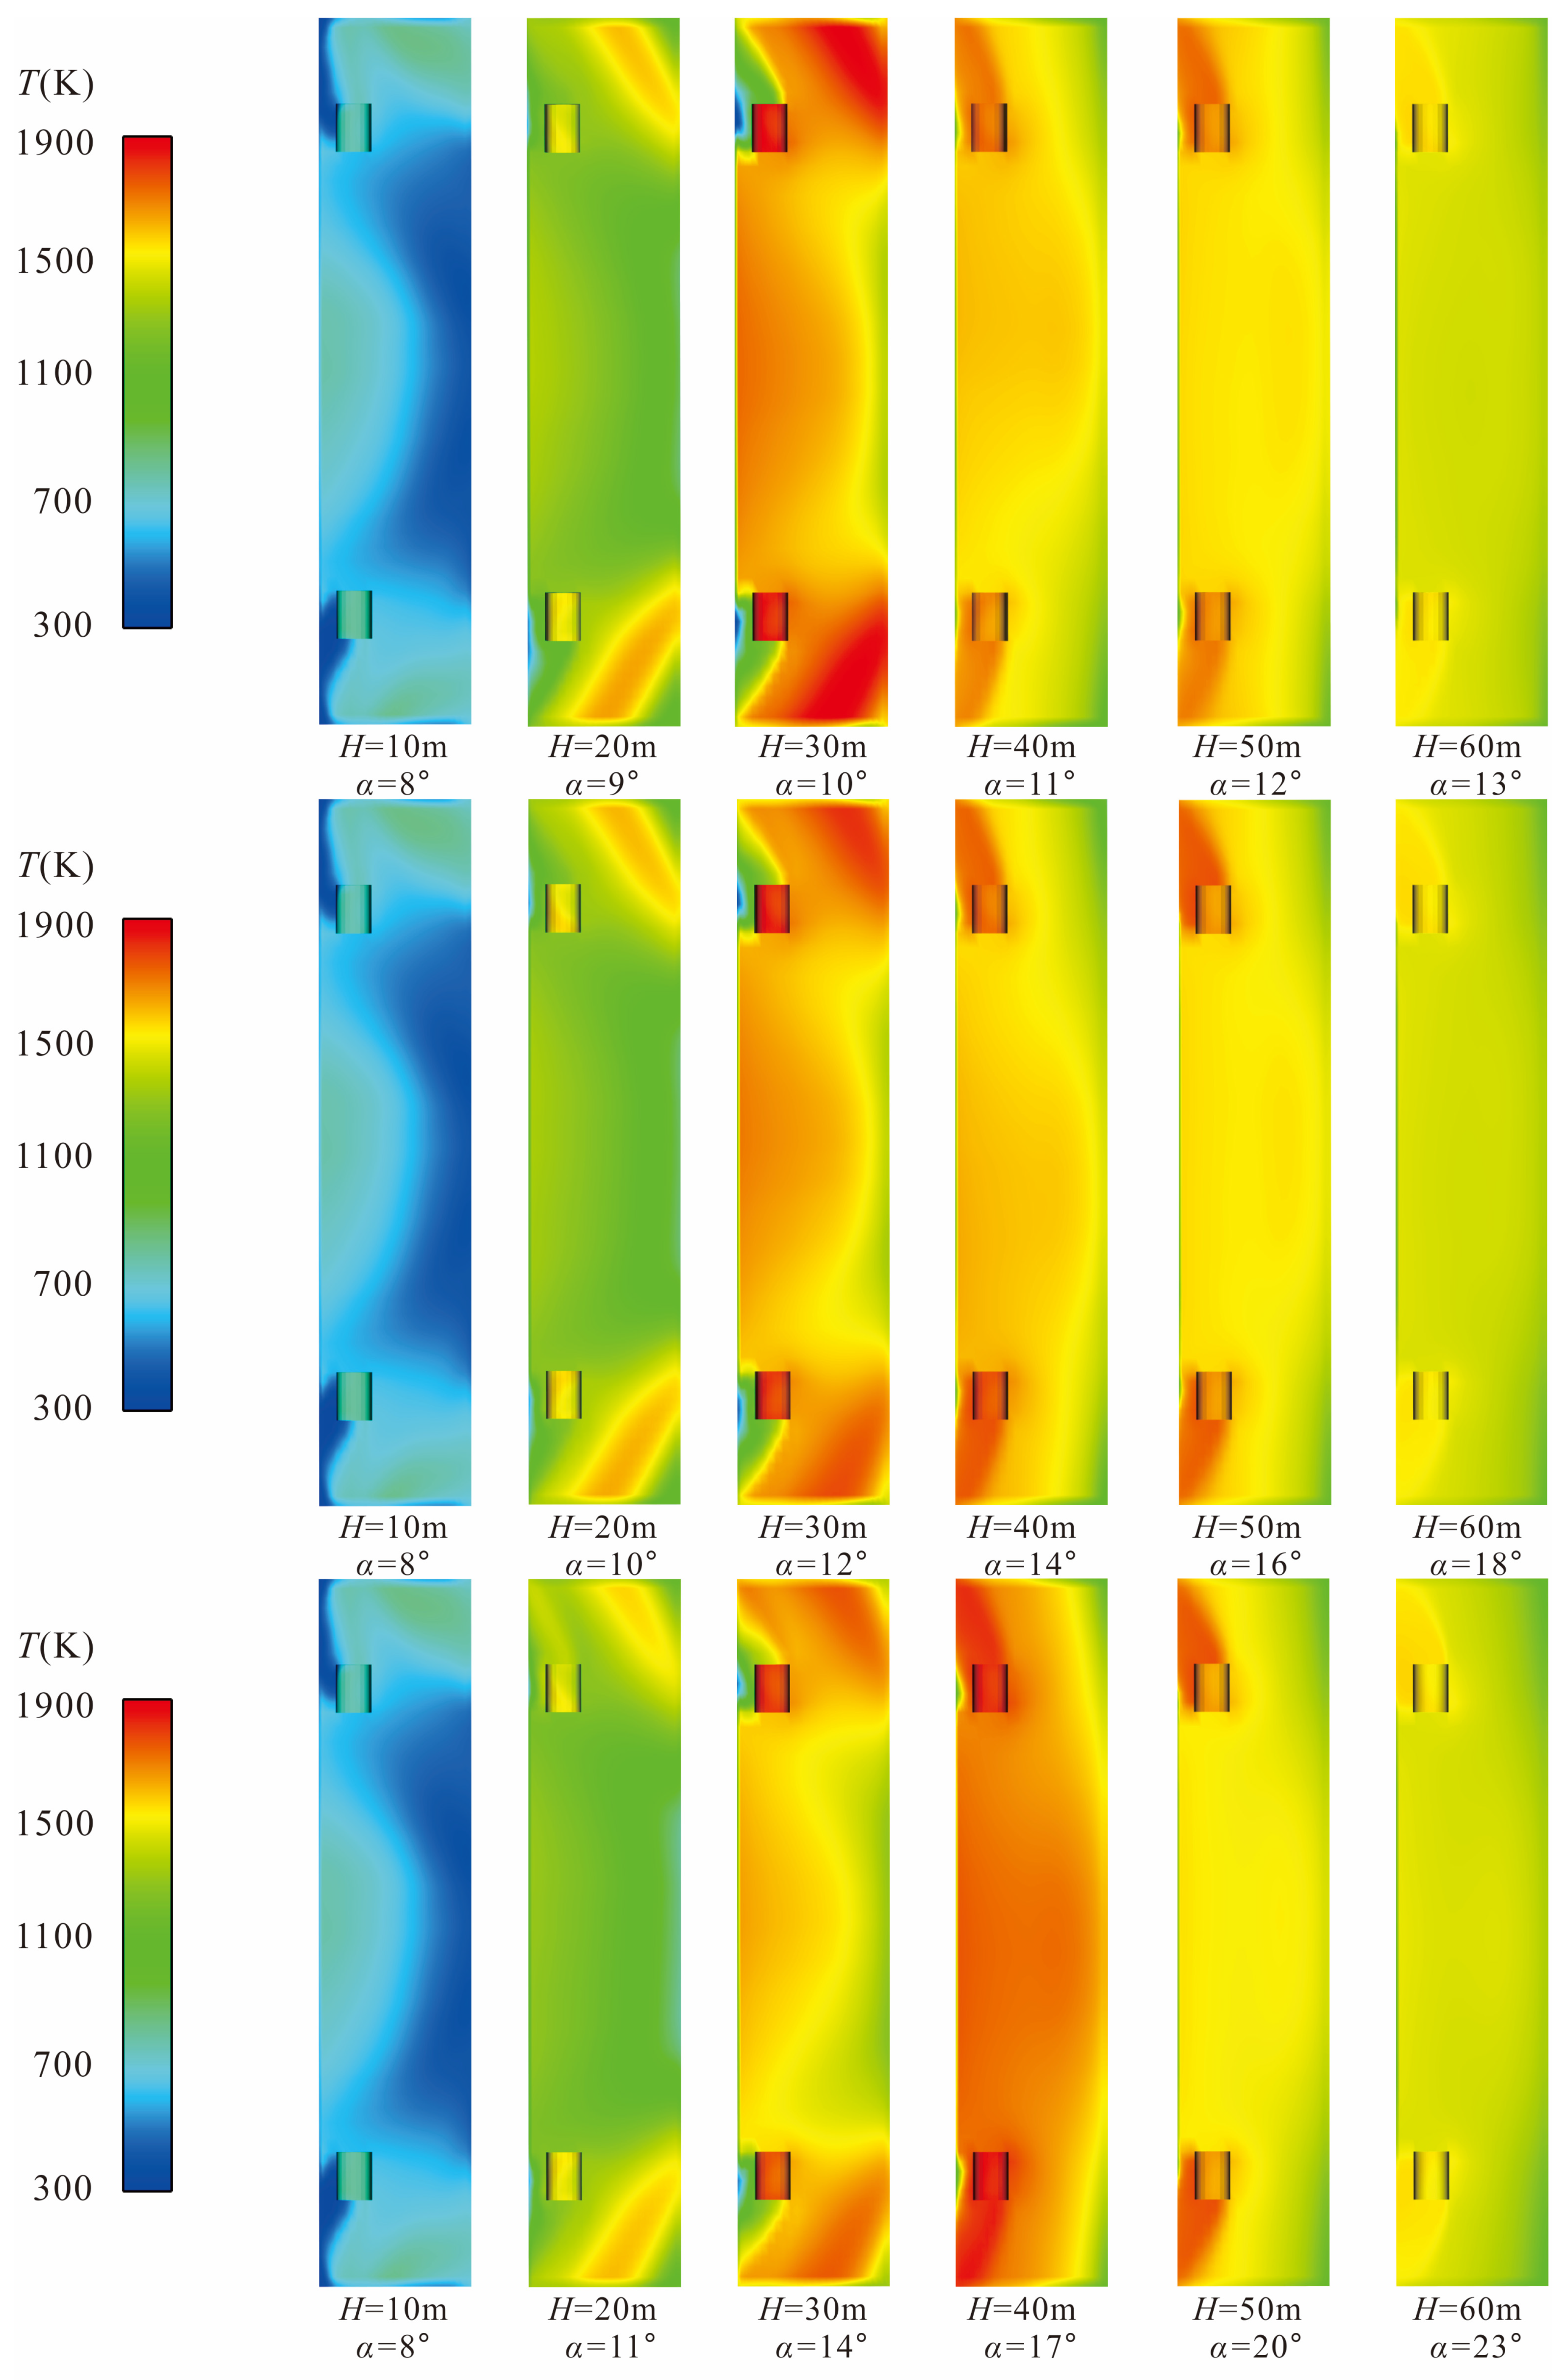
Figure 6 is a comparison diagram of the temperature distribution cloud map at the bottom of the vertical arm under all working conditions. It can be seen that when H = 10 m, the temperature at the bottom of the vertical arm is much lower than that at other flight altitudes, and the area in the bottom −Y direction (right side in the figure) is not in contact with the splashed gas flow, so the temperature in this area is basically maintained at 300 K–400 K. The area in the +Y direction begins to contact with the splashed gas flow, so the temperature rises to 700 K. The temperature of the nearby area and the rotary shaft body rises to 800 K. The maximum temperature of 845 K appears at the rotary shaft. When H = 20 m, most areas at the bottom of the vertical arm rise to 1000 K, and there are two higher temperature areas at both ends of the X direction (the upper and lower ends in the figure), with a maximum value of 1590 K to 1630 K (if α is different, the maximum value is slightly different). The reason for the temperature distribution on the bottom surface showing a lower center and higher ends is the geometric structure of the area. Figure 7 shows the streamtraces near the bottom of the vertical arm when H = 20 m, α = 10°. Figure 7a shows the position of the clip plane. In Figure 7b, due to the absence of obstruction from the rotary shaft, the gas passes through this area unobstructed. But in Figure 7c, when the gas passes near the rotary shaft, it is blocked by the rotary shaft and forms a backflow gathering area in the front, further exacerbating the thermal load in this area. When H = 30 m, the temperature at the bottom of the vertical arm continues to rise above 1500 K, and when α = 10°, the maximum value of 1895 K under all working conditions occurs. When the rocket rises further to H = 40 m, most of the area at the bottom of the vertical arm rises further to 1700 K. Compared with the previous several flight altitudes, the temperature rise area at both ends of the X direction moves in the +Y direction (the left side in the figure, that is, the side away from the rocket). At this time, the gas flow fully contacts the bottom of the vertical arm. Due to the blocking of the rotary shaft, the gas flow, at the rotary shaft and its rear side, slows down and heats up. At this flight altitude, the larger angle of the vertical arm will lead to a higher bottom temperature. When the core area of the gas flow is out of contact with the launch pad and the vertical arm, i.e., H = 50 m, it can be seen that the temperature distribution at the bottom of the vertical arm is significantly lower than that at the altitude of H = 40 m. At this time, the temperature in most areas at the bottom of the vertical arm drops to 1500 K, but the temperature rise area caused by the gas flow blocked by the rotary shaft can still reach 1700 K. When the gas flow is further away at H = 60 m, it can be seen that the temperature in most areas at the bottom of the vertical arm further decreases to 1300 K, and the shape distribution is the same as that of H = 50 m.
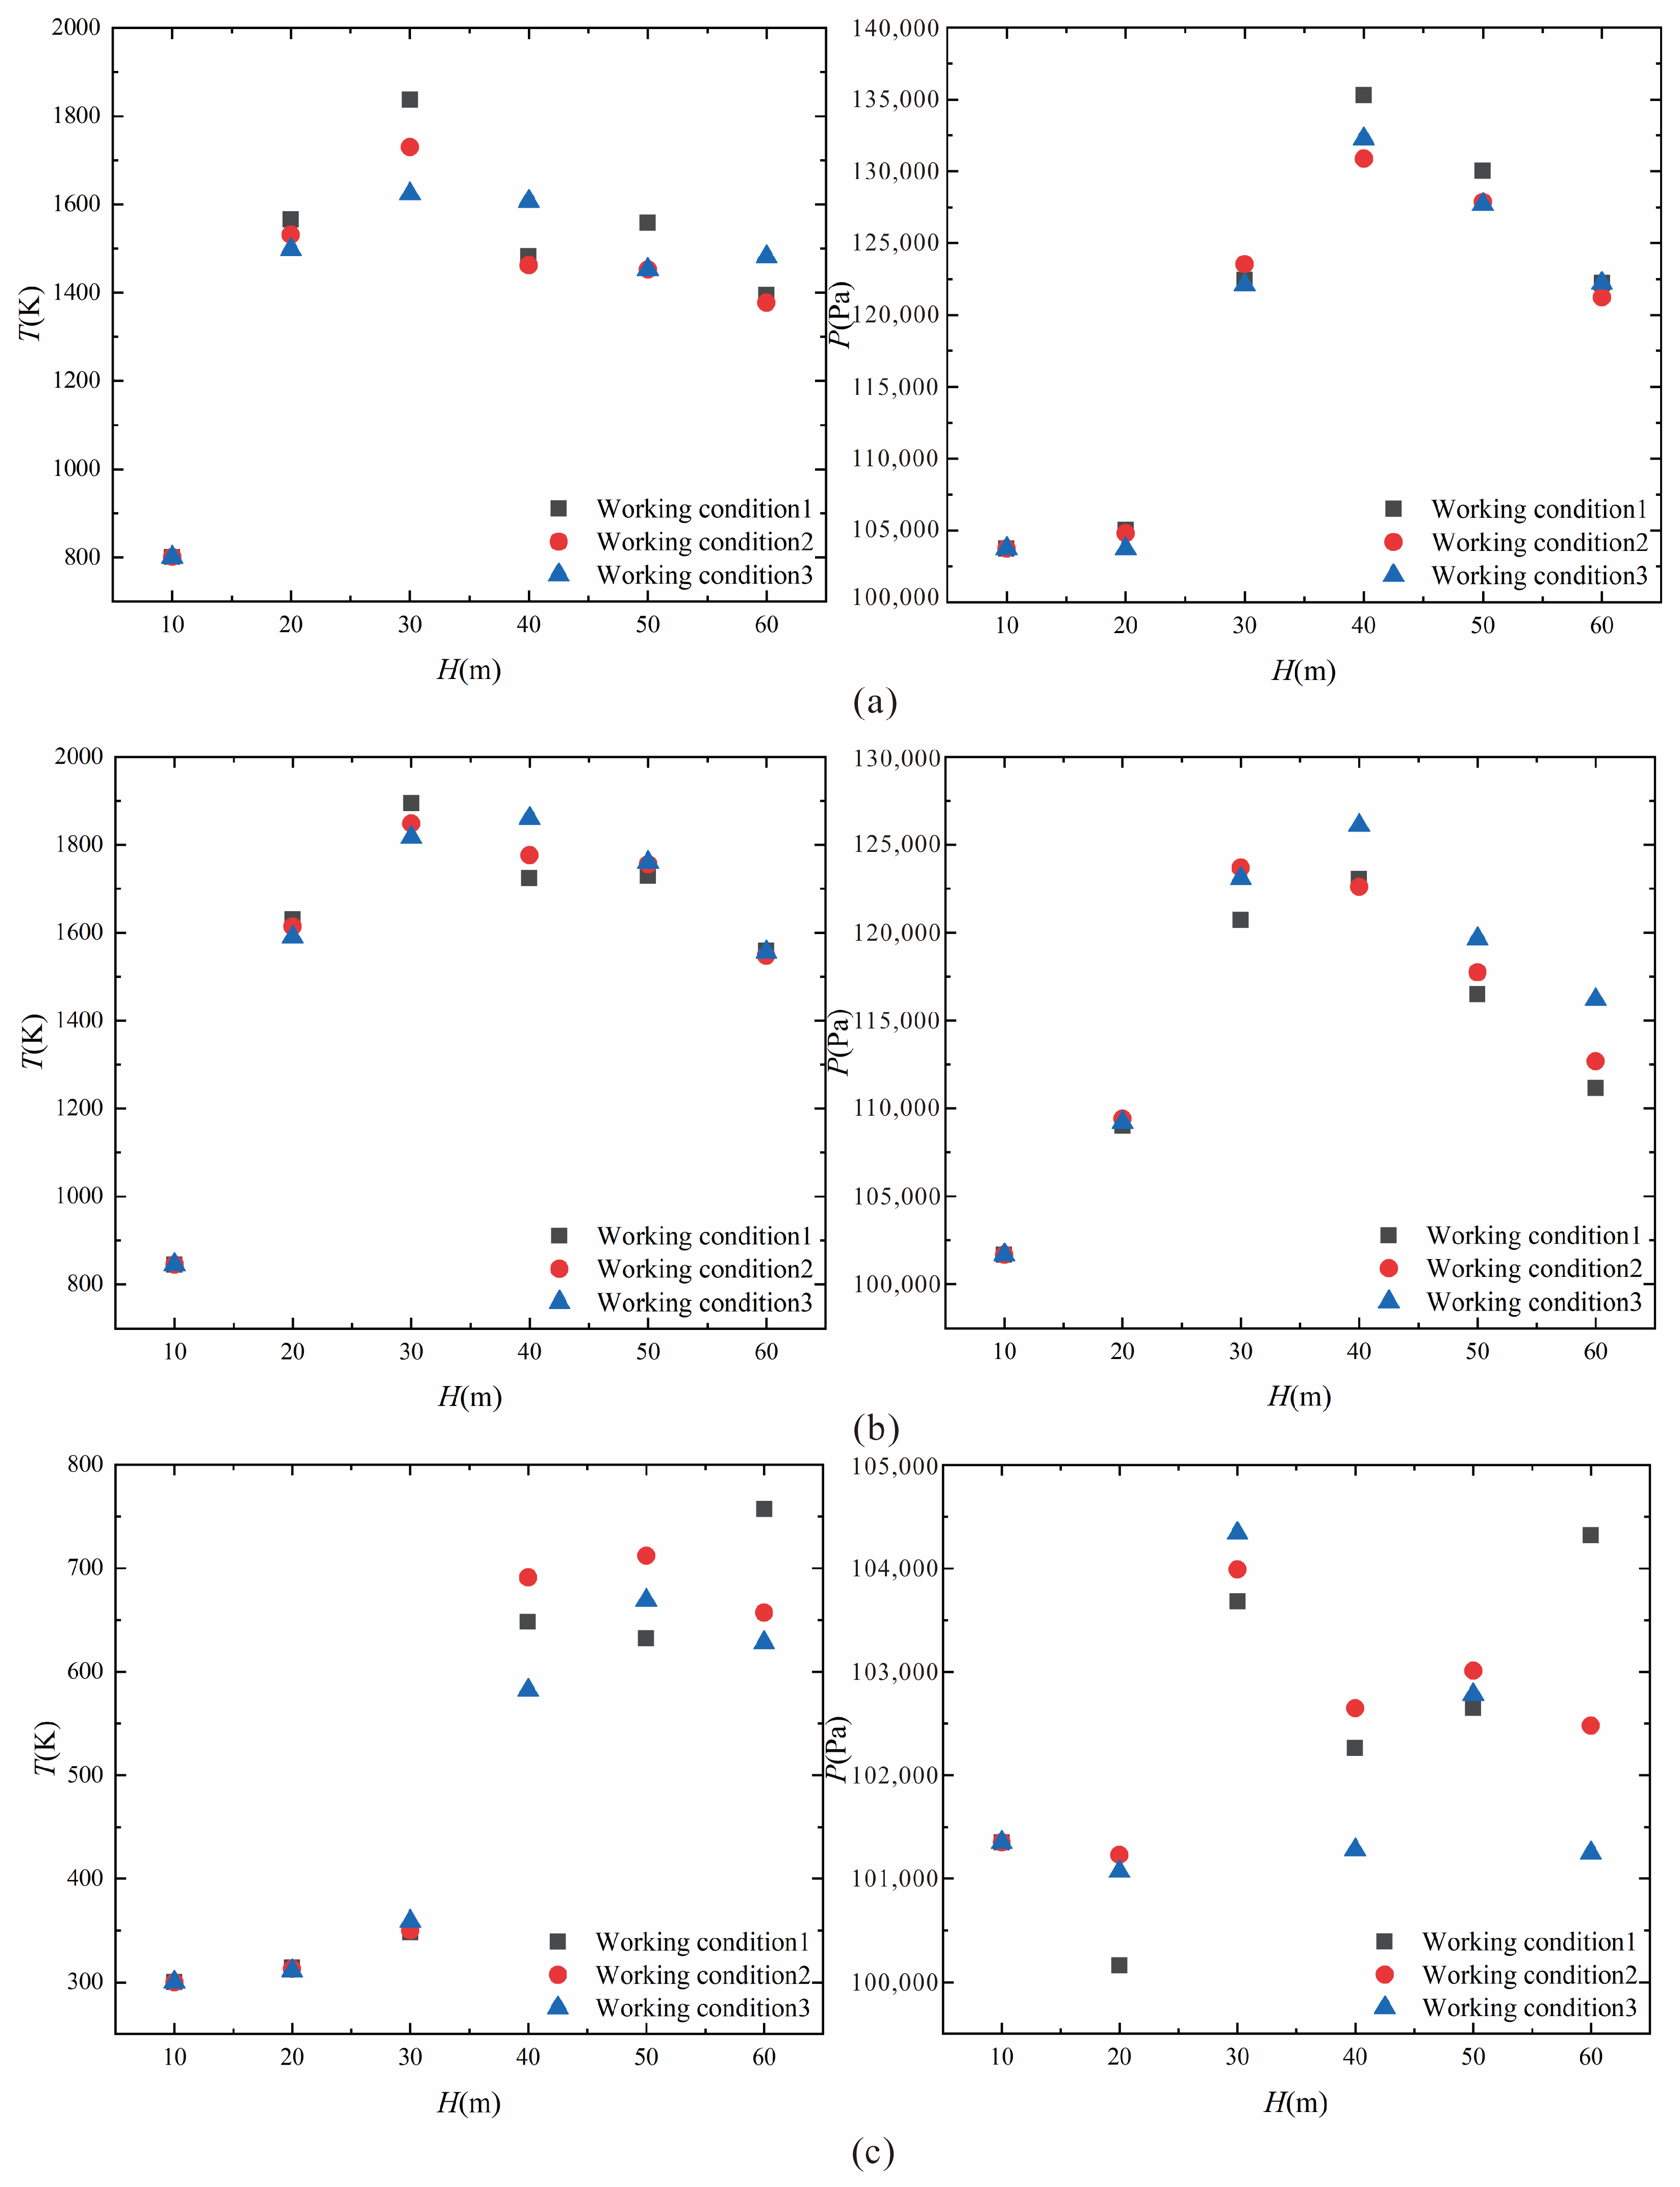
In the analysis of the temperature distribution at the bottom of the vertical arm, there is a phenomenon worthy of attention. When H ≤ 30 m, the smaller α will lead to an increase of the maximum bottom temperature, while when H ≥ 40 m, the smaller α will lead to a decrease of the maximum bottom temperature, as shown in Figure 8a in the left figure. In Figure 5b it is found that when H ≤ 30 m, the gas flow stagnates on the surface around the guide hole of the launch pad, forming a region with a sharp rise in temperature (the red part of the cloud map), so the larger α will give these gases with temperature rise due to stagnation more space to contact with the air and then cool down. When H ≥ 40 m, as the gas flow gradually moves away from the launch pad, there is no such area with such a sharp rise in temperature in this region, and the full expansion of the gas flow here leads to a larger influence range of the gas flow. At this time, the larger α will cause the bottom to be more easily scoured by the gas flow, so this phenomenon occurs.
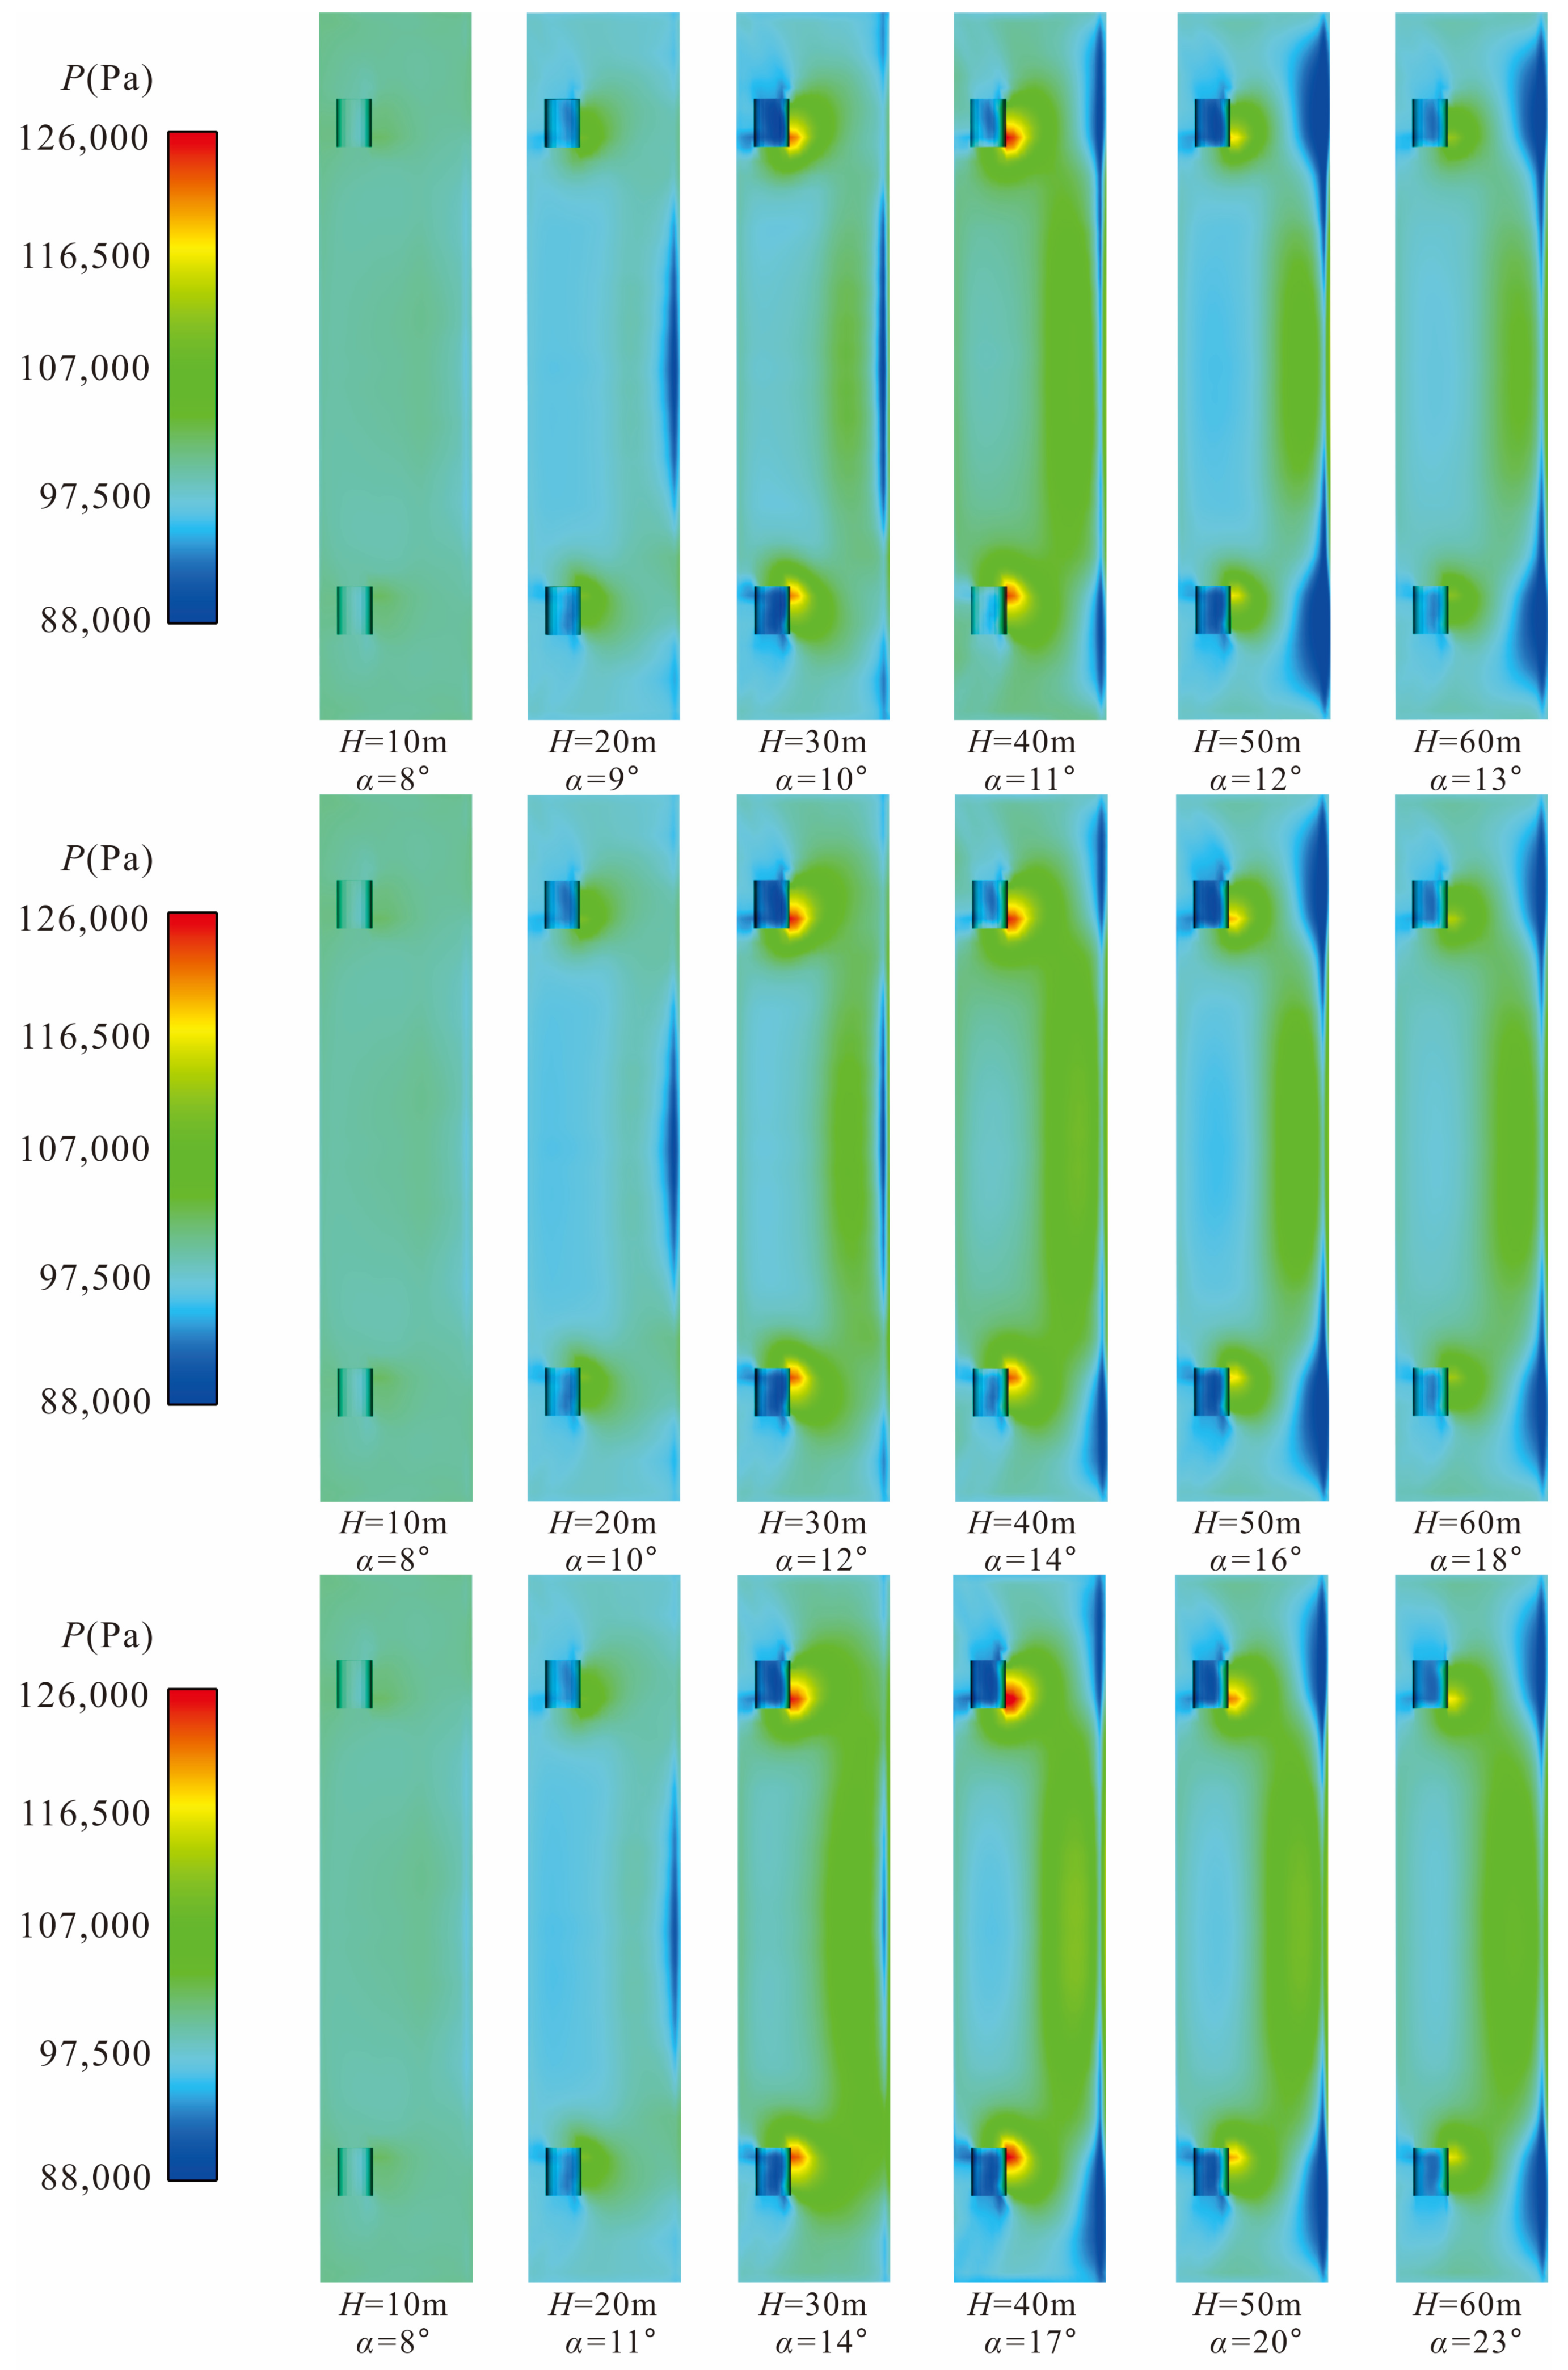
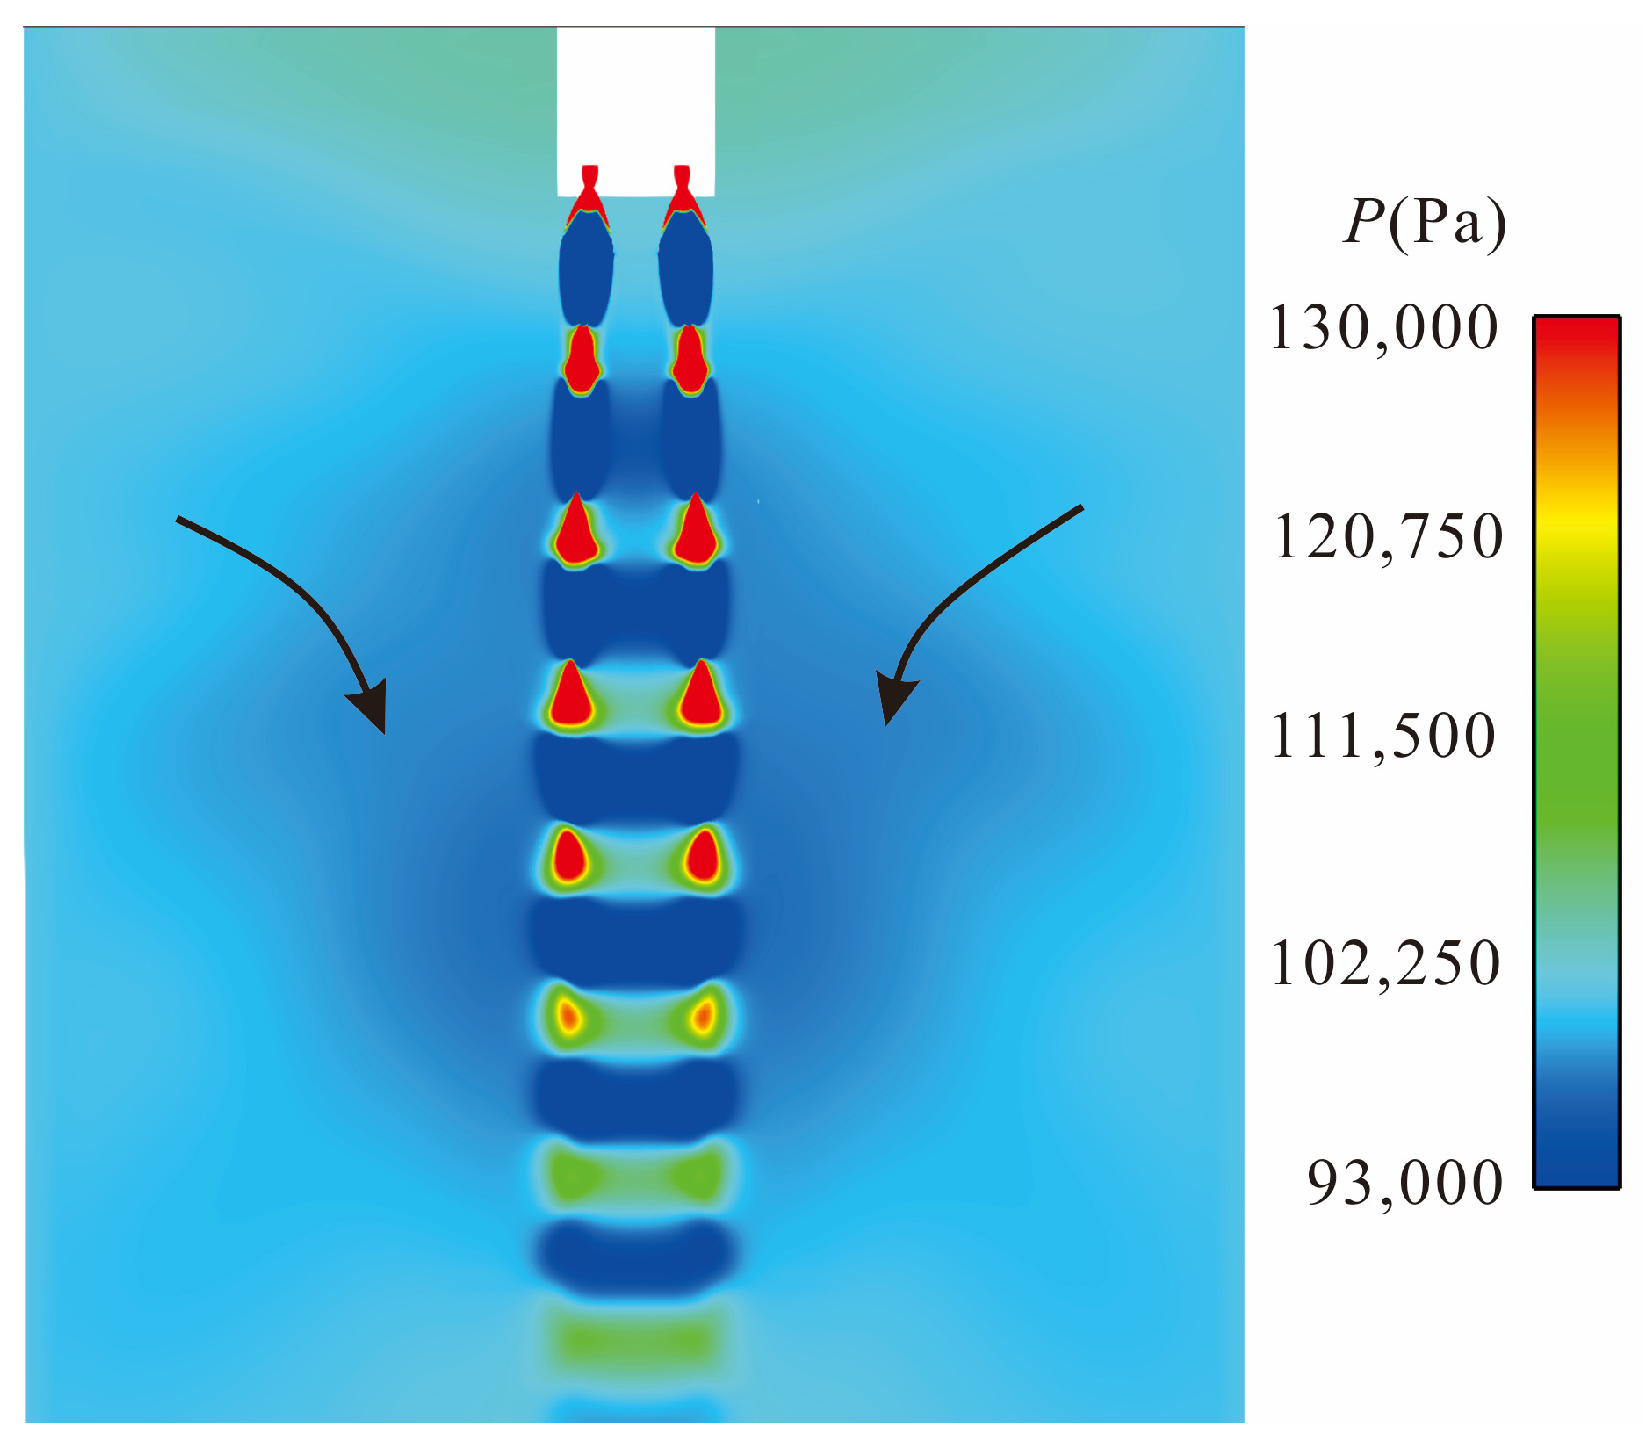
Accordingly, the bottom temperature distribution cloud image can be extracted. Figure 9 shows the pressure distribution at the bottom of the vertical arm under all working conditions. Different from the temperature distribution, the pressure at the bottom of the vertical arm has almost no change when H = 10 m. When H = 20 m, it can be seen that the pressure at the rotary shaft is slightly higher than that at other parts, while the pressure at other parts (the cloud map turns blue) is slightly lower than the atmospheric pressure of 101,325 Pa due to the gas flow ejection effect. Figure 10 shows a sketch explaining the ejection effect. A fast gas flow rate can cause a decrease in the nearby pressure. The pressure in the figure is the absolute pressure. Figure 10 shows a blue area with a pressure below 101,325 Pa around the core region of the rocket engine jet. Therefore, air from further away will be drawn into this area and move along the black arrow in the figure with the rocket engine gas flow. This effect only occurs near the first to fifth Mach disks in the core region of the jet, so the flight altitude at which this effect can have an impact is limited. When the flight altitude is too low, the negative pressure caused by this effect is not significant. When the flight altitude is high enough, this effect will also weaken, and H = 20 m is the most obvious moment of this effect. When the rocket rises to H = 30 m, the pressure peak appears at the side of the rotary shaft facing the rocket, and when α = 14°, the pressure reaches the maximum value of 123,680 Pa at this flight altitude. When the rocket flies further to H = 40 m, the range of pressure rise here will be further enlarged. When α = 17°, the maximum pressure at the bottom of the vertical arm under all working conditions is 126,100 Pa. From then, as the gas flow gradually separates from the launch pad and the vertical arm, when H = 50 m and H = 60 m, the maximum pressure at the bottom of the vertical arm will gradually reduce to 119,650 Pa and 116,200 Pa (obtained at the corresponding maximum α at their respective flight altitude), and the range of pressure rise area will also decrease.
The right figure in Figure 8b shows the scatter plot of the maximum pressure on the front of the vertical arm. The comparison under different angles shows that the smaller α corresponds to a smaller pressure peak area, and this law does not change in the rocket flight altitudes covered by the calculation conditions of H = 20 m to H = 60 m.
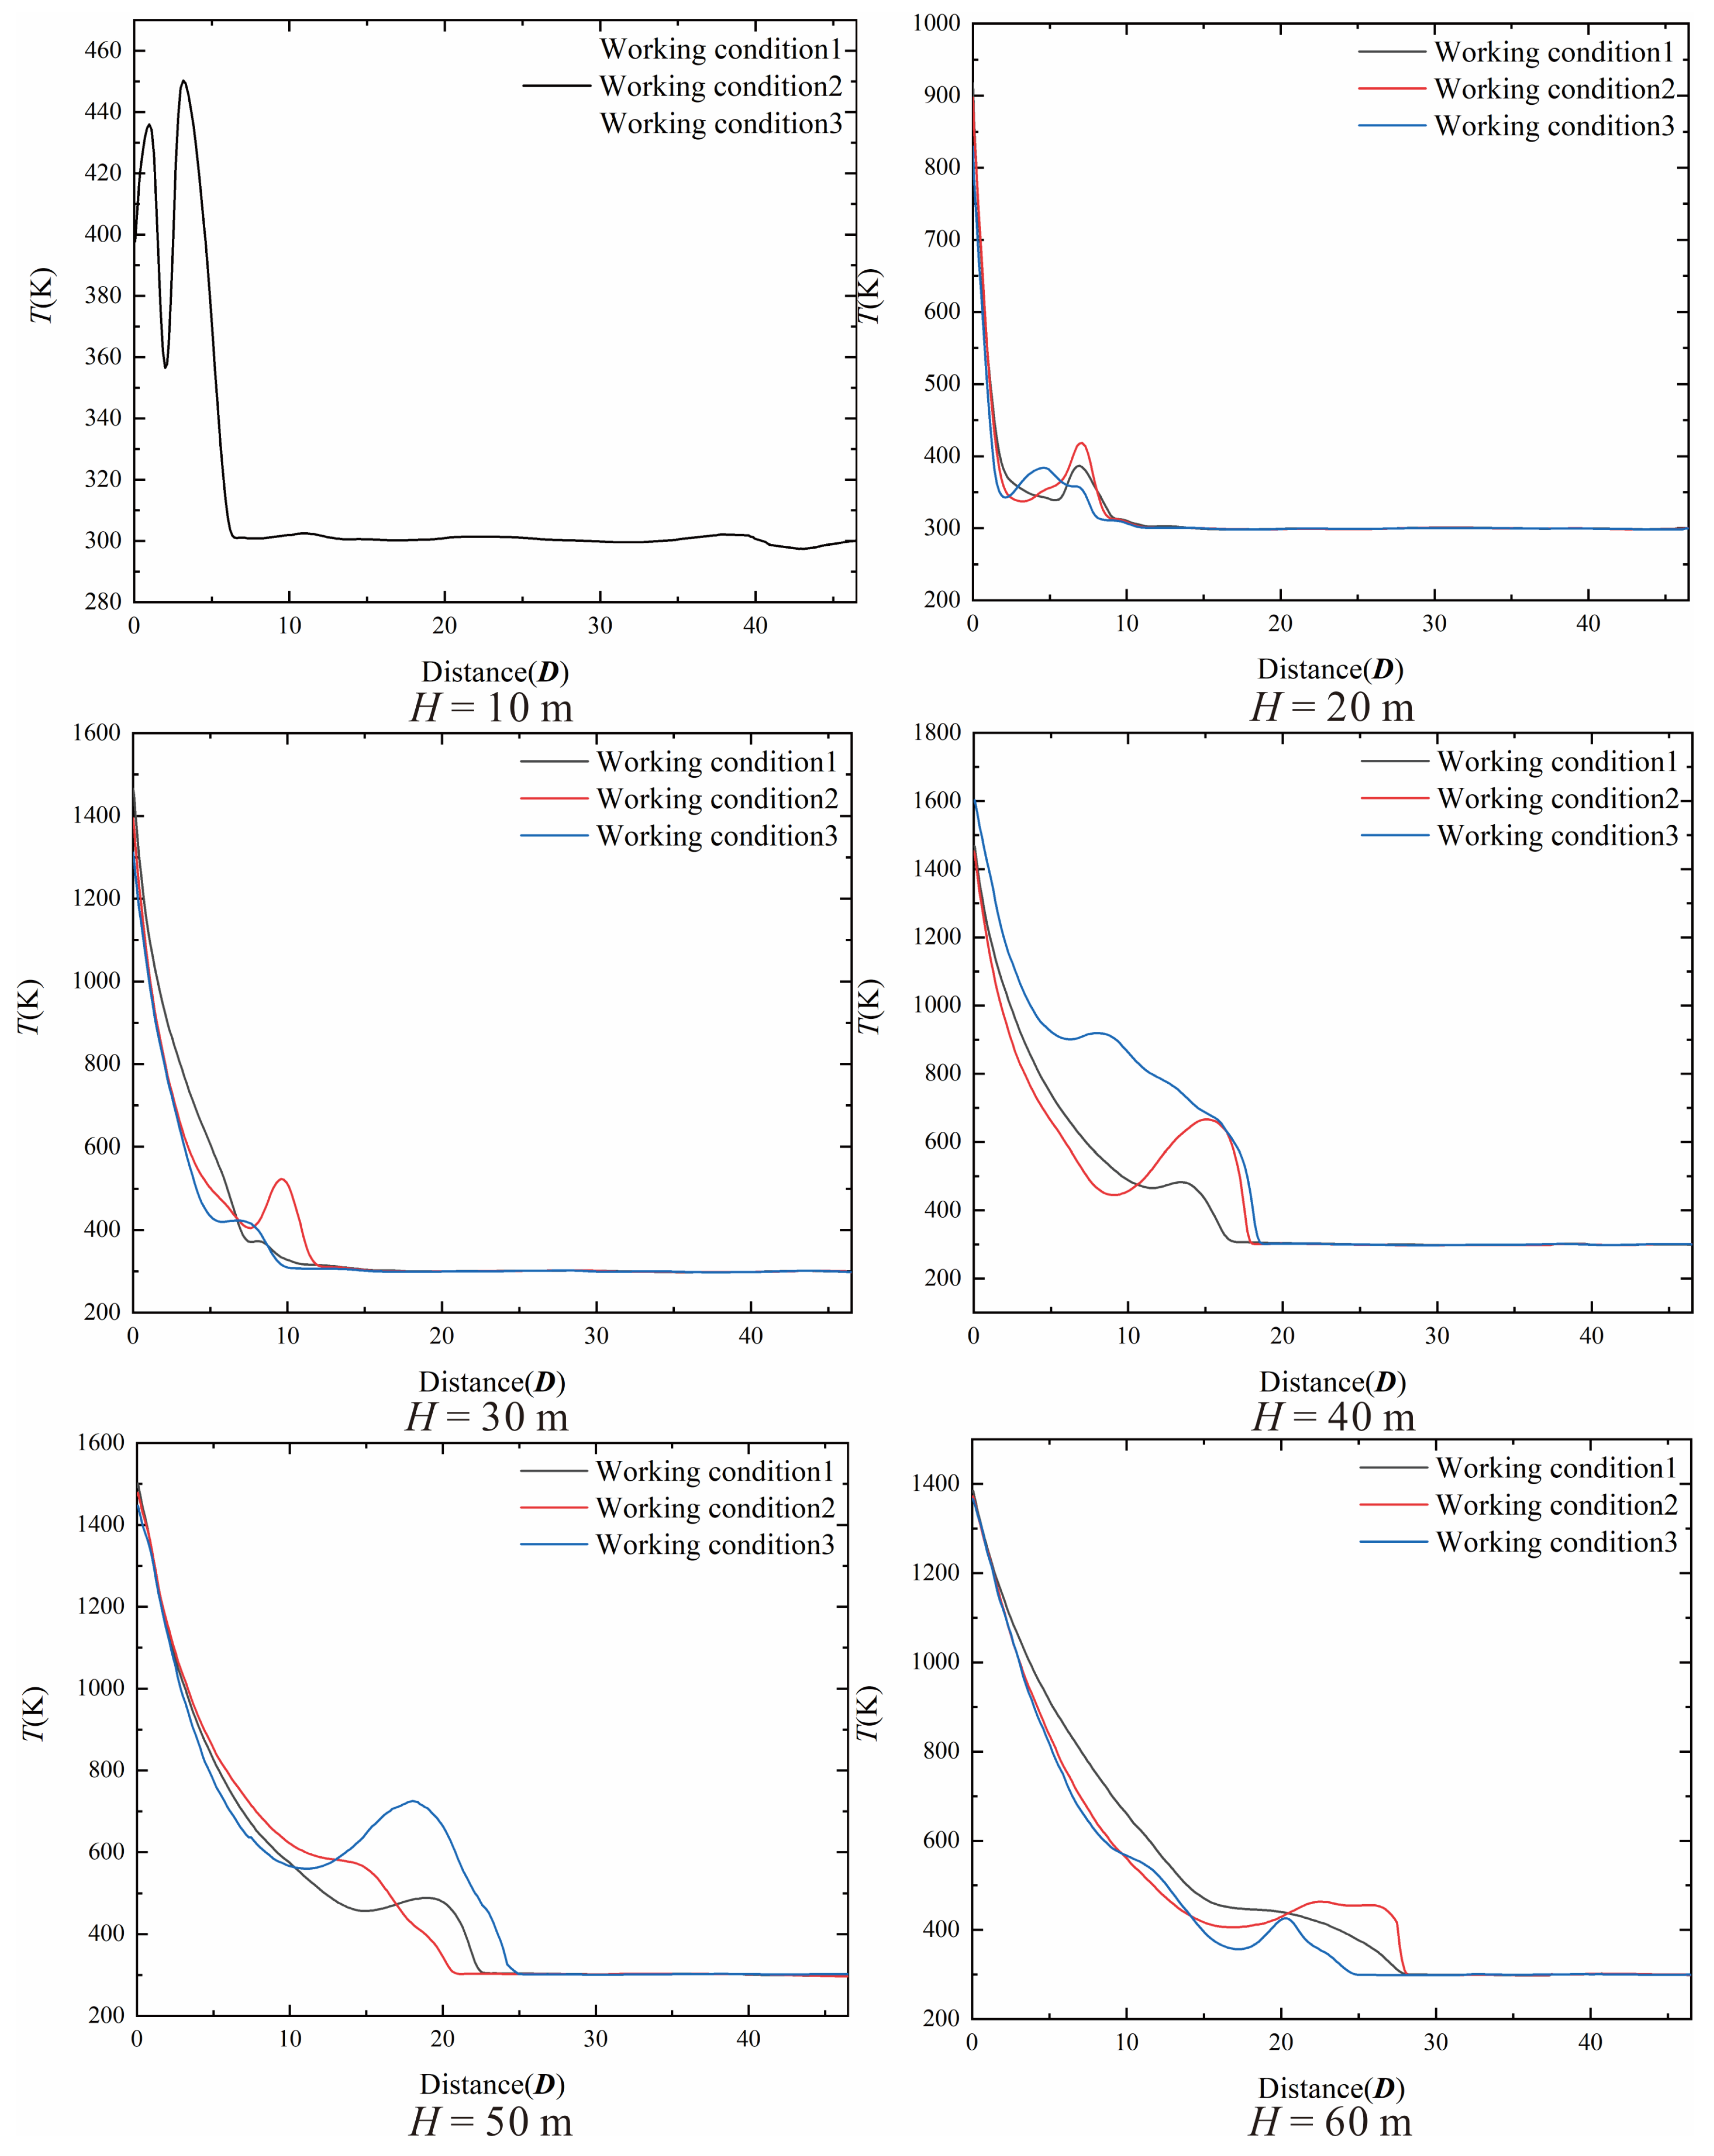
Another key part of the vertical arm affected by the gas flow is the area facing the launch vehicle, which will be directly impacted by the gas flow. Figure 11 shows the temperature distribution at the front of the vertical arm under all working conditions. Figure 12 shows the temperature distribution curve of the centerline of the vertical arm. On the whole, the maximum temperature at the front of the vertical arm, corresponding to different rocket flight altitudes, appears in the bottom area. When H = 10 m, there is a small temperature rise of less than 700 K in the extremely small area on both sides of the front bottom of the vertical arm. The temperature at the centerline of the vertical arm is actually lower than that on both sides, maintaining a temperature of 350 K to 450 K within the range where the height of the vertical arm is less than 5.19D. When the rocket rises to H = 20 m, the temperature in the middle area of the front bottom of the vertical arm also begins to rise, but the temperature on both sides is higher than that in the middle area. The temperature at the centerline of the vertical arm gradually decreases from 917 K at the bottom and drops to 300 K after 8.94D. When the rocket continues to move to H = 30 m, the temperature rise area begins to expand above the vertical arm, and the maximum temperature of 1890 K is located on both sides of the bottom of the front face of the vertical arm with α = 10°. The maximum temperature at the centerline of the vertical arm is 1466 K, which drops back to 300 K after 11.72D. When H = 40 m, the maximum temperature at the front of the vertical arm and the maximum area of the temperature rise range (the area with the temperature exceeding 300 K) occur in the state of α = 17°. At this angle, the temperature of the centerline of the vertical arm is generally higher than the other two angles of the vertical arm. At this time, the maximum temperature of 1607 K is located at the starting of the centerline of the vertical arm, and it drops back to 300 K after 18.67D. When H = 50 m, the influence range of gas flow is larger, but the core area starts to be far away from the vertical arm, so the maximum temperature at the front of the vertical arm decreases to 1501 K, but the height of the temperature rise part at α = 20° exceeds all other working conditions with the rocket flight altitude reaching 22.09D. The core area of the gas flow is completely separated from the launch pad and the vertical arm area. When H = 60 m, the maximum temperature at the front of the vertical arm is on the centerline, and the maximum temperature decreases to 1385 K before falling back to 300 K after 27.96D.
The left figure in Figure 8b shows the scatter plot of the maximum temperature at the front of the vertical arm. When H ≤ 30 m, the temperature distribution law is the same as that of Figure 6. When H = 40 m and H = 50 m, it is still the same in that the higher α is at the same flight altitude, the higher is the temperature at the bottom of the front face of the vertical arm, but the distribution law of temperature rise area changes slightly. With the increase of the rocket flight altitude, the gas flow will impact to a higher position of the vertical arm.
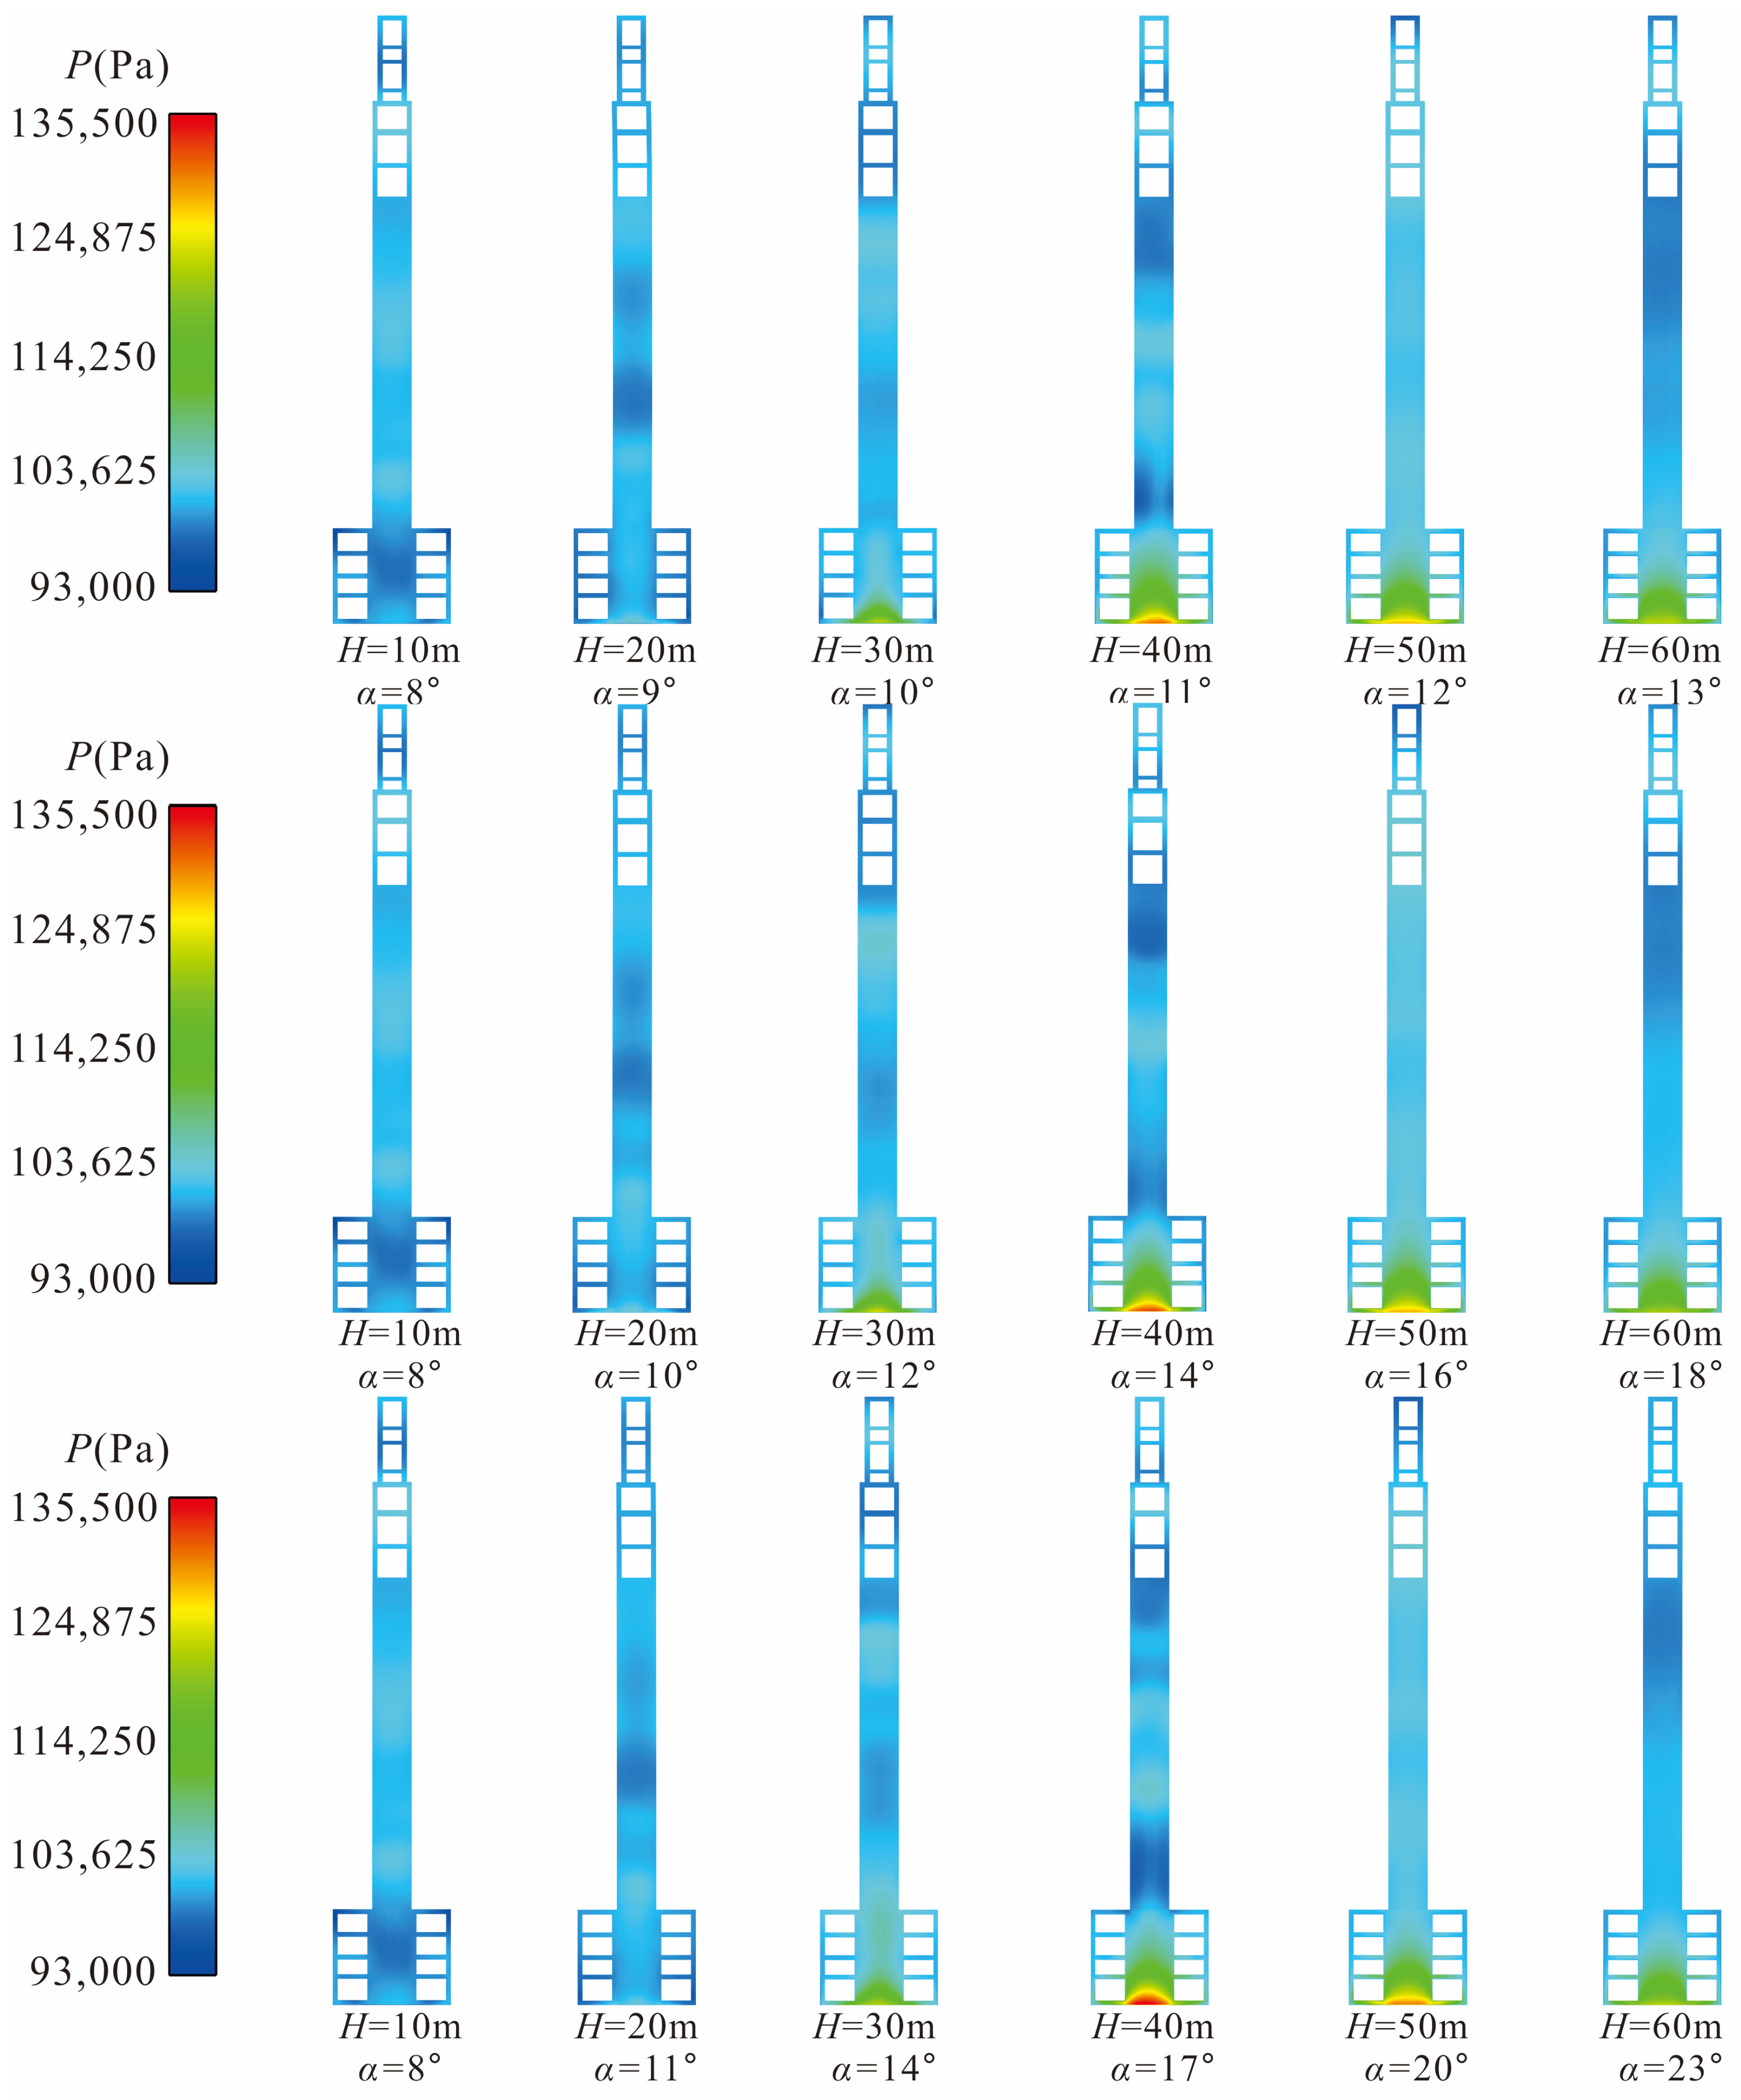
Figure 13 shows the pressure distribution on the front of the vertical arm. It can be seen that when H ≤ 20 m, there is no obvious pressure rise on the front of the whole vertical arm, because the pressure rise is mainly caused by the impact of high-speed gas, and the rocket flight altitude is low. At this time, the gas flow does not directly impact the area, but because of the ejection effect (Figure 9) of the rocket gas flow, there is a negative pressure area below 101,325 Pa at the lower frame of the vertical arm. When the rocket has flown to H = 30 m, the high-speed gas flow begins to spread to the bottom area of the front face of the vertical arm, causing a slight rise in the temperature in this area, The larger the α, the higher the maximum pressure, but at this rocket flight altitude, the difference of the maximum pressure caused by the change of α is not obvious. When the rocket moves further to H = 40 m, the vertical arm is most severely impacted by the rocket gas. When α = 17°, the maximum value of 135,270 Pa of the front face of the vertical arm appears in the whole process. At this flight altitude, the maximum difference of pressure caused by the change of α is also the largest. Then, when H = 50 m, the maximum pressure in the region decreases to 130,050 Pa as the core region of the gas flow moves away, and later when H = 60 m, the maximum pressure in the region further decreases to 122,210 Pa.
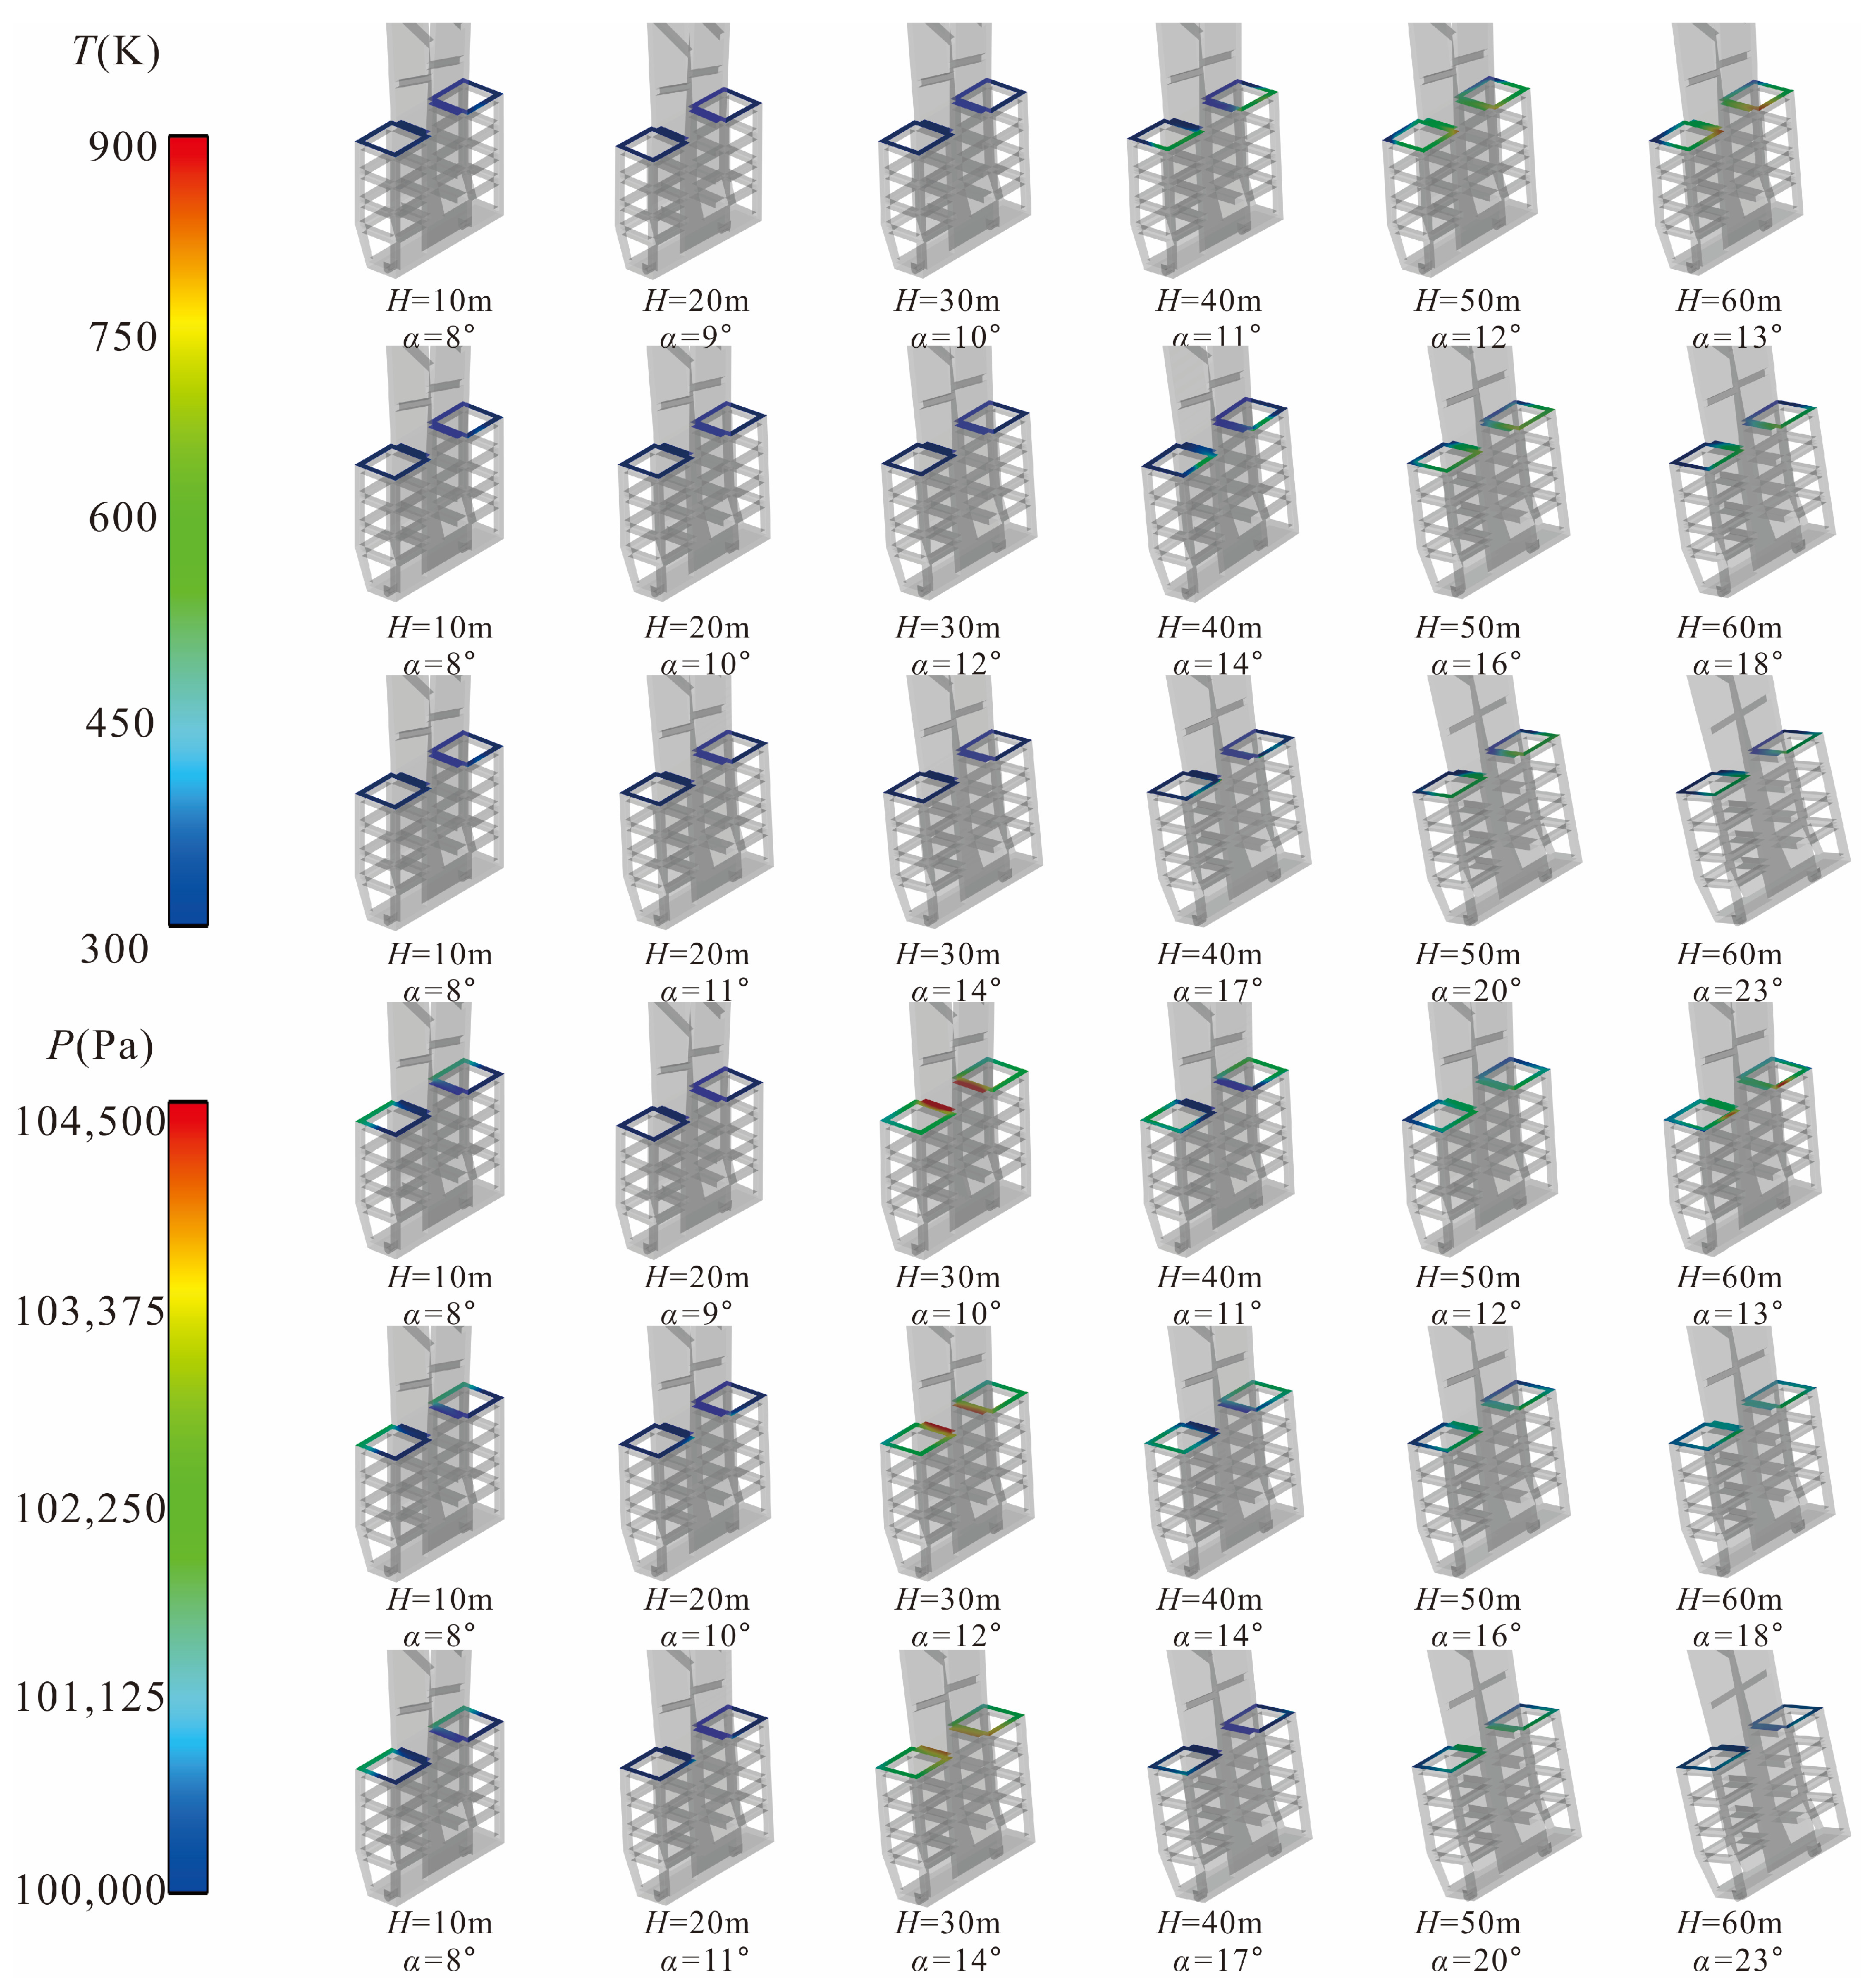
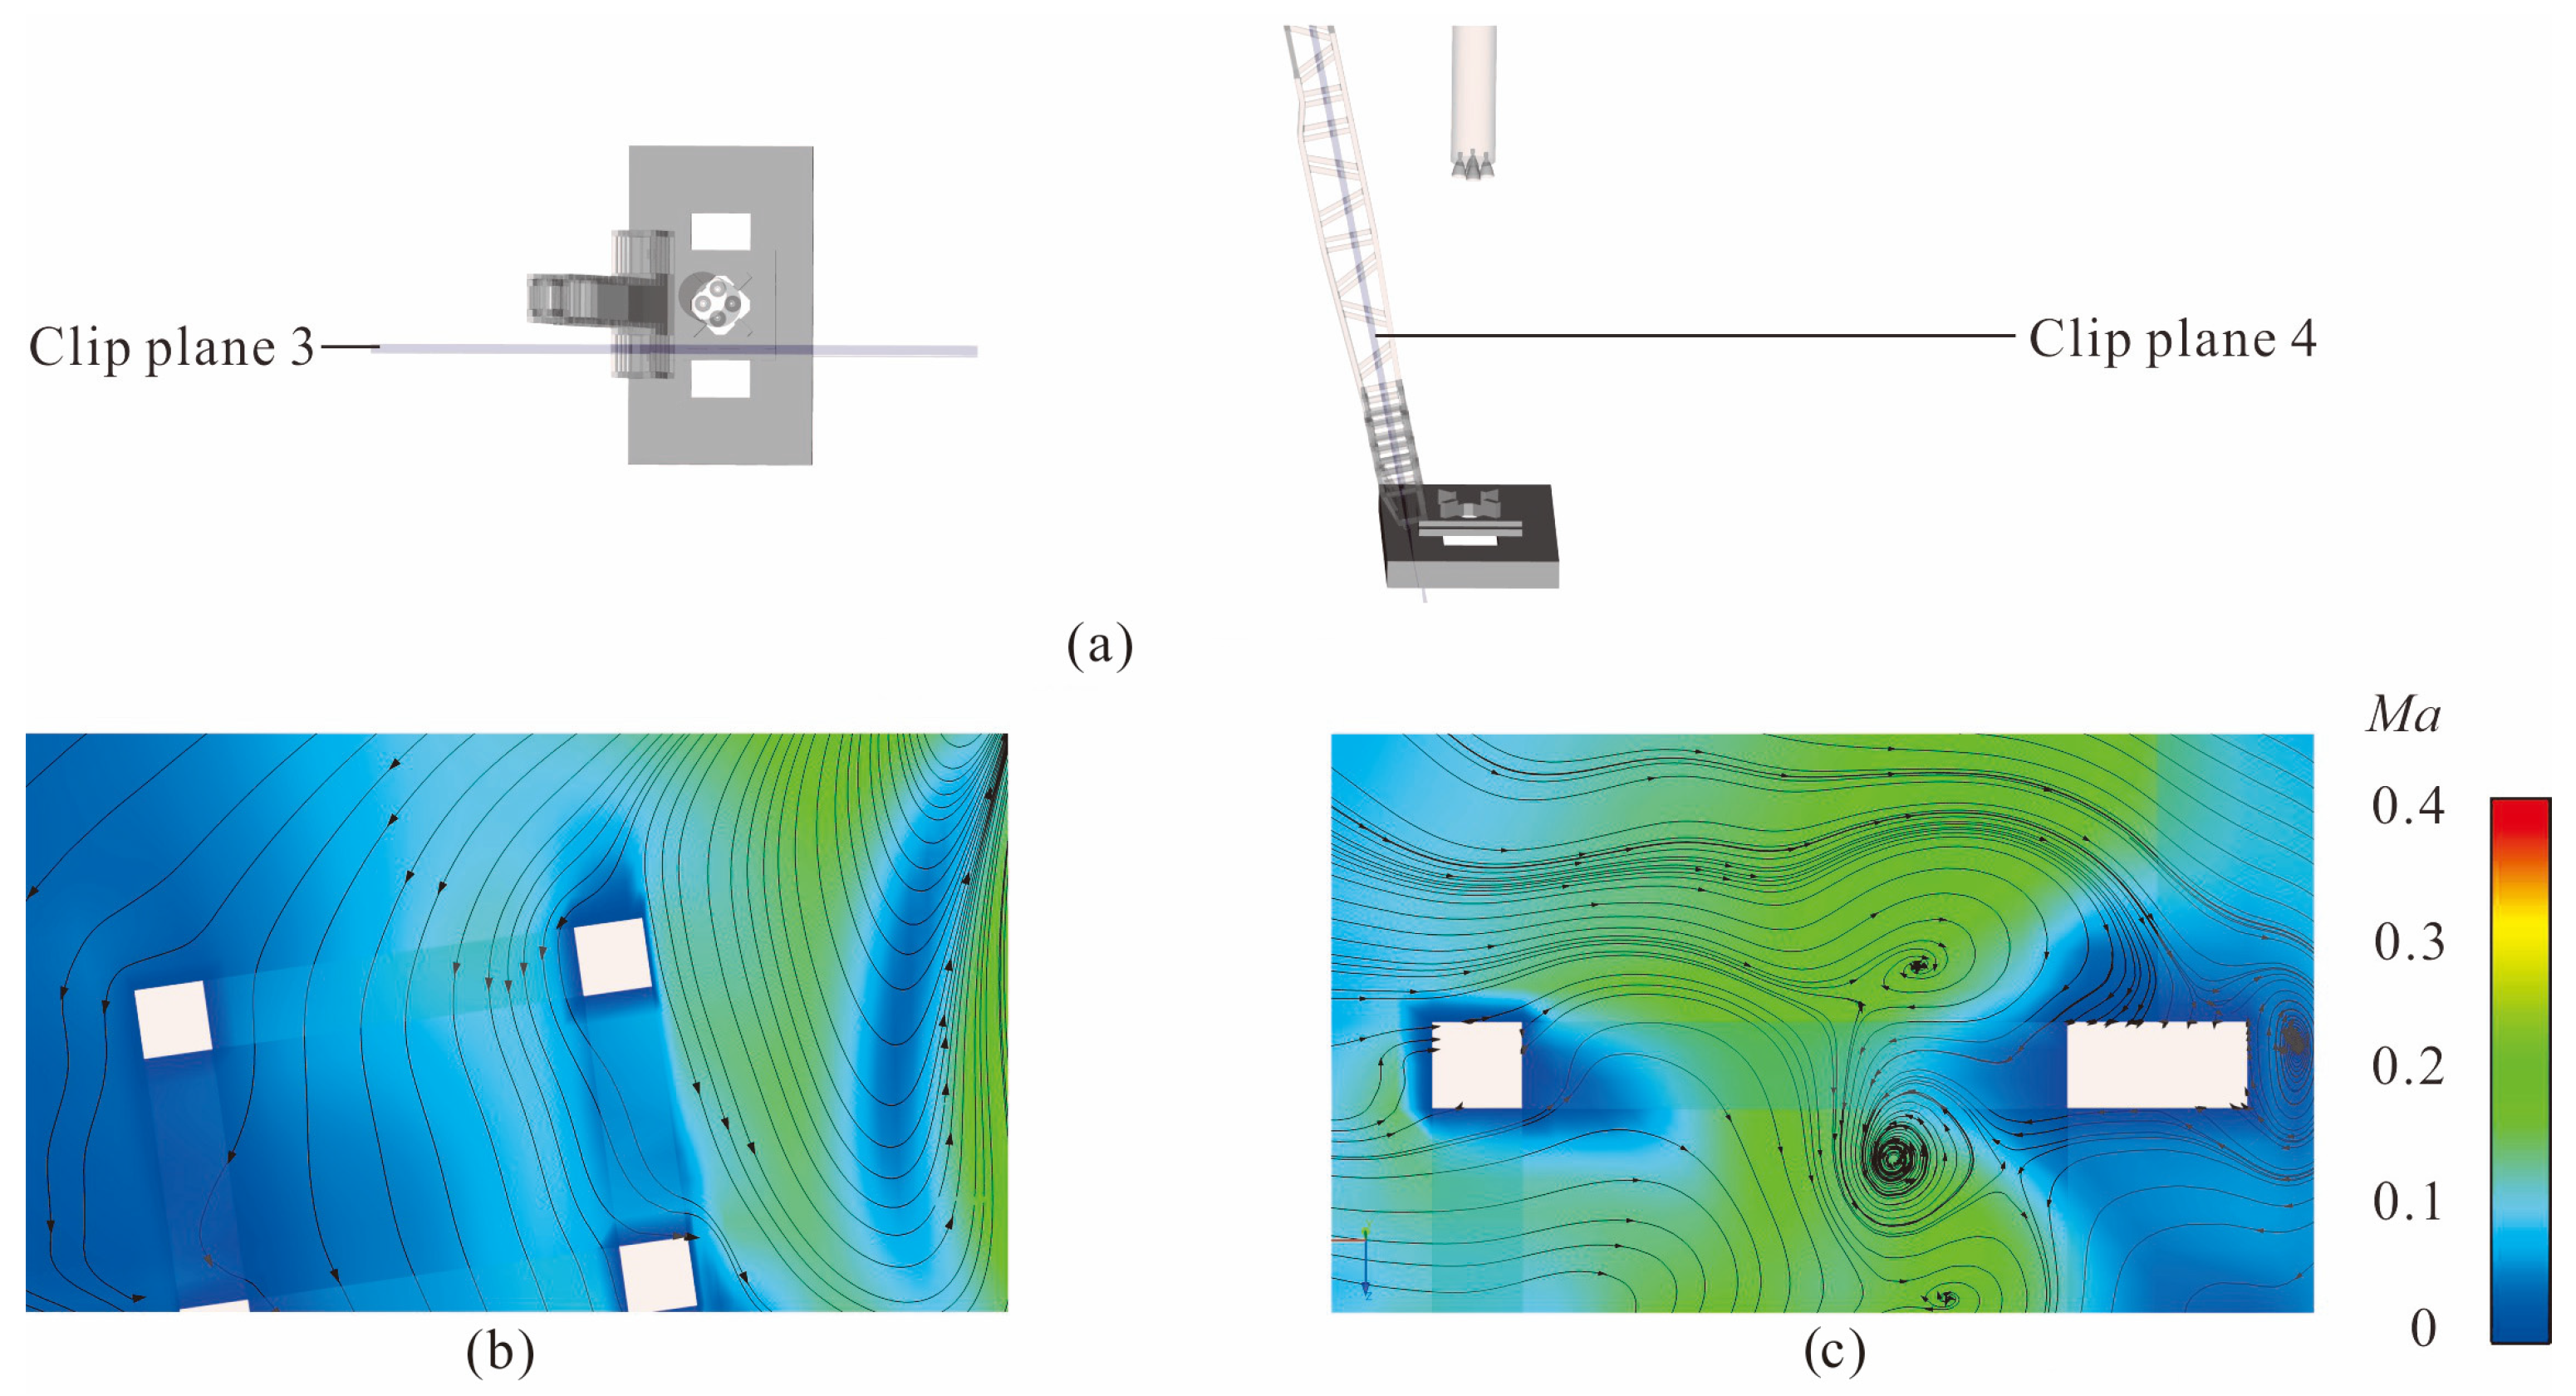
The lower part of the vertical arm is designed with a frame structure to increase the structural strength. The structure is from the bottom of the vertical arm to a height of 7.28D. The top of the frame will also be affected by the gas flow and the related laws are complex. This needs to be discussed in two parts: H ≤ 30 m and H ≥ 40 m. Figure 14 shows the temperature and pressure comparison diagram at the top of the frame. It can be seen that when H = 10 m, the atmospheric ambient pressure at one end of the +Y direction of the frame is maintained at 101,325 Pa, while the −Y direction end at the top of the frame is as low as 100,000 Pa. With the rocket flying to H = 20 m, the pressure on the top of the whole frame decreases to about 100,000 Pa, and the smaller α is, the smaller is the pressure. When H = 30 m, the maximum pressure in this area increases to 104,340 Pa, and the smaller α is, the higher is the maximum pressure. When H ≤ 30 m, the temperature at the top of the frame is always maintained at 300 K to 330 K, and there is almost no increase, but the pressure has a different trend from the temperature, which shows that the increase or decrease of pressure is not caused by the impact of the high temperature gas flow edge. When H = 10 m, the high-speed gas flow ejection affects the surrounding air to form a negative pressure area. Figure 15b shows the streamtrace near the lower part in this state. The air affected by the ejection effect flows through both sides of the horizontal beam in the -y direction on the upper surface of the lower part. The air here is sucked in and flows together, resulting in a decrease in pressure, so that the -Y direction end of the frame top near the rocket is significantly less than 101,325 Pa. As the rocket rises to H = 20 m, the impact area of the gas flow ejection effect is larger, so the negative pressure of the whole frame top is significantly smaller than the ambient atmospheric pressure. When H = 30 m, the temperature at the top of the frame still does not rise significantly, so the pressure rise in this part of the area is due to the further increase of the area ejection effected by the gas flow with the rise of the rocket, and the ejection affected air impacts the top of the frame from top to bottom. Due to the ejection effect of the gas flow at this point, it can already affect this area. Figure 15c shows the area where air from further away is entrained by the gas flow and collides with the pressure increase in Figure 14 (H = 30 m). This is also consistent with the right figure in Figure 8c. When H = 20 m, the smaller the α, the smaller is the pressure, while when H = 30 m, the smaller the α, the higher is the pressure. At this time, the degree of pressure reduction or increase is related to the degree of ejection effect. The smaller the α, the closer the vertical arm frame is to the rocket, so this phenomenon appears.
As the rocket rises further, the maximum temperature at the top of the frame begins to rise sharply. When H = 40 m, a small part of the +Y direction at the top of the frame is closer to the rocket, which is heated earlier by the impact of the gas flow, and the maximum temperature of 691 K appears when α = 11°. When H = 50 m, the rise of the rocket makes the area affected by the tail of the gas flow larger, the range of temperature rise at the top of the frame also increases significantly, and the maximum temperature also increases slightly. When α = 12°, the maximum temperature is 712 K. When H = 60 m, the larger are the two vertical arm angles, α = 18° and α = 23°, the area of the heating part decreases, and the maximum temperature decreases slightly. However, when α = 13°, the area and maximum temperature of the heating part increase instead, and the maximum temperature of the upper surface of the frame in the whole rocket takeoff phase is 757 K.
The pressure distribution at the top of the frame under these conditions is basically consistent with the above temperature distribution. As the flight altitude of the rocket increases, the tail of the gas flow expands and begins to impact the top of the frame. The ejection effect of the gas flow on the surrounding air no longer plays a major role in this pressure change. Therefore, the pressure at the top of the frame at H = 40 m is lower than that at H = 30 m, and the smaller the pressure, the greater the maximum pressure is. With the decrease of α, the influence of gas flow on the mechanical and thermal environment is still maintained. Then, similar to the above temperature distribution law, when H = 50 m, the area and maximum pressure of the pressure rise part at the top of the frame continue to increase, and finally when H = 60 m, α = 18°, and α = 23°, the area and pressure of the pressure rise part become smaller, while when α = 13°, the area and pressure of the pressure rise part instead, and the maximum pressure at this time is 104,320 Pa.
6. Conclusions

In this paper, the impact of the gas flow emitted by CZ-12 in the “three-horizontal” test and launch mode on the multi-functional vertical arm and other launch facilities was studied, and the pressure and thermal loads of the vertical arm with different rotation angles (α) at six flight altitudes (H) compared. Using the Navier–Stokes equation, a model of rocket gas flow impacting the vertical arm was established based on the realizable k ε turbulence model. The validity of the above calculation model was verified by comparing the calculation results with the experimental data. The following conclusions can be drawn.
(1)
During the launch of the CZ-12 “three-horizontal” test and launch mode, the rocket flight altitude (H) with severe impact of the rocket gas flow on the vertical arm is between 20 m and 50 m, and the backsplash deflection effect of the launch pad on the gas flow brings the pressure and thermal load at the bottom of the vertical arm. When the flight altitude is 30 m and the rotation angle of the vertical arm α = 10°, the extreme temperature at the bottom of the vertical arm reaches the maximum value of 1895 K. The flight altitude is 40 m. When α = 17°, the extreme pressure at the bottom of the vertical arm reaches the maximum value of 126,100 Pa. The influence of α at various flight altitudes on the bottom temperature of the vertical arm is different. When H ≤ 30 m, the maximum bottom temperature decreases with the increase of α. When H ≥ 40 m, the increase of α will lead to the increase of the maximum bottom temperature. The effect of α on the pressure at the bottom of the vertical arm is such that the maximum pressure at the bottom increases with an increase of α.
(2)
The mechanical and thermal load on the front of the vertical arm is caused by the impact of the gas flow. When the flight altitude is H = 30 m, α = 10°, the extreme temperature on the front of the vertical arm reaches a maximum value of 1890 K, and when H = 40 m, α = 17°, the extreme pressure on the front of the vertical arm reaches a maximum value of 135,270 Pa. The variation trend of the maximum temperature and pressure at the front of the vertical arm is similar to that at the bottom of the vertical arm (taking H ≤ 30 m and H ≥ 40 m as the dividing line). In addition, when H = 60 m, although the maximum values of temperature and pressure decrease, the area affected by the gas flow on the front of the vertical arm is the largest. From the temperature distribution along the centerline of the vertical arm, the area with higher temperature (over 700 K) does not exceed 22D. Adiabatic walls may cause the surface gas temperature to be slightly higher than the actual situation.
(3)
The top of the frame structure at the lower part of the vertical arm is affected by the more complex gas flow. When H ≤ 30 m, the temperature at the top of the frame is almost unchanged, so the pressure change is mainly caused by the surrounding air ejected by the gas flow. When H = 30 m and α = 10°, the maximum pressure at the top of the frame is 104,340 Pa. When H ≥ 40 m, the temperature rises sharply here, and the increase of α leads to an increase of temperature and pressure. When H = 60 m, α = 13°, the temperature at the top of the frame reaches a maximum value of 757 K. With the increase of the rocket flight altitude, the expanded tail of the gas flow can impact the top of the frame, and the smaller α will make the impact more severe.
Based on the above numerical simulation results, when this kind of rocket is launched in the “three-horizontal” test and launch mode, the key thermal protection position of the vertical arm is in the area where the height of the vertical arm bottom and the vertical arm front is less than 22D. Although the pressure and thermal load at the top of the frame at the lower part of the vertical arm is significantly lower than that at the bottom and front of the vertical arm, considering that there are a large number of components used for electrical connection and fuel filling here, the thermal protection should also be paid attention to.
In addition, as for the rotation rate of the vertical arm when the rocket is launched, it is suggested to select the Hα corresponding relationship that can make the thermal environment of the vertical arm pressure relatively small. In the current study, the launch vehicle rises vertically without considering the impact changes of the vertical arm caused by the lateral drift of the rocket. If the rocket drifts towards the position of the vertical arm, it will bring about a more severe thermal environment. Therefore, further research is to be carried out on the thermal load changes of the vertical arm pressure caused by the rocket drift.

Author Contributions

Writer of the original draft: Y.W. and Y.S.; Editors and reviewers: G.L. All authors have read and agreed to the published version of the manuscript.

Funding

This research received no external funding.

Data Availability Statement

The data that support the findings of this study are available from the corresponding author upon reasonable request.

Conflicts of Interest

The authors declare no conflict of interest.

References

  1. Li, L.; Ma, C.; Wang, E. Overview on the Current Situation and Future Development of Space Launch Technology at Home and Abroad. Aerospace 2024, 41, 1–6, (In Chinese & English). [Google Scholar]
  2. Zhou, Z.; Zhao, C.; Lu, C.; Le, G. Numerical studies on four-engine rocket exhaust plume impinging on flame deflectors with afterburning. Def. Technol. 2021, 17, 1207–1216. [Google Scholar] [CrossRef]
  3. Romero, E.; Francisco, D. The NASA human system risk mitigation process for space exploration. ACTA Astronaut. 2020, 175, 606–615. [Google Scholar] [CrossRef]
  4. Musso, G.; Figueiras, I.; Goubel, H.; Goncalves, A.; Costa, A. A Multidisciplinary Optimization Framework for Ecodesign of Reusable Microsatellite Launchers. Aerospace 2024, 11, 126. [Google Scholar] [CrossRef]
  5. Zhou, Z.; Ding, Y.; Le, G.; Liang, X.; Sun, P.; Sheng, Y. Studies on Thermal Environment of Liquid Launch Vehicle Tail Compartmentat High Altitude. J. Astronaut. 2019, 40, 577–584. [Google Scholar]
  6. Dharavath, M.; Chakraborty, D. Numerical Simulation of Supersonic Jet Impingement on Inclined Plate. Def. Sci. J. 2013, 63, 355–362. [Google Scholar] [CrossRef]
  7. Oh, H.; Lee, J.; Um, H.; Huh, H. Numerical study for flame deflector design of a space launch vehicle. Adv. Space Res. 2017, 59, 1833–1847. [Google Scholar] [CrossRef]
  8. Moraes, P.; Morgenstern, A. Evaluation of the effectiveness of VLS launcher flame deflector. Comput. Fluids 2001, 30, 523–532. [Google Scholar] [CrossRef]
  9. Zhao, J.; Wang, C.; Xu, Y.; Chen, Z.; Zhu, C.; Chang, J.; Yan, X. Influence Analysis of Vertical Arm on the Ground-wind Loads of a Launch Vehicle with the Three-Horizontal Test Launch Mode. Aerospace 2024, 41, 81–86, (In Chinese & English). [Google Scholar]
  10. Chin, C.; Li, M.; Harkin, C.; Rochwerger, T.; Chan, L.; Ooi, A.; Risborg, A.; Soria, J. Investigation of the Flow Structures in Supersonic Free and Impinging Jet Flows. J. Fluids Eng.-Trans. ASME 2013, 135, 031202. [Google Scholar] [CrossRef]
  11. Chan, L.; Chin, C.; Soria, J.; Ooi, A. Large eddy simulation and Reynolds-averaged Navier-Stokes calculations of supersonic impinging jets at varying nozzle-to-wall distances and impinging angles. Int. J. Heat Fluid Flow 2014, 47, 31–41. [Google Scholar] [CrossRef]
  12. Mayer, E.; Prickett, R. Rocket plume impingement heat transfer on plane surfaces. J. Spacecr. Rocket. 2015, 24, 291–295. [Google Scholar] [CrossRef]
  13. Dettleff, G. Plume flow and plume impingement in space technology. Prog. Aerosp. Sci. 1991, 28, 1–71. [Google Scholar] [CrossRef]
  14. Zhang, J.; Qu, Z.; Fu, R.; He, Y. Experimental study on the transient thermal characteristics of an integrated deflector under the periodic impingement of a supersonic flame jet. Int. J. Heat Mass Transf. 2015, 85, 811–823. [Google Scholar] [CrossRef]
  15. Harris, M.F.; Vu, B.T. Modeling of Heat Transfer and Ablation of Refractory Material Due to Rocket Plume Impingement. In Proceedings of the Thaermal Fluids Analysis Workshop, Pasadena, CA, USA, 13–17 August 2012. [Google Scholar]
  16. Allgood, D.; Ahuja, V. Computational Plume Modeling of COnceptual ARES Vehicle Stage Tests. In Proceedings of the 43rd AIAA/ASME/SAE/ASEE Joint Propulsion Conference & Exhibit, Cincinnati, OH, USA, 8–11 July 2007. [Google Scholar]
  17. Zhou, Z.; Zhang, L.; Le, G. Numerical study for the flame deflector design of four-engine liquid rockets. Eng. Appl. Comput. Fluid Mech. 2020, 14, 726–737. [Google Scholar] [CrossRef]
  18. Zhou, Z.; Le, G.; Zhang, L. Numerical Studies of Afterburning on Impingement Flowfield of the Four-Engine Rockets. J. Spacecr. Rocket. 2020, 57, 1284–1294. [Google Scholar] [CrossRef]
  19. Xing, C.; Le, G.; Shen, L.; Zhao, C.; Zheng, H. Numerical investigations on acoustic environment of multi-nozzle launch vehicle at lift-off. Aerosp. Sci. Technol. 2020, 106, 106140. [Google Scholar] [CrossRef]
  20. Zhao, C.; Su, Y.; Sun, Z.; Wang, Y.; Le, G. Drift and afterburning effect on rocket exhaust plume impingement and optimization of deflector. Adv. Space Res. 2024, 73, 3963–3975. [Google Scholar] [CrossRef]
  21. Lu, C.; Zhou, Z.; Liang, X.; Le, G. Thermal Environment of Launch Pads During Rocket Launching. J. Spacecr. Rocket. 2022, 59, 489–496. [Google Scholar] [CrossRef]
  22. Su, Y.; Lu, X.; Le, G.; Li, G.; Fu, B. Numerical simulations of seawater spraying on launch platform during CZ-8X offshore launching. Adv. Space Res. 2023, 72, 3631–3644. [Google Scholar] [CrossRef]
  23. Vatsa, V.N.; Wedan, B.W. Development of a multigrid code for 3-d navier-stokes equations and its application to a grid-refinement study. Comput. Fluids 1990, 18, 391–403. [Google Scholar] [CrossRef]
  24. Lu, C.; Zhou, Z.; Shi, Y.; Bao, Y.; Le, G. Numerical simulations of water spray on launch pad during rocket launching. J. Spacecr. Rocket. 2020, 58, 566–574. [Google Scholar] [CrossRef]
  25. Zhou, Z.; Liang, X.; Zhao, C.; Le, G.; Ding, Y. Investigations of base thermal environment on four-nozzle liquid launch vehicle at high altitude. J. Spacecr. Rocket. 2019, 57, 49–57. [Google Scholar] [CrossRef]
  26. Zhou, Z.; Lu, C.; Zhao, C.; Le, G. Numerical simulations of water spray on flame deflector during the four-engine rocket launching. Adv. Space Res. 2019, 65, 1296–1305. [Google Scholar] [CrossRef]
  27. Zhou, Z.; Bao, Y.; Sun, P.; Li, Y. Cooling of rocket plume using aqueous jets during launching. Eng. Appl. Comput. Fluid Mech. 2022, 16, 20–35. [Google Scholar] [CrossRef]
  28. Zhou, Z.; Wang, X.; Lu, C.; Le, G. Numerical analysis on thermal environment of liquid rocket with afterburning under different altitudes. Appl. Therm. Eng. 2020, 178, 115584. [Google Scholar] [CrossRef]
  29. Salehian, S.; Mankbadi, R.R. Simulations of rocket launch noise suppression with water injection from impingement pad. Int. J. Aeroacoustics 2020, 19, 207–239. [Google Scholar] [CrossRef]
  30. Mankbadi, R.; Lo, S.C.; Lyrintzis, A.; Golubev, V.; Dewan, Y. Hybrid LES-RANS simulations of a jet impinging on a flat plate. Int. J. Aeroacoustics 2016, 15, 535–553. [Google Scholar] [CrossRef]
  31. Brown, M.R.; Frendi, A. Supersonic Jet Impingement on a Flat Plate. In Proceedings of the 18th AIAA/CEAS Aeroacoustics Conference, Colorado Springs, CO, USA, 4–6 June 2012. [Google Scholar]
  32. Lamont, P.J. The impingement of underexpanded, axisymmetric jets on perpendicular and inclined flat plates. J. Fluid Mech. 2006, 100, 471–511. [Google Scholar] [CrossRef]
Figure 1. Geometry of the launching pad with vertical arm and the rocket: (a) The parameters of nozzles; (b) The parameters of the lower frame.
Aerospace 12 00467 g001
Figure 2. Three-dimensional mesh of the launching pad with vertical arm and the rocket.
Aerospace 12 00467 g002
Figure 3. Temperature distributions on the monitoring lines: (a) Temperature contor on the lower part of vertical arm with 9.50 million grids; (b) Temperature contour on the bottom of vertical arm with 9.50 million grids; (c) Temperature distributions on the monitoring line 1; (d) Temperature distributions on the monitoring line 2.
Aerospace 12 00467 g003
Figure 4. Comparison of experiment and simulation: (a) Comparision of flow field; (b) Comparision of data.
Aerospace 12 00467 g004
Figure 5. The distribution of Mach number (a) and temperature (b) on the isosurfaces of the vertical arm centerline and rocket axis under working condition 2.
Aerospace 12 00467 g005
Figure 6. The distribution of temperature on the bottom of the vertical arm.
Aerospace 12 00467 g006
Figure 7. The streamtraces near the bottom of the vertical arm (H = 20 m, α = 10°): (a) Sketch of clip plane; (b) Streamtraces of clip plane 1; (c) Streamtraces of clip plane 2.
Aerospace 12 00467 g007
Figure 8. Scatter plot of maximum temperature (left) and pressure (right) values for the bottom (a), front (b), and lower frames (c) of the vertical arm.
Aerospace 12 00467 g008
Figure 9. The distribution of pressure on the bottom of the vertical arm.
Aerospace 12 00467 g009
Figure 10. Sketch of ejection effect direction.
Aerospace 12 00467 g010
Figure 11. The distribution of temperature on the front of the vertical arm.
Aerospace 12 00467 g011
Figure 12. Temperature distribution on the centerline of the vertical arm.
Aerospace 12 00467 g012
Figure 13. The distribution of pressure on the front of the vertical arm.
Aerospace 12 00467 g013
Figure 14. The distribution of temperature and pressure on top of the lower frame of the vertical arm.
Aerospace 12 00467 g014
Figure 15. The streamtraces near the lower part of the vertical arm: (a) Sketch of clip plane; (b) Streamtraces of clip plane 3; (c) Streamtraces of clip plane 4.
Aerospace 12 00467 g015
Table 1. Mole fractions for the rocket engine inlet gas.
ComponentH2OCO2COH2
Inlet gas0.3880.2620.2550.095
Table 2. Corresponding table of vertical arm angle and rocket flight altitude.
Rocket flight altitude (m)102030405060
Working condition 1 α (°)8910111213
Working condition 2 α (°)81012141618
Working condition 3 α (°)81114172023
Disclaimer/Publisher’s Note: The statements, opinions and data contained in all publications are solely those of the individual author(s) and contributor(s) and not of MDPI and/or the editor(s). MDPI and/or the editor(s) disclaim responsibility for any injury to people or property resulting from any ideas, methods, instructions or products referred to in the content.