1. Introduction
The advancement of aircraft communication technology has led to an increasing reliance on networks for data communication in airborne systems. Civil aircraft communication has evolved from ARINC 429 and ARINC 629 to AFDX [
1] and TTE networks. This transition from digital to networked communication has significantly enhanced data transmission rates. Currently, the Airbus A380 and Boeing 787 utilize AFDX networks for system communication. As AFDX networks are based on internet protocols, they are susceptible to various information security threats prevalent in general networks. Airborne networks, serving as the “nerve center” of modern aircraft, operate within an open information interaction environment that exacerbates information security concerns. These concerns extend to airborne control, navigation, communication, and passenger service systems, which may be vulnerable to network attacks such as denial of service and data tampering, thereby compromising the safety and reliability of aircraft. Hence, airborne network security is critical for ensuring flight safety and aviation data integrity.
Airborne networks encounter numerous external threats, including unauthorized access, use, disclosure, denial, disruption, modification, and destruction, which may yield varying effects on operational safety. For aircraft, if threats penetrate critical asset systems, severe consequences may ensue. Therefore, identifying and analyzing potential threat conditions affecting airborne network security is essential for conducting a thorough in-formation security assessment. Accurate identification of these threat conditions can guide the formulation of subsequent risk assessment indicators. Traditional safety analysis methods for airborne networks often employ linear decomposition using the accident chain model. While these methods are suitable for simple, linear cause–effect relationships in accident chains, they struggle to effectively analyze the interactions among components in increasingly complex airborne networks. To describe the functional interactions be-tween system modules, NACY proposed the system-theoretic process analysis (STPA [
2]), which redefines safety analysis issues as control problems for resolution. Wang et al. [
3] used STPA in the safety assessment of hydrogen liquefaction systems, identifying potential risks and quantitatively evaluating risk values using the best-worst method, while proposing safety constraints to prevent accidents and enhance system reliability. Oginni et al. [
4] used STPA in the safety analysis of the UK railway system, uncovering complex interaction risks that traditional methods failed to capture. Zhang et al. [
5] applied STPA to analyze the safety of intelligent railway driving assistance systems, identifying critical risk factors and developing targeted hazard control strategies. These studies demonstrate the effectiveness of STPA in the safety analysis of complex systems and its capability to identify potential control safety issues. In the domain of information security, it is crucial to focus not only on the internal interaction safety of information systems but also on security issues arising from external attacks or malicious activities. Thus, this paper aims to develop a risk identification framework based on the existing STPA method, with a focus on external threats.
STPA-Sec [
6] is an improved method based on STPA. It identifies potential hazards by analyzing the information interaction behavior and system architecture of cyber-physical systems, with a focus on unsafe control actions caused by information system threats. While it has been applied in several safety critical fields, its application in the aviation field is relatively limited. Salgado et al. [
7] applied STPA-Sec to airborne collision avoidance systems to enhance aircraft safety from the perspective of system threats. Guskova et al. [
8] applied STPA-Sec to air traffic management, effectively identifying potential safety vulnerabilities and hazards. Sahay et al. [
9] applied STPA-Sec to the cyber ship system framework and determined the threat and hazard scenarios of the cyber ship framework as well as the safety requirements. Li et al. [
10] used STPA-Sec for qualitative analysis and determined the causation scenarios and safety requirements of automotive automatic emergency braking systems. The STPA-Sec method emphasizes external threats that systems may encounter, facilitating more effective identification of unsafe interactions and a comprehensive assessment of potential safety risks, thereby ensuring the security and reliability.
As an active defense technology, information security risk assessment must consider multidimensional evaluation criteria and factors. Numerous scholars have investigated information security risk assessment indicators across various domains. Li et al. [
11] established a detailed index system utilizing the analytic hierarchy process (AHP) and Intuitionistic Fuzzy Sets, including five dimensions: risk analysis, risk prevention, risk control, risk treatment, and monitoring and improvement. Shirvani et al. [
12] proposed a risk assessment framework using custom standards and the STRIDE threat model to enhance the identification of threats and risks within the electric vehicle ecosystem. Tsai et al. [
13] constructed an index system comprising risk, demand, attack, and configuration layers, integrating safety requirements, potential attack methods, and system configurations, while using AHP to calculate weights for assessing and managing wireless networks. Sato et al. [
14] examined the probability dependency relationships among information assets, threats, and vulnerabilities by focusing on malicious communication within the network. Dong et al. [
15] established an information security risk assessment system for smart grids, employing a D number preference relation enhanced AHP to determine indicator weights and combining grey theory to derive a comprehensive evaluation value and risk level. Li et al. [
16] divided the computer network security risk assessment system into three main sections: assets, access control, and communication and operation, further refining each into multiple detailed evaluation indicators. Although these studies have advanced the construction of evaluation index systems, most are limited to simple optimizations for specific industries or fields, with constraints on applicability in complex interaction environments. Particularly regarding the critical criterion of threat conditions, existing research frequently employs generic threat conditions or linear logic-based safety analysis methods, failing to fully consider interaction risks among components in complex information systems, which may lead to overlooked potential risks. In the highly complex interaction environment of airborne networks, traditional general information security risk assessment systems are clearly inadequate. Therefore, it is necessary to expand threat conditions within a general assessment framework to enhance the adaptability of the assessment system to airborne networks. This study improves the STPA, capitalizing on its capability to identify complex interaction risks in airborne networks to further refine threat scenarios. By integrating the interaction risks identified by STPA into the assessment system, a more comprehensive coverage of potential safety threats arising from component interactions in airborne networks is achieved, thereby enhancing the scientific rigor and accuracy of assessments and providing a more reliable theoretical foundation for airborne network security risk assessment.
In the field of information security risk assessment, extensive theoretical research has been conducted utilizing various risk analysis methods and assessment tools tailored for different systems or specific target networks. Wang et al. [
17] proposed combining Pythagorean fuzzy AHP with a technique for order preference by similarity to an ideal solution (TOPSIS) to address expert cognitive uncertainty in airborne network information security risk assessment. Alhakami [
18] integrated fuzzy theory into energy management and control systems to identify optimal communication network solutions against attacks and risks, reducing expert uncertainty but neglecting interactions among evaluation indicators. Tian et al. [
19] used the GRA-TOPSIS method based on EW-CRITIC combination weighting to comprehensively evaluate the air combat control ability for anti-ballistic missiles, but the selection of preference coefficients introduced some subjectivity. Alshahrani et al. [
20] presented a fuzzy TOPSIS method to analyze and rank IT risk factors in an organizational environment with 25 decision makers. Wu et al. [
21] used the CRITIC-TOPSIS method to evaluate bridge construction safety risks in marine environments, determining secondary indicator weights with CRITIC and assessing construction safety risk levels with TOPSIS. Baylan [
22] combined AHP and TOPSIS for project risk quantitative analysis, also applicable at the project activity level. Awodi et al. [
23] applied fuzzy TOPSIS to rank nuclear decommissioning risk factors. Borges et al. [
24] analyzed integrating STPA with TOPSIS for system safety assessment to prioritize unsafe control actions. Tian et al. [
25] used the CRITIC-entropy weighting method and Gray-TOPSIS correlation analysis method to assess risks, enhancing the accuracy of identifying risk hotspots on airport surfaces. Li et al. [
26] created a coal mine safety evaluation index system, utilizing TOPSIS combined with the entropy weight method to mitigate subjectivity in risk weight allocation and enhance the objectivity of assessment results. These studies show hybrid MCDM methods based on TOPSIS [
27] are widely used in various fields. By combining with other methods, they give full play to their respective advantages to solve multi criterion decision making problems in risk assessment, enhancing the validity and reliability of assessment results. Many of these methods contribute to reducing expert subjectivity but generally fail to adequately consider the interrelationships among assessment indicators, leading to limitations in assessing objectivity and overall system risk, particularly in complex information systems. This limitation can adversely affect the comprehensiveness and accuracy of assessments, highlighting the urgency to develop an assessment method that comprehensively considers the interactions among indicators to better reflect the true security status of airborne networks.
One of the main challenges in airborne network information security risk assessment is the lack of historical data. Several traditional risk assessment methods, such as fault tree analysis (FTA), failure mode and effects analysis (FMEA), and MITRE ATT & CK, have been used in aviation. Liu et al. [
28] built an FMEA framework for risk assessment of aircraft integrated drive generators, combined FMEA with TOPSIS to classify failure modes, and verified the method’s effectiveness. Maheve et al. [
29] improved the safety of actuator controllers in aircraft control systems through fault tree analysis. However, FMEA and FTA mainly focus on analyzing the failure modes of individual components and their impact on the system. They have limited ability to analyze interaction problems and simultaneous multiple component failures in complex systems, and their results are prone to subjective influences. Georgiadou et al. [
30] used MITRE ATT & CK for network security assessment but found it difficult to directly quantify and prioritize system related risks. In contrast, STPA-Sec focuses on interactions between system components and the impact of external threats, enabling macro level risk scenario identification. CRITIC-TOPSIS, through objective weight determination and comprehensive assessment, ranks and assesses risks more accurately, providing a stronger basis for decision making.
The paper proposes a network threat condition identification method based on the improved STPA to address complex interaction risks in airborne network systems. It employs TOPSIS to rank threat scenarios and conduct a comprehensive assessment of identified threats. The opinion aggregation method based on the weakest t-norm (
) [
31] is applied and the criteria importance through intercriteria correlation (CRITIC [
32]) method is employed to determine the weights of evaluation indicators, taking into account both the differences and correlations in expert scores to enhance the objectivity of assessment results. Finally, the effectiveness of the proposed method is validated through a comparison of the closeness of different assessment methods.
2. Improved STPA-TOPSIS Evaluation Framework
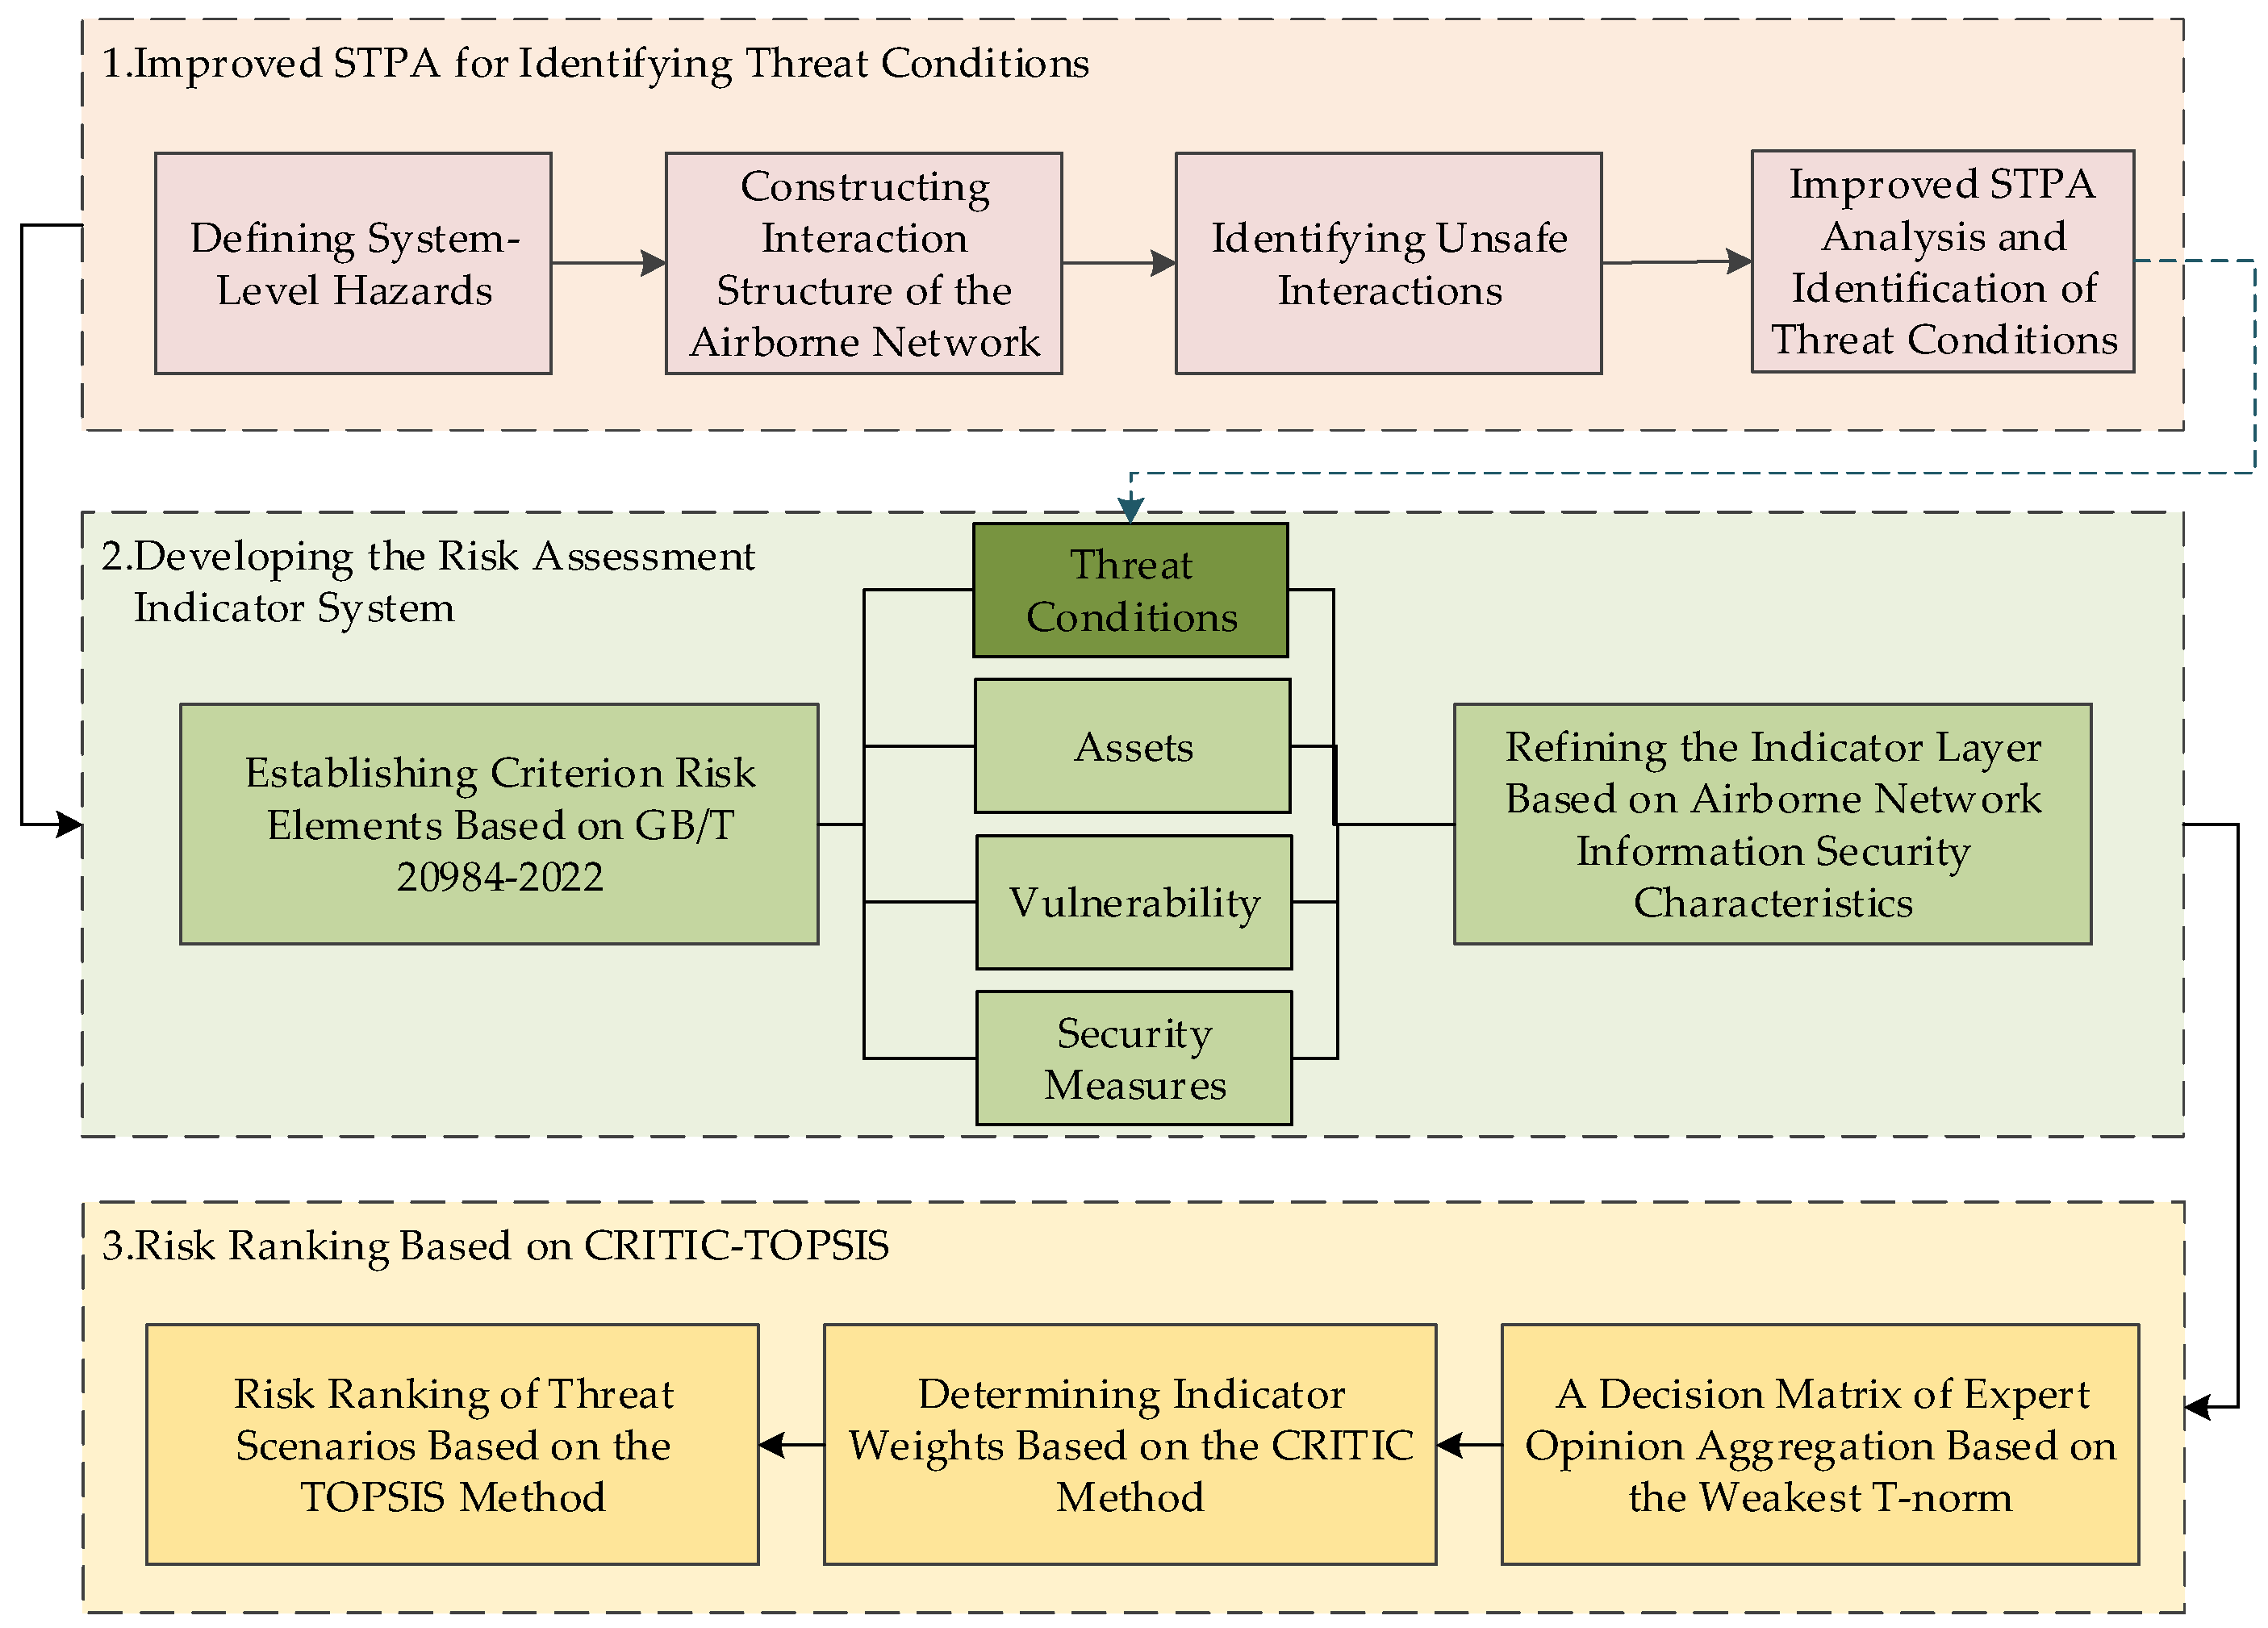
In addressing the limitations of traditional information security assessment methods for complex airborne network threat identification and risk assessment, this paper proposes an airborne network information security assessment framework based on the improved STPA-TOPSIS method. The flowchart of framework is illustrated in
Figure 1, and the comprehensive information security assessment process comprises three components.
The first component is a safety analysis using the improved STPA approach. Starting from the simplified airborne network system architecture interaction diagram provided in the airworthiness document RTCA DO-356A [
33], the improved STPA is applied to the airborne network architecture. Initially, the system-level losses and hazards of the airborne network are defined. Subsequently, a safety interaction model of the airborne network components is constructed, and unsafe interactions among these components are identified. Finally, utilizing general causal factors and integrating the behavior of malicious unauthorized electronic interactions, this paper summarizes the interaction risks for the airborne network.
The second component constructs a risk assessment index system for airborne networks, considering the complexity of airborne network interactions and aligning with the latest national standards for information security risk assessment. This system integrates the threat conditions identified and analyzed in the first component to further enhance and expand the assessment framework.
The third component performs analysis and assessment of threat scenarios. Using the CRITIC method for objective weight, it incorporates weights into a decision matrix based on evaluation indicators and threat scenarios. The TOPSIS method is applied to quantitatively evaluate the interactive effects of various threat scenarios on airborne networks by calculating their closeness coefficients.
2.1. Improved STPA Method for Airborne Network Information Security
The STPA is used to identify and analyze safety risks in complex systems, emphasizing not only individual component failures but also system-wide interactions. The core premise of the STPA method is that safety issues arise predominantly from interactions among system components and the overall system design, thereby providing a significant advantage in analyzing complex systems [
34].
The improved STPA method extends safety analysis into the security domain, evolving into the STPA-Sec method. Unlike the traditional STPA, which focuses primarily on internal faults, STPA-Sec emphasizes external threats. It enhances the original four analysis steps by focusing on intentional unauthorized electronic interaction (IUEI) [
35]. The STPA-Sec method for airborne networks comprises the following four steps:
This step corresponds to the traditional STPA method, which includes identifying system characteristics, defining its state or conditions, and recognizing hazardous factors and potential losses that could lead to accidents within a specific environment.
- 2.
Construct the functional interaction structure of the model.
Unlike the component-based control structure of traditional STPA, the STPA-Sec method emphasizes a functional interaction structure. This structure is widely utilized in safety analysis, including input and output interactions in network configurations, ex-tending beyond the control actions and feedback of control systems.
- 3.
Identify unsafe control actions (UCAs).
UCAs can be classified into four categories: failing to perform a required interaction, executing an incorrect interaction, timing the interaction inaccurately, and interactions that are excessively prolonged or conclude prematurely.
- 4.
Extract causal factors.
Causal factors are potential triggers for UCAs and hazards, existing throughout the functional interaction loop. While the four types of interaction loops in traditional STPA can be further refined into ten general causal factors, the enhancement of STPA-Sec primarily focuses on considering IUEI during causal factor extraction to identify external threats to airborne networks.
Unlike traditional STPA methods, which concentrate on internal component interactions within complex systems, the STPA-Sec method used in this study addresses the safety concerns of airborne network information security. It not only addresses safety issues arising from internal interactions but also confronts risks stemming from interactions with external networks. The STPA-Sec method emphasizes external threats that airborne networks may encounter, facilitating more effective identification of unsafe interactions and a comprehensive assessment of potential safety risks, thereby ensuring the security and reliability of airborne networks.
2.2. Airborne Networks Security Risk Assessment Method Based on the CRITIC-TOPSIS Methodology
To conduct a thorough analysis and assessment of threat scenarios in airborne networks, this paper employs a CRITIC-TOPSIS-based information security risk assessment model. Traditional risk assessment methods fail to comprehensively and objectively reflect the risk status of airborne networks. To address this issue, this study gathers evaluation data through expert group scoring. The CRITIC method objectively determines the weights of evaluation indicators, balancing the subjectivity inherent in expert assessments with the objective significance of the information among indicators. The TOPSIS method, utilizing the concepts of positive ideal solution (PIS) and negative ideal solution (NIS), quantitatively ranks the complex and variable threat scenarios in airborne networks, aiding decision-makers in promptly identifying and prioritizing critical security risks. The integration of CRITIC and TOPSIS combines expert subjective judgment with objective analysis, enhancing the rigor and practical applicability of the assessment results, thereby providing support for information security risk management in airborne networks.
2.2.1. The Expert Opinion Aggregation Method Based on the
The triangular fuzzy number is denoted as
, and its membership function is shown in
Figure 2 and the Equation (1):
In this context, represents the lower bound of , represents the upper bound of . The difference between and signifies the fuzziness of ; a larger difference means higher fuzziness. When , becomes a non-fuzzy number.
The theory of Intuitionistic Fuzzy Sets (IFS) is an extension of traditional fuzzy set theory. Unlike traditional fuzzy sets, IFS considers membership, non-membership, and hesitation degrees of fuzzy numbers, making it better at capturing the ambiguity and uncertainty of expert opinions. An IFS
is represented as a triplet ordered set.
In the Equations (2), (3), and (4), and denote the membership degree and non-membership degree, respectively. is defined as the intuitionistic fuzzy metric of , which represents the hesitation degree of with respect to .
In the triangular intuitionistic fuzzy set, the triangular intuitionistic fuzzy number is denoted as
, and its non-membership functions are as follows:
To determine the weights of experts in the airborne network security risk assessment process, this paper adopts an expert weighting method based on multi-dimensional scoring. Let the total multi-dimensional score of the
-th expert be
, and the calculation formula for its weight
is as follows:
represents the scores of experts across
dimensions. This study evaluates experts in three core dimensions: job title, education, and work experience. Each dimension is weighted appropriately and quantified. The total scores of experts are calculated per the evaluation criteria and Formula (7), and their weights are derived using Formula (6).
Multiple evaluators assess a threat scenario, yielding multiple results. To aggregate these into a comprehensive fuzzy number, both the degree of consensus among differing opinions and the importance of the evaluators are crucial. The similarity aggregation method, considering both expert weights and opinion consensus, enhances the reliability of aggregated result.
During the opinion aggregation process, uncertainties can accumulate. The weakest t-norm, a classic form of the T-norm, performs fuzzy operations while preserving the fuzzy number form. It reduces the width of the reliability interval and lowers the impact of fuzzy accumulation. The
is a common operator in algorithms for evaluating complex systems under uncertainty as it reduces the accumulation of fuzziness.
The basic operational rules for two triangular intuitionistic fuzzy numbers (TIFN),
and
, are shown in
Table 1.
The evaluation results of experts
and
for a certain event are converted into TIFNs
and
, respectively. Then, the similarity function
between the two fuzzy numbers is defined as follows:
Considering the weights of evaluators, the consistency of opinions is calculated. The weighted consistency of expert
is calculated as follows:
In Formula (11),
is the weight of expert
, and
is the number of experts. Based on the weighted consistency
, the relative consistency of expert
’s opinion is calculated in the Formula (12).
In Formula (13), the weights of experts and the relative consistency are combined to calculate the aggregated weight of expert
. Finally, Formula (14) aggregates expert opinions based on the
operator to obtain the overall fuzzy number for a threat scenario under a specific evaluation criterion. The overall flowchart of the expert opinion aggregation process based on
is shown in
Figure 3.
2.2.2. The Indicator Correlation Weight Determination Method
The CRITIC method serves as an objective approach for determining indicator weights in multi-attribute decision-making. It considers data characteristics and correlations between indicators to compute weights, ensuring high objectivity and rationality. In the context of airborne network risk assessment, CRITIC effectively captures the significance of each security indicator across various threat scenarios. The specific steps are as follows:
First, calculate the standard deviation of each evaluation indicator. The standard deviation reflects the variation of the indicator across different threat scenarios. In airborne networks, a larger standard deviation indicates that the security indicator exhibits greater variability across different threat scenarios, contains more information, and exerts a more substantial influence on risk assessment. The calculation formula is shown in the Equation (15):
where
: the standard deviation of the -th indicator;
: the value of the -th indicator under the -th threat scenario;
: the average value of the -th indicator;
: the number of threat scenarios.
Next, compute the correlation coefficient matrix between indicators. In airborne networks, a high correlation coefficient between two indicators signifies that they exhibit similar trends in risk measurement. The calculation formula for the correlation coefficient is shown in the Equation (16):
In the equation, is the correlation coefficient between the -th and -th indicators.
Based on the data from these two steps, the conflict degree of each indicator is defined as the weighted sum of the standard deviation and the correlation, as expressed in the Equation (17):
In the formula, represents the conflict between the -th and -th evaluation indicators. The CRITIC method suggests that indicators with lower correlations provide more independent information; thus, greater conflict indicates that the indicator is more significant and warrants a higher weight.
Finally, the weights of the evaluation indicators are computed based on the conflict degree, as shown in the Equation (18):
By adhering to the outlined steps, the CRITIC method thoroughly considers the dispersion and mutual independence of each security indicator in the risk assessment of airborne networks. This approach not only enhances the validity and rationality of the assessment results, but also accurately reflects the impact of the evaluation system’s indicators on overall risk.
2.2.3. Technique for Order Preference by Similarity to Ideal Solution
The TOPSIS is a multi-attribute decision-making method used to identify optimal solutions or rank alternatives. This method is employed to evaluate the risk associated with threat scenarios in airborne networks. Initially, the PIS and NIS are calculated. The PIS represents the worst-case scenario in which all evaluation indicators achieve their most unfavorable levels, indicating the highest risk state. Conversely, the NIS signifies the best-case scenario where all indicators attain their most favorable levels, reflecting the lowest risk state. Subsequently, weighted Euclidean distances from each threat scenario to both the PIS and NIS are computed, based on the weights of each indicator. Finally, threat scenarios are ranked according to their closeness degree, which quantifies how near a scenario is to the PIS and how far it is from the NIS. This ranking process effectively assesses the risk of threat scenarios in airborne networks.
Figure 4 illustrates the evaluation process of the TOPSIS method.
The main steps of the TOPSIS method are as follows:
The calculation formulas for the PIS and the NIS are shown in the Equations (19) and (20):
where
: standardized decision-making matrix;
: the rating data of the -th threat scenario under different evaluation criteria;
: the rating data of different threat scenarios under the -th evaluation criterion;
PIS:; NIS: .
In airborne networks, the PIS represents the most disadvantageous risk state, where all indicators reach their maximum risk values. In contrast, the NIS represents the most advantageous risk state, where all indicators reach their minimum risk values.
- 2.
Calculate the distance between threat scenarios and the PIS/NIS.
The TOPSIS method employs Euclidean distance to compute the distances between threat scenarios and the PIS/NIS, as demonstrated in the following equations:
denotes the Euclidean distance between a threat scenario and the PIS, and denotes the Euclidean distance between a threat scenario and the NIS. Through calculation, we can obtain the positive vector between the identified threats and the PIS, and the negative vector between the threats and the NIS. In airborne network risk assessment, a smaller means the threat scenario is closer to the highest risk state, while a larger also indicates a threat scenario closer to the highest risk state.
- 3.
Rank threat scenarios based on closeness.
Utilizing the concept of the positive and negative distance vectors between the threat scenarios and the PIS/NIS, closeness can be quantitatively defined as the measure of how near a threat scenario is to the highest risk state. If the closeness of solution
is denoted as
, the calculation is shown in the Equation (23):
The represents the relative risk level of a threat scenario. In airborne networks, a higher closeness implies greater proximity to the highest-risk state and an elevated risk level, whereas a lower closeness indicates a reduced risk level. Therefore, threat scenarios can be ranked according to their closeness.
3. Case Study
3.1. Threat Condition Identification for Airborne Networks Based on Improved STPA
The specific steps of the STPA-Sec method for airborne network security are delineated as follows:
The initial step defines the system-level losses and hazards of the aircraft from the perspective of information security [
10]. These losses represent unacceptable events at the system-level that may lead to personnel casualties, property damage, or mission failure.
Airborne networks, as integral components of an aircraft system, may incur severe consequences if threatened or attacked through unauthorized electronic interactions. Thus, system-level losses are defined to identify those losses that are unacceptable to the system owner or stakeholders, enabling a focus on evaluating and mitigating the risks that could precipitate these losses. The system-level losses determined from the airworthiness security document DO-356A regarding aircraft safety and crew effects are detailed in
Table 2.
According to the STPA-Sec method, a hazard is characterized as a system state or a set of conditions that, in conjunction with specific worst-case environmental conditions, leads to system-level losses. In the context of airborne networks, system-level hazards manifest as unsafe states resulting from unauthorized electronic interactions, which may lead to system-level losses within the network.
Table 3 presents the system-level hazards and their potential losses for airborne networks.
The second step entails constructing the secure interaction structure of the airborne network.
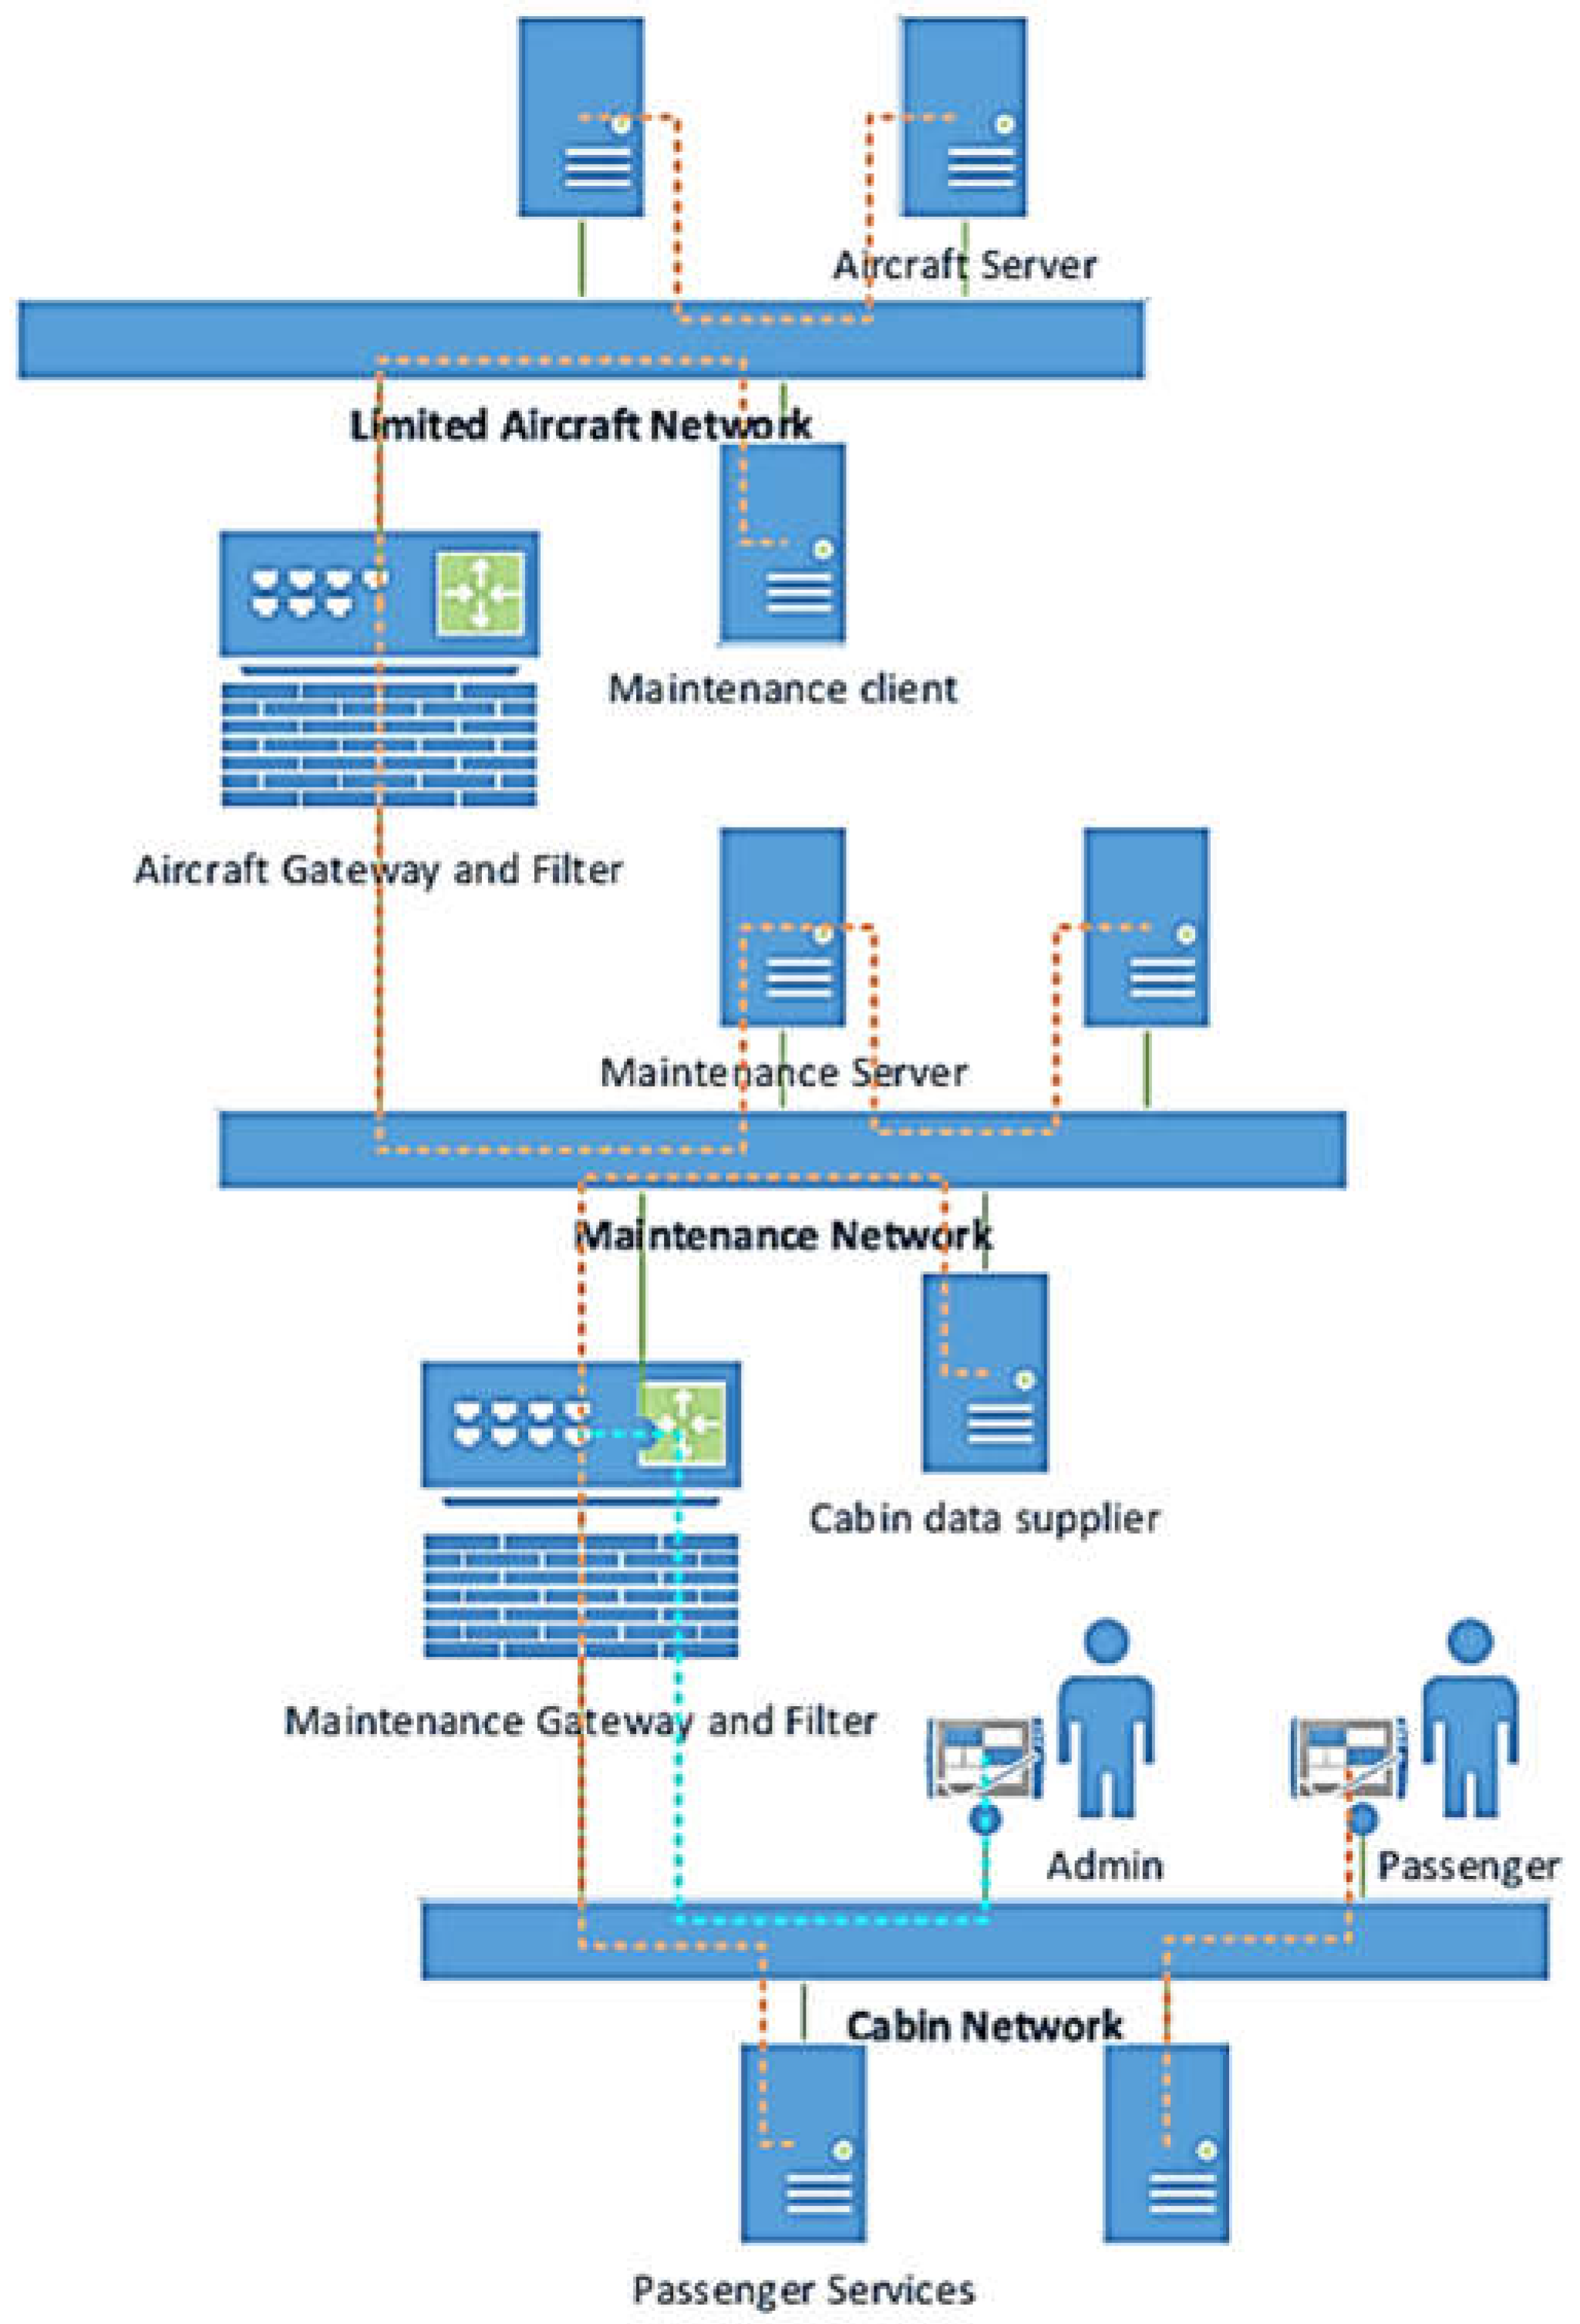
In the aviation field, to handle the complex safety challenges in airborne networks, the RTCA DO-356A standard offers assessment methods and guidelines for airborne network information security. By dividing network systems into various security domains, it enhances information security risk management. In its simplified network model, the airborne network is split into the cabin network, maintenance network, and limited aircraft network. This improves security responsibility clarity, resource allocation, and assessment effectiveness.
By conducting risk assessments on the simplified network, we can identify key security threats and risk scenarios, and then generalize these findings to the entire airborne network architecture. The threat scenarios and assessment methods identified in this study can serve as a template for application in more complex real-world airborne network environments. This provides guidance and support for the information security assessment of the entire airborne network. The basic architecture of the simplified airborne network is shown in
Figure 5.
Each network serves specific functions and communication requirements. The cabin network provides services for passengers, including in-flight entertainment and personal communication, with passengers connecting through designated devices. The maintenance network facilitates aircraft repair systems, allowing maintenance personnel to per-form authentication, system configuration updates, and access the airborne maintenance system. The cabin network server may request essential resources from the maintenance network server, such as flight altitude and cruise speed. The aircraft network manages communications for flight-related systems (communication, navigation, flight control, and fuel management), supporting overall flight operations. It enables the maintenance network server to upload critical configuration update data for system updates and maintenance. To ensure secure and efficient network communication, a maintenance gateway filters data packets and controls speed between the cabin and maintenance networks. Maintenance personnel are authenticated via the management interface of this gateway. Additionally, an aircraft gateway between the maintenance and airborne networks ensures communication security and compliance.
Based on the analysis of the airborne network system architecture and the characteristics of the STPA-Sec, a security interaction model between personnel and airborne network components is developed, as depicted in
Figure 6.
The third step is to identify UCAs within the airborne network security interaction structure.
In the STPA-Sec framework, UCAs that may cause hazardous states in airborne aircraft networks are categorized into four types: providing incorrect control actions, failing to provide the necessary control actions for safety, supplying control actions with incorrect timing, and delivering control actions for excessively prolonged or insufficient durations.
To safeguard the airborne network, this study analyzes the interaction structures of airborne networks, concentrating on component interactions and personnel access to network interactions. This analysis identifies 24 UCAs in airborne networks using the STPA-Sec method, as detailed in
Table 4.
The fourth step consists of extracting causal scenarios and subsequently identifying the threat conditions that affect the airborne network.
To outline all causal scenarios leading to UCAs, each UCA is examined using three threat types from the STRIDE model [
36]: Tampering, Denial of Service, and Privilege Escalation. Due to space constraints, the following summarizes the causal scenario analysis process for four UCAs related to cabin resource provisioning, as illustrated in
Table 5.
Based on the information presented in the table, multiple unsafe interactions within airborne networks give rise to various causal scenarios. These scenarios are categorized according to the STRIDE model and synthesized as threat conditions for airborne networks.
For example, analysis of the causal scenarios U1-3, U2-2, U2-3, U3-2, U3-3, and U4-2 shows that these scenarios describe attackers launching denial-of-service attacks to disrupt cabin networks. From these analyses, a threat condition termed “denial of cabin ser-vice” (T1 in
Table 6) can be derived. Similarly, additional threat conditions (T2–T9 in
Table 6) can be established by examining causal scenarios stemming from different attack types as classified by the STRIDE model. This analysis links causal scenarios among components to specific threat conditions within the airborne network.
3.2. Airborne Network Security Risk Assessment
3.2.1. Threat Scenario Analysis
GB/T 20984-2022 [
37] defines the fundamental elements and their interrelationships in information security risk assessment, which comprise assets, threats, vulnerabilities, and security measures [
17]. Therefore, the risk assessment of airborne networks in this study is grounded in these four elements, considering the characteristics of network information security and integrating the airworthiness security risk assessment standard DO-356A, as illustrated in
Figure 7.
According to GB/T 20984-2022, confidentiality, integrity, and availability are the three main security attributes of (assets). These are reflected in the (confidentiality value), (integrity value), and (availability value) of airborne network assets during risk assessment. The exploitability of (vulnerabilities) in airborne networks is indicated by the (attack vector), (required privileges), and (attack complexity), based on the Common Vulnerability Scoring System. According to the characteristics of airborne networks, the (threat conditions) identified by the improved STPA method are incorporated into the risk assessment index system. These threat conditions include (denial of cabin service), (tampering with cabin services), (denial of maintenance service), (tampering with maintenance services), (denial of aircraft service), (tampering with aircraft services), (tampering with maintenance gateway configuration), (hijacking cabin services in the maintenance network), and (hijacking maintenance services in the aircraft network), to assess the severity of their impacts. Finally, referring to the airworthiness security document DO-356A, (protection effectiveness) is used as the evaluation index for security measures.
Referring to the airworthiness security risk assessment standard DO-356A and the threat conditions analyzed by the aforementioned improved STPA method, and integrating the four fundamental elements outlined in GB/T 20984-2022, six primary airborne network threat scenarios within the airborne network system are analyzed and identified, as illustrated in
Table 7.
3.2.2. Expert Opinions Aggregation Based on
To ensure the rigor of the airborne network security risk assessment, five experts from the aviation and airborne network domains constituted an assessment panel, detailed in
Table 8. The selection of the experts adheres to principles of diversity and professionalism. The experts hail from aviation manufacturing companies, academic institutions, and research organizations, with job titles ranging from senior engineers to professors and researchers, offering multidisciplinary perspectives including engineering practice and academic theory. All panel members possess master’s or doctoral degrees, ensuring a comprehensive understanding of airborne network technology and security. With extensive professional experience, the evaluation group brings rich insights from key technological research and development to network security assessment. The five experts have considerable experience in airborne networks, with specializations covering airborne communication protocols (such as ARINC 429 and AFDX networks), aviation network architecture design, airborne information security, and threat analysis. They are equipped to evaluate the index system and risk scenarios scientifically from multiple perspectives. During the expert scoring process, adherence to their professional strengths, technical depth, and risk assessment experience guarantees objective and reliable results, providing robust theoretical and practical support for airborne network security risk ranking.
In order to quantitatively evaluate the expert level, the scoring criteria are defined in terms of their job titles, education level, and working time as shown in
Table 8. Based on the scoring criteria in this table, the invited experts are evaluated in the three dimensions of the scoring criteria, and their expert weights are normalized according to their total scores. The specific expert information, scoring results, and final evaluation expert weights are shown in
Table 9.
Based on the established airborne network security risk assessment index system, the five experts in the evaluation panel conducted a quantitative analysis of potential threat scenarios in the airborne network. Drawing on their extensive professional knowledge and practical experience, the experts meticulously analyzed the key characteristics of the risk scenarios. Adhering strictly to the assessment system outlined in this paper, they performed risk assessments for six typical threat scenarios in the airborne network across 16 evaluation criteria. To guarantee the objectivity and rigor of the assessment process, the experts utilized a triangular fuzzy scoring mechanism in combination with a percentile scoring system to categorize risk levels. The specific classifications are presented in
Table 10, where risk assessments are defined as ten levels based on fuzzy risk language.
During the scoring process, the experts referred to the threat scenario assessment guidelines in air worthiness certification standard DO-356A. They also drew on their extensive research and practical experience in airborne communication protocols, aviation network architecture design, and information security protection. This allowed them to evaluate the weights of the assessment indicators and the risk levels of the threat scenarios.
The evaluation results of the five experts were aggregated and defuzzified using a
-based opinion aggregation algorithm. Due to space constraints, the aggregation process is illustrated with the scores of the five experts for evaluation criterion
in threat scenario TS5, as shown in
Table 11.
According to the steps in
Figure 3, the evaluation results of the five experts can be aggregated using
. The comprehensive fuzzy number for TS5 under
is
. After defuzzification, the aggregate score is 63.38. Repeating this aggregation method for all experts’ results yields the final aggregated scores for each threat scenario based on the risk assessment criteria. These scores, rounded to the nearest integer, are presented in
Table 12.
3.2.3. Risk Ranking Based on the CRITIC-TOPSIS
The evaluation matrix was constructed using the scores from
Table 12. Following data normalization, the CRITIC weights for risk assessment indicators were computed using the CRITIC method. The results are summarized in
Table 13.
This study develops an index system based on four primary criteria for airborne network information security risk assessment. The CRITIC method is employed to calculate the weights. Results from
Table 13 indicate that threat conditions are the highest weight among the criteria layer, followed by assets, vulnerabilities, and security measures. An analysis of these four components is as follows:
Vulnerabilities: and have the lowest weights among the 16 evaluation indicators, and has a higher weight than these two, indicating that is the top priority risk factor in vulnerability assessment.
Security measures: only is considered, which mainly assesses the effectiveness of existing security measures, not the key factors that directly affect the occurrence of threats; thus, its weight is relatively small.
Assets: , , and increase in weight in turn. For airborne network security assets, availability is especially important.
Threat conditions: the weights of the indicators are much higher than those of other levels. In particular, and have extremely high weights, which emphasizes that these threat conditions may pose significant threats to the security of airborne networks. Indicators such as and are also crucial, but their impacts are relatively small compared with those of other threats.
The CRITIC weights of the 16 evaluation indicators in
Table 13 are integrated into the decision-making matrix. The TOPSIS method is then applied to calculate the PIS and NIS, as well as the distances between each threat scenario and these reference points. The closeness to the ideal solution is subsequently determined. Scenarios exhibiting smaller positive distances and larger negative distances from the ideal solution signify lower risks, while the converse indicates higher risks. Therefore, threat scenarios are ranked according to their proximity to the ideal solution, with the CRITIC-TOPSIS assessment ranking results presented in
Table 14.
Based on the ranking results of the threat scenarios, TS4 is the most significant. In this scenario, attackers exploit vulnerabilities in packet filtering or rate limiting of the aircraft gateway, launching DoS attacks on the airborne network or tampering with aircraft network services, directly threatening the core assets of the airborne network and impacting the flight safety of civil aircraft.
4. Comparison Analysis
To address the construction of the airborne network risk assessment index system, the threat scenario assessment results of the original airborne network risk assessment index system [
17] are compared with those of the improved index system, which integrates the STPA-Sec method discussed in this paper. The same expert panel was invited for scoring, with the CRITIC-TOPSIS method employed for assessment. The comparative assessment results are illustrated in
Figure 8.
As depicted in
Figure 8, the original index system ranks threat scenarios as TS6 > TS4 > TS3 > TS2 > TS5 > TS1, which is consistent with the results obtained using the method in this study. Differences primarily arise in the ranking of TS4 and TS6. TS4’s main threats include denial of service attacks and tampering with aircraft network services, whereas TS6’s principal threat pertains to hijacking maintenance services on the aircraft network. In the context of airborne network information security, denial attacks may disrupt operations; however, pilots can manage such situations through contingency plans. Tampering with aircraft network services may invalidate specific communication commands issued to pilots, while hijacking maintenance services may obstruct fault information from reaching pilots. Following discussions with experts, it is agreed that although TS6’s hijacking threat possesses a higher impact, TS4’s dual threats may lead to cascading consequences. Thus, characterizing TS4’s risk as higher than that of TS6 is deemed more appropriate. This highlights the significance of refining threat-related indicators within the evaluation index system for assessing risks associated with threat scenarios.
To verify the effectiveness and feasibility of our proposed information security risk assessment model, we conducted a closeness degree comparison analysis with several other methods discussed in the introduction. As illustrated in
Figure 9, the ranking trend of threat scenarios identified by this method aligns with that of other evaluation methods. Scenarios TS4 and TS6 present the highest risks, as they are related to aircraft networks and related services, thereby posing significant flight safety risks. In contrast, TS2, which pertains to the open cabin network and excludes core aircraft network assets, presents fewer safety concerns. Scenarios TS1, TS3, and TS5, associated with the maintenance network, are less accessible to passengers and less likely to be targeted by authorized maintenance personnel; thus, they are ranked in the middle, consistent with actual conditions. This supports the accuracy of our method in identifying risks across various threat scenarios.
The proposed method also demonstrates ranking differentiation due to its capacity to objectively calculate indicator weights through the CRITIC method, thereby enhancing objectivity and accuracy. In
Figure 9, CRITIC-TOPSIS reveals higher closeness degrees across multiple threat scenarios, particularly in TS1, TS4, and TS5. This suggests it provides more precise and reliable risk assessment results for specific threat scenarios. Compared to other methods, its curve exhibits smaller fluctuations, reflecting more stable evaluation results that are less influenced by scenario changes. Overall, the improved STPA-TOPSIS method shows significant advantages in terms of accuracy and stability in risk assessment.
Figure 10 and
Table 15 compare different methods. The similar trends show that our method is reliable and effective for risk assessment, offering decision-makers more accurate and credible results for wiser decisions.
From the comparative experiments in three ways, TS2 consistently has the lowest risk ranking, while TS4 and TS6 have the highest. This aligns with other methods, proving the consistency and validity of our approach.
5. Conclusions and Future Work
This article presents an information security risk assessment method based on an improved STPA-TOPSIS framework, specifically addressing the characteristics of airborne networks, and analyzes it using a simplified airborne network system as an example. The following conclusions have been drawn:
First, the STPA-Sec method identifies unsafe control behaviors and derives threat conditions for airborne network components, establishing the foundation for the subsequent risk assessment index system.
Second, the risk assessment model based on the TOPSIS method can intuitively calculate and rank the risks of various threat scenarios within the airborne network. The results indicate that the TS4 threat scenario, which has the strongest correlation with the aircraft network, presents the highest level of risk.
During the assessment, the index system is developed in accordance with national standards for information security risk assessment. This system considers four aspects: assets, threat conditions, vulnerabilities, and security measures. To balance the subjectivity of expert decisions with the objectivity of assessment data, this paper employs the CRITIC method to determine the weights of assessment indicators, enabling a comprehensive assessment of airborne network security risks. Comparative analysis demonstrates that the improved STPA-TOPSIS method is effective in evaluating airborne network information security risks.
The confidentiality of typical airborne network systems and data prevents the disclosure of detailed architecture and complexity in this paper. Consequently, the risk assessment and method validation were based on the simplified airborne network model from DO-356A. To further advance this research, the research team plans to develop an airborne network penetration testing simulation platform. This platform will be used to simulate airborne network architectures and communication data, enabling more in-depth research in this area.
The future research directions of this paper focus on information security assessment methods for airborne networks across multiple flight phases and real-time dynamic threat detection methods. For the former, the research team will combine the methods proposed in this paper with a focus on the operational status of network components and external threats during different flight phases to provide support for subsequent protective measures. For the latter, the team plans to build a penetration-testing simulation platform for airborne networks. By using real-time dynamic network traffic and device status data from aircraft operations, the team will conduct dynamic risk assessments and real-time threat detection research.


