Abstract
The design of heat and drag reduction systems for hypersonic vehicles has garnered widespread global attention. In this study, the Navier–Stokes equations and the SST k-ω turbulence model are employed to establish a simulation model for heat and drag reduction induced by a forward-facing cavity. The numerical methods are validated using existing experimental results. The oscillation characteristics of the bow shock wave at the head and the shock inside the cavity in hypersonic flows are investigated. The heat and drag reduction mechanisms of the forward-facing cavity are discussed. The effects of the diameter and depth of the cavity on drag and heat reduction are comprehensively analyzed. The obtained results show that a reduction in drag and heat is achieved when a forward-facing cavity is added to the vehicle. The main reasons for this heat reduction are the cold ring mechanism and the energy conversion mechanism. The size of the cold ring is significantly affected by the cavity diameter, whereas the energy conversion mechanism is more sensitive to variations in diameter. The maximum reduction in heat load is 2.2%, and the maximum reduction in the Stanton number is 25.3%. Increases in both diameter and depth enhance drag reduction, achieving an average drag reduction of approximately 1.65%.
1. Introduction
Hypersonic vehicles generally refer to aircraft, missiles, and winged or wingless vehicles with a speed exceeding Mach 5, which have advantages such as higher speeds and enhanced penetration capabilities. They have significant potential for development and application in both the military and civilian sectors. In recent years, they have garnered widespread attention from countries around the world [1,2,3].
During the cruising phase of hypersonic vehicles, shock wave drag is generated at the head of the vehicle, which can account for more than 50% of the total drag. This proportion increases as the incoming Mach number rises, significantly affecting the aerodynamic performance of the vehicle and resulting in higher fuel consumption [4]. One study found that a roughly 1% reduction in drag can lead to a 10% increase in the effective payload or range of a vehicle [5]. Due to the viscous drag of gas, the heat flux at the surface of the vehicle increases, causing a rise in surface temperature and exposing the head to the risk of ablation [6,7,8]. Consequently, designing drag and heat reduction mechanisms for hypersonic vehicles has faced formidable challenges in engineering applications.
In summary, the shock wave at the head of a vehicle is the primary cause of immense aerodynamic force and severe aerodynamic heating [9]. Therefore, aerodynamic heat and aerodynamic forces can be reduced by controlling the strength and structure of the head shock wave. Based on this theory, numerous drag reduction and thermal protection technologies have been proposed, primarily by designing specific structures or injecting cooling fluids into high-temperature regions to alter the flow field structure. These technologies include forward-facing cavities [10,11,12,13], spikes [14,15,16,17], opposing jets [18,19,20], energy deposition [21,22,23], and various combinations of these technologies [24,25,26,27,28,29,30]. Among them, opposing jet and energy deposition technologies have relatively complex structures and require additional gas bottles or energy sources, which significantly affect the effective payload of the vehicle. Although the spike design avoids the ablation of the head of the vehicle, the spike itself experiences severe ablation, which negatively impacts its effectiveness [4]. Establishing a forward-facing cavity at the head of the vehicle is the simplest way to reduce drag and heat load. It offers unique advantages that cannot be replaced by other technologies. Hartmann et al. were the first to propose the application of cavity structures to supersonic flow fields. Initially, these structures were employed as sound generators, rather than for thermal protection [31]. Yuceil et al. investigated the surface temperature of a hemispherical blunt body with a nasal cavity in a Mach 4.9 flow using thermal imaging. Their results showed that a shallow cavity with a larger diameter significantly lowered the temperature near the lip of the cavity [32]. Ladoon et al. further explored the effects of cavity depth through experiments. The results indicated that free noise is the primary cause of pressure oscillations in shallow cavities [33]. Engblom et al. proposed a circular lip cavity scheme. Their experiments demonstrated that a deep cavity with circular lips causes more intense shock wave oscillations, resulting in better cooling effects [34]. Saravanan et al. applied a forward-facing cavity to blunt-headed supersonic missiles and conducted wind tunnel tests. The oscillating motion of the bow shock wave and cold rings could be clearly observed using schlieren flow visualization technology. Their results indicated that smaller cavities have the highest lift-to-drag ratio, while medium cavities have the highest heat reduction efficiency [12]. Lu et al. studied the effects of windward cavity size on the aerodynamic heating of hypersonic aircraft heads by using CFD methods. Their research results indicated that the cavity has a significant heat reduction effect on the stagnation area. The deeper the cavity, the lower the heat flux density [35]. Rajesh Yadav et al. investigated the effects of parabolic cavities on the heat flux of a spherical blunt body. Their research results indicated that this type of cavity effectively reduces aerodynamic heating without significantly reducing the volume of the nasal cone [36]. Amanda Chou et al. studied the damping characteristics of cavities with a ratio of length to diameter of less than 1.2 by using a free-flow laser to induce flow field disturbances in the cavity. The results showed that the damping characteristics of the cavity seem to depend on the dimensionless depth of the cavity but are unaffected by stagnation pressure, stagnation temperature, and Mach number [37]. In summary, current research mainly focuses on the influence of cavity size and cavity shape on aerodynamic heating.
In particular, simulation studies often assume that the flow field induced by a forward-facing cavity is steady-state. However, forward-facing cavities often induce flow field oscillations, leading to constant changes in the aerodynamic forces and aerodynamic heating to which the vehicle is subjected. Thus, there are deficiencies in the understanding of the heat reduction and drag reduction mechanisms induced by a forward-facing cavity, and further exploration is needed to fully elucidate these mechanisms.
In this study, the heat and drag reduction effects induced by a forward-facing cavity in hypersonic flow are numerically investigated using the commercial software ANSYS FLUENT 2022. The oscillation characteristics of the shock waves within the cavity and the bow shock wave at the head of the vehicle are investigated. The mechanisms of drag and heat reduction are further analyzed. On this basis, the influence of cavity depth and diameter on drag and heat reduction is discussed. The remainder of this paper is organized as follows. In Section 2, the physical model and numerical method are described, and the effectiveness of numerical methods and grids is verified. In Section 3, the forward-facing cavity flow field is investigated; the mechanisms of drag reduction and heat reduction are further examined; and the impact of cavity diameter and depth on the efficiency of drag and heat reduction is analyzed. Finally, some conclusions are presented in Section 4.
2. Physical Model and Numerical Methods
2.1. Physical Model
The hypersonic blunt body used in this study is based on the geometric shape described in Ref. [12], with a length of 40.6 mm and a radius of 25.5 mm. The radius of the blunt region is 15 mm, and the cone angle is 20.5°. The spherical region is marked with red and the conical region with blue. The model is shown in Figure 1, with the initial stagnation point of the blunt body defined as the coordinate origin. A forward-facing cavity is introduced at the head of the blunt body to investigate drag and heat reduction. The cavity diameter (D) is 12 mm, and the cavity depth (L) is 18 mm.
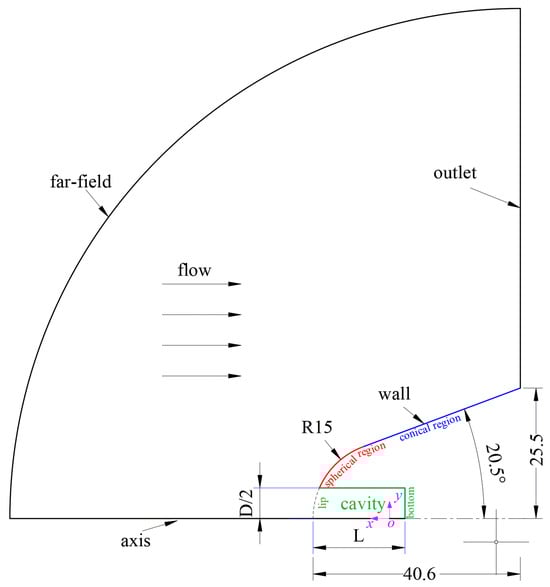
Figure 1.
The geometry of the numerical model.
For the calculations, typical flight conditions of a hypersonic vehicle are used as the incoming flow conditions. The flight altitude is 25 km, and the flight speed is Mach 5. Air flows from left to right, with the inlet boundary set as a pressure far-field and the outlet boundary set as a pressure outlet. The flow field is filled with freestream flow, and the gas is assumed to be an ideal gas. In this study, the temperature rise on the surface of the model is relatively low because the calculation condition lasts for milliseconds. The variation in wall surface temperature in the simulation timescale is ignored in this study. Therefore, the wall surface has a no-slip isothermal wall boundary [12,24,29]. The specific parameters for these conditions are listed in Table 1.

Table 1.
Freestream flow conditions.
2.2. Numerical Approach
Due to the two-dimensional simplification of the axisymmetry of the blunt body, the flow field can be described by the axisymmetry Navier–Stokes equations in two dimensions. The governing equations are as follows.
The vector expressions in this equation are as follows:
where ρ is density; u and v are velocity components; E is the total energy per unit mass; p is pressure; τxx, τxr, and τrr are the components of the viscous stress tensor; H is the total enthalpy per unit mass; and qx and qr are the components of the total heat flux in the x and r directions.
According to recommendations from the published literature, the SST k−ω turbulence model has been widely and successfully applied to predict flow separation and heat flux calculation in supersonic flows. Therefore, the SST k−ω model is adopted in this study. Its governing equations are as follows:
where k and ω represent the turbulent kinetic energy and specific dissipation rate, respectively. Gk is the turbulent kinetic energy generated by the mean velocity gradient. Gω is the turbulent kinetic energy generated by ω. μ is the viscosity coefficient; μt is the turbulent viscosity coefficient. Yk and Yω are the effects of compressible energy on turbulence for different flow states. Dω is the cross-diffusion term.
The environment of the hypersonic vehicle is complex, including the aerodynamic heat transfer of high-temperature airflow, the heat radiated from the surface of the vehicle, the flight flow absorbed by direct solar heat radiation, the heat absorbed by earth surface radiation, and the thermal diffusion of the multi-crew gas mixture in the boundary layer. Palmer et al. studied the aerodynamic thermal correlation of FIRR II at different trajectory points and compared the effects of radiation and no radiation on the results [38]. Du et al. conducted a similar study on FIRR II [39]. Their results show that radiative heat transfer has little effect on heat flow during this process. When the flight velocity of the aircraft exceeds 9 km/s, radiative heat transfer becomes important, and the peak of radiative heat transfer generally occurs at an altitude of 60 km [40]. The incoming flow Mach number in this study is 5, which is relatively low. In references [26,30], only the influence of convective heat transfer on the hypersonic vehicle was considered in the design of a drag reduction and heat protection system. And the forward-facing cavity scheme mainly affects the convective heat transfer of the blunt body. Therefore, in this study, it is reasonable to ignore the influence of radiation heat transfer on the heat load of the vehicle.
The hypersonic flow field around the forward-facing cavity was solved using the commercial solver FLUENT 2022. The simulation was performed on a workstation equipped with a dual-channel Intel Xeon Platinum 8368 processor (76 cores/152 threads, 2.6 GHz; Intel, Santa Clara, CA, USA) and an NVIDIA GeForce RTX 4080 graphics card (16 GB GDDR6X memory; NVIDIA, Santa Clara, CA, USA). A double-precision solver was used, with the flux type set to AUMS. Spatial discretization was performed using a second-order upwind scheme. The time step was set to 1 × 10⁻⁸ s, with a maximum of 20 iterations per time step.
2.3. Numerical Approach Validation
The accuracy of the numerical method in this study was validated through wind tunnel experiments conducted by Saravanan et al. [12]. A forward-facing cavity, with a length of 24 mm and a diameter of 12 mm, was placed at the head of the experimental model. The wind tunnel boundary conditions are provided in Table 2. The oscillation distance of the bow shock and the wall heat flux from the numerical results are compared with the experimental results. Figure 2 shows the pressure contours of the flow field at the moments when the bow shock reaches its furthest and closest positions. Further, the pressure distribution on the axis at the corresponding moments are shown in Figure 3. It can be seen that the maximum position of the bow shock is −17.28 mm, the minimum position is −16.69 mm, and the oscillation amplitude is 0.59 mm. The oscillation amplitude of the shock wave in the experiment is 0.615 mm. It is evident that the simulation results agree well with the experimental data. This indicates that the numerical method used in this study is able to accurately capture the oscillatory effects of the forward-facing cavity on the bow shock wave.
Table 2.
Test conditions achieved in HSTT2 hypersonic shock tunnel.
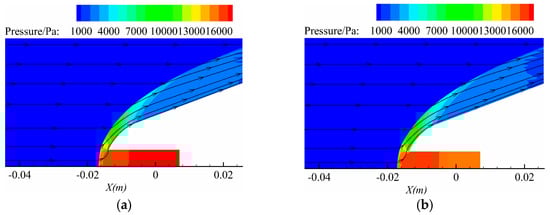
Figure 2.
Results of CFD calculations: (a) pressure cloud map at minimum shock wave position and (b) pressure cloud map at maximum shock wave position.
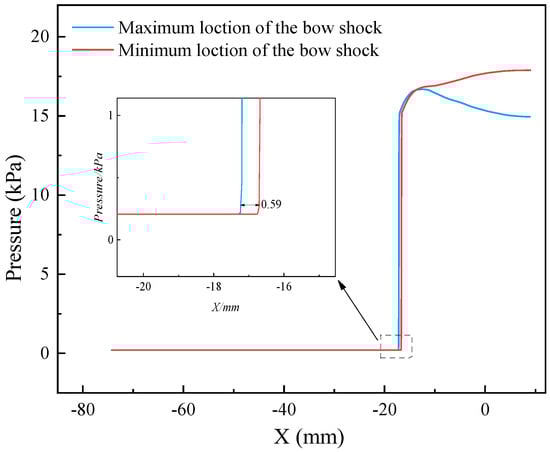
Figure 3.
The pressure distribution along the cavity axis.
The heat flux density distribution is presented by the Stanton number, which is defined as the following.
where qw is the surface heat flux; Taw is the adiabatic wall temperature; Tw is the wall temperature; and ρ∞, u∞, T∞, and M∞ are the freestream density, velocity, temperature, and Mach number. Pr is the Prandtl number, cp∞ is the specific heat, and γ is the ratio of specific heats.
Figure 4 shows a comparison of the Stanton number distribution along the blunt body surface. The numerical results show good agreement with the experimental data, with the observed difference likely being due to the two-dimensional assumption. Therefore, the numerical method used in this study to calculate heat flux is reliable.
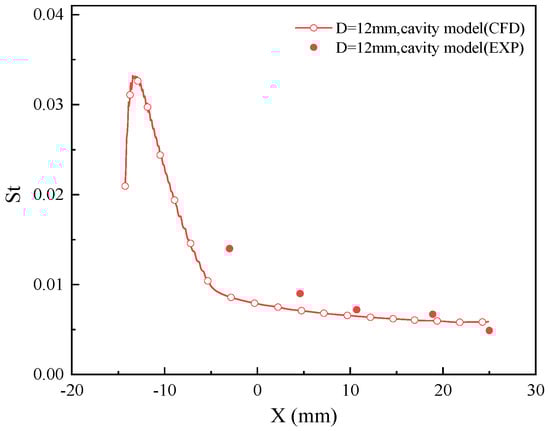
Figure 4.
A comparison of the Stanton number distribution along the blunt body surface.
2.4. Grid Independence
As is well known, the proper arrangement of mesh nodes is crucial in numerical simulations, and the normal dimension of the first-layer mesh near the wall has a significant impact on heat flux calculations. This is especially important for the SST k−ω turbulence model, which requires the wall y+ value to be less than 1 for accurate results. In this study, multiple structured meshes are generated to discretize the geometry, with the number of cells being 257,869, as shown in Figure 5. Three different first-layer wall mesh heights were selected for analysis, and the details of the meshes are provided in Table 3, and Figure 6 displays the distribution of wall y+ values for different first-layer mesh heights. It can be observed that for the moderate and refined meshes, the wall y+ values are below 1.
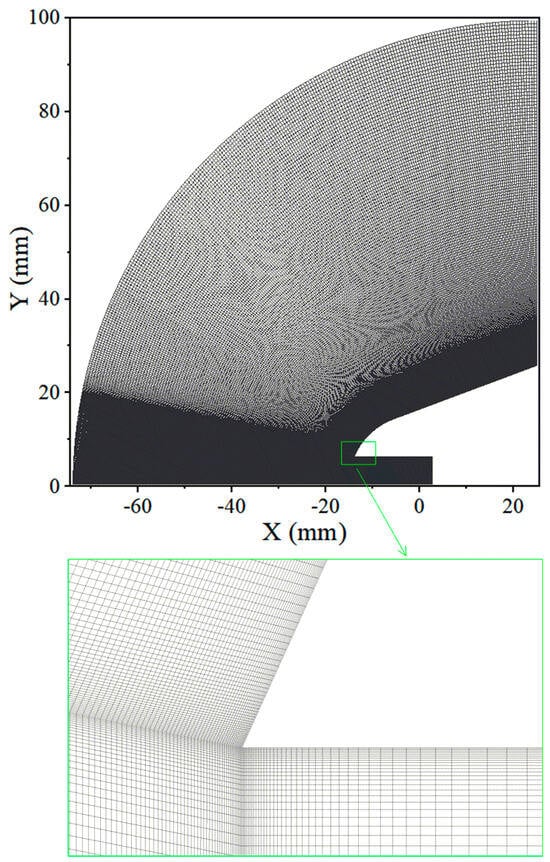
Figure 5.
Computational grids (number of cells = 257,869).
Table 3.
Details of three different grids.
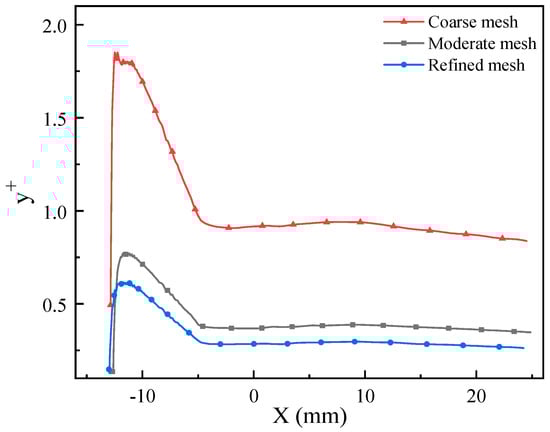
Figure 6.
Comparison of y+ values along blunt body surface.
Figure 7 shows the distribution of the Stanton number along the blunt body surface with different meshes. It can be observed that the Stanton numbers for the three grid types are nearly identical on the wall of the conical region, while significant differences are seen in the spherical region for the coarse grid. A comparison of the drag coefficient with different meshes is shown in Figure 8. The results indicate that the three grid types have a minimal impact on aerodynamic forces. Considering the computational resources used, the moderate mesh is selected for the simulations in this study.
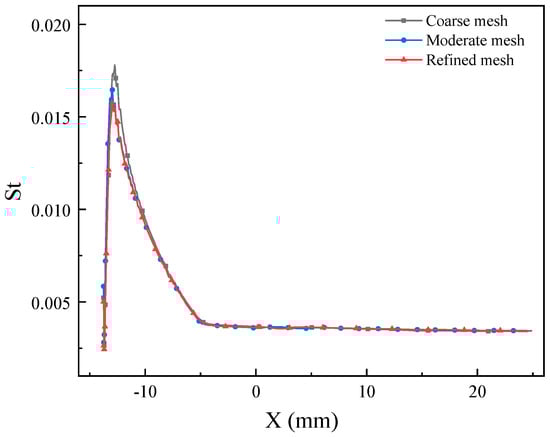
Figure 7.
Distribution of Stanton number along blunt body surface.
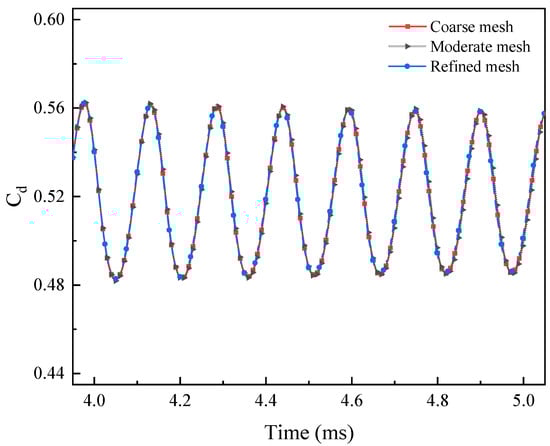
Figure 8.
Comparison of drag coefficient with different meshes.
3. Results and Discussion
First, the flow features induced by the forward-facing cavity were numerically investigated and discussed. Then, the mechanisms of drag and heat reduction were illustrated. Finally, the influences of cavity diameter and depth on the flow field, drag reduction, and heat reduction were investigated.
3.1. Features of Flow Field
Figure 9 illustrates the variation in pressure contours and streamlines over time under forward-facing cavity control. The period from 0/10 T to 5/10 T corresponds to the stage when the bow shock wave moves away from the wall. From 0/10 T to 2/10 T, compression waves form in the cavity as external airflow enters. These waves propagate along the axis, gradually increasing the cavity pressure and slightly pushing the bow shock forward. At t = 2/10 T, the compression wave intensity peaks, and a swirling flow forms within the cavity, with the flow direction nearly reversing. As shown in Figure 10, the pressure gradient inside the cavity reaches its maximum, and the pressure at the bottom is 1.23 times the pressure at the cavity lip. From 3/10 T to 5/10 T, the airflow inside the cavity moves from right to left, interacting with the bow shock wave, which is slightly pushed away from the wall. The pressure inside the cavity begins to decrease. At t = 5/10 T, the bow shock intensity stabilizes, with the oscillation distance of the bow shock wave being the largest.
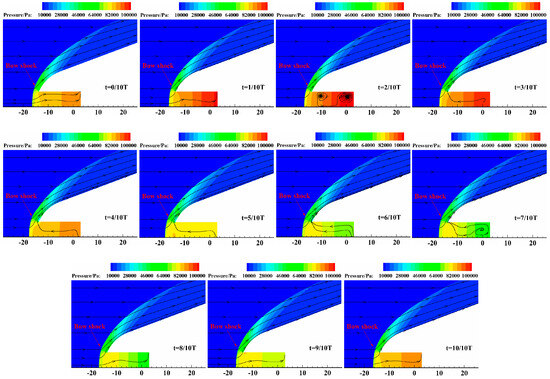
Figure 9.
Variation in pressure contours and streamlines with time.
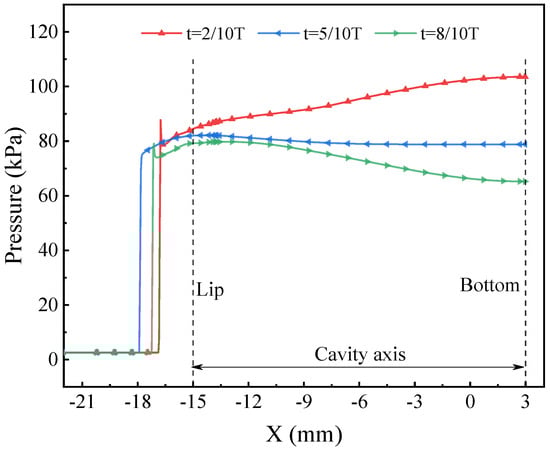
Figure 10.
Distribution of pressure along blunt body axis.
Between 5/10 T and 10/10 T, the bow shock wave gradually moves toward the wall of the blunt body. From 5/10 T to 8/10 T, due to the inertia of the gas, the airflow inside the cavity continues to move toward the exit. During this period, the pressure distribution inside the cavity shows that the pressure at the cavity lip is higher than that at the cavity bottom. At t = 8/10 T, the pressure at the bottom reaches its minimum, being 0.82 times the pressure at the lip. Then, from 8/10 T to 10/10 T, under the influence of low pressure inside the cavity and hypersonic incoming flow, the airflow rapidly fills the cavity, and the bow shock wave quickly approach the wall. The pressure inside the cavity gradually increases during this stage.
Figure 11 illustrates the variation in the bow shock wave standoff distance with time. It can be observed that the standoff distance of the bow shock wave first increases and then decreases within one cycle. The maximum standoff distance of the bow shock wave is −17.73 mm, the minimum standoff distance is −16.3 mm, and the shock wave oscillation amplitude is 1.43 mm. The time taken for the shock wave to move away from and approach the wall of the aircraft is nearly identical.
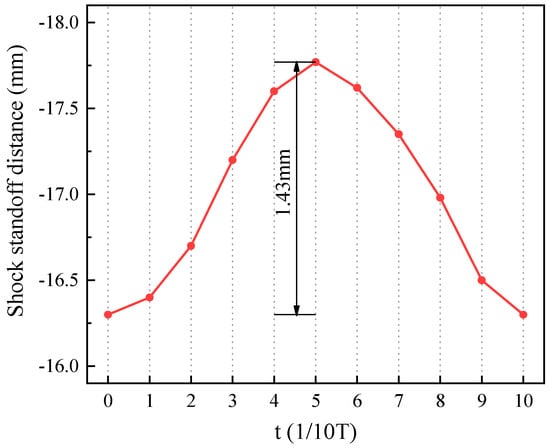
Figure 11.
Variation in bow shock wave standoff distance with time.
The drag of the blunt body consists of two components: surface drag and cavity drag. Due to the oscillation of bow shock waves and compression waves within the cavity, both drag coefficient components exhibit corresponding variations. Figure 12 shows the variation in these drag coefficients with time. It can be seen that the cavity drag coefficient is smaller than the surface drag of the blunt body, with the cavity drag coefficient being approximately 20% of the average surface drag. Both drag coefficient components follow similar oscillatory patterns, though their peak times differ. The peak of the cavity drag coefficient occurs at t = 2/10 T, when the airflow direction in the cavity transitions from the bottom to the lip. At this moment, the pressure at the bottom of the cavity reaches its maximum, with the maximum cavity drag coefficient being 0.127. At t = 7/10 T, the cavity drag coefficient reaches its minimum value of 0.08, as the external airflow begins to backfill due to the low pressure inside the cavity. Comparing this with Figure 11, the variation in the surface drag coefficient is closely linked to the motion of the bow shock wave. As the bow shock moves away from the wall, the surface drag coefficient decreases, and when the shock moves closer, the surface drag coefficient increases. Around t = 5/10 T, the surface drag coefficient reaches its minimum value of 0.484.
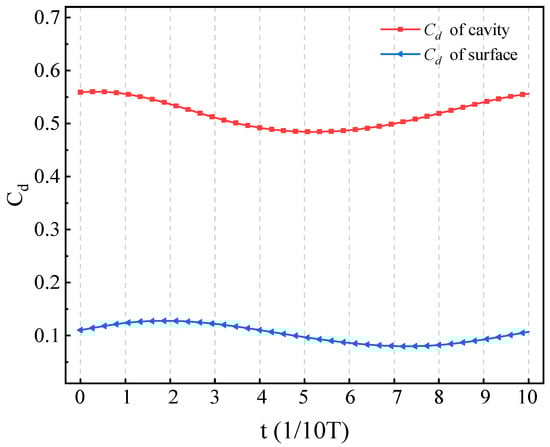
Figure 12.
Variation in drag coefficient of cavity and surface with time.
Figure 13 illustrates the pressure distribution along the blunt body surface at different times. It shows that the presence of a forward-facing cavity effectively reduces the surface pressure in the spherical area of the blunt body, especially near the lip where the pressure decreases significantly. This is primarily due to the oscillation of the bow shock wave, which creates a low-pressure swirling region near the lip. As the bow shock wave moves further from the wall, the low-pressure swirling area expands, resulting in a greater reduction in pressure near the cavity lip. However, at t = 1/10 T, in the range of X between −11 mm and −5 mm, the wall pressure is slightly higher than that in the baseline case, which is due to the overcharge phenomenon. As shown in Figure 9, it can be seen that although the pressure inside the cavity is already greater than the lip pressure at this time, under the action of the kinetic energy of the airflow, the airflow still flows from the lip direction to the bottom, which inevitably causes the bow shock wave to be slightly closer to the wall, resulting in a slight increase in pressure in this area. From t = 3/10 T to t = 5/10 T, the bow shock wave moves away from the surface of the blunt body, and the pressure distribution on the surface of the spherical region decreases significantly. However, the cavity has a significant control effect on the shock wave in the spherical region of the vehicle, but its influence on the shock waves in the conical region is relatively weak. The peak surface pressure occurs at the shock reattachment point downstream of the swirling region, and the maximum decrease in surface pressure peak is 61.2%.
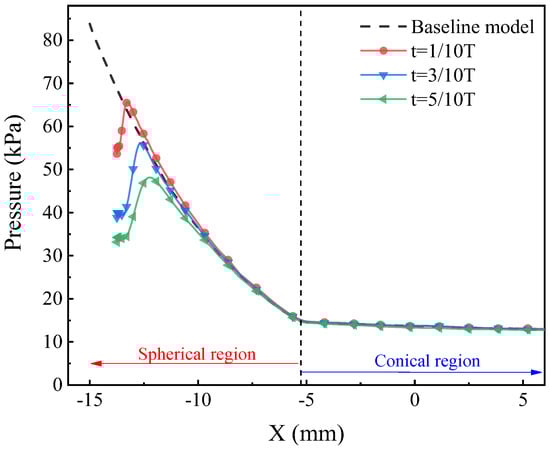
Figure 13.
Surface pressure distribution along blunt body surface at different times.
To describe the drag reduction in the forward-facing cavity, the average drag reduction ΔCd is defined as shown in the following equation.
where Cd0 is the drag coefficient of the baseline model.
Figure 14 depicts the variation in the normalized heat load on the blunt body surface over time. It can be observed that the presence of the cavity causes noticeable fluctuations in the heat load. The fluctuation trend in heat load is increasing and then decreasing, exhibiting a significant bimodal effect. The first low peak appears around 5/10 T, and the second low peak occurs between 7/10 T and 8/10 T. To explain the cause of the bimodal phenomenon, the enthalpy contours and velocity vectors near the cavity at the moments of 5/10 T and 8/10 T are provided in Figure 15. According to the enthalpy contours, the mechanism of heat flux reduction for the blunt body can be identified. The first type of heat load reduction mechanism is the cold ring mechanism. Due to the oscillatory motion of shock waves, the swirling airflow near the concave lip forms a “cold ring”, which significantly reduces the heat flux near the lip. The second heat reduction mechanism is the energy conversion mechanism. As gas begins to fill the cavity, energy exchange occurs near the lip area of the cavity, and some of the internal energy is converted into the kinetic energy of the gas movement inside the cavity. The enthalpy near the lip decreases, which further contributes to a reduction in the heat load. The cold ring and energy conversion mechanisms are mutually transformed throughout the entire heat reduction process.
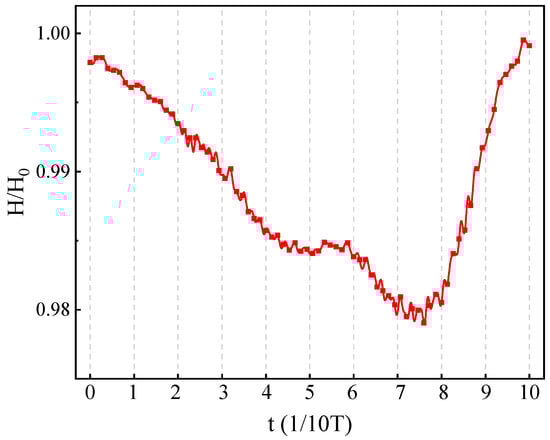
Figure 14.
Variation in normalized heat load of blunt body surface with time.
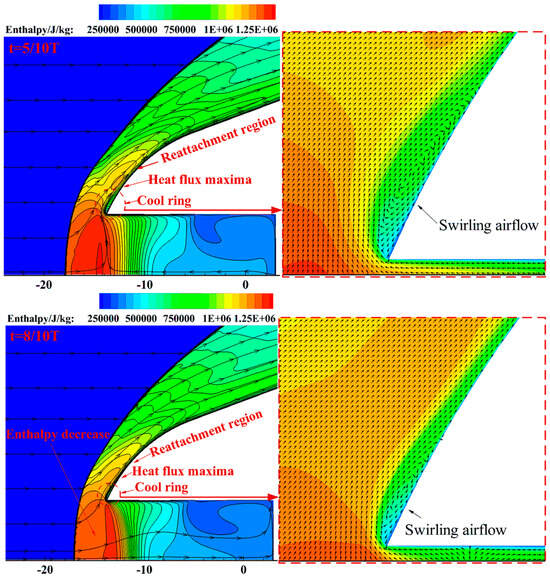
Figure 15.
Enthalpy contours and vectors at different moments.
Figure 16 shows the distribution of the Stanton number along the blunt body surface at t = 5/10 T and t = 8/10 T. It can be seen that compared with the baseline model, under the influence of the cold ring mechanism, the Stanton number in the cavity lip region decreases significantly, and in the reattachment shock region, the Stanton number increases significantly. Under the influence of the energy conversion mechanism, the Stanton number in the reattachment shock region at t = 8/10 T is significantly lower than that at t = 5/10 T.
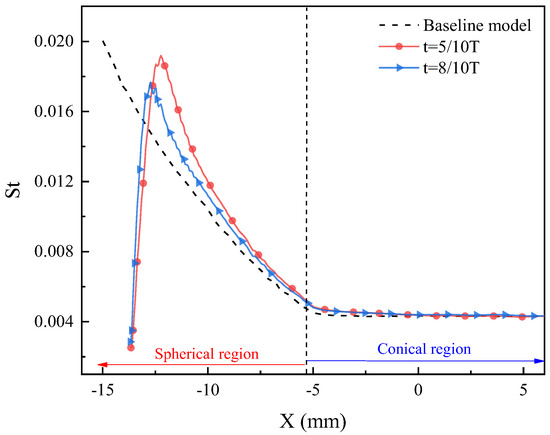
Figure 16.
The Stanton number distributions along the blunt body surface at different times.
In order to analyze the overall effects of heat reduction, the maximum Stanton number ΔStmax and the heat load ΔH are calculated as follows:
where St0_max is the maximum Stanton number of the wall surface of the baseline model, H0 is the heat load of the wall surface of the baseline model, and S0 is the surface area outside the blunt body. In this case, ΔStmax is 12.9%, and ΔH is 1.75%.
When the hypersonic vehicle is flying at an high altitude, the air density is so low that the mean free path of the particle is of the same order of magnitude as the characteristic length of the vehicle. At this point, air can no longer be considered continuous, and all concepts, equations, and their results based on the assumption of a continuum are invalidated. In order to determine whether the 25 km flow condition used in this paper meets the requirements of the continuity hypothesis, the Knudsen number of the flow field is solved. The Knudsen number is defined as follows:
where λ is the mean free path of the particle, L is the characteristic length of the flow field, kB is the Boltzmann constant, T is the temperature, P is the absolute pressure, and σ is the effective diameter of the particle. In this study, kB is 1.380649 × 10⁻²³ J/K, σ is 3.5 × 10⁻¹⁰ m, and L is 5.1 × 10⁻² m.
Figure 17 shows the Knudsen number contours of the flow field at two typical moments, and it can be seen that the Knudsen number of the flow field is much less than 0.001 [41,42], so it is reasonable to use the continuity hypothesis in this study.
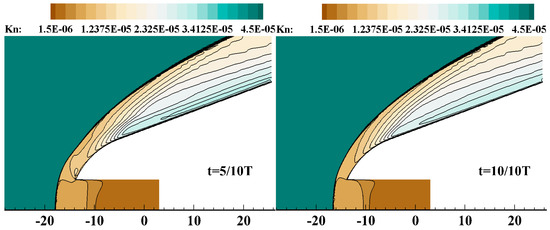
Figure 17.
The Knudsen number contours of the flow field at two typical moments.
3.2. Influence of Cavity Diameter
In this section, five different cavity diameters are considered to investigate the effects of cavity diameter on flow characteristics, drag reduction, and heat reduction, with cavity diameters of 3 mm, 6 mm, 9 mm, 12 mm, and 15 mm. The other parameters are set to be consistent with those in the previous section.
As discussed above, the pressure gradient within the cavity is the primary cause of the oscillation of the bow shock at the head of the blunt body. Figure 18 illustrates the pressure distribution along the cavity axis at the moment when the average pressure in the cavity reaches its maximum for different cavity diameters. It can be seen that as the cavity diameter increases, the pressure gradient within the cavity first increases and then decreases. When the diameter of the cavity is 9 mm, the pressure gradient inside the cavity is the highest, with a bottom pressure of 118.2 kPa and a lip pressure of 86.3 kPa. The pressure at the bottom is about 1.37 times that of the pressure at the lip. When the cavity diameter is too large or too small, it is difficult to generate a significant pressure gradient within the cavity. The maximum and minimum standoff distances of the bow shock wave for different cavity diameters are shown in Figure 19. It can be observed that as the cavity diameter increases, the oscillation amplitude of the bow shock first increases and then decreases. The oscillation amplitude of the bow shock is positively correlated with the maximum pressure gradient that can be generated inside the cavity. When the cavity diameter is 9 mm, the maximum oscillation amplitude reaches 1.62 mm. When the cavity diameter is 3 mm, there is almost no movement of the bow shock wave.
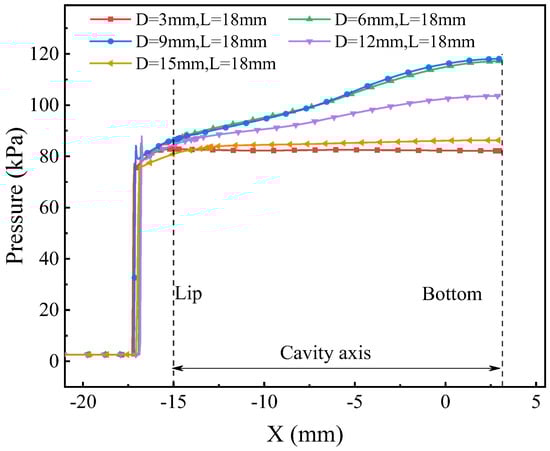
Figure 18.
The pressure distribution of the cavity axis with different cavity diameters.
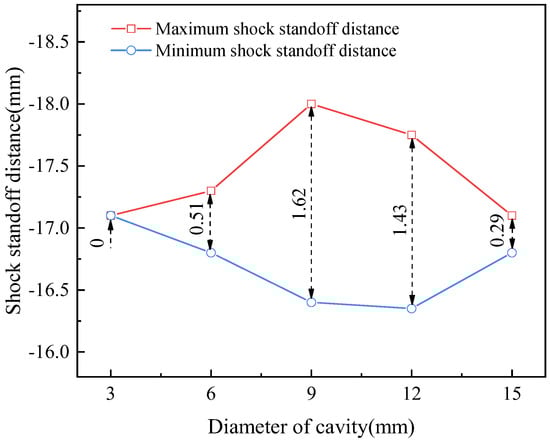
Figure 19.
The maximum and minimum standoff distances of the bow shock for different cavity diameters.
Figure 20 illustrates the variation in the drag coefficient of the blunt body with time for different cavity diameters. It is evident that as the cavity diameter increases, the amplitude of drag fluctuations initially rises and then decreases. When the diameter of the cavity is 12 mm, the fluctuation amplitude of the drag is the largest. On the one hand, the fluctuations in drag are correlated with the oscillation amplitude of the bow shock; a larger amplitude of the bow shock oscillation results in a more pronounced variation in the drag. On the other hand, drag fluctuations are also related to the size of the low-pressure recirculation region. As the cavity diameter increases, the area of the low-pressure recirculation region formed at the cavity lip expands, thereby enhancing the drag reduction effect. The combined influence of these two factors leads to the greatest fluctuation in the drag coefficient when D = 12 mm. Figure 21 displays the variation in the average drag reduction with cavity diameter. It is observed that as the cavity diameter increases, the average drag reduction efficiency improves. When the cavity diameter is 15 mm, the average drag reduction efficiency reaches 1.65%.
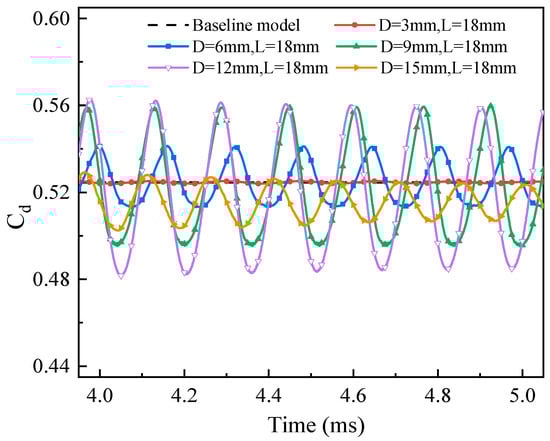
Figure 20.
Variation in drag coefficient with time for different cavity diameters.
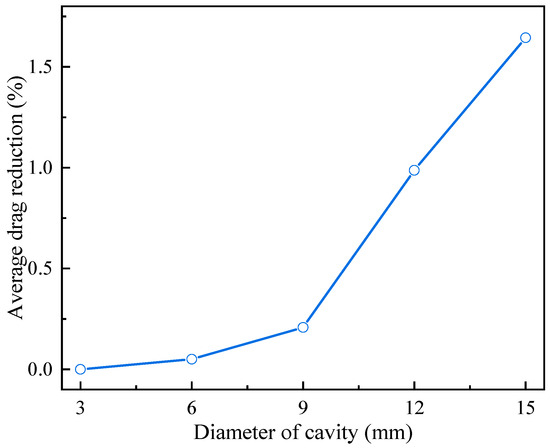
Figure 21.
Variation in average drag reduction with different cavity diameters.
Figure 22 shows the enthalpy contours of the flow field at the moment of the minimum heat load on the blunt body surface for different cavity diameters. It can be seen that the heat load on the bottom of the cavity is relatively low. As the diameter of the cavity increases, more heat energy carried by the flow field is transferred into the cavity. At the same time, the larger the cold ring formed by the low-pressure swirling area at the cavity lip, the more pronounced the cold ring mechanism becomes. When the cavity diameter is 9 mm, the energy conversion mechanism at the cavity lip is the most evident. This is because when the diameter of the cavity is 9 mm, the pressure gradient that can be generated inside the cavity is the largest, resulting in violent oscillations of the shock wave and bow shock wave inside the cavity, and the energy conversion at the lip is more pronounced. Furthermore, Figure 23 depicts the distribution of Stanton numbers along the blunt body surface at the moment of the minimum heat load for different cavity diameters.
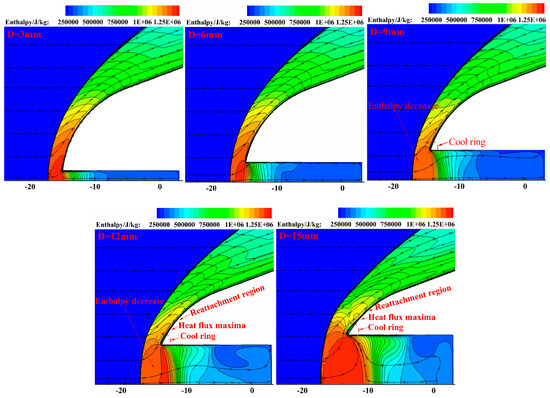
Figure 22.
Comparison of enthalpy contours at moment of minimum heat load for different cavity diameters.
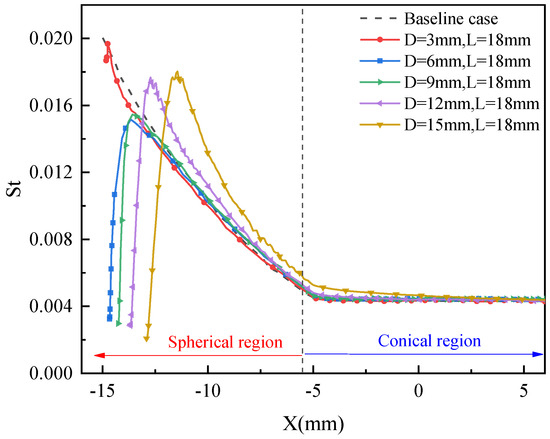
Figure 23.
The Stanton number distributions along the blunt body surface for different cavity diameters.
As can be seen from Figure 23, the peak value of the wall Stanton number shows a trend of first increasing and then decreasing, which is caused by the cold ring formed at the lip. When the diameters are 3 mm, 6 mm, and 8 mm, the Stanton number in the spherical region is smaller than that in the baseline case. However, when the diameters are 12 mm and 15 mm, only the Stanton number near the lip is smaller than that in the baseline case, while the Stanton number in most areas of the spherical region is higher than that in the baseline case. This is mainly due to the influence of the cold ring at the lip on the shock wave in the reattachment region. The larger the cold ring, the stronger the reattachment shock wave downstream of the cold ring, leading to an increase in the Stanton number in the reattachment region.
Figure 24 illustrates the variation in heat load reduction and the maximum Stanton number reduction with cavity diameters. It can be seen that the maximum Stanton number reduction first increases and then decreases. When D = 6 mm, the maximum Stanton number reduction is 25.3%. The main reason for this is that no obvious reattachment shock wave is formed under this condition, and the overall Stanton number is relatively small. The heat load reduction increases with an increase in the cavity diameter. When D = 15 mm, the head load reduction is 2.1%. This is because as the cavity diameter continues to increase, the cold ring phenomenon becomes more pronounced, and the heat reduction effect improves.
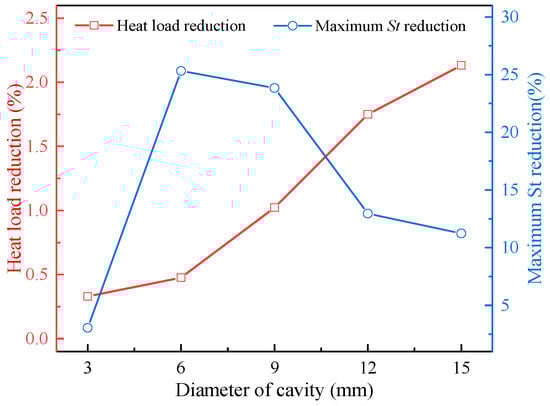
Figure 24.
Variations in heat load and maximum Stanton number reduction with different cavity diameters.
3.3. Influence of Cavity Depth
The influence of cavity depth (L = 9 mm, 12 mm, 15 mm, 18 mm, and 21 mm) on the flow field, drag reduction, and heat reduction is studied in this section.
Figure 25 shows the pressure distribution along the cavity axis for different cavity depths at the moment of the maximum cavity pressure. As the depth of the cavity increases, the pressure inside the cavity rises, and the pressure gradient at the bottom and lip of the cavity also becomes steeper. When the depth of the cavity is 9 mm, the pressure gradient is minimal, and the bottom pressure is 1.02 times the lip pressure. As the depth of the cavity increases, the pressure gradient increases to 1.28 times. The variations in the maximum and minimum standoff distances of the shock wave for different cavity depths are given in Figure 26.
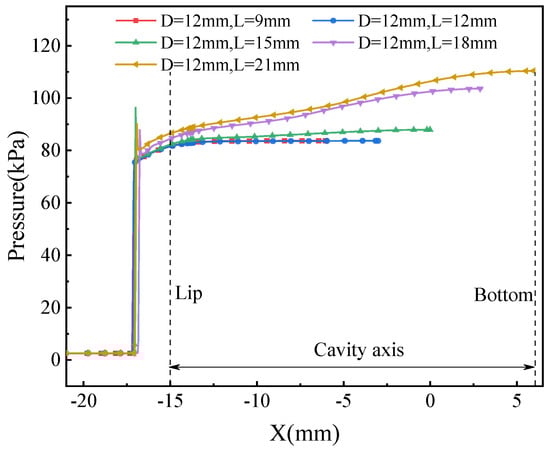
Figure 25.
Pressure distribution along cavity axis for different cavity depths.
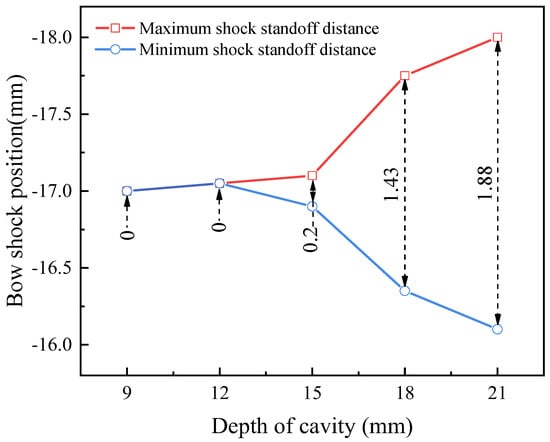
Figure 26.
Variations in maximum and minimum standoff distances of shock wave with cavity depths.
It is clear from Figure 26 that when the depths of the cavity are 9 mm and 12 mm, the bow shock wave does not oscillate significantly. This is because the pressure gradient inside the cavity is too small to induce oscillation. As the cavity depth increases, the oscillation amplitude of the bow shock wave also increases accordingly. At L = 21 mm, the maximum oscillation amplitude is 1.88 mm.
Figure 27 shows the variation in the drag coefficient with time for cavity depths. The fluctuation in the drag coefficient is positively correlated with cavity depth, with a longer cavity depth resulting in a greater amplitude of drag oscillation. Figure 28 illustrates the effects of cavity depths on drag reduction. It is clear that as the cavity depth increases, drag reduction is significantly improved. At a cavity depth of 21 mm, the maximum average drag reduction is 1.46%.
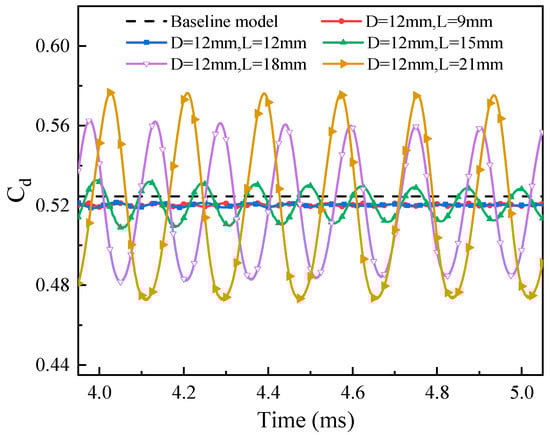
Figure 27.
Variation in drag coefficient with different cavity depths.
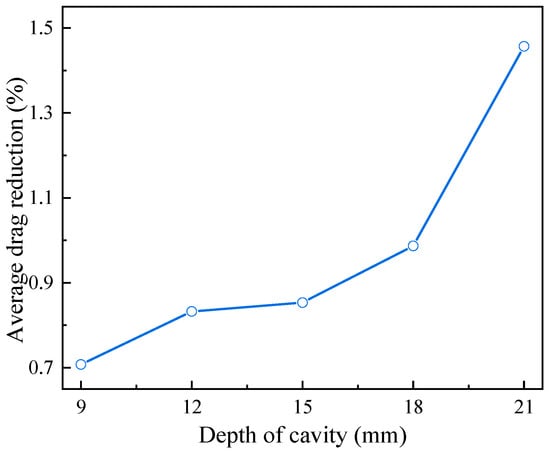
Figure 28.
Variation in average drag reduction with cavity depths.
Figure 29 depicts the enthalpy contours at the lowest moment of heat load for different cavity depths. As shown in Figure 29, when L = 9 mm, 12 mm, and 15 mm, only the cold ring exists at the head of the blunt body, and the enthalpy at the front remains relatively unchanged. When L = 18 mm and 21 mm, both the cold ring and a decrease in enthalpy at the lip of the blunt body are observed. This indicates that the cavity depth significantly affects the heat reduction mechanism. As the cavity depth increases, shock oscillation becomes more pronounced, and the conversion process between the internal energy and kinetic energy of the head airflow is enhanced, resulting in improved heat reduction.
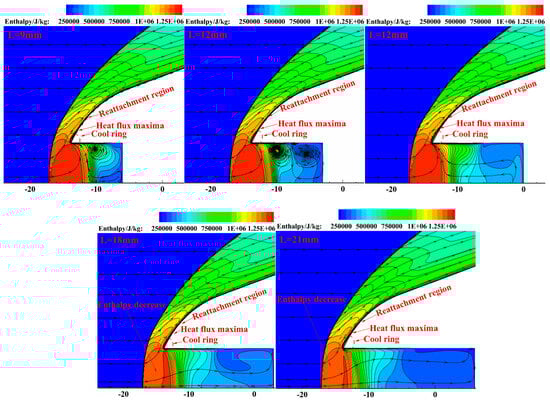
Figure 29.
Comparison of enthalpy contours at moment of minimum heat load for different cavity depths.
Figure 30 shows the Stanton number distribution along the blunt body surface at the moment of the minimum heat load for different cavity depths. It can be observed that the peak position of the Stanton number is generally consistent, located downstream of the cold ring. As the cavity depth increases, the peak Stanton number decreases. The Stanton number at a cavity depth of 18 mm is significantly reduced compared to the 15 mm depth, due to the intensification of shock wave oscillations and the enhancement in energy conversion and heat reduction mechanisms. Additionally, the distribution of Stanton numbers in the reattachment region is higher than that of the baseline case for all cavity depths, primarily due to the formation of distinct reattachment shock waves. Further, the variations in heat load and the maximum Stanton number reduction with different cavity depths are shown in Figure 31.
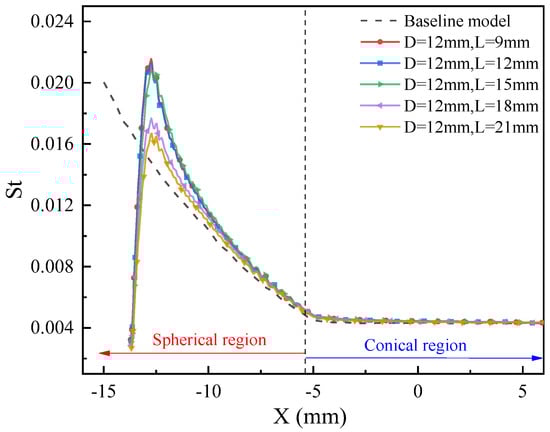
Figure 30.
Comparison of Stanton number distributions along blunt body surface for different cavity depths.
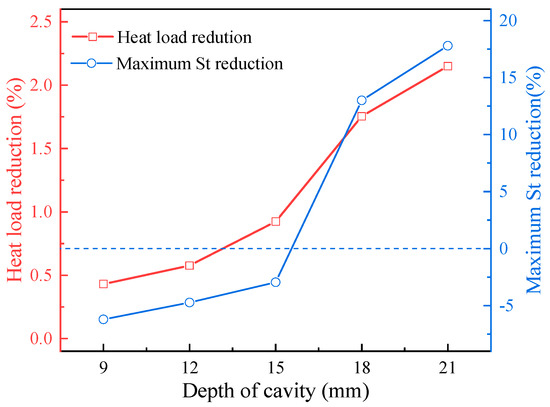
Figure 31.
Variations in heat load and maximum Stanton number reduction with different cavity depths.
As shown in Figure 31, as the cavity depth increases, the heat reduction effect is enhanced. When D = 21 mm, the maximum Stanton number reduction is 17.8%, and the heat load reduction is 2.2%. The main reason for this is the increase in cavity depth, which intensifies the shock wave oscillation caused by the cavity. However, when the cavity depth is less than 15 mm, the maximum Stanton number reduction is negative, which has an adverse effect on heat reduction.
4. Conclusions
In this study, the flow field characteristics of and drag and heat reduction in a forward-facing cavity in hypersonic flow are numerically studied. A detailed investigation of the flow field variations for different cavity depths and diameters is conducted, and the effects on drag and heat reduction are discussed. The main findings of this study are as follows:
The forward-facing cavity can reduce drag in hypersonic flow. The shock oscillations induced by the cavity and the low-pressure recirculation region formed at the cavity lip are the primary causes of this drag reduction. The amplitude of the bow shock oscillation is influenced by the pressure gradient between the cavity lip and the bottom. The size of the low-pressure recirculation region is related to the cavity diameter; the larger the diameter, the greater the area of recirculation. When D = 15 mm and L = 18 mm, the cavity achieves the highest drag reduction of 1.65%.
The amplitude of the shock wave oscillation caused by the forward-facing cavity is related to the size of the cavity. When the diameter and depth of the cavity are too small, they fail to induce shock wave oscillations. When D = 3 mm and L = 18 mm and D = 12 mm and L = 9 mm, the shock wave does not oscillate significantly. When the diameter of the cavity is constant, the amplitude of oscillation increases significantly with increasing depth. When the depth of the cavity is constant, there exists an optimal diameter that maximizes the oscillation amplitude.
The heat reduction mechanisms of the forward-facing cavity involve the cold ring mechanism and the energy conversion mechanism. When the cavity depth is constant, increasing the cavity diameter enhances the cold ring phenomenon, and the energy conversion process is first strengthened and then weakened. However, the cooling effect generated by the cold ring is the main factor, and as the diameter of the cavity increases, the heat load reduction continues to increase. When the diameter is 15 mm, the heat load reduction reaches a maximum of 2.1%. When the cavity diameter is constant, the cold ring changes minimally as the depth of the concave cavity increases. However, the oscillation of the bow shock wave intensifies, the energy conversion process is enhanced, and the heat reduction effect is enhanced.
Author Contributions
Conceptualization, N.D. and J.C.; methodology, N.D.; validation, N.D; formal analysis, N.D.; investigation, J.C.; data curation, N.D.; writing—original draft preparation, N.D and J.L.; writing—review and editing, J.C.; supervision, J.C.; project administration, J.C.; funding acquisition, J.C. All authors have read and agreed to the published version of the manuscript.
Funding
This research was funded by the National Natural Science Foundation of China (grant number 12202408), the Aviation Science Foundation (grant number 2019ZA0U0001) and Key Talent Team for Science and Technology Innovation in Shanxi Province (Grant No. 202204051002023).
Data Availability Statement
Due to privacy restrictions, we cannot share our research data.
Conflicts of Interest
The authors declare no conflicts of interest.
References
- Huang, W.; Chen, Z.; Yan, L.; Yan, B.-B.; Du, Z.-B. Drag and heat flux reduction mechanism induced by the spike and its combinations in supersonic flows: A review. Prog. Aerosp. Sci. 2019, 105, 31–39. [Google Scholar] [CrossRef]
- Sziroczak, D.; Smith, H. A review of design issues specific to hypersonic flight vehicles. Prog. Aerosp. Sci. 2016, 84, 1–28. [Google Scholar] [CrossRef]
- Pezzella, G. Aerodynamic and aerothermodynamic design of Future Launchers Preparatory Program concepts. Aerosp. Sci. Technol. 2012, 23, 233–249. [Google Scholar] [CrossRef]
- Schmisseur, J.D. Hypersonics into the 21st century: A perspective on AFOSR-sponsored research in aerothermodynamics. Prog. Aerosp. Sci. 2015, 72, 3–16. [Google Scholar] [CrossRef]
- Bushnell, D.M. Shock wave drag reduction. Annu. Rev. Fluid Mech. 2004, 28, 81–96. [Google Scholar] [CrossRef]
- Li, S.; Huang, W.; Lei, J.; Wang, Z. Drag and heat reduction mechanism of the porous opposing jet for variable blunt hypersonic vehicles. Int. J. Heat Mass Transf. 2018, 126, 1087–1098. [Google Scholar] [CrossRef]
- Ahmed, M.Y.M.; Qin, N. Recent advances in the aerothermodynamics of spiked hypersonic vehicles. Prog. Aerosp. Sci. 2011, 47, 425–449. [Google Scholar] [CrossRef]
- Chen, F.; Liu, H.; Zhang, S. Coupled heat transfer and thermo-mechanical behavior of hypersonic cylindrical leading edges. Int. J. Heat Mass Transf. 2018, 122, 846–862. [Google Scholar] [CrossRef]
- Tahsini, A.M. Heat release effects on drag reduction in high speed flows. Int. J. Heat Mass Transf. 2013, 57, 657–661. [Google Scholar] [CrossRef]
- Silton, S.I.; Goldstein, D.B. Ablation Onset in Unsteady Hypersonic Flow About Nose Tip with Cavity. J. Thermophys. Heat Transf. 2000, 14, 421–434. [Google Scholar] [CrossRef]
- Engblom, W.A.; Goldstein, D.B.; Ladoon, D.; Schneider, S.P. Fluid Dynamics of Hypersonic Forward-Facing Cavity Flow. J. Spacecr. Rockrts 1997, 34, 437–444. [Google Scholar] [CrossRef]
- Saravanan, S.; Jagadeesh, G.; Reddy, K.P.J. Investigation of Missile-Shaped Body with Forward-Facing Cavity at Mach 8. J. Spacecr. Rockrts 2009, 46, 577–591. [Google Scholar] [CrossRef]
- Yuceil, K.B.; Dolling, D.S. Nose cavity effects on blunt body pressure and temperatures at Mach 5. J. Thermophys. Heat Transf. 1995, 9, 612–619. [Google Scholar] [CrossRef]
- Gerdroodbary, M.B.; Hosseinalipour, S.M. Numerical simulation of hypersonic flow over highly blunted cones with spike. Acta Astronaut. 2010, 67, 180–193. [Google Scholar] [CrossRef]
- Huang, W.; Li, L.Q.; Yan, L.; Zhang, T.T. Drag and heat flux reduction mechanism of blunted cone with aerodisks. Acta Astronaut. 2017, 138, 168–175. [Google Scholar] [CrossRef]
- Yamauchi, M.; Fujii, K.; Higashino, F. Numerical investigation of supersonic flows around a spiked blunt body. J. Spacecr. Rockrts 1995, 32, 32–42. [Google Scholar] [CrossRef]
- Zhong, K.; Yan, C.; Chen, S.S.; Zhang, T.X.; Lou, S.A. Aerodisk effects on drag reduction for hypersonic blunt body with an ellipsoid nose. Aerosp. Sci. Technol. 2019, 86, 599–612. [Google Scholar] [CrossRef]
- Gerdroodbary, M.B.; Bishehsari, S.; Hosseinalipour, S.M.; Sedighi, K. Transient analysis of counterflowing jet over highly blunt cone in hypersonic flow. Acta Astronaut. 2012, 73, 38–48. [Google Scholar] [CrossRef]
- Zhang, R.R.; Huang, W.; Li, L.Q.; Yan, L.; Moradi, R. Drag and heat flux reduction induced by the pulsed counterflowing jet with different periods on a blunt body in supersonic flows. Int. J. Heat Mass Transf. 2018, 127, 503–512. [Google Scholar] [CrossRef]
- Guo, J.; Lin, G.; Bu, X.; Bai, L.; Chao, Y. Parametric study on the heat transfer of a blunt body with counterflowing jets in hypersonic flows. Int. J. Heat Mass Transf. 2018, 121, 84–96. [Google Scholar] [CrossRef]
- Knight, D. Survey of Aerodynamic Drag Reduction at High Speed by Energy Deposition. J. Propuls. Power 2008, 24, 1153–1167. [Google Scholar] [CrossRef]
- Erdem, E.; Kontis, K.; Yang, L. Steady energy deposition at Mach 5 for drag reduction. Shock. Waves 2012, 23, 285–298. [Google Scholar] [CrossRef]
- Hong, Y.J.; Wang, D.K.; Li, Q.; Ye, J.F. Interaction of single-pulse laser energy with bow shock in hypersonic flow. Chin. J. Aeronaut. 2014, 27, 241–247. [Google Scholar] [CrossRef]
- Sharma, K.; Nair, M.T. Combination of counterflow jet and cavity for heat flux and drag reduction. Phys. Fluids 2020, 32, 056107. [Google Scholar] [CrossRef]
- Kim, Y.; Roh, T.-S.; Huh, H.; Lee, H.J. Study on the combined effect of various injection conditions on the drag reduction by a counter-flow jet in supersonic flow. Aerosp. Sci. Technol. 2020, 98, 105580. [Google Scholar] [CrossRef]
- Zhu, L.; Chen, X.; Li, Y.K.; Musa, O.; Zhou, C.S. Investigation of drag and heat reduction induced by a novel combinational lateral jet and spike concept in supersonic flows based on conjugate heat transfer approach. Acta Astronaut. 2018, 142, 300–313. [Google Scholar] [CrossRef]
- Barzegar Gerdroodbary, M.; Imani, M.; Ganji, D.D. Heat reduction using conterflowing jet for a nose cone with aerodisk in hypersonic flow. Aerosp. Sci. Technol. 2014, 39, 652–665. [Google Scholar] [CrossRef]
- Ou, M.; Yan, L.; Huang, W.; Li, S.-B.; Li, L.-Q. Detailed parametric investigations on drag and heat flux reduction induced by a combinational spike and opposing jet concept in hypersonic flows. Int. J. Heat Mass Transf. 2018, 126, 10–31. [Google Scholar] [CrossRef]
- Sun, X.-W.; Guo, Z.-Y.; Huang, W.; Li, S.-B.; Yan, L. A study of performance parameters on drag and heat flux reduction efficiency of combinational novel cavity and opposing jet concept in hypersonic flows. Acta Astronaut. 2017, 131, 204–225. [Google Scholar] [CrossRef]
- Zhu, L.; Li, Y.; Chen, X.; Li, H.; Li, W.; Li, C. Hypersonic flow characteristics and relevant structure thermal response induced by the novel combined spike-aerodome and lateral jet strategy. Aerosp. Sci. Technol. 2019, 95, 105459. [Google Scholar] [CrossRef]
- Hartmann, J. On a New Method for the Generation of Sound-Waves. Phys. Rev. 1922, 20, 719–727. [Google Scholar] [CrossRef]
- Yuceil, B.; Dolling, D.; Wilson, D. A preliminary investigation of the Helmholtz resonator concept for heat flux reduction. In Proceedings of the 28th Thermophysics Conference, Orlando, FL, USA, 6–9 July 1993. [Google Scholar] [CrossRef]
- Ladoon, D.W.; Schneider, S.P.; Schmisseur, J.D. Physics of Resonance in a Supersonic Forward-Facing Cavity. J. Spacecr. Rockrts 1998, 35, 626–632. [Google Scholar] [CrossRef]
- Engblom, W.A.; Yuceil, B.; Goldstein, D.B.; Dolling, D.S. Experimental and numerical study of hypersonic forward-facing cavity flow. J. Spacecr. Rockrts 1996, 33, 353–359. [Google Scholar] [CrossRef]
- Lu, H.; Liu, W. Nummerical Simulation in Influence of Forward-Facing Cavity on Aerodynamic Heating of Hypersonic Vehicle. Procedia Eng. 2012, 29, 4096–4100. [Google Scholar] [CrossRef]
- Yadav, R.; Guven, U. Aerothermodynamics of a hypersonic vehicle with a forward-facing parabolic cavity at nose. Proc. Inst. Mech. Eng. Part G J. Aerosp. Eng. 2013, 228, 1863–1874. [Google Scholar] [CrossRef]
- Chou, A.; Schneider, S.P. Measurements of Resonance in a Forward-Facing Cavity at Mach Six. J. Spacecr. Rockrts 2015, 52, 1486–1494. [Google Scholar] [CrossRef]
- Palmer, G.E.; White, T.; Pace, A. Direct Coupling of the NEQAIR Radiation and DPLR CFD Codes. J. Spacecr. Rockrts 2011, 48, 836–845. [Google Scholar] [CrossRef]
- Du, Y.; Sun, S.; Tan, M.; Huang, H.; Yan, C.; Meng, X.; Chen, X.; Wang, H. Numerical study on the non-equilibrium characteristics of high-speed atmospheric re-entry flow and radiation of aircraft based on fully coupled model. J. Fluid. Mech. 2023, 977, A39. [Google Scholar] [CrossRef]
- Tauber, M.E.; Sutton, K. Stagnation-point radiative heating relations for earth and Mars entries. J. Spacecr. Rockrts 1991, 28, 40–42. [Google Scholar] [CrossRef]
- Colin, S. Rarefaction and compressibility effects on steady and transient gas flows in microchannels. Microfluid. Nanofluid. 2004, 1, 268–279. [Google Scholar] [CrossRef]
- Wang, W.-L.; Boyd, I.D. Prediction continuum breakdown in hypersonic viscous flows. Phys. Fluids 2003, 15, 91–100. [Google Scholar] [CrossRef]
Disclaimer/Publisher’s Note: The statements, opinions and data contained in all publications are solely those of the individual author(s) and contributor(s) and not of MDPI and/or the editor(s). MDPI and/or the editor(s) disclaim responsibility for any injury to people or property resulting from any ideas, methods, instructions or products referred to in the content. |
© 2025 by the authors. Licensee MDPI, Basel, Switzerland. This article is an open access article distributed under the terms and conditions of the Creative Commons Attribution (CC BY) license (https://creativecommons.org/licenses/by/4.0/).