1. Introduction
As a strategically emerging industry, drone delivery operations are demonstrating a vigorous development trend on a global scale. Drone delivery boasts the shortest straight-line distance and high transportation efficiency, with good adaptability to complex service scenarios. The capability of drones to deliver packages has been proven through numerous experiments [
1]. In China, drone delivery is gaining significant traction. The first cross-river commercial low-altitude drone route in Wuhan and the accelerated construction of low-altitude take-off and landing facilities in Shenzhen highlight the progress in integrating drones into urban logistics [
2,
3]. In the United States, Alphabet’s Wing has been operating autonomous deliveries in Logan, Australia, for two years and has completed over 400,000 commercial deliveries globally [
4,
5]. In addition, Amazon’s Prime Air project has achieved commercial testing in Texas and California with Federal Aviation Administration (FAA) approval [
6]. Manna Aero has conducted large-scale drone delivery pilots in Ireland and the United States, completing over 100,000 deliveries in Ireland [
7]. Meanwhile, DHL and Daimler have also launched drone pilot projects, aiming to achieve their vision for future logistics transportation [
8,
9].
Nevertheless, the development of drone delivery is not only driven by technological advancements but also constrained by legal and regulatory frameworks. In the European Union, the regulatory framework for drone operations is continuously evolving, with the European Union Aviation Safety Agency (EASA) implementing strict safety and operational standards [
10]. These regulations focus on ensuring public safety, protecting privacy, and minimizing environmental impact, which significantly influence the deployment and operation of drone delivery services. Similarly, in the United States, the FAA has established comprehensive guidelines for drone operations, including restrictions on flight altitude, distance from airports, and operational hours [
11]. These limitations aim to balance the potential benefits of drone delivery with the need to maintain air safety and security. In China, the Civil Aviation Administration of China (CAAC) has also introduced regulations to govern drone operations, emphasizing the importance of flight safety and compliance with national airspace regulations [
12]. These legal requirements, while necessary for safety, pose significant challenges for the large-scale commercialization of drone delivery.
Against this backdrop, small-sized logistics drones have been popularized and developed rapidly in various countries. However, according to the study by Wild et al. [
13], the accident rate during take-off and landing phases accounts for approximately 52% of the entire flight phase in drone operations, representing critical safety and capacity bottlenecks that severely constrain the sustainable development of urban logistics drone industries. Therefore, designing the approach and departure structures and procedures for droneports, along with developing corresponding sequencing strategies for take-off and landing, is of critical importance in enhancing urban air logistics efficiency and overcoming current developmental bottlenecks.
Existing research on the structural design of droneports follows three categories of approaches: traditional flight procedure-based approaches [
14], static topology optimization [
15,
16,
17,
18], and dynamic buffer expansion [
19]. Based on traditional flight procedures, Zhang et al. [
14] proposed a vertical take-off and landing (VTOL) procedure design method for urban logistics drones based on the flight procedure design standards for VTOL aircraft. Another category is the method of static topology optimization. Zhao et al. [
15] developed a parametric design model for the approach route of small multi-rotor logistics drones based on factors such as safety and noise. Song et al. [
16] proposed a design concept for eVTOL (electric Vertical Take-Off and Landing) airspaces. However, this category of methods does not account for the dynamic characteristics of drone delivery. Consequently, they subsequently introduced additional freely movable circular zones [
17]. Meanwhile, Zeng et al. from Nanyang Technological University [
18] designed a dynamically rotating route in the terminal area of the droneport. Then, they integrated this design into the actual drone operations and developed a simulation model. Recently, Yang et al. [
19] proposed a funnel-shaped airspace design and approach/departure procedure methodology for droneports, which can accommodate hovering and mixed approach–departure operations. However, the design schemes mentioned above do not adequately address the separation of take-off and landing, resulting in a theoretically maximum throughput that is inversely proportional to the sum of arrival and departure times. This creates significant capacity bottlenecks and introduces risks in drone delivery scenarios characterized by extremely high frequencies of take-off and landing.
In practice, drone hives have been widely adopted as critical infrastructure. For example, in China, Cainiao Network has launched similar initiatives, deploying drone hives in urban areas to support last-mile delivery and emergency response operations [
20]. In the United States, companies like Volansi have developed drone hives that can be integrated into their delivery services, allowing drones to autonomously take off, complete deliveries, and return for recharging [
21]. These drone hives not only enhance operational efficiency but also address challenges related to drone storage, maintenance, and regulatory compliance.
Regarding the domain of take-off and landing sequencing, extensive research has been conducted within the field of civil aviation. Erzberger et al. [
22] developed design principles and algorithms for a real-time scheduling program for arriving aircraft based on the First-Come, First-Served (FCFS) scheduling protocol. Li et al. [
23] used the Immune Algorithm (IA) to adjust the aircraft approach sequencing. Liao et al. [
24] discussed a sequencing model for scheduling the arrival order of flights in the approach airspace, and this model schedules the arrival flight sequence by reducing the delays caused by encounters between flights.
Meanwhile, in the field of drone take-off and landing sequencing, relevant research has also been conducted, with methods primarily categorized into three approaches: traditional aviation-based methods [
25], methods combining departure and arrival route planning [
26,
27], and optimization-based methods [
28,
29,
30]. Bosson et al. [
25] developed a drone departure and scheduling algorithm suitable for the entire urban air traffic network based on the AutoResolver algorithm originally developed for traditional aviation. To better adapt to drone departure and arrival routes, several scholars have integrated departure and arrival sequencing with route planning. For instance, Zeng et al. [
26] proposed a droneport airspace flow control method based on graph theory. Similarly, Shao et al. [
27] established a collaborative scheduling model for arrival and departure flights in the terminal area of vertical droneports, incorporating a path planning model and a distributed sequencing model. Finally, scholars have adopted optimization methods tailored to specific objectives for drone departure and arrival sequencing. Pradeep et al. [
28] proposed two separate arrival procedures for vertical droneports and a heuristic algorithm known as Insertion and Local Search (ILS). Bertram et al. [
29] introduced the Markov Decision Process into the problem of optimizing drone arrival time sequencing. Chang et al. [
30] selected the cargo value, distance to the delivery point, and latest acceptable delivery time as the primary factors influencing the scheduling of logistics drone take-off times, aiming to minimize delays. However, these methods are still in their nascent stages, with most addressing only a subset of practical scenario constraints. Factors such as drone energy consumption and sequencing challenges in emergency scenarios are often overlooked, and optimization-based methods are characterized by a relatively slow computational time, which fails to meet the real-time requirements for high throughput.
In summary, although extensive research has been conducted on the design of droneports, process optimization, and sequencing strategies, several limitations remain:
The current designs of logistic droneports have not adequately addressed the necessity for separation between take-offs and landings during airspace planning. This oversight results in reduced throughput and elevated collision risks, particularly in scenarios with high frequencies of drone operations.
There is a lack of sequencing methods specifically tailored to the unique characteristics of logistic drones, hindering efficient and safe operations.
To address these challenges, this study focuses on optimizing the operational efficiency of droneports for high-flow, high-frequency logistics drones, with a primary emphasis on safety. The main contributions are as follows:
Droneport Airspace Structure Design: A pioneering terminal-area airspace structure has been developed for lightweight, small-type drones, enabling the simultaneous take-off and landing of multiple drones. This design ensures the precise separation of take-offs and landings by strategically planning flight routes and designating exclusive areas, thereby facilitating smooth drone operations.
The Take-off and Landing Sequencing Method: An advanced drone arrival and departure sequencing model based on the Hungarian algorithm has been proposed. This model transforms the sequencing problem into an assignment problem, incorporating variables such as drone battery levels and task priorities. By defining the cost matrix comprising the power, task priority, and planned sequence, this method can quickly determine the optimal take-off and landing sequence.
Implementation Results: The proposed airspace structure significantly enhances the efficiency of drone take-offs and landings. Compared to traditional single-channel funnel-shaped airspace, the new structure achieves a 34.8% reduction in take-off and landing time. Our take-off and landing sequencing method ensures that high-priority drones are given precedence for take-off or landing. Additionally, it reduces the average waiting time for low-battery drones by 47.3%, thereby alleviating endurance pressures and enhancing the safety and stability of drone operations.
2. Airspace Structure Design of Droneport
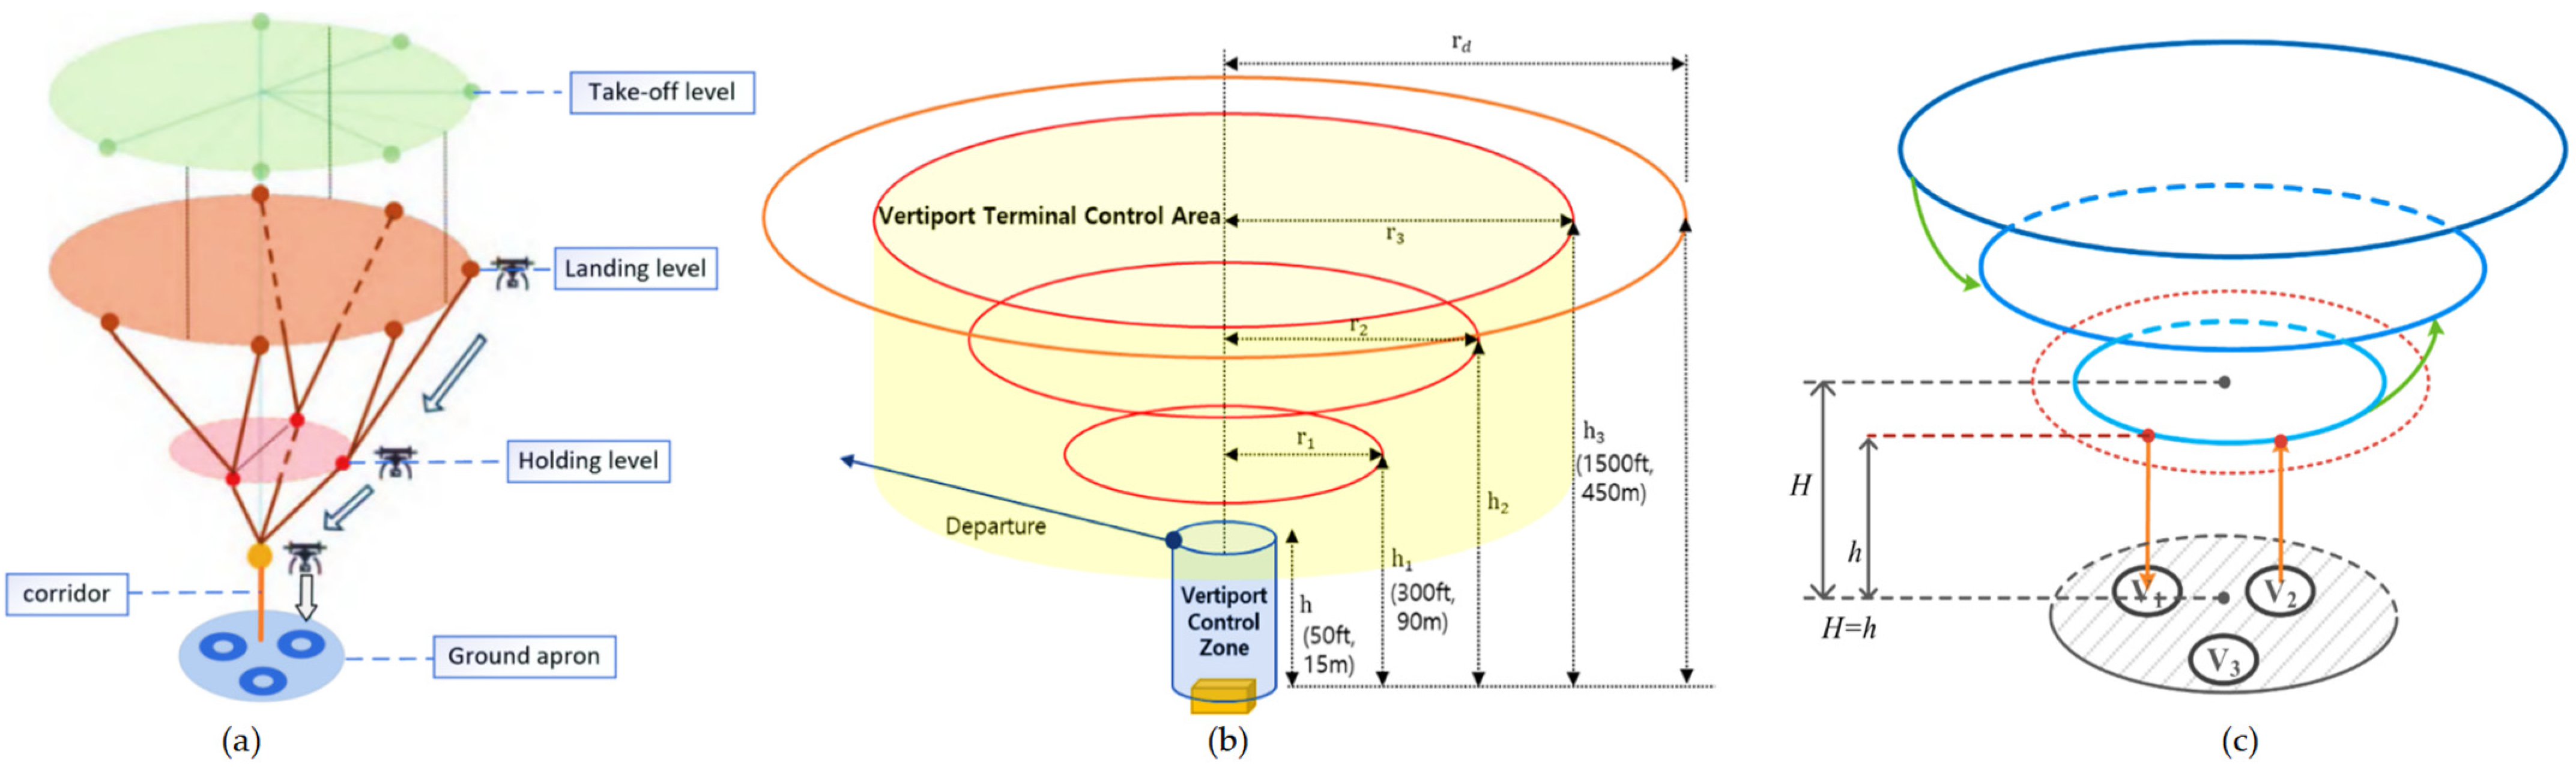
This study analyzes three existing airspace structures and their limitations in high-traffic drone operations, as shown in
Figure 1. Specifically, the “single-entry and single-exit” airspace structure suitable for eVTOL shown in
Figure 1b [
16] and
Figure 1c [
27] struggles to meet the large-scale take-off and landing requirements of drones. Meanwhile, although
Figure 1a [
19] presents a “multi-entry and multi-exit” configuration, it fails to effectively separate the take-off and landing procedures of drones, thereby increasing the potential collision risks among drones.
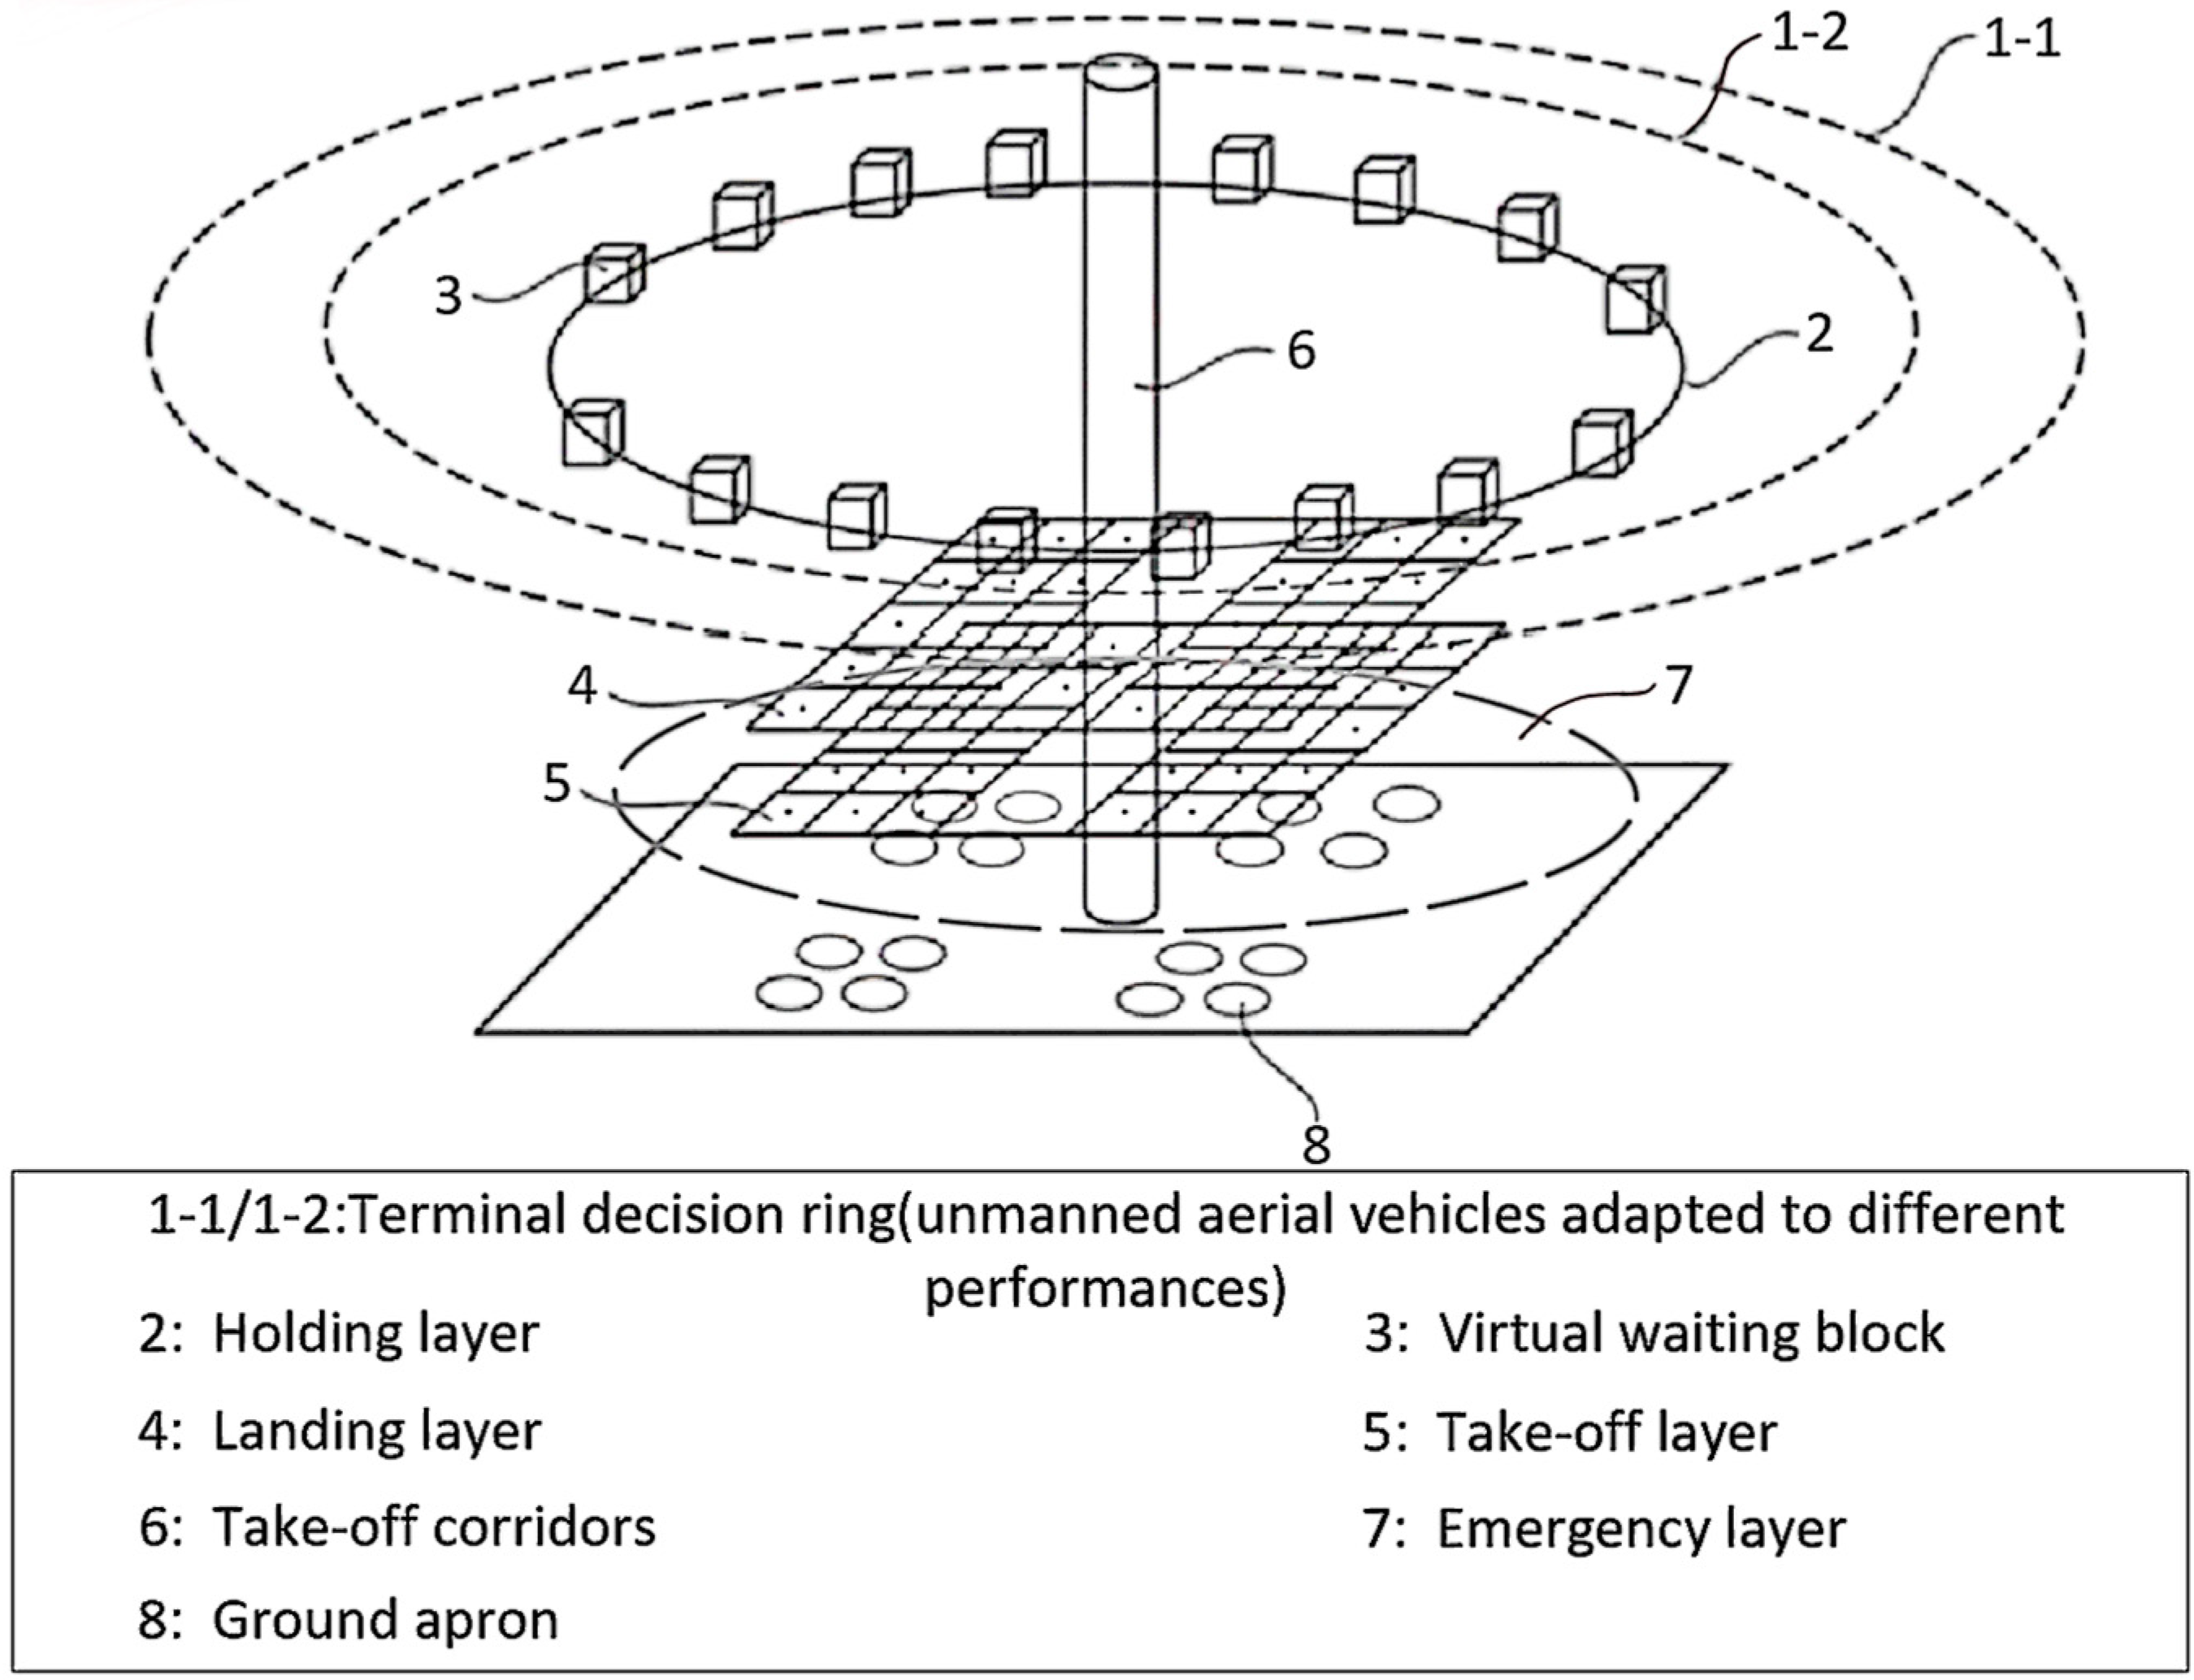
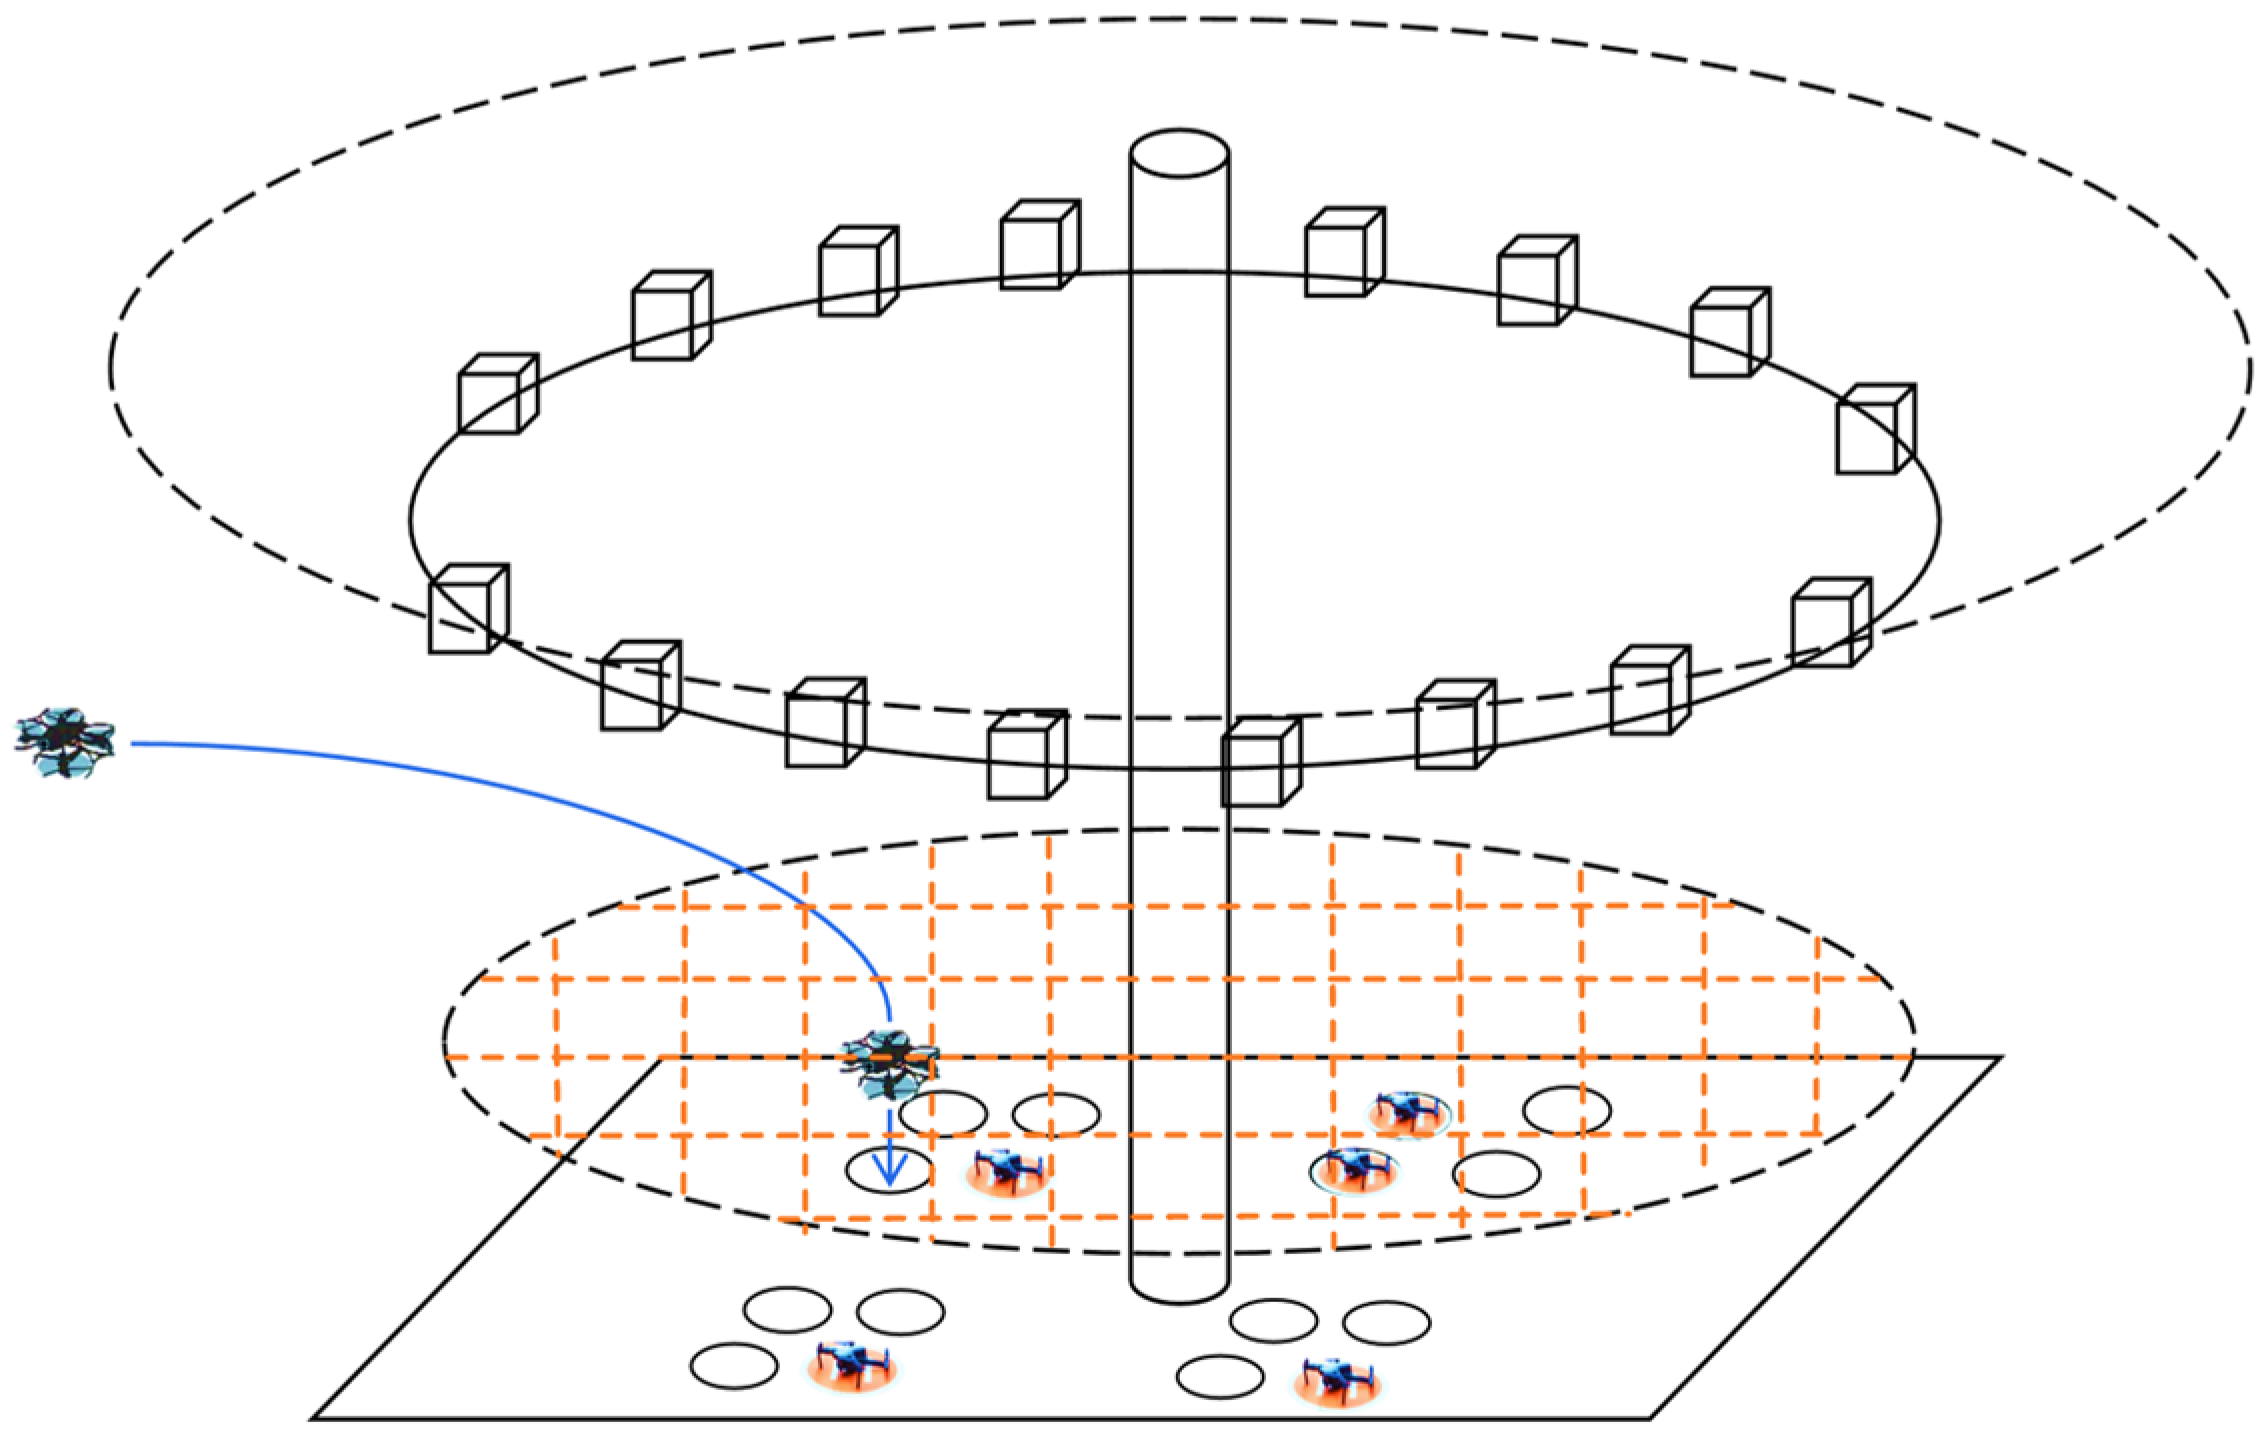
Considering the relevant research findings of current scholars, to satisfy the requirement of separating take-offs and landings during the approach and departure processes for a large volume of low-altitude small drones, this study specifically designed an airspace structure for the terminal area of a droneport. As illustrated in
Figure 2, this study conducted structural planning for a droneport, as well as the surrounding airspace. In this paper, the airspace structure within the terminal area of the droneport includes a terminal decision ring, a holding layer, an arrival layer, a departure layer, an emergency layer, and take-off corridors, as illustrated below:
2.1. Terminal Decision Ring
The terminal decision ring serves as the boundary of the airspace under the jurisdiction of the terminal area of the droneport, encompassing all drones within it into the control scope of the droneport. Based on the different performance characteristics (the glide slope angle during oblique flight) of drones, this structure can be configured with different radii, as illustrated in
Figure 1 (1-1 and 1-2). As the boundary of the airspace in the terminal area of the droneport, the terminal decision ring is the airspace structure of the droneport with the highest altitude and the largest radius.
2.2. Holding Layer
The holding layer is circular in shape. The altitude is lower than that of the terminal decision ring, and the radius can vary dynamically according to the expected throughput of the droneport and the traffic flow of the public flight routes of drones served by the droneport, and the height difference between the holding layer and the terminal decision ring can dynamically change based on the radius of the holding layer.
2.3. Virtual Waiting Block
Within the holding layer, multiple virtual waiting blocks are set up, and the number of these blocks is adjusted dynamically according to the radius. Upon reaching the terminal decision ring, the drone will descend to a virtual waiting block at the holding layer in accordance with a specific descent gradient angle and wait there for the landing instruction.
2.4. Landing Layer
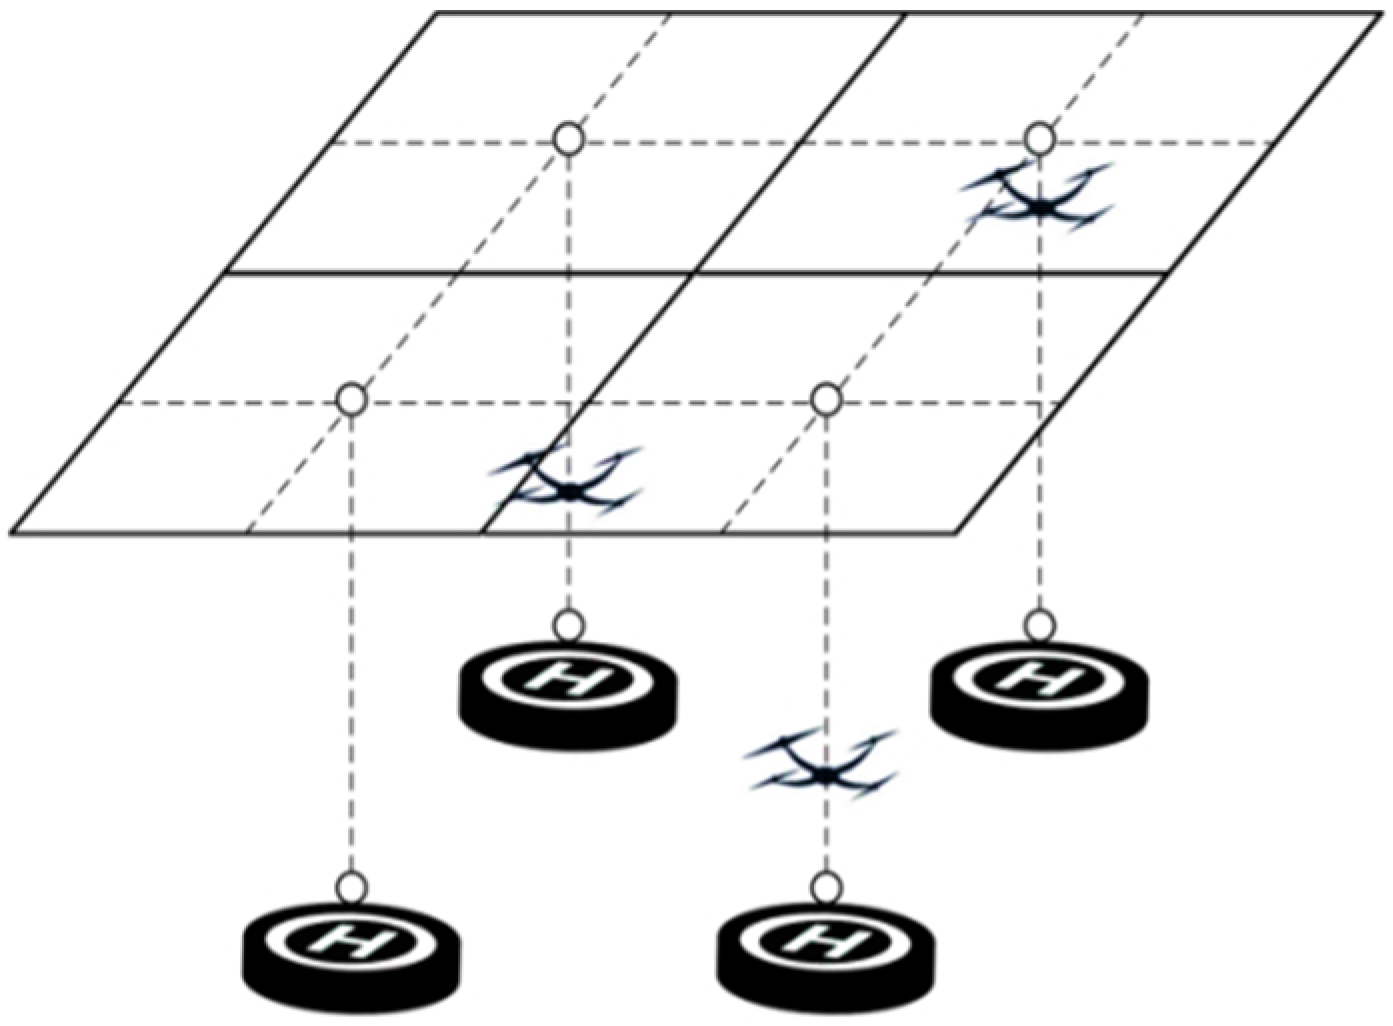
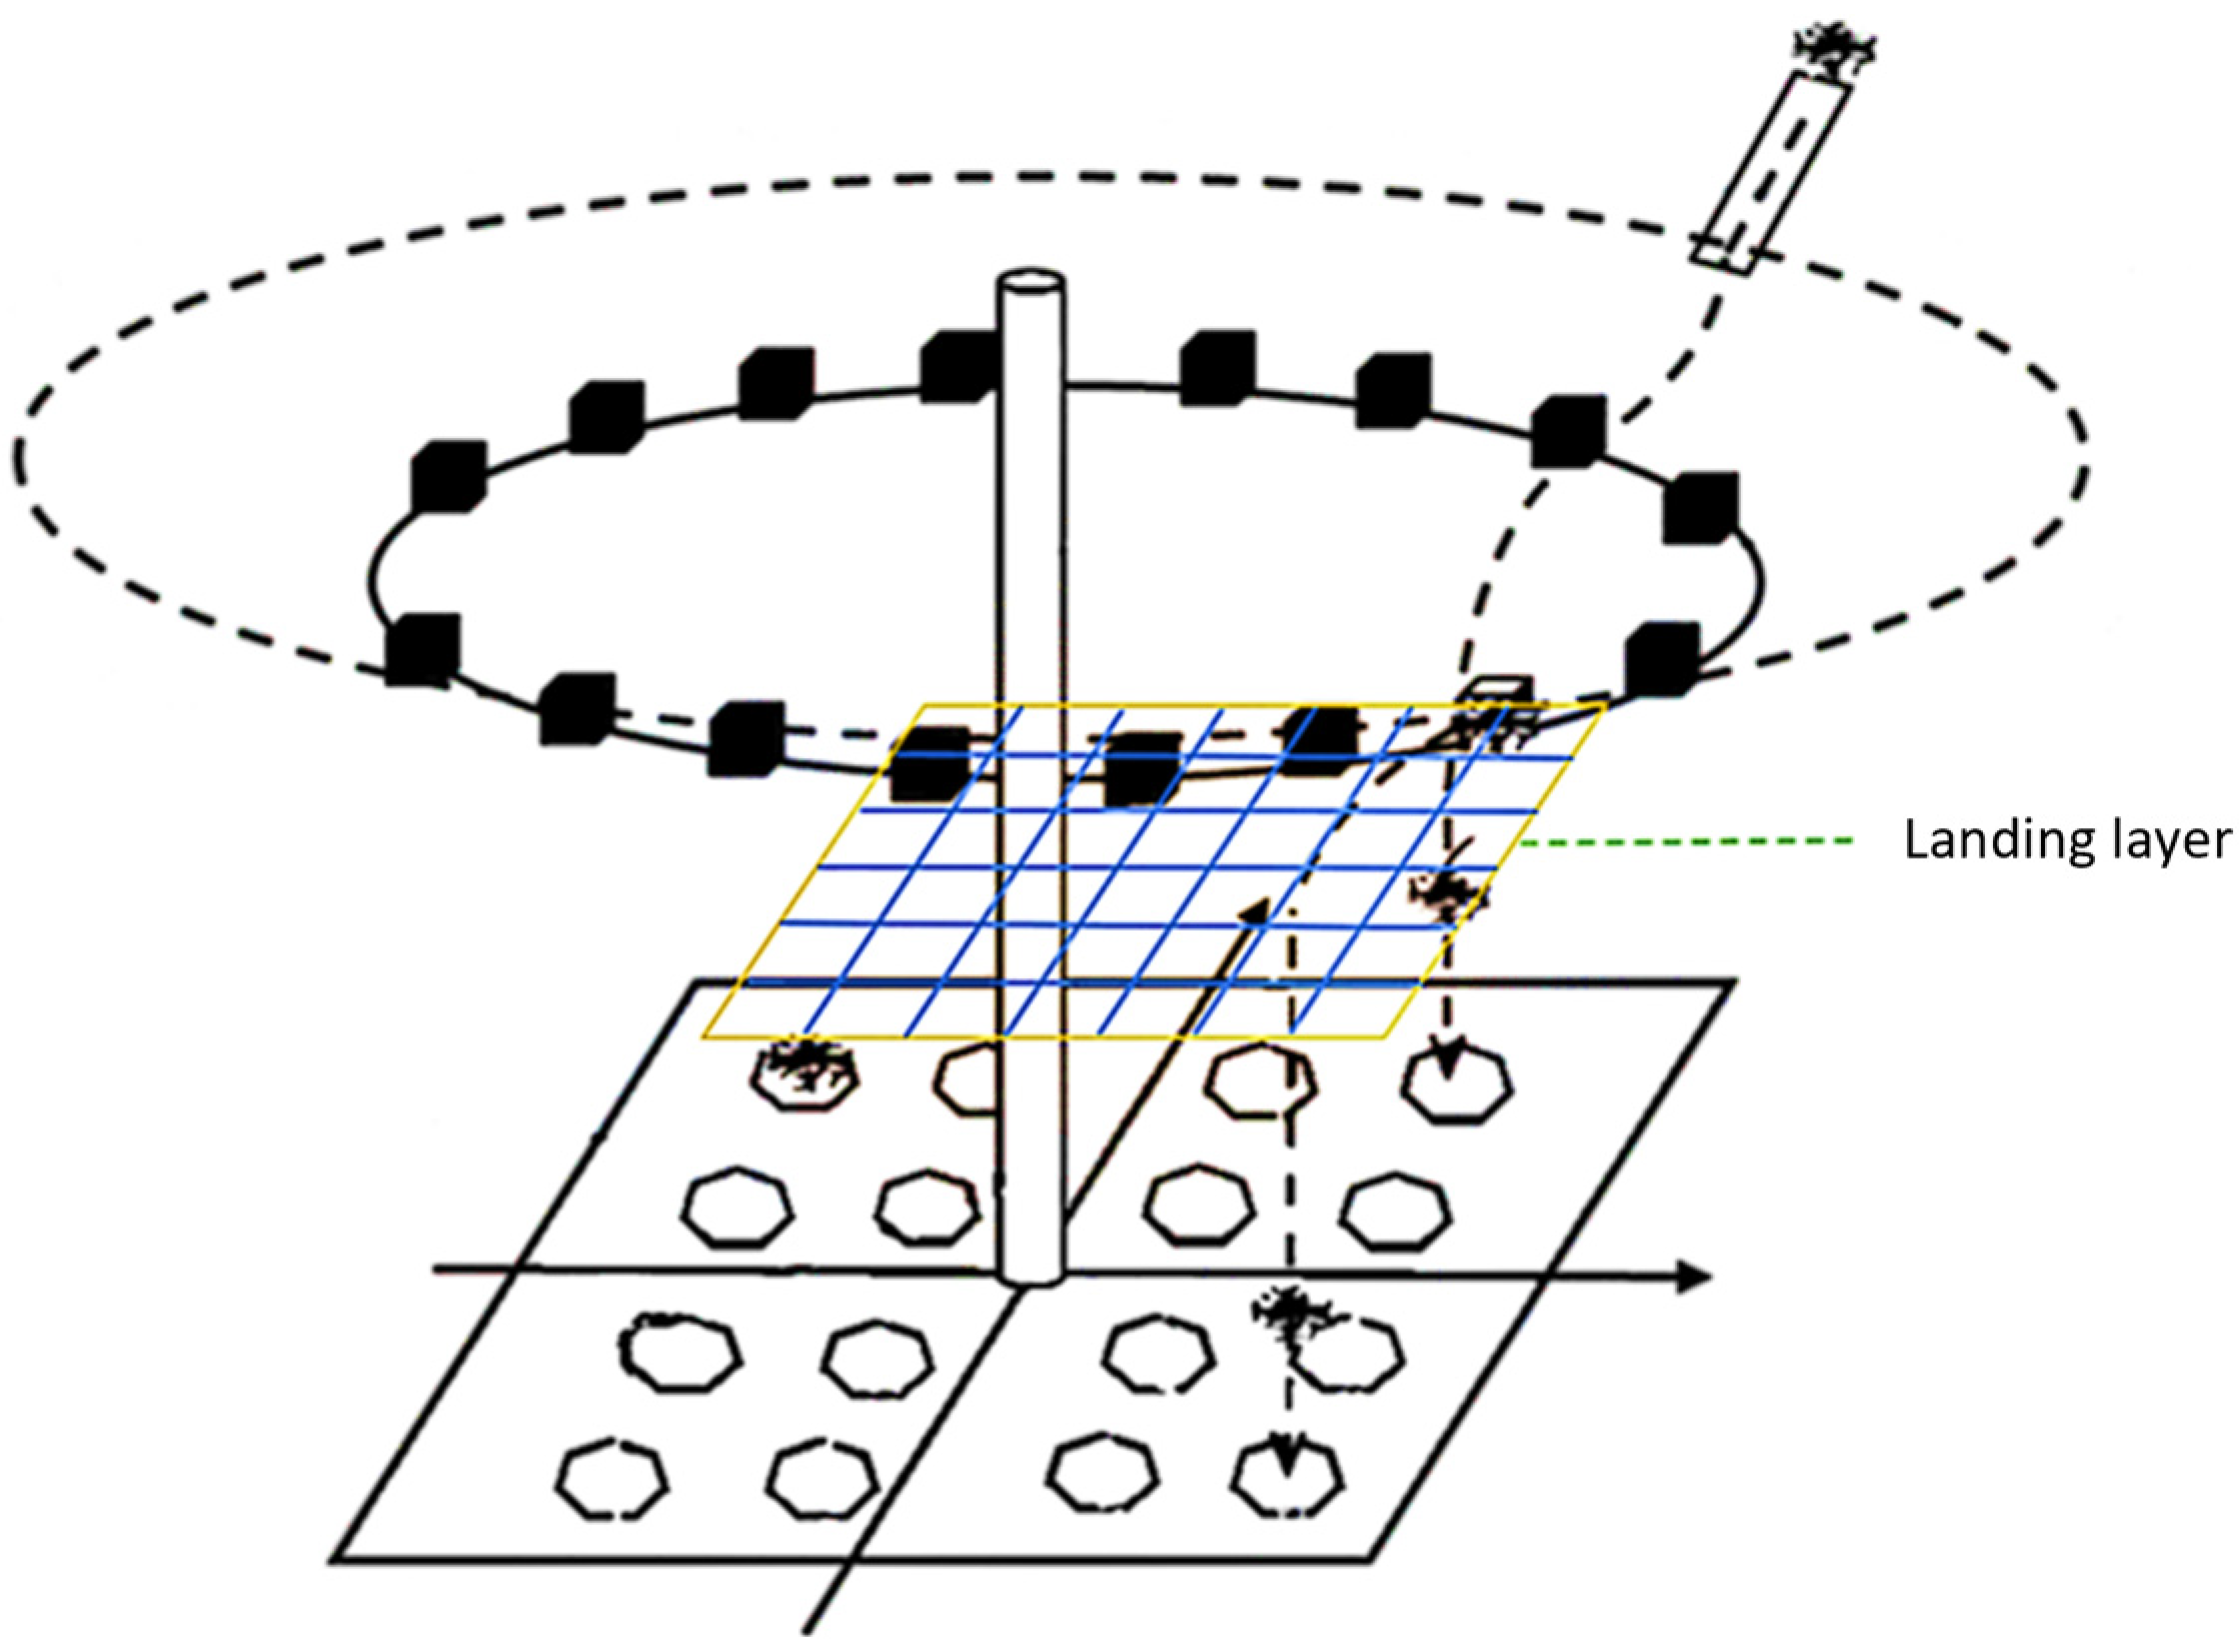
The landing layer is positioned below the holding layer and above the take-off layer, with the height above ground not being excessively high. As shown in
Figure 3, the configuration of the landing layer is the projection at the corresponding height after the ground apron is gridded. The lines connecting the hollow points represent the routes for the final vertical landing of drones.
2.5. Take-Off Layer
The take-off layer is positioned below the landing layer to implement stratification for drones during take-off and landing, thereby minimizing path conflicts between drones. The configuration of the take-off layer is analogous to that of the landing layer, representing the projection at the corresponding height after the ground apron is gridded.
2.6. Take-Off Corridor
To maximize the spatial separation of take-off and landing paths, the take-off corridor is set in the central area of the apron of the droneport. The take-off corridor is configured as a column-shaped airspace. Drones arriving at the take-off corridor climb vertically to the corresponding altitude then complete the departure and head for the target route.
2.7. Emergency Layer
To ensure that drones can respond safely in the case of emergencies during flight, the emergency layer should be set between the take-off layer and the ground apron when planning the emergency layer. Meanwhile, when planning the emergency layer, the radius needs to be comprehensively determined based on multiple factors such as the airspace congestion level of the droneport, the types of drones, and their flight performance.
2.8. Ground Apron
The dimensions of drone ground aprons and the spacing between each apron are fundamental components of the design of a droneport. When designing the ground apron, sufficient spacing between each apron area needs to be considered to ensure that multi-rotor drones can complete take-off and landing tasks within a safe collision risk range.
In practice, when constructing new droneports or renovating old ones, the design of the terminal decision ring, the holding layer, the landing layer, the take-off layer, the emergency layer, and take-off corridors should be carefully planned according to the local airspace conditions, drone traffic volume, and surrounding environment. It should be noted that, due to practical constraints such as the roof area and surrounding obstacles, the maximum drone capacity per layer in the terminal airspace proposed in this study must be determined based on specific on-site conditions. Additionally, to mitigate downwash interactions, turbulence propagation, and wind shear effects, vertical safety separation must be maintained between layers, and lateral separation must be ensured between the ground apron and virtual waiting blocks.
4. Hungarian Algorithm-Based Approach and Departure Sequencing Method
The Hungarian algorithm, a well-known method for solving assignment problems efficiently, was selected for its ability to minimize the total cost in resource allocation scenarios [
34]. In this section, we optimize the approach and take-off sequence of drones at the droneport by introducing the model construction of the Hungarian algorithm and the factors influencing approach and departure sequencing, ensuring efficient and safe operations within the droneport.
4.1. Model Construction
In the terminal area, to achieve the reasonable arrangement of the take-off and landing sequence of drones, this paper introduces an adaptive adjustment mechanism under multiple constraints. Assuming that during the sequencing process, all waiting drones are positioned at reasonable holding points, the sequencing problem can be described as follows: within the terminal area of the airspace, drones are denoted by , waiting to land or take off. Affected by factors such as the remaining battery power, their arrival sequence at the terminal area, the sequence of take-off applications, the waiting time, and the priority of the tasks carried out by the drones themselves, drones have different costs when they land or take off in different orders. In this paper, the assignment problem for the approach and departure sequencing is described as follows:
Suppose that drones descend or take off in the order from to , and the cost of the drone when it lands/takes off in the order is . The approach and departure sequencing problem is to find a sequence to maximize the total cost of all drones, as follows:
Constraints:
where
,
, and
represent the total take-off and landing cost, landing cost, and take-off cost, respectively; in the factors influencing approach
,
,
, and
represent the cost of the remaining battery life of the drone, the sequence of arrival into the terminal area, the mission priority, and the drone’s waiting time, respectively; and in the factors influencing departure,
,
, and
represent the cost of the take-off application sequence, mission priority, and drone waiting time, respectively.
As for the different cost
,
,
,
,
,
, and
of drones under different landing or take-off sequences, they can collectively be referred to as the cost matrix
A. The detailed calculation for these costs will be elaborated in
Section 4.2.
where
is a positive number, representing the total cost of the drones waiting to take off or land in the droneport under different take-off and landing sequences.
With the sharp increase in the number of drones in the approach airspace, airspace resources are becoming increasingly scarce. Under such circumstances, to ensure the safe and efficient operation of drones, the take-off and landing sequence of incoming drones is obtained according to the approach–departure sequencing algorithm. In practice, through methods such as changing or delaying the take-off time of drones, the drones can experience secondary separation in the above extreme condition, which ensures that approaching drones are not affected during the approach process and guarantees that the take-off requests of departing drones are responded to.
4.2. Factors Influencing Approach and Departure Sequencing
The influencing factors in arrival and departure sequencing are a crucial part of constructing the arrival and departure sequencing model based on the Hungarian algorithm. It comprehensively takes into account various practical factors and determines the optimal take-off and landing sequence of drones through a dynamic adjustment mechanism. Thus, it achieves the minimization of the overall cost and enhances the safety and operational efficiency of drone operations.
4.2.1. Factors Influencing Approach Sequencing
Due to factors such as the remaining battery life of drones within the terminal area, the order of arrival at the terminal area, the priority of missions carried out by the drones themselves, and the planned sequence, the impedance of drones descending in different sequences will vary to different degrees.
- (1)
Remaining battery cost
Based on the analysis of power consumption logic during the drone landing process, we propose a linear power consumption model to determine whether the drone has insufficient power during the descent. And the remaining battery capacity of the drone upon landing on the ground is obtained through Equation (5). Although the actual situation is more complex and different types of drones have different power consumption characteristics, making it difficult to accurately evaluate and determine power consumption through a single model, this study aims to provide a general framework for calculating power consumption. In practice, operators can customize and adjust this module according to the energy consumption characteristics of specific drones to better meet the actual operation requirements.
where
represents the remaining battery power of the drone when it arrives at the terminal area;
represents the power coefficient;
is the time for the drone that is currently occupying the landing corridor to complete landing;
is the time when the drone reaches the holding layer;
is the assumed landing sequence of the drone; and
represents the time required for the drone to descend from the holding layer to the ground.
The remaining battery power for a drone to land on the ground can be divided into two scenarios.
If the drone arrives at the terminal area with sufficient remaining battery power (≥10%), then it will have a lower cost in the landing priority. Based on the concept of queuing theory [
35], the remaining battery cost is defined according to Equation (6) below. The remaining battery power is converted into a battery cost, which then participates in matrix operations to obtain the optimal descent sequence.
where
represents the remaining battery power of the drone calculated by Equation (5) when it descends to the ground;
represents the total number of drones waiting for approach; and
represents the battery cost of the drone.
When the drone has limited remaining power upon arriving at the terminal area, it is necessary to prioritize the landing to ensure safety. Based on the concept of queuing theory, we have developed a dynamic priority adjustment mechanism specifically for these drones with critical battery levels. As the number of drones waiting to land increases, the priority of drones with lower remaining battery power will be significantly increased to ensure that they can land first. Therefore, the battery cost is set as Equation (7).
where
represents the remaining battery power of the drone calculated by Equation (1) when it descends to the ground;
represents the total number of drones waiting for approach; and
represents the battery cost of the drone.
- (2)
Planned sequence cost
According to the order in which drones arrive at the terminal area, this paper sorts the drones reaching the terminal area based on the first-come, first-served principle. This paper comprehensively considers the arrival sequence of drones, hypothetical landing order, and overall traffic flow conditions. Through a series of calculations using Equation (8), it derives the planned sequence cost of drones under different landing scenarios. And it provides a foundation for subsequent matrix operations and the determination of the optimal landing sequence for drones.
where
is the defined planned sequence cost of the drone,
is the arrival sequence of the drone,
is the total number of drones arriving at the terminal area within the specified time, and
is the assumed landing sequence of the drone.
- (3)
Mission priority cost
Since the priority of the mission carried out by the drone is a quantitative indicator and cannot be defined by specific qualitative indicators, following Chang et al. [
30], this paper transforms the linguistic description of the mission priority in this paper into triangular fuzzy numbers, and the larger the most likely value of the triangular fuzzy number, the higher the priority of the mission. If there are a total of
n drones carrying cargo for flight, then their mission priority linguistic descriptions, after being converted into triangular fuzzy numbers, can be represented as follows:
In the equation:
,
, and
represent the lower bound, most likely value, and upper bound of the triangular fuzzy number for the mission priority indicator, respectively. The evaluation scale of triangular fuzzy numbers is shown in the following
Table 1.
In this paper, the mission priority cost was defined through Equation (10), in preparation for obtaining the optimal descent sequence of drones using matrix operations later.
where
represents the mission priority cost of the drone;
represents the total number of drones arriving at the terminal area within the specified time;
represents the assumed landing sequence of the drone; and
is the most likely value of the triangular fuzzy number of the mission priority carried by the drone.
indicates a high mission priority; otherwise, it indicates a low mission priority.
- (4)
Waiting cost
Next, we introduced a waiting cost factor to further adjust the weights. Considering that the longer the waiting time, the greater the weight, we defined a weight function related to the waiting time. Simultaneously, we introduced the estimated arrival time and the actual arrival time of the drone to obtain the delay time. The longer the delay time, the greater the weight.
where
represents the waiting cost of the drone,
is the estimated arrival time of the drone waiting to land,
is the actual arrival time,
represents the number of drones waiting to land, and
represents the waiting time for a drone to descend from the airspace of the terminal area to the ground.
4.2.2. Factors Influencing Departure Sequencing
Due to factors such as the order of drone take-off applications, the priority of missions carried out by the drones themselves, and waiting times, the impedance of drones that take off in different sequences will be affected to varying degrees.
- (1)
Planned sequence cost
Based on the sequence of drone take-off applications, this paper sorts the drones waiting to take off according to the first-come, first-served principle. Taking into comprehensive consideration the take-off application sequence of drones, the assumed take-off sequence, and the overall traffic flow, for this paper, we conducted a series of operations on the drone take-off application sequence through Equation (12) and defined the planned sequence cost values of drones under different take-off sequences to serve as preparation for obtaining the optimal take-off sequence of drones through subsequent matrix operations.
where
represents the planned sequence cost of the drone,
represents the take-off application sequence of the drone,
represents the total number of drones that arrive at the ground and are ready for take-off within the specified time, and
represents the assumed take-off sequence of the drone.
- (2)
Mission priority cost
Similarly to the drone approach process, for the drones waiting for take-off at the airspace, the mission priority cost under different take-off sequences can be obtained through Equation (13) in preparation for obtaining the optimal take-off sequence of drones through subsequent matrix operations.
where
represents the mission priority cost of the drone;
represents the total number of drones that reach the ground and are ready to take off within the specified time; and
is the most likely value of the triangular fuzzy number of the mission priority carried by the drone.
indicates a high mission priority; otherwise, it indicates a low mission priority.
- (3)
Waiting cost
Similarly to the drone approach, this paper introduces the estimated take-off time and the actual take-off time of the drone. And through Equation (14), the waiting cost of the drone under different take-off sequences can be obtained. This avoids delays and wastes of resources caused by an unreasonable take-off sequence and improves the operational efficiency and smoothness of drones during the departure process in the terminal airspace.
where
represents the waiting cost of the drone,
is the estimated take-off time of the drone waiting to take off,
is the actual take-off time,
is the number of drones waiting to land, and
is the waiting time for the drone to descend from the terminal area airspace to the ground.
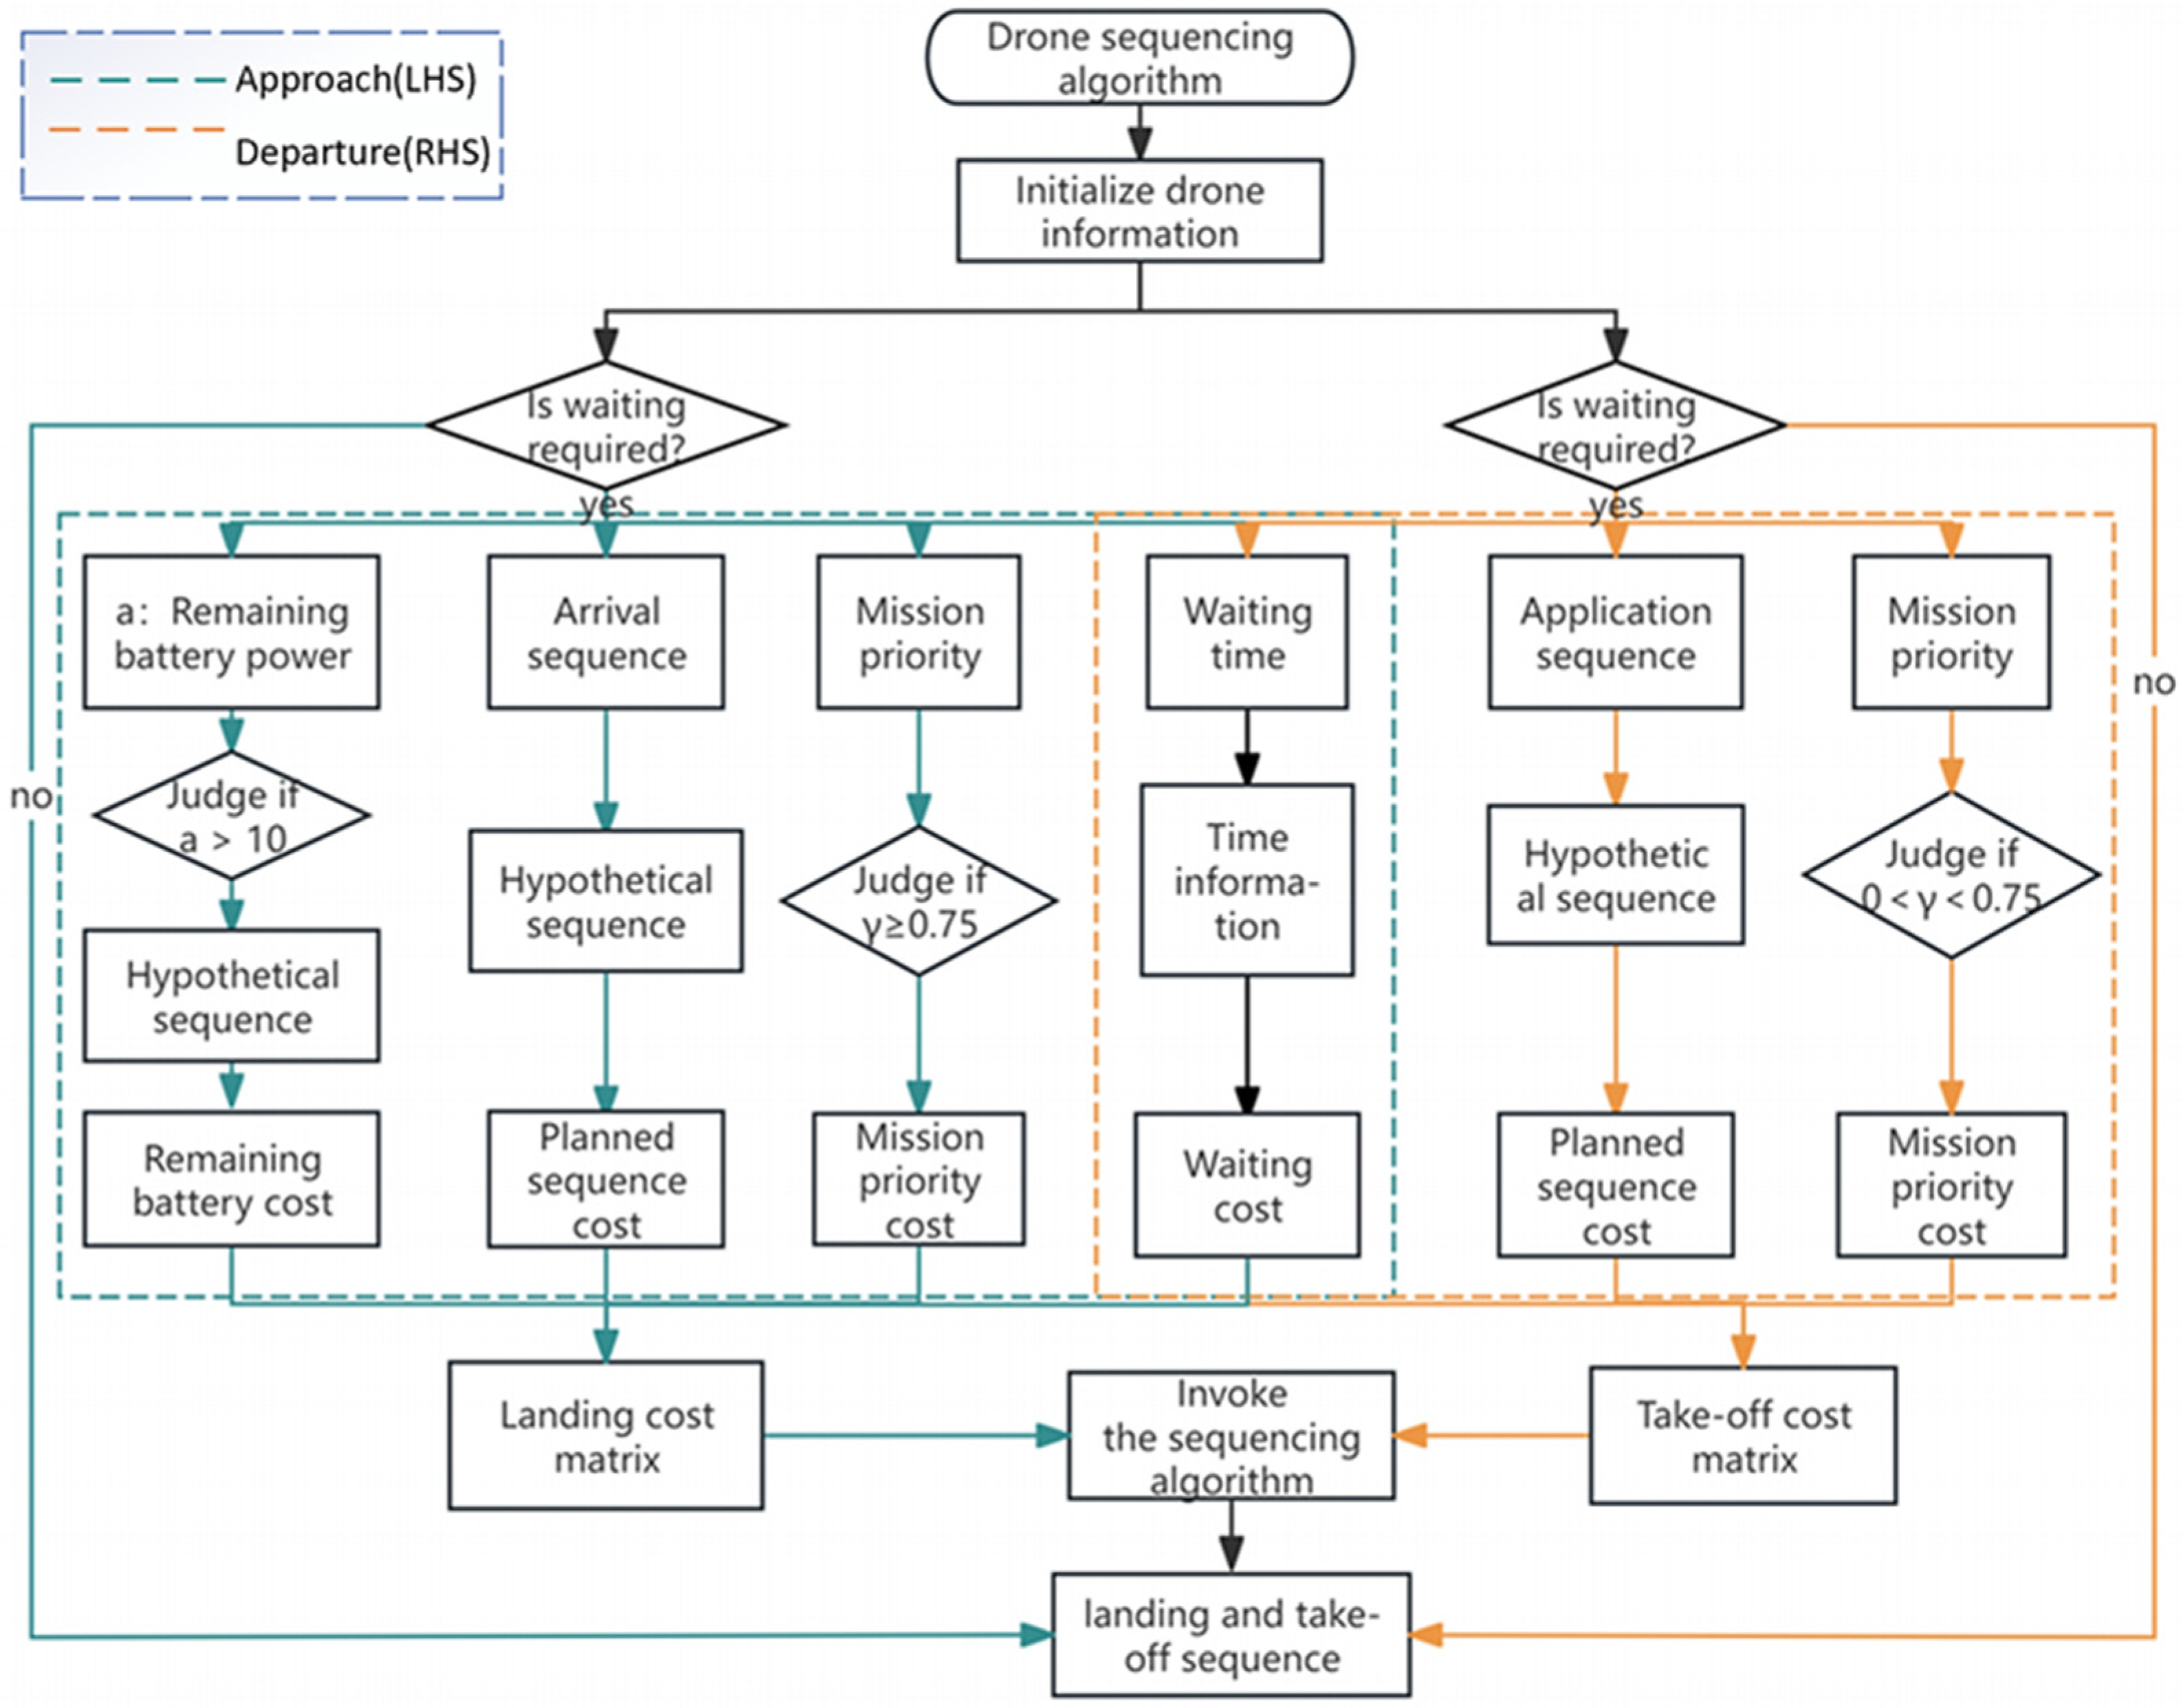
In the end, the above sequencing algorithm is described by a flowchart, as shown in
Figure 7. This figure provides a detailed illustration of the specific process of the drone take-off and landing sequencing algorithm. It can effectively balance various factors in a complex terminal area environment, minimizing the overall cost. Meanwhile, this mechanism can also enhance the safety and operational efficiency of drones in the droneport, ensuring that the missions of each drone can be carried out in an orderly manner within a reasonable time.
5. Simulation Experiment
To validate the effectiveness of the proposed airspace structure and sequencing algorithm, this section presents a series of simulation experiments. These experiments are designed to evaluate the operational efficiency of the novel airspace design, the performance of the sequencing algorithm under different mission priorities and battery conditions, and the computational scalability of the algorithm in large-scale drone operations.
To ensure the reproducibility of the experimental results, all tests were completed in a Microsoft Windows 10 with unified software and hardware environment information, where Python 3.11.4 was used as the primary programming language for data processing and algorithm implementation. The CPU was an Intel(R)Xeon(R) W-2133.
5.1. Comparative Experiment on Operational Efficiency of Airspace Structure
We conducted a validatory analysis on the airspace structure proposed in this paper by performing a comparative experiment on airspace operational efficiency. The airspace structure [
19] of the control group is shown in
Figure 1a. Additionally, it is assumed that the number of ground aprons
, the number of pre-take-off drones
, the time required for departure
, the time required for landing
, and the ground transfer time of the drone
. Then, in this experiment, considering the uncertainty of drone arrivals in actual operations, we choose to randomly generate the arrival intervals of drones. Two different arrival flows are, respectively, adopted. The arrival interval of each drone in the first arrival flow is set between 50 s and 70 s, denoted by
. And the interval of each drone in the second arrival flow is set between 40 s and 60 s, denoted by
. In these arrival flows, the flight plans for drones numbered from
to
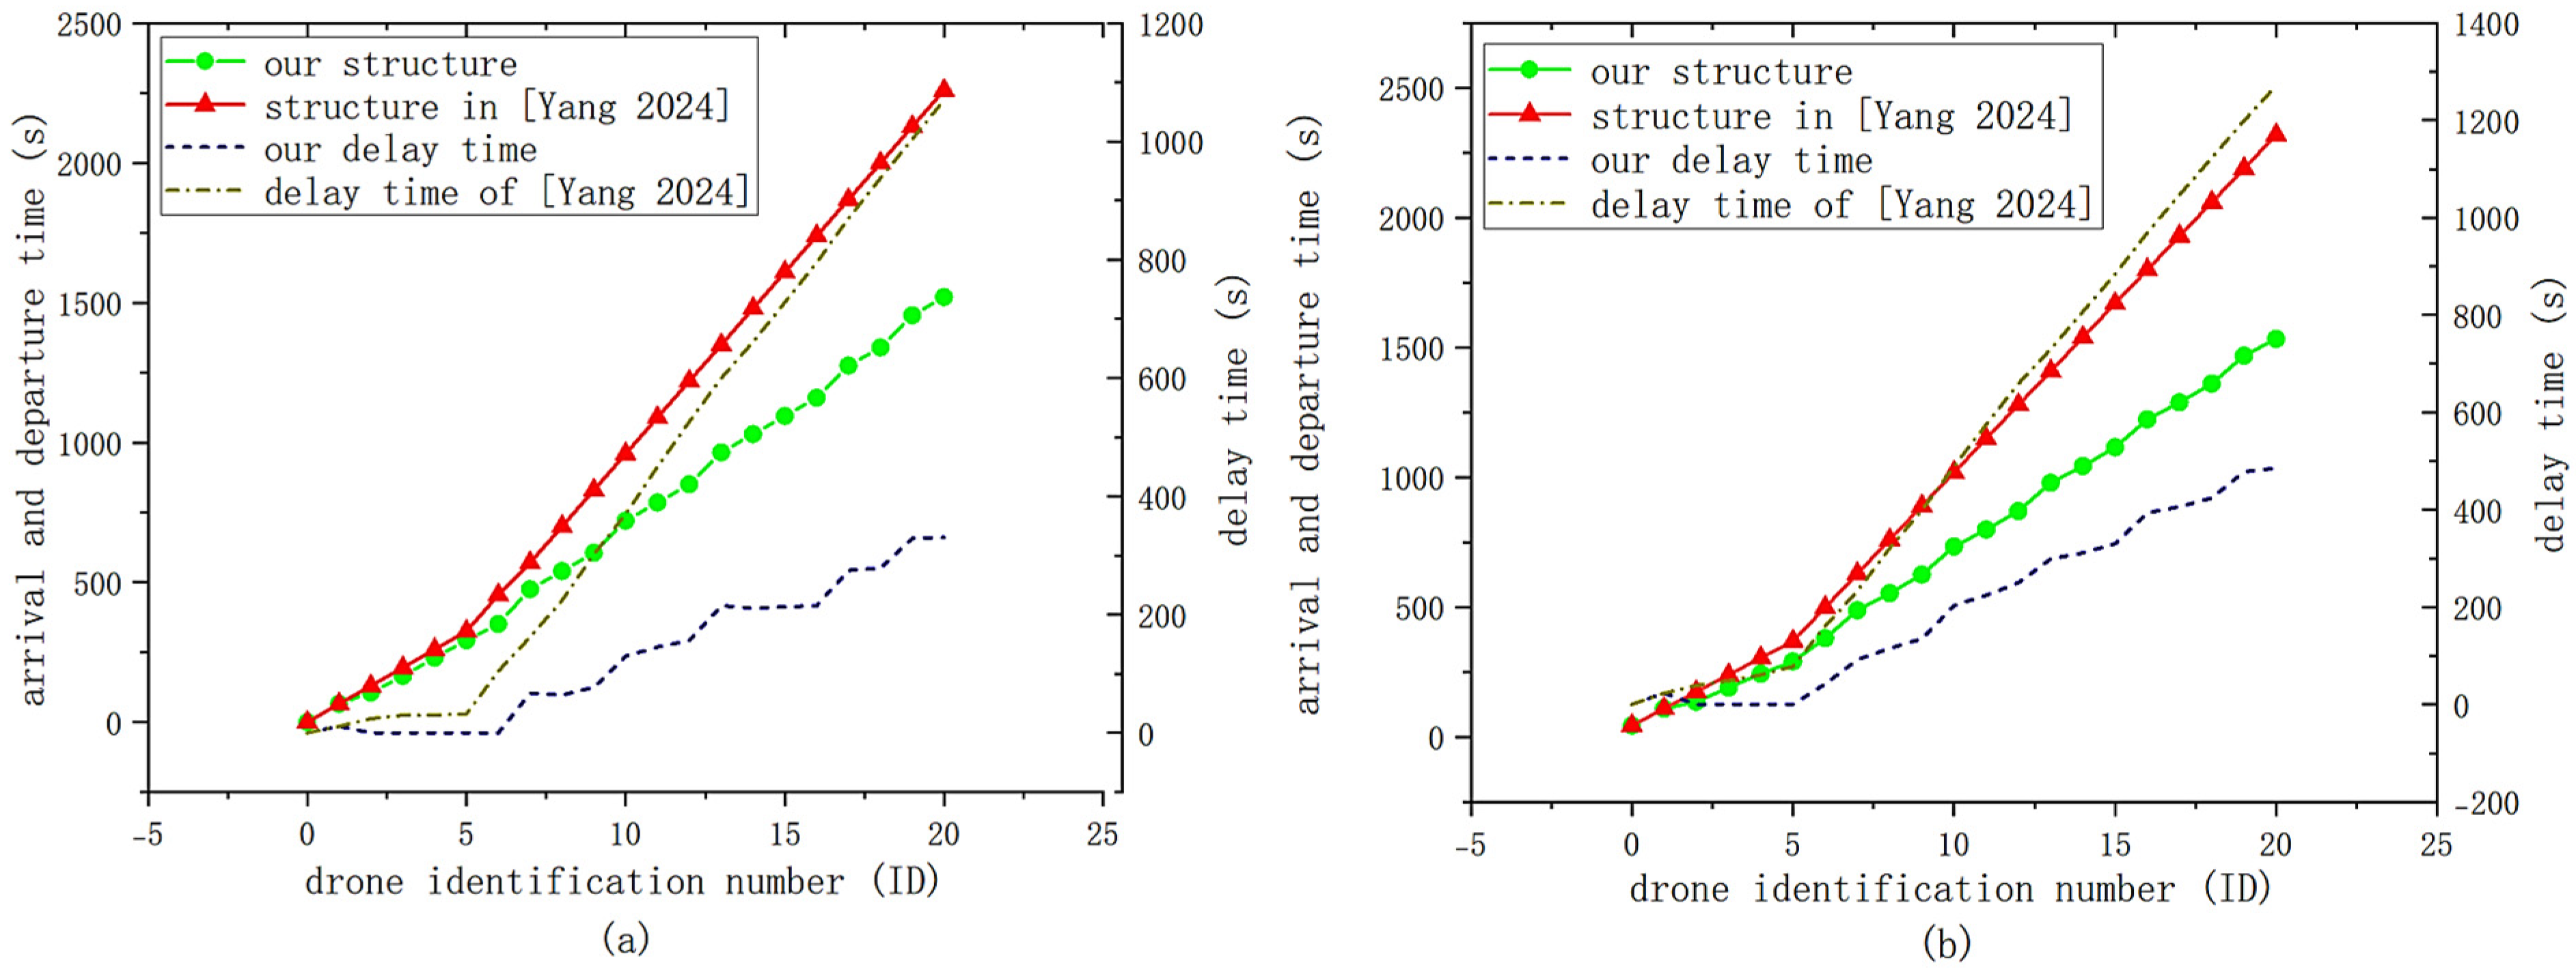
are randomly generated with the Poisson distribution. Finally, through simulation, the actual departure times and actual approach times of each arriving and departing drone under the two different arrival flows are obtained, respectively, as shown in
Figure 8, below. Among them, the arrival flow in
Figure 8a is
, and the arrival flow in
Figure 8b is
. The dotted line represents the delay time of the drone under the two airspace structures, and the solid line represents the arrival and departure time of the drone under the two airspace structures.
As can be seen from the picture, under the two arrival flow conditions, the completion time of drones in our arrival and departure structure is around 1500 s, while in the arrival and departure structure of the control group airspace, the completion time of drones is around 2300 s. In comparison, the time taken by our arrival and departure structure is 34.8% less than that of the arrival and departure structure of the control group. Meanwhile, due to the absence of a take-off and landing separation structure in the airspace of the control group, there are numerous conflicts between departing and arriving aircraft. This increases the operational pressure on the droneport, which in turn leads to a wide-range delay. The total delay in two types of air flow with the control group’s airspace structure reaches 2341 s. In contrast, our airspace structure, equipped with a take-off and landing separation structure, achieves a delay of only 815 s, representing a 65.2% reduction in total delay.
5.2. Comparison of Sequencing Algorithm Under Different Mission Priorities
To verify the effectiveness of the proposed approach and departure sequencing algorithm under different mission priorities, this paper compares the delay time between the proposed algorithm and the FCFS algorithm. To verify whether drones with high mission priorities in this algorithm can land or take off preferentially, the remaining battery power of drones upon arrival is controlled to be sufficient. The arriving drones are divided into two groups according to mission priorities, including high-mission-priority and low-mission-priority groups (as defined in
Table 1), and the specific settings are as follows:
The settings for the drone arrival flow are as follows: The speed of the arrival flow is achieved by controlling the minimum and maximum arrival intervals of drones and set between 40 units per second and 60 units per second. This setting aims to simulate the uncertainty of drone arrivals in actual operations.
The setting of infrastructure and drone operational parameters is as follows: The number of aprons , the number of pre-take-off drone , the threshold , the number of landing corridors , the number of take-off corridors , the time required for departure , the time required for landing , the ground transfer time of the drone , the total duration for generating the arrival flow , and the power coefficient (the drone consumes 1.5% of the total power per minute).
The setting of the drone flight plan is as follows: Through a random generation method, we generated four sets of drone flight plans. An example of the drone flight plan is shown in
Table 2.
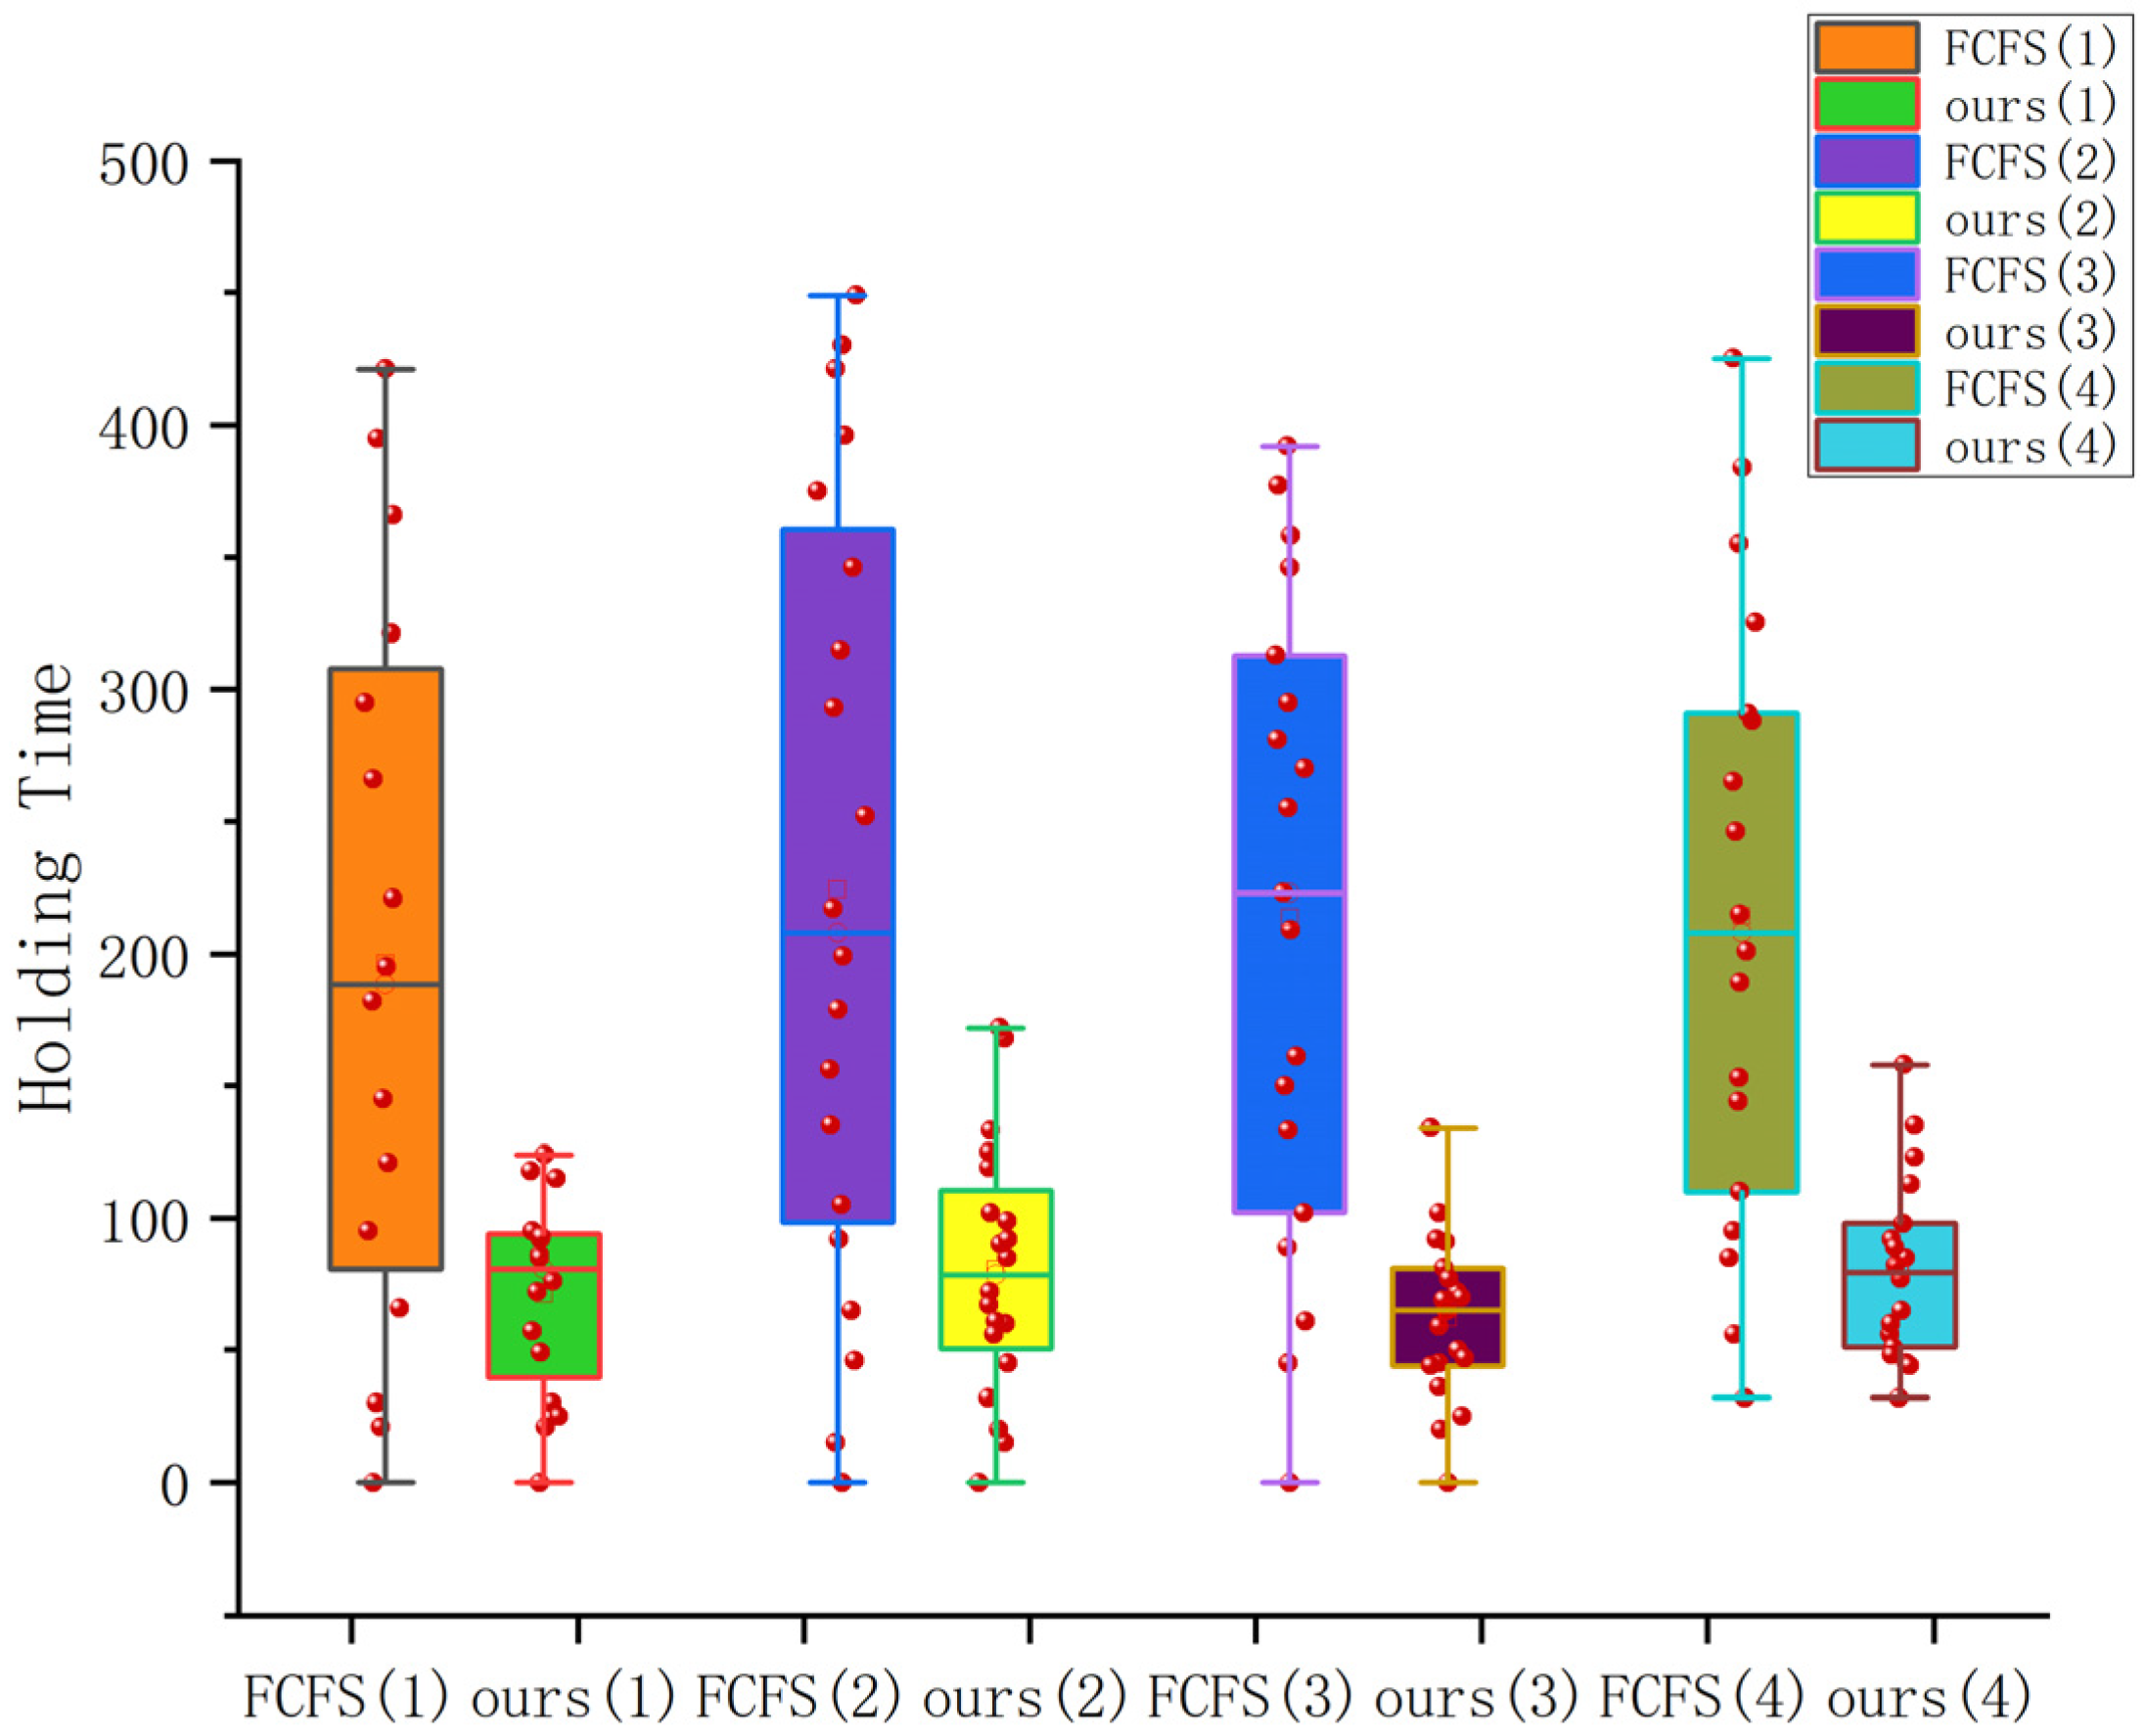
Through the above flight plan, there are a total of 136 incoming and outgoing drones, among which 73 drones are performing high-priority tasks. For the four sets of random experiments, this paper, respectively, adopted the approach and departure sequencing algorithm based on the proposed approach and the strategy based on FCFS, with the waiting times of drones performing high-priority tasks serving as the evaluation metric. The statistical results are shown in
Figure 9. According to this approach and departure sequence, taking Experiment 1 as an example, for drones numbered 0–34, the sequence for performing landing and take-off tasks is
2, 0,
3,
4, 1, 5,
6,
9,
11, 12, 7, 8, 10,
17, 13,
18, 14, 15, 16,
20,
23,
26,
28, 19, 21, 22,
33, 24, 25, 27,
30,
32, 29, 31, 34 (high-priority flight plans are bolded). From the above results, it can be seen that most of the high-priority flight plans have been executed preferentially, ensuring the timeliness of critical tasks and the efficient achievement of important flight objectives.
In
Figure 9, the waiting times of drones with high mission priorities in our method are significantly less than those in the FCFS method. Compared with the FCFS strategy, the maximum reduction in the waiting-time cost of a single drone can reach 384 s, and the average waiting time of drones is reduced by approximately 65.37%. Meanwhile, as can be seen from the figure, the distribution of waiting times under the two strategies differs significantly. Compared with the FCFS method, the waiting-time distribution of our approach is relatively more stable, with a smaller variance. This further demonstrates that our algorithm has significant advantages in optimizing the approach and departure sequencing of drones with different mission priorities.
5.3. Comparison of Sequencing Algorithms Under Low-Battery Condition
To verify whether drones with battery levels below the threshold in this algorithm can all land safely with the random flight plans, the mission priorities of drones upon arrival will be controlled to be at the same level, and the battery levels of drones when they reach the waiting area will be controlled to be low. The specific settings are as follows:
Regarding the setting for the drone arrival flow, the speed of the arrival flow is achieved by controlling the minimum and maximum arrival intervals of drones and set between 50 units per second and 70 units per second.
The infrastructure and drone operational parameter settings are the same as those in Experiment 5.2.
Through a randomly generated approach, for this paper, we generated two sets of drone flight plans and calculated the waiting times of 39 departing and approaching drones whose remaining battery levels were below the threshold under two sequencing strategies, as shown in
Figure 10 below. Among them, in (a) and (b), the blue dots represent the waiting times of low-battery drones under our sequencing strategy, and the red dots represent the waiting times of low-battery drones under the FCFS strategy.
In
Figure 10, compared with FCFS, the waiting time with our approach can be reduced for every flight plan. Under the FCFS strategy, the average waiting time of drones with critically low remaining battery power is 280.68 s. However, after sorting with our algorithm, the average waiting time of such drones is reduced by 47.3%. At the same time, there is also a significant difference in the remaining battery power of drones when they land on the ground. Under the FCFS strategy, the average remaining battery power of drones upon landing is 3.2%, while after using our algorithm for sequencing, the average remaining battery power of drones when landing on the ground is 7.45%.
Notably, after sequencing with our algorithm, all drones with critically low remaining battery power can land safely on the apron, eliminating the risk of crashes due to insufficient power. In contrast, under the FCFS strategy, during the experiment, drones numbered 25, 28, and 31 in the first group and drones numbered 30, 35, 36, and 38 in the second group crashed due to low battery power.
5.4. Computational Performance Evaluation of Large-Scale Drone Operations
To evaluate the computational performance of the proposed drone take-off and landing sequencing algorithm based on the Hungarian algorithm in large-scale drone operations, we designed a set of experiments to simulate drone traffic of different scales and measure the running time of the algorithm. The experiment was designed to verify the efficiency and scalability of the algorithm when dealing with large-scale drone operations; the specific settings were as follows:
The settings for the drone arrival flow were as follows: The speed of the arrival flow was achieved by controlling the minimum and maximum arrival intervals of drones and set between 50 units per second and 70 units per second.
The infrastructure and drone operational parameter settings were the same as those in Experiment 5.2.
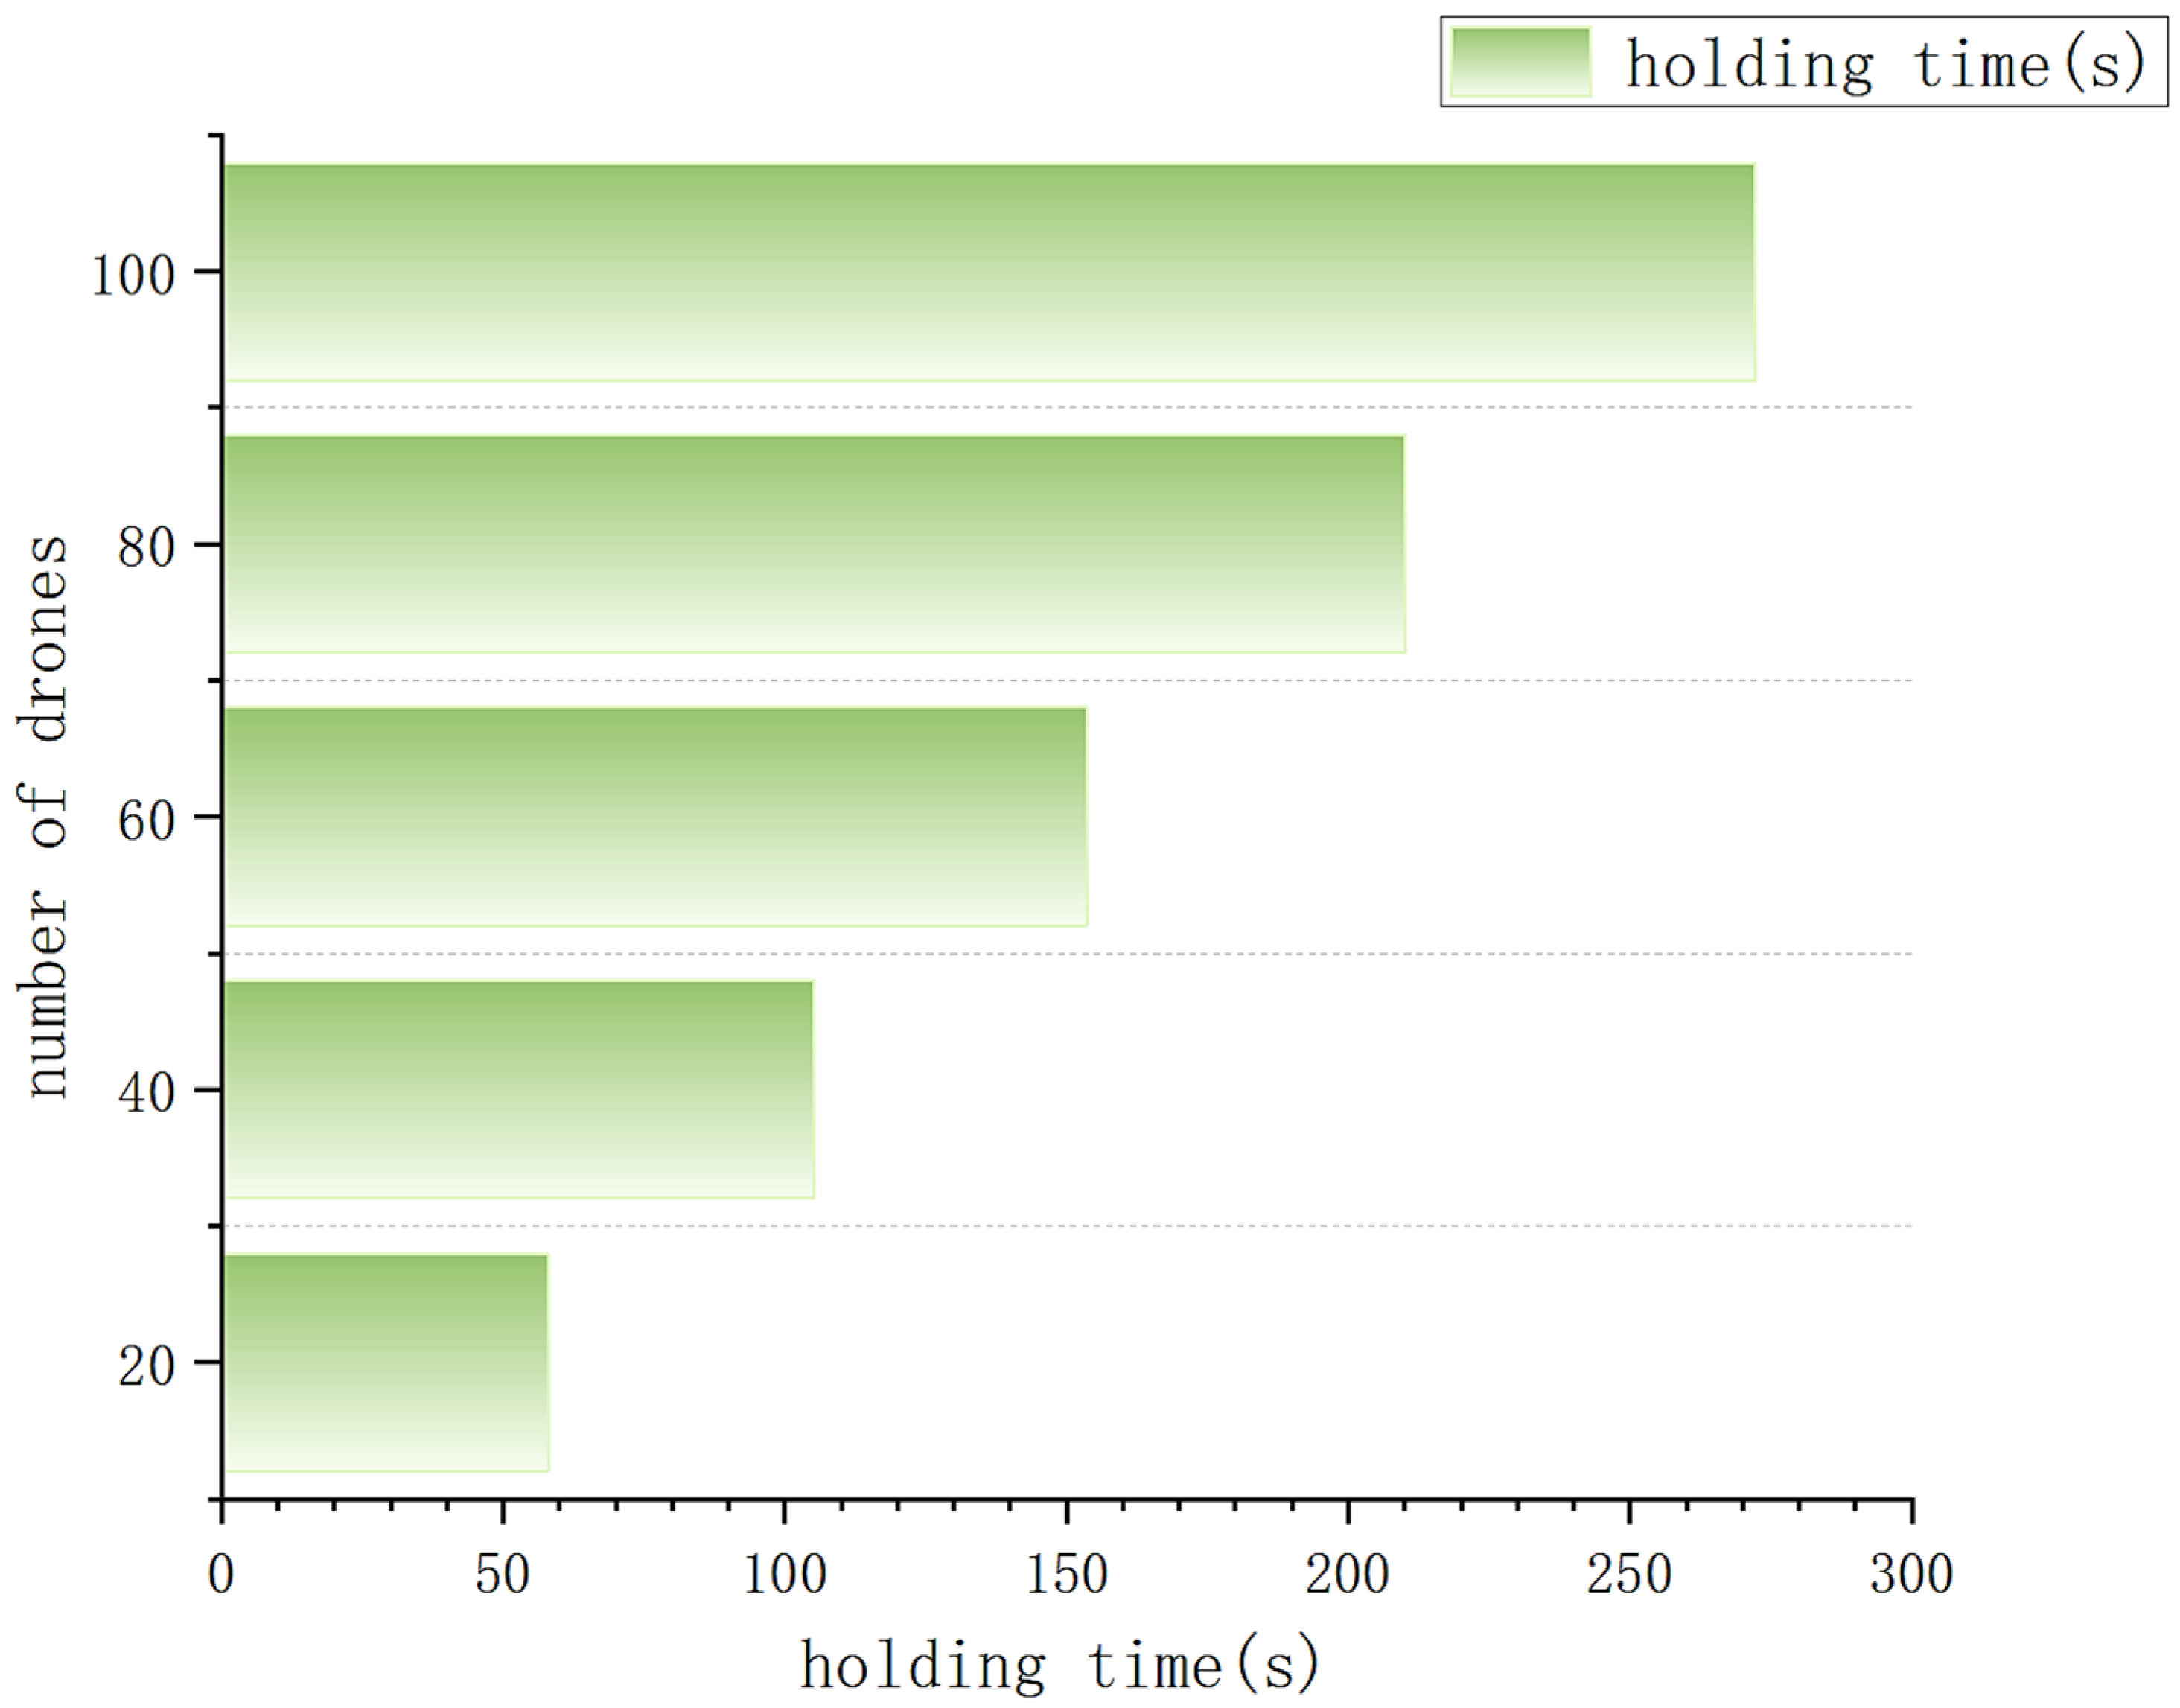
We utilized the Hungarian algorithm to calculate the aerial waiting times for scenarios involving 20 to 100 drones, respectively, as illustrated in
Figure 11 below. Additionally, to validate the computational performance of the Hungarian algorithm, we calculated the average runtime for drone traffic of varying scales, specifically for 50, 100, 200, 505, and 1005 drones, as shown in
Table 3, below. For each scale, drone traffic was randomly generated to reflect real-world conditions.
As observed in
Table 3, the running time of the Hungarian algorithm exhibits polynomial growth with increasing drone numbers. For operations involving 50 to 100 drones, the algorithm maintains a running time within 1 s, satisfying real-time requirements. Although the running time increases for medium-to-large-scale drone operations, the algorithm’s ability to optimize drone take-off and landing sequences remains significant.
At the theoretical level, we also compared the computational time complexity of our method with that of other intelligent algorithms. The time complexity of the Hungarian algorithm is
, and its advantage lies in that it can guarantee to obtain the absolute optimal solution within polynomial time. In contrast, the time complexity of the Particle Swarm Optimization (PSO) algorithm based on heuristic strategies is generally
[
36], where
represents the number of particles,
represents the problem dimension, and
represents the number of iterations (usually,
) [
37]. Although the PSO algorithm shows better scalability in large-scale problems, there is a risk of becoming trapped in local optima, and it is difficult to quantify the quality of the solution. From an analysis of computational efficiency boundaries, the Hungarian algorithm has an advantage in computational time only when the problem size
(the problem scale
in the Hungarian algorithm is smaller than the minimum of the PSO’s dimension
and iteration count
). However, in real-world scenarios, high-density operations with
are extremely rare. According to
Section 5.4, it can be seen that the Hungarian algorithm can already meet the real-time requirements in the typical scale of urban logistics drones (where
). Furthermore, as the number of drones increases, the holding time in
Figure 11 under our method exhibits a linear growth trend, demonstrating the algorithm’s robustness and maintaining stable queue management across varying drone densities.
6. Conclusions
This study presents an integrated framework designed to enhance the safety and efficiency of drone operations by combining innovative airspace design with dynamic sequencing optimization. The framework addresses two critical aspects of drone delivery: airspace structure and sequencing models. Firstly, a novel terminal airspace structure is introduced, enabling simultaneous multi-drone operations through spatially segregated routes and dedicated zones. This design effectively meets the requirements for separating the take-offs and landings of high-traffic, low-altitude, light, and small drones, while also handling emergencies. The experimental results demonstrate that this structure reduces departure and approach times by 34.8% compared to traditional configurations, thereby alleviating operational pressures on droneports. Secondly, a real-time sequencing model based on the Hungarian algorithm is developed. This model optimizes the order of drone take-offs and landings by considering factors such as battery levels and task priorities. The algorithm ensures that high-priority drones are given preference for take-off or landing, significantly reducing waiting times. Notably, the Hungarian algorithm demonstrates real-time feasibility for typical urban logistics drone scales (where ), reducing the average waiting time for low-battery drones by 47.3% and significantly mitigating the risk of crashes due to power depletion.
In the future, drone logistics operators such as Wing and Amazon can draw inspiration from the design concepts proposed in this paper when constructing their rooftop droneports, thereby reducing collision risks during take-off and landing through efficient drone take-off and landing separation mechanisms.
Despite these advancements, the study acknowledges a limitation: the absence of real-world drone delivery business data, which somewhat impacts the accuracy and generalizability of the results. Future research should focus on incorporating these data and further exploring the establishment of capacity assessment models based on different scenario characteristics to enhance the model’s applicability and robustness.


