1. Introduction
Aviation transport is responsible for 2.4% (1.2 billion tons of GHGs) of worldwide CO
2 production, i.e., approximately 12% of the transport sector [
1]; this value is expected to grow due to the increase in air traffic. According to the International Air Transport Association (IATA), in 2023, the air passenger demand rose by 24.8% compared to 2022. Annually, about 1.5–1.7 billion barrels of conventional fuels are used in the aviation sector. The IATA goal is to reduce CO
2 emissions by 50% by 2050 with respect to 2005 [
2].
Aircraft are designed for long lifetime usage; therefore, it is necessary to evaluate whether the already existing propulsion systems can be supplied with alternative, cleaner, and renewable fuels, like Sustainable Aviation Fuels (SAFs), hydrogen, and hydrogen-enriched fuels [
3]. SAFs represent the most immediate solution as they can be used without changes to the refueling system present at airports or modifications to the fuel system of the aircraft themselves [
4]. SAF can be derived from different types of biological feedstocks, and they can reduce CO
2 emissions by between 15 and 70% [
5,
6]. Such a percentage depends on the production process and the percentage in the supplying blend. However, according to the current regulations, it is possible to add to the mixture no more than 50% of SAF, even if it was demonstrated that pure SAF can power entire flights by aircraft with turbofans, for instance, the transatlantic flight of the Virgin Atlantic company with a Boeing 787 propelled by two Rolls-Royce Trent 1000 engines [
7]. The low use of SAFs is also a consequence of their cost [
8,
9], significantly higher than traditional jet fuels, due to their production and all the processes for conveying and disposing of the produced CO
2. However, these high costs are justified by the substantial reduction in CO
2 emissions (up to 100%).
Another interesting possible alternative fuel for aviation is hydrogen since it produces only H
2O as a direct product [
10,
11]. Nevertheless, despite being the most abundant element in nature, H
2 is not available as an independent molecule to be burned, but it is generally found in chemical compounds [
12], and extraction processes need to be carried out. Hydrogen can be produced through different processes, but the most interesting from an environmental point of view is water electrolysis which exploits electrical energy to split water into hydrogen and oxygen; indeed, if the electricity used during the process is obtained from a renewable energy source, like solar or wind power, it is possible to produce “green” hydrogen, a net-zero carbon fuel produced with efficiency levels of approximately 75% [
13,
14].
The future use of hydrogen has been planned by many industrialized countries, and the investigation of its combustion performance represents a fundamental topic for the feasibility of this fuel in the aviation field. Studies in refs. [
15,
16] explore the potential of hydrogen gas turbine engines for sustainable aviation for zero CO
2 emissions and high energy density. Its widespread adoption is prevented by the significant challenges in production, infrastructure, storage, aircraft design, and combustion technology. While SAF is expected to dominate future advances, alternative solutions such as hydrogen-fueled gas turbine engines could offer superior performance, thus representing an intermediate step towards hydrogen-only gas turbine engines.
Although the use of hydrogen features many advantages [
17], it cannot be a short-term solution because it requires substantial changes to the refueling systems [
18]; also, airplanes must be equipped with adequate tanks and adequate fuel injection systems [
19,
20].
To this aim, many researchers have been investigating the options and challenges for a successful introduction of hydrogen in aviation from an economic point of view [
10]. Indeed, some experimental projects have been implemented over the years on gas turbines for propulsion, like the hydrogen prototype already tested in 1937 [
21].
Considering a generic mixture of hydrocarbons for kerosene [
22], as observable in
Table 1, hydrogen features a lower heating value (LHV) of almost three times higher, but the energy density is about four times lower. This means that the same flight requires a fuel volume of four times greater as well. Such limit requires the study of new designs of aircraft to implement adequate tanks [
23,
24,
25]. In addition,
Table 1 reports the stoichiometric air-to-fuel ratio (α
ST), where the high air mass flow rates are ensured considering that gas turbines operate with a high air excess.
Different systems can be used for storage depending on the physical characteristics of hydrogen or tank materials [
27,
28]. Currently, the best on-board hypothesis of solutions for aircraft is the storage of liquid hydrogen (LH
2) with a temperature of about 20 K and a pressure of 1–2 bar [
29,
30]. In this way, the fuel can easily flow inside the duct system. However, before reaching the turbine, it must return into gas conditions to take advantage of the gaseous properties during the mixing and burning phases. As a matter of fact, a gasification system must be added to the injection system before entering the combustion chamber, increasing the complexity and costs. Ebrahimi at al. [
31] report an in-depth analysis of LH
2 fuel and thermal management systems for gas turbine engines in the aviation field. In the literature, there are numerous examples of works and research projects considering the use of liquid hydrogen for turbofan engines. In fact, there is a growing level of interest in investigating liquid hydrogen propulsion systems, although the selection and arrangement of components within the fuel system remains a critical area of investigation.
A further important issue linked to the use of hydrogen as fuel is the production of nitrogen oxide (NO
x) emissions, caused by the high adiabatic flame temperature of hydrogen combustion. The formation can be reduced by using lean burn or partially premixed combustion, but instability problems and flashback may occur [
32]. Computational fluid dynamics (CFD) is a useful tool in the development of combustion technology, and reliable models for hydrogen combustion chemistry and its interaction with turbulent flow are needed. A detailed model of chemical kinetics is needed to obtain accurate numerical predictions of NO
x formation [
33].
Looking at the methods for turbofan engine simulations, in [
34], the General Electric GE90 turbofan engine is thermodynamically simulated in MATLAB in both hydrocarbon fuel and hydrogen fuel usage states under design point conditions. A genetic algorithm is used to determine the best bypass ratio and fan pressure ratio to achieve the optimum performance and environmental conditions for a hydrogen-fueled engine. The optimal bypass ratio for a hydrogen-powered General Electric GE90 turbofan was determined to be 10.2965, higher than that of conventional jet fuel engines. Similarly, the fan pressure ratio must be adapted, with an optimal value of 1.6111, ensuring efficient thrust production while maintaining fuel efficiency. Another critical aspect is emissions management. While hydrogen combustion eliminates CO₂ emissions, nitrogen oxides can still form due to the high combustion temperatures. However, with optimized operating conditions, NO
x emissions per unit of thrust are reduced by 68.25% compared to hydrocarbon-based operation. Another example of thermodynamic analysis can be found in [
35] with regard to a TF33 turbofan engine fueled by hydrogen as opposed to kerosene. Using hydrogen instead of kerosene in the take-off phase, it was found that the fuel flow is reduced by 64% for the same energy rate of fuels, and therefore the specific fuel consumption decreases by 60%. Energy efficiency, however, is reduced only slightly while the cost of fuel increases by 290%. The combustion chamber outlet temperature using hydrogen is lower with respect to kerosene fuel. The environmental impact factor increases.
Based on the above considerations and on the state of the art in turbofan engine simulations, it can be concluded that appropriate calculation tools can be helpful for the analysis of the phenomena inside a gas turbine combustor, especially when the conventional fuel is replaced by a different mixture with strong variations in physical-chemical characteristics. Therefore, the authors’ contribution to the study of a turbofan burner is expressly addressed to the CFD-based analysis of the combustion process, by comparing the phenomena that take place in the case of hydrogen supply with those occurring with the use of kerosene, which is assumed as a reference fuel, both in terms of performance and nitrogen oxide emissions. Actually, the novelty contents in this article mainly consist of a thorough examination of the flow and thermochemical property distribution throughout a combustor specifically design for aircraft under different typical conditions in a flight mission. This allows the comparison of the different fuel performance, in terms of combustion effectiveness and pollutant emission as well as as a result of the multidimensional simulation of the reacting flow.
In the following, a thermodynamic model is firstly built and validated based on the data of the turbofan GE90 engine produced by General Electric and equipping the Boeing 777. Secondly, some operating conditions of a flight, performed by the selected aircraft, are simulated using kerosene and hydrogen, and the results are compared in terms of performance and thermodynamic properties. The latter are used as the boundary conditions of the burner to study the combustion process of both fuels via a CFD approach under very different operating conditions: take-off, climbing, and cruise. For each one of these conditions, the comparison between the two fuels is discussed in terms of both lumped parameters and overall performance and results from the CFD based simulation.
2. GE90 Turbofan Engine Model
The engine selected for this study is of the GE90 type, which is one of the most powerful aeronautical engines powering the Boeing 777, a medium- to long-range twin-engine aircraft.
In
Table 2, the main operating conditions and engine characteristics are reported in cruise and take-off modes [
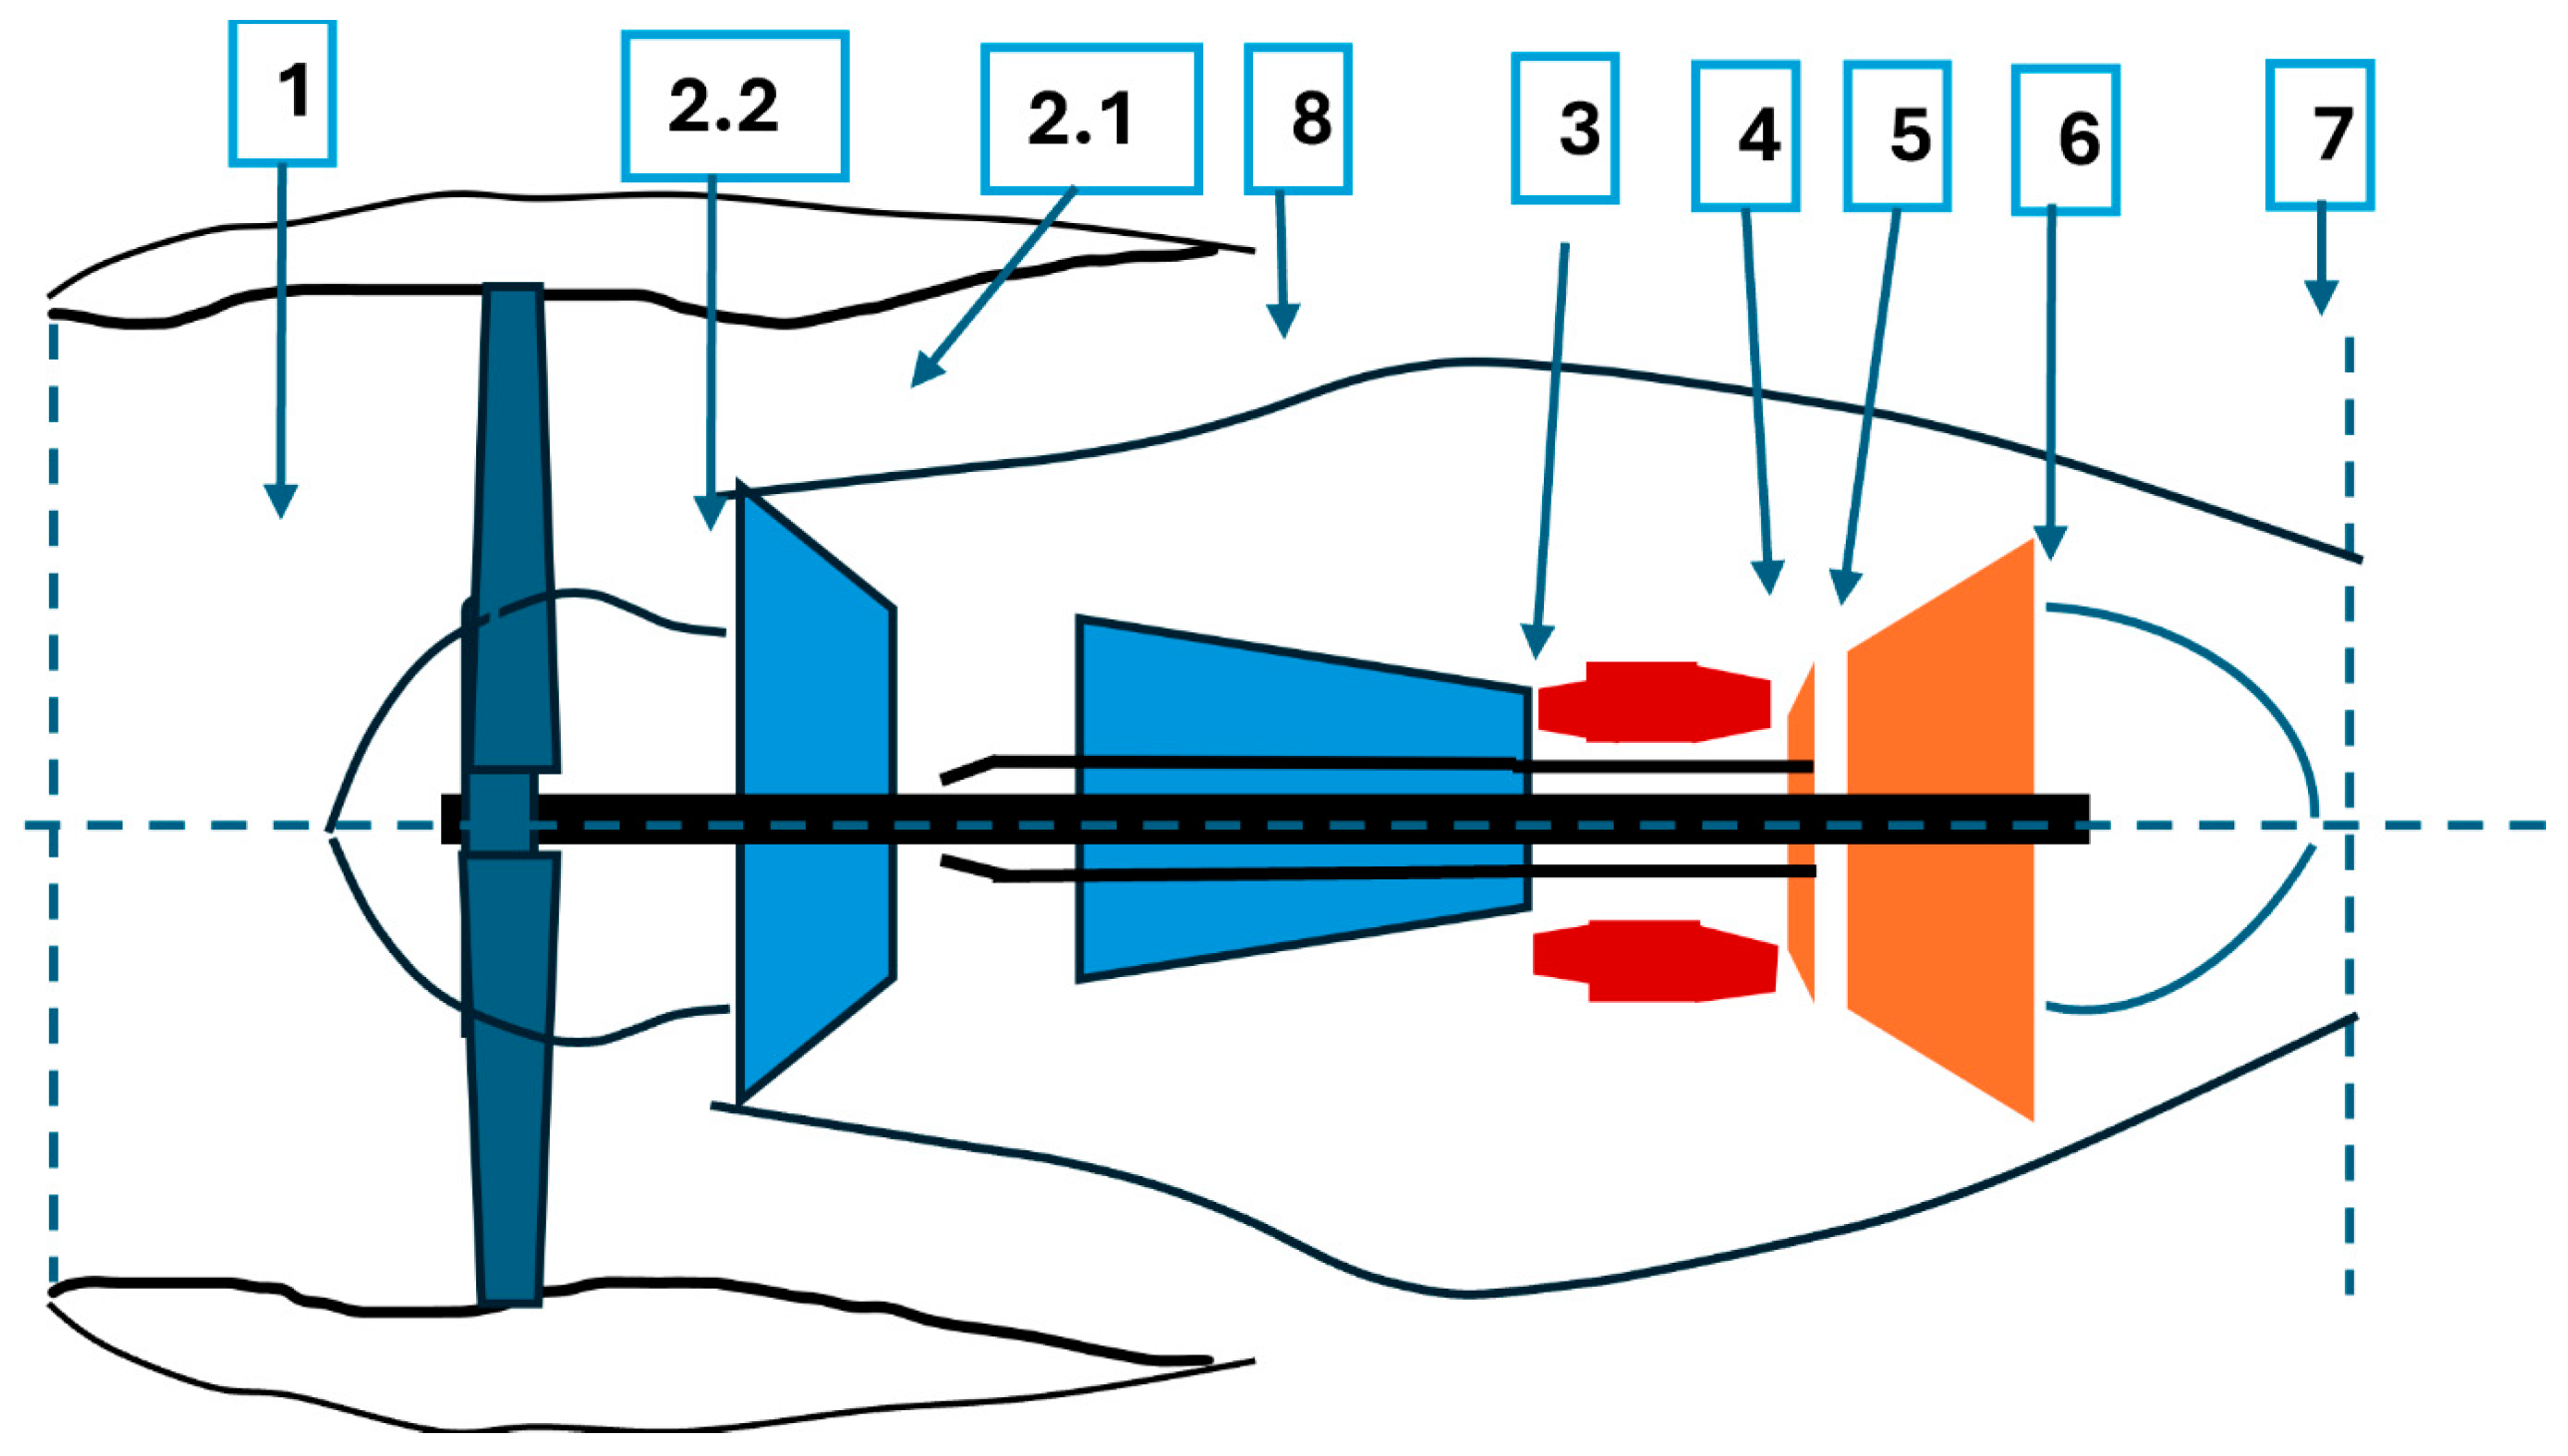
36]. The engine is an unmixed flow turbofan consisting of a fan, a low-pressure compressor (LPC) with 3 stages, a high-pressure compressor (HPC) with 10 stages, the combustion chamber, a high-pressure turbine (HPT) with 2 stages, and low-pressure turbine (LPT) with 6 stages. The two-spool asset foresees that the fan and the LPC are driven by the six-stage LPT, while the HPC is driven by the HPT.
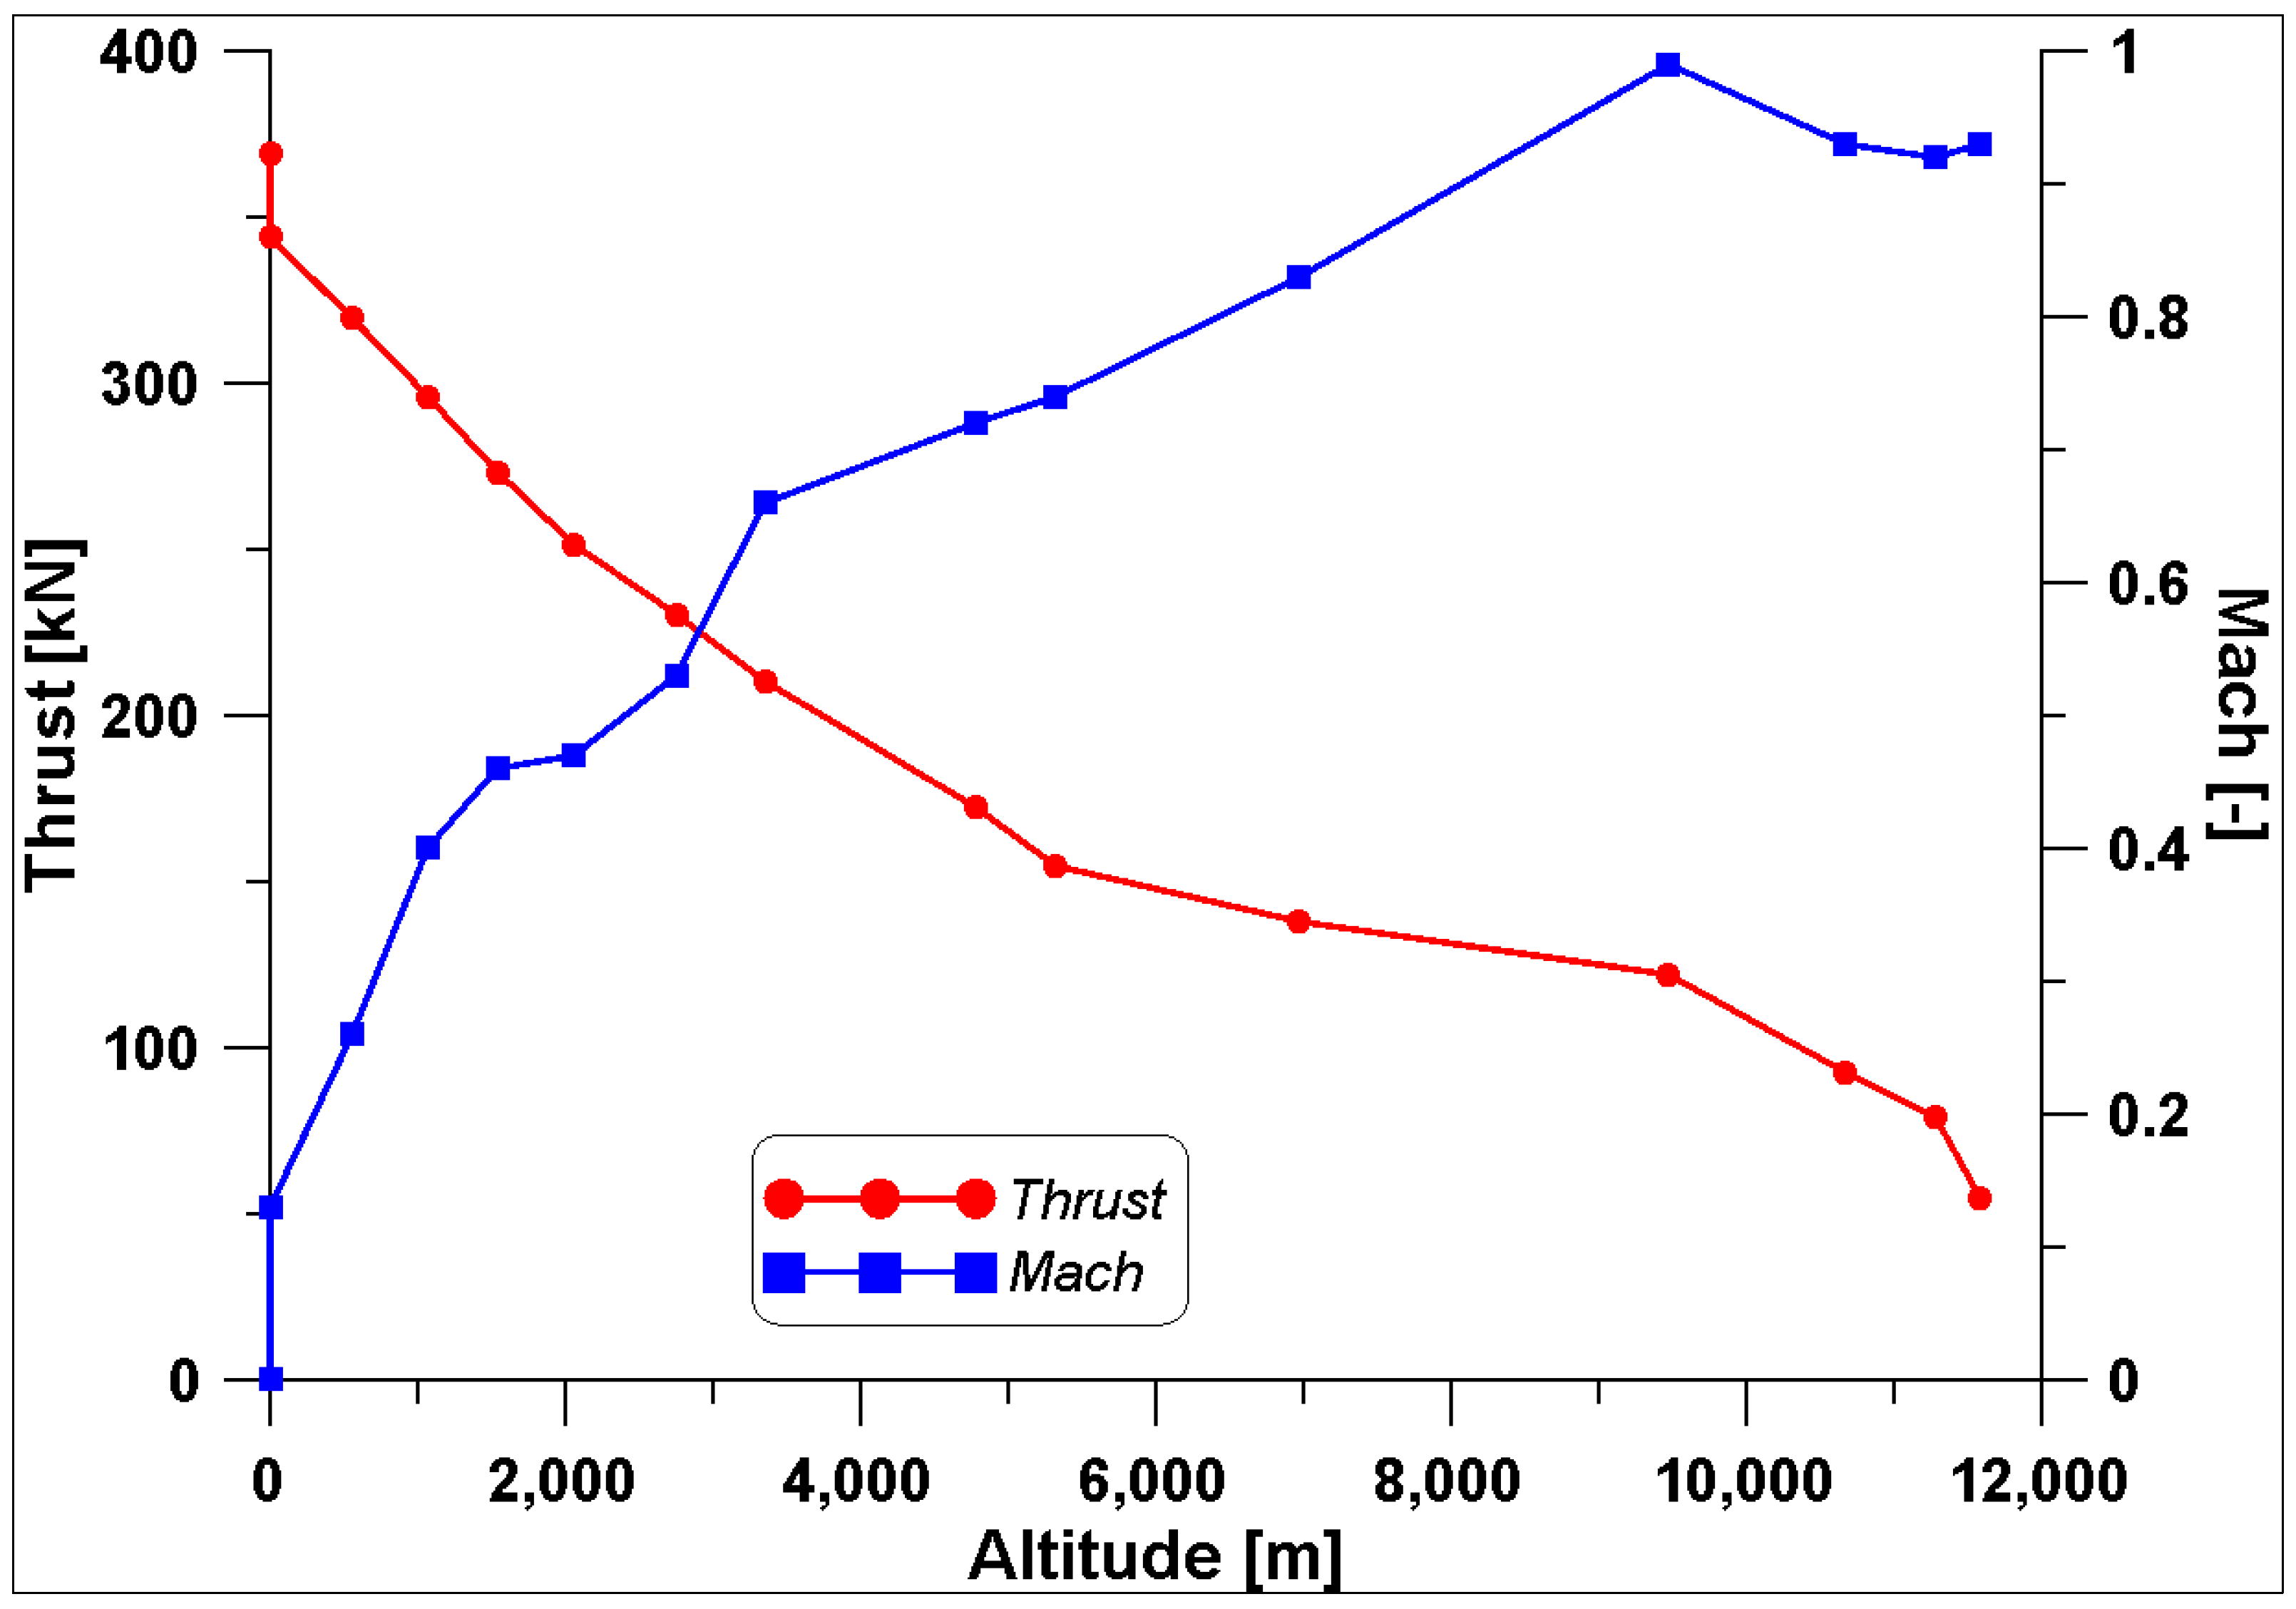
The overall pressure ratio (OPR) is obtained by multiplying the pressure ratios (PRs) of the above-mentioned components. Actually, the first increase in pressure is obtained in the dynamic air intake (DAI) before the fan. Moreover, the engine features a high by-pass ratio (BPR) allowing a reduced specific fuel consumption (SFC). The Mach number and the aircraft speed (Ca) are representative of the operating point; at take-off, they are equal to zero. It is known that when the altitude increases, the ambient pressure and temperature decrease, together with the air density. Consequently, a reduced air mass flow rate is introduced into the engine. At every operating condition, a correct combustion development should be ensured. Therefore, the preliminary information provided by the thermodynamic analysis must be checked via a more refined CFD study.
Commercial software allowed the setting up of a thermodynamic model considering the typical layout of an unmixed flow turbofan as shown in
Figure 1. The several numbers indicate the different thermodynamic points where a change of mass flow, temperature, or pressure is identified. Further information about the efficiency of the several components is reported in
Table 3.
By using the data in
Table 2, at the design point, the model is set up considering kerosene as the fuel. The values of altitude, Mach, air mass flow rate, turbine inlet temperature (TIT), and BPR are assigned, and a validation of the model is obtained by verifying the achievement of nominal thrust (
Table 4). In the same table, it is possible to observe that also the fuel mass flow rate and SFC values match those declared by the manufacturer with an error of around 5%. After this simulation, the engine size and operating maps are considered fixed, and at this operating point, the non-dimensional spool speed is equal to 1.
From the simulations, it is also possible to quantify the air bleeding for the turbine blade cooling. In this engine, about 11% of the air leaves the compressor and is introduced upstream (5%) and downstream (6%) of the high-pressure turbine.
To check the reliability of the model, a second operating point (take-off), whose conditions are also available in
Table 2, is simulated. However, this point is considered an off-design condition, and only the altitude, Mach, and TIT values are assigned. In order to match the take-off thrust, a scaling of the high pressure spool speed is needed. Similarly, different scaling factors are assigned under any other operating condition. The results in
Table 5 demonstrate again that the model can reproduce different operating conditions. It is also worth noting that the thrust and SFC levels are very close to those reported on the GE90 ICAO Data sheet [
37].
The non-dimensional high-pressure spool speed assumes a value equal to 1.095. Via a linear correlation, it is possible to evaluate the spool speed and the other parameters for the intermediate conditions as well.
4. CFD Combustion Modelling
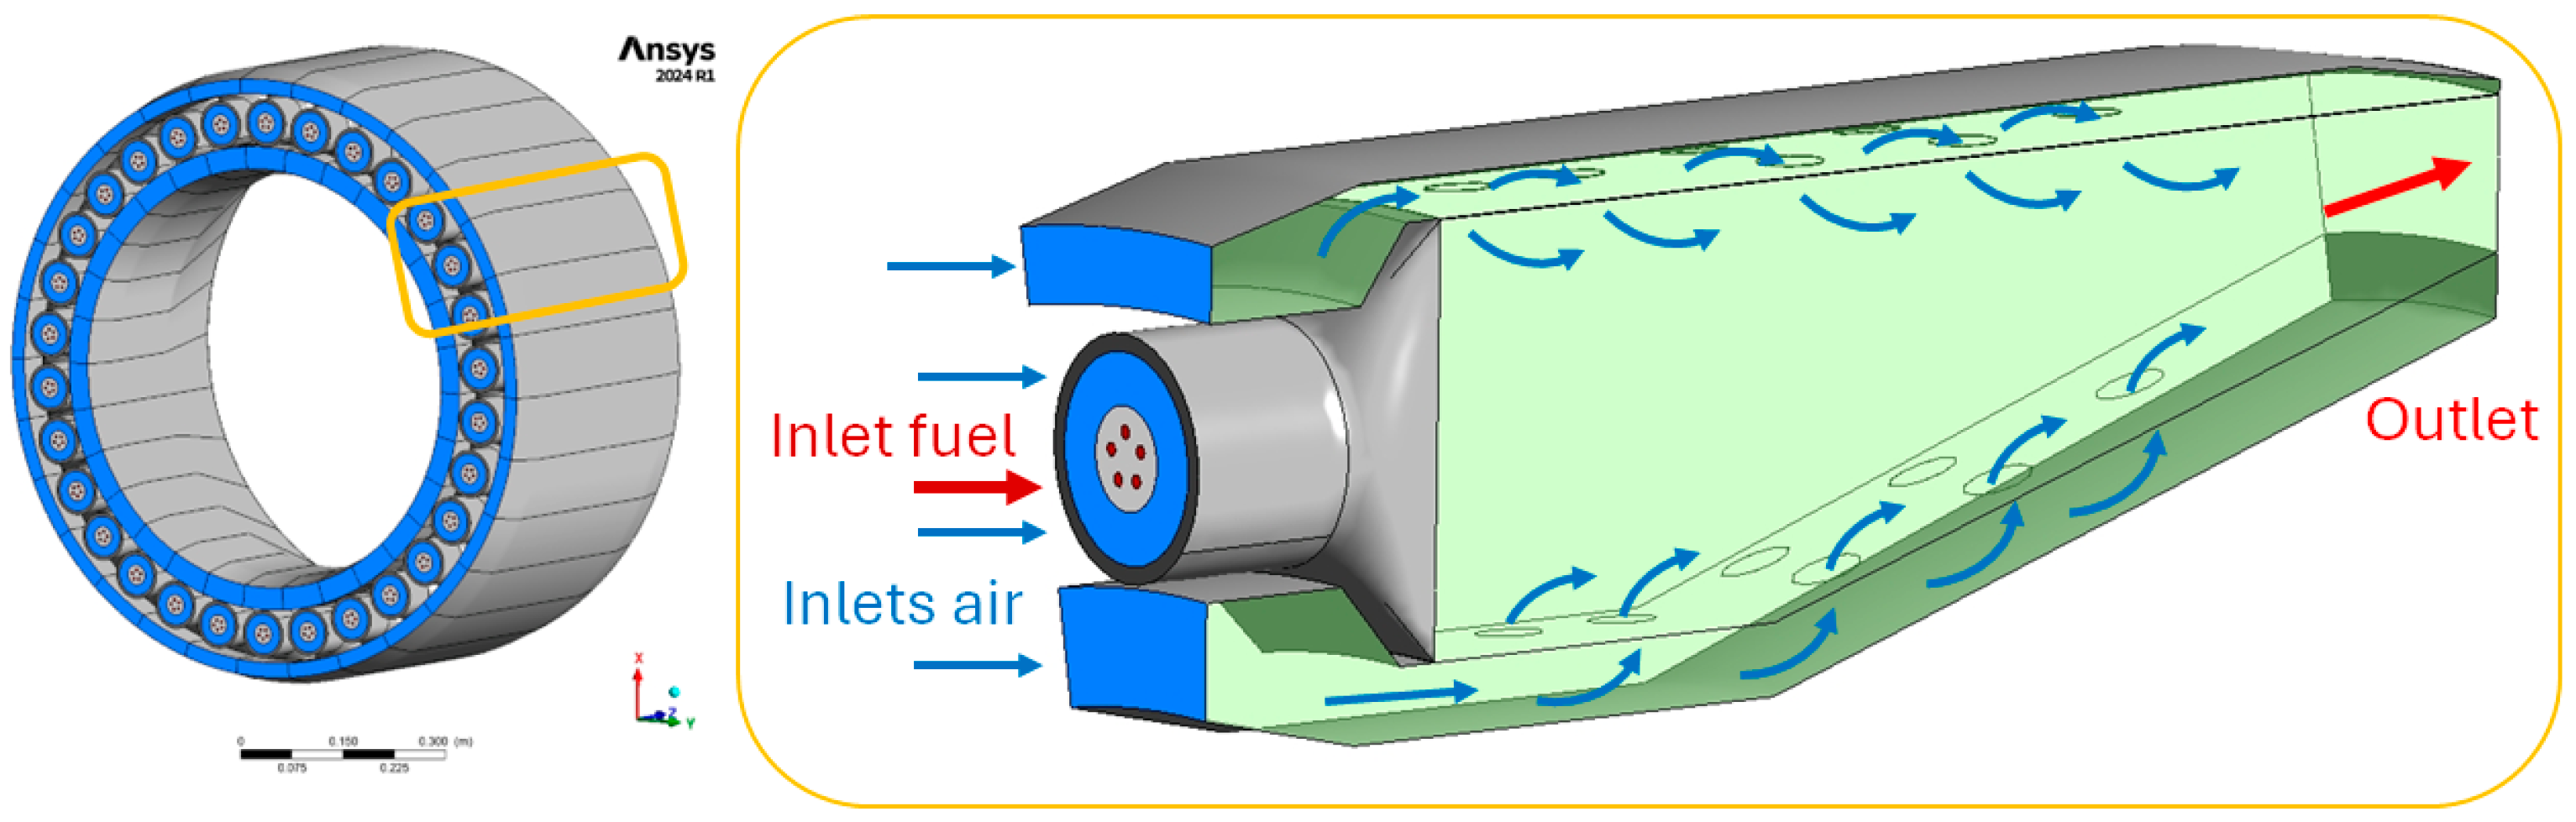
The combustor of the GE90 engine is of the annular type, and in this preliminary study, a simplified geometry of the same type is adopted. The burner features 30 injectors equally spaced every 12°; hence, the symmetry of the component allows the restriction of the computational domain to a 12° sector so reducing the computational efforts (
Figure 4). As observable from the same
Figure 4, the burner is characterized by a core embedded in a liner, divided into two regions (internal and external), which communicate with the core via 14 dilution holes. Air enters all regions but, upstream of the core air inlet, a swirler induces a swirled flow. Fuel is injected only in the core: when the fuel is liquid (kerosene) injection is set as a pressure swirl atomizer source, while a gaseous fuel (hydrogen) is introduced via five holes evidenced in red in
Figure 4.
All the simulations with kerosene are performed using an unsteady solver, due to the presence of the injection process. The flow field is modeled via the RANS, whose governing equations are reported as follows:
The mass balance is completed by using the mass conservation equations of the species involved in the reacting flow. The source terms in these equations as strictly related to the chemical kinetics scheme, as described in the following. In the case of liquid fuel injection, a source term is also introduced in Equation (1) to take into account the droplet evaporation.
The second member of Equation (2) includes the static pressure, the stress tensor which is calculated via the correlation (3), the gravitational body force, and external body forces, respectively.
Turbulence is modeled with the Standard k-ω model, which introduces the variables, the turbulent kinetic energy (k) and the specific dissipation rate (ω) and relative transport equations [
40]:
where:
Γ represents the diffusivity effects;
G is the generation term;
Y is associated with the dissipation of k and omega due to turbulence;
S is the source term.
Kerosene is injected as a liquid, considering the C
12H
23 species as a surrogate [
41] since its properties are close to those of kerosene [
26]; then, the Kelvin–Helmholtz/Rayleigh–Taylor (KH-RT) model is used to describe the primary and secondary breakup. Kerosene oxidation is described by using the Finite Rate/Eddy Dissipation (FRED) model. Equations (7) and (8) calculate the kinetic and the turbulent rate of reaction, respectively; the smaller one is used as the actual net rate.
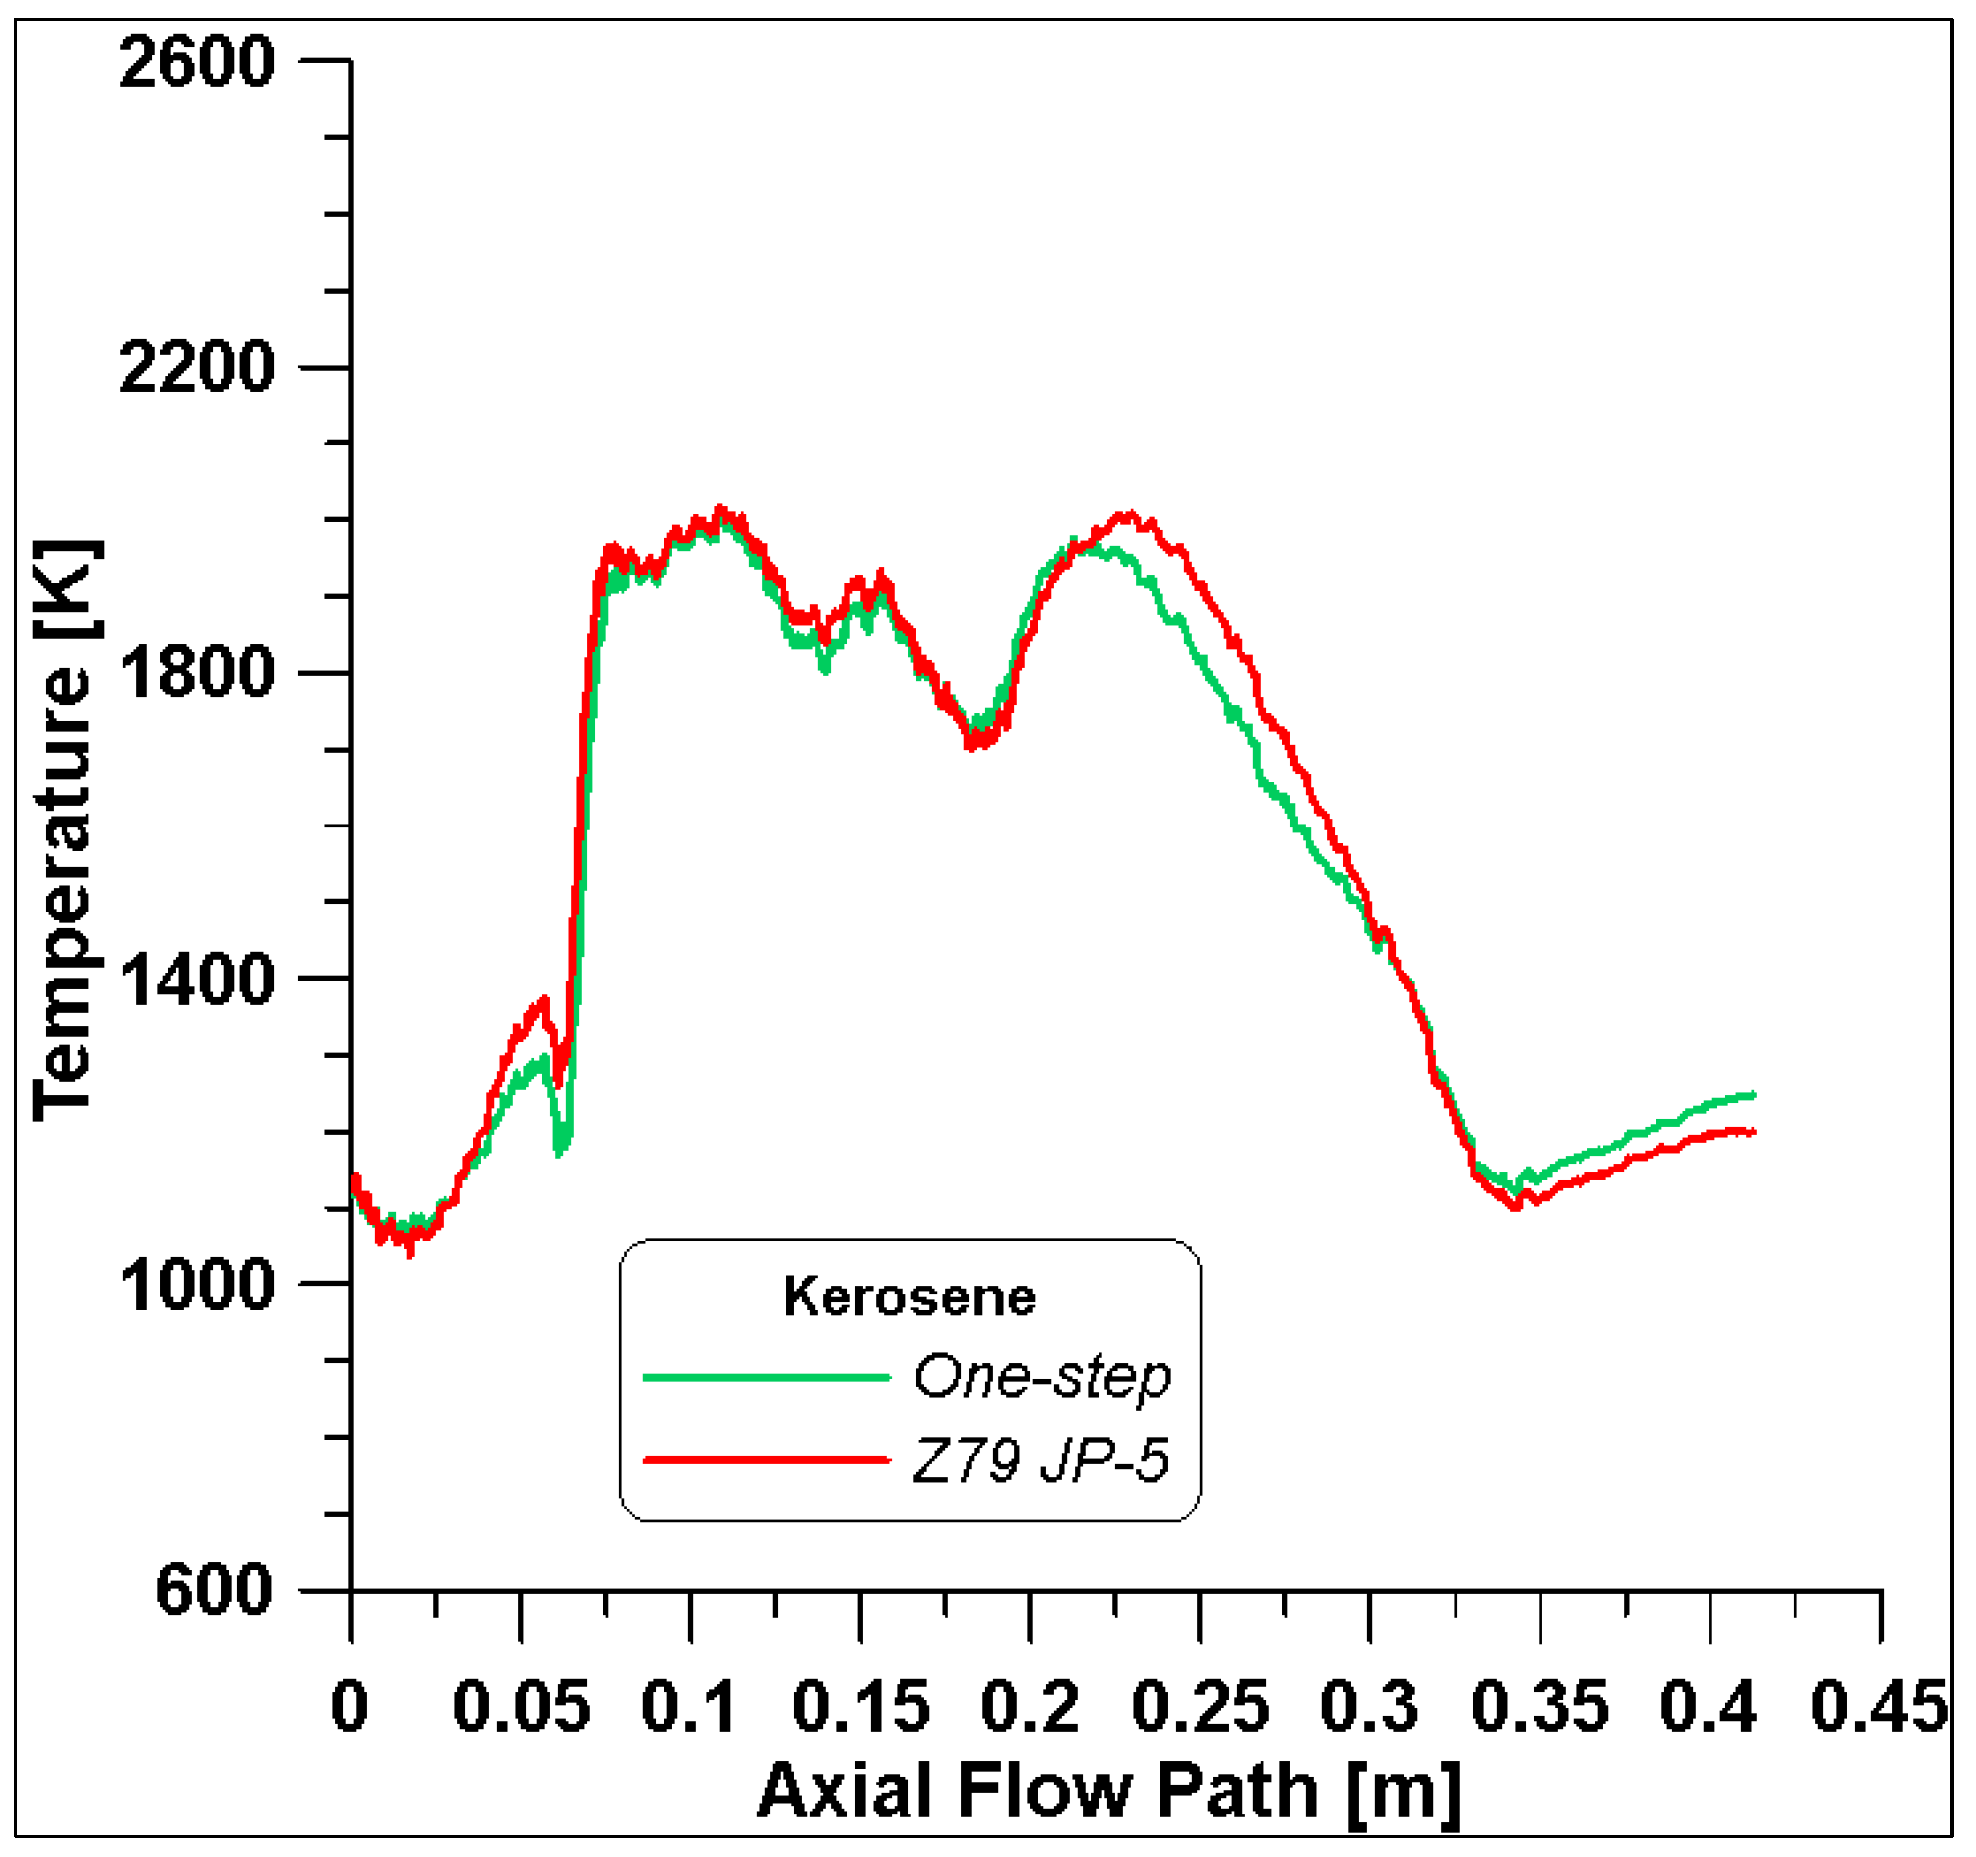
Of course, the kinetic rate is obtained via a reaction mechanism. Two kinetic schemes were tested: the first is a one-step reaction, but two additional reactions are included for the dissociation of CO
2 into CO and vice versa (
Table 9); the second one is a detailed mechanism consisting of 32 species and 79 reactions called Z79 JP-5 [
42]. In both cases, the Zel’dovich mechanism incorporated into Fluent is activated to calculate the thermal NO emissions.
Due to the significant computational costs associated with the use of the detailed scheme, the one-step reaction is used for the simulations. Indeed, from
Figure 5, it is possible to observe that an acceptable compromise can be obtained with similar outcomes and reduced calculation times.
Simulations with hydrogen are performed using the same turbulence model. Hydrogen is injected in a gaseous state; therefore, the spray development process is not considered. Differently, hydrogen combustion is modeled via the Eddy Dissipation Concept (EDC) in Equation (9) where the chemical kinetics, a mechanism consisting of 105 reactions and 21 species by Naik [
43], is incorporated into turbulent flames. This mechanism also includes a chain of reactions for the evaluation of the thermal NO
x as well.
The terms in Equation (9) are the Kolmogorov (
), time scale (
), and the species mass fraction (
). Further details can be found in ref. [
40].
4.1. Mesh Sensitivity
Although only a 12° sector of the geometry is used as the computational domain, to further reduce the numerical costs and to assess the reliability of the results, a mesh sensitivity analysis is performed to establish the proper dimension of the grid. Four tetrahedral mesh grids are created by enhancing the number of cells, which means reducing the dimension of the cells (
Table 10).
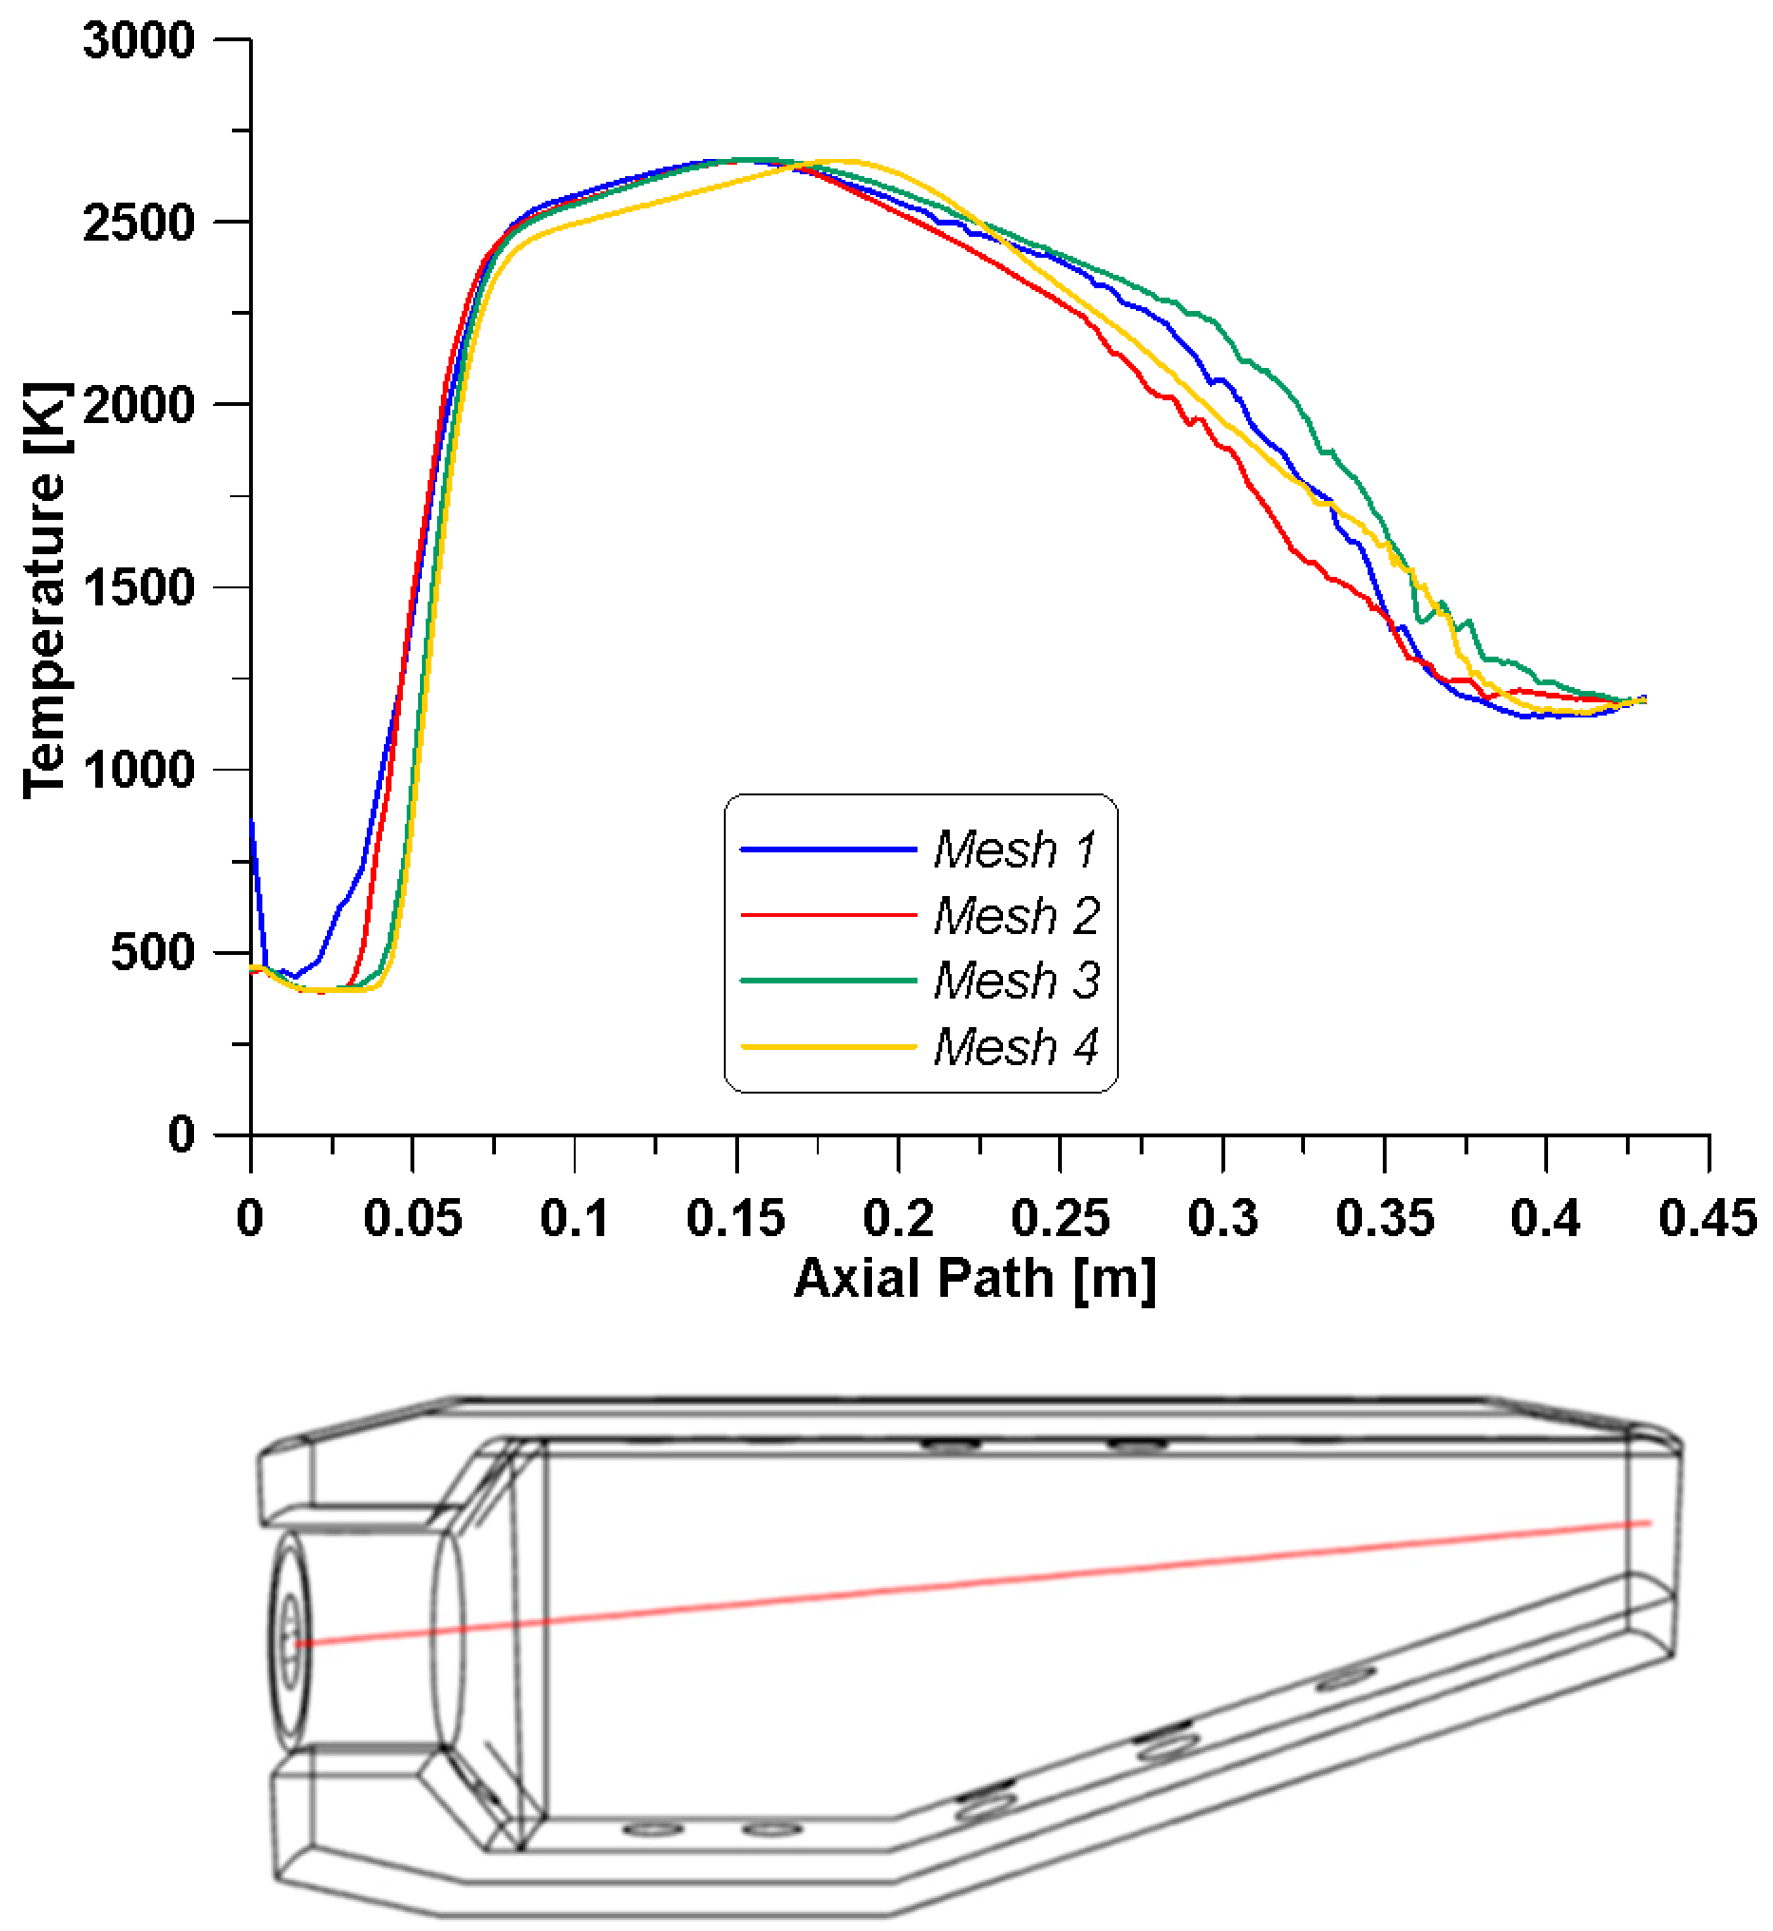
To compare the outcomes of the different grids, the temperature profiles are illustrated in
Figure 6 (up). Such variable is assessed along a line which crosses the burner, starting from the center point of the inlet core surface and running to the center of the outlet (
Figure 6—down).
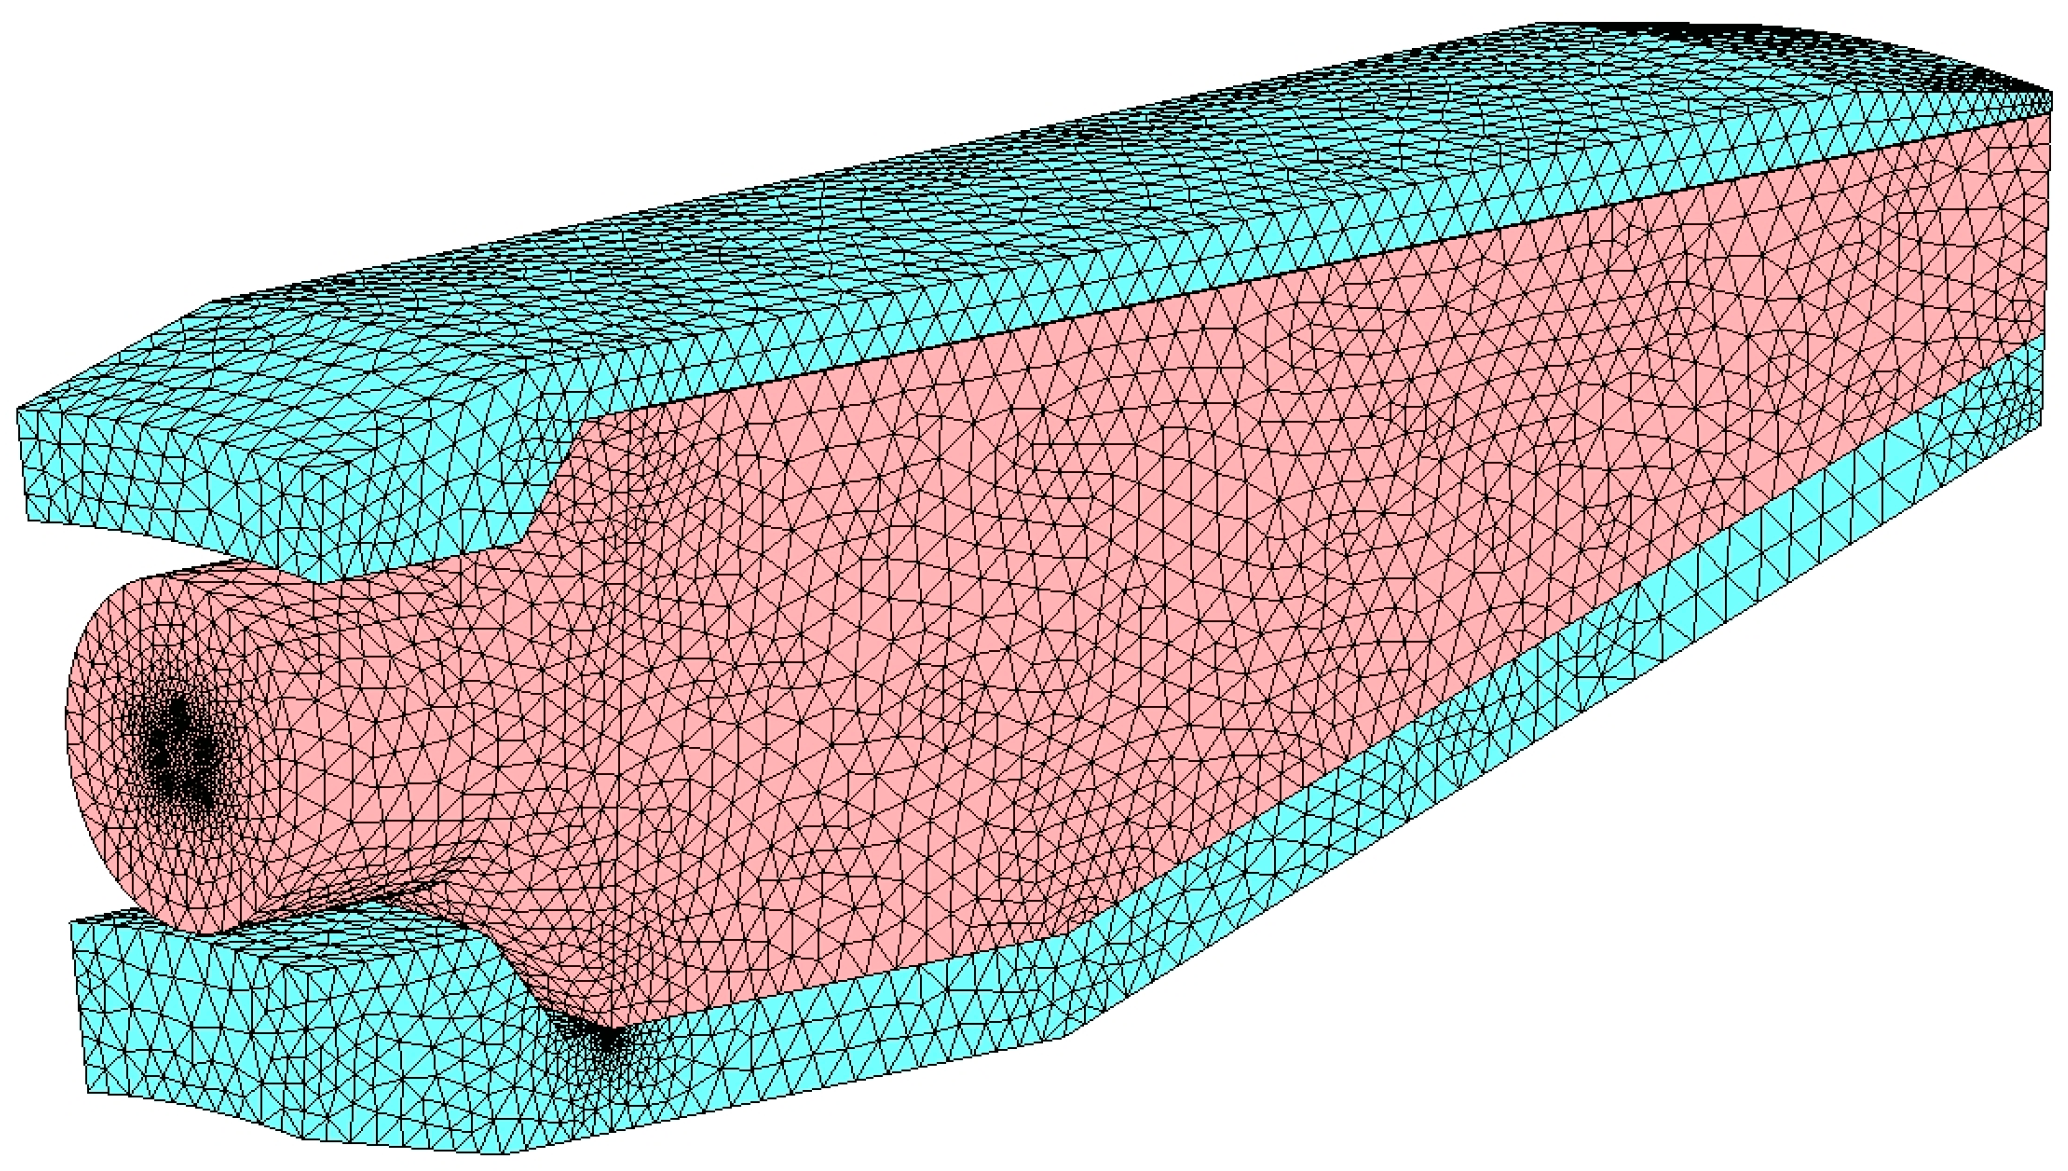
Except for the coarsest mesh that features a different temperature trend in the first part of the burner (up to 0.05 m), the other three grids reproduce a similar behavior. For this reason, the chosen grid is the one consisting of almost 130 thousand cells, that is, mesh number 2 in
Table 10 and displayed in
Figure 7.
4.2. Test Cases
With the aim of reducing greenhouse gas emissions, in particular CO2, in this work, kerosene is replaced by hydrogen. In the previous chapter, it is demonstrated that hydrogen, thanks to its high LHV, allows a significant reduction in SFC and being a carbon-free fuel, important benefits are expected from an environmental point of view. Nevertheless, aircraft run at different altitudes, which implies very different ambient conditions, and some of them can be considered extreme. The engine must ensure efficient combustion development during the entire flight. For this purpose, CFD represents a useful tool to evaluate and compare the oxidation process of both fuels.
To set up the CFD calculations, the boundary conditions listed in
Table 11 and
Table 12 are used for the three selected flight conditions for kerosene and hydrogen, respectively. Temperature and pressures at the inlet and outlet of the burner (stations 3 and 4 in
Figure 1) are retrieved from the thermodynamic model. Since the computational domain includes three regions, the correct distribution of the inlet air mass flow can be obtained by setting the same inlet pressure (p
3) at the three air inlets. As said, a swirl motion is also imposed on the air entering the core in order to match the total air mass flow obtained from the thermodynamic model. In
Table 11 and
Table 12, the values of the total and core air mass flows are reported as well; in all cases, it is observable that the air mass entering the core region is 35% of the total mass. Moreover, the equivalence ratios are calculated as follows:
where
with
values reported in
Table 1.
As known, gas turbines operate with very lean mixtures, achieving the minimum value of φ under the cruise conditions. The use of hydrogen leads to an even leaner mixture because the entering air is not particularly affected by the changing of the fuel. Nevertheless, ignition occurs in the core region; therefore, to ensure the start of the oxidation process, the local equivalence ratio (φ
core) should be close to the stoichiometric value, as it happens in simulations with kerosene, especially during climbing. Despite the leaner conditions of the air–hydrogen mixture, due to the wide flammability limits of this gaseous fuel [
22], it is expected that a correct combustion development is guaranteed for a wide range of operating conditions; indeed, it is necessary to investigate how H
2 spreads in the combustion chamber, taking into account its high diffusivity (
Table 1).
5. Results and Discussion
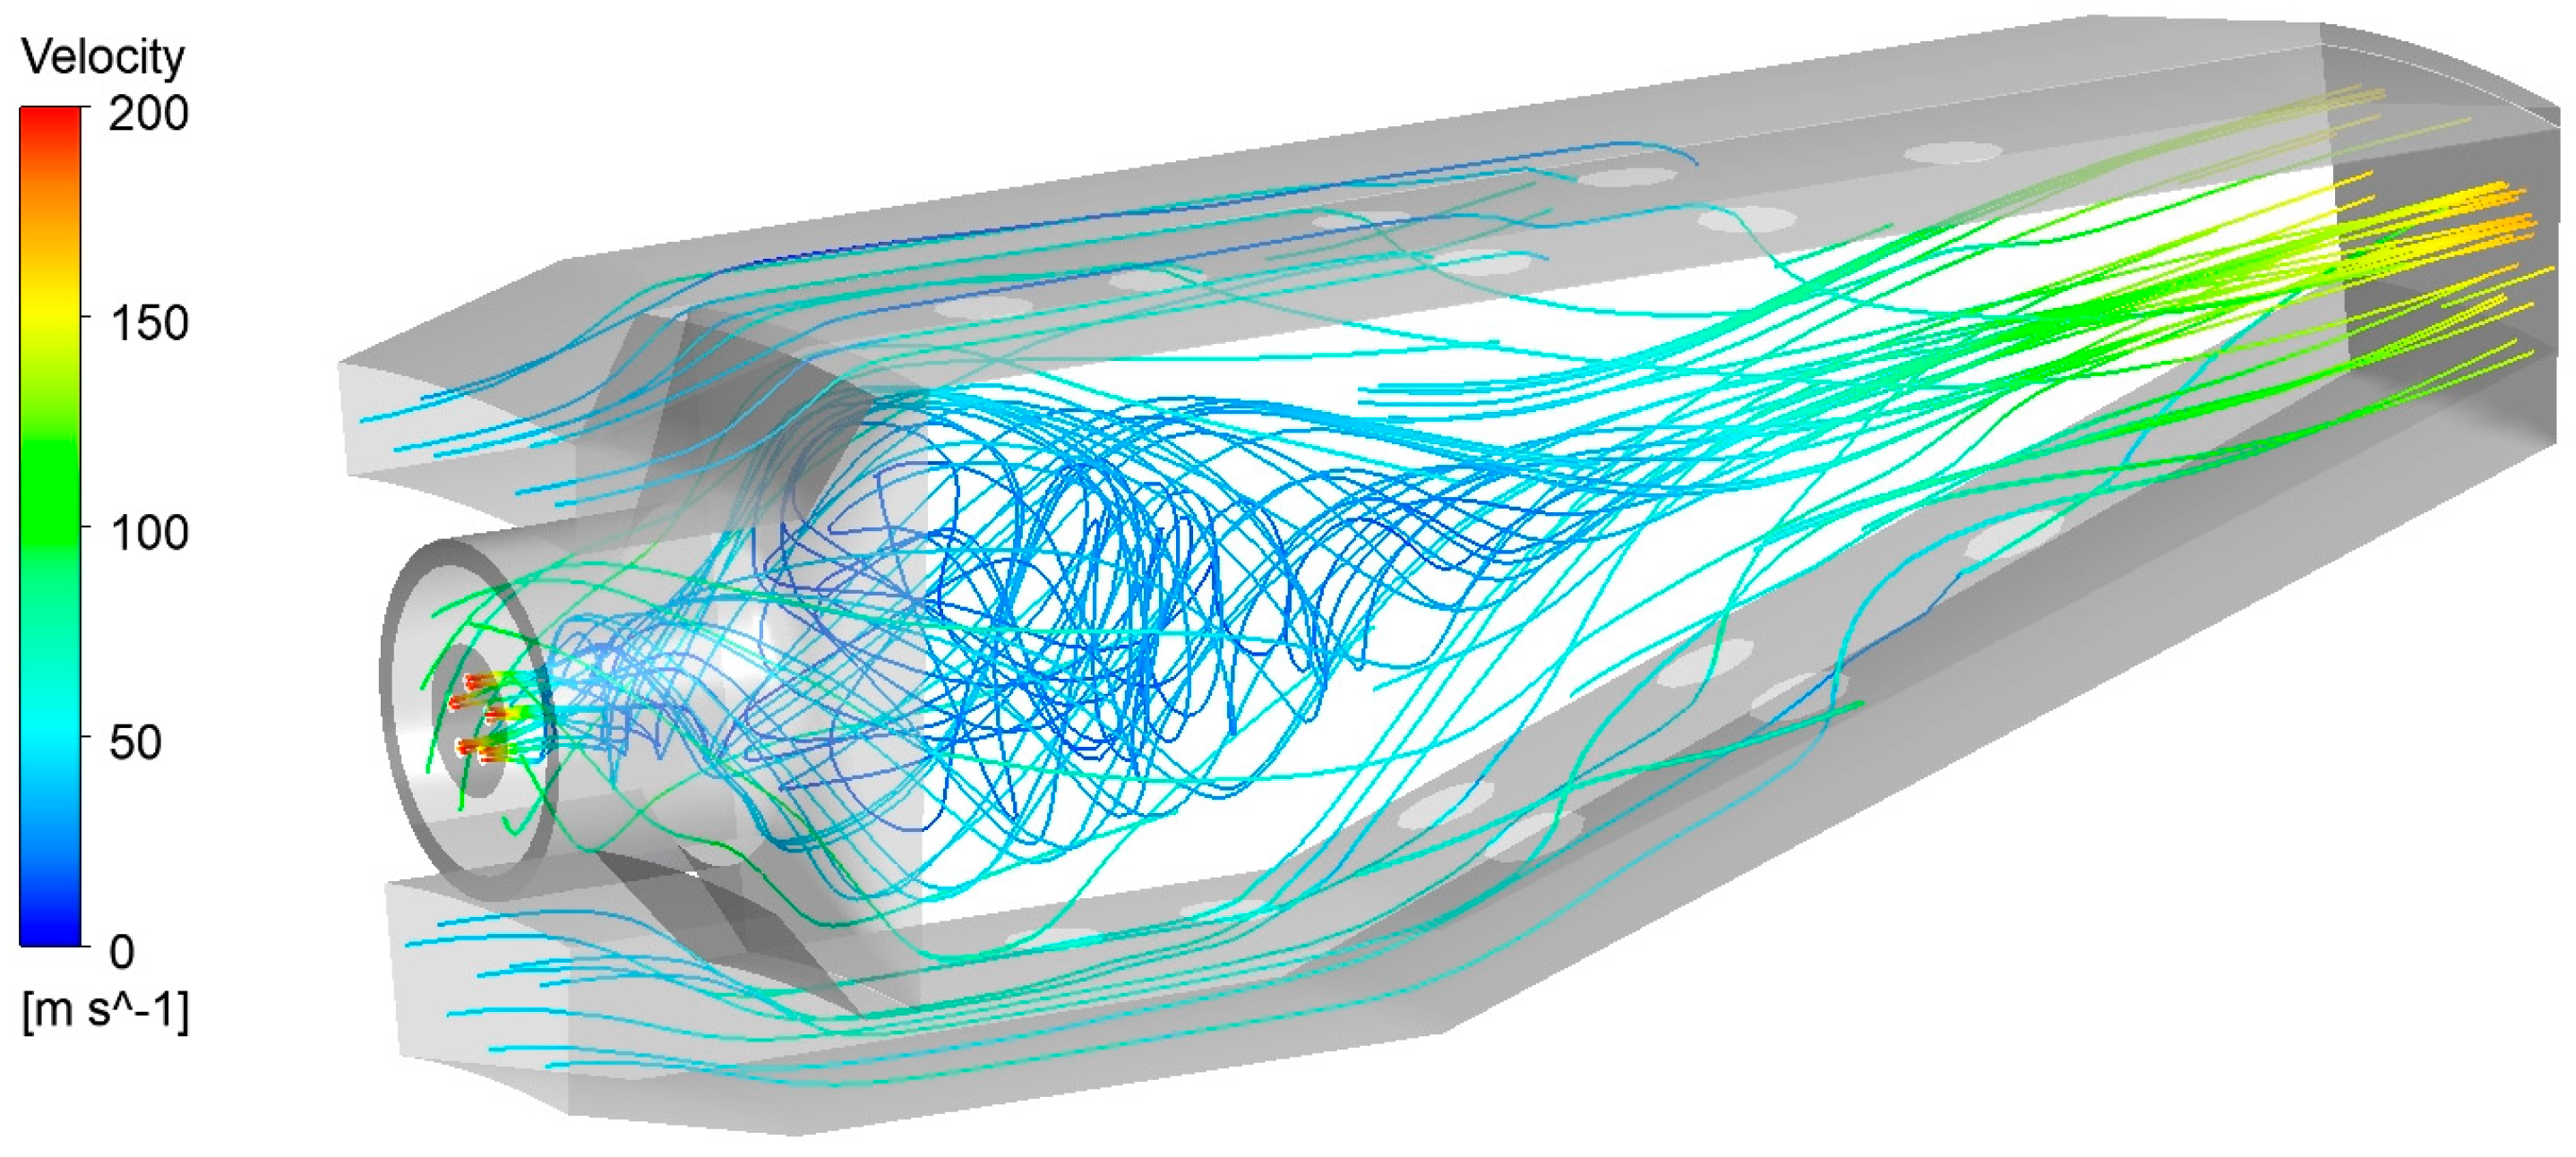
Before comparing and discussing the combustion behavior of the two fuels, it is necessary to examine the velocity field inside the burner. In
Figure 8 the streamlines evidence the swirl motion provided to the air entering the core region with a swirl number of 1.73. It is possible to observe that the path followed by a single fluid line is enhanced by the vortex, so increasing the residence times of the species in the zone downstream of the inlets of air and fuel. This zone is expected to be the principal location of reactivity. Then, the air coming from the inlets of the liner regions mixes with the principal air, allowing the completion of the oxidation process and the reaching of the TIT.
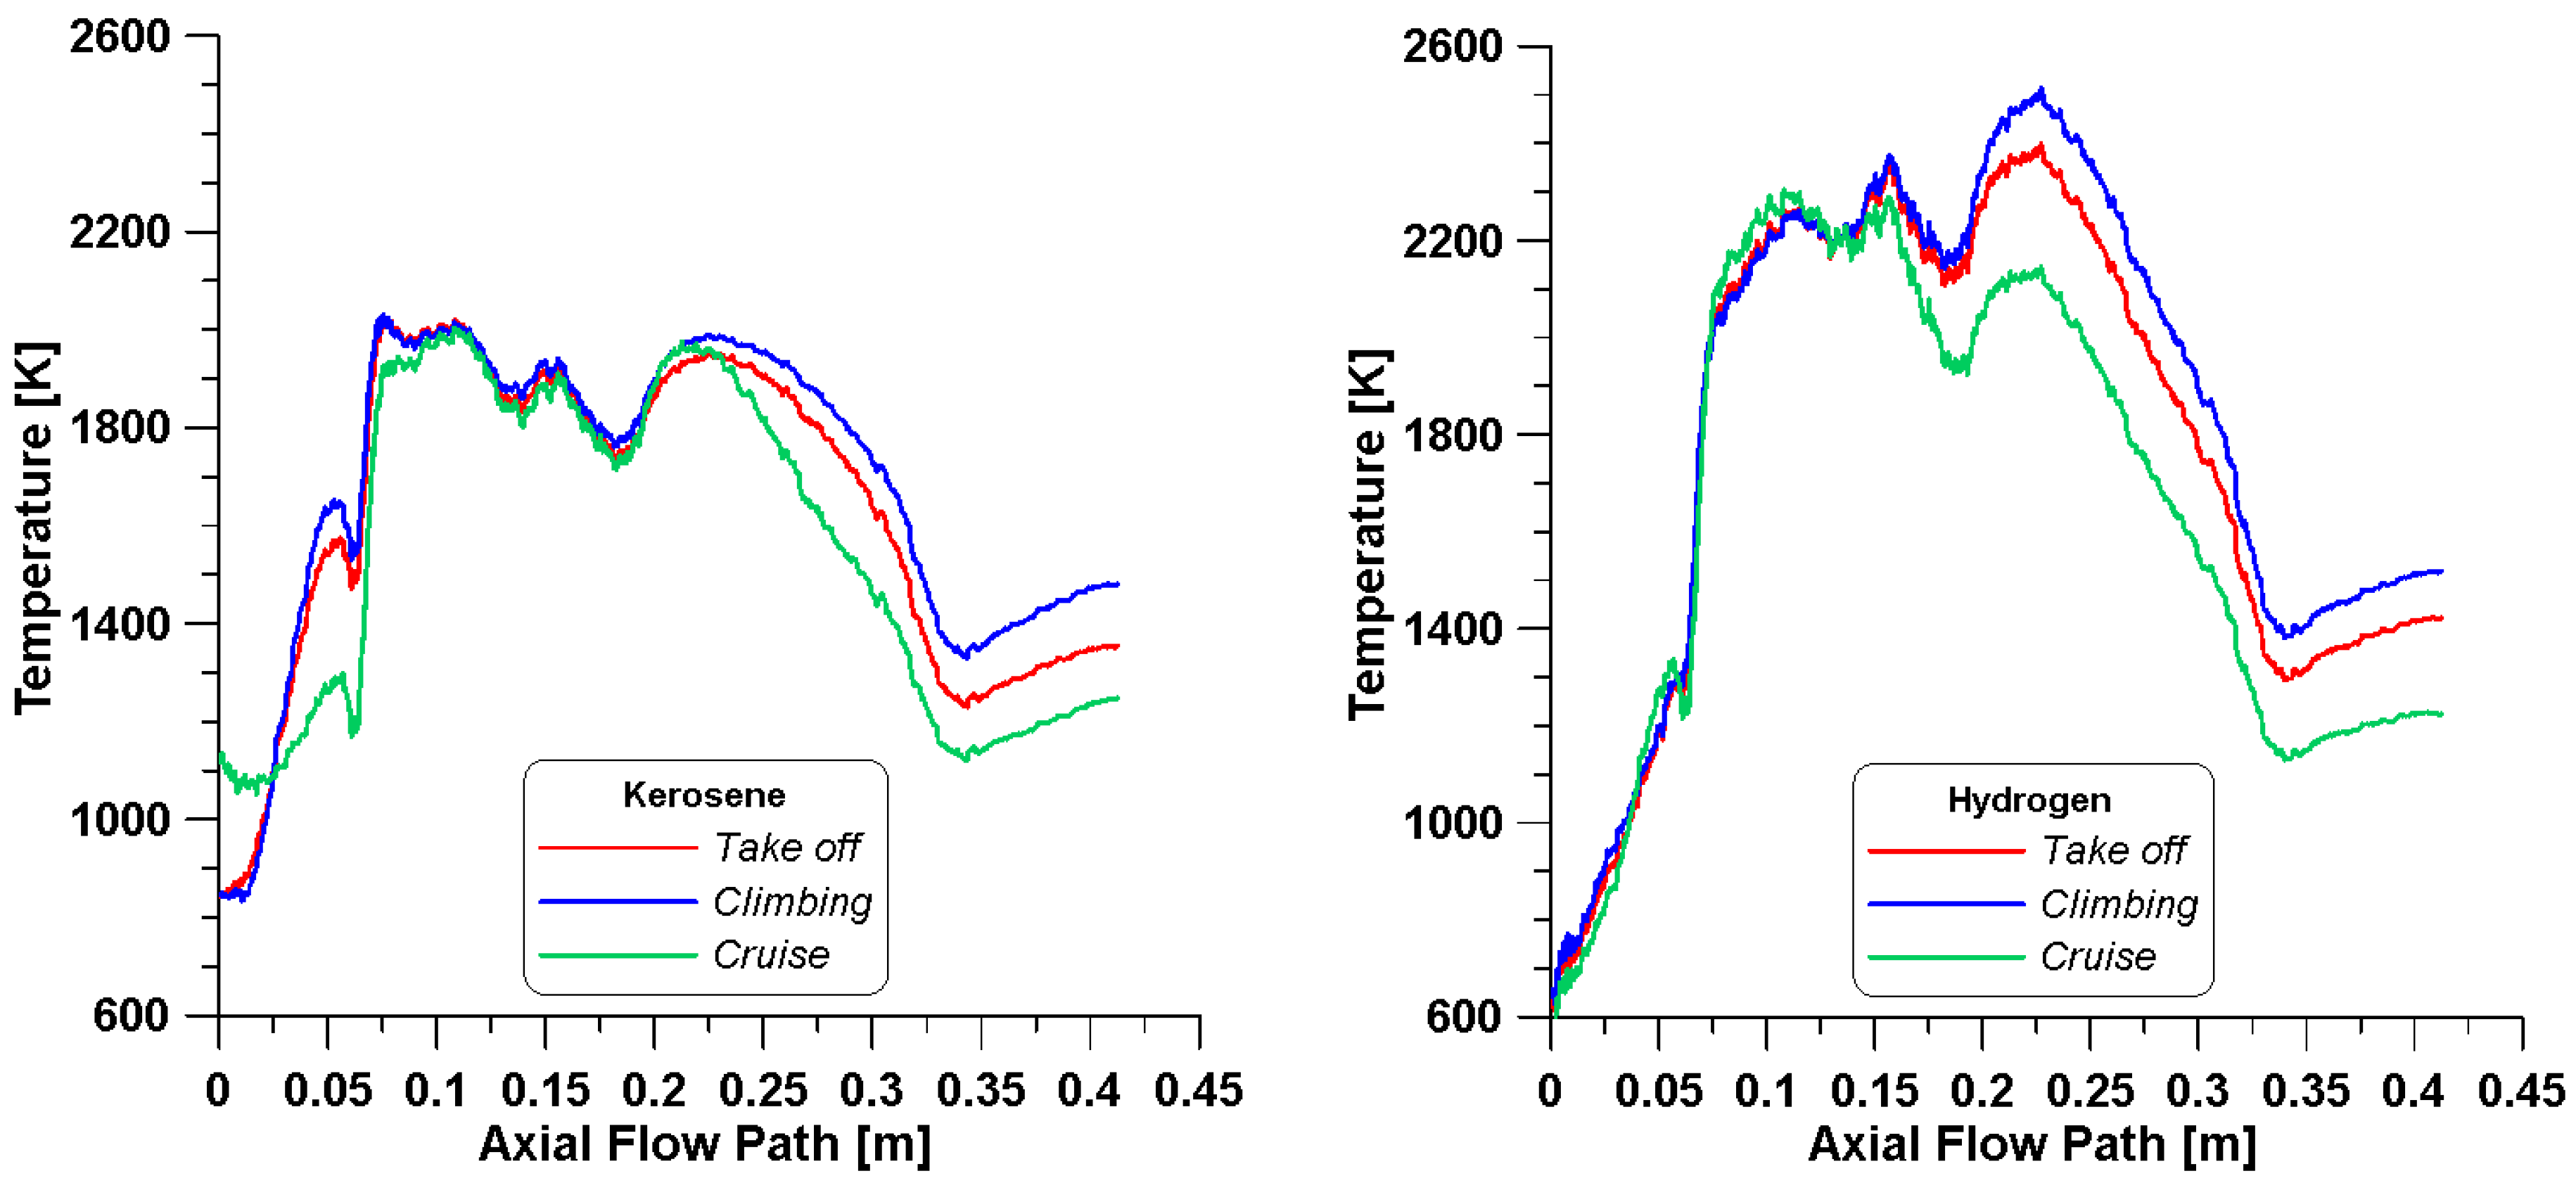
The above considerations are confirmed by the mean temperature profiles in the core region obtained from simulations with kerosene and hydrogen as shown in
Figure 9. Generally, hydrogen foresees higher levels of temperature for all conditions with respect to kerosene, mainly due to the higher adiabatic flame temperature that characterizes the gaseous fuel. Actually, from the same
Figure 9, it is possible to notice that the initial zone (right after the inlets) in the simulations with kerosene presents higher temperatures, and this is more evident for the cruise point. This may be due to a different distribution of the fuel species and their reaction rates, as evidenced by
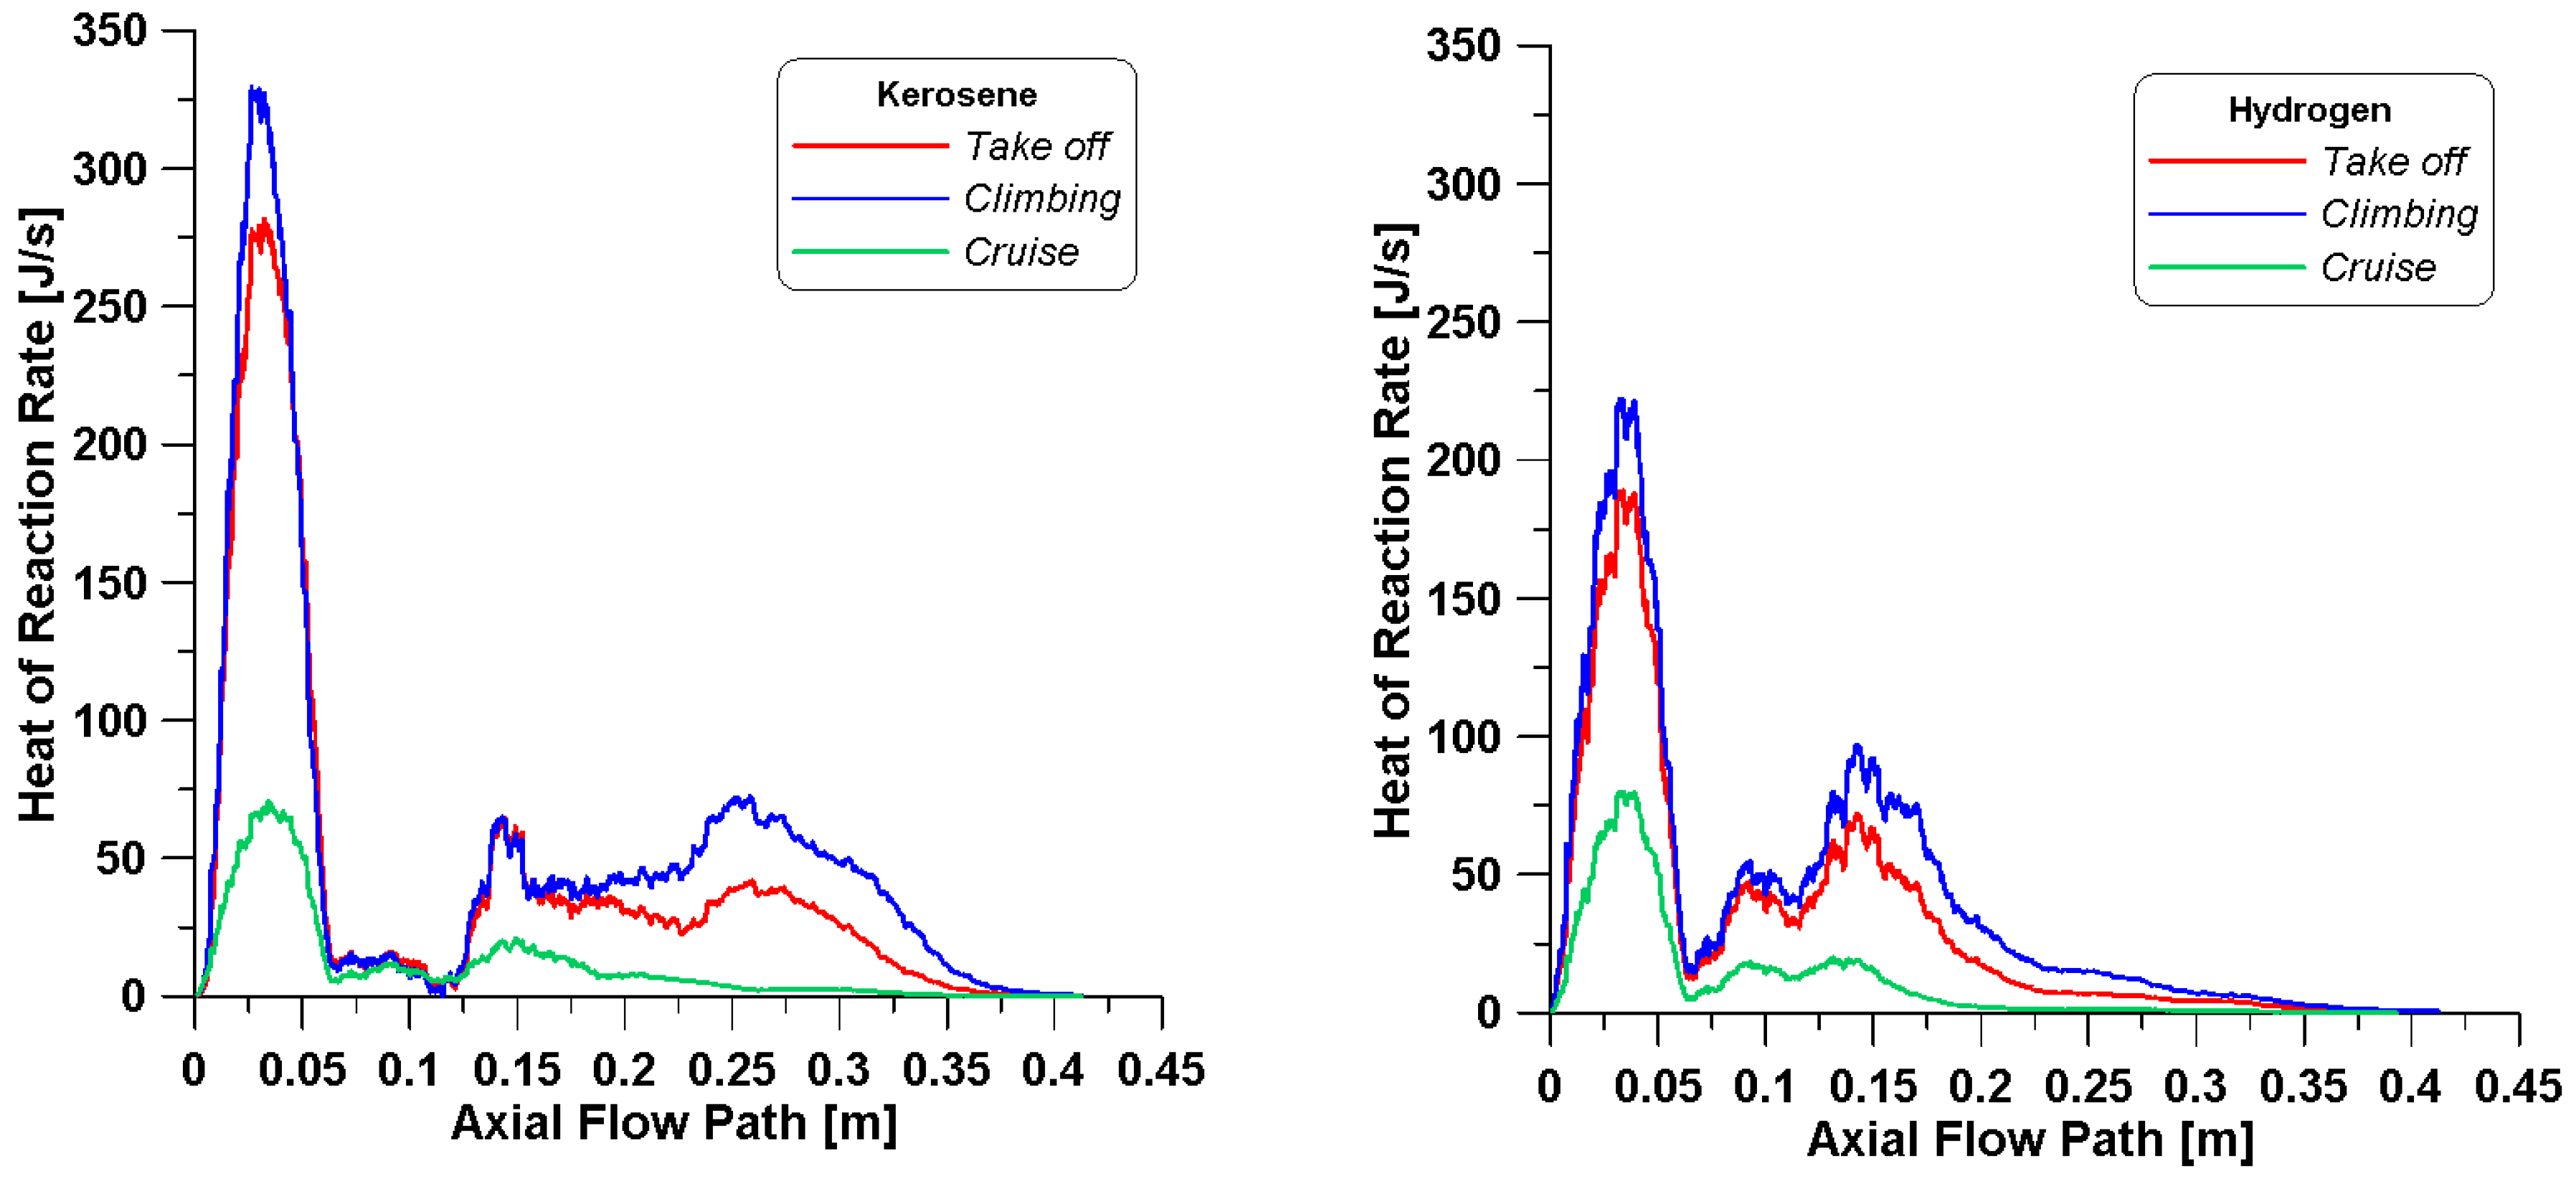
Figure 10 where higher peaks of the heat of reaction are achieved. Indeed, the profiles of heat of reaction evidence that kerosene’s higher reactivity occurs in the primary zone where injection, atomization, and vaporization occur causing a higher concentration of C
12H
23.
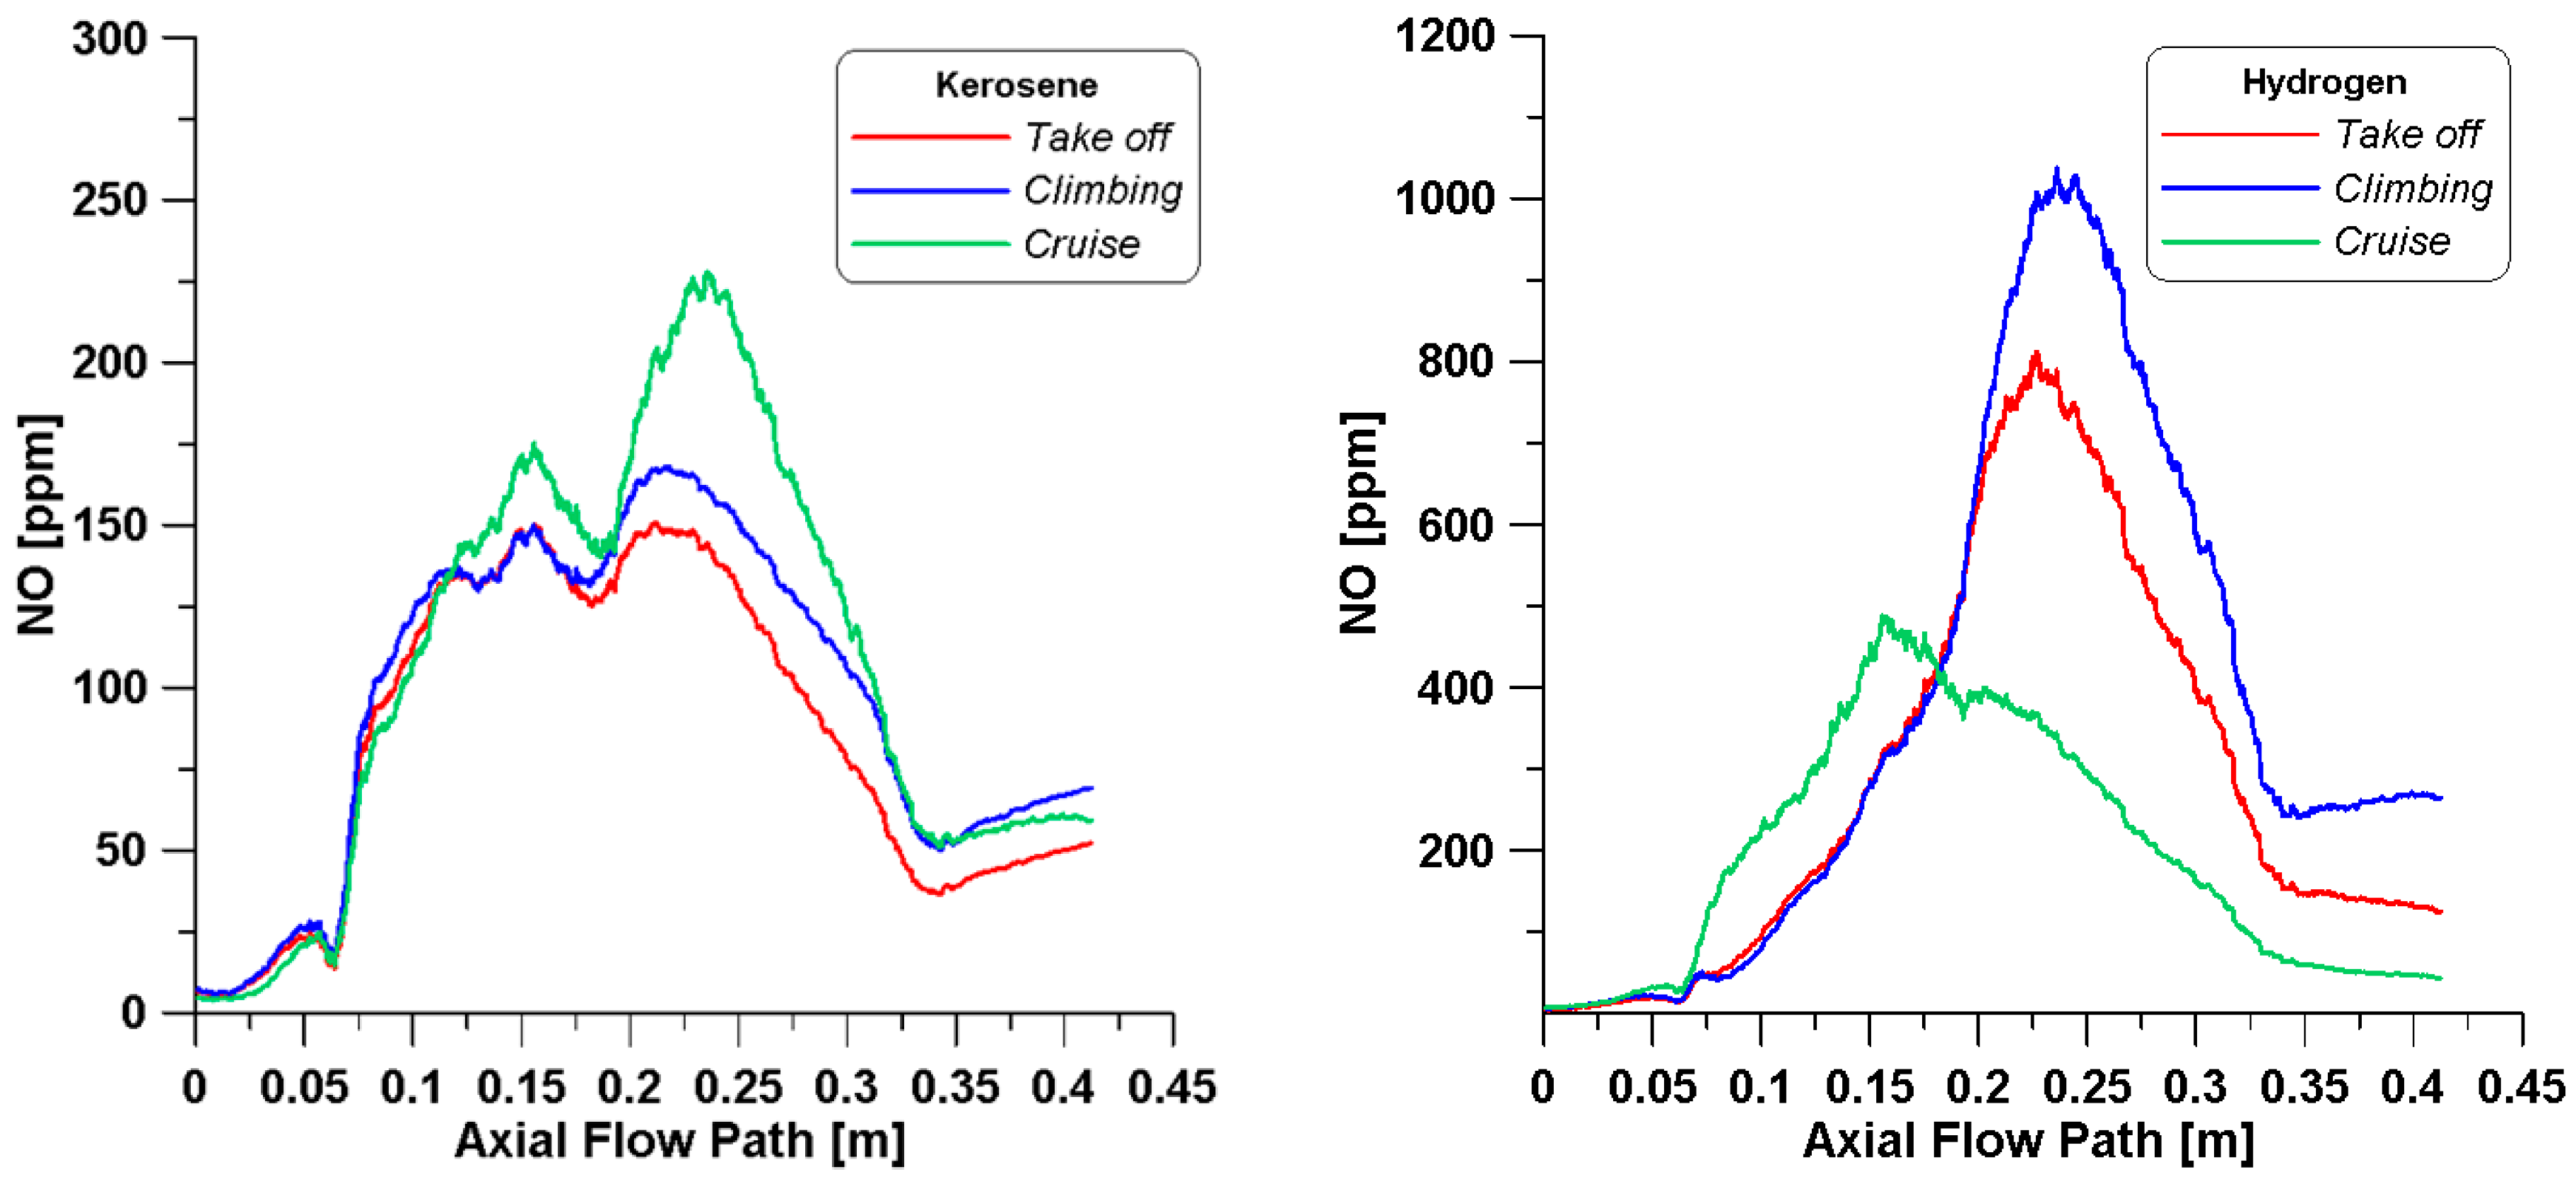
In
Figure 11, the mean concentrations of thermal NO in the core region are plotted along the axial pathway. Generally, it is observable that higher concentrations of NO are reached in the simulations with hydrogen. In all the kerosene cases, the peaks are reached at 0.25 m; also, the cruise condition presents the maximum value, but at the outlet, the concentration decreases with respect to the climbing. On the other hand, hydrogen features a completely different behavior. It is well known that in gas turbines, the main causes of NO
x emissions are the high temperature levels, high residence time, and oxygen availability; by looking at the NO trends in
Figure 11 and by changing the operating point, one of these aspects has a more major impact than the others. During take-off and climbing, temperature levels higher than 2200 K are achieved from 0.10 m up to 0.25 m along the axial path; this length is sufficient for this species to form as the peaks of NO perfectly correspond to this distance. Although the temperature profiles for hydrogen cases in
Figure 9 present an equal trend up to 0.15 m, the cruise condition features a slightly different behavior, which may be given by the reduced φ
core value. The high concentration of oxygen allows the peak of NO to be achieved right after the primary zone.
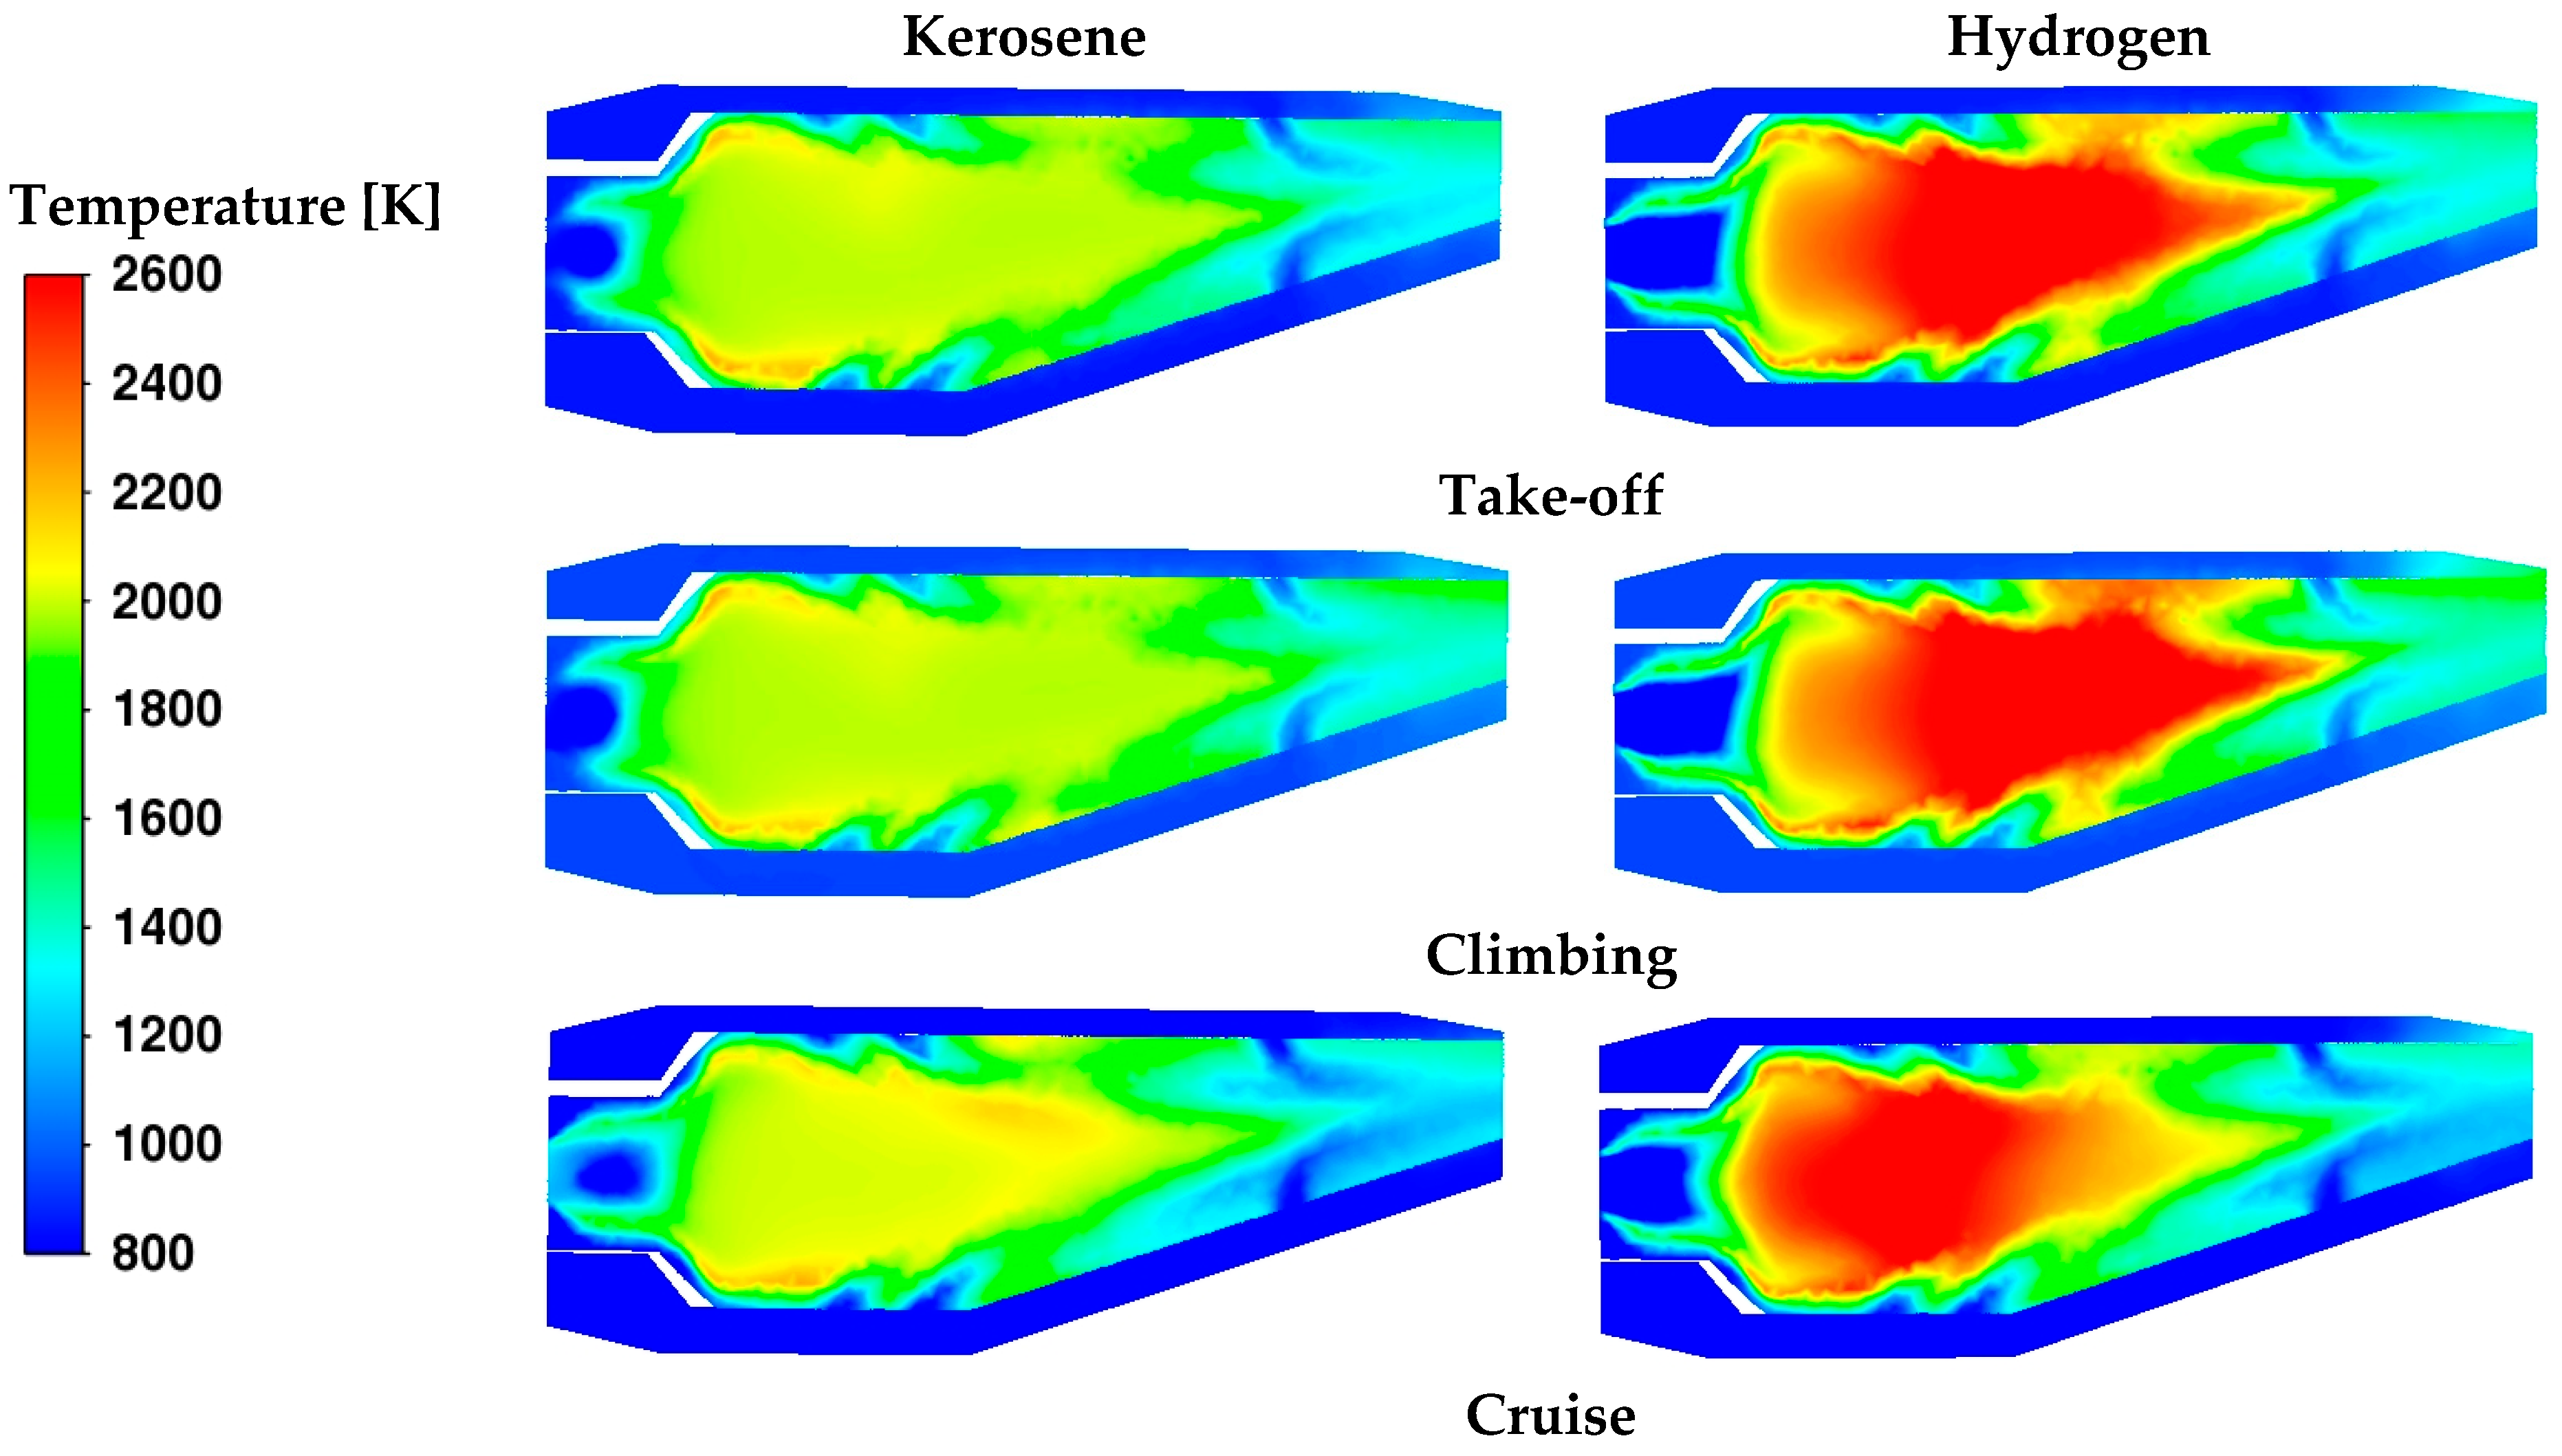
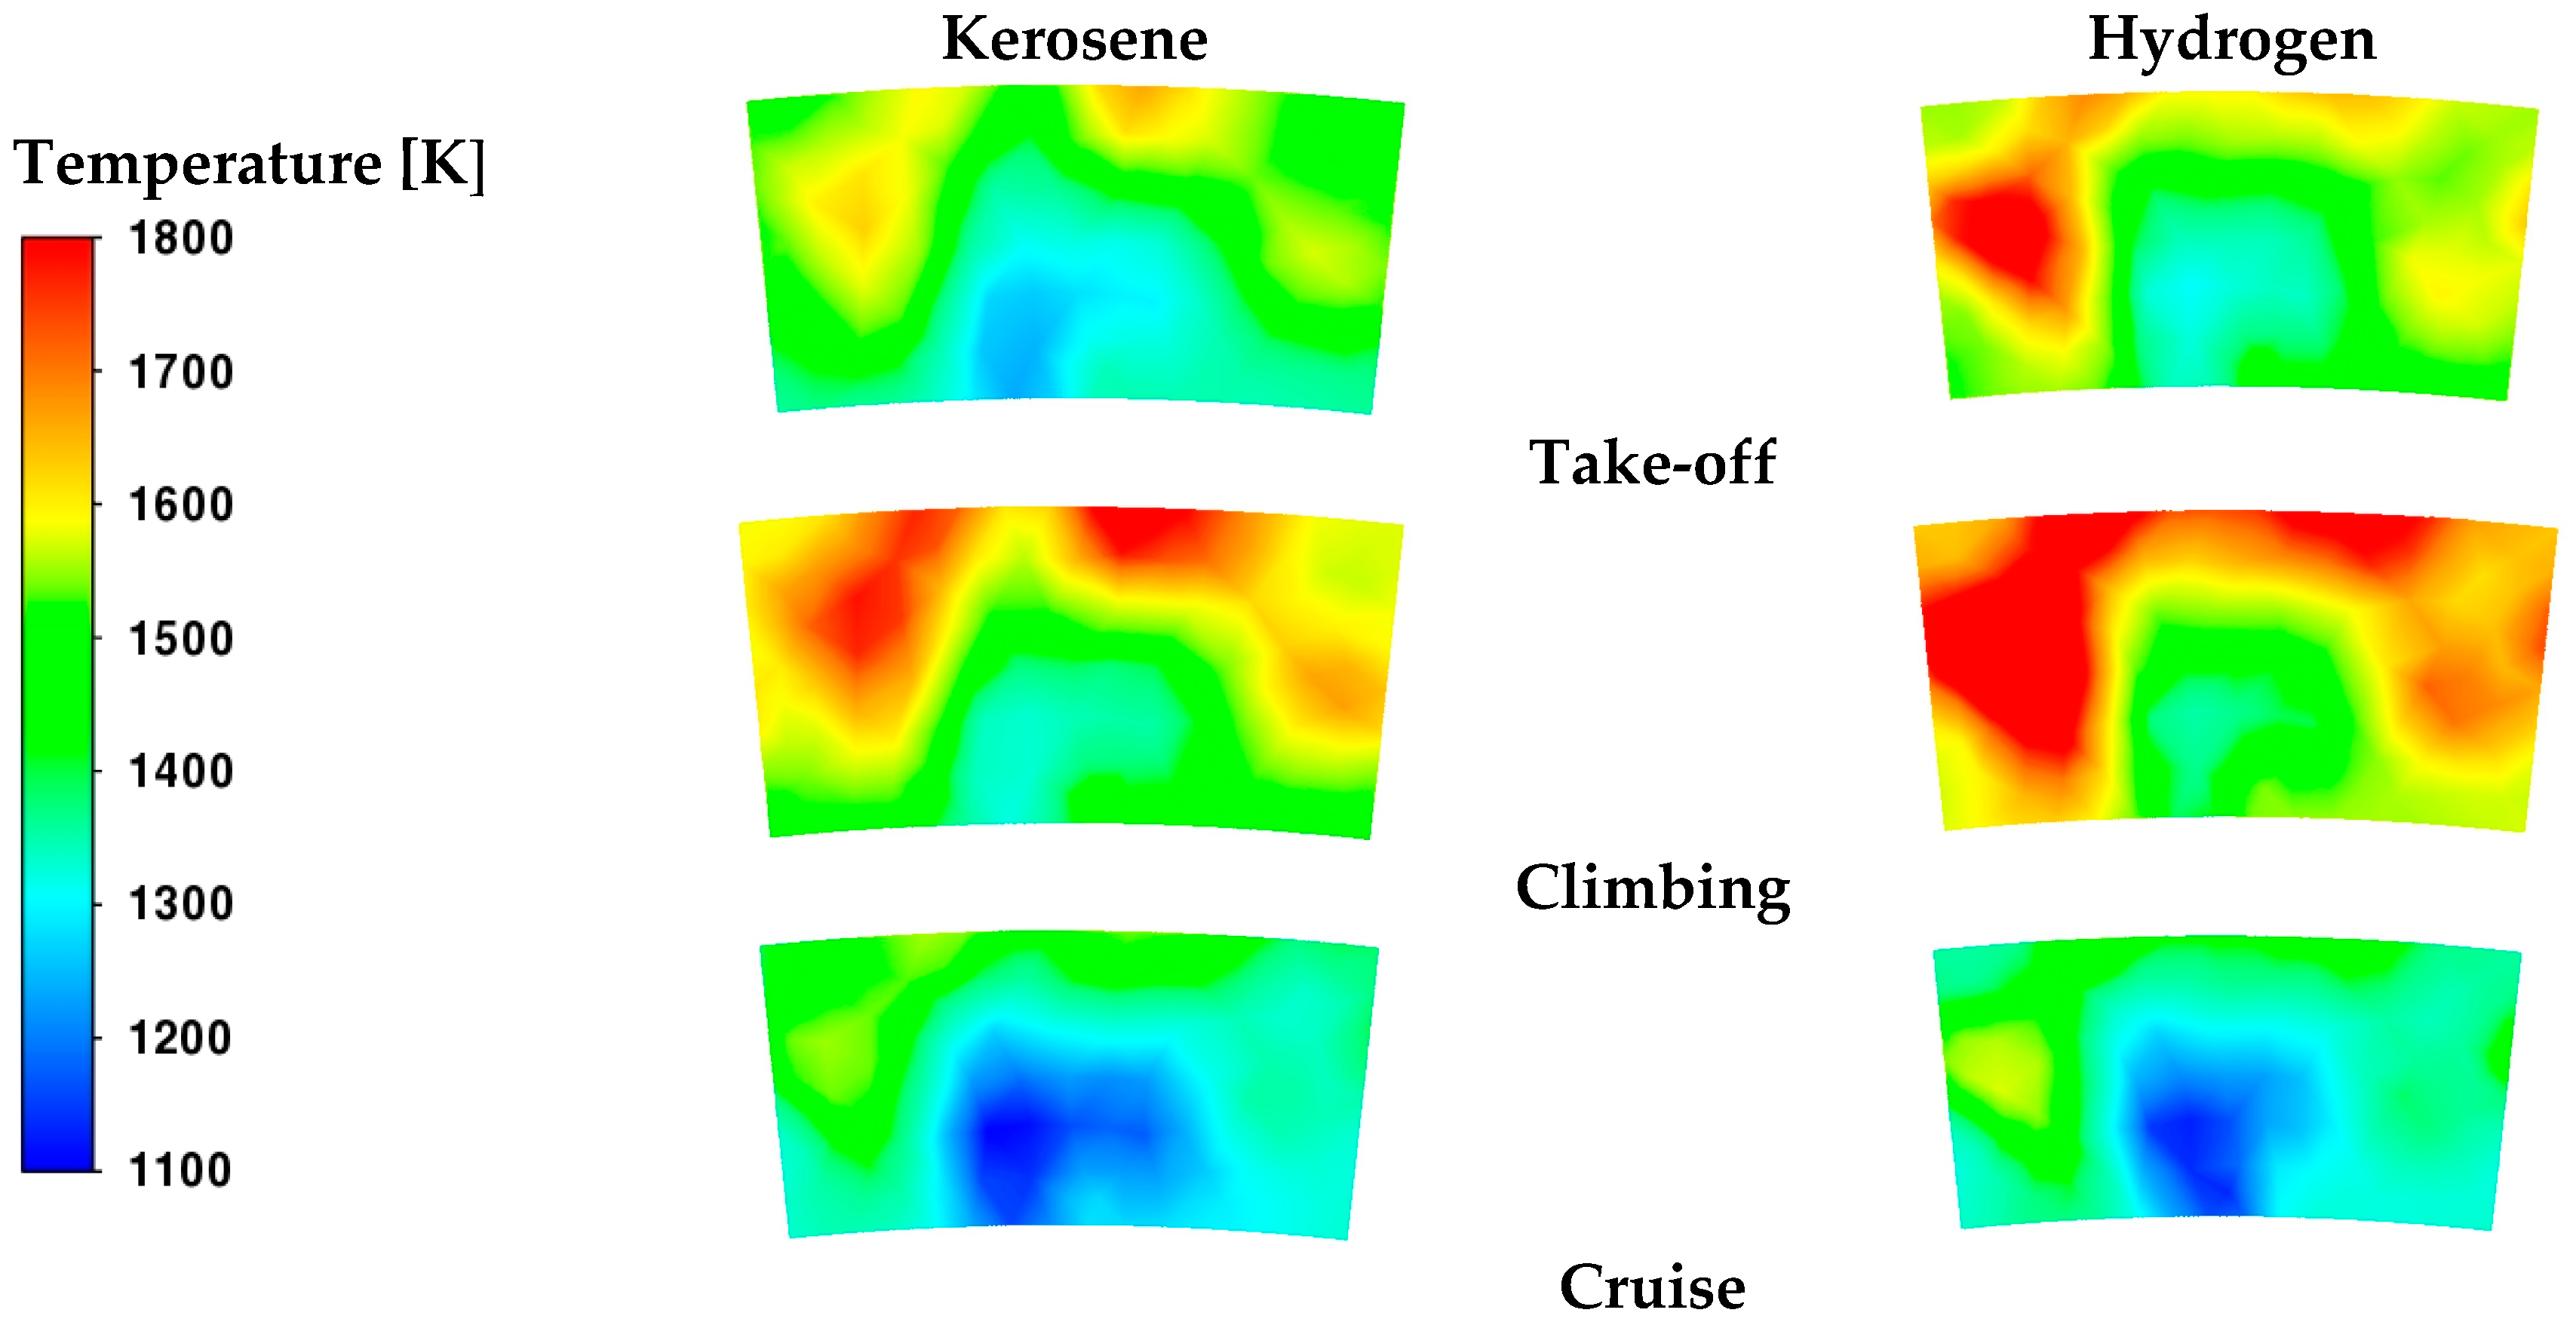
The temperature contours in
Figure 12 confirm the previous considerations. Although a reduced fuel flow rate is introduced, the temperature levels are clearly higher with hydrogen. On the contrary, in the neck of the core burner, a more uniform temperature distribution is obtained with kerosene.
The oxidation process occurring in the core region affects the thermal regime at the burner outlet, which in turn impacts on the operating conditions of the turbine. The temperature contours in
Figure 13 evidence a non-uniform distribution of temperature, especially in the cases with hydrogen. Instead, as already observed in
Table 6,
Table 7 and
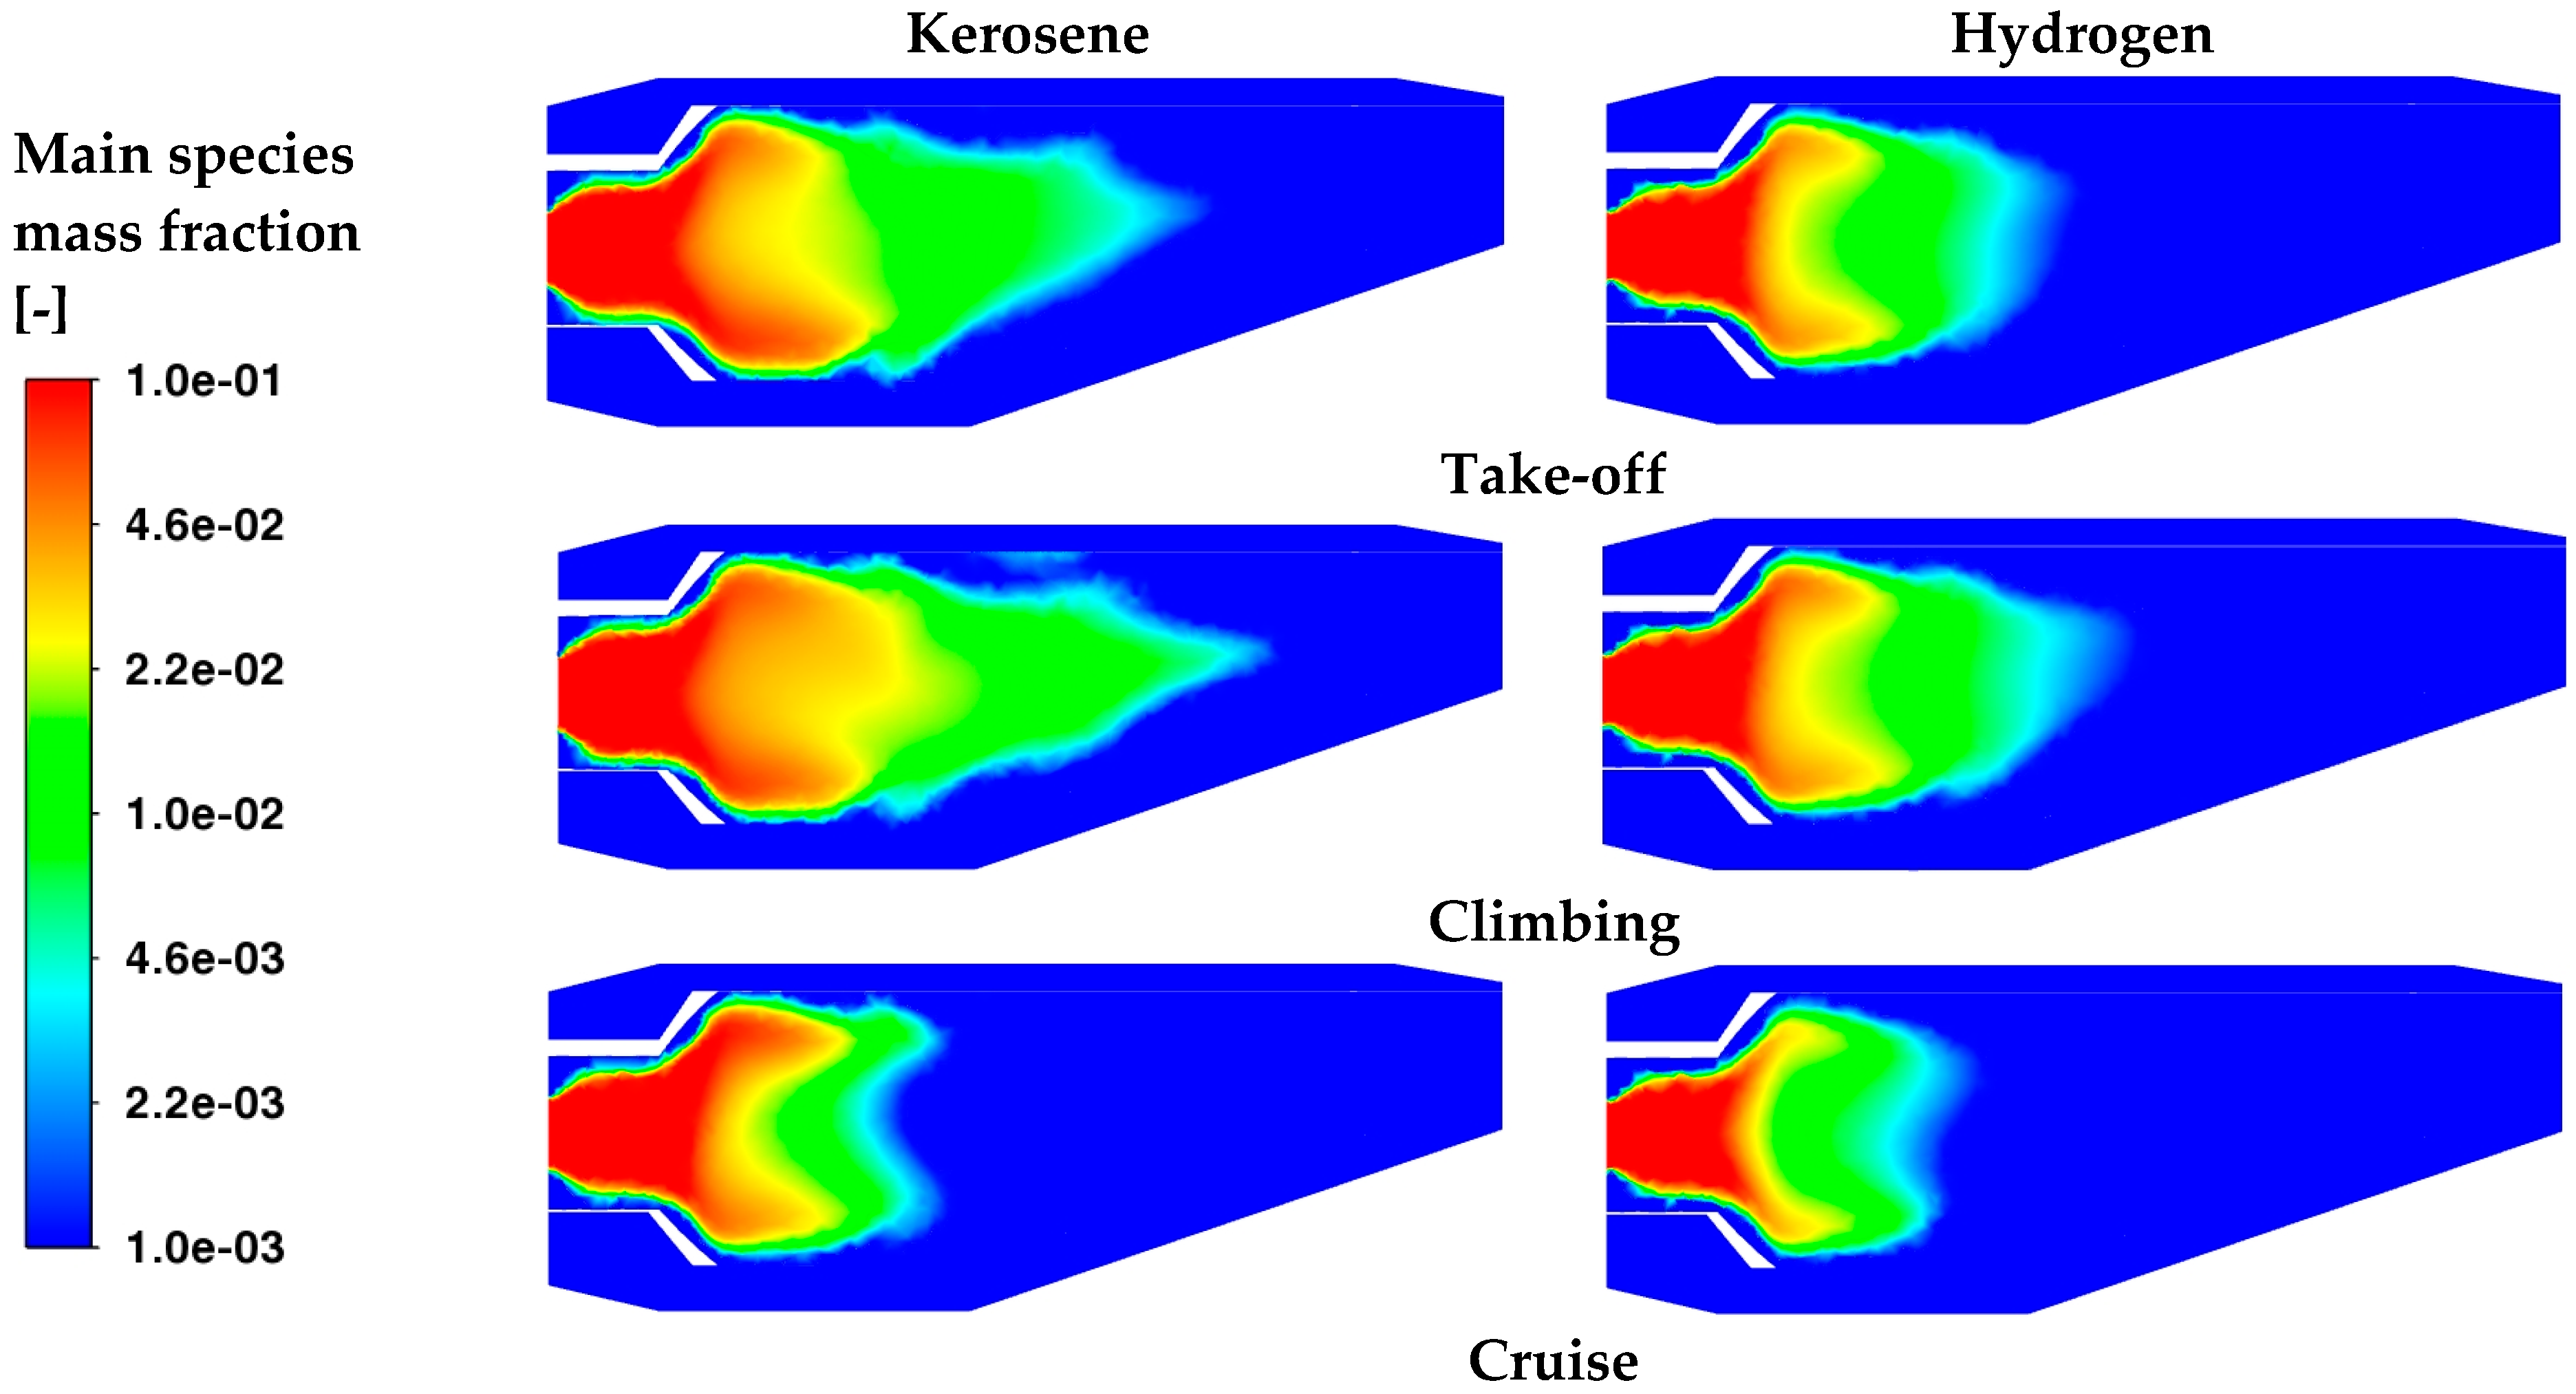
Table 8 although the necessary TIT that must be achieved to ensure the required thrust is higher in the cases with kerosene, wide regions at a high temperature are observed at take-off and during climbing for hydrogen. Temperature distributions are also caused by the concentrations of the main species inside the core; indeed, from
Figure 14, a higher concentration of C
12H
23 is clearly visible, and such distributions are also more extended with respect to those of H
2. Indeed, under cruise conditions, both kerosene and hydrogen seem totally oxidated before the achievement of the dilution zone.
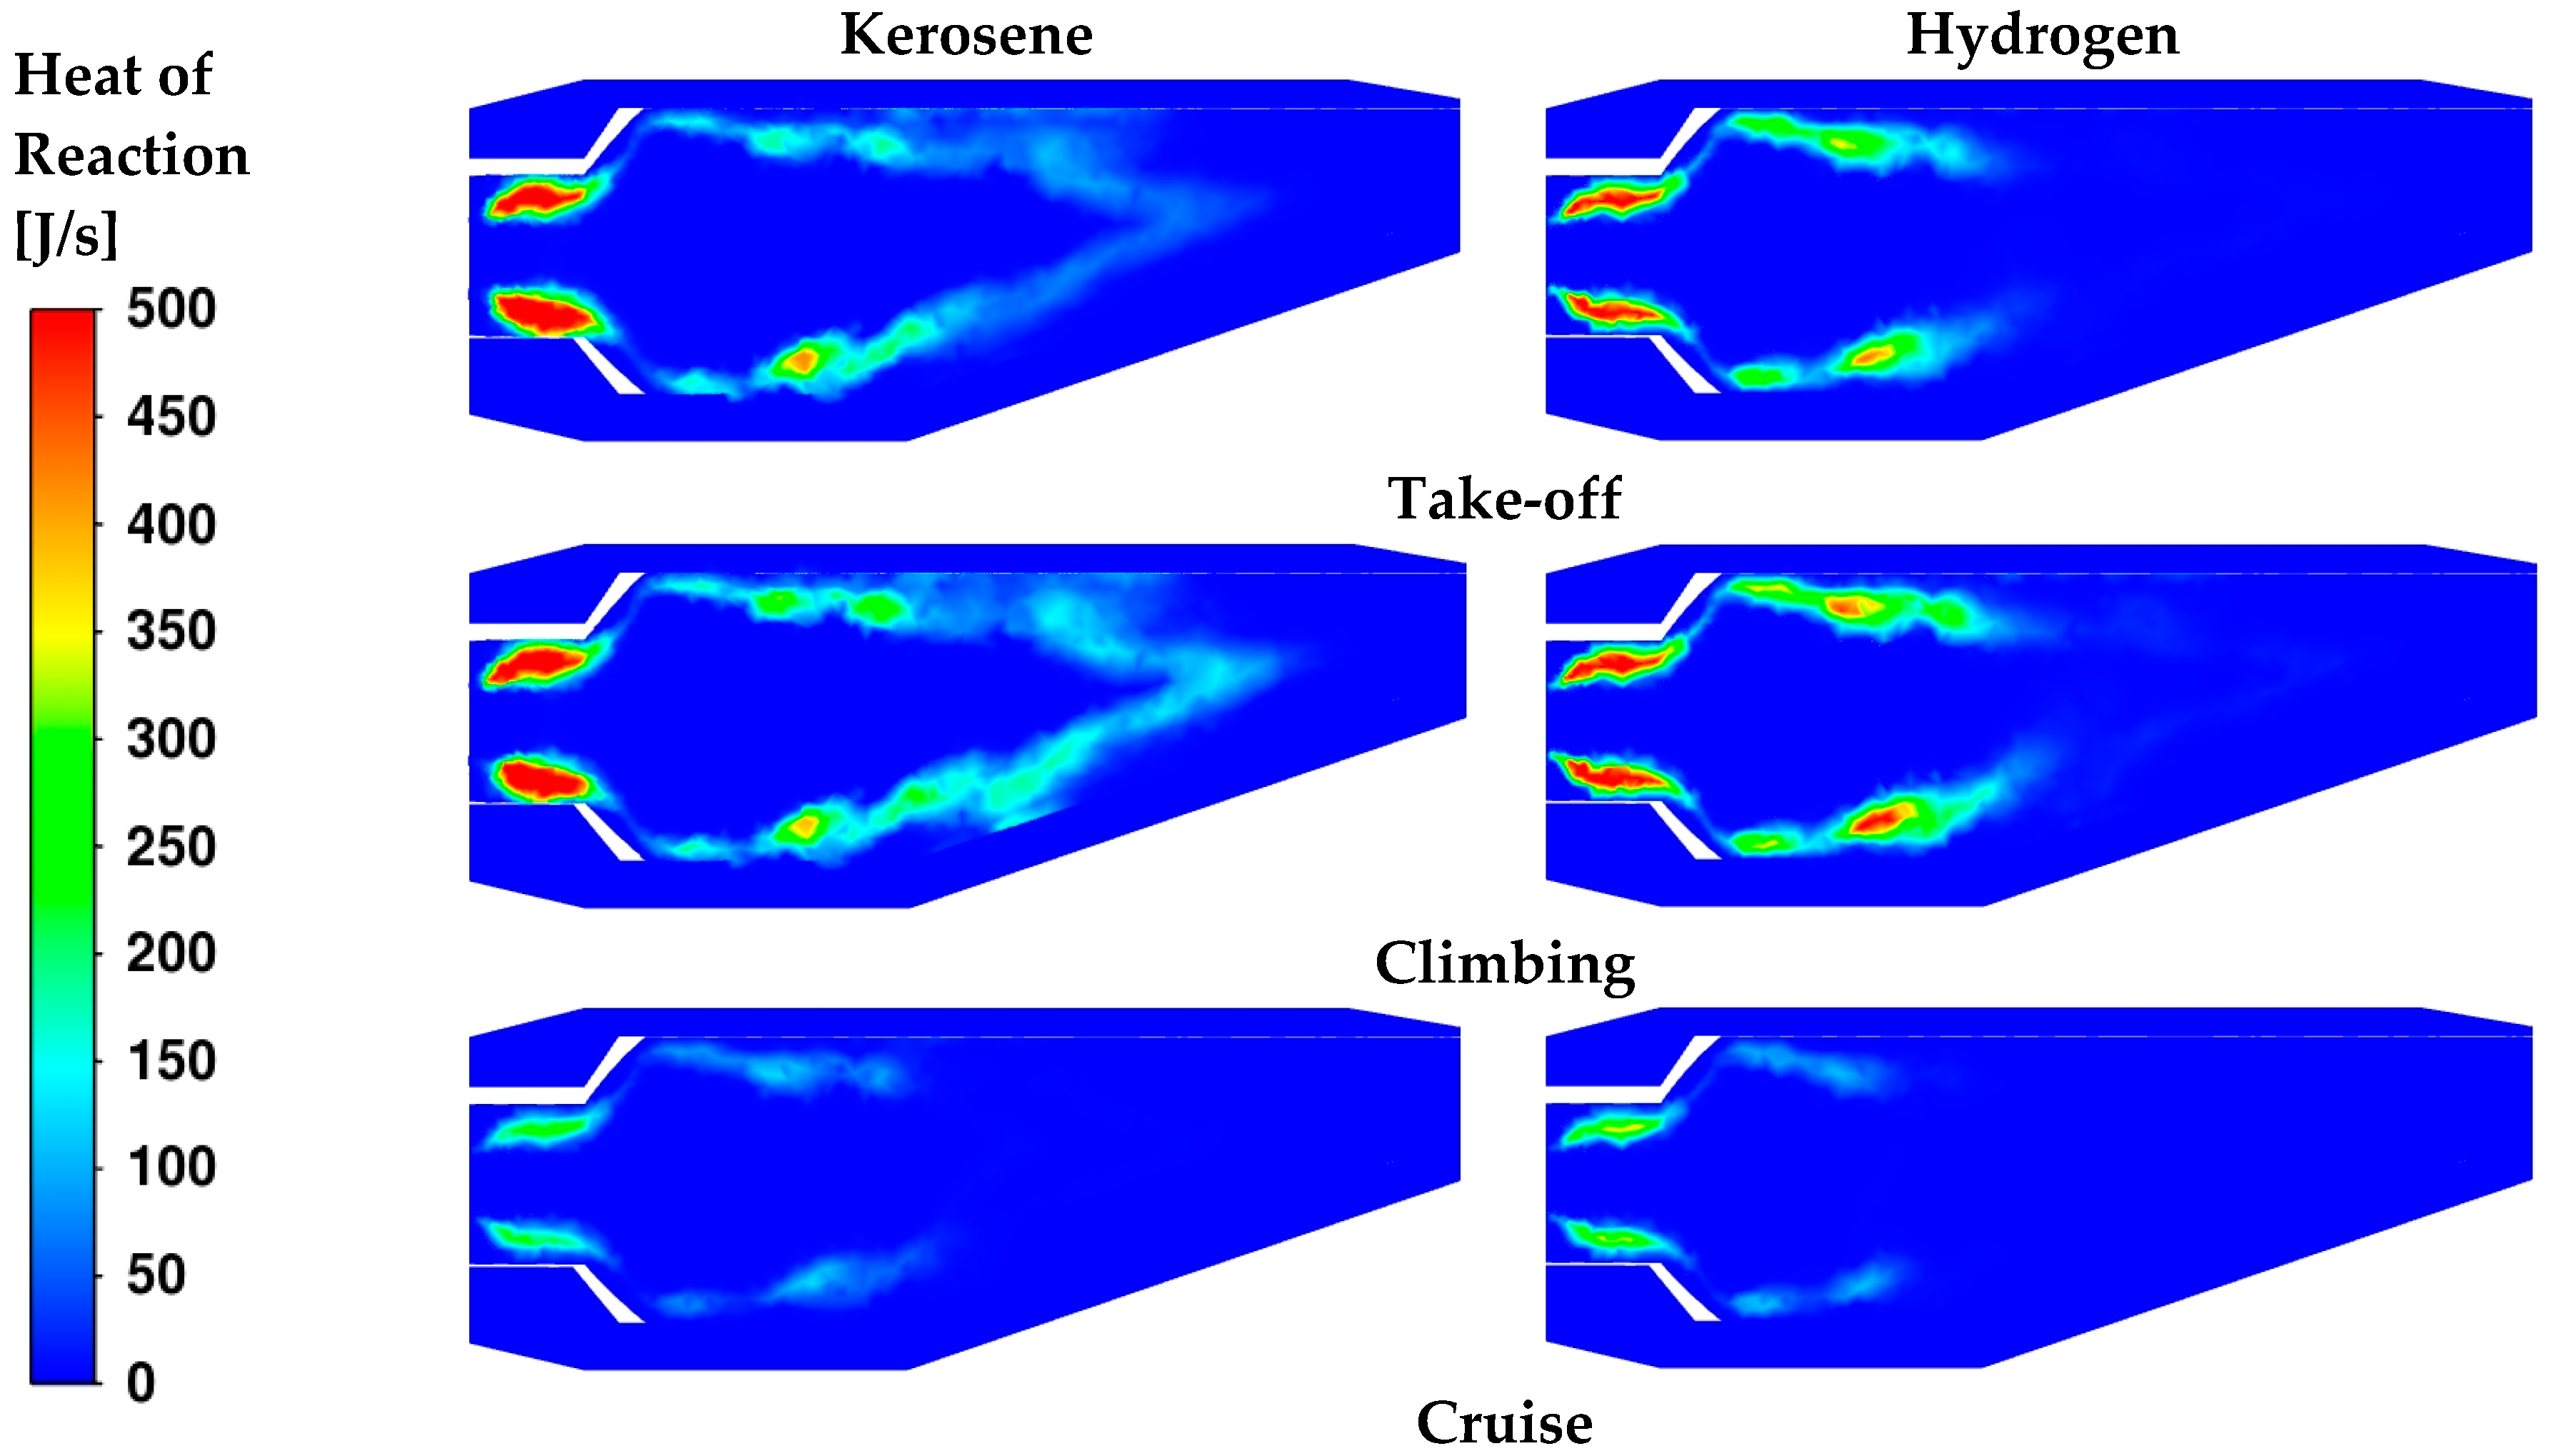
The contours of the heat of reaction in
Figure 15 are useful to visualize the exact location where the reactions take place. The main differences are observed under the cruise conditions. For both fuels, the heat is mainly released in the neck of the burner, as already observed in
Figure 10. For take-off and climbing, high spots of heat are visible in the secondary region as well. The higher φ
core values in these cases (
Table 11 and
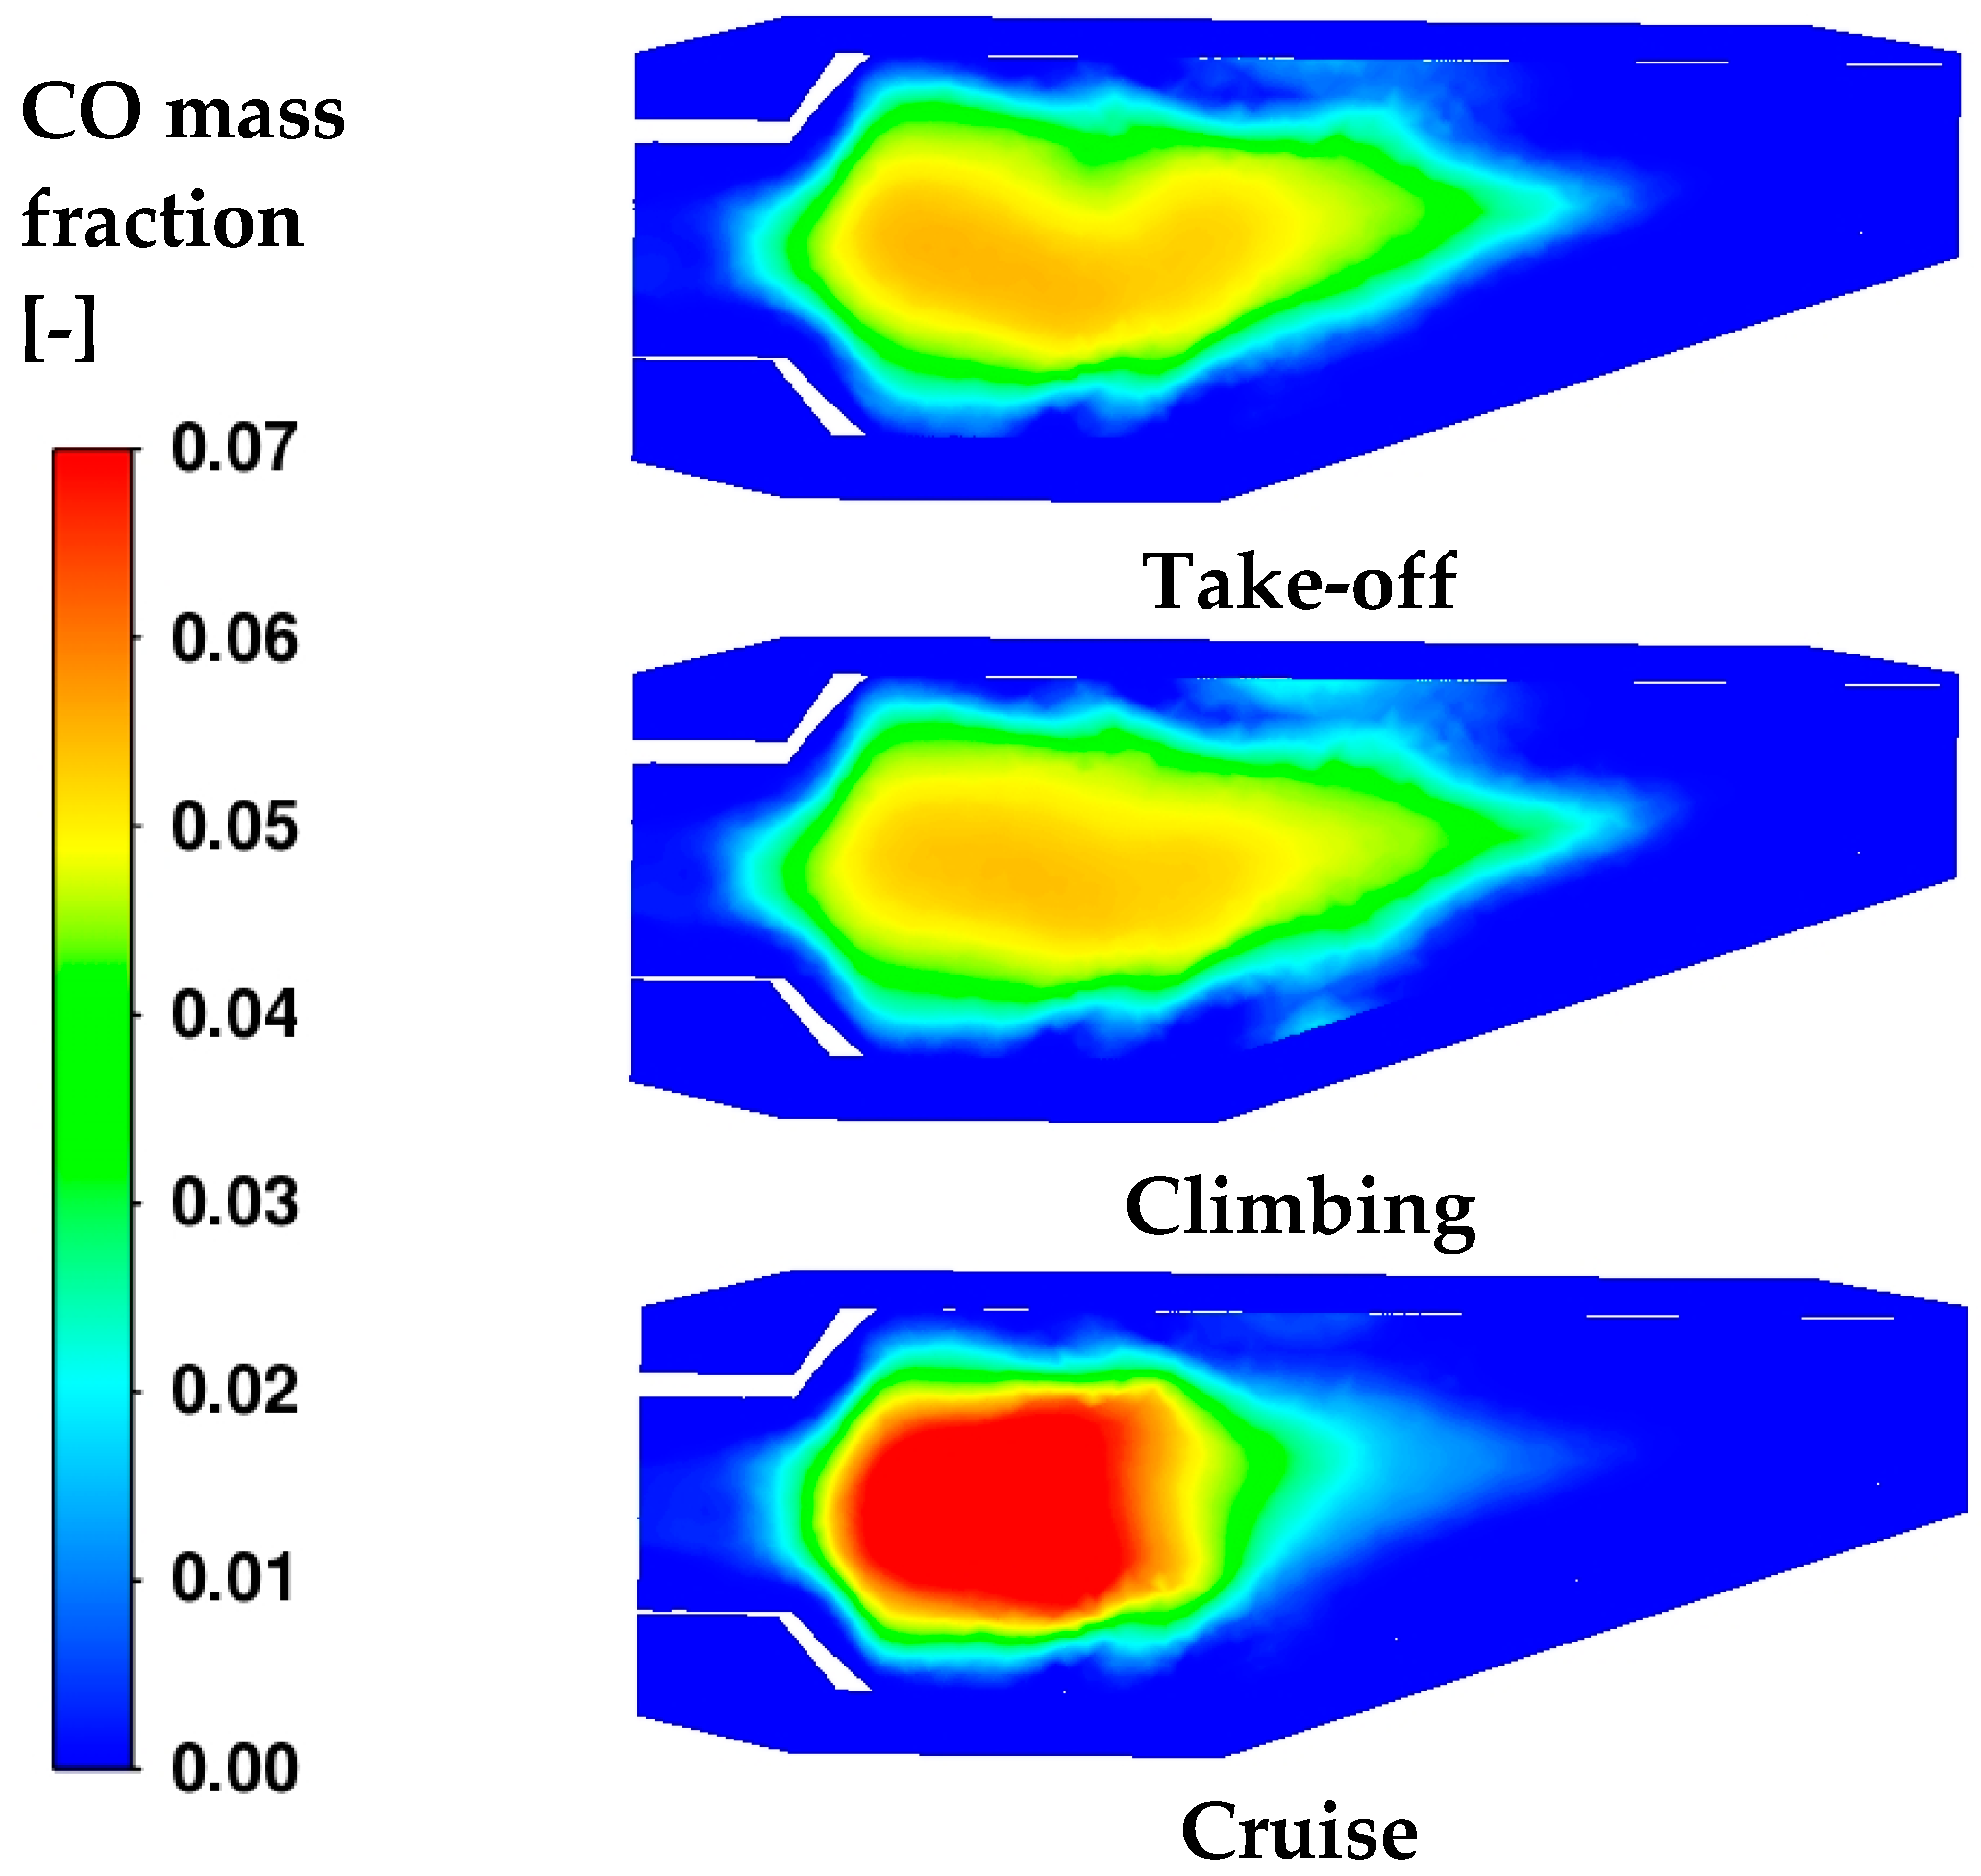
Table 12) suggest that additional air coming from dilution holes is necessary to complete the oxidation. Furthermore, in the cases where kerosene reactions are still occurring in the dilution zone, heat is released in the proximity of the outlet. To confirm such hypothesis, the distribution of CO is displayed in
Figure 16.
As reported in
Table 9, a one-step reaction mechanism is used for kerosene oxidation. Indeed, two additional reactions are included for the dissociation of CO
2 due to the high temperature and its recombination. The tail of oxidation observed in
Figure 15 perfectly matches the edge of the CO concentration in
Figure 16. Instead, under the cruise condition, the reduced amount of fuel introduced in the core region allows a quick and complete oxidation of the C-based fuel in the secondary region.
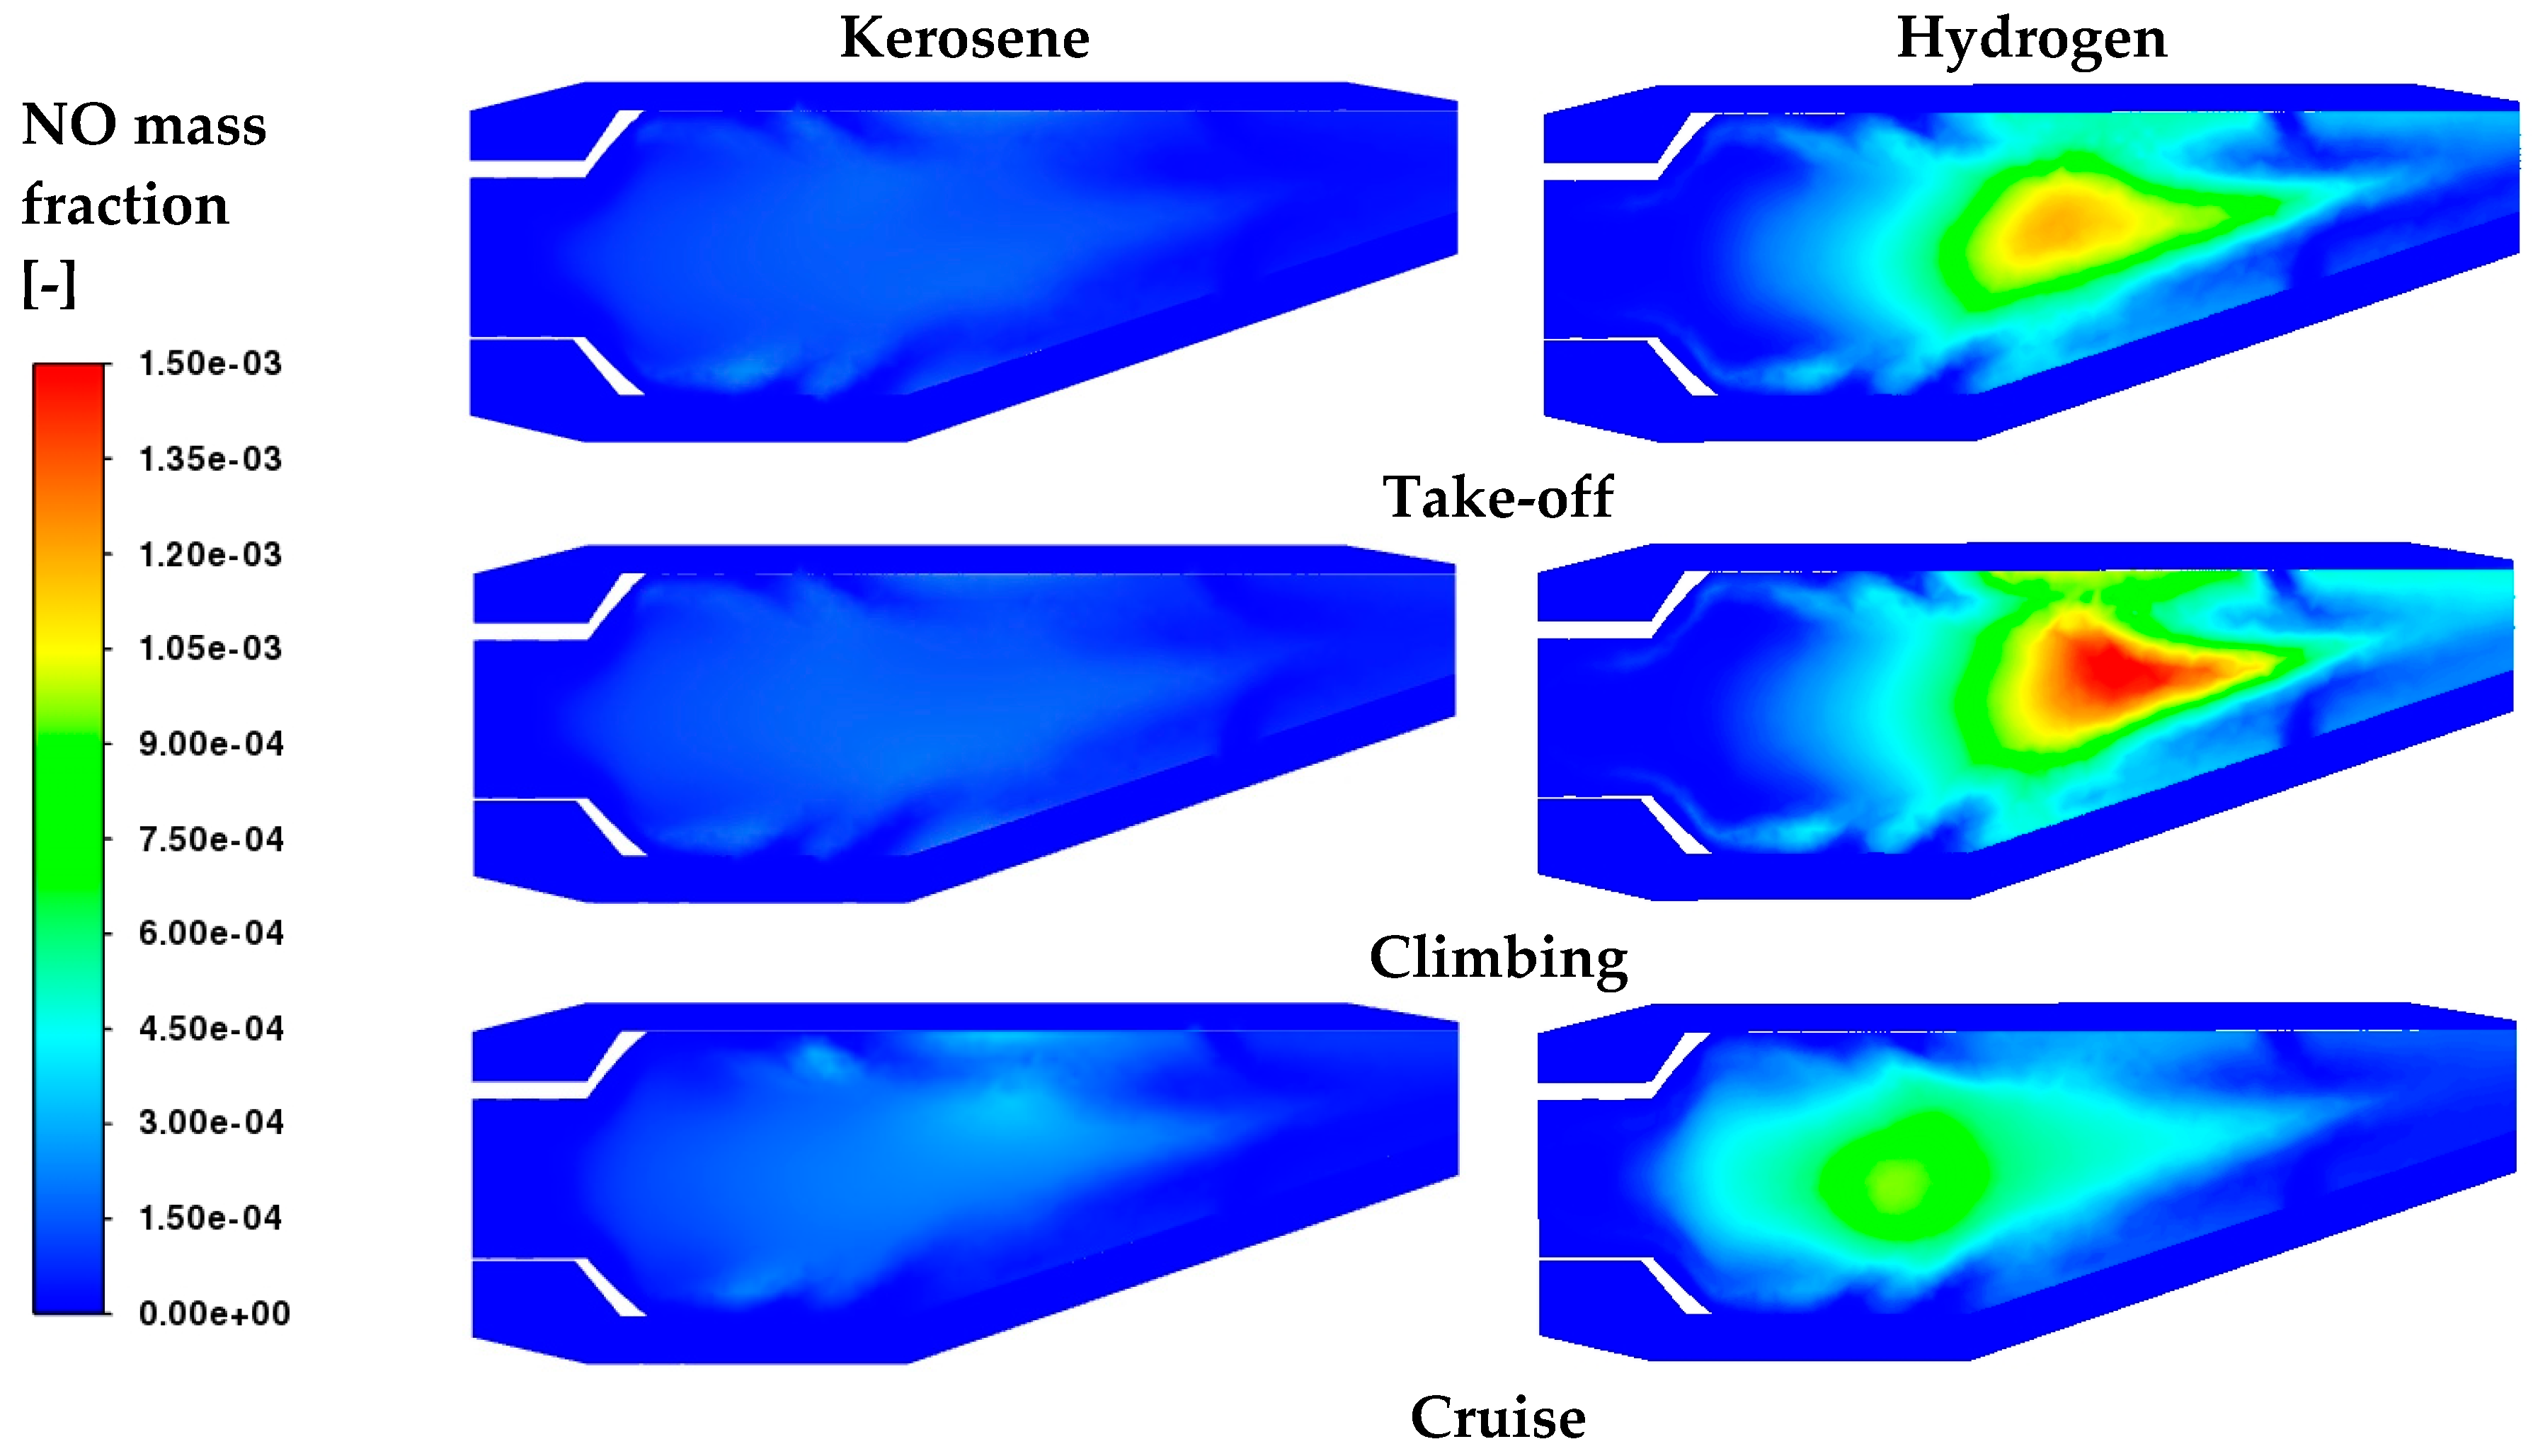
The distributions of NO species in
Figure 17 provide better insights on the mean trends already observed in
Figure 11. Firstly, kerosene combustion leads to low concentrations of this pollutant; however, a weak presence is observable in the secondary region (0.25 m), especially under cruise conditions. Instead, for the hydrogen simulations, as anticipated, differently from the cruise condition, at take-off and during climbing, NO is produced between the secondary and dilution zones.
Figure 17 also confirms the comments made on the equivalence ratio under the cruise condition, i.e., the lower φ
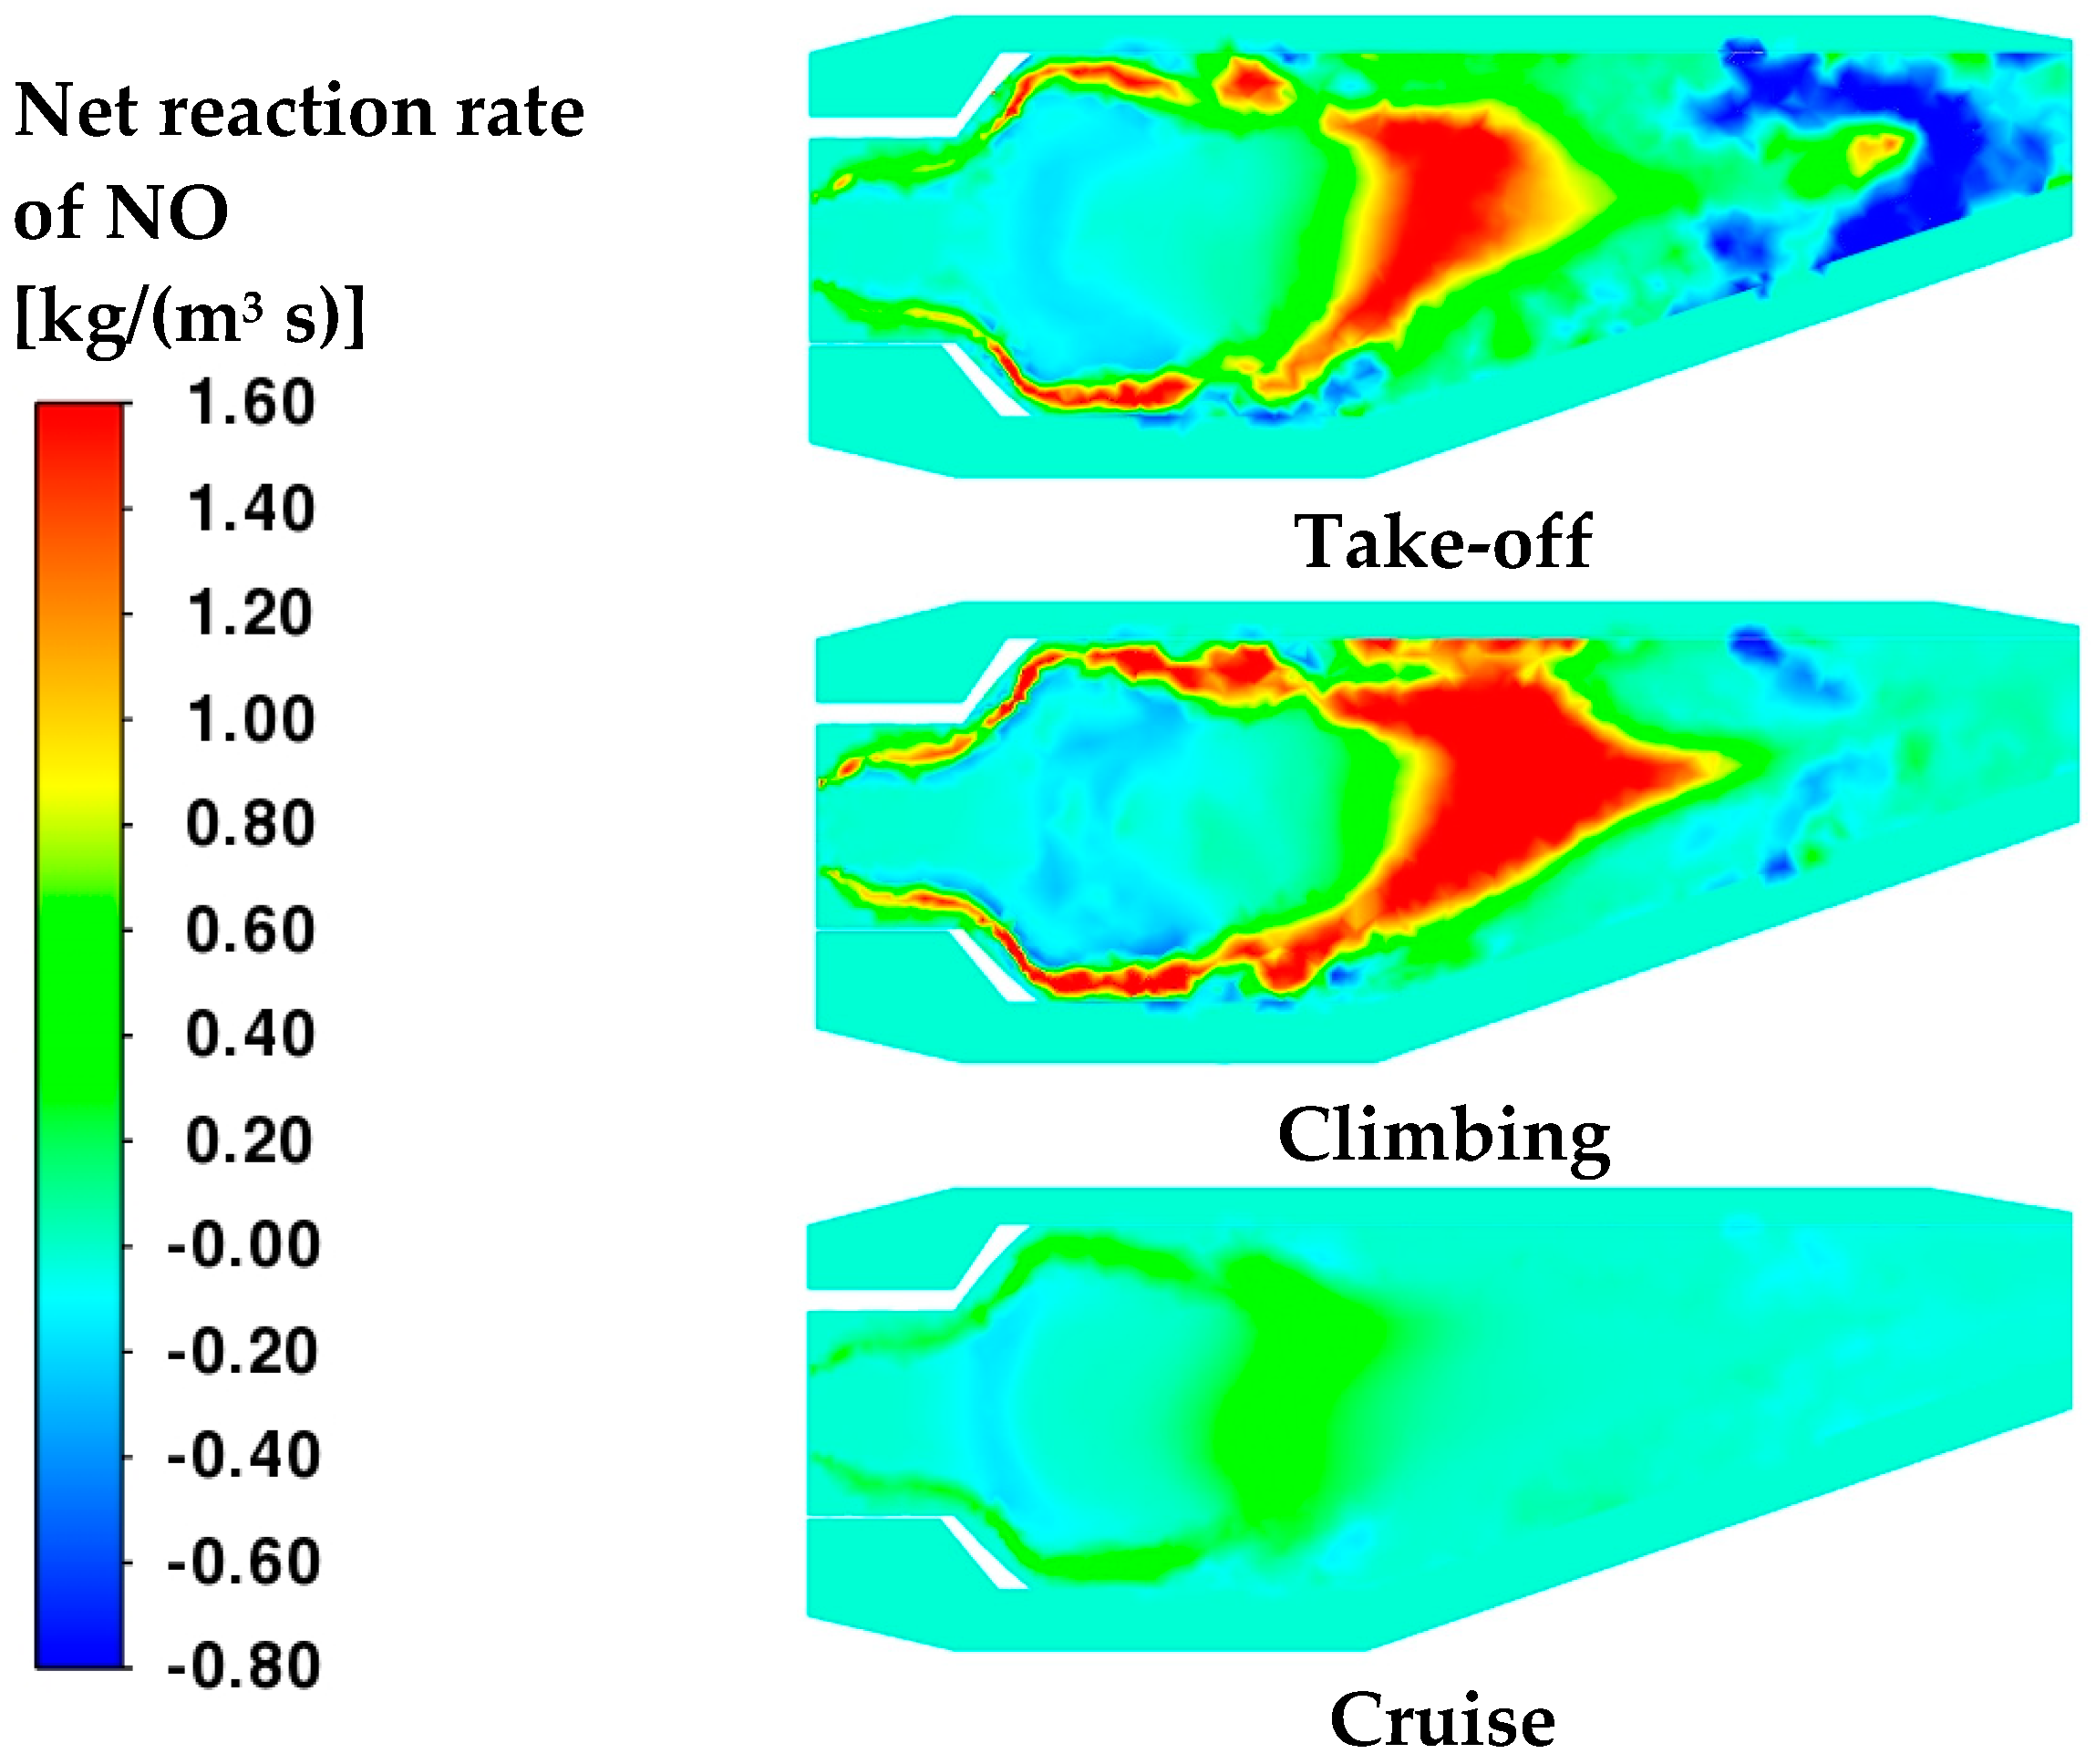
core promotes the formation of NO in the center of the burner where high temperatures are reached and oxygen is abundant. On the other hand, although the take-off and climbing conditions feature higher reactivity zones in the neck of the burner, only when air enters from the dilution holes is NO produced between the secondary and dilution zones due to the heat released from the ongoing reactions that contribute to the increase in temperature. Such conclusions are confirmed by examining
Figure 18. Moreover, it is interesting to notice that the same
Figure 18 displays negative reaction rates before the outlet; this suggests that the reduction in NO concentration already observed in
Figure 10 at 0.35 m of the axial path is due not only to the additional dilution of air but also to a redox of the NO species.
Finally, a summary of the NO concentrations is displayed in
Table 13. The use of hydrogen for the examined cases causes a dramatic increase in this pollutant species at the burner outlet. As already anticipated from
Figure 11, the simulations under the kerosene cruise condition feature higher emissions with respect to take-off, differently from the hydrogen simulation that presents the lower value. It is necessary to point out that major attention should be paid to the take-off and climbing conditions, since these flight phases are carried out in proximity to the ground entailing local pollution.
6. Conclusions
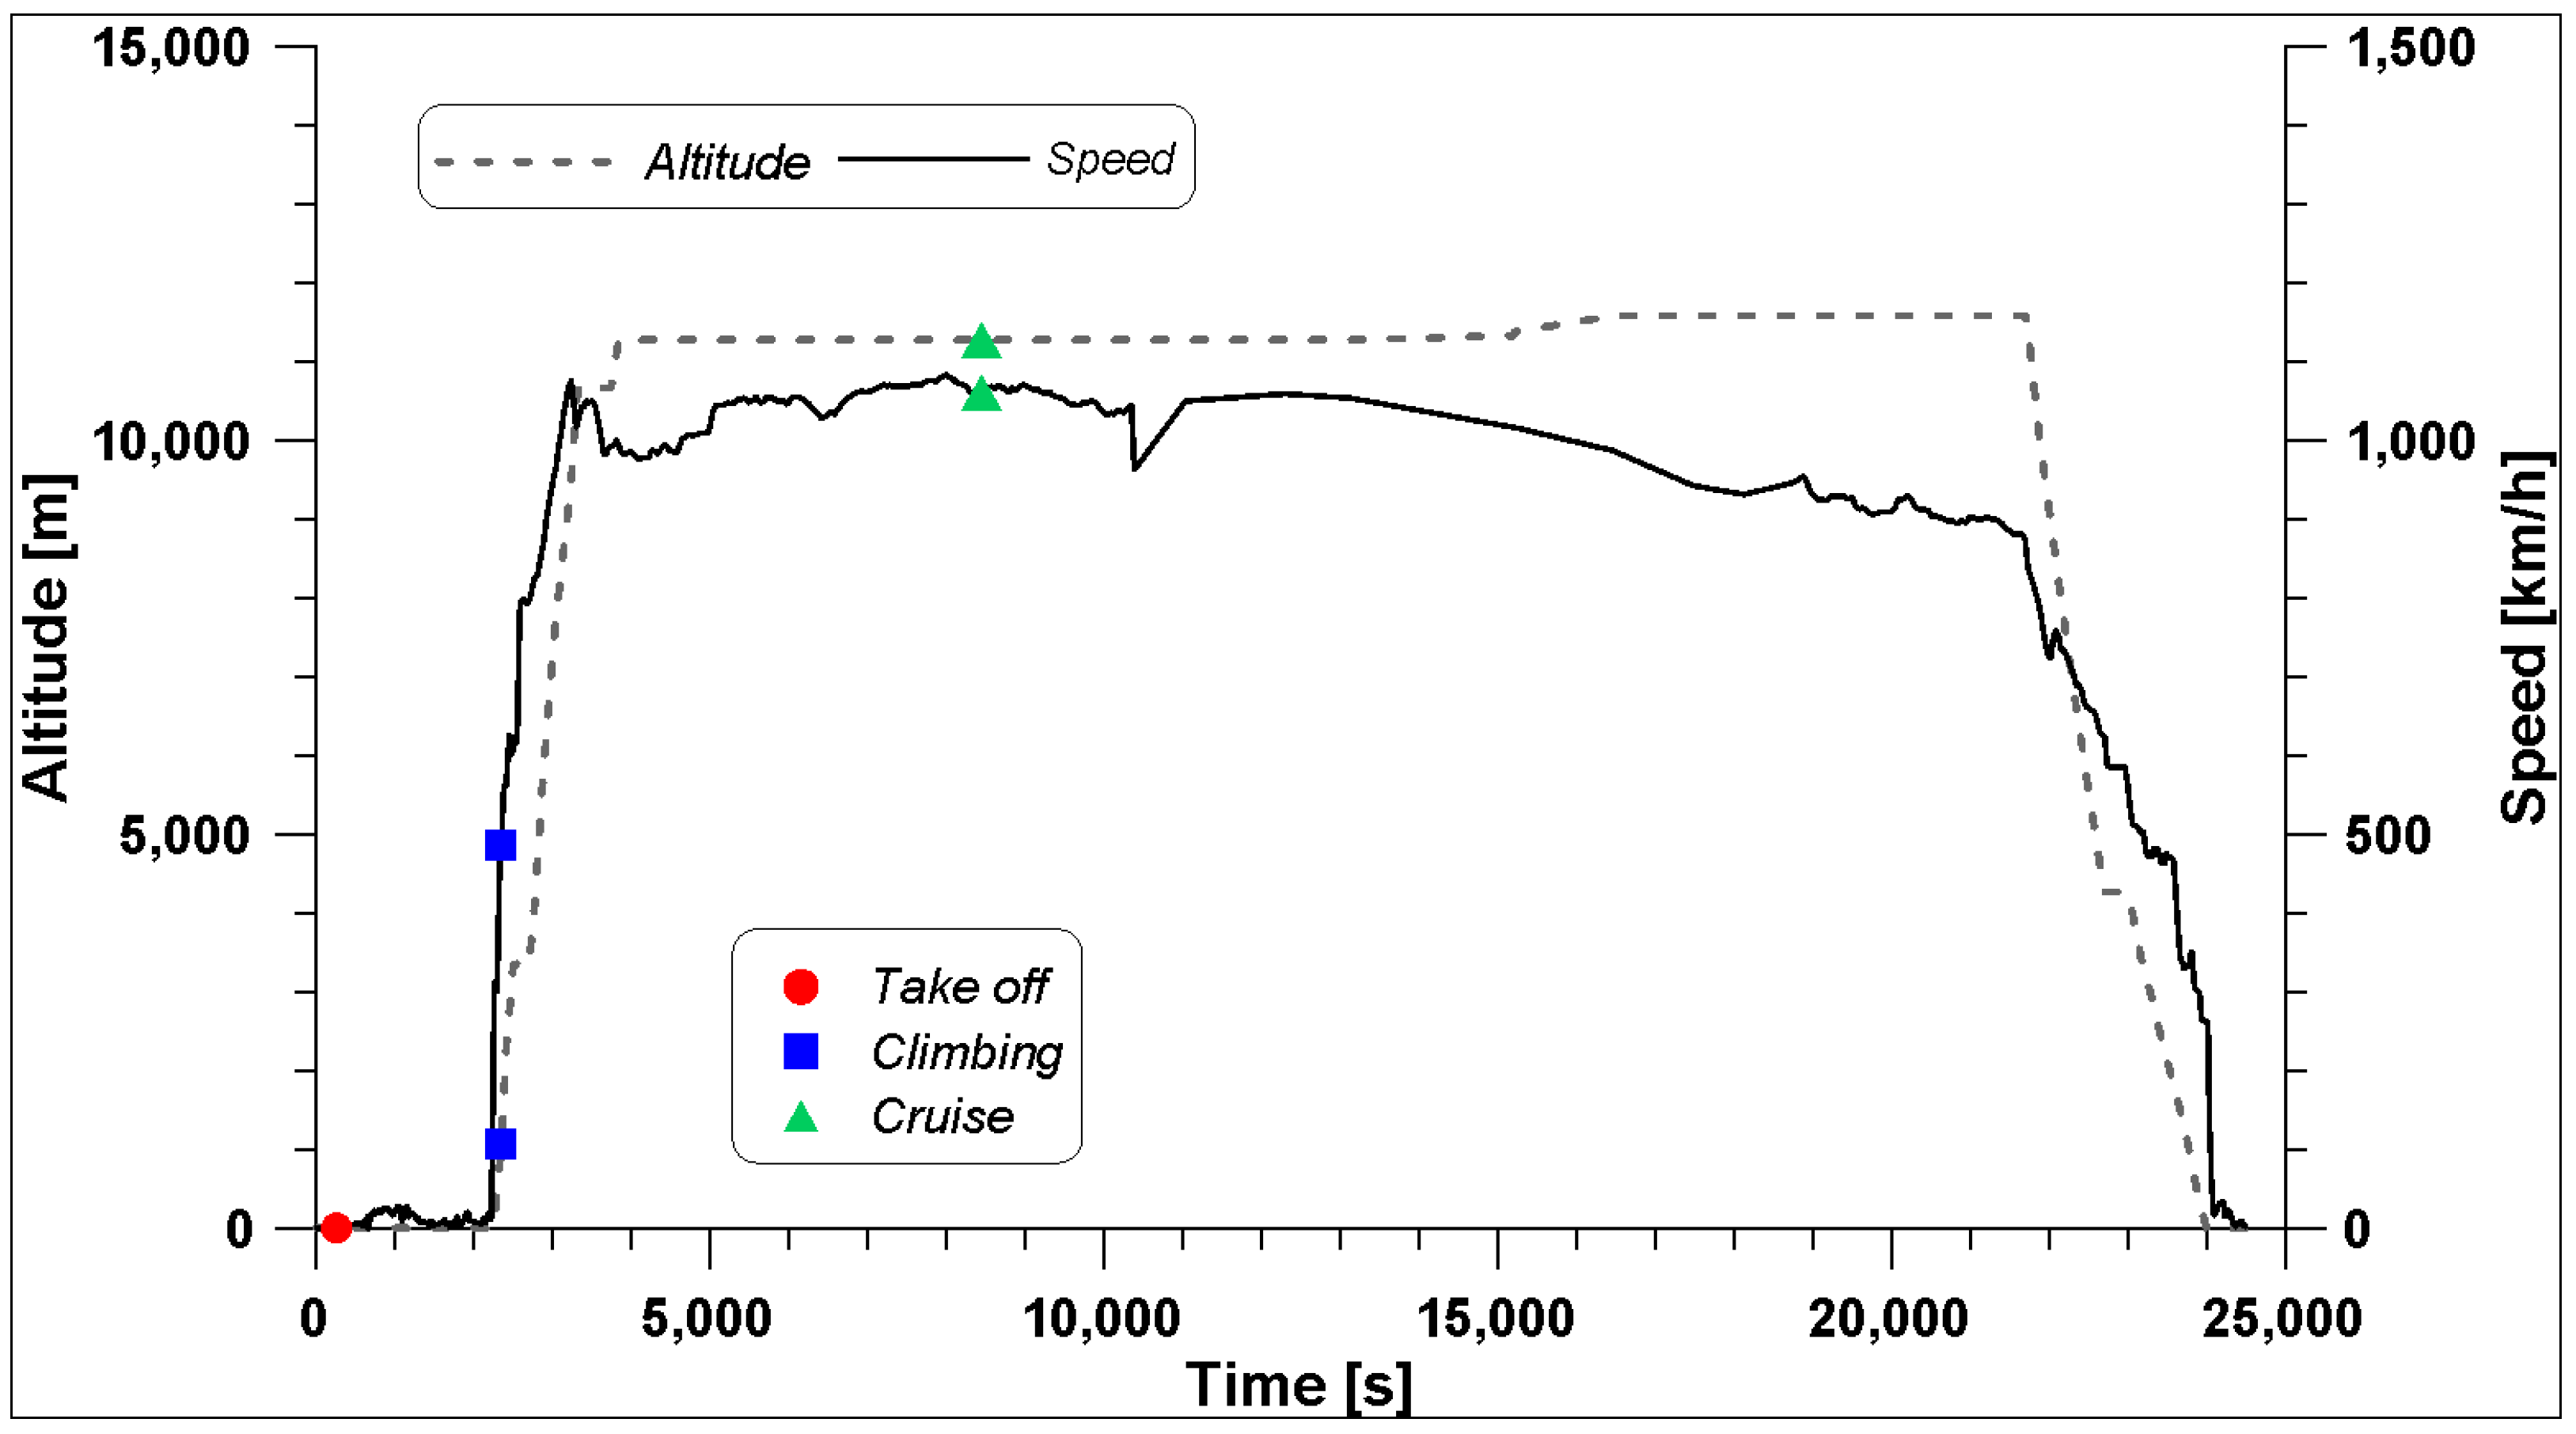
In this work, the use of hydrogen in the GE90 engine has been tested by using fluid-dynamic simulation tools, and the results have been compared with those of the standard fuel used in the aviation sector, that is, kerosene. A fly mission performed by a Boeing 777-200 (equipped with this engine) on the route New York–London (BA172) carried out on 8th November 2024 has been used to obtain the necessary information on the engine operation under three operating conditions: take-off, climbing, and cruise. These three conditions are characterized by very different altitude, speed, and thrust.
Firstly, a thermodynamic model has been developed and validated based on the data provided by the manufacturer. Then, the results obtained have been used as boundary conditions for the CFD simulations on the sole burner, to assess the possibility of using hydrogen instead of kerosene without affecting the efficient operation of the engine.
The main outcomes can be listed as follows:
Although the thermodynamic cycle is modified with respect to kerosene, the overall performance in terms of TIT and thrust can be ensured under all operating conditions. However, in all the cases, the increase in the hydrogen LHV allows a significant reduction in the overall fuel consumption while the heat consumption remains substantially unchanged. The CFD simulations provide important insights into the processes occurring inside the burner, considering that efficient combustion development must be guaranteed under every condition during a flight.
With both fuels, the cruise condition features different distributions of temperature and species inside the domain.
Despite the leaner conditions in the core region, where combustion is initiated, the use of hydrogen causes a substantial increase in temperature levels.
As a consequence, the locations of higher reactivity for the formation of thermal NO are detected and discussed. These pollutants significantly increase by using hydrogen under all the conditions, especially during take-off and climbing. This represents a critical aspect since these phases are carried out at a low altitude and can have a major impact on local pollution.
The above considerations suggest future developments of the authors’ work. First of all, the critical issue represented by the NO increase with hydrogen fueling can be addressed through proper modifications in the fuel–air mixing aiming at reducing the extent of regions with high NO formation rates. Furthermore, the CFD analysis is worthy of refinement in order to allow an investigation of some typical phenomena related to hydrogen fueling, like flashback to the injection system and insurgence of thermo-acoustic instabilities.


