1. Introduction
For military transport aircraft, improving short takeoff and landing (STOL) capability enables the rapid and precise deployment of combat forces in complex battlefield environments, enhancing battlefield adaptability [
1]. For civil transport aircraft, achieving short takeoff and landing can improve flight efficiency, alleviate congestion at major city airports, and reduce the runway length requirements for aircraft. It can also increase the utilization of smaller airports and help mitigate the impact of aircraft takeoff and landing noise on the surrounding environment [
2]. For transport aircraft with specific STOL requirements, conventional mechanical lift augmentation systems cannot meet the design requirements for low-speed aerodynamics. The technical challenge is to achieve efficient cruising while flying slowly with smaller wing sizes during takeoff and landing, making high-lift systems a critical design target [
3]. The Japanese US-2 large amphibious aircraft is a successful example of combining blown-flap technology and propeller slipstream technology [
4]. Blown-flap technology, which utilizes power for lift augmentation, will play a crucial role in the design of high-lift systems for future transport aircraft [
5,
6].
Propeller slipstream can significantly affect the aerodynamic characteristics of aircraft tail fins and other control surfaces. Researchers have determined the interference between propeller slipstream and wings through wind tunnel experiments and numerical simulations. Alba [
7] pointed out that the increase in dynamic pressure at the wing is primarily related to the axial induced velocity of the slipstream, while the change in the local angle of attack (AOA) of the wing is mainly related to the tangential induced velocity of the slipstream. Both effects alter the lift distribution of the wing. Miranda [
8] utilized lifting-line theory and a vortex tube model to study the optimal design of propeller–wing configurations to reduce induced drag. Rakshith [
9] et al. investigated the chord length distribution of wings under the influence of propeller slipstream. The study found that shorter chord lengths in the slipstream region are beneficial for reducing wing drag. Veldhuis [
10,
11,
12] studied the twist angle distribution of wings under the influence of propeller slipstream and found that upward rotation on the inner side of the propeller, propeller installation closer to the wingtip, and higher or lower vertical positions are conducive to improving the lift-to-drag ratio. Xue Chen [
13] et al. validated the accuracy of numerical methods by comparing them with experimental data. By analyzing data on the effects of different propellers on wing aerodynamic characteristics, they concluded that increasing the induced axial velocity downstream of the hub is beneficial for improving the lift-to-drag ratio. Ma Shuai [
14] et al., through a combination of experiments and simulations, proposed that the enhanced dynamic pressure on the flap within the slipstream region and the high-speed slipstream have a blowing effect on the boundary layer of high-deflection flaps, which can delay airflow separation and improve flap efficiency.
With the in-depth research on active flow control technology, efforts have been made to combine propeller slipstream with active flow control for optimized design, achieving better control effects. The German Aerospace Center (DLR) [
3] conducted experimental studies on the flap steady jet flow based on the Coanda effect under the influence of propeller slipstream. After control, the overall lift coefficient of the model reached 4.2, with the maximum local lift coefficient exceeding 6. The study also explored the strategy of using differential jet flow on both sides of the short nacelle to save air volume. Keller [
15] and others used CFD to study the impact of jet flow flaps on aircraft’s longitudinal stability, considering the effects of propeller slipstream. Murnieks [
16] and others simulated aircraft’s hover flight conditions and investigated the effectiveness of various trailing-edge Coanda active flow control actuators in propeller slipstream. To explore the effect of actuator design on propeller slipstream, Murnieks [
17] and others also provided the optimal installation positions for Coanda active flow control actuators and compared their effectiveness in propeller slipstream. However, the effectiveness of actuators under slipstream effects with freestream flow and flaps has not been studied.
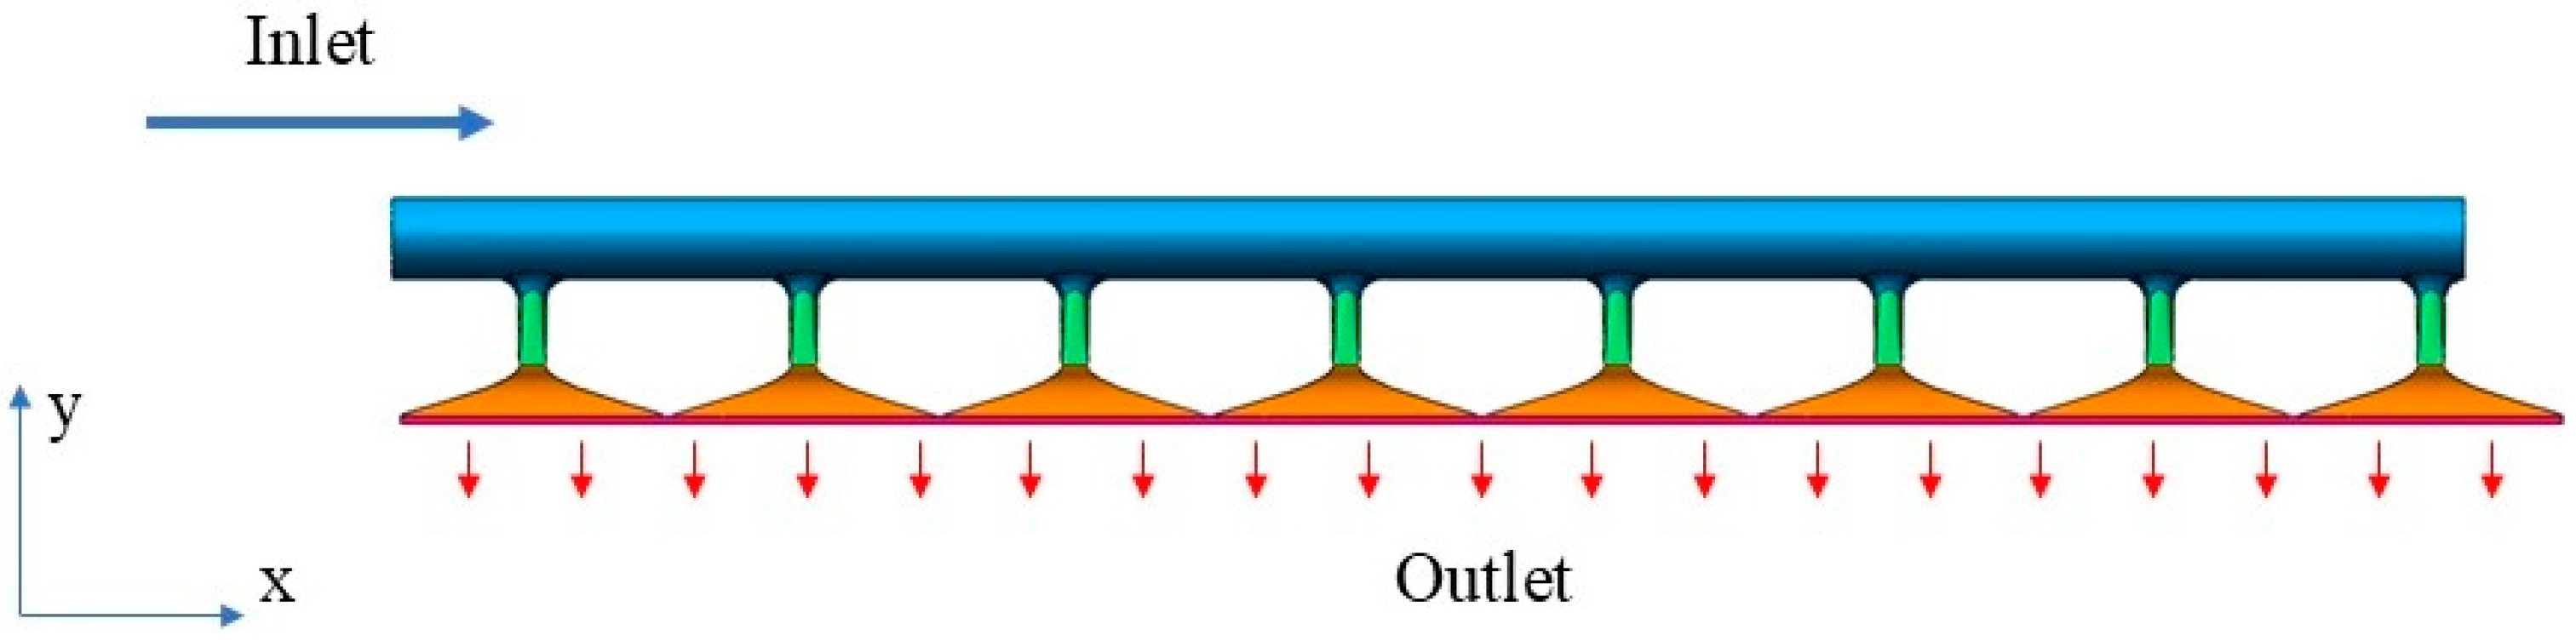
In actuator design, previous research has mostly focused on the trailing edge and the design of the wing itself, with less attention given to the design of plenum uniformly distributed along the span of the wing. J. Chard [
18] and others conducted studies on the internal design of actuators. Under compact size, weight, and power constraints, they optimized the internal design from intake to exhaust using CFD to some extent and preliminarily summarized related design experiences. However, there is still a lack of systematic parametric studies and validation. Crowther B [
19,
20] and others conducted a parametric study on the flow distribution system of compact actuators. Through CFD and experimental verification, they analyzed the impact of the design space of each component on pressure loss and created a toolkit for designing flow distribution systems. Their approach to intake chamber design involved adding guide vanes to distribute the flow spanwise. The addition of guide vanes did have a positive effect on the spanwise distribution of airflow, but the flow inevitably generated vortex structures at the guide vanes, increasing the complexity of the internal flow field and raising the system’s pressure drop.
In previous studies, although there has been research on the coupling effect of slipstream and jet flow, most of the studies focused on the case of spanwise uniform jet flow. Murnieks [
16,
17] only studied the case where jet flow is present locally at the wing trailing edge without considering the effect of the freestream flow. The focus of this study is to experimentally investigate the effect of momentum variation along the spanwise position of the trailing-edge jet actuator on the propeller slipstream in the presence of freestream flow. Under the influence of propeller slipstream, the wing’s upper surface is divided into two regions, the upper-wash side and the lower-wash side, using the propeller’s centerline as a dividing line. The slipstream is asymmetrically distributed on both sides, with the slipstream velocity on the lower-wash side being higher than that on the upper-wash side. The overall direction of the slipstream is also biased toward the lower-wash side. The position directly in front of the propeller is where the slipstream velocity is at its maximum, and due to the influence of the propeller nacelle vortex, separation is more likely to occur at the flap. In this study, the actuator design is used to alter the local jet momentum coefficient. Through experimental methods, the effects of propeller slipstream on flap separation and jet flow control effectiveness are investigated under conditions of natural airflow.
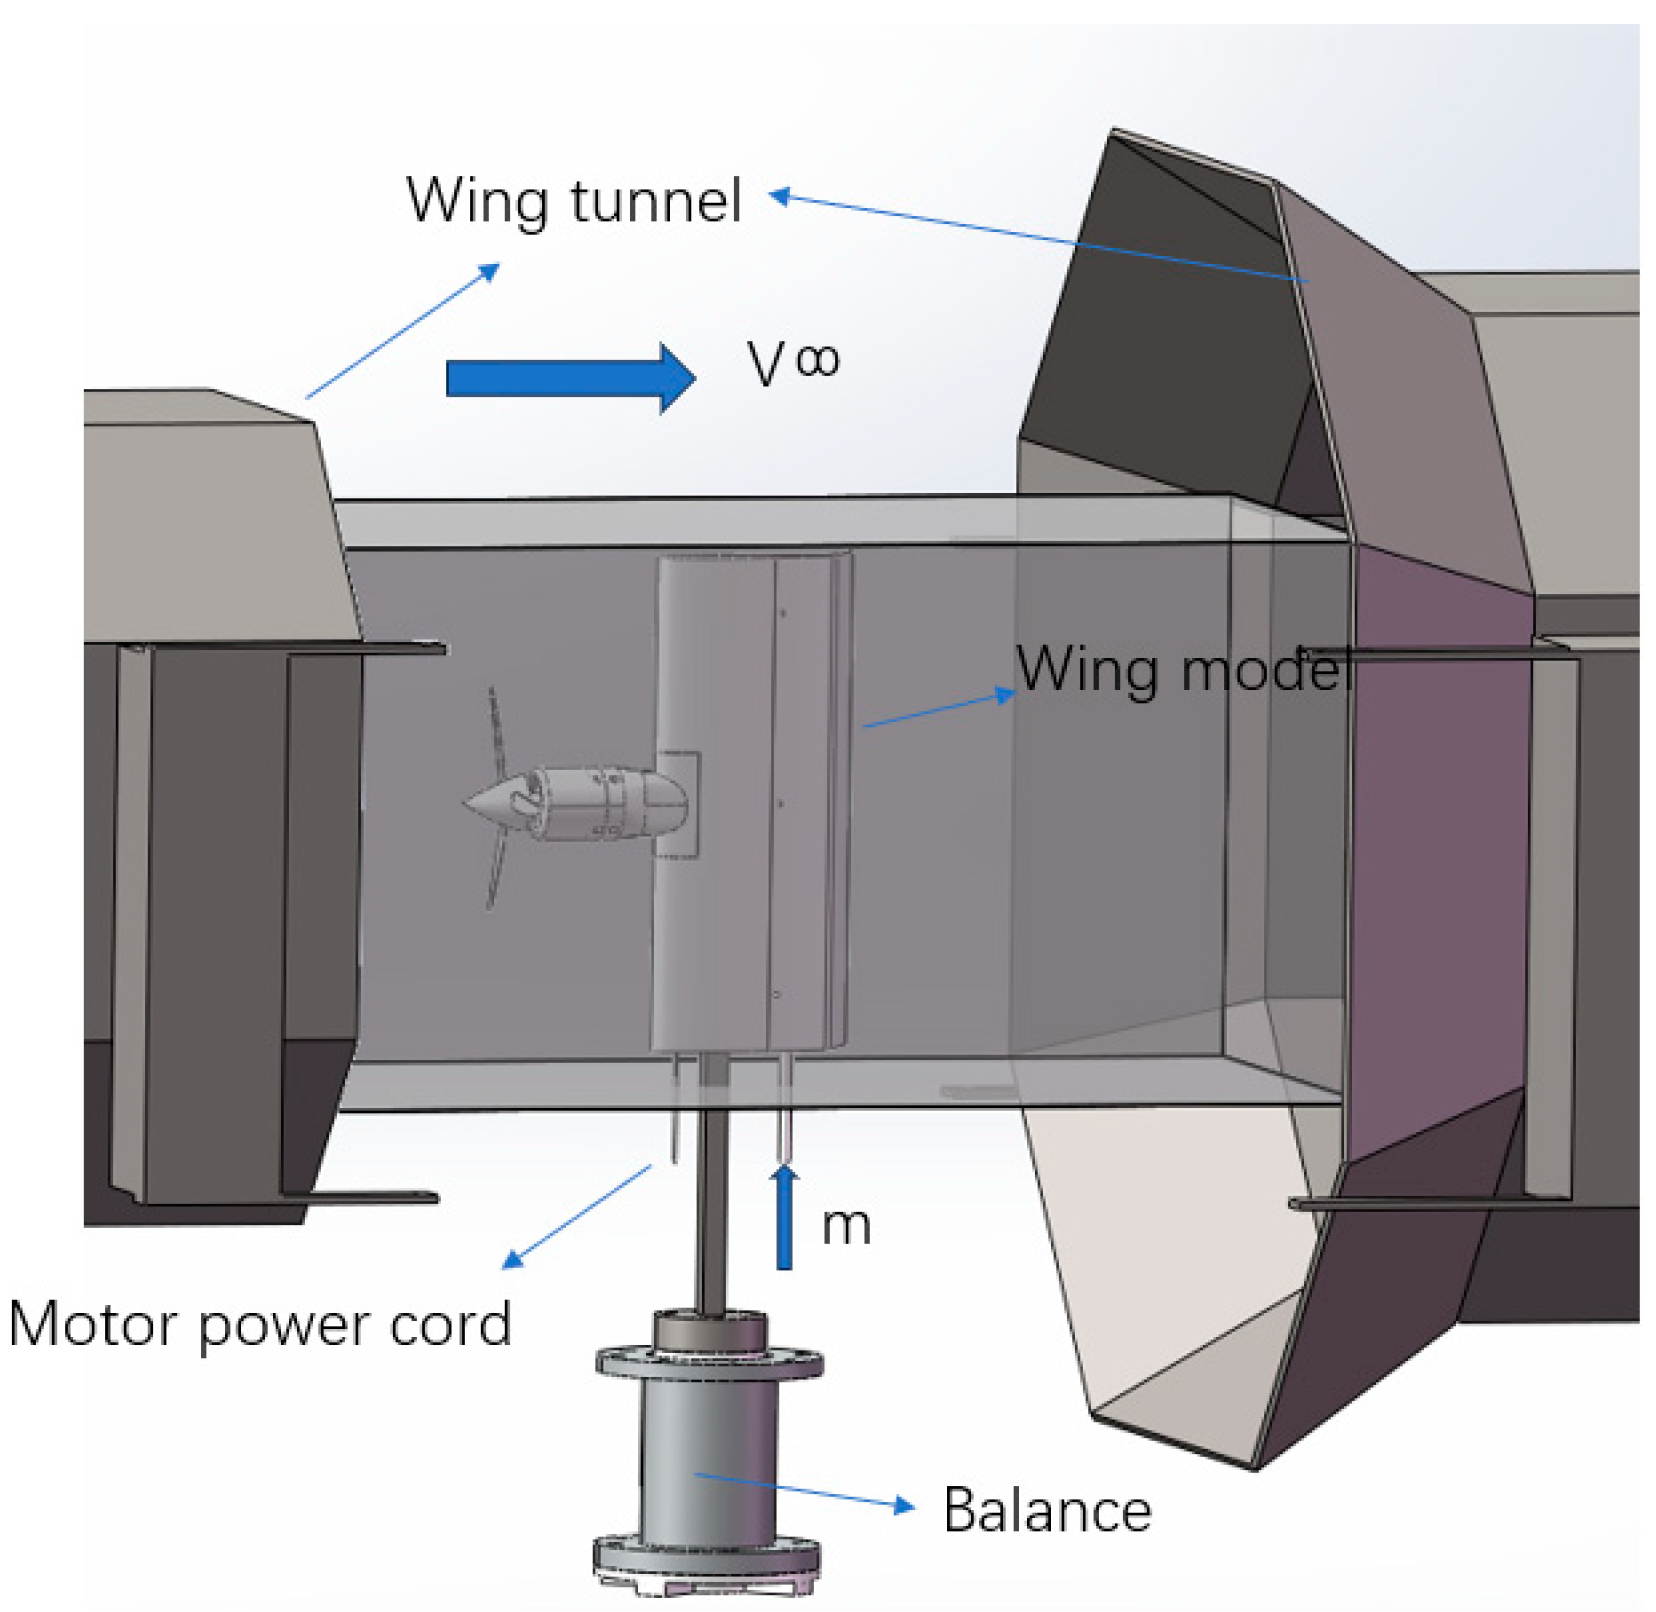
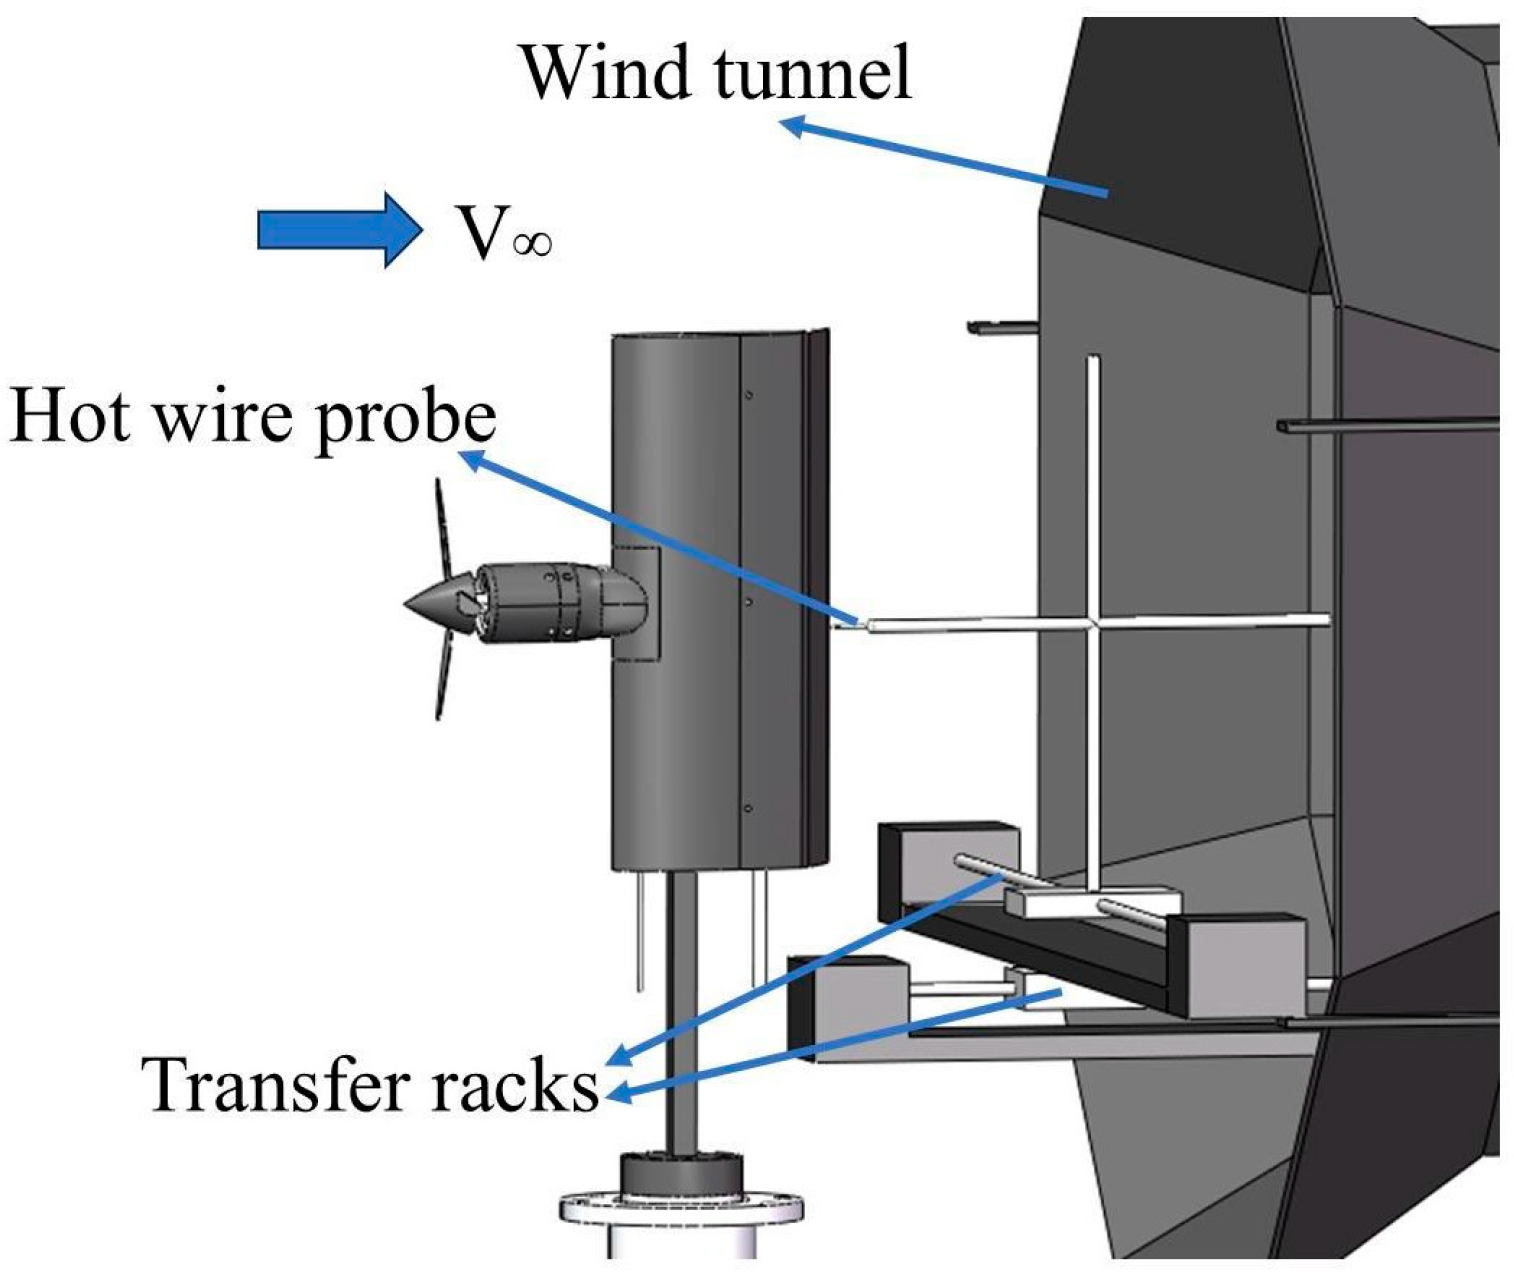
3. Experimental Data and Analysis
The test fixed wing has an angle of attack of 0°, a flap deflection angle of 60°, and a freestream velocity of 15 m/s. The propeller speed is measured using a digital tachometer, with a measurement error of less than 10 RPM. The propeller thrust and other detailed parameters are shown in
Table 2. The test adjusts the jet momentum coefficient through a flowmeter, and the detailed parameters are shown in
Table 3.
3.1. The Impact of Slipstream Effect
The impact of the propeller on the airflow over the upper surface of the wing is multifaceted. At very low propeller speeds, although the generated thrust and vortices are small, they still affect the airflow distribution on the wing surface and have a certain influence on the lift coefficient. When the freestream velocity is 15 m/s, thrust coefficients of 0.04, 0.13, 0.25, and 0.46 are selected for study.
Figure 11 shows the lift coefficient curves under different thrust coefficients without jet flow. The results indicate that as the thrust coefficient increases, the lift coefficient of the wing increases approximately linearly. When the propeller thrust coefficient increases from 0.04 to 0.46, the lift coefficient increases by 37.9%. The reason for this is that as the thrust coefficient increases, the slipstream effect gradually strengthens, accelerating the airflow over the upper surface of the wing, causing the angle of attack of the wing leading edge relative to the freestream to increase, thereby enhancing the overall lift coefficient. This is consistent with the conclusions of Catalano F M et al. [
22,
23,
24].
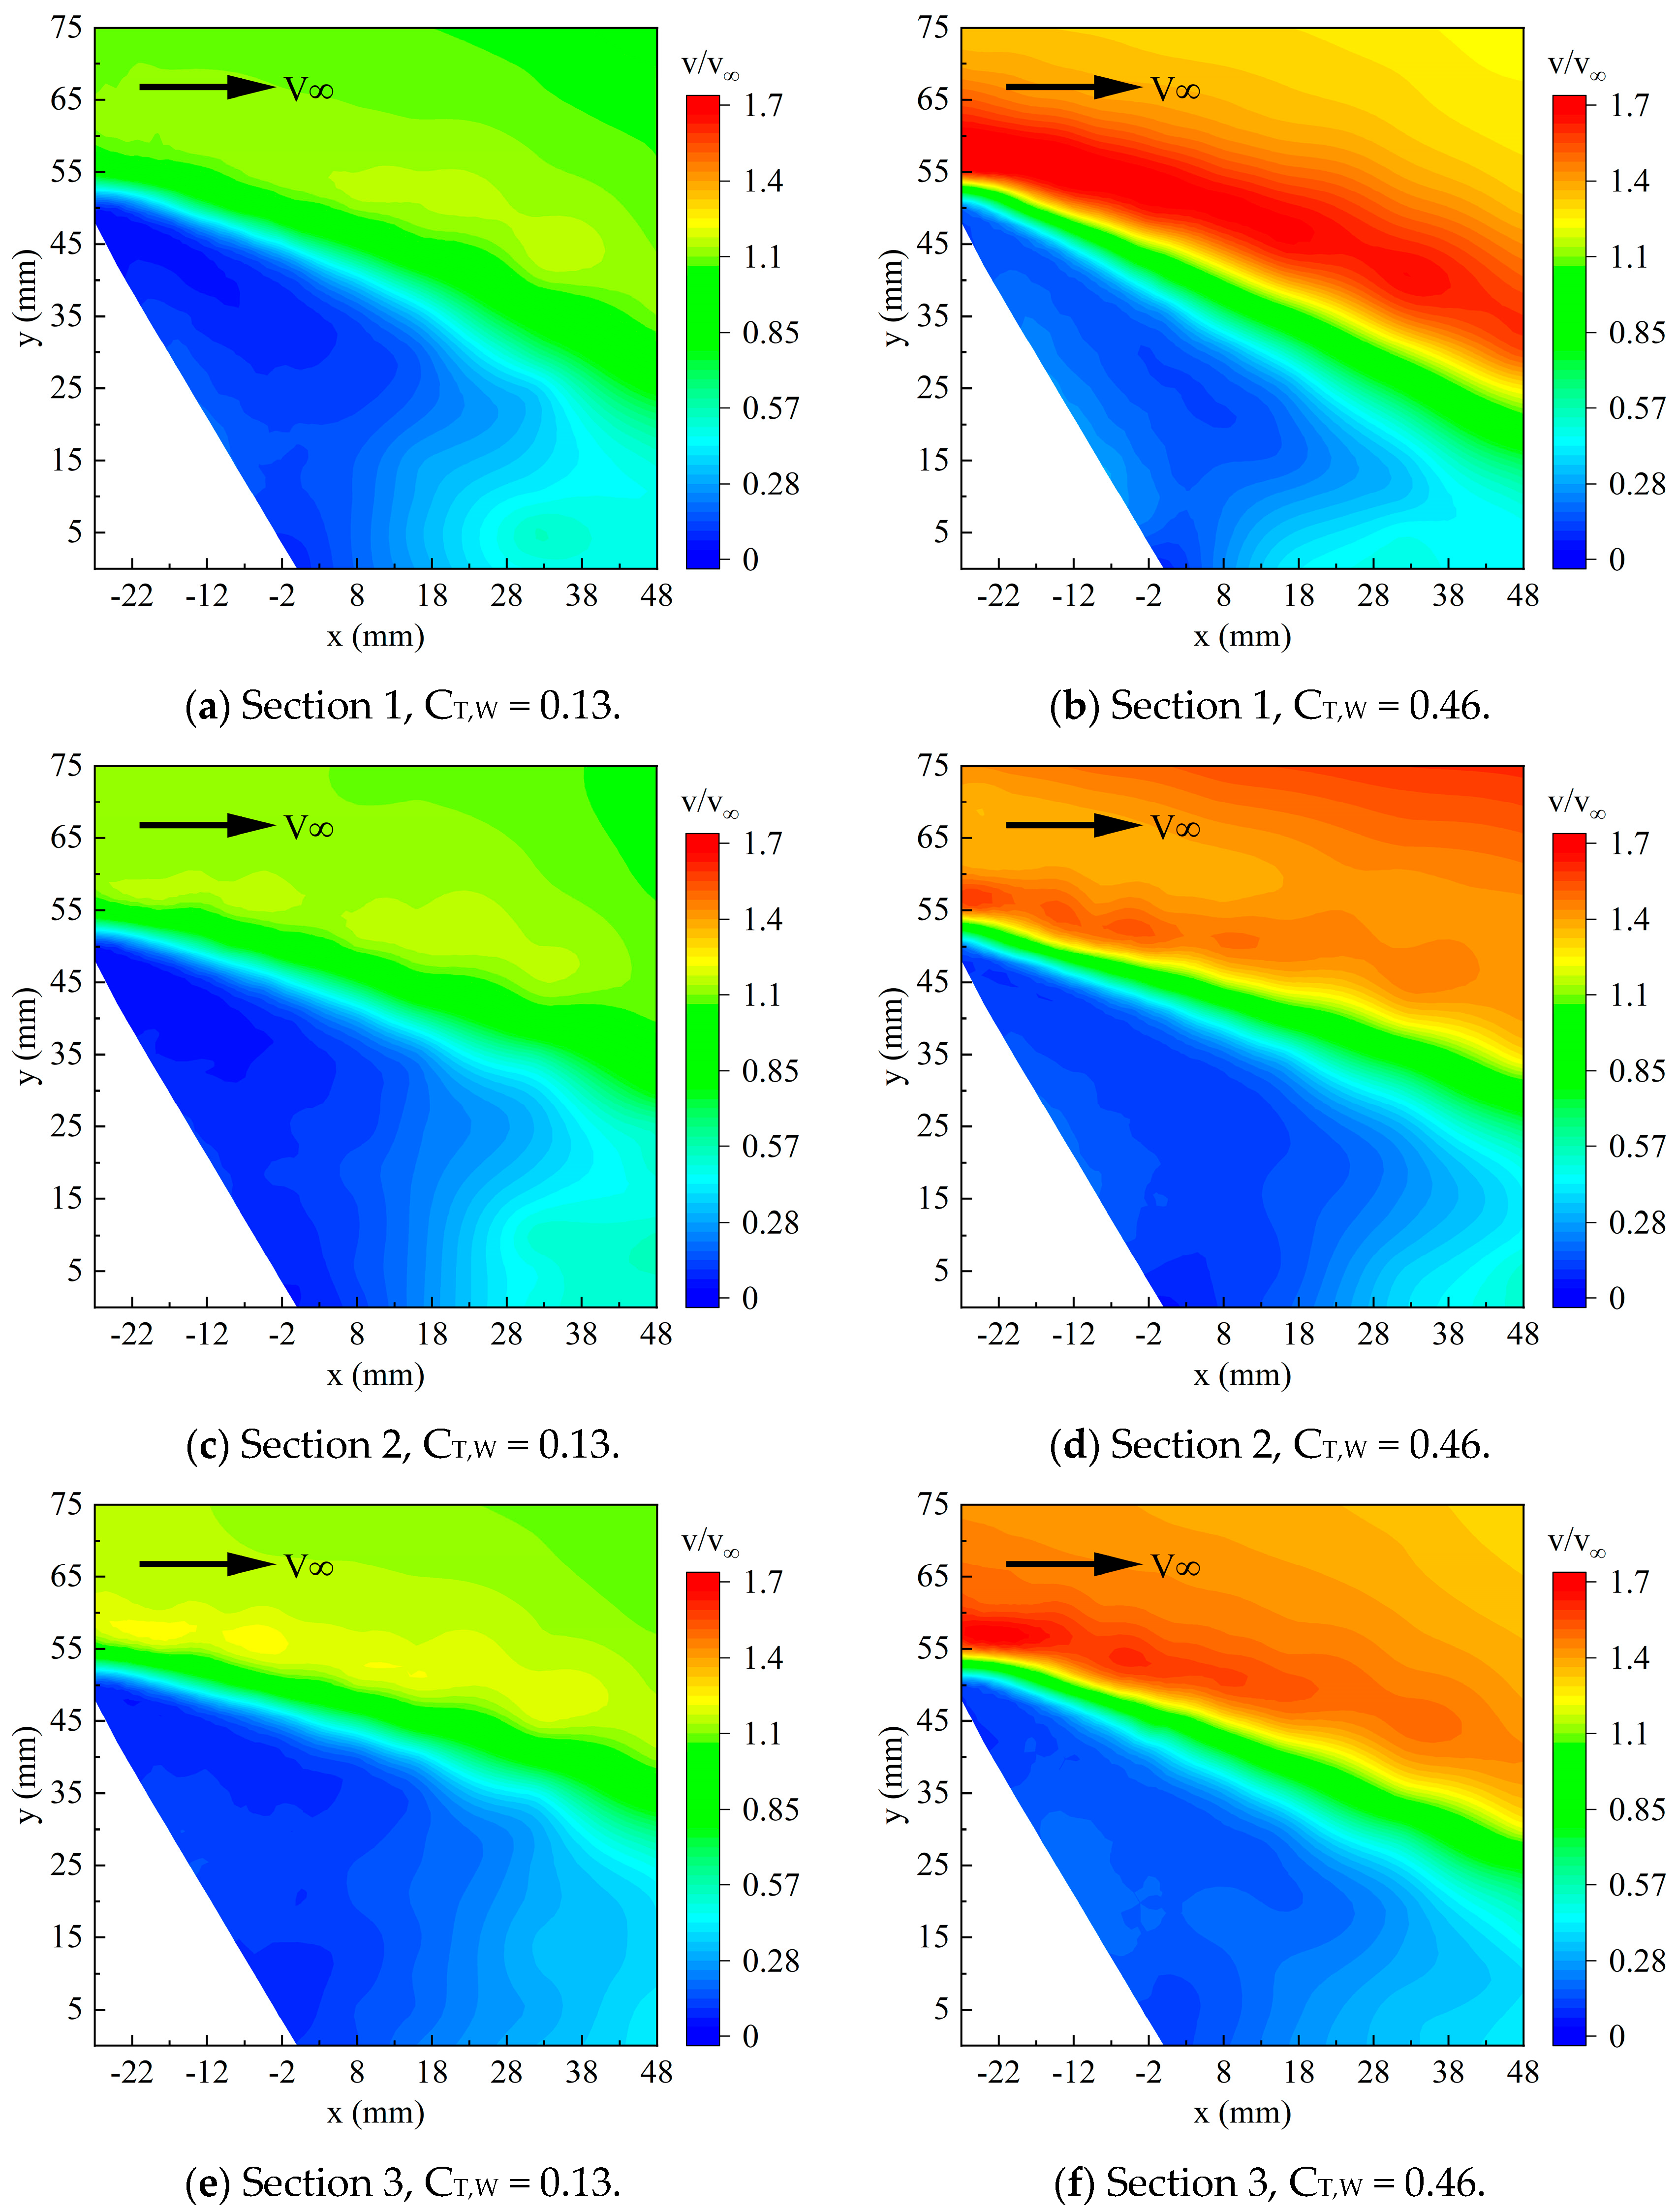
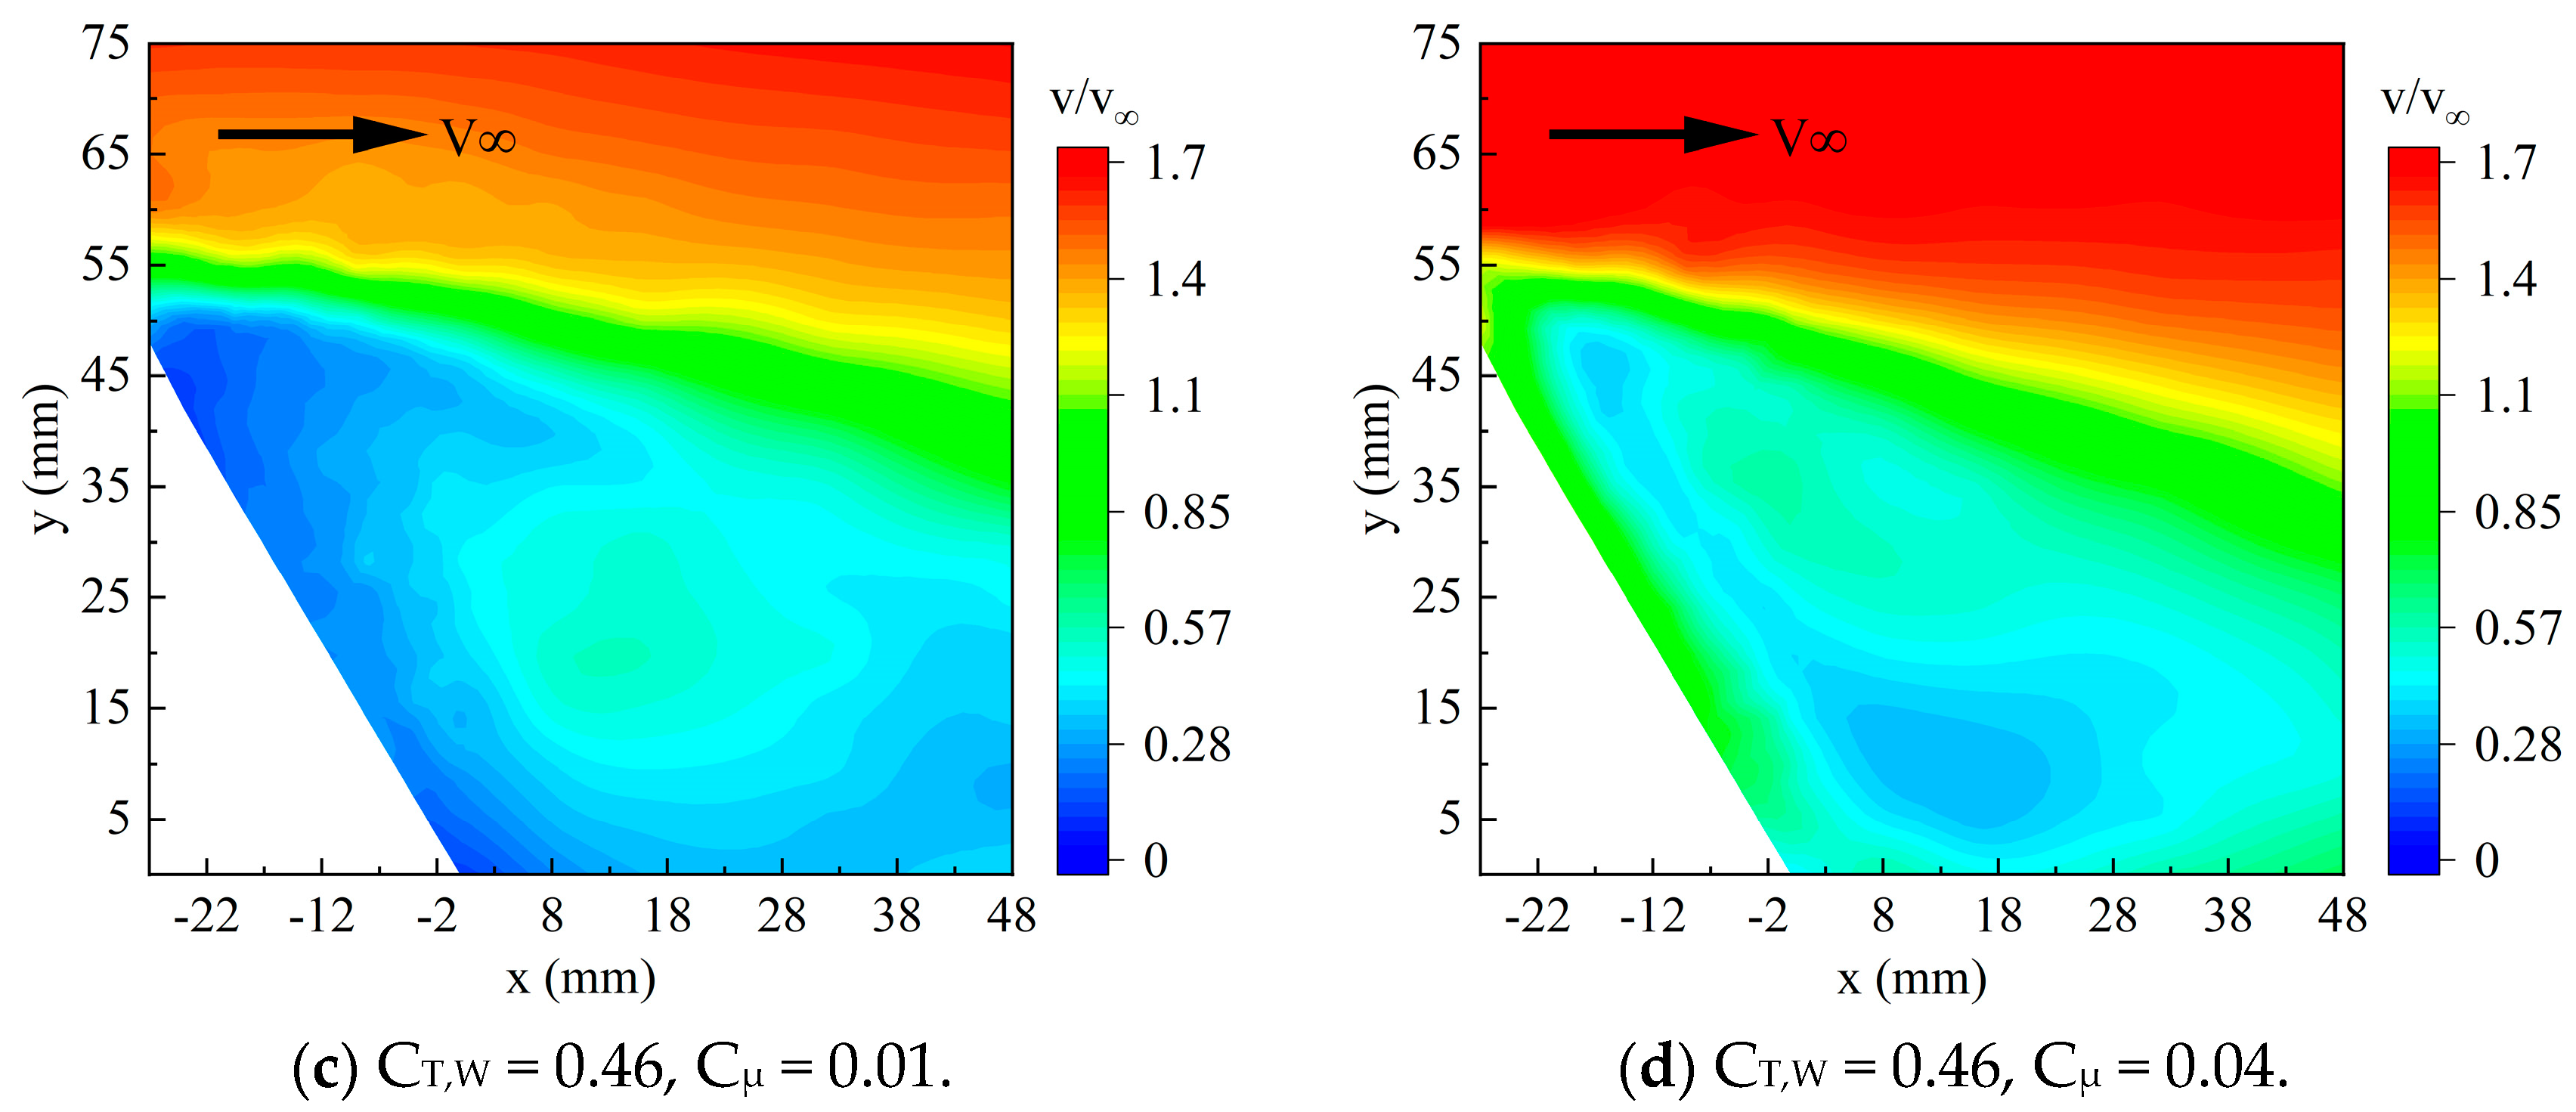
Figure 12 shows the velocity flow field of the wing at different flap positions for thrust coefficients of 0.13 and 0.46. As the thrust coefficient increases, a significant increase in velocity in the mainstream area can be observed, while the changes in the low-speed region are relatively small. For the same thrust coefficient, due to the slipstream’s high-speed flow slightly biased toward the downwash side, the local Reynolds number at the flap position increases [
25,
26]. This helps delay the flow separation over the flap. Comparing the downwash-side section (
Section 1) and the upwash-side section (
Section 3), the low-speed region on the downwash side is smaller than that on the upwash side, and the separation shear layer has a certain downward deflection. Additionally, at a thrust coefficient of 0.46, for the flap position directly aligned with the propeller (
Section 2), the high-speed region in the mainstream area is biased upward. In comparison,
Section 1 and
Section 3 have lower positions for the high-speed region. This is due to the influence of the propeller nacelle, which generates nacelle vortices on both sides of the nacelle as the airflow passes through it [
15,
27]. These vortices continually absorb the airflow energy near the wall at the nacelle center [
27]. Furthermore, because the speed at the propeller’s direct position is higher and the leading-edge relative angle of attack is greater, the boundary layer at the trailing-edge flap position becomes thicker, causing the mainstream to shift upward.
3.2. Jet Control Under Slipstream Effect
Figure 13a shows the variation of ΔC
L with different momentum coefficients for the uniformly distributed jet of actuator A. It is clearly observed that as the momentum coefficient increases, ΔC
L increases accordingly.
Figure 13b shows the corresponding lift gain factor curve. When the momentum coefficient increases to 0.1, the lift gain factor decreases by approximately 65% compared to when the momentum coefficient is 0.01. From theoretical analysis, the jet from the actuator can improve the airflow characteristics on the flap surface. When airflow attachment is enhanced, the flow becomes smoother, thereby increasing the pressure difference between the upper and lower surfaces of the wing and enhancing the lift. However, as the momentum coefficient increases, flow separation at the flap position is completely eliminated. Beyond this point, further increases in the momentum coefficient result in diminishing returns in terms of lift coefficient improvement. Therefore, when the momentum coefficient continues to increase, the lift enhancement coefficient shows a decreasing trend. Additionally, it can be observed that at the same momentum coefficient, a higher thrust coefficient leads to a greater lift enhancement coefficient and lift gain coefficient. This indicates that stronger slipstream effects result in more significant jet flow control effects.
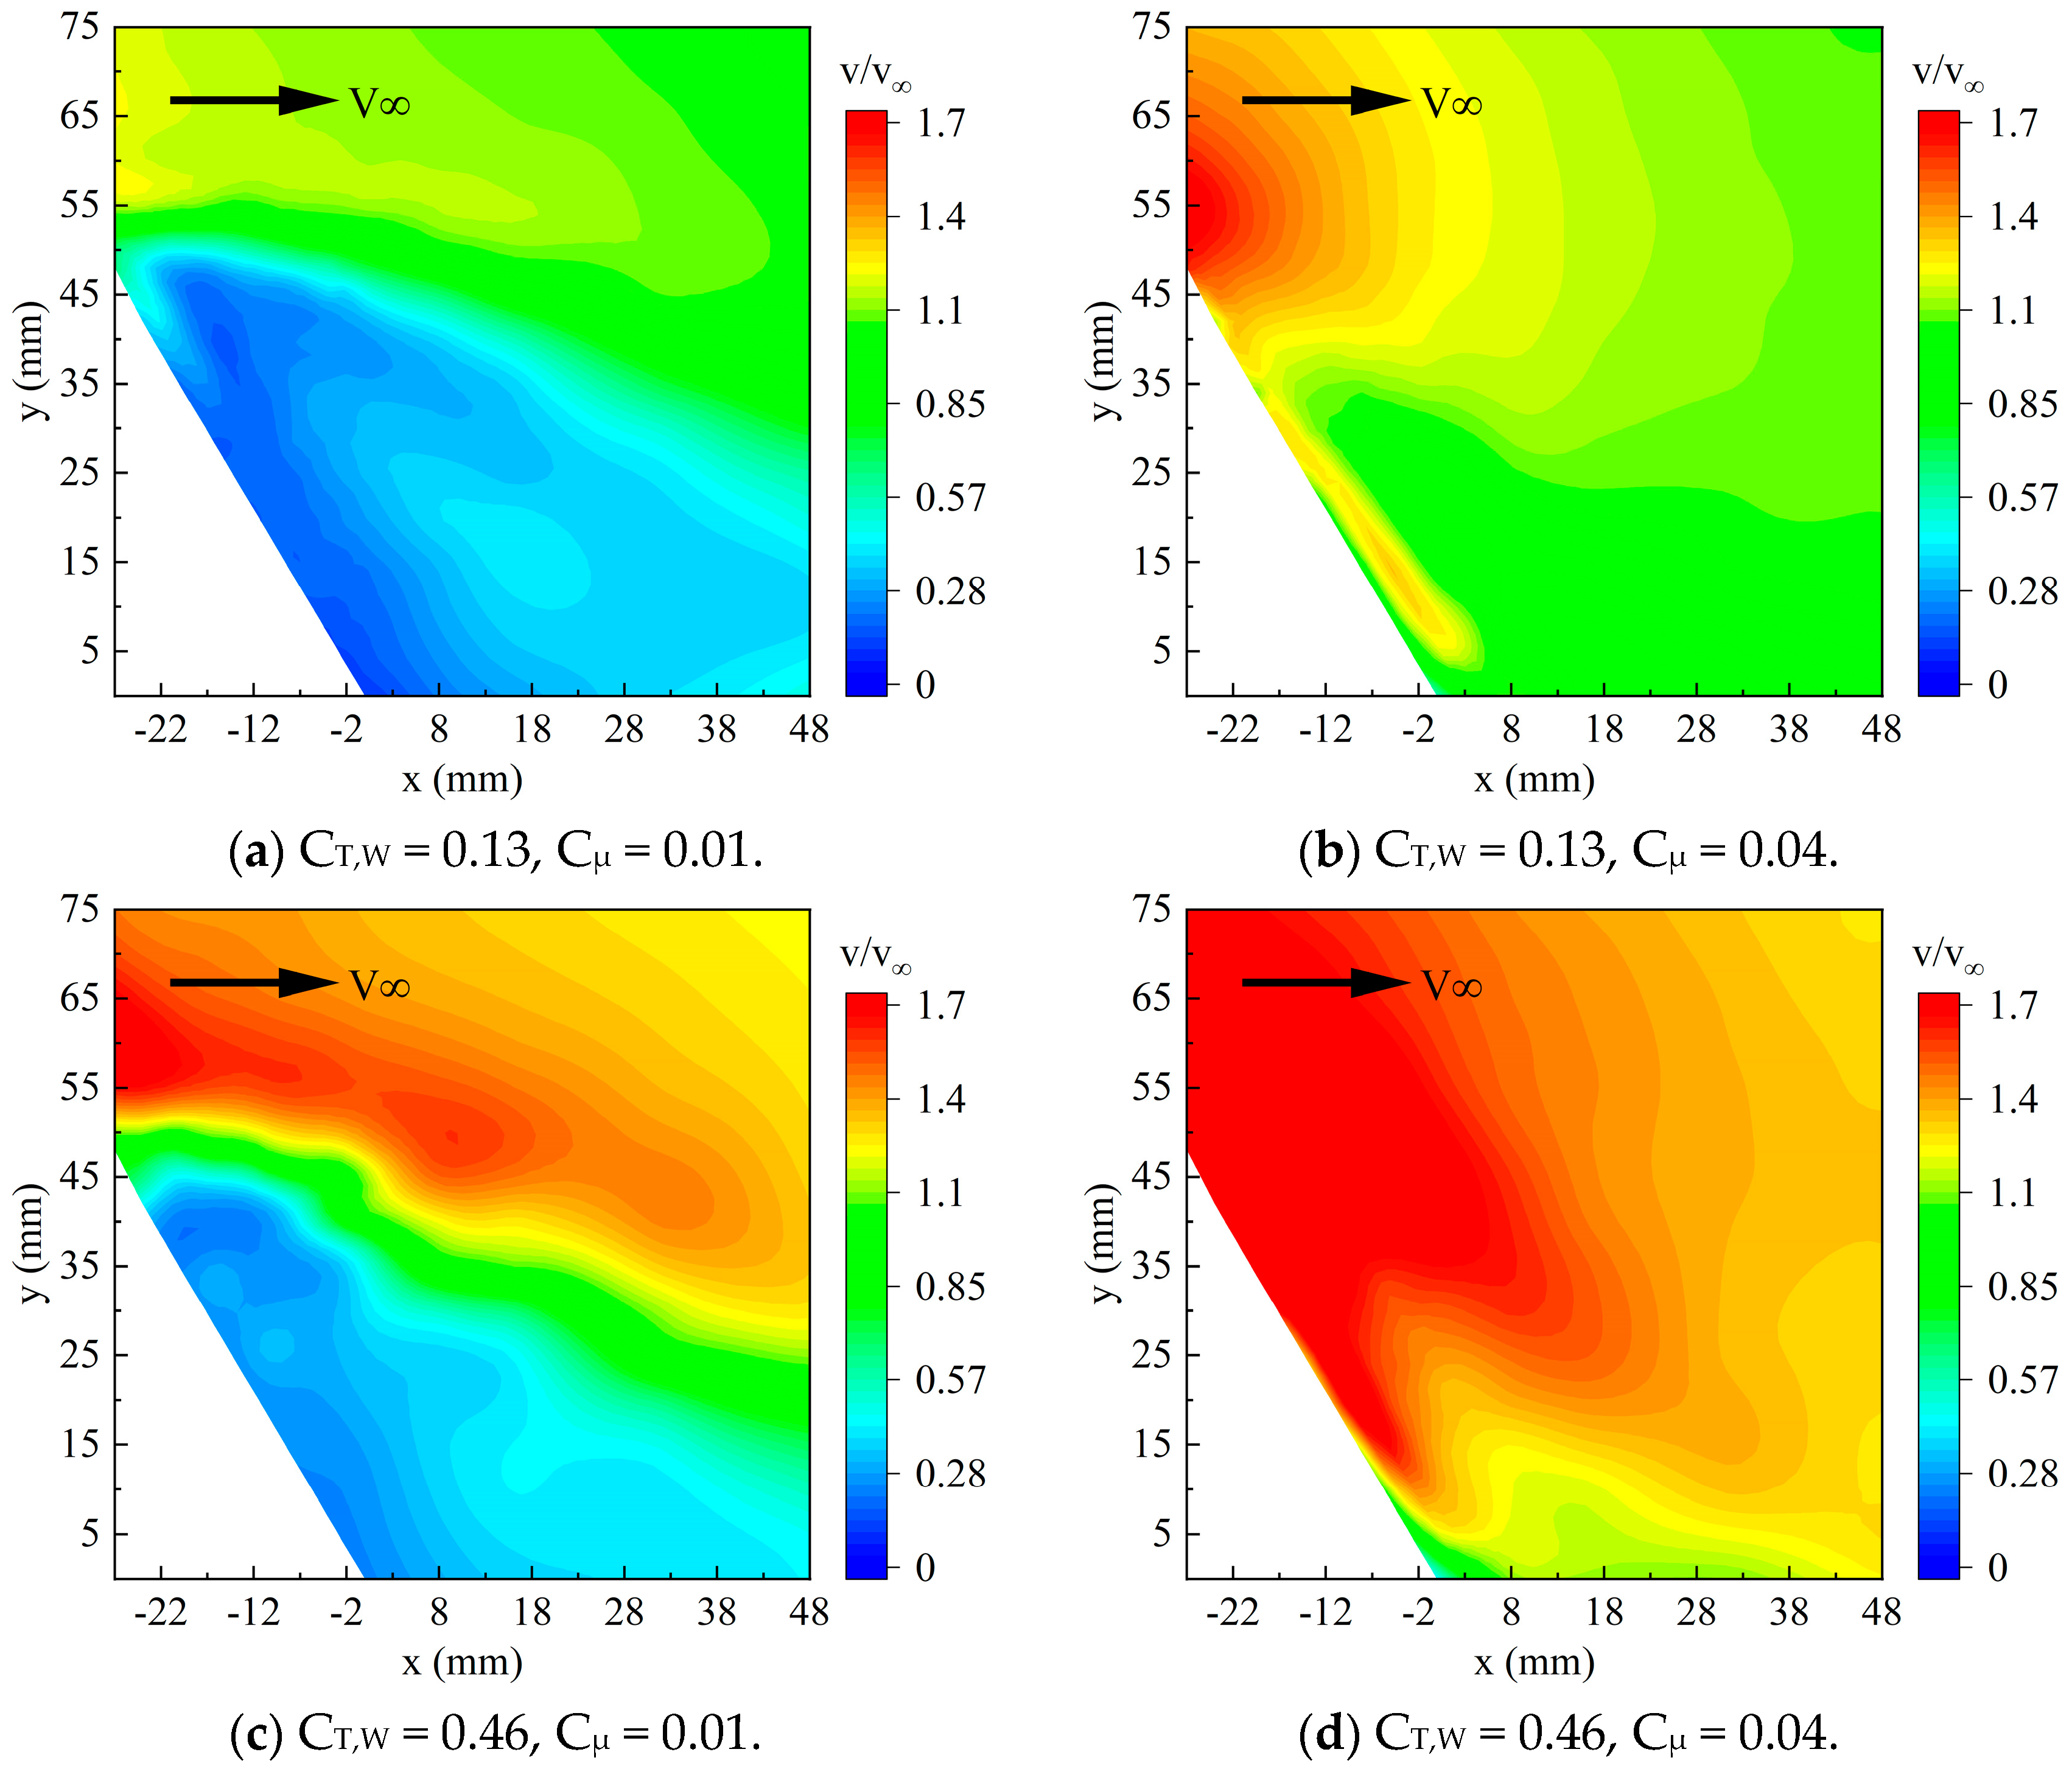
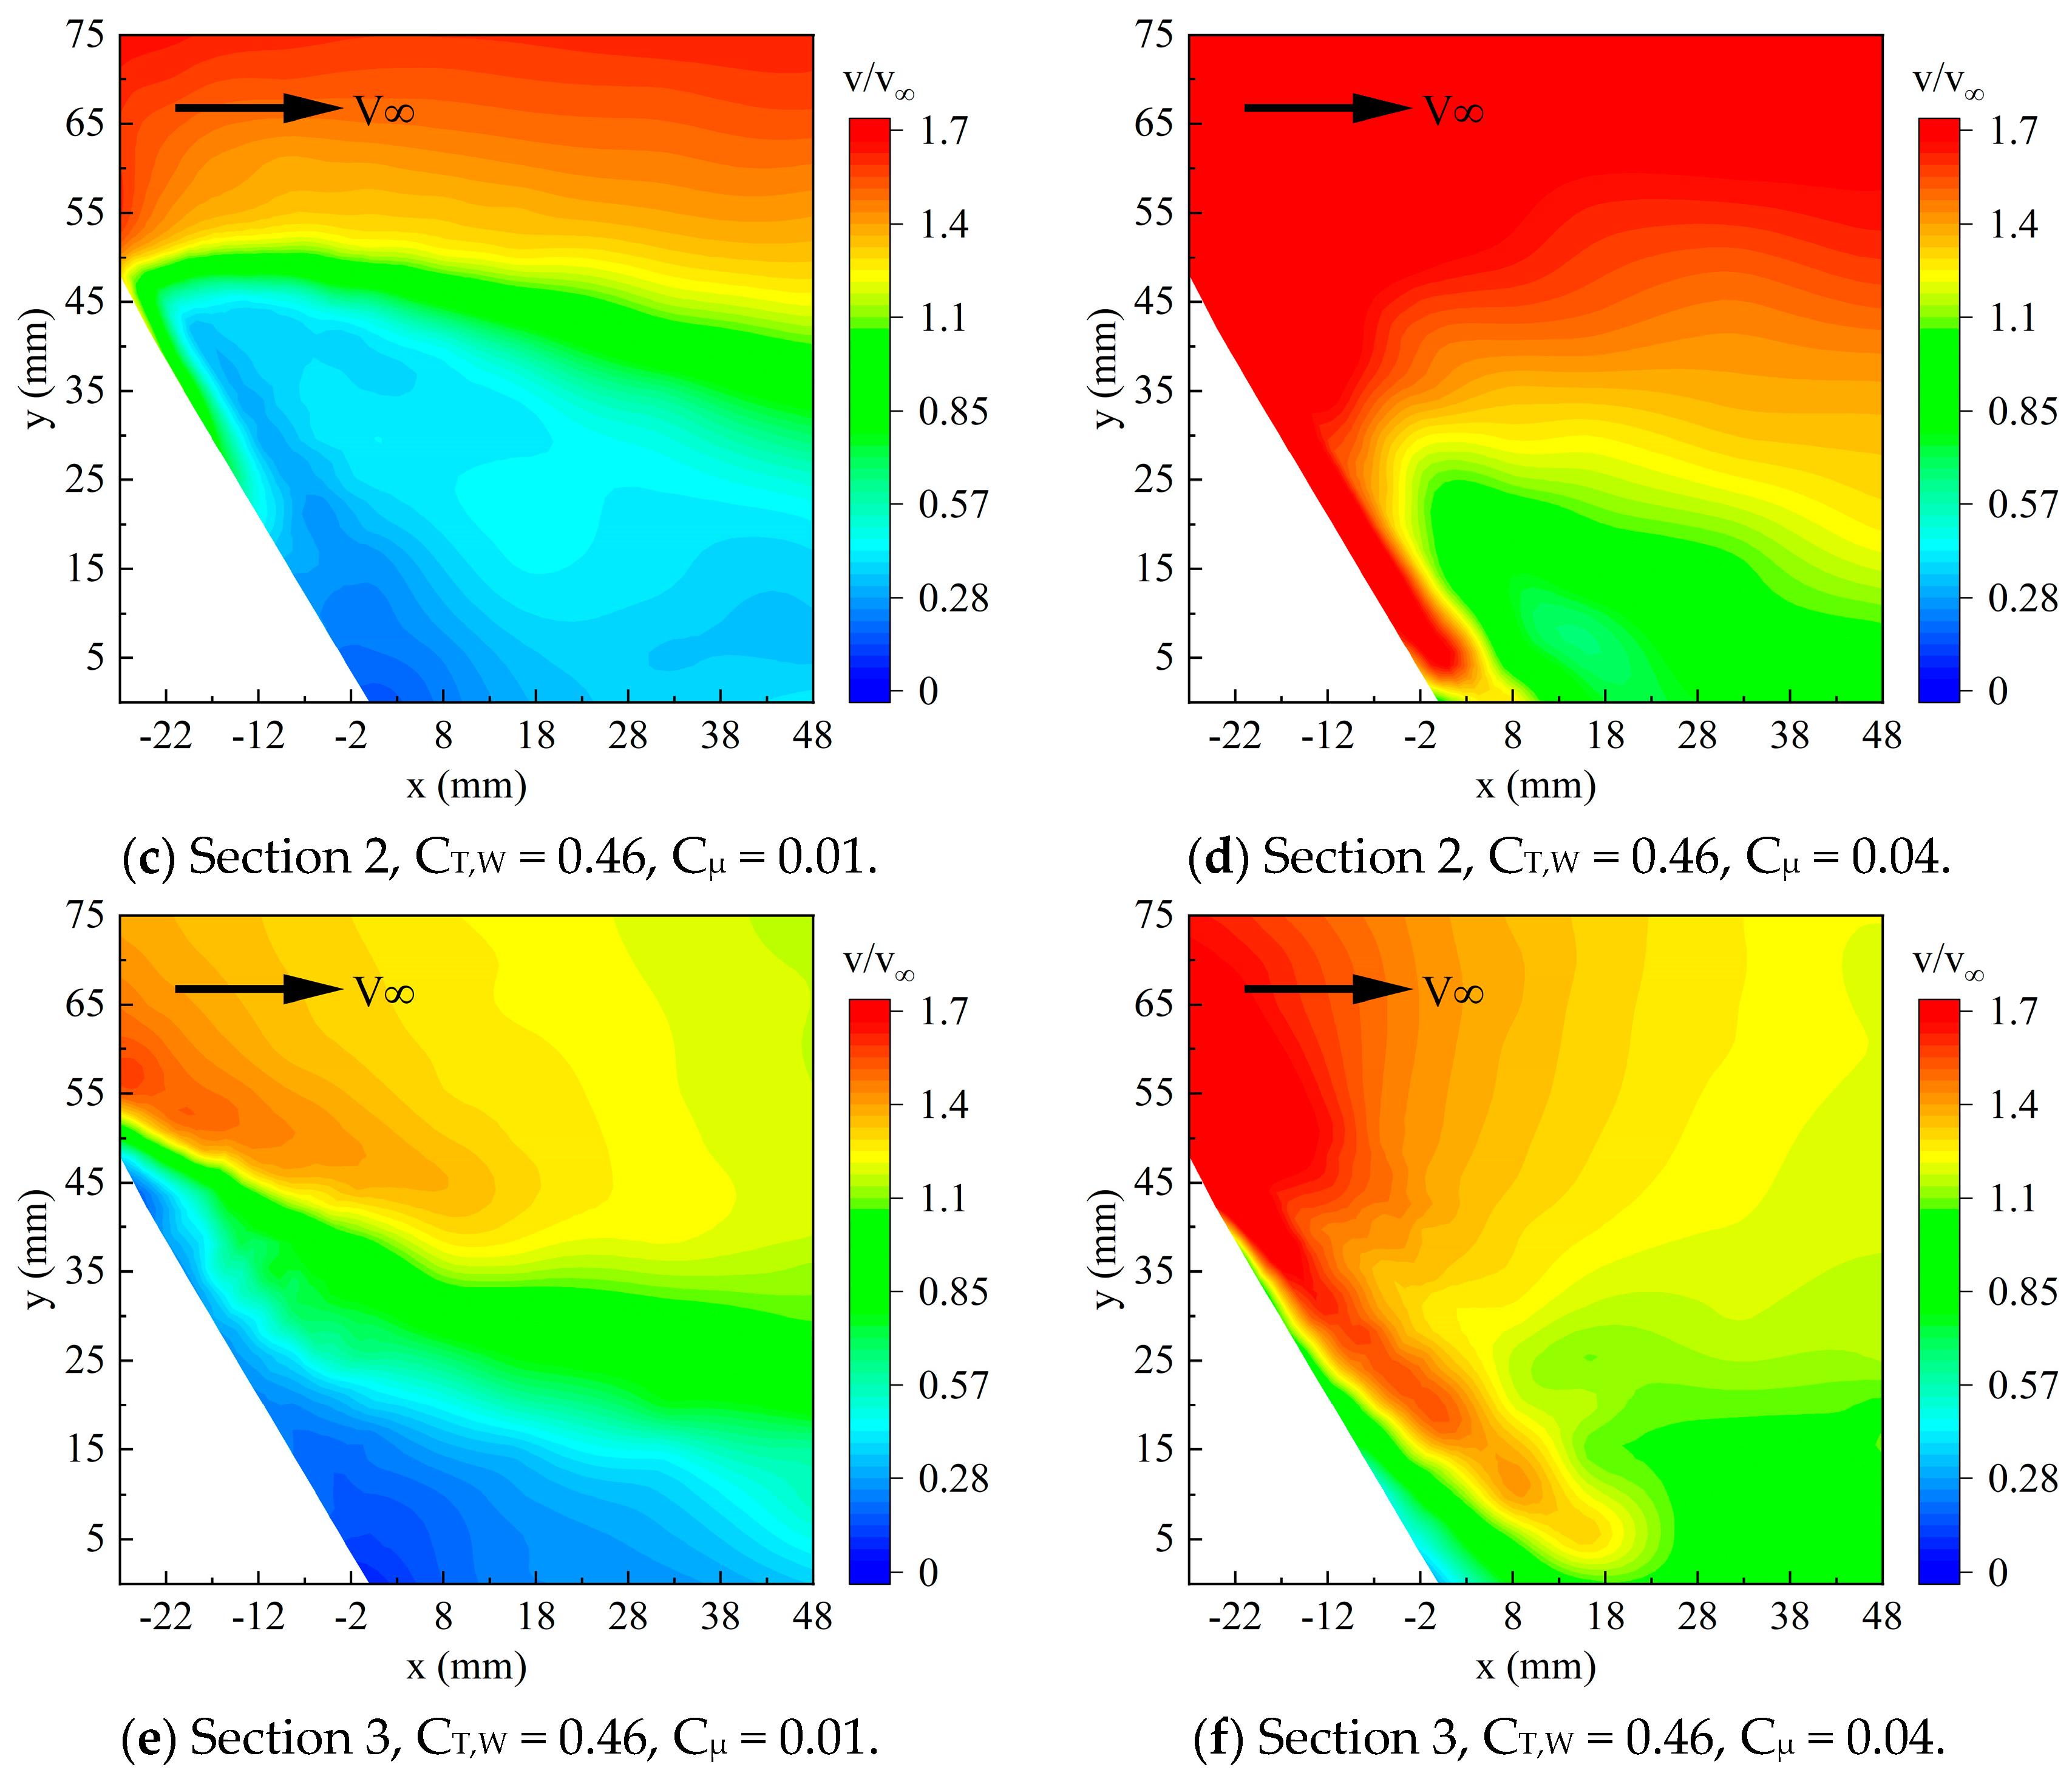
Figure 14 shows the flow field at
Section 1 of the downwash-side flap under different momentum coefficients, with thrust coefficients of 0.13 and 0.46. When the momentum coefficient is 0.01, compared to the no-jet control condition in
Figure 12, part of the flap separation is eliminated, and the flow speed in the low-speed region is improved to some extent. When the momentum coefficient reaches 0.04, separation at the flap is completely controlled. When comparing the same momentum coefficient, a higher thrust coefficient results in a larger dynamic pressure in the mainstream region, leading to better control effects and therefore a higher lift enhancement. The slipstream effect reduces the effective angle of attack on the downwash side, which results in a slight reduction in lift. However, the propeller’s acceleration effect increases the lift, ultimately leading to a significant increase in the lift on the downwash side.
The flow field at
Section 3 on the upwash-side flap is shown in
Figure 15. At low momentum coefficients,
Section 3 demonstrates a significant control effect. When the momentum coefficient reaches 0.04, flap separation is completely eliminated. The upwash airflow from the propeller provides additional flow acceleration in the flap region, increasing the flow speed near the flap surface. This enhancement increases the lift effect on the flap, effectively reducing the risk of flow separation and improving the airflow stability in the flap region.
As shown in
Figure 16, the flow field at
Section 2, which is directly in front of the propeller, is depicted after the increase in jet momentum. It is evident that the improvement in the flow field at the propeller’s directly aligned position with increasing momentum coefficients is less pronounced than at the upwash and downwash sides. Compared to the case without jet flow control, when the momentum coefficient reaches 0.01, the separation region and mainstream flow speed show slight improvement, and the shear layer moves downward. When the jet momentum increases to 0.04, a clear reduction in separation can be observed in the flow field. However, unlike
Section 1 and
Section 3, it is observed that while the jet flow attaches to the flap, a low-speed region appears between the jet and mainstream flow, resulting in spatial separation. This indicates that to completely eliminate separation, more jet momentum is required than at
Section 1 and
Section 3. The reason for this can be analyzed: at low jet momentum, the jet flow accelerates the surrounding air, “attracting” the mainstream flow towards the flap. This phenomenon causes an increase in the mainstream flow speed, essentially attracting higher-positioned airflow to attach to the flap. When the jet momentum coefficient is increased to 0.04, due to the difference in kinetic energy between the jet and mainstream flow, as well as the differing jet angle and mainstream direction, vortices or turbulence are generated by the jet flow. This mixing process leads to the formation of a localized low-speed region between the jet flow and incoming flow.
3.3. Control Effect of Local Momentum Change Under Slipstream Effect
Under the influence of the propeller slipstream effect, the slipstream velocity along the spanwise direction of the wing is not uniform. The wing surface at the propeller’s directly aligned position experiences much stronger slipstream intensity than at the wing tips. As discussed earlier, the flow field indicates that for an actuator with a uniformly distributed spanwise jet, the flow separation at the flap directly in front of the propeller is more severe than on the sides. Higher jet momentum is needed to completely eliminate flap separation in this region. Actuator A has a uniformly distributed spanwise jet with consistent momentum distribution. Based on actuator A, without changing the slot height, the local jet slot area of the actuator can be reduced by adding a blockage. This modification aims to adjust the local jet momentum coefficient by decreasing the area of the jet slot, allowing for better control of the flow characteristics and potentially improving the overall jet control effectiveness in certain regions.
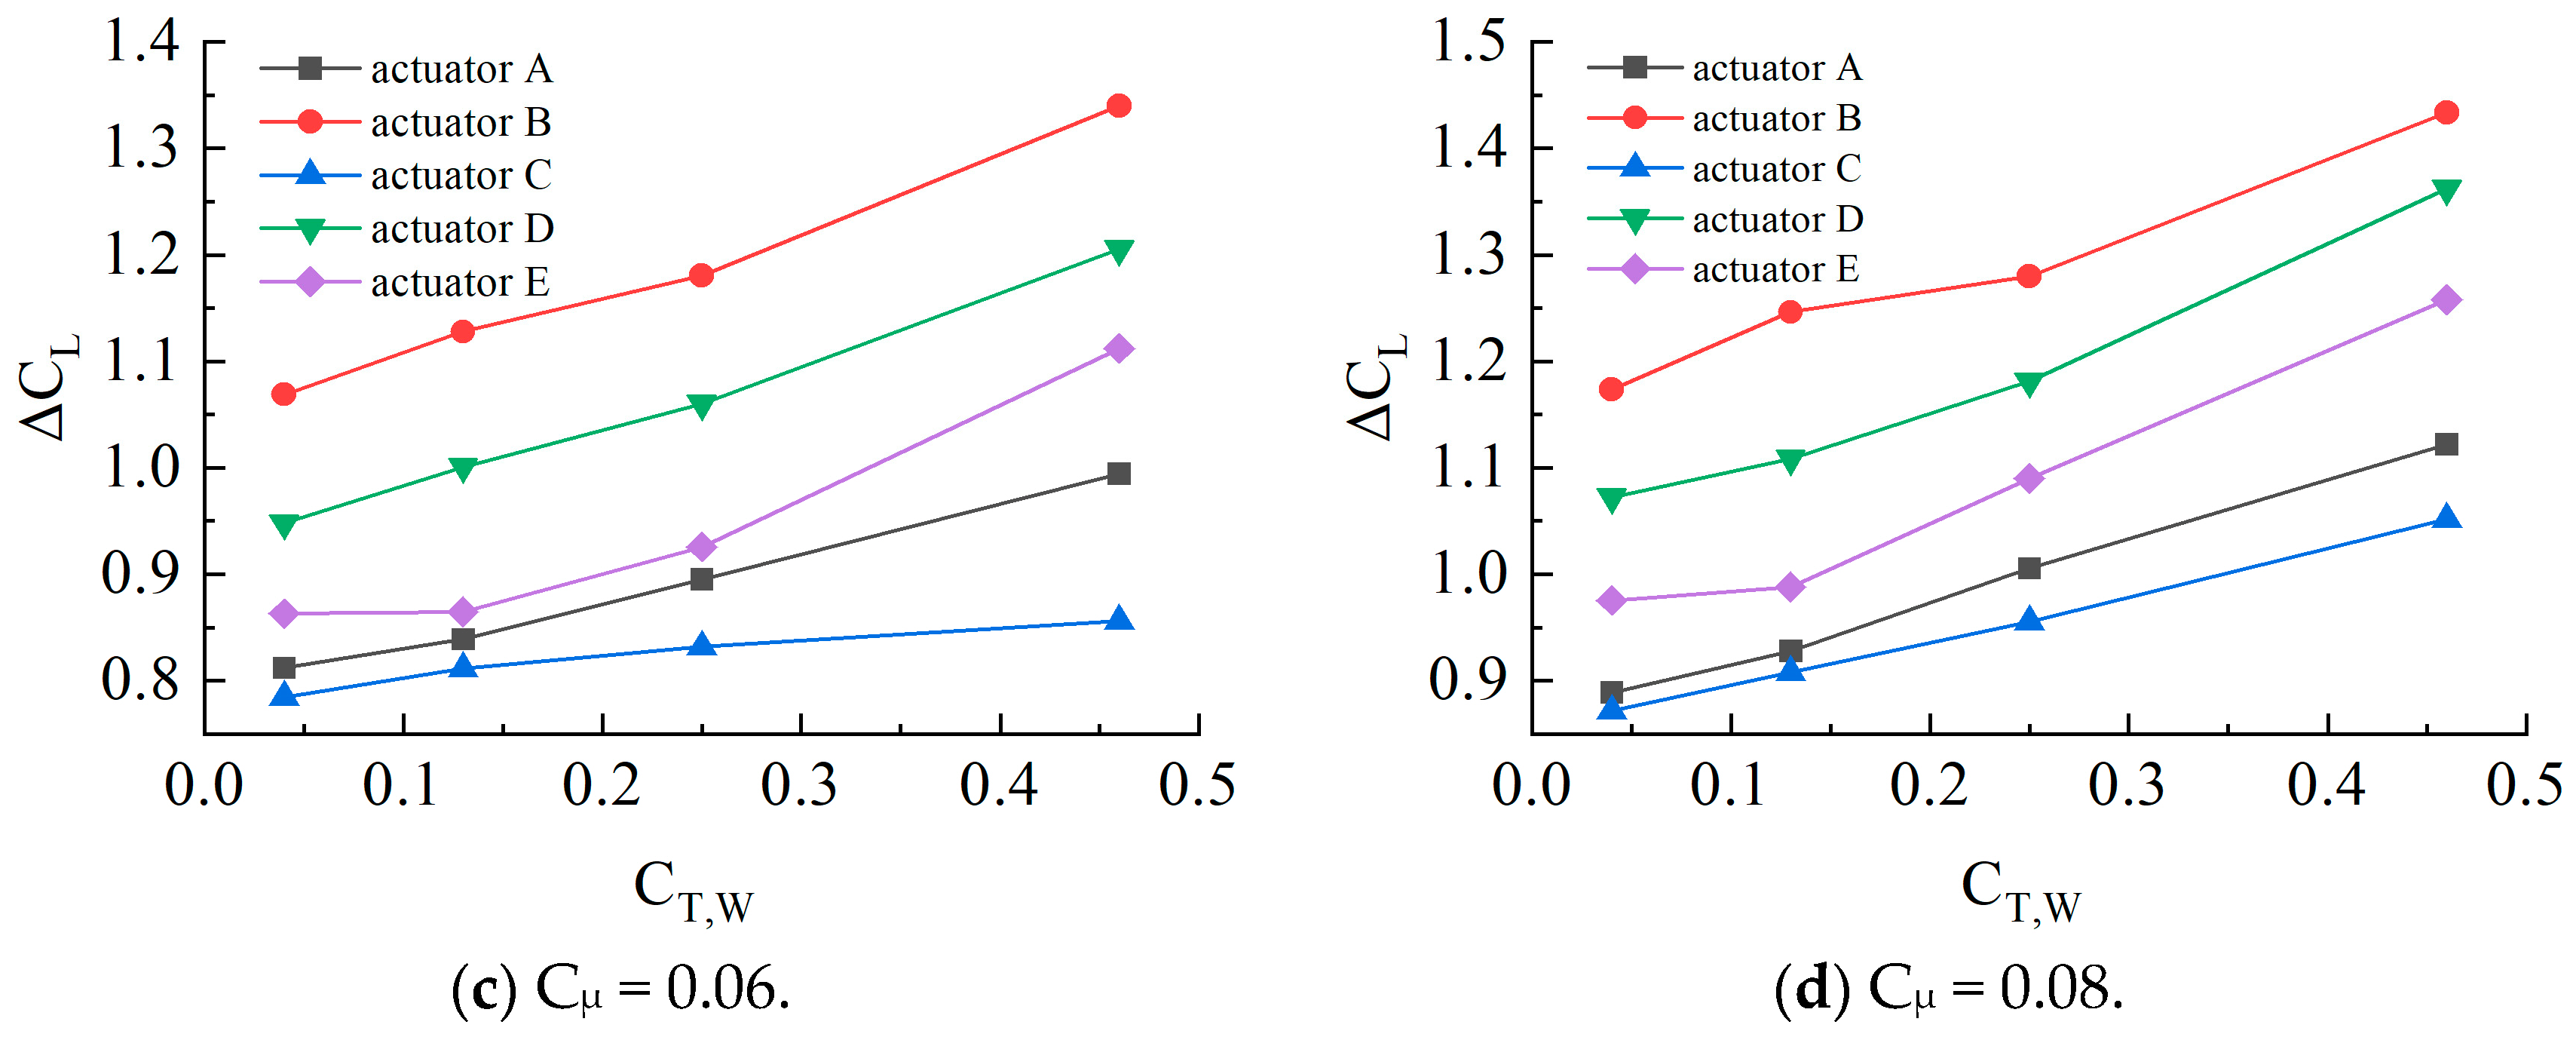
Figure 17 shows the curves of the lift coefficient variation with the momentum coefficient for different actuators. As the momentum coefficient and thrust coefficient change, actuator B (with the jet slot area at the propeller’s directly aligned position being 1.5 times that of the sides) consistently demonstrates the best lift enhancement capability. The next most effective actuators are D (with the downwash-side jet slot area being 1.5 times that of the upwash side) and E (with the upwash-side jet slot area being 1.5 times that of the downwash side). Since the upwash and downwash sides are distinguished by the propeller centerline, this results in each side having half of the jet slots located at the propeller’s directly aligned position. Actuators D and E increase the momentum coefficient at the propeller’s directly aligned position, leading to better performance compared to actuators A and C (where the jet slot area at the sides is 1.5 times that of the propeller’s directly aligned position). When the thrust coefficient is 0.13, 0.25, and 0.46, actuator B improves the lift effect by 35.5%, 41.3%, and 52.6%, respectively, compared to actuator A. This indicates that as the thrust coefficient increases, the control effect of actuator B becomes more significant. Due to the slipstream direction being biased towards the downwash side, actuator D shows better control performance than actuator E when the slipstream effect strengthens. Additionally, actuator C, which distributes more momentum to the sides, consistently shows the poorest control performance.
Figure 18 shows the lift augmentation coefficient curves under different thrust coefficients at the same momentum coefficient. It can be observed that as the thrust coefficient increases, the lift augmentation coefficient also increases, indicating that the enhancement of slipstream effects can improve the lift of the airfoil. Actuator B consistently exhibits the highest lift augmentation coefficient, reflecting the rationality of allocating more momentum at the position directly opposite the propeller.
From the performance of these five different actuators, we can conclude that for wings affected by the propeller slipstream effect, setting a localized high momentum coefficient at the propeller’s directly aligned position can effectively improve the lift enhancement effect while also requiring less overall jet flow.
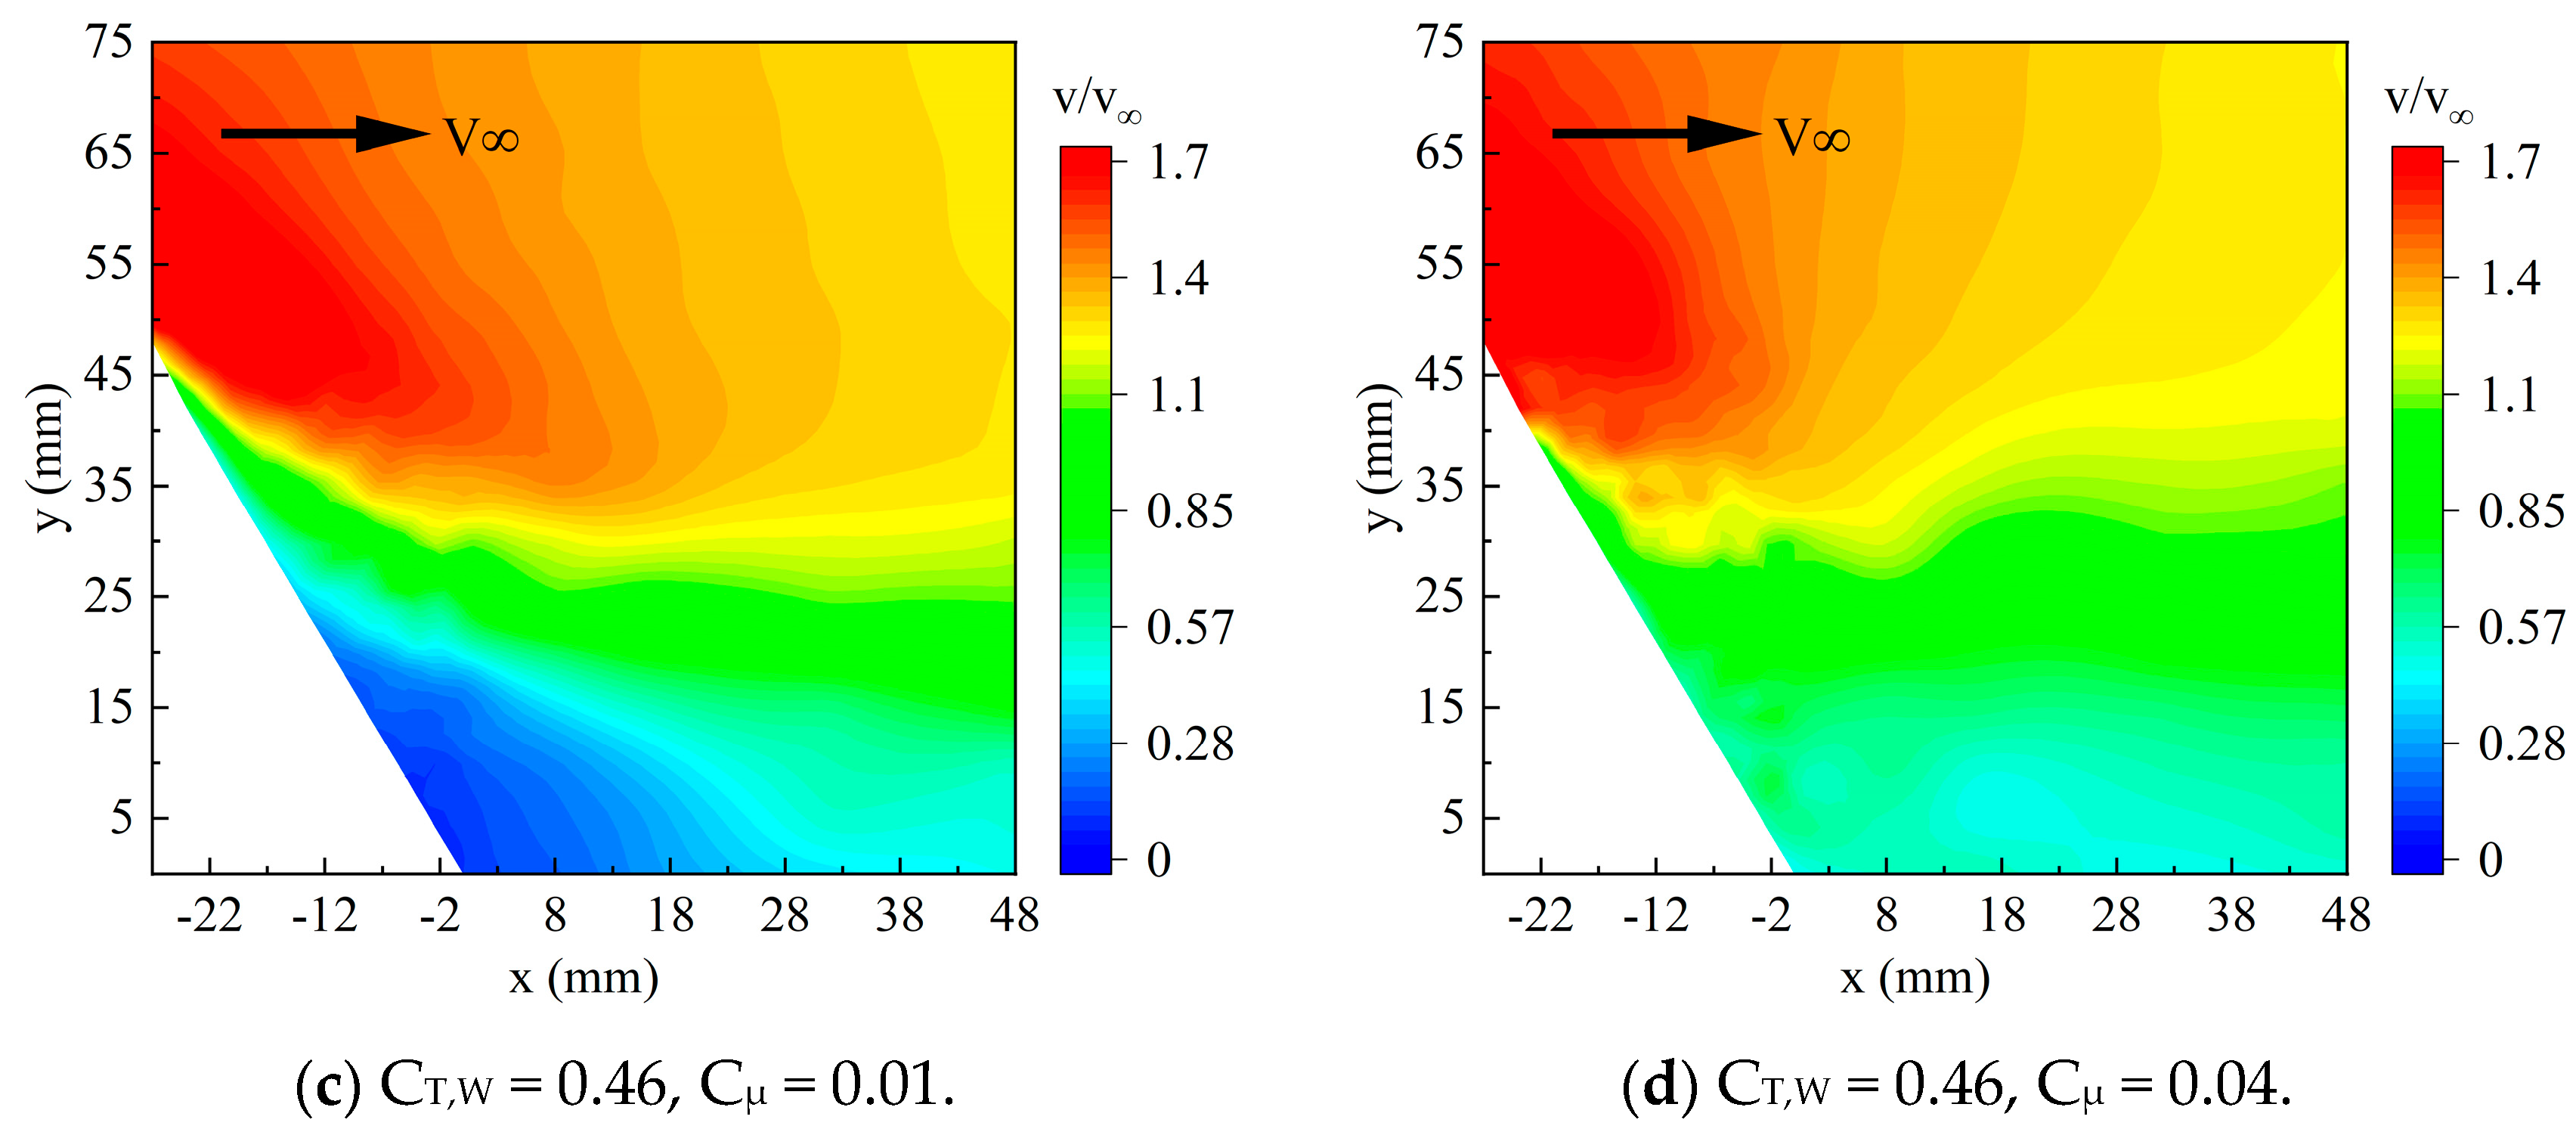
Figure 19 shows the flow field at the flap’s
Section 2 for actuator B with a thrust coefficient of 0.46. From the flow field, we can clearly observe the jet control effect of actuator B at
Section 2 of the flap. Comparing with
Figure 16c,d, when the jet momentum coefficient is 0.01, actuator B not only reduces the separation region compared to actuator A but also increases the speed in the mainstream region. When the jet momentum coefficient increases to 0.04, actuator B nearly completely controls the separation at
Section 2 of the flap, while actuator A still shows a noticeable separation region. When the jet momentum coefficient is increased to 0.06, actuator A nearly completely controls the separation at
Section 2, but visually, the control effect is still not as effective as that of actuator B at a momentum coefficient of 0.04. When comparing the flow fields at the upwash and downwash sides for actuator A and actuator B with a jet momentum coefficient of 0.04, we can see that separation at the flap is effectively controlled in both cases. To maintain a consistent overall jet momentum coefficient, actuator B essentially increases the jet momentum coefficient at the propeller’s directly aligned position while reducing the jet momentum coefficients at the sides. In fact, the slipstream velocity at the sides is lower than at the center, and the influence of the propeller blades and the short nacelle on the incoming flow is also less. Therefore, smaller jet momentum compared to the center position is sufficient to completely control flap separation. This is why actuator B can effectively control separation at the propeller’s directly aligned position while also achieving good control over the separation regions at both sides of the flap.
4. Discussion
This paper investigates the influence of the coupling effects of propeller slipstream and jet flow on airfoil lift. While early studies separately explored the effects of propeller slipstream and jet flow on airfoil lift, they did not explicitly discuss the impact of different jet flow distribution methods on airfoil lift under the influence of propeller slipstream.
We found that while the slipstream effect can enhance airfoil lift, it makes it more difficult for airflow to adhere to the flap regions strongly influenced by the slipstream. Typically, the area directly opposite the propeller is most affected by the slipstream, and the presence of the propeller nacelle leads to the generation of nacelle vortices, making the flow field in this flap region more complex. Flap jet technology can effectively eliminate flap separation. In previous studies, a spanwise uniform jet design method was commonly used. However, this is clearly unsuitable for propeller airfoils, as the flap regions with stronger slipstream effects require more momentum input to completely eliminate flap separation. Our experimental study validated the feasibility of momentum distribution. By allocating the jet momentum from both sides to the jet at the position directly opposite the propeller, we achieved the elimination of global flap separation and realized efficient lift enhancement.
The research results of this paper can provide technical references for aircraft design, especially for short takeoff and landing (STOL) and vertical takeoff and landing (VTOL) aircraft. However, there are certain limitations. Firstly, this study focuses on specific operating conditions with high flap deflection angles and lacks research on freestream velocity and angle of attack variations. Secondly, this paper emphasizes experimental research and lacks mutual validation with numerical simulations. These issues will be further addressed in the next steps of our work. In practical applications, the design of jet momentum distribution increases the complexity of engineering design. Achieving precise momentum distribution inevitably involves challenges related to the installation space of actuators and the distribution of air ducts. Further research is needed to explore how to design compact distribution pipelines and actuators.
5. Conclusions
The lift coefficient and flap flow field analyses were conducted for actuators with different momentum distribution methods under varying jet momentum coefficients. Under the condition of natural incoming flow, the coupling effect of propeller slipstream and jet flow on wing lift was studied. By optimizing the jet flow distribution, the lift enhancement effect under slipstream was significantly improved. When the thrust coefficient was 0.46 and the momentum coefficient was 0.1, the lift increase was 52.6% higher compared to the spanwise uniform jet flow distribution while saving approximately 9% of the jet flow rate. This provides a more comprehensive design approach for future research and applications. The following conclusions were drawn.
The propeller nacelle and blades introduce disturbances to the natural incoming flow, generating vortices on the sides of the nacelle. These vortices, known as nacelle vortices, influence the airflow at the center of the wing, particularly at the propeller’s directly aligned position. As a result, the airflow in this region is more disrupted compared to the airflow on the sides of the wing, making the flow at the flap more susceptible to separation.
An increase in the thrust coefficient accelerates the airflow, which helps increase the local angle of attack, thereby improving the overall lift coefficient. After implementing jet flow control, the wing’s lift coefficient increases further, and the lift coefficient rises as the jet momentum coefficient increases. The slipstream has a significant impact on the effectiveness of jet flow control. In the high-speed region of the slipstream, more jet momentum is required to completely eliminate flap separation compared to the low-speed region, but this also results in a higher lift coefficient.
Since the slipstream velocity is strongest at the propeller-aligned position, increasing the jet momentum at the center position results in a much greater lift coefficient improvement compared to the wing’s sides. For jet flow control lift enhancement designs for wings with propellers, the focus should be on increasing the jet momentum at the propeller-aligned position, followed by the downwash side.


