Article

Designing an Urban Air Mobility Corridor Network: A Multi-Objective Optimization Approach Using U-NSGA-III

1
College of Air Traffic Management, Civil Aviation Flight University of China, Guanghan 618307, China
2
School of Computer Science, Civil Aviation Flight University of China, Guanghan 618307, China
3
Flight Technology College, Civil Aviation Flight University of China, Guanghan 618307, China
*
Author to whom correspondence should be addressed.
Aerospace 2025, 12(3), 229; https://doi.org/10.3390/aerospace12030229
Submission received: 14 January 2025 / Revised: 12 February 2025 / Accepted: 27 February 2025 / Published: 12 March 2025
(This article belongs to the Special Issue Future Airspace and Air Traffic Management Design)

Abstract

:
The corridor network serves as an effective solution for the airspace structure safety design of UAM. However, current studies rarely account for the ground risk posed by the corridor operation and typically consider a single design objective with limited variables. In this paper, we address these gaps by considering three key factors: demand, safety, and implementation costs. The corridor network design is formulated as a multi-objective optimization problem. In practice, firstly, we define the travel time-saving rate, average population density, and total length of corridors as optimization objectives. Then, we propose a straightforward and efficient corridor network encoding scheme that supports a variable number of corridors, significantly enhancing the diversity and flexibility of corridor network designs. Finally, based on this encoding scheme, we solve the corridor network problem using the unified non-dominated sorting genetic algorithm III (U-NSGA-III). Based on a detailed analysis of the obtained Pareto front, a relatively optimal design scheme across three optimization objectives is determined. The case study conducted in Chengdu illustrates that the corridor network obtained by our method not only achieves a 37.8% reduction in ground risk and a 69.9% decrease in implementation costs, but also saves a comparable 4.7% in time relative to traditional methods.

1. Introduction

Long-distance commuting poses a major challenge for megacities, with traffic congestion and prolonged travel times severely impacting quality of life and work productivity. According to a 2024 report by the China Academy of Urban Planning and Design [1], 42% of commuters in Beijing spent over 45 min on a single trip, while 28% exceeded 60 min. The average one-way commute took 46 min, with an average speed of only 15.13 km/h. Improving the efficiency of long-distance transportation is critical for urban transport planning. Technological advancements in air mobility offer a promising pathway for developing three-dimensional urban transportation to enhance travel efficiency [2,3,4,5]. In 2016, Uber Elevate published a white paper on urban air mobility (UAM) and urban air taxis [6]. Since then, leading organizations such as NASA [7], FAA [8,9], and SESAR [10] have introduced operational concepts for UAM, aiming to provide urban residents with safe, efficient, and convenient air transportation.
The development of UAM faces numerous challenges, among which the design of its initial operational environment (i.e., the corridor network) is considered a critical issue to be addressed as a priority. A corridor serves as an integral part of the corridor network, offering segregated airspace along predefined flight routes. A corridor network, comprising interconnected corridors and nodes, enables passengers to embark from any node and fly through the corridors to reach the node that is near their desired destination. Figure 1 illustrates a corridor network, highlighted in yellow, connecting diverse areas of the city. These include high-risk, high-demand zones such as densely populated urban centers, as well as low-risk, low-demand areas like peripheral urban districts.
The current methods for designing UAM corridor networks can be categorized into the following perspectives: (1) Simple geometric partitioning-based methods: To ensure the safety of traditional air transportation, UAM operations are prohibited from entering aerodrome airspace or being close to approach and departure routes. Using Dallas as a case study, NASA [11] partitioned low-altitude urban airspace into UAM-accessible and restricted areas, factoring in aerodrome airspace and historical track data of approach and departure routes. The UAM-accessible airspace was then designated as the UAM corridor network. Simple geometric partitioning-based methods are easy to implement but exhibit limited flexibility and scalability. (2) Node-based methods: Designing corridor networks often begins with determining node locations, turning the task into an optimization problem. Zhao et al. [12] employed clustering methods to group taxi and metro demand points of origin and destination in Beijing’s urban areas, ensuring that corridor nodes effectively covered travel demand. Jin et al. [13] addressed the facility location problem under a budget uncertainty set, considering uncertain user demands. They formulated a robust optimization model and solved it using mixed-integer linear programming (MILP). Kitthamkesorn et al. [14] modeled network design as a multiple allocation incomplete p-hub location problem and utilized MILP to develop three design strategies: maximizing revenue, maximizing profit, and maximizing profit with dynamic pricing. Node-based methods allow for a formal representation of corridor networks and facilitate the use of various mature optimization methods, ensuring high flexibility and scalability. (3) Complex network-based methods: Complex network theory proves highly applicable to corridor networks, which are constrained by implementation costs and flow capacity. Wei et al. [15] proposed a bi-level optimization framework using MILP to maximize the expected throughput of the network under budgetary constraints and cost–benefit trade-offs. Their model also considered risk margins and provided alternative node designs to enhance resilience. Complex network-based methods primarily concentrate on the key structural features of the network, paying little attention to the spatial locations of nodes and corridors. (4) Pre-defined path-based methods: Corridors encompass pre-defined flight paths, making corridor network design a path-planning problem. Barsotti et al. [16] integrated ecological and social considerations, including traffic noise, household income distribution, elderly population density, and bus stop locations, into their model. They developed a weighted cost map of these factors and applied the A-star algorithm to identify optimal low-cost paths. Pre-defined path-based methods provide substantial flexibility but involve high optimization complexity and computational costs.
This study employs a node-based method and aims to overcome the following shortcomings of previous node-based methods. First, previous research studies failed to adequately consider the risks that flights within corridors might pose to public safety on the ground. Second, current approaches typically optimize for a single objective, such as cost, coverage, or throughput. In practice, however, corridor network design requires a multi-objective optimization framework that integrates various constraints to produce a balanced and comprehensive solution.
Therefore, this paper proposes a multi-objective optimization framework for UAM corridor network design, addressing three critical objectives: travel time efficiency, ground risk, and implementation cost. The primary contributions are as follows:
  • Theoretical contribution: The UAM corridor network design problem is mathematically formulated as a multi-objective optimization framework, balancing travel time efficiency, ground risk, and implementation costs, while considering constraints such as available airspace. This framework presents a novel theoretical approach to UAM corridor network design, fostering the application of multi-objective optimization in this domain.
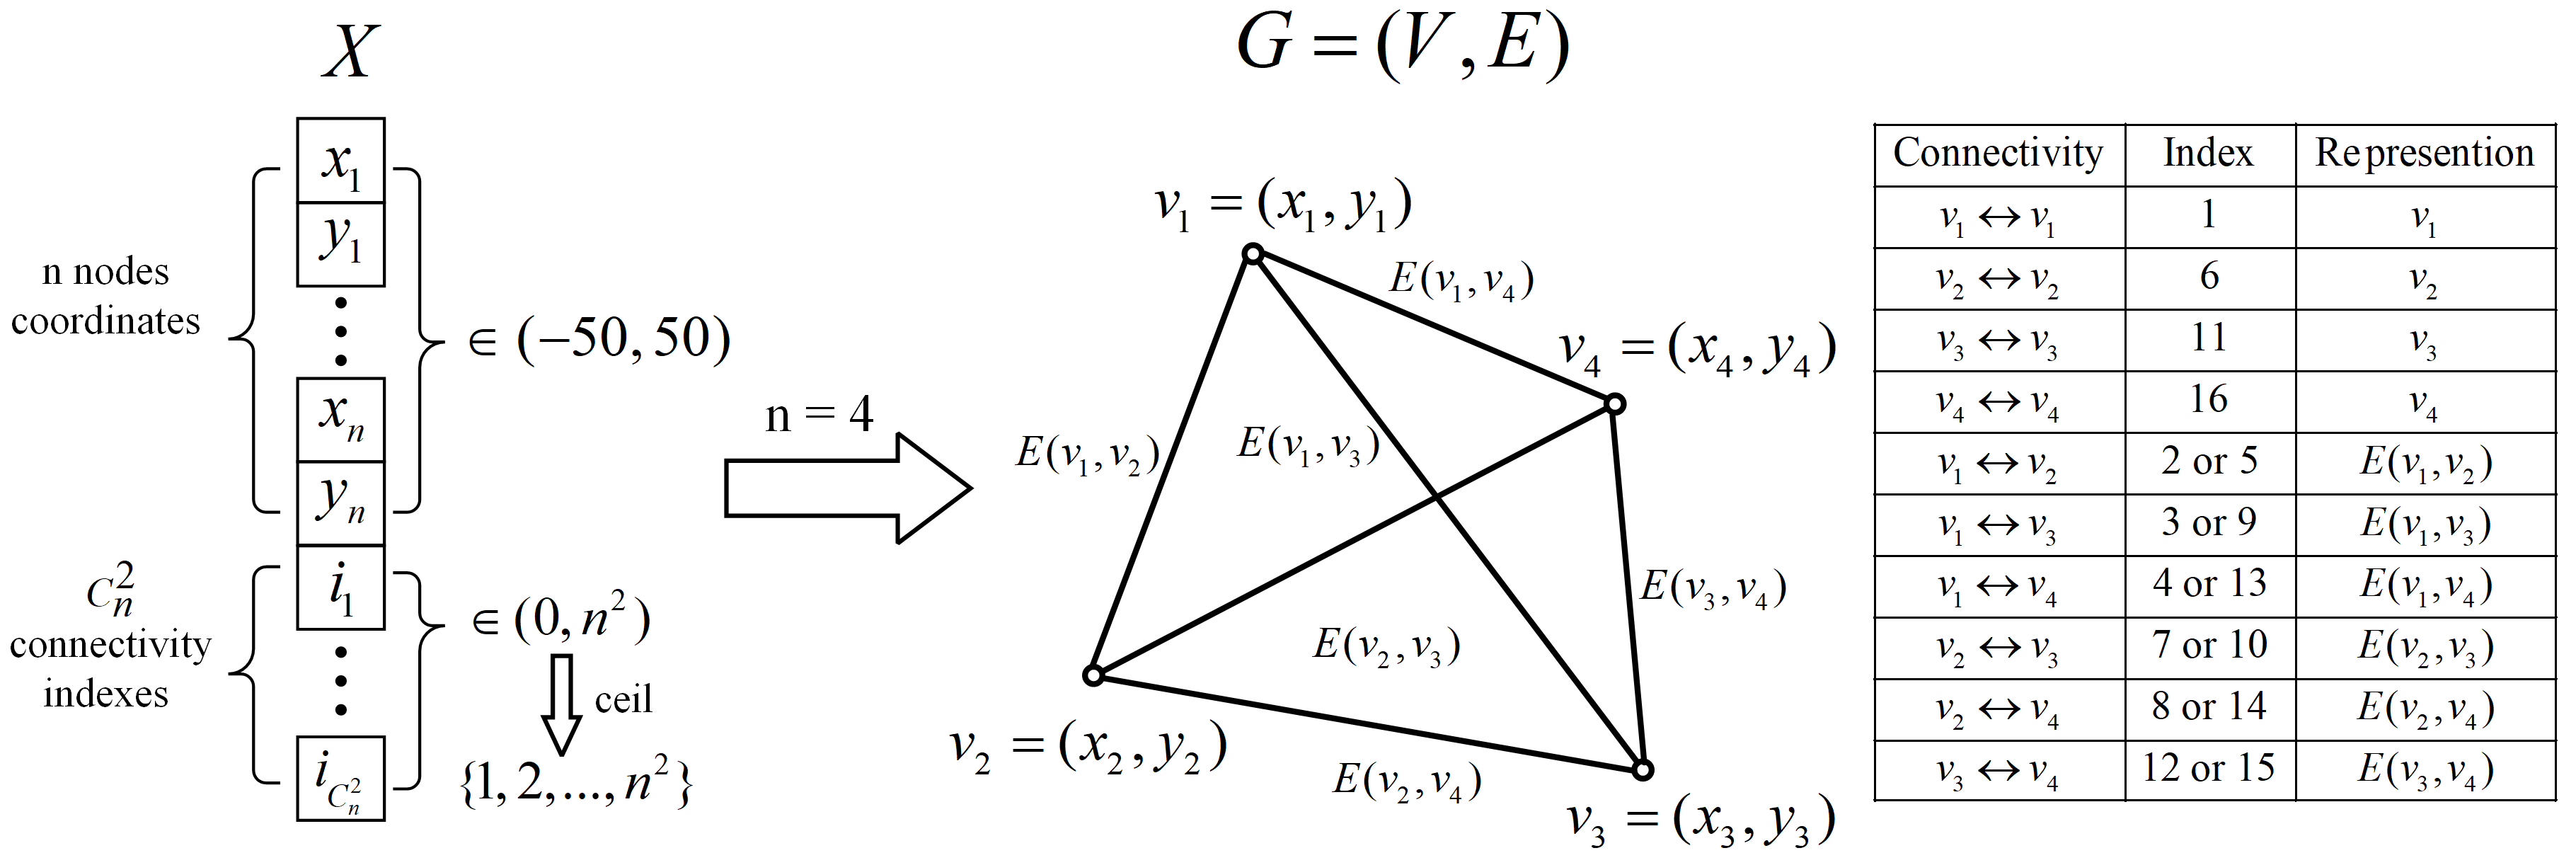
  • Method contribution: By combining node position vectors and edge connection vectors into a fixed-length encoding vector, the encoding scheme allows for the representation of UAM corridor networks with variable corridor counts, thereby significantly enhancing the diversity and flexibility of network designs. With the proposed encoding scheme, this study presents a UAM corridor network design approach based on the unified non-dominated sorting genetic algorithm III (U-NSGA-III).
  • Application contribution: This study demonstrates the application of the proposed UAM corridor network design method in a real-world case study in Chengdu. Beyond improving efficiency, our method achieves substantial reductions in risk and cost. The results demonstrate that, compared to the traditional method, our approach reduces ground risk by 37.8%, reduces implementation costs by 69.9%, and increases time savings by 4.7%. This result validates the effectiveness of the proposed method and showcases its substantial potential in real-world applications.
The remainder of this paper is organized as follows: Section 2 models the corridor network design problem as a multi-objective optimization problem. Section 3 elaborates on the corridor network design method utilizing U-NSGA-III. Section 4 illustrates its application through a case study based on Chengdu, and compares it with the traditional method. Section 5 discusses the results and outlines future work.

2. Problem Formulation

2.1. Multi-Objective Optimization Problem of Corridor Network Design

Travel time efficiency is a primary concern for passengers, whereas transportation systems prioritize operational safety and implementation costs. In UAM corridor network design, three critical performance metrics must be considered: travel time efficiency, corridor ground risk, and implementation cost [17]. Achieving these objectives simultaneously presents a substantial challenge, particularly in densely populated urban areas. Higher population density often corresponds to increased travel demand, but UAM operations over such areas significantly elevate ground risk. Additionally, improving travel efficiency typically requires expanding the number and length of corridors, which leads to a higher implementation cost.
Therefore, the UAM corridor network design is approached as a multi-objective optimization problem that seeks to maximize travel time efficiency, while minimizing ground risk and implementation costs. The general expression for this problem is given in Equation (1).
maximize F 1 = f 1 ( X ) , minimize F 2 = f 2 ( X ) , minimize F 3 = f 3 ( X ) , subject to G 1 = g 1 ( X ) 0 , . . . G n = g n ( X ) 0 .
where X denotes a corridor network encoding vector, which specifies the nodes and connectivity structure of the corridor network. F 1 denotes the evaluation metric for travel time efficiency, F 2 denotes the evaluation metric for ground risk, and F 3 denotes the evaluation metric for implementation costs. The constraints g 1 ( X ) , , g n ( X ) denote the n conditions that the corridor network must meet, accounting for geographical limitations, available airspace, and other related factors.
To enable a more formal and convenient representation of the corridor network in the subsequent problem formulation, it is modeled as an undirected graph G based on graph theory. The relationship between the corridor network encoding vector X and graph G can be expressed as follows:
X decode encode G = ( V , E )
where V represents the set of network nodes, and E denotes the set of network edges (i.e., corridors).

2.2. Optimal Objective Setting

For a specific corridor network design, the exact form of Equation (1) must first be defined. This paper set three critical performance metrics as optimization objectives for Equation (1), denoted as F 1 , F 2 , and F 3 . These metrics are described as follows.

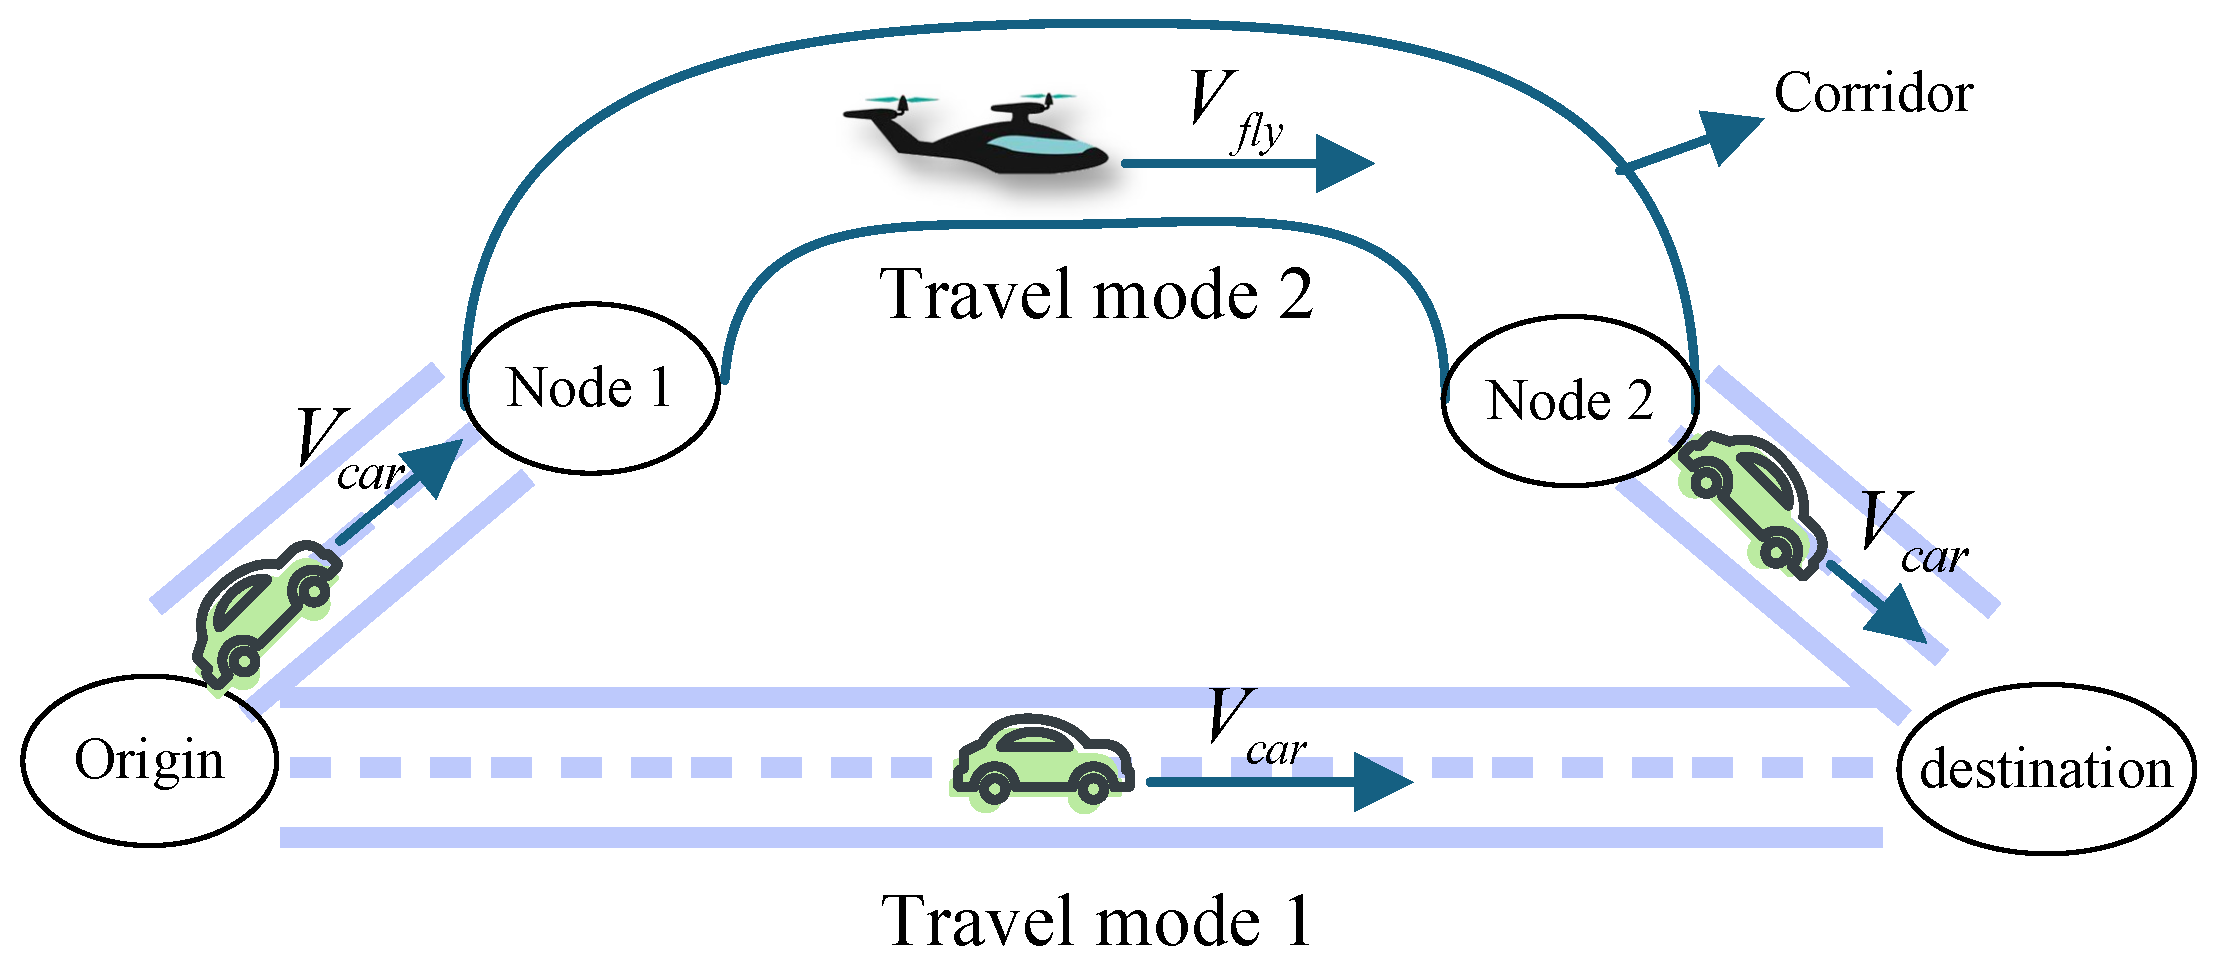
2.2.1. Travel Time-Saving Rate

This metric quantifies the time savings for long-distance urban mobility (e.g., >30 km) achieved through UAM corridor network travel, compared to conventional transportation modes such as ride-hailing services. It is defined as in Equation (3).
F 1 = f 1 ( X ) = T T ( X ) T
where T denotes the total travel time for all long-distance trips using traditional transportation modes, T ( X ) denotes the total time spent using the corridor network to fulfill the same travel demand.
UAM is primarily intended for long-distance on-demand urban travel, which is currently dominated by ride-hailing services and taxis. Therefore, this paper benchmarks the travel time of ride-hailing services to evaluate the time-saving effectiveness of the UAM corridor network for long-distance travel.
As depicted in the lower part of Figure 2, ride-hailing services are assumed to constitute travel mode 1, traveling at the average speed of long-distance ride-hailing services, V c a r . With the introduction of the corridor network X, it is assumed that passengers first travel to and from the nodes at a velocity V c a r , and then fly within the corridors at a velocity V f l y , as depicted in the upper part of Figure 2 for travel mode 2. Passengers can choose the path with the shortest travel time between travel mode 1 and travel mode 2. Accordingly, the time-saving rate F 1 for the corridor network X in Equation (3) is rewritten in Equation (4).
F 1 = f 1 ( X , D O D ) = T T ( X , D O D ) T
where D O D represents the travel demand for long-distance ride-hailing services, and T ( X , D O D ) represents the minimum total travel time for all trips in D O D with two travel modes.

2.2.2. Ground Risk

Ground risk pertains to the probability of aircraft crashes and the associated casualties. For a single aircraft, it is generally represented in the following form [18]:
R a = ρ p o p × A × P ( c a s u a l t y ) × P ( e v e n t )
where R a is the ground risk of an aircraft, A is the area of impact point, ρ p o p is the corresponding people density of the ground impact, P ( e v e n t ) is the probability of the aircraft crashing to the ground, and P ( c a s u a l t y ) is the fatality rate of the people impacted by the crashed aircraft.
In this study, A, P ( e v e n t ) , and P ( c a s u a l t y ) are treated as constant parameters. As a result, the ground risk associated with a single aircraft can be expressed as follows:
R a = K r × ρ p o p
where K r = A × P ( c a s u a l t y ) × P ( e v e n t ) is a constant parameter.
For a corridor network, where K a aircraft are assumed to be operating, the ground risk of the network can be formulated as follows:
R c = K a × R a = K a × K r × ρ p o p
where R c is the ground risk of a corridor network, K a is a constant parameter denoting the number of aircraft operating within the corridor network.
According to Equation (7), the ground risk of the corridor network is directly proportional to the population density in the regions potentially affected by aircraft crashes within the corridor network. Therefore, this study uses the average population density of the area covered by the corridor network as an optimization objective F 2 to represent the ground risk. Using the population density map, the average population density F 2 for the corridor network X in Equation (1) can be calculated as in Equation (8).
F 2 = f 2 ( X , M p o p ) = M e a n ( M p o p ( X ) )
where M e a n ( · ) denotes the averaging operation, and M p o p ( X ) refers to the population density map within the grid cells covered by the corridor network X.

2.2.3. Implementation Cost

The primary implementation costs of a corridor network involve the infrastructure needed for communication, navigation, and surveillance, such as 5G communication base stations, radar, and ground-based navigation augmentation systems. These infrastructure costs are proportional to the length of the corridor. Assuming a corridor width of 1 km and a length of several hundred kilometers [19], the infrastructure cost could reach several hundred million pounds. In contrast, the cost of constructing nodes (e.g., takeoff and landing sites) is in the millions of pounds and can be considered negligible [20].
Therefore, this paper assumes that the implementation costs of a corridor network are directly proportional to the total length of corridors, which can be expressed by the following equation:
C L = e E e 2
where C denotes the implementation costs of the corridor network, L denotes its total length of corridors, and |   ·   | 2 denotes the 2-norm (Euclidean length).
Therefore, this study uses the total length of corridors as an optimization objective, F 3 , to represent the implementation costs, as shown in Equation (10):
F 3 = f 3 ( X ) = e E e 2

2.3. Constraint Setting
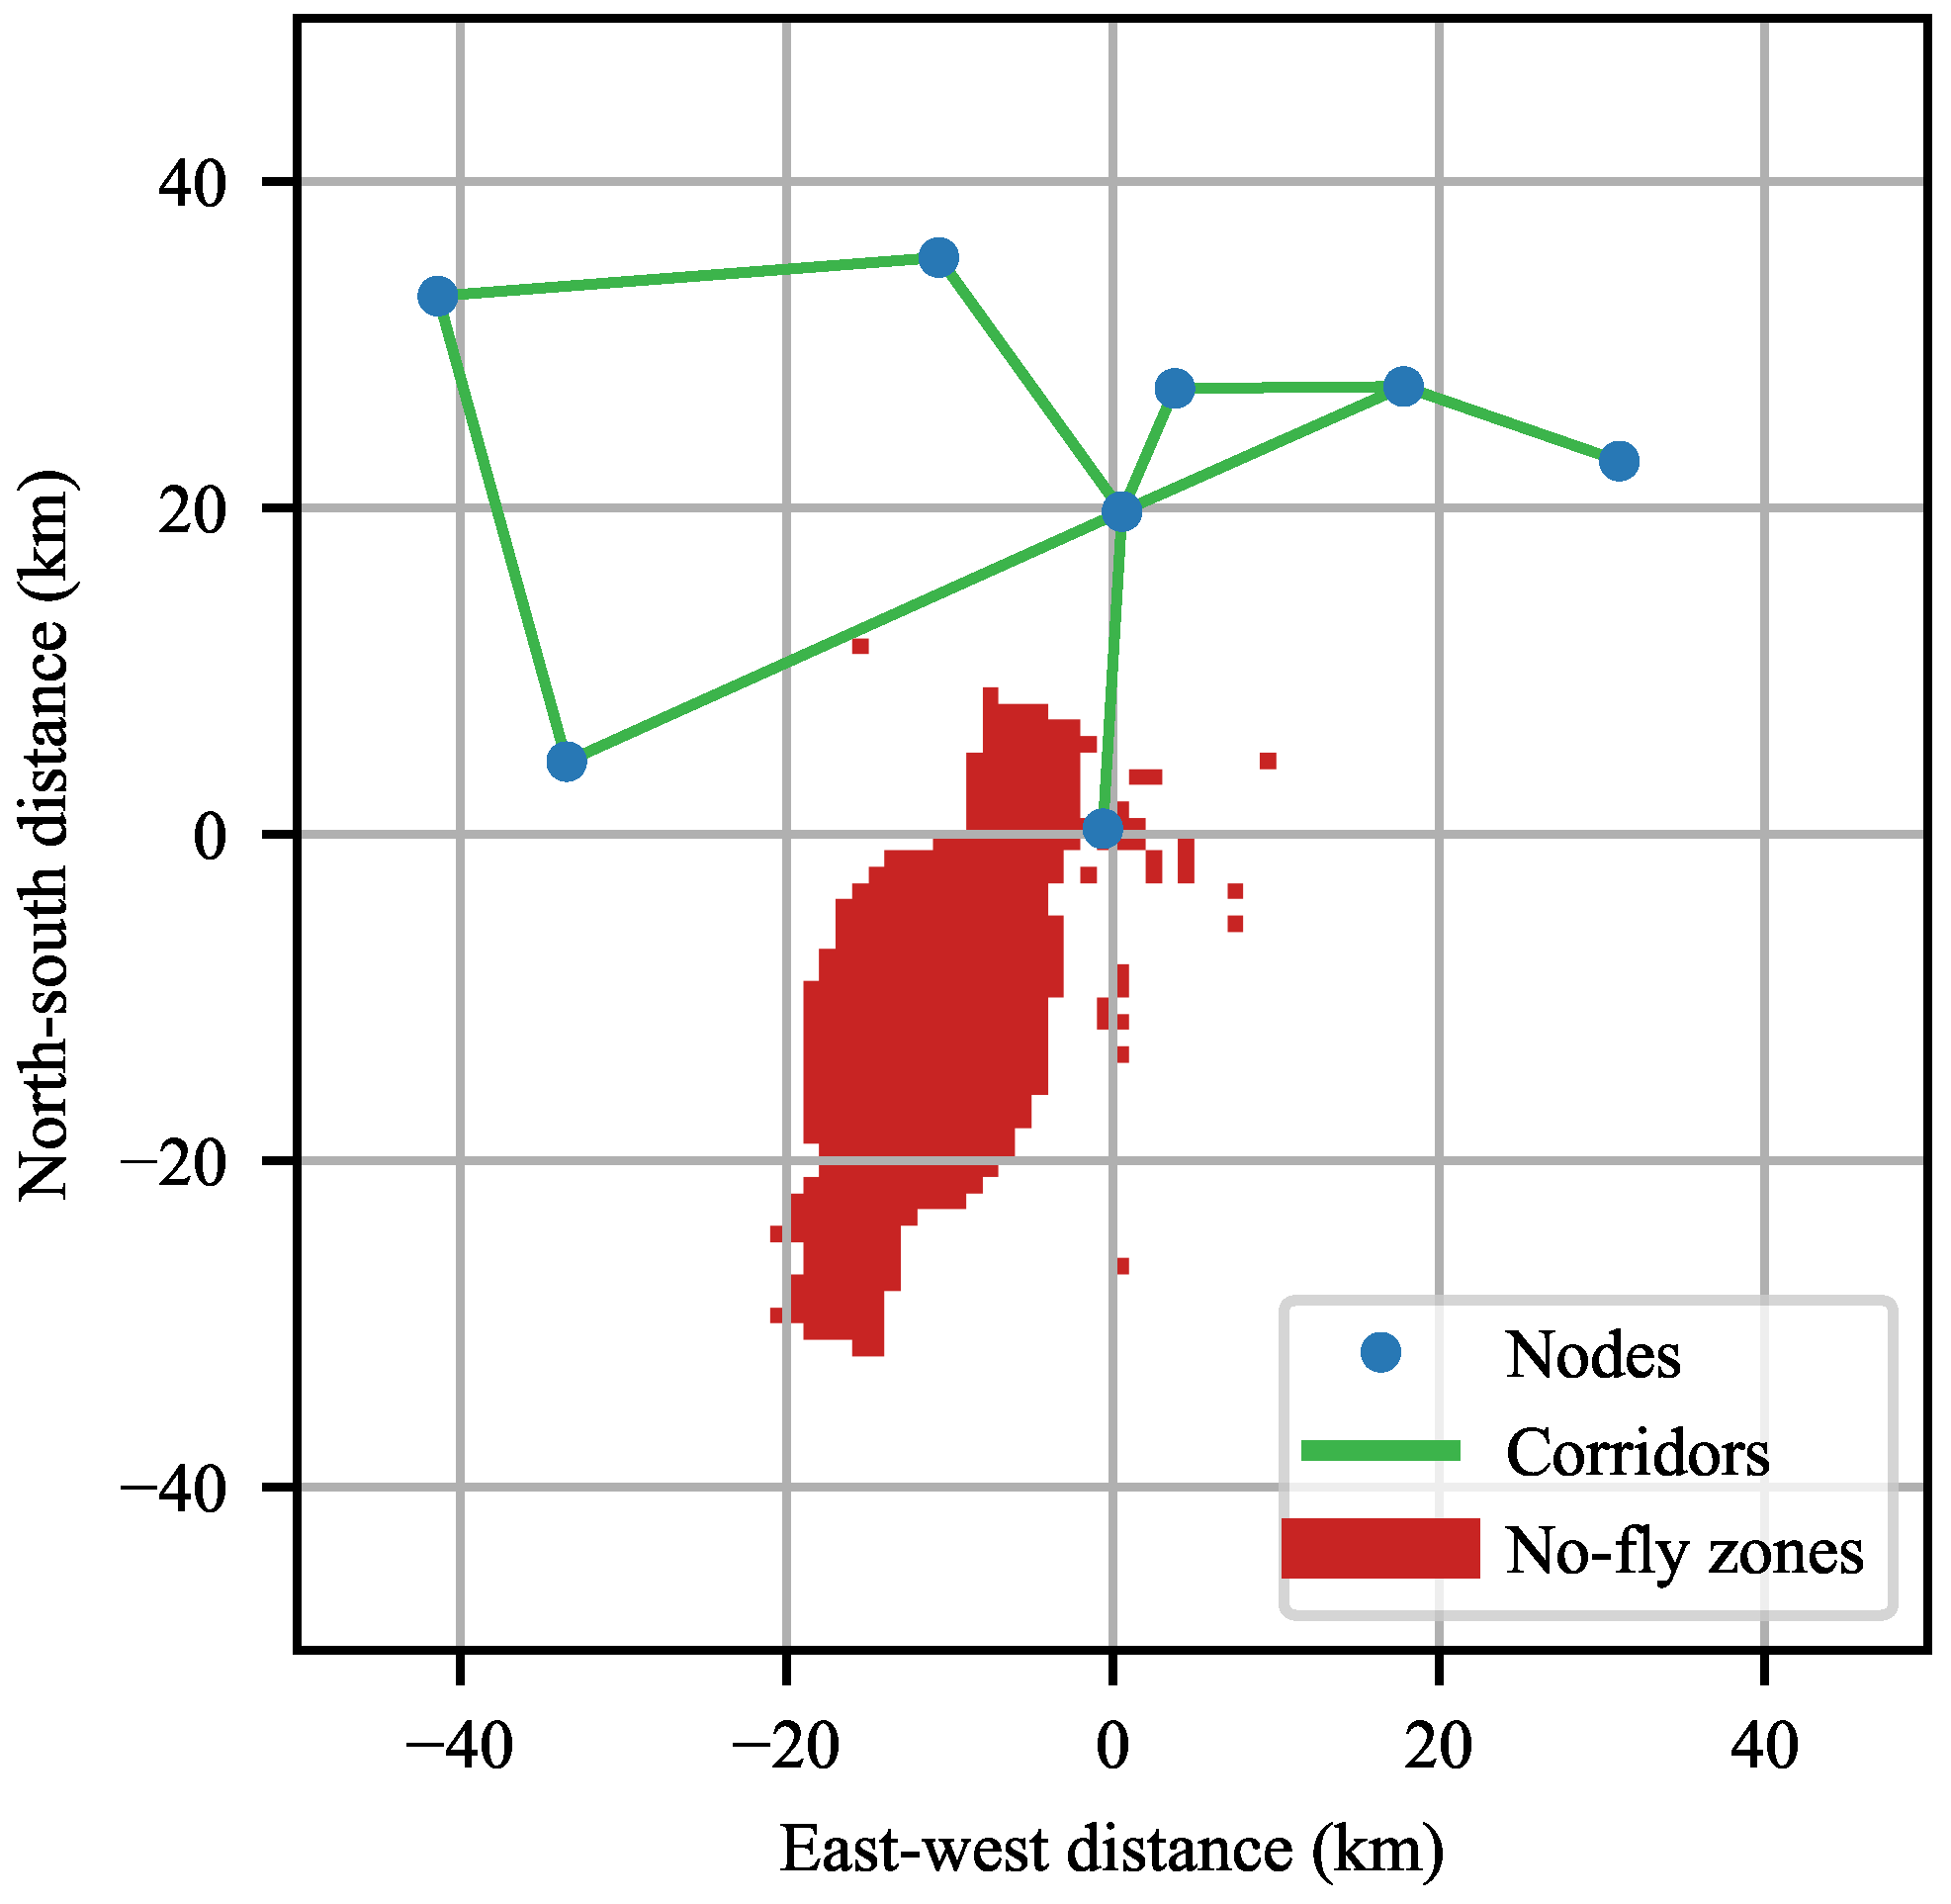
The design of a specific corridor network is constrained by factors such as the aerodrome airspace, tall buildings, and densely populated areas. Additionally, the network must be fully connected. To support long-distance travel demands and avoid singular solutions, the length of individual corridor segments should not be excessively short. Accordingly, we define three key constraints for corridor network design:
  • No-fly zone constraint ( G 1 ): Each corridor in the network must avoid passing through no-fly zones, as shown in Equation (11).
    g 1 ( X , M n o f l y ) = ( X M n o f l y )
    where M n o f l y represents the grid matrix of the no-fly zone, and X M n o f l y denotes the intersection of grid cells occupied by the corridor network X and those belonging to the no-fly zones.
  • Connectivity constraint ( G 2 ): All nodes within the corridor network must form a connected structure. The connectivity of the corridor network is expressed as follows:
    G is connected u , v V , a path P ( u , v ) , s . t . P ( u , v ) = ( u = v 0 , v 1 , v 2 , , v k = v ) , and i , E ( v i , v i + 1 ) E .
    where P ( u , v ) denotes a path from node u to node v. E ( v i , v i + 1 ) denotes an edge with nodes v i and v i + 1 as the starting and ending points.
  • Minimum length constraint ( G 3 ): The length of each corridor in the network must be no less than L m i n , as shown in Equation (12).
    G 3 = g 3 ( X ) = e E ( e 2 < L m i n )
    where ( · < L m i n ) denotes determining whether it is true. If true, then g 3 ( X ) plus 1.

3. Methods

3.1. Overview of Multi-Objective Optimization Methods

The multi-objective optimization problem aims to simultaneously optimize multiple, often conflicting objectives, where achieving the optimal solution for one objective may compromise others. The goal is to identify a set of Pareto-optimal solutions for which no other alternative can improve all objectives simultaneously. In other words, a solution is Pareto-optimal if no other solution achieves better performance across all objectives. The Pareto front is the curve or surface representing the projection of all Pareto-optimal solutions in the objective space. It defines the distribution range and the boundary limits of the objective values, providing a visualization of Pareto solutions within the objective space.
Currently, the most commonly used multi-objective optimization methods include the following: scalarization methods, swarm intelligence algorithms, and evolutionary algorithms.
Scalarization methods, including the weighted sum method, ϵ -constraint method [21], and normal-boundary intersection [22], are based on the idea of transforming a multi-objective problem into a single-objective problem, allowing the use of existing single-objective optimization algorithms to find solutions [23]. These methods are conceptually clear and easy to understand and implement. However, they have limitations in performance when dealing with non-convex, nonlinear problems, or with complex solution spaces, potentially failing to comprehensively cover the Pareto front.
Swarm intelligence algorithms are heuristic search methods that simulate collective behaviors in nature, such as those of ant colonies and particle swarms, where multiple individuals cooperate and compete to explore the solution space [24]. These algorithms have strong global search capabilities, simple structures, and low computational costs, making them well-suited for black-box or complex problems. However, swarm intelligence algorithms can still become trapped in local optima for certain problems. In more complex optimization scenarios, the convergence speed of these algorithms may be slower, particularly when dealing with multi-objective problems with numerous constraints.
Evolutionary algorithms are optimization algorithms that simulate the biological evolution process—including genetic algorithm and differential evolution—work by mimicking natural selection and gene recombination through operations such as selection, crossover, and mutation to search for optimal solutions [24,25]. Evolutionary algorithms can effectively avoid local optima through the evolutionary process of the population, offering strong global optimization capabilities. These algorithms are especially suitable for handling high-dimensional, large-scale, and complex nonlinear problems. They perform stably when dealing with complex objective functions and can handle irregular solution spaces, making them ideal for non-convex and complex objective functions. However, they have high computational costs and slow convergence speeds.
The corridor network design problem presented in this paper is a large-scale, complex multi-objective optimization problem with a high-dimensional and irregular solution space. Since the problem is not time-sensitive, algorithms with high computational costs can be utilized. Therefore, evolutionary algorithms are selected to solve the corridor network design problem in this study.

3.2. Non-Dominated Sorting Genetic Algorithm

In evolutionary algorithms of multi-objective optimization, the non-dominated sorting genetic algorithm (NSGA) family is one of the most established methods. NSGA introduced the concept of non-dominated sorting, which was further refined in NSGA-II through the incorporation of a fast non-dominated sorting mechanism and a crowding distance operator. These enhancements reduced computational complexity, improved efficiency, and increased the robustness of the algorithm. NSGA-II [26] is particularly notable for its ability to explore the Pareto front effectively while maintaining a well-distributed set of solutions, making it one of the most widely applied algorithms in multi-objective optimization.
As research has advanced, NSGA-II has faced challenges when addressing problems with three or more objectives. To overcome this, NSGA-III employs a reference point-based selection strategy, enabling the solution set to effectively cover diverse regions of the objective space. The key enhancement in NSGA-III lies in its selection operation, which maintains population diversity through the use of dynamically generated and updated reference points. U-NSGA-III [27], a “Unified” variant of NSGA-III, further enhances performance by introducing tournament selection pressure.
In this paper, the U-NSGA-III algorithm is applied to solve the multi-objective optimization problem of corridor network design.

3.3. Encoding Scheme

The encoding scheme is fundamental in representing optimization problem solutions as individuals suitable for algorithmic processing. It defines the mapping of real-world solutions into chromosome-like structures, facilitating effective genetic operations such as selection, crossover, and mutation. The encoding scheme not only influences the algorithm’s ability to represent solutions but also plays a crucial role in determining its efficiency and overall performance.
The encoding scheme X for the corridor network in this paper is illustrated in Figure 3. As shown in the left half of the figure, the encoding of X consists of two components: the first part contains the coordinates of n nodes, and the second part includes C n 2 = ( n 1 ) n 2 connectivity indexes. For an undirected graph with n nodes, the maximum number of edges is C n 2 . Therefore, setting C n 2 connectivity indexes can encompass all possible configurations of the corridor network. The corridor network is assumed to lie within a square area extending 50 km in all four directions (north, south, east, and west) from the city center, restricting the range of node coordinates to ( 50 , 50 ) . The connectivity indexes are defined by the indexes of the connected nodes. For a corridor with a connectivity index i, the sequence numbers of the two nodes it connects are determined using Equation (13).
j = i n k = ( i mod n )
where j refers to the node index of the corridor’s starting point v j , and k refers to the node index of its endpoint v k . i mod n represents the remainder when i is divided by n, and · denotes the ceil function, which rounds a number down to the greatest integer less than or equal to it.
It is evident that for a corridor connecting nodes j and k, the connectivity indexes ( j 1 ) × n + k and ( k 1 ) × n + j are interchangeable in representing its connectivity. In cases where j = k , the connectivity index refers exclusively to a node and does not represent a corridor. The corridor network is represented as an undirected graph. By not distinguishing network symmetry, we allow different solution representations to correspond to the same corridor network. This approach enhances the exploration capabilities and promotes diversity within the population. Regarding the case where j = k , the corridor is left undefined, which enables the fixed-length encoding vector to represent corridor networks with varying numbers of corridors. This strategy expands the search space and further contributes to increasing the diversity of the population. These factors contribute to the diversity of networks constructed from the same set of nodes. The number of corridors in such networks is not fixed and can reach a maximum of C n 2 = ( n 1 ) n 2 .
As shown in the right half of Figure 3, a schematic example with n = 4 nodes is provided. Here, an edge E ( v j , v k ) connects the nodes v j and v k , with v j , v k V . The far-right side of Figure 3 displays the correspondence relationship between the connectivity indexes and their associated nodes and edges.
As depicted in Figure 3, the connectivity index i in X may correspond to either a corridor or a node; it is not considered when it represents a node. Accordingly, the total corridor length ( F 3 ) in Equation (8), and the minimum length constraint ( G 3 ) in Equation (12) can be expressed as follows:
F 2 = f 2 ( X ) = i = 1 2 n ( x k x j , y k y j ) 2
G 3 = g 3 ( X ) = i = 1 2 n ( ( x k x j , y k y j ) 2 < L min )
where j and k are from Equation (13).

3.4. Algorithm Flow and Parameter Setting

U-NSGA-III is a reference point-based multi-objective optimization algorithm, well-suited for solving high-dimensional optimization problems. Its algorithm flow is shown in Algorithm 1.
For initialization, in step 1, apply the DAS-Dennis method [28] to generate reference directions in a three-dimensional objective space, dividing each dimension into N d i r e c t i o n intervals to produce uniformly distributed reference points R p o i n t in the unit hypercube. These reference points play a crucial role in U-NSGA-III by guiding the population’s distribution across the objective space. In step 2, randomly initialize the population P 0 with N p o p solutions, where each corridor network comprises N p o i n t nodes.
For the main loop, in steps 5–7, generate the offspring population Q t through selection, crossover, and mutation. The crossover probability P c r s s o v e r and mutation probability P m u t a t i o n are shown in Table 1. Filter out solutions in R t that do not meet the constraints G ( X ) = ( g 1 ( X , M n o f l y ) , g 2 ( X ) , g 3 ( X ) ) 0 , which are described in Section 2.3. Here, · 0 denotes that all elements in · are less than or equal to 0. In step 8, for each solution X in R t f , calculate the optimization objective F ( X ) = ( f 1 ( X , D O D ) , f 2 ( M p o p ) , f 3 ( X ) ) outlined in Section 2.2, and apply non-dominated sorting to derive the Pareto solution set P n d s . In steps 9–11, for each individual X R t f , compute its distances to all reference points R p o i n t , identify the closest reference point, and calculate the crowding distance to determine the population fitness S. Using S and P n d s , construct the next-generation population P n + 1 and update the reference points R p o i n t .
Algorithm 1 U-NSGA-III algorithm.
Initialization:
1:     R p o i n t Generate reference points with ( N d i r e c t i o n )
2:     P 0 Randomly initialize with ( N p o p , N p o i n t )
Main loop:
3:     t 0
4: while   t < N g e n do
5:           Q t generate offspring population with P t .
6:           R t Combine P t and Q t .
7:           R t f For X in R t : Filter out X that do not meet G ( X ) 0 .
8:           P n d s Perform non-dominated sorting on R t f by F ( X ) .
9:           S Calculate the population fitness of R t f by R p o i n t .
10:          P t + 1 Select the next-generation population with ( P n d s , S ) .
11:          R p o i n t Update the reference points with ( P n d s ) .
12:          t t + 1 .
13:  end while
     Output:
14:     Return the final set of non-dominated solutions P n d s .
In the U-NSGA-III algorithm, the selection of parameters significantly influences optimization performance, solution distribution quality, and computational efficiency. The key algorithm parameter settings used in this study are presented in Table 1.
Here, population size denotes the number of solutions maintained during the optimization process, i.e., the candidate solutions in each generation. The population size must align with the number of reference points. A small population size may fail to adequately cover all reference point directions, whereas an excessively large population size may lead to unnecessary computational overhead.
The population generation number represents the total number of iterations and often serves as the termination criterion for U-NSGA-III. High-dimensional problems typically require a greater number of generations to achieve convergence.
The reference direction division number determines the number and distribution of reference points in the objective space. A higher division number increases the number of reference points, enabling more comprehensive coverage of the objective space, which is particularly useful for higher-dimensional problems. However, it may cause the population to become sparse. A lower division number reduces the reference points, leading to incomplete coverage of the objective space, sparser solutions, and a higher likelihood of missing parts of the Pareto front.
Crossover and mutation are critical genetic operators that generate new solutions (offspring population) and enable exploration of the solution space. These operations are the core mechanisms for conducting both local and global searches within the algorithm. In this study, crossover refers to the process of exchanging parts of the encoded information between two different corridor encoding schemes, including position coordinates and network connectivity, with the selection process determined by the crossover probability ( P c r o s s o v e r ). Mutation refers to the process of introducing random changes to a certain extent in the position coordinates and connectivity of the corridor encoding scheme, based on the mutation probability ( P m u t a t i o n ). Different problems necessitate the adjustment of crossover and mutation probabilities based on their specific characteristics to maintain population diversity and enhance exploratory capabilities. In Section 4, this study establishes and assesses various combinations of these probabilities to determine the most suitable values.
Various algorithms exist for crossover and mutation operations. In this study, we employ two widely used algorithms for real-valued variables: simulated binary crossover (SBX) [29] and polynomial mutation [30].

4. Case Analysis

This section presents the case analysis of Chengdu using the methods detailed in Section 3.

4.1. Data Collection and Processing

As stated in Section 2.2, the optimization objectives include the travel time-saving rate, average population density, and total length of corridors. Specifically, the total length of corridors depends exclusively on the corridor network X itself, while the travel time-saving rate and average population density are determined through calculations based on travel demand data D O D and population distribution data M p o p .
As stated in Section 2.3, the constraints include a no-fly zone, a connectivity constraint, and a minimum length constraint. Specifically, the connectivity constraint and minimum length constraint depend exclusively on the corridor network X itself, while the no-fly zone data M n o f l y are determined through calculations based on geospatial data.
Relevant data from Chengdu were collected and analyzed to determine the specific parameters D O D , M p o p , and M n o f l y .

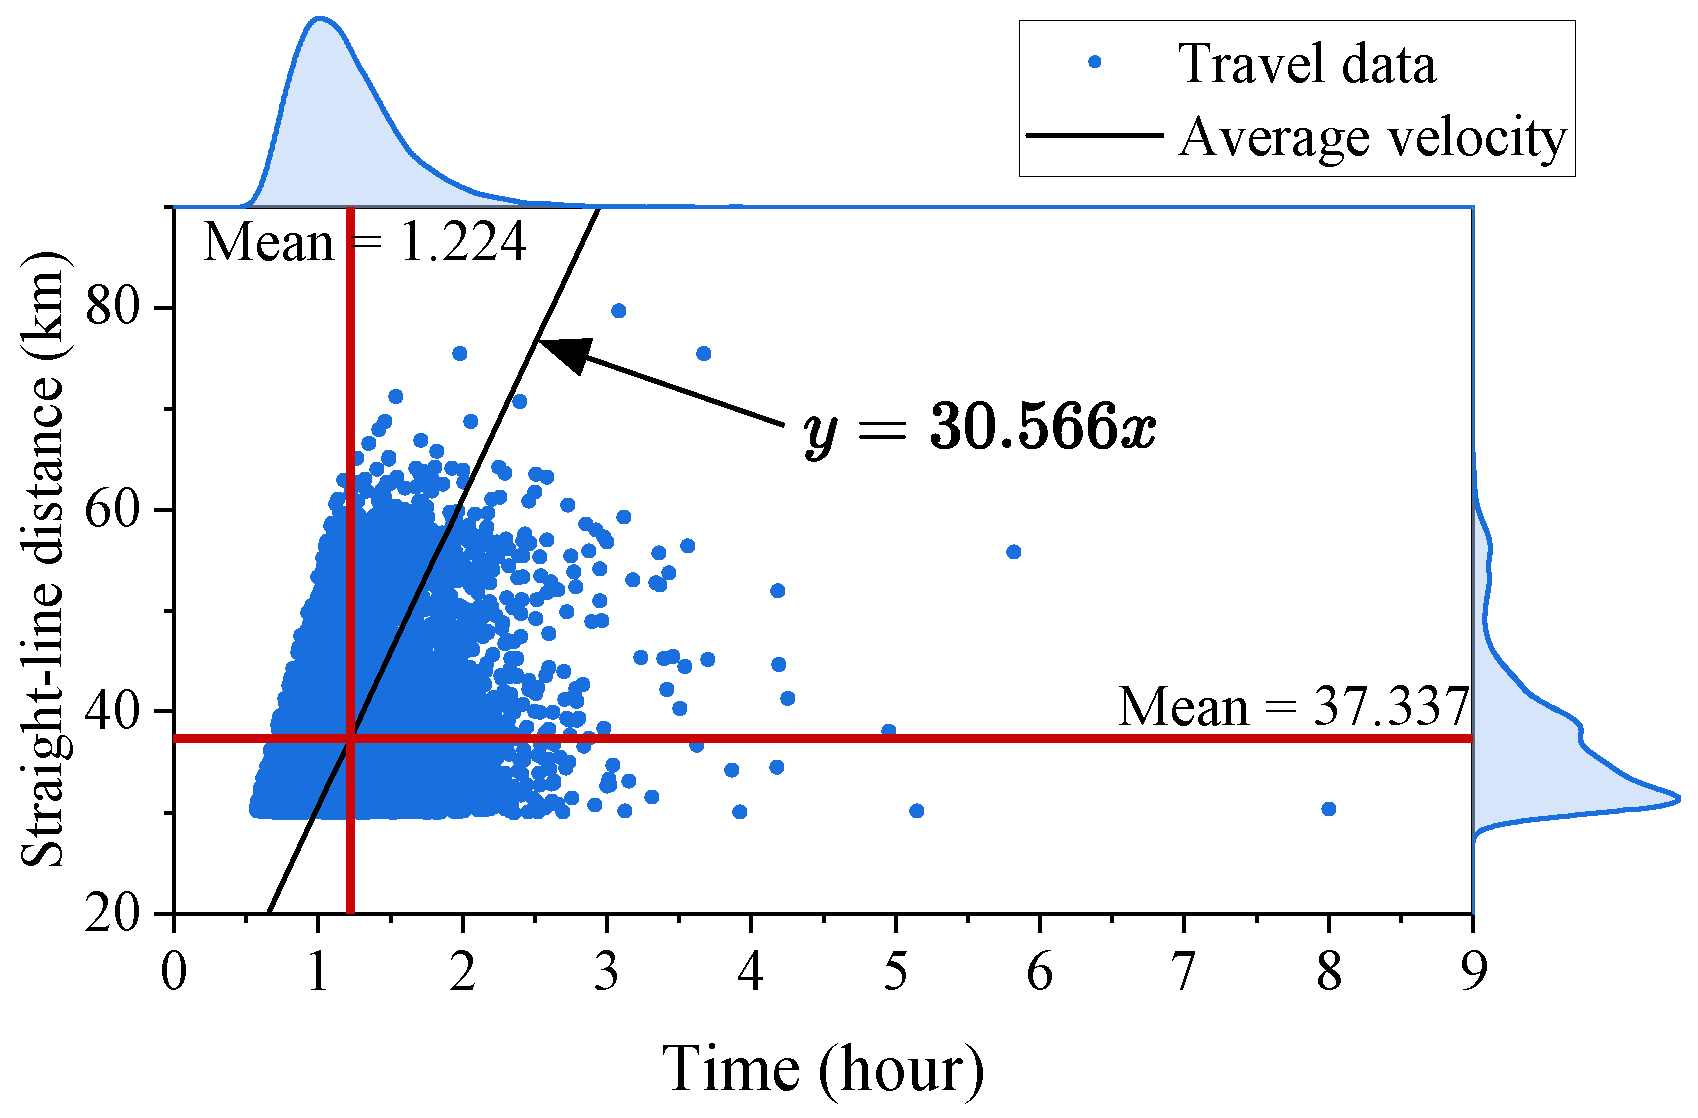
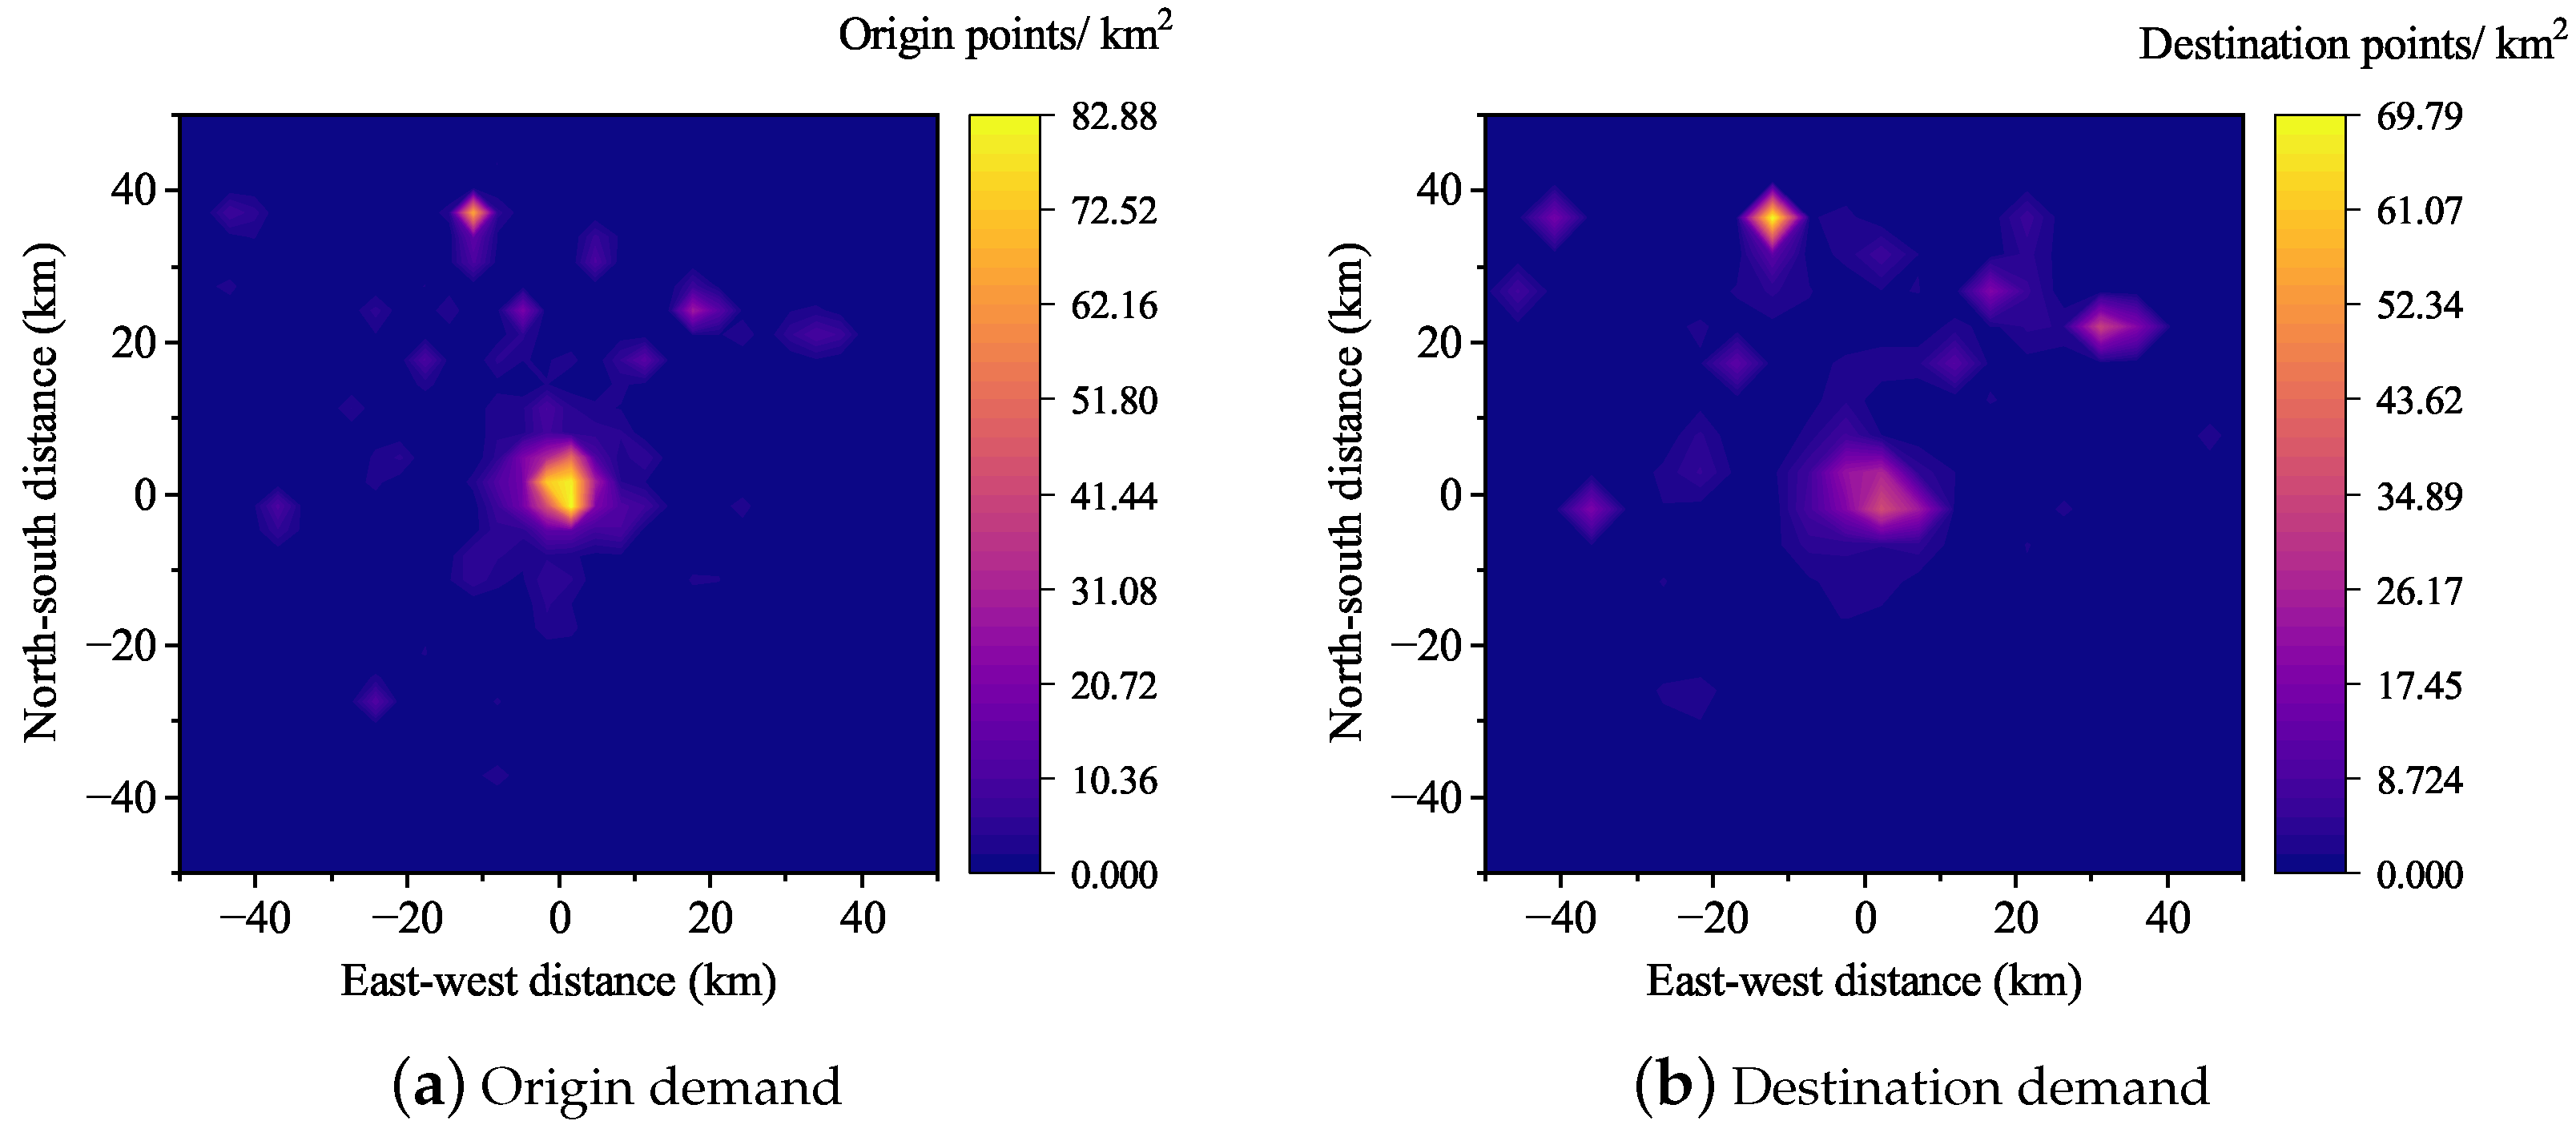
4.1.1. Travel Demand Data

As discussed in Section 2.2.1, the travel demand data were obtained from long-distance ride-hailing trip records. Therefore, we utilized the Didi travel dataset from Chengdu in November 2016 [31] and processed it as follows:
  • Travel distance filtering: Identify trips with a straight-line distance greater than 30 km.
  • Travel scope filtering: Select trips where both the origin and destination lie within Chengdu’s main urban area, defined as a square region extending 50 km in all four directions (north, south, east, and west) from the city center (Tianfu Square).
  • Outlier Removal: Clean and filter out abnormal data.
After filtering, we obtain a dataset of 12,829 travel records, i.e., D O D . A scatter plot depicting the travel time versus straight-line travel distance for D O D is shown in Figure 4. The results indicate an average travel time of 1.224 h, an average straight-line distance of 37.337 km, and an average straight-line speed V c a r of 30.566 km/h. The spatial distribution of origins and destinations is further visualized as an origin–destination demand heatmap in Figure 5. The heatmap clearly shows that travel demand is most concentrated in the city center, followed by higher demand in the northern areas, whereas the southern areas exhibit comparatively lower demand.

4.1.2. Population Distribution Data

To compute the average population density F 2 , population distribution data M p o p are required. Mobile signaling data have proven to be novel and effective for estimating and analyzing population distribution [32]. Here, mobile signaling data from Chengdu at a specific time in 2023 were selected and processed as follows:
  • Travel scope filtering: This involves filtering mobile signaling data to include only locations within Chengdu’s main urban area, represented as a square area extending 50 km in all four directions (north, south, east, and west) from the city center (Tianfu Square).
  • Outlier removal: This involves cleaning and filtering out abnormal data.
After the above processing, a total of 344,710 signaling data records were obtained. According to the Chengdu Bureau of Statistics, the population of Chengdu’s main urban area was 15.4194 million in 2020. Based on the signaling data, the population density distribution map for Chengdu’s central urban area is shown in Figure 6. The map reveals that population density is higher in the northern region compared to the southern region—a pattern consistent with the travel demand distribution.

4.1.3. No-Fly Zone Data

In this paper, the term “No-Fly zone” refers to geospatial areas in urban low-altitude airspace where flight activities are restricted. For illustrative purposes, this case focuses on three types of areas: the protection zone of obstacle limitation surfaces for transport aerodromes, tall buildings, and densely populated areas. Other cases may include regions with persistent adverse weather conditions or military no-fly zones. Short-term dynamic factors, such as temporary meteorological disturbances, are not addressed in this paper.
The obstacle limitation surfaces for transport aerodromes are regulated to ensure the safety of aircraft during takeoff and landing by imposing strict height restrictions on ground objects [33], To prevent low-altitude aircraft from intruding into the obstacle limitation surfaces of civil airports, the Civil Aviation Administration of China (CAAC) established the protection zone for obstacle limitation surfaces for major domestic transport aerodromes in 2017, including the Shuangliu Aerodrome located in the main urban area of Chengdu [34]. The protection zone of obstacle limitation surfaces is shown in Figure 7, where the protection area is the polygon defined by the coordinates of points A1-A2-C2-arcC2B2-B2-B3-arc B3C3-C3-A3-A4-C4-arc C4B4-B4-B1-arc B1C1-C1-A1. The radius of each arc is 7070 meters.
As UAM primarily operates within urban airspace at a height above ground level of approximately 300 to 600 m [35], buildings taller than 200 m are identified as relevant obstacles. The list of buildings in Chengdu exceeding 200 m is presented in Table 2.
Currently, there is no unified standard for defining densely populated areas. In this section, we use 3 × 10 4 people / km 2 as an illustrative threshold to classify densely populated areas.
The no-fly zones for UAM operations, defined by the three aforementioned factors, are shown in Figure 8. The map reveals that these zones are predominantly situated in the southern part of Chengdu’s main urban area, in contrast to the distribution of travel demand and population density.

4.2. Result of U-NSGA-III

Integrating the U-NSGA-III method from Section 3 with the data presented in Section 4.1 yields the following results.

4.2.1. Experiment on Selecting Crossover and Mutation Probabilities

To select the appropriate crossover and mutation probabilities, the following combinations are considered: 0.2, 0.4, 0.6, 0.8. This results in 16 different combinations in total. The hypervolume metric is used to evaluate each combination in order to choose the most suitable crossover and mutation probability pair for the corridor network design problem. Hypervolume is a widely adopted metric for evaluating the Pareto front in multi-objective optimization problems, particularly when the number of objectives exceeds two [36]. It measures the “volume” of the region between the Pareto front and a reference point. Specifically, Hypervolume calculates the volume from the reference point to the Pareto front, representing the diversity and dominance of the optimization results.
In this procedure, the maximum and minimum values of all Pareto front surfaces across the three optimization objective dimensions are first determined, with all optimization results normalized to the range [0, 1] using these values as unit lengths. Next, the worst point in the three objective dimensions is selected as the reference point, corresponding to the normalized values ( F 1 , F 2 , F 3 ) being set as ( 0 , 1 , 1 ) . Then, the hypervolume of the different normalized Pareto front surfaces is calculated, with a larger hypervolume indicating superior optimization results.
The hypervolume corresponding to different combinations of crossover and mutation probabilities is shown in Table 3. The results demonstrate that a crossover probability of 0.2 and a mutation probability of 0.6 produce the largest hypervolume. Consequently, these values for crossover and mutation probabilities are selected for the subsequent experiments. To reduce the experimental duration on selecting crossover and mutation probabilities, the population size and generation number are adjusted accordingly. The population size is N p o i n t × 1000 , and the generation number is 100.

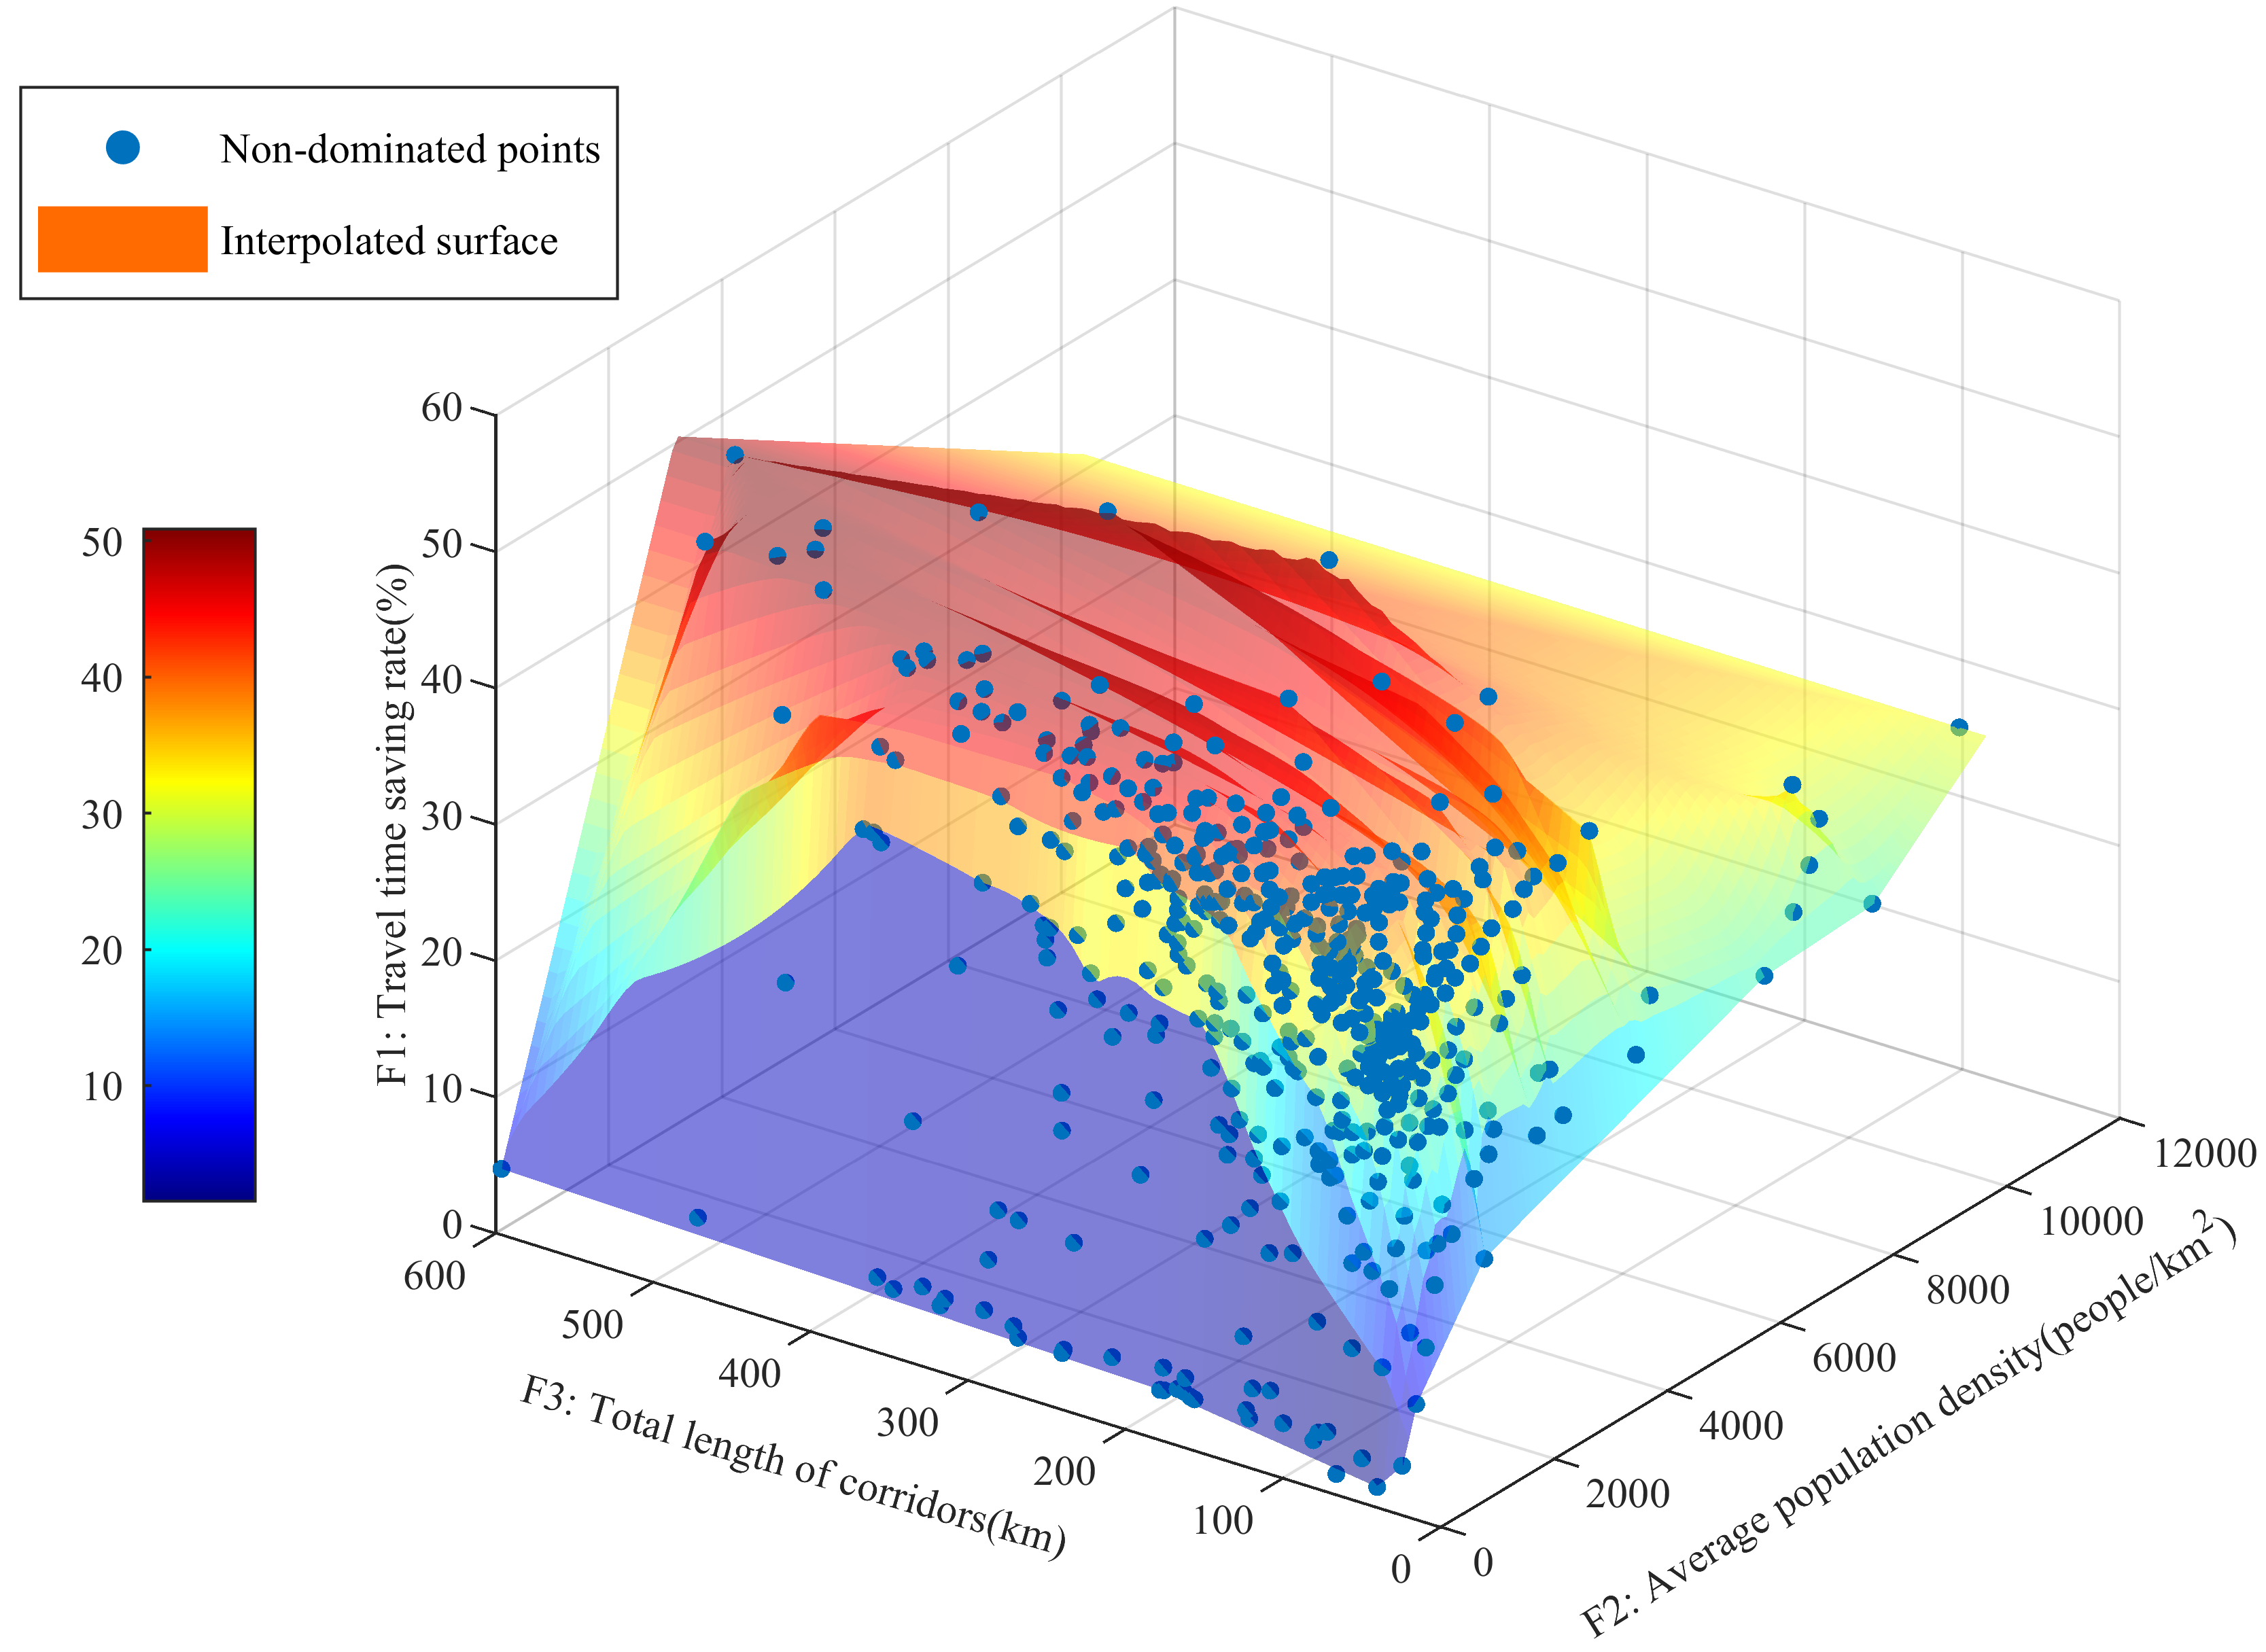
4.2.2. Pareto Front and Corridor Design Result

Figure 9 depicts the Pareto fronts of the optimized results generated by the U-NSGA-III algorithm, demonstrating the outcomes for varying numbers of nodes across different optimization objectives. It is evident that there is a trade-off relationship between F 1 and F 2 / F 3 . When F 1 improves, F 2 / F 3 worsens, and vice versa. In contrast, no clear correlation is observed between F 2 and F 3 , resulting in fewer Pareto solutions, which are represented as scattered points. Additionally, the maximum value of F 1 increases with the number of nodes.
The Pareto fronts derived from varying node numbers are consolidated into a unified Pareto front, and a 3D scatter plot and an interpolated surface are presented, as shown in Figure 10. Here, the blue 3D spheres represent the Pareto solutions and the interpolated surface employs color to visualize the variations in the travel time-saving rate F 1 . As the travel time-saving rate F 1 increases, the 3D scatter plot becomes less dense and more dispersed, with both the average population density F 2 and the total length of corridors F 3 also showing an upward trend.
Each solution along a set of Pareto fronts holds a reference value, however, we ultimately need to select a specific solution as the final result. This decision often depends on the decision-maker’s preferences, the shape and trend of the Pareto front, as well as other contextual factors related to the problem. In the context of the corridor design problem addressed in this paper, our primary objective is to maximize the travel time-saving rate F 1 . Figure 9 shows that when the average population density F 2 is below 1500 people/km2 and the total corridor length F 3 is below 200 km, further increases in the travel time-saving rate do not significantly affect F 2 and F 3 . Therefore, we set upper bounds of 1500 people/km2 for F 2 and 200 km for F 3 and selected the solution with the highest F 1 value within this subset of Pareto-optimal solutions as our final solution.
The corresponding final corridor network is illustrated in Figure 11, comprising 8 nodes connected by 9 corridors, predominantly located in the northern part of the city, aligns with areas requiring long-distance travel. The final solution features an average population density of 1346.1 people/km2, a total corridor length of 191.6 km, and a travel time-saving rate of 47.1%.

4.3. Comparison of K-Means Clustering Method

To assess the performance of the proposed corridor network design method relative to existing approaches, we use the classic and widely applied K-means clustering algorithm as a benchmark. In the K-means method, the number of clusters, K, has a significant effect on the clustering performance. The values for K are set between 4 and 8, and the resulting optimization outcomes are shown in Table 4. The demand coverage rate is the proportion of long-distance travel demands for which the corridor network offers shorter travel times than ride-hailing services, and the travel time-saving rate of covered demands refers to the travel time savings achieved specifically for the subset of demands served by the corridors. In Table 4, when K = 8, the travel time-saving rate, average population density, demand coverage rate, and travel time-saving rate of covered demands all reach their optimal values. Therefore, the number of clusters, K, is selected to be 8.
By setting 8 clustering centers, the origin–destination (OD) travel demand points are grouped. The clustering results are shown in Figure 12a. Some clustering centers initially fall within no-fly zones; these are slightly adjusted to move them outside the restricted areas, and the adjusted points are designated as the nodes. Connecting all nodes that satisfy the specified constraints produces a network of 16 corridors, as illustrated in Figure 12b.
Table 5 presents a comparison of the performance of the corridor networks generated by U-NSGA-III and K-means across several evaluation metrics.
The corridor network generated by U-NSGA-III demonstrates superior performance over the K-means method across most evaluation metrics, except for the demand coverage rate, where it performs slightly worse than K-means.

5. Discussion

This study models the urban air mobility (UAM) corridor network design as a multi-objective optimization problem, balancing travel time efficiency, ground risk, and implementation costs. Utilizing the U-NSGA-III algorithm, the optimized corridor network demonstrates substantial improvements over traditional approaches. Specifically, as illustrated in Table 5, the proposed method achieves a 47.1% reduction in travel time compared to ride-hailing services, a 37.8% decrease in ground risk (measured by average population density), and a 69.9% reduction in implementation costs (evaluated by total length of corridors). These results indicate that the proposed optimization effectively enhances efficiency while simultaneously mitigating risks and costs, offering a comprehensive solution to urban air transportation challenges.
A prominent characteristic of the optimized corridor network is its spatial distribution, with the majority of nodes and corridors concentrated in the northern region of Chengdu. This area exhibits higher demand and fewer no-fly zones; therefore, U-NSGA-III demonstrates a preference for establishing the corridor network in this region. However, the demand coverage rate is marginally lower than that achieved by traditional methods, as the U-NSGA-III algorithm prioritizes efficiency and safety over extensive coverage.
The findings of this study are consistent with and extend existing research on UAM network design. Prior studies, such as by Zhao et al. [12] and Wei et al. [15], focused on optimizing either demand coverage or cost reduction as single objectives. In contrast, this study employs a multi-objective framework that integrates travel time efficiency, ground safety, and cost considerations. This balanced approach represents a significant advancement over single-objective optimization methods like K-means clustering, which do not adequately address critical trade-offs. Moreover, the results corroborate earlier work by Barsotti et al. [16], which highlighted the importance of avoiding high-density population zones to minimize risks. This study enhances these insights by applying a Pareto optimization approach, thereby providing decision-makers with flexible solutions that balance competing priorities based on specific local requirements.
The implications of this research extend beyond Chengdu, offering valuable insights into UAM deployment in other urban areas. The demonstrated approach provides a replicable framework for balancing efficiency, safety, and cost, which is essential for cities with diverse geographic, demographic, and regulatory conditions. Additionally, the optimization framework can be adapted to incorporate other objectives, such as noise reduction and environmental impact, thereby broadening its applicability. Furthermore, the findings underscore the potential of integrating advanced algorithms like U-NSGA-III into urban planning processes. By leveraging such optimization techniques, city planners can systematically evaluate trade-offs and identify solutions that align with their strategic goals, facilitating the development of safer, faster, and more sustainable urban air transportation systems.
For future research, the following potential directions are worth exploring:
  • Non-linear corridor design: The current model assumes linear connections between nodes. Future studies could explore non-linear pathways to enhance coverage, particularly in areas with numerous no-fly zones or geographical constraints.
  • Dynamic factors: Incorporating dynamic elements such as weather conditions, time-varying demands, and real-time traffic data could improve the robustness and adaptability of the corridor network.
  • Additional objectives: Expanding the optimization framework to include objectives like noise pollution, environmental impact, and social equity would provide a more comprehensive assessment of UAM network performance.
  • Implementation feasibility: Further research is necessary to evaluate the practical feasibility of deploying the optimized network, including aspects of regulatory compliance, public acceptance, and economic viability.
In conclusion, this study demonstrates the efficacy of multi-objective optimization in addressing the complex challenges associated with UAM corridor network design. By balancing efficiency, safety, and cost, the proposed method offers a versatile and effective solution for urban air transportation, paving the way for safer, faster, and more sustainable mobility options in the future.

Author Contributions

Conceptualization, Z.Z. and Y.Z.; methodology, Z.Z.; software, Z.Z.; validation, Z.Z. and C.L.; formal analysis, Z.Z. and Y.Z.; investigation, Z.Z. and Y.Z.; resources, B.J.; data curation, Z.Z.; writing—original draft preparation, Z.Z.; writing—review and editing, Z.Z. and Y.Z.; visualization, Z.Z. and Y.L.; supervision, B.J.; project administration, B.J.; funding acquisition, C.L. All authors have read and agreed to the published version of the manuscript.

Funding

This study was co-supported by the Civil Aviation Administration of China Safety Capacity Building Project (MHAQ2024033), the National Natural Science Foundation of China (NSFC)-Joint Fund of Civil Aviation Research (U2333214), and the Graduate Innovation Fund of the Fundamental Research Funds for the Central Universities for the year 2024 (24CAFUC10191).

Data Availability Statement

The data that support the findings of this study are available from the author, [email: zzy2022@cafuc.edu.cn], upon reasonable request.

Conflicts of Interest

The authors declare no conflicts of interest.

References

  1. China Academy of Urban Planning and Design. Commuter Monitoring Report of Major Chinese Cities in 2024; Technical report; China Academy of Urban Planning and Design: Beijing, China, 2024. [Google Scholar]
  2. Niklaß, M.; Dzikus, N.; Swaid, M.; Berling, J.; Lührs, B.; Lau, A.; Terekhov, I.; Gollnick, V. A Collaborative Approach for an Integrated Modeling of Urban Air Transportation Systems. Aerospace 2020, 7, 50. [Google Scholar] [CrossRef]
  3. Altun, A.T.; Hasanzade, M.; Saldiran, E.; Guner, G.; Uzun, M.; Fremond, R.; Tang, Y.; Bhundoo, P.; Su, Y.; Xu, Y.; et al. AMU-LED Cranfield Flight Trials for Demonstrating the Advanced Air Mobility Concept. Aerospace 2023, 10, 775. [Google Scholar] [CrossRef]
  4. Gordo, V.; Becerra, I.; Fransoy, A.; Ventas, E.; Menendez-Ponte, P.; Xu, Y.; Tojal, M.; Perez-Castan, J.; Perez Sanz, L. A Layered Structure Approach to Assure Urban Air Mobility Safety and Efficiency. Aerospace 2023, 10, 609. [Google Scholar] [CrossRef]
  5. Qu, W.; Xu, C.; Tan, X.; Tang, A.; He, H.; Liao, X. Preliminary Concept of Urban Air Mobility Traffic Rules. Drones 2023, 7, 54. [Google Scholar] [CrossRef]
  6. Holden, J.; Goel, N. Fast-Forwarding to a Future of on-Demand Urban Air Transportation; Technical report; Uber Elevate: San Francisco, CA, USA, 2016. [Google Scholar]
  7. NASA. UAM Vision Concept of Operations (ConOps) UAM Maturity Level (UML) 4; Technical report; NASA: Washington, DC, USA, 2021. [Google Scholar]
  8. FAA. NextGen Concept of Operations for Urban Air Mobility (UAM) v1.0; Technical report; FAA: Washington, DC, USA, 2020. [Google Scholar]
  9. FAA. Urban Air Mobility (UAM) Concept of Operations 2.0; Technical Report; FAA: Washington, DC, USA, 2023. [Google Scholar]
  10. SESAR. U-Space Concept of Operations (Conops), 4th ed.; Technical Report; SESAR: Brussels, Belgium, 2023. [Google Scholar]
  11. Verma, S.; Dulchinos, V.; Wood, R.D.; Farrahi, A.; Mogford, R.; Shyr, M.; Ghatas, R. Design and Analysis of Corridors for UAM Operations. In Proceedings of the 2022 IEEE/AIAA 41st Digital Avionics Systems Conference (DASC), Portsmouth, VA, USA, 18–22 September 2022; pp. 1–10. [Google Scholar] [CrossRef]
  12. Zhao, Y.; Feng, T. Strategic Integration of Vertiport Planning in Multimodal Transportation for Urban Air Mobility: A Case Study in Beijing, China. J. Clean. Prod. 2024, 467, 142988. [Google Scholar] [CrossRef]
  13. Jin, Z.; Ng, K.K.; Zhang, C. Robust Optimisation for Vertiport Location Problem Considering Travel Mode Choice Behaviour in Urban Air Mobility Systems. J. Air Transp. Res. Soc. 2024, 2, 100006. [Google Scholar] [CrossRef]
  14. Kitthamkesorn, S.; Chen, A. Maximum Capture Problem for Urban Air Mobility Network Design. Transp. Res. Part E Logist. Transp. Rev. 2024, 187, 103569. [Google Scholar] [CrossRef]
  15. Wei, Q.; Gao, Z.; Clarke, J.P.; Topcu, U. Risk-Aware Urban Air Mobility Network Design with Overflow Redundancy. Transp. Res. Part B Methodol. 2024, 185, 102967. [Google Scholar] [CrossRef]
  16. Barsotti, M.; Gao, Z.; Clarke, J.P. An Eco-Social Approach to Sustainable UAM Network Design. In Proceedings of the AIAA AVIATION Forum and ASCEND 2024, Las Vegas, NV, USA, 29 July–2 August 2024. [Google Scholar] [CrossRef]
  17. Bauranov, A.; Rakas, J. Designing Airspace for Urban Air Mobility: A Review of Concepts and Approaches. Prog. Aerosp. Sci. 2021, 125, 100726. [Google Scholar] [CrossRef]
  18. Jiao, Q.; Liu, Y.; Zheng, Z.; Sun, L.; Bai, Y.; Zhang, Z.; Sun, L.; Ren, G.; Zhou, G.; Chen, X.; et al. Ground Risk Assessment for Unmanned Aircraft Systems Based on Dynamic Model. Drones 2022, 6, 324. [Google Scholar] [CrossRef]
  19. Wisely, D.; Wang, N.; Tafazolli, R. Capacity and Costs for 5G Networks in Dense Urban Areas. IET Commun. 2018, 12, 2502–2510. [Google Scholar] [CrossRef]
  20. EHang. The Future of Transportation: White Paper on Urban Air Mobility Systems; EHang: Guangzhou, China, 2020. [Google Scholar]
  21. Deb, K.; Sindhya, K.; Hakanen, J. Multi-objective optimization. In Decision Sciences; CRC Press: Boca Raton, FL, USA, 2016; pp. 161–200. [Google Scholar]
  22. Das, I.; Dennis, J.E. Normal-Boundary Intersection: A New Method for Generating the Pareto Surface in Nonlinear Multicriteria Optimization Problems. SIAM J. Optim. 1998, 8, 631–657. [Google Scholar] [CrossRef]
  23. Kasimbeyli, R.; Ozturk, Z.K.; Kasimbeyli, N.; Yalcin, G.D.; Erdem, B.I. Comparison of some scalarization methods in multiobjective optimization: Comparison of scalarization methods. Bull. Malays. Math. Sci. Soc. 2019, 42, 1875–1905. [Google Scholar] [CrossRef]
  24. Sharma, S.; Kumar, V. A Comprehensive Review on Multi-objective Optimization Techniques: Past, Present and Future. Arch. Comput. Methods Eng. 2022, 29, 5605–5633. [Google Scholar] [CrossRef]
  25. Deb, K. Multiobjective Optimization: Interactive and Evolutionary Approaches; Lecture Notes in Computer Science Series; Springer: Berlin/Heidelberg, Germany, 2008. [Google Scholar]
  26. Deb, K.; Pratap, A.; Agarwal, S.; Meyarivan, T. A fast and elitist multiobjective genetic algorithm: NSGA-II. IEEE Trans. Evol. Comput. 2002, 6, 182–197. [Google Scholar] [CrossRef]
  27. Seada, H.; Deb, K. A Unified Evolutionary Optimization Procedure for Single, Multiple, and Many Objectives. IEEE Trans. Evol. Comput. 2016, 20, 358–369. [Google Scholar] [CrossRef]
  28. Tian, Y.; Xiang, X.; Zhang, X.; Cheng, R.; Jin, Y. Sampling Reference Points on the Pareto Fronts of Benchmark Multi-Objective Optimization Problems. In Proceedings of the 2018 IEEE Congress on Evolutionary Computation (CEC), Rio de Janeiro, Brazil, 8–13 July 2018; pp. 1–6. [Google Scholar] [CrossRef]
  29. Deb, K.; Sindhya, K.; Okabe, T. Self-Adaptive Simulated Binary Crossover for Real-Parameter Optimization. In Proceedings of the 9th Annual Conference on Genetic and Evolutionary Computation, London, UK, 7–11 July 2007; pp. 1187–1194. [Google Scholar] [CrossRef]
  30. Carles-Bou, J.L.; Galán, S.F. Self-Adaptive Polynomial Mutation in NSGA-II. Soft Comput. 2023, 27, 17711–17727. [Google Scholar] [CrossRef]
  31. Didi Chuxing. Didi Gaia Data Open Plan. 2017. Available online: https://outreach.didichuxing.com/research/opendata (accessed on 20 December 2024).
  32. Wei, B.; Su, G.; Liu, F. Dynamic Assessment of Spatiotemporal Population Distribution Based on Mobile Phone Data: A Case Study in Xining City, China. Int. J. Disaster Risk Sci. 2023, 14, 649–665. [Google Scholar] [CrossRef]
  33. ICAO. Annex14-Aerodromes Volume I; ICAO: Montréal, QC, USA, 2018. [Google Scholar]
  34. China Civil Aviation Website. The Civil Aviation Administration Has Announced the Protection Zones for Obstacle Limitation Surfaces at Civil Airports. 2017. Available online: https://www.ccaonline.cn/news/hot/332813.html (accessed on 20 December 2024).
  35. SKYDB. Chengdu—Buildings—Skyscrapers—High-Rise-Buildings. Available online: https://www.skydb.net/city/598504688/chengdu/ (accessed on 20 December 2024).
  36. Fonseca, C.; Paquete, L.; Lopez-Ibanez, M. An Improved Dimension-Sweep Algorithm for the Hypervolume Indicator. In Proceedings of the 2006 IEEE International Conference on Evolutionary Computation, Vancouver, BC, Canada, 16–21 July 2006; pp. 1157–1163. [Google Scholar] [CrossRef]
Figure 1. UAM corridor network in the city (modified from FAA [8]).
Aerospace 12 00229 g001
Figure 2. The two travel modes are as follows. Travel mode 1: traditional ride-hailing trips with an average speed V c a r ; travel mode 2: traditional ride-hailing integrated with corridor network travel, where the flying velocity within the corridors is V f l y .
Aerospace 12 00229 g002
Figure 3. Encoding scheme of the corridor network. The left side shows the encoded vector X, the right side depicts the undirected graph G = ( V , E ) corresponding to X using a 4-node example, and the far-right illustrates the connectivity indexes and their associations with nodes and edges.
Aerospace 12 00229 g003
Figure 4. Straight-line distance versus travel time for long-distance ride-hailing trips in Chengdu.
Aerospace 12 00229 g004
Figure 5. Heatmap of the origin–destination demand for long-distance ride-hailing trips in Chengdu.
Aerospace 12 00229 g005
Figure 6. Population density map of the main urban area of Chengdu.
Aerospace 12 00229 g006
Figure 7. The protection zone of obstacle limitation surfaces (Source: CAAC [34]).
Aerospace 12 00229 g007
Figure 8. No-fly zone of UAM corridor operations in the main urban area of Chengdu.
Aerospace 12 00229 g008
Figure 9. The Pareto fronts of different optimization objectives.
Aerospace 12 00229 g009
Figure 10. The Pareto fronts of three optimization objectives. The blue 3D spheres represent the Pareto solutions. The interpolated surface employs color to visualize the variations in F 1 .
Aerospace 12 00229 g010
Figure 11. The final solution of U-NSGA-III comprises a corridor network consisting of 7 nodes and 8 corridors.
Aerospace 12 00229 g011
Figure 12. The K-means corridor network consists of 8 nodes and 16 corridors.
Aerospace 12 00229 g012
Table 1. Key parameters of the assumption and algorithm.
NameSymbolValue
Velocity of fling in corridors V f l y 240 km/h
Minimum length of a corridor L min 8 km
The number of nodes N p o i n t [4–8]
Population size N p o p N p o i n t × 2000
Population generation number N g e n 1000
Reference direction division number N d i r e c t i o n 20
Crossover probability P c r s s o v e r [0.2–0.8]
Mutation probability P m u t a t i o n [0.2–0.8]
Table 2. Tall buildings over 200 m in Chengdu (Source: SKYDB). [35]).
NameHeightLatitudeLongitude
Chengdu Greenland Tower46830.61055104.1408
Tiantou International Business Center28430.42122104.0730
International Commerce Center28030.63604104.1115
Chengdu IFS Tower 24730.65705104.0780
Global Times Center24330.55739104.0628
Western IFC Conrad Hotel24130.65101104.0808
Tianxi Twin Towers 22230.63745104.0933
Tianfu IFC22030.58707104.0643
Waldorf Astoria Chengdu22030.58685104.0665
Oriental Hope Intertek Plaza21930.55477104.0656
Minyoun Financial Plaza20630.64957104.0886
OPPO Headquarters20630.58233104.0673
Chengdu Fantasia Meinian Plaza20430.53615104.0660
Sichuan Airlines Plaza20430.66147104.0678
Huarun Tower20130.65247104.1135
Pinnacle One20030.65258104.0816
Chengdu World Financial Center20030.55341104.0608
Twin Rivers International Office Tower20030.56217104.0550
Palm Springs International Center20030.55763104.0672
Table 3. The hypervolume corresponding to different combinations of P c r s s o v e r and P m u t a t i o n . (Bold indicates optimal).
P mutation 0.20.40.60.8
P crssover
0.20.8860.9140.9260.921
0.40.8680.8790.8950.884
0.60.8450.8680.8830.875
0.80.8250.8420.8370.855
Table 4. Comparison of K-means results for different numbers of clusters. (Bold indicates optimal).
Number of Clusters (K)45678
Travel time-saving rate ( F 1 )30.9%33.7%35.7%38.5%42.4%
e population density ( F 2 )2488.42968.13609.53059.32164.9
Total corridor length ( F 3 )112.3225.4412.7445.2636.2
Demand coverage rate77.9%82.6%87.8%89.7%90.6%
Travel time-saving rate of covered demands37.3%39.0%39.2%41.7%45.5%
Table 5. Comparison of algorithm results. (Bold indicates optimal).
Evaluation MetricsU-NSGA-IIIK-Means
Travel time-saving rate ( F 1 )47.1%42.4%
Average population density ( F 2 )1346.12164.9
Total corridor length ( F 3 )191.6636.2
Demand coverage rate88.190.6%
Travel time-saving rate of covered demands51.945.5%
Disclaimer/Publisher’s Note: The statements, opinions and data contained in all publications are solely those of the individual author(s) and contributor(s) and not of MDPI and/or the editor(s). MDPI and/or the editor(s) disclaim responsibility for any injury to people or property resulting from any ideas, methods, instructions or products referred to in the content.

