1. Introduction
Despite the significant crises the aviation industry has faces in recent years, both in Europe and globally, current trends indicate an upward trajectory in the number of operations. It is estimated that in Europe, the 2019 level of operations will be reached again by 2025 [
1]. This growth will lead to increased airspace congestion and, consequently, a higher probability of highly undesirable aviation incidents, such as loss of separation. EUROCONTROL analyses indicate a rising trend in the number of such incidents in recent years [
2].
Currently, several solutions are available to counteract or minimize loss of separation incidents. These include extensive controller training focused on proper radar display scanning technique, the Short-Term Conflict Alert (STCA) system [
3,
4,
5], the Airborne Collision Avoidance System (ACAS) [
6,
7], the Tactical Controller Tool (TCT) [
8,
9,
10,
11], and the Medium-Term Conflict Detection (MTCD) system [
12,
13,
14]. A comparison of these systems is presented in
Table 1.
Tactical Controller Tool (TCT) assists air traffic controllers by detecting potential conflicts relatively early (5–8 min in advance). The system not only identifies situations requiring intervention, but also verifies the effectiveness of issued clearances [
15]. For example, TCT can inform the ATCO (Air Traffic Controller) whether a given clearance will lead to a separation minima infringement. This allows the controller to make necessary corrections before a critical situation arises [
15].
Short-Term Conflict Alert (STCA) is a ground-based safety net system used in air traffic management to assist controllers in detecting potential separation minima infringements between aircraft. Its primary purpose is to generate timely warnings (1–2 min in advance) of a potential conflict, allowing controllers to take preventive action before a dangerous situation arises [
16,
17]. According to EUROCONTROL guidelines, the presence of an STCA system should not be considered when calculating the capacity of a given sector, as it is not designed to enhance efficiency but solely to support collision prevention—like any ground-based safety-net system [
16,
18].
Medium-Term Conflict Detection (MTCD) is an advanced tool in air traffic management systems that helps controllers identify potential conflicts between aircraft, as well as between aircraft and designated airspaces, within a medium-term horizon—typically from 20 to 30 min [
19]. MTCD can be considered as a natural extension of the STCA system; however, the key difference between them lies in their purpose. While STCA is part of the ground-based safety net, designed solely to enhance safety by issuing alerts, MTCD serves as a planning tool for controllers, aiding in effective air traffic management.
Airborne Collision Avoidance System (ACAS) serves as the final line of defense against airborne collisions. Operating independently of air traffic control services, the system continuously monitors the surrounding airspace by detecting responses from the SSR (Secondary Surveillance Radar) transponders of other aircraft. If a collision risk is identified, ACAS generates either a Traffic Advisory (TA) or Resolution Advisory (RA), suggesting a change in flight trajectory in the vertical plane [
20,
21]. ACAS is a crucial component of aviation safety infrastructure, enabling the autonomous prevention of airborne collisions without reliance on ground infrastructure or air traffic control services. It is the last safeguard against mid-air collisions and the only system that provides direct conflict resolution instructions—while systems issue only warnings with varying levels of advance notice. However, ACAS is designed solely to protect the lives of passengers and crew, rather than to optimize or efficiently manage airspace.
The article “Neural Network-Based Aircraft Conflict Prediction in Final Approach Maneuvers” [
22] explores the use of artificial neural networks to detect potential conflicts between aircraft during the Final Approach Segment. The study aimed to develop a neural network model capable of predicting whether the separation between two aircraft during the approach phase of flight would be lost. To achieve this, a binary classification system was employed, where the network, based on input data representing aircraft positions and time differences, predicts whether a conflict will occur. The system relied solely on simulation data at both the training and evaluation stages. The simulations were based on the dynamics model of only a single aircraft type (A320). Real operational constraints were taken into account, including minimum horizontal (3 NM) and vertical (1000 ft) separation. When simulating trajectories, a fixed area was defined where new aircraft would appear (initial position). The possibility of radar vectoring (vectors to final) was not considered in any way. The training examples included conflict and non-conflict scenarios, which were used to train the model. Ultimately, the only input data used were aircraft positions (in the horizontal plane) and time difference. The network demonstrated high accuracy in classifying conflict scenarios, confirming its potential as a tool for supporting air traffic controllers’ decisions. The study highlights the effectiveness of neural networks in analyzing complex data and the model’s robustness to variables related to the real-flight operational dynamics.
The article “Design of an ATC Tool for Conflict Detection Based on Machine Learning Techniques” [
23] presents the development of an air traffic control tool that utilizes machine learning techniques to detect conflicts between aircraft. The primary goal of the study was to create a system that supports controllers in detecting separation minima infringements and enhancing airspace safety. The system was developed using historical trajectories obtained from the ADS-B system (real data). Machine learning techniques, including classification and regression, provided the following results:
The system identified the most similar historical trajectory to the current one (based on factors such as callsign, groundspeed, and heading). It then used this trajectory to assess the minimum separation values and potential conflicts. Simulations were conducted in the selected airspace, which were used to generate training and test data. The analyzed airspace was LSAZM567—an en-route sector where most trajectories followed straight lines, with minimal lateral and vertical changes. A combination of historical data filtering and time modifications was used to analyze the trajectories and simulate potential conflicts. The system demonstrated high efficiency in conflict prediction:
Despite achieving high accuracy of the prediction (adequately over 97% and 99%), the authors of [
22,
23] highlight the need for further development of the tool, including deep learning, incorporating operational and environmental variables, and expanding data sources for trajectory predictions, such as flight plans and ground systems. The study demonstrates that machine learning techniques have the potential to become an integral part of modern air traffic management systems, supporting both their efficiency and safety.
References [
22,
23] as well as [
24,
25,
26,
27] inspired the authors of this article to develop their own concept of an early warning system for supporting air traffic control. Reference [
24] presents a digital assistance system designed to identify conflicts in air traffic by comprehensively analyzing aircraft surveillance data, thereby enhancing situational awareness for air traffic controllers. To achieve this, the study employs long short-term memory networks (a type of recurrent neural network) to assess whether their temporal dynamic behavior can effectively monitor air traffic and classify error patterns. The goal of reference [
25] was to determine how much the high false-alarm rate of air traffic control midair conflict alerts contributes to the “cry wolf” effect, in which genuine alerts are ignored and responses to all alerts are delayed. Reference [
25] concludes that the frequent occurrence of false alarms does not seem to lead to a “cry wolf” reaction in the context of en route air traffic control conflict alerts. This conclusion is very important in the event that the planned system could generate a certain percentage of false alarms. References [
26] and [
27] address, respectively, the prediction of air traffic controller workload and delays in air traffic. Both studies are related through the use of artificial neural networks to accomplish these tasks.
This report provides the following contributions concerning the analyzed studies: the system operates independently of a specific aircraft type’s dynamics model, it considers the option of radar vectoring (vectors to final), input data are not limited to position in horizontal plane and time difference, it does not require the identification of the most comparable historical trajectories to evaluate minimum separation distances and potential conflicts, and the system is expected to perform more effectively in airspace dominated by radar vectoring instead of following standard routes.
2. Methods
Based on a literature analysis of currently used or proposed solutions [
22,
23], a set of assumptions was formulated for the development of the new system. These assumptions aim to eliminate (partially or completely) the shortcomings of existing systems while maintaining their useful functions. The key assumptions are as follows:
Early warning—Information or warning should be provided to the controller with sufficient time in advance. The warning should allow the controller to respond in controlled manner, such as modifying a clearance or issuing additional instructions (e.g., skipping one of the Standard Instrument Arrival points), without requiring an immediate change in flight parameters. The goal is to achieve a time horizon similar to that of the MTCD system, i.e., more than 10 min.
Use of an artificial neural network (ANN)—All currently used solutions rely on classic, advanced mathematical models. However, studies [
22,
23] highlight the great potential of machine learning in addressing such problems. Therefore, the concept of using an ANN as the foundation of the implemented system appears to be well justified.
Real data—Both in the system creation phase (implementation, network training, etc.) and during testing, real data of the aircraft trajectory and flight parameters are to be used (instead of simulated, as was the case in [
22], where only a dynamics model of a single aircraft type was used). This is to examine the usability of the proposed solution in the target environment as faithfully as possible. Data from flights that arrived at Chopin Airport in Warsaw and landed on runway RWY11 were used. In the analyzed airspace (simplified TMA), numerous changes in speed, course, and position occur in both the vertical and horizontal planes (in contrast to the en-route airspace analyzed in [
12]). Aircraft enter this airspace from various directions; therefore, it is not possible to define a narrow initial area of their appearance, as was the case in [
11].
Independence from external data (e.g., flight plan data)—The developed tool should function without the need for integration with data regarding the future (planned) flight trajectory (in contrast to the system described in [
12], which searched historical trajectories to find the best match for the current one). In theory, this should allow for simpler implementation and increase autonomy and reliability—for example: a failure of systems processing flight plans should not affect the functioning of the developed system. Moreover, the system should perform better in airspace where radar vectoring prevails (such as TMA) rather than flight along standard routes.
Effectiveness—High effectiveness in predicting future conflicts is desired. Ideally, the system should not generate false alerts about a possible conflict while not omitting any future conflict. Due to early warnings that do not require immediate reaction, it was assumed that the nature of the system’s operation and the warnings issued are relatively preventive: false alerts about a future conflict are allowed at the expense of minimizing the probability of the conflict not being detected.
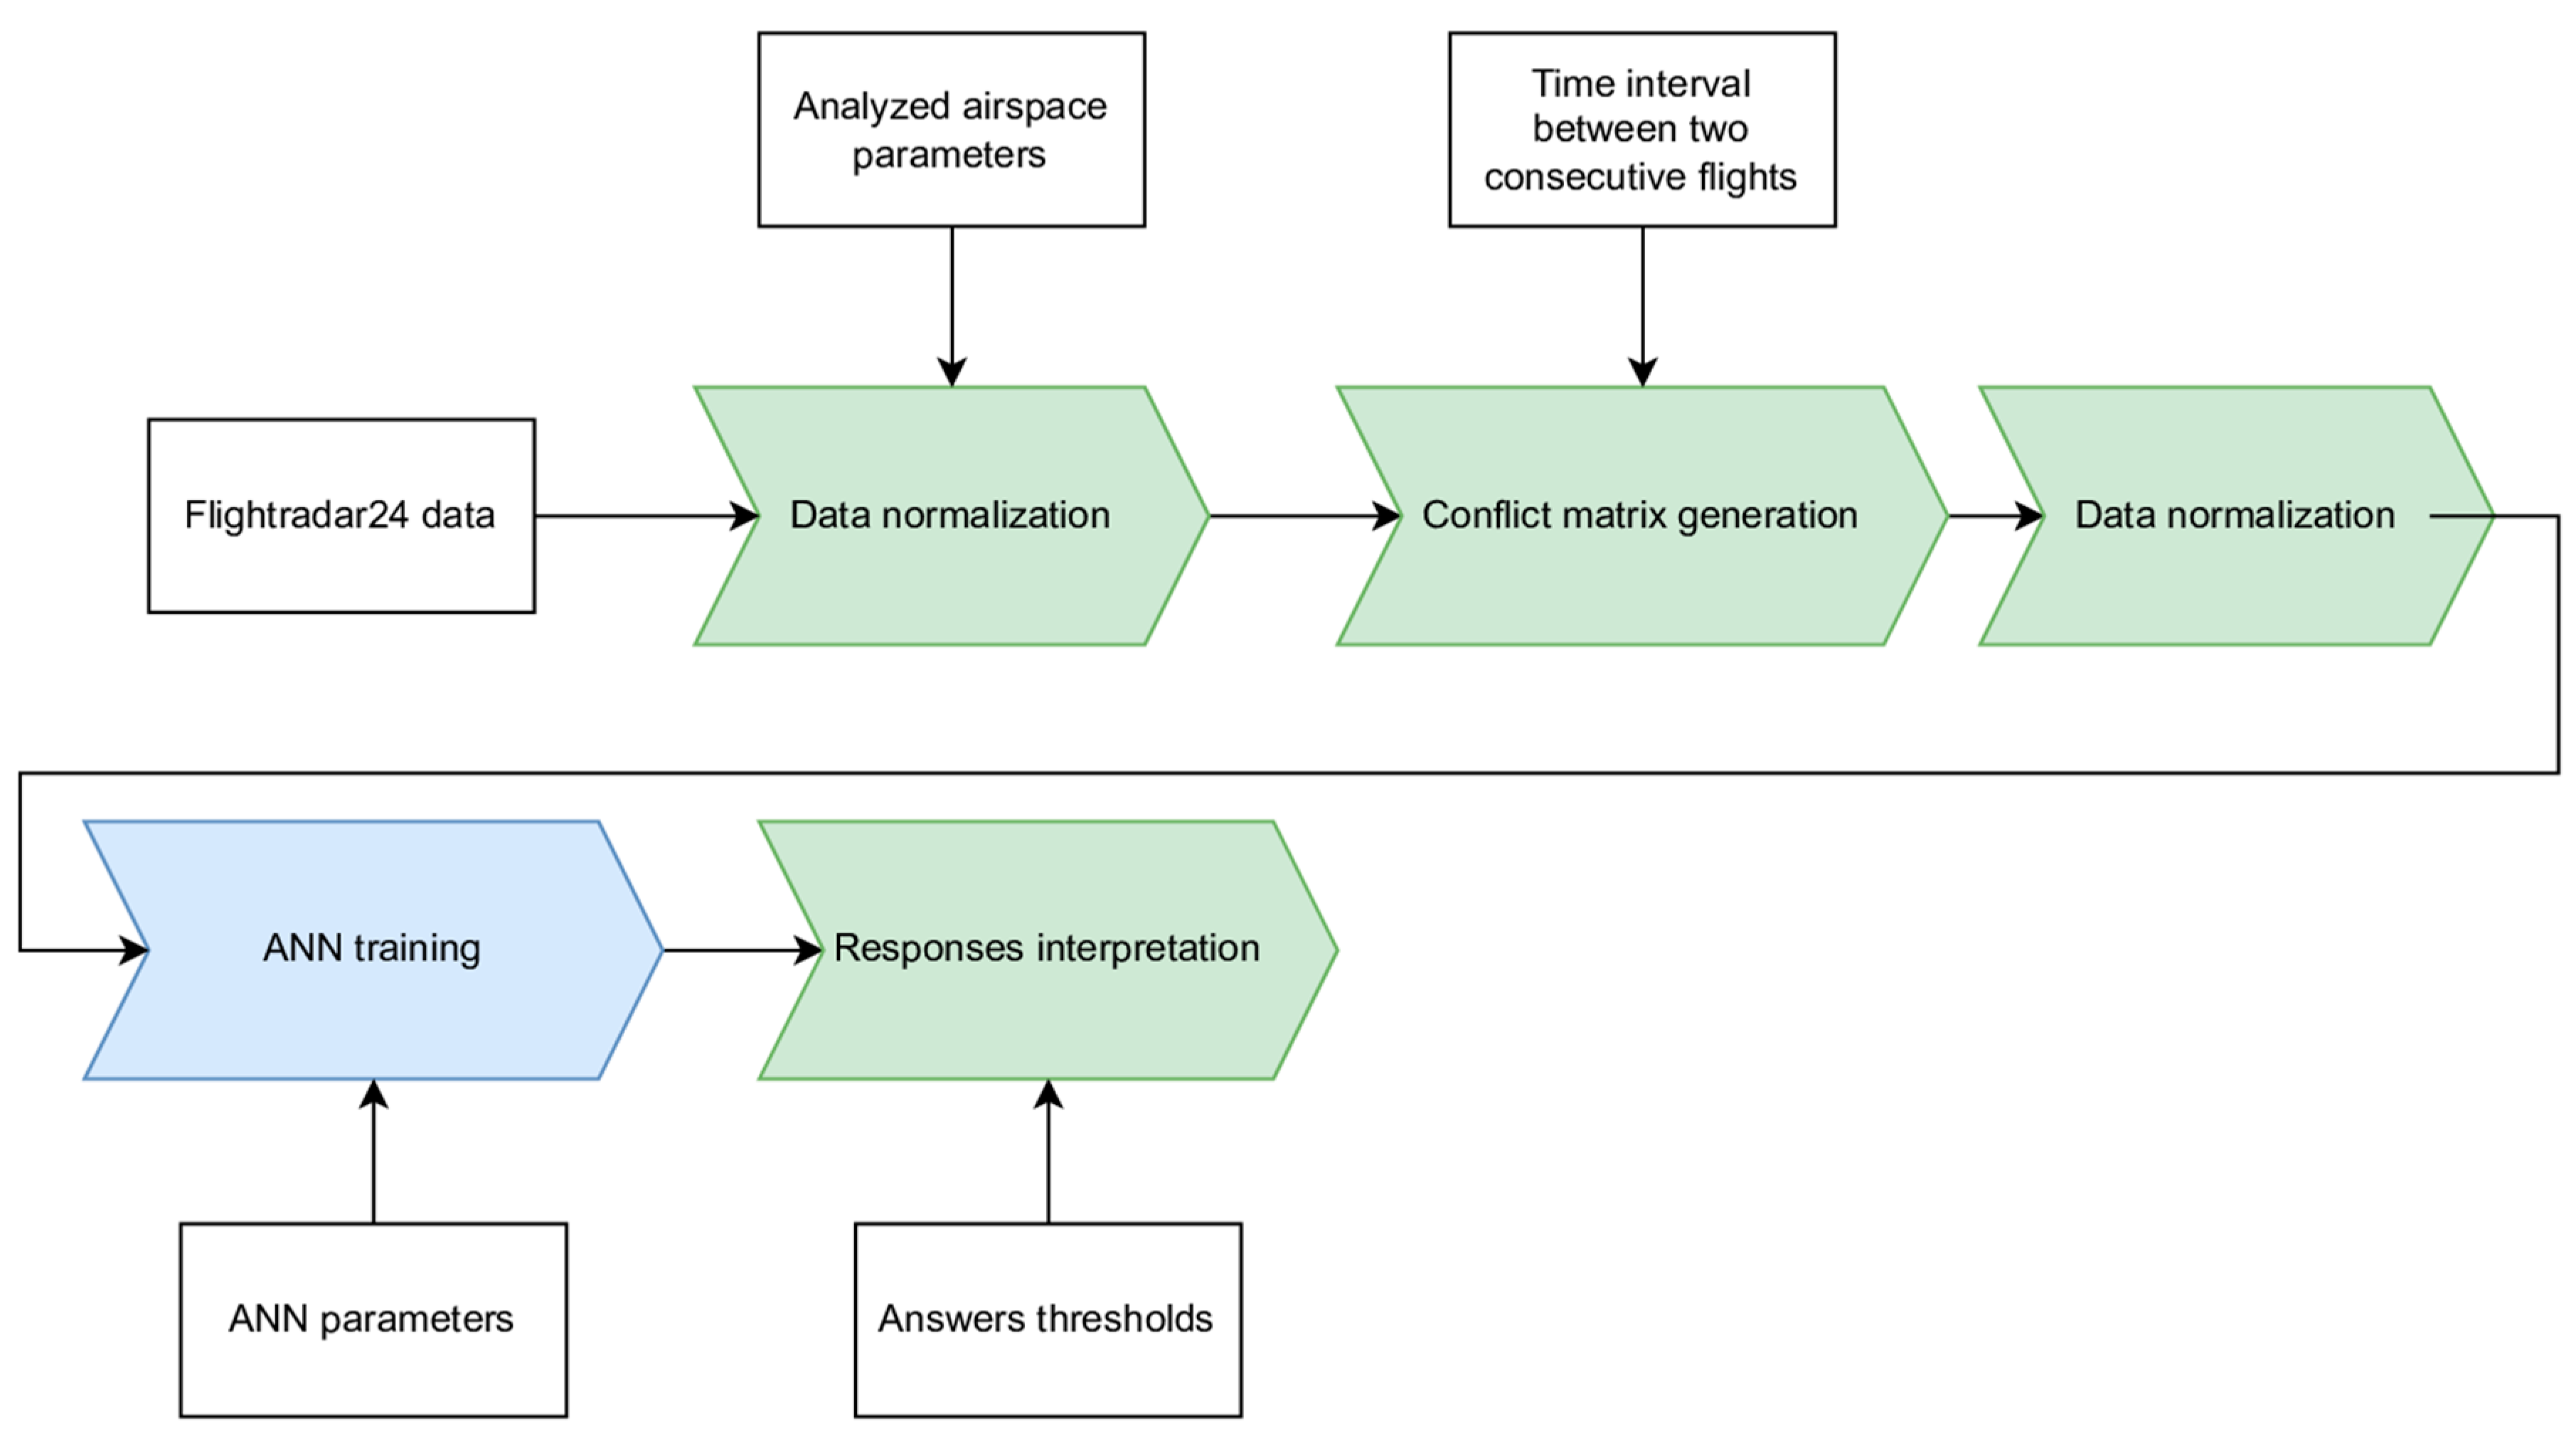
To develop a system that meets the aforementioned assumptions, the MATLAB R2024a environment with the Deep Learning Toolbox was selected. This toolbox provides a set of commands and functions for designing, training and implementing deep neural networks [
28]. The aim of the work was to create a program using an ANN that would determine solely on the basis of the initial (at the time of crossing the boundary of the given airspace) positions, altitudes, speeds, and headings of two aircraft whether there would be a loss of separation (conflict) between them. The program’s (network’s) responses were compared with actual outcomes to assess its effectiveness and usefulness. The process of developing the early warning system is illustrated in the flowchart in
Figure 1. Data processing stages are highlighted in green, stages related to training the neural network are marked in blue, and input data are marked in white.
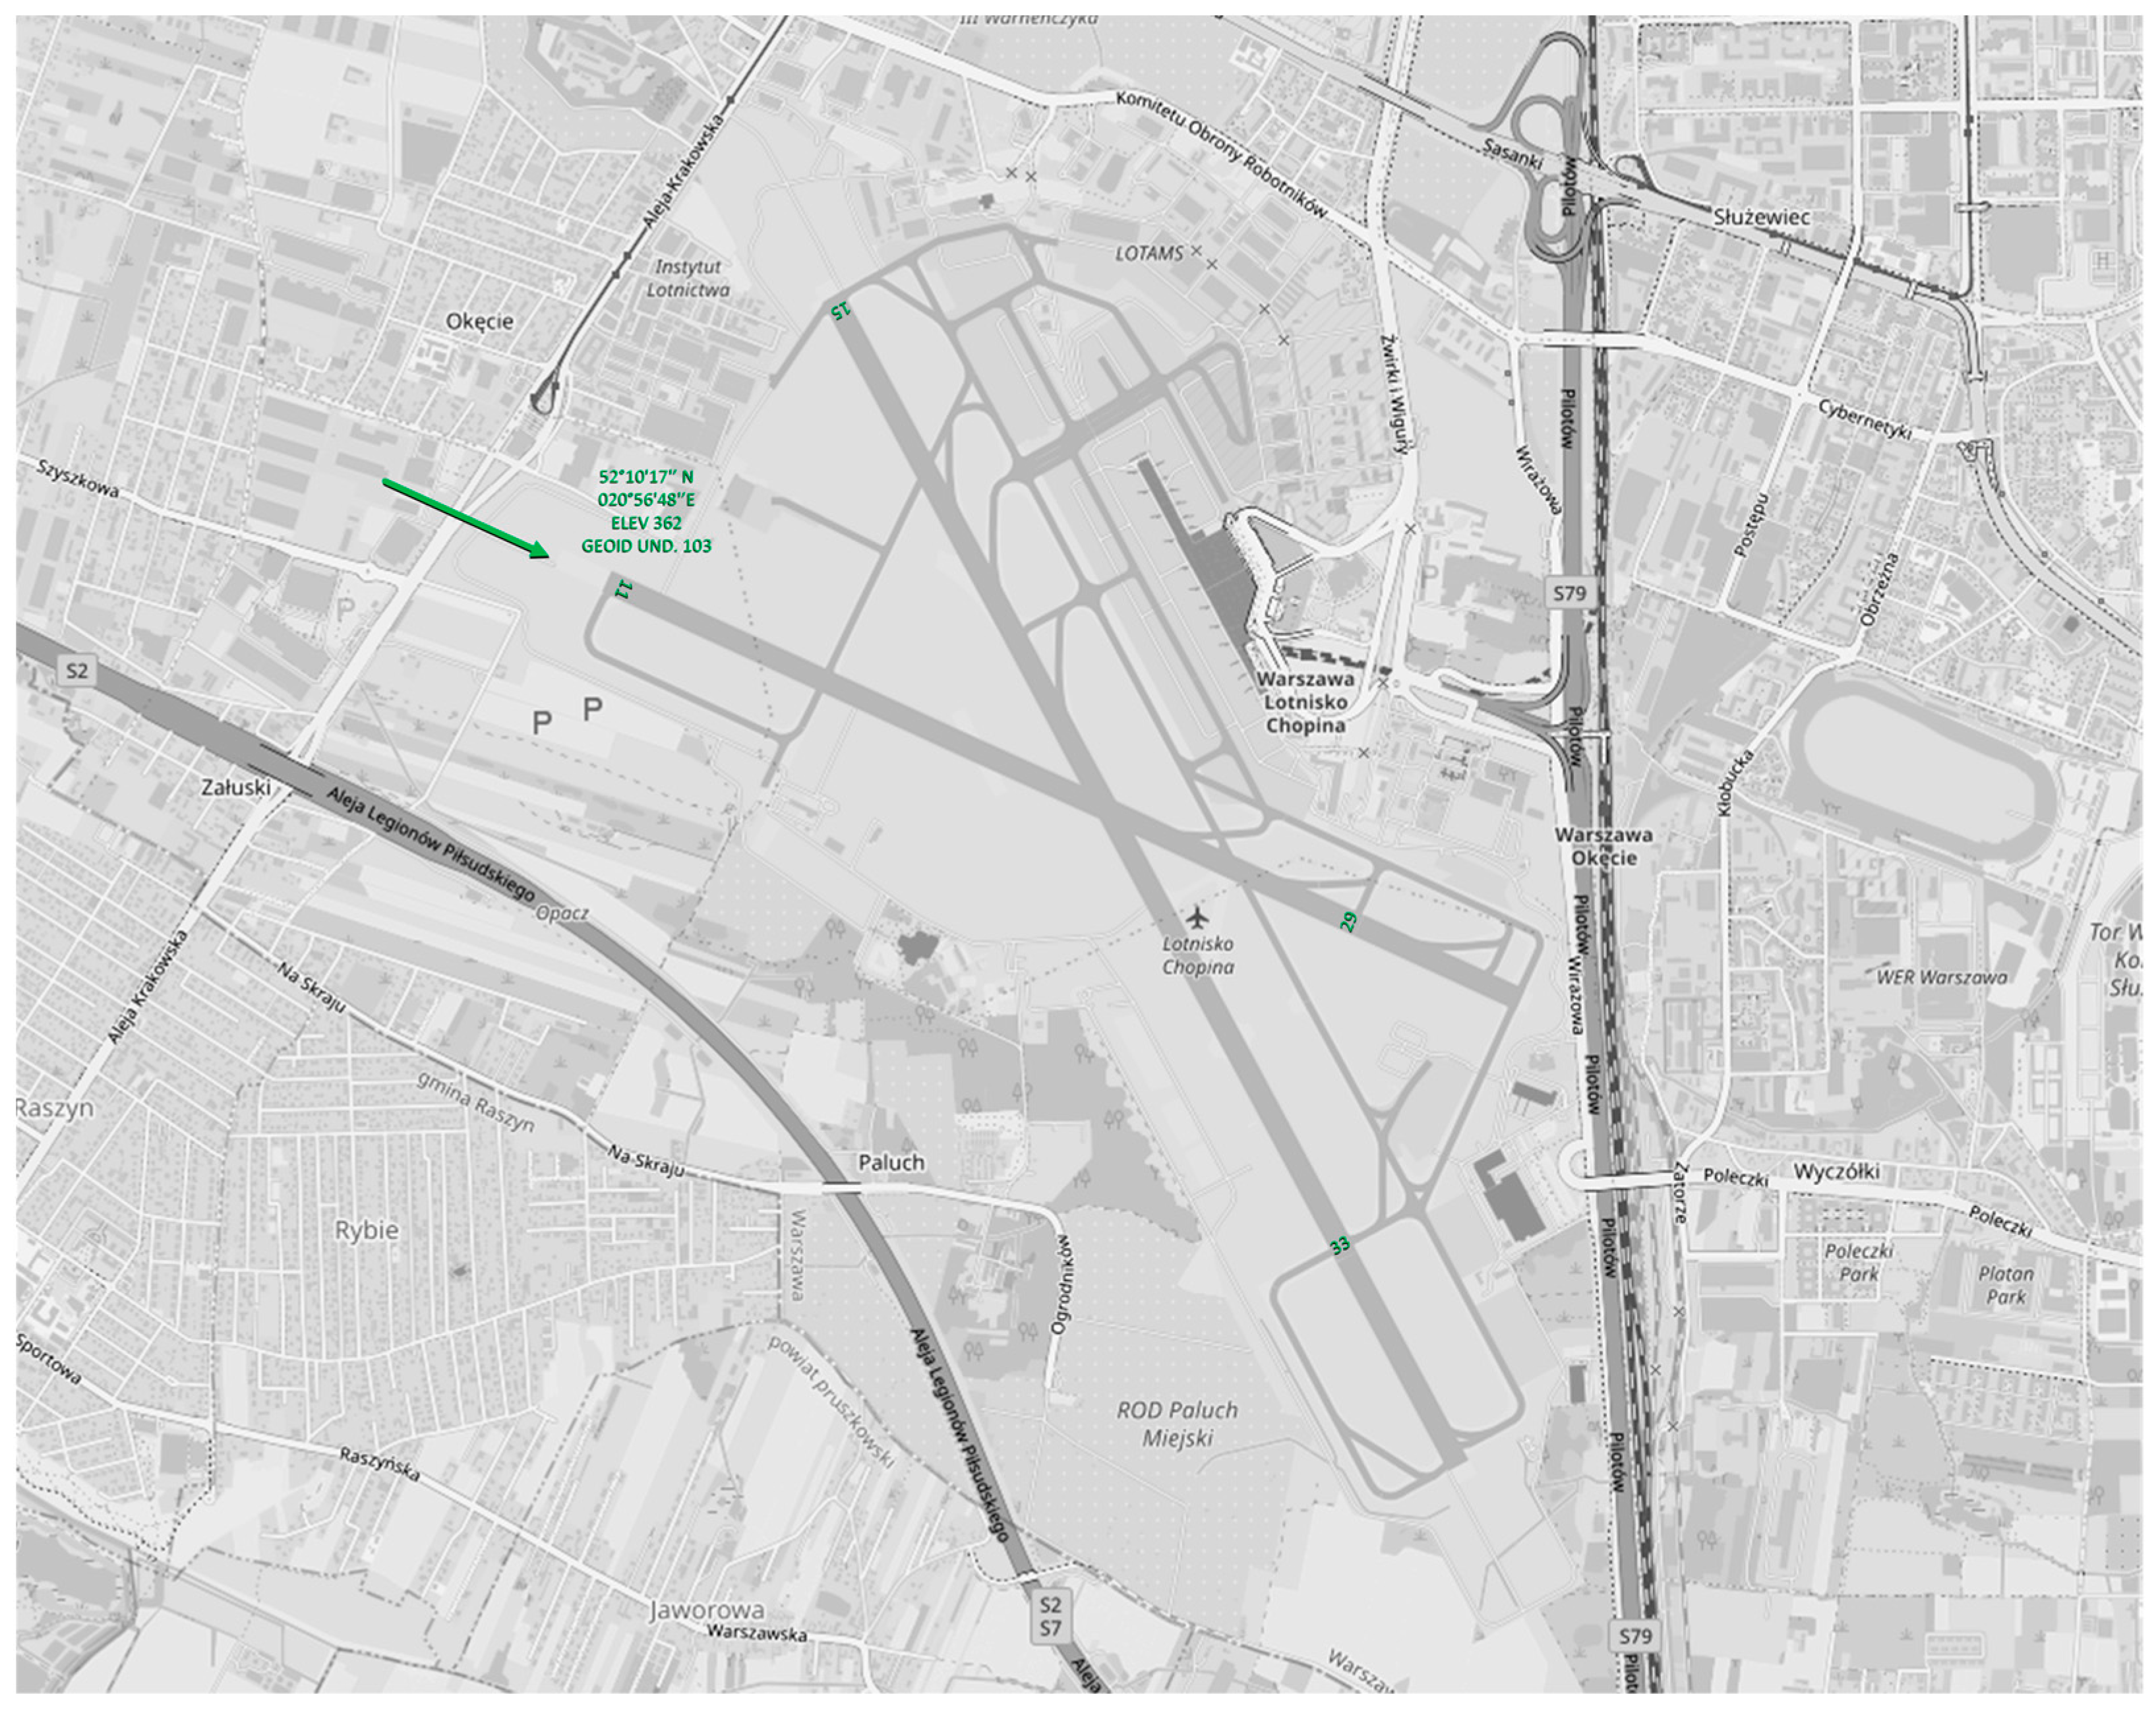
The choice of Warsaw Chopin Airport airspace (
Figure 2) was driven by its high traffic density and therefore the ease in obtaining the appropriate data. The airport features two intersecting runways: 11/29 and 15/33 [
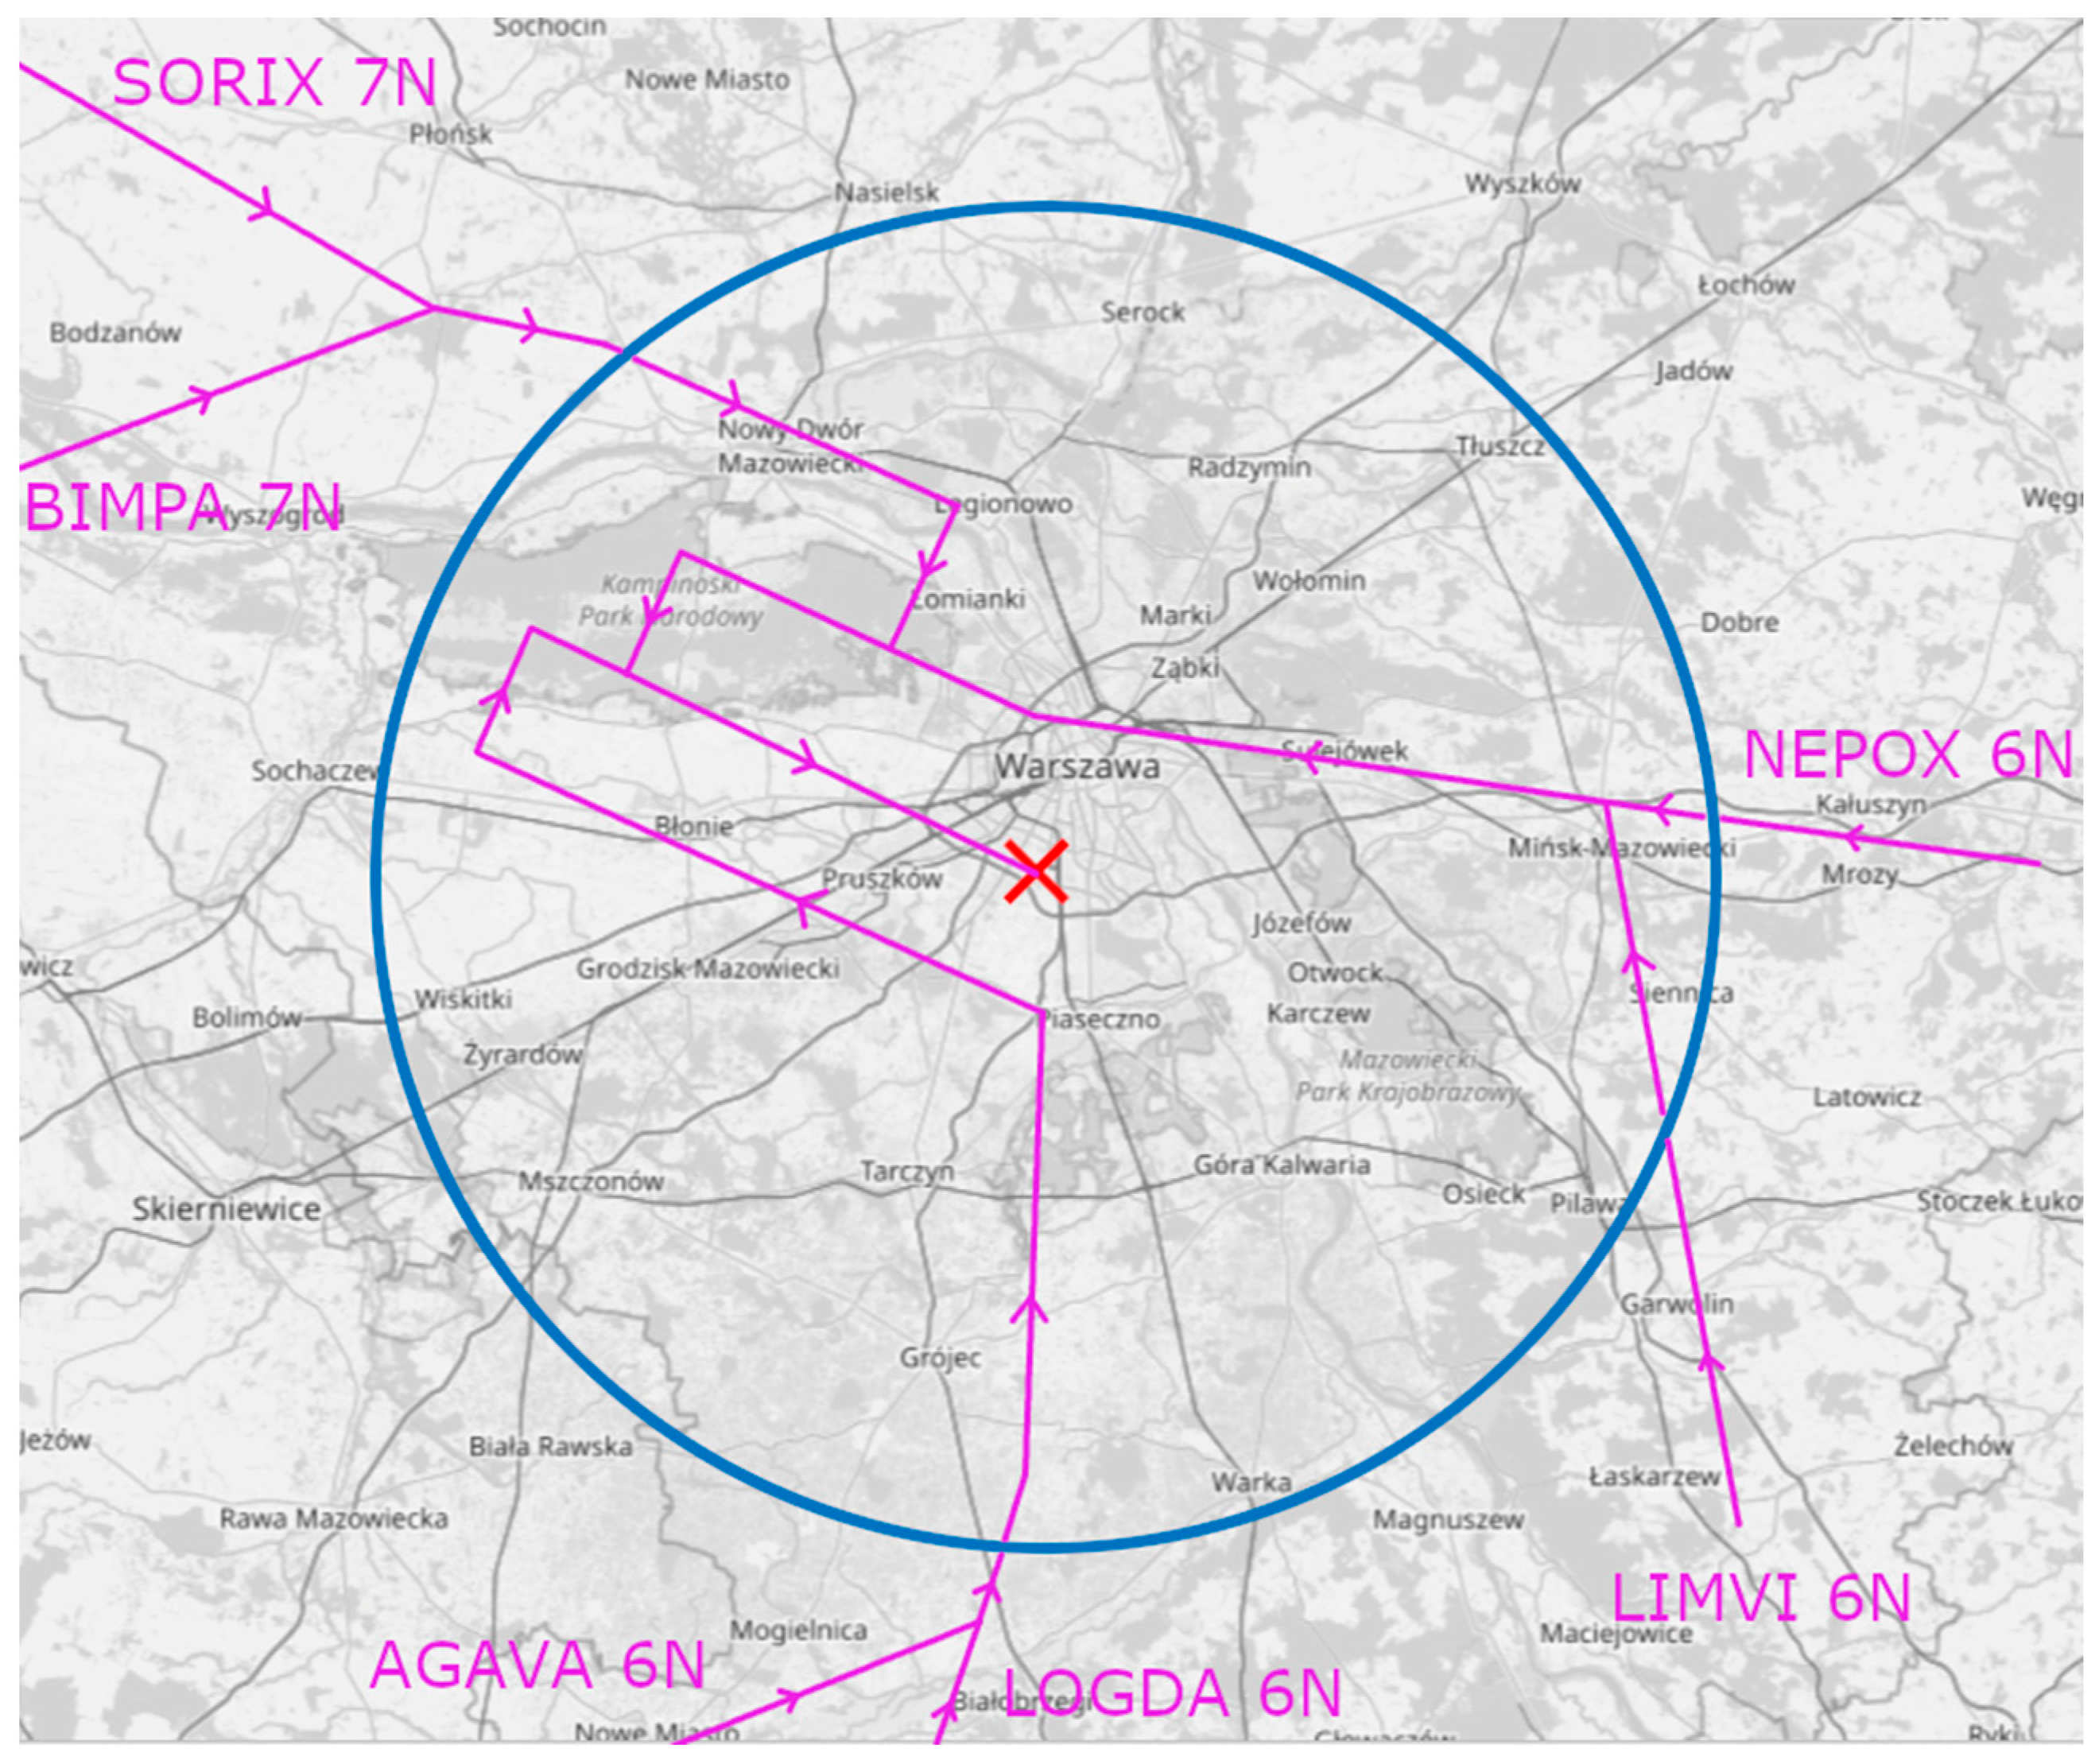
29]. The decision to analyze arrivals to RWY11 was based on the prevailing meteorological conditions (wind direction) at the time of data acquisition. There are six Standard Instrument Arrivals (STARs) to RWY11 [
30]: SORIX 7N, BIMPA 7N, NEPOX 6N, LIMVI 6N, AGAVA 6N, LOGDA 6N. To simplify the calculations, it was assumed that the analyzed space is a circle with a radius of 25 NM and the center at the ARP (Aerodrome Reference Point) of EPWA airport (Warsaw Chopin Airport) (
Figure 3).
For RWY11, the available approach procedures [
29] are ILS (Instrument Landing System), VOR (Very High Frequency Omnidirectional Radio Range), and RNP (Required Navigation Performance). These approaches differ in the navigation aids used, but the nominal flight paths remain very similar. In most cases, the turn to the final approach is performed using radar vectoring [
29]. The final approach segment has a standard 3° glidepath.
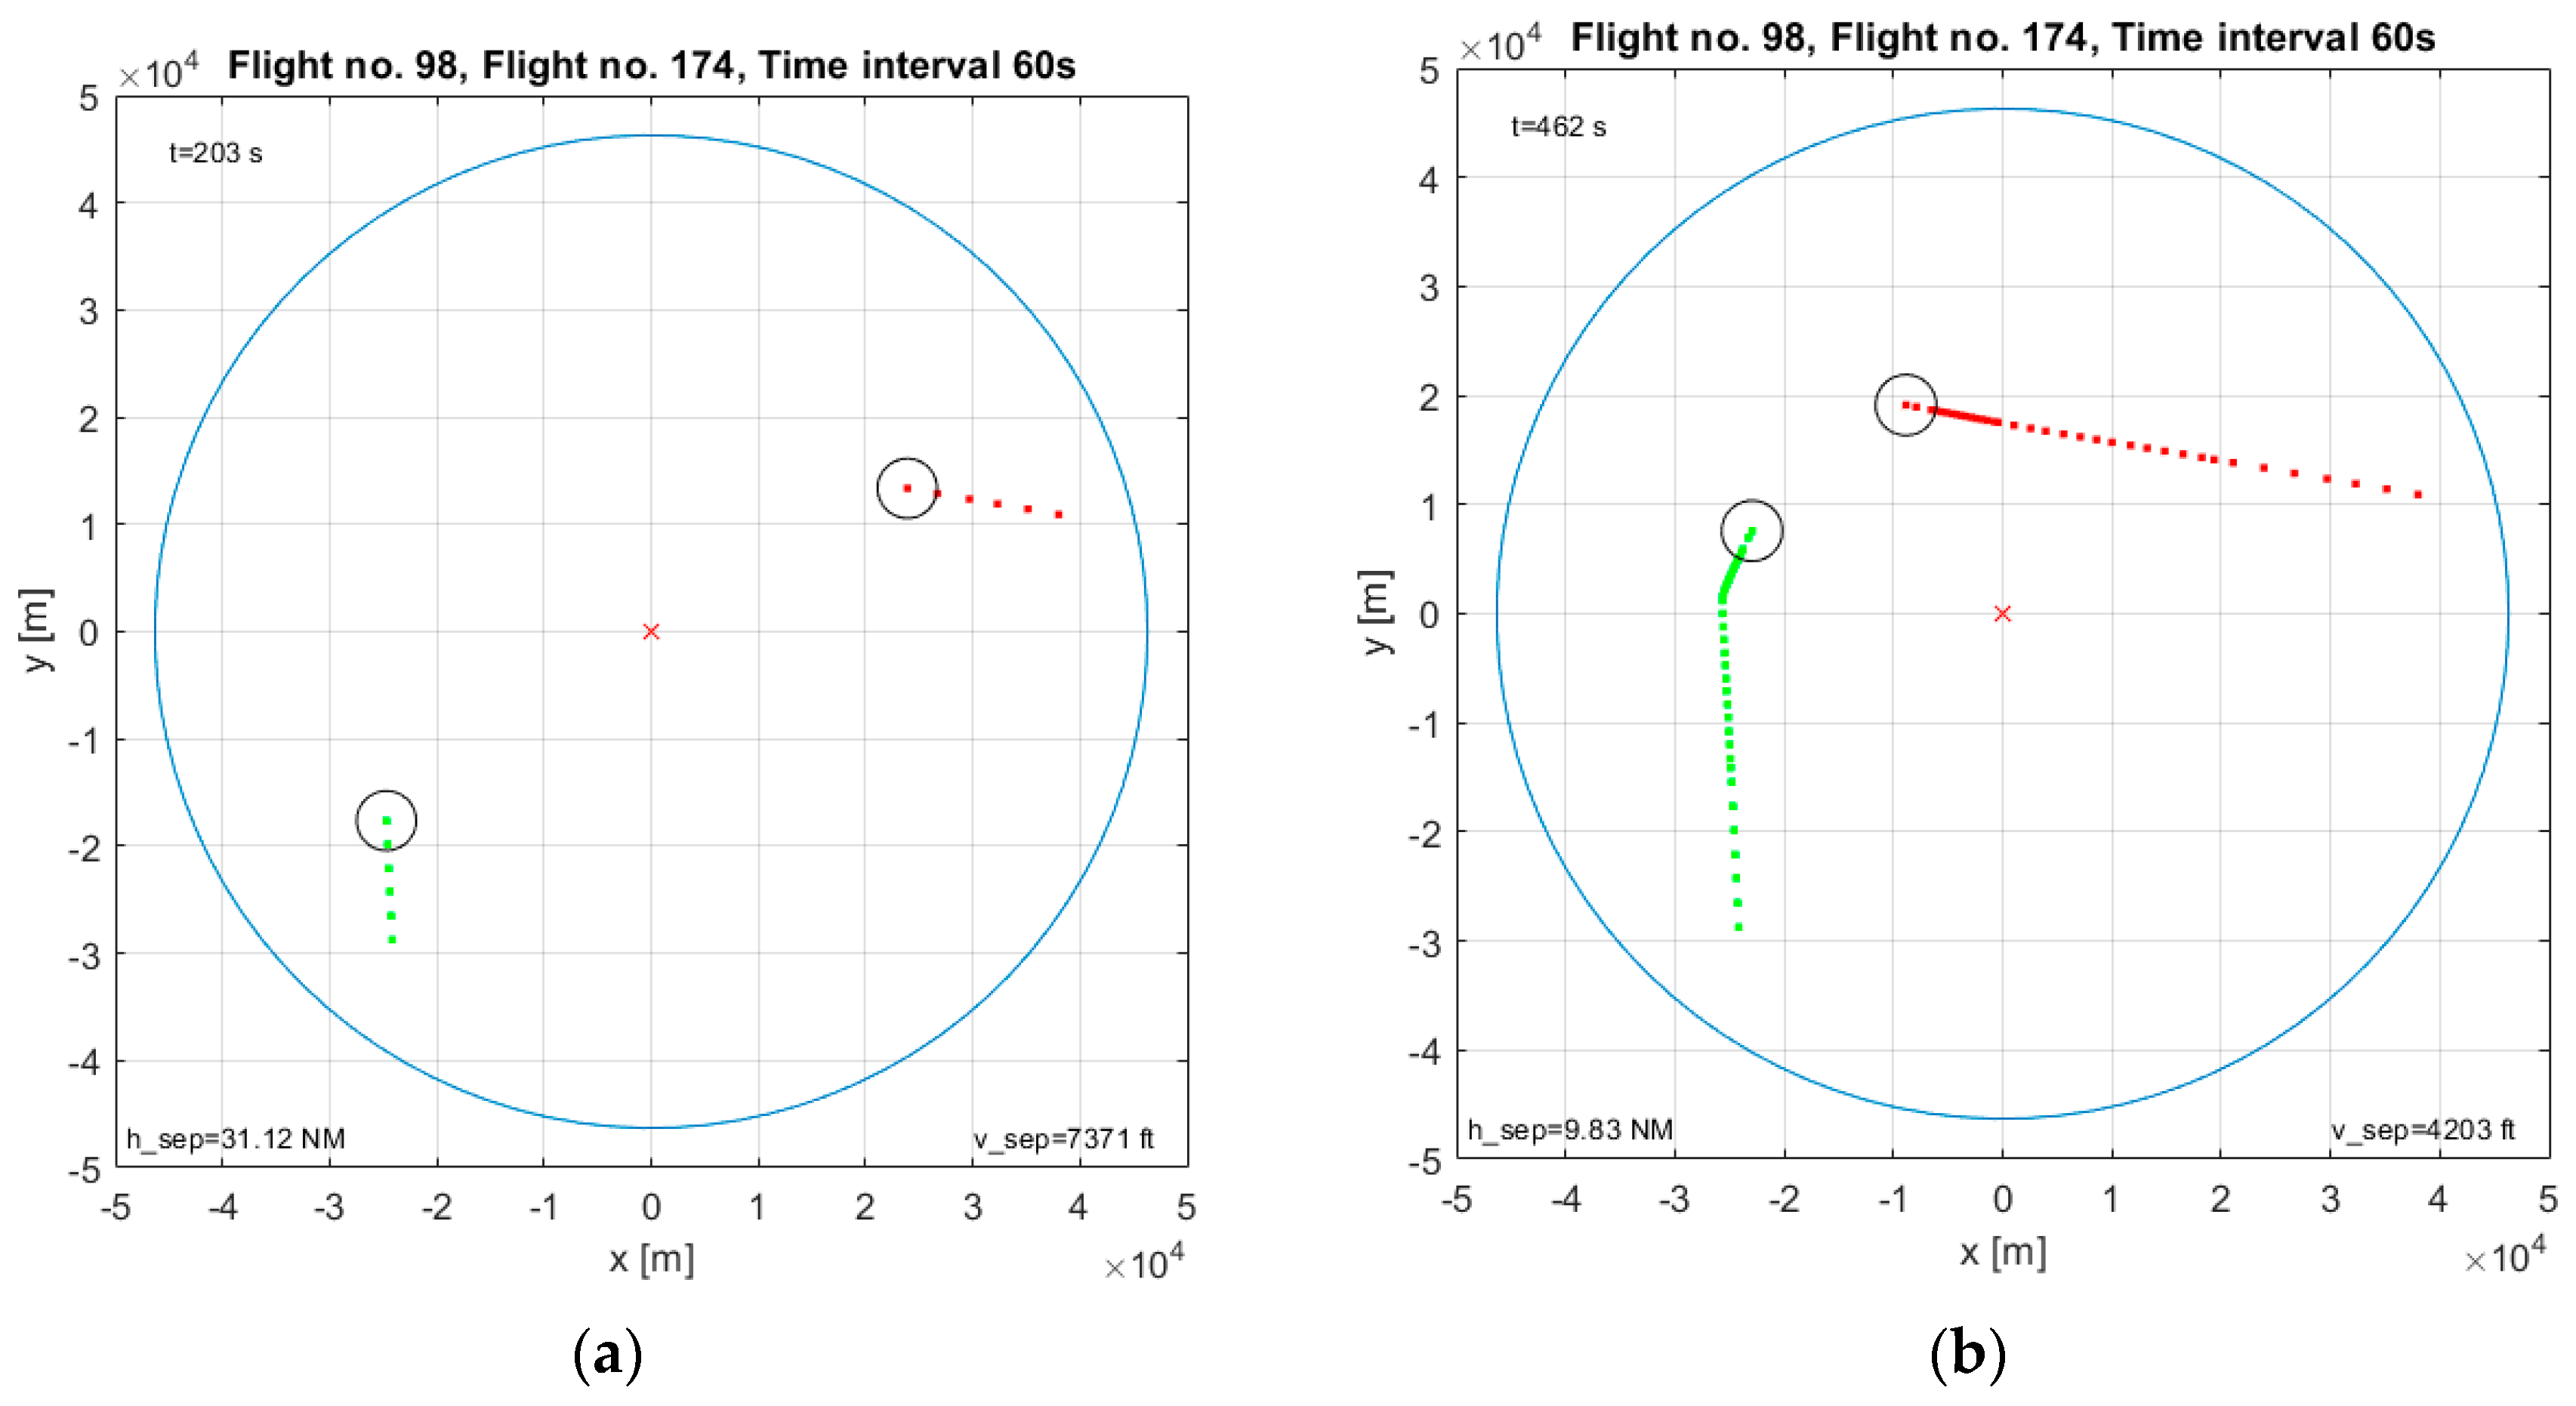
It is important that, whenever possible, the air traffic control service ensures that flights follow the shortest direct route or use shortcuts, especially during off-peak hours [
29]. As a result, the expected flight paths may differ significantly from the standard ones. This is evident in the sample visualizations of arrivals in the non-conflict case (without loss of separation) and conflict case (with reduced separation) shown in
Figure 4 and
Figure 5, respectively. In this context, a loss of separation refers to a reduction in horizontal separation to below 3 NM, along with a simultaneous reduction in vertical separation to below 1000 ft. The visualizations include the boundaries of the analyzed airspace (blue circle), the EPWA airport ARP (red cross), and the subsequent positions of both aircraft (marked with dots). The aircraft positions are surrounded by circles with a radius equal to half the minimum horizontal separation (1.5 NM); the intersection of these circles indicates that the distance between the aircraft is below the minimum horizontal separation. The aircraft that first crossed the area boundary is marked in green, while the second one is marked in red. The quantities
h_sep and
v_sep denote the current horizontal and vertical separation, respectively, while
t represents the time measured from the beginning of the simulation.
In the non-conflict case (
Figure 4), standard arrival routes were not utilized. Throughout the simulation, horizontal separation remained at least 7 NM, and vertical separation was at least 2000 ft, ensuring no loss of separation.
In the conflict case (
Figure 5), a loss of separation occurred as both aircraft were turning for final approach, with only 2.9 NM of horizontal separation and 413 ft of vertical separation. From that point onward, the approach continued with a loss of separation.
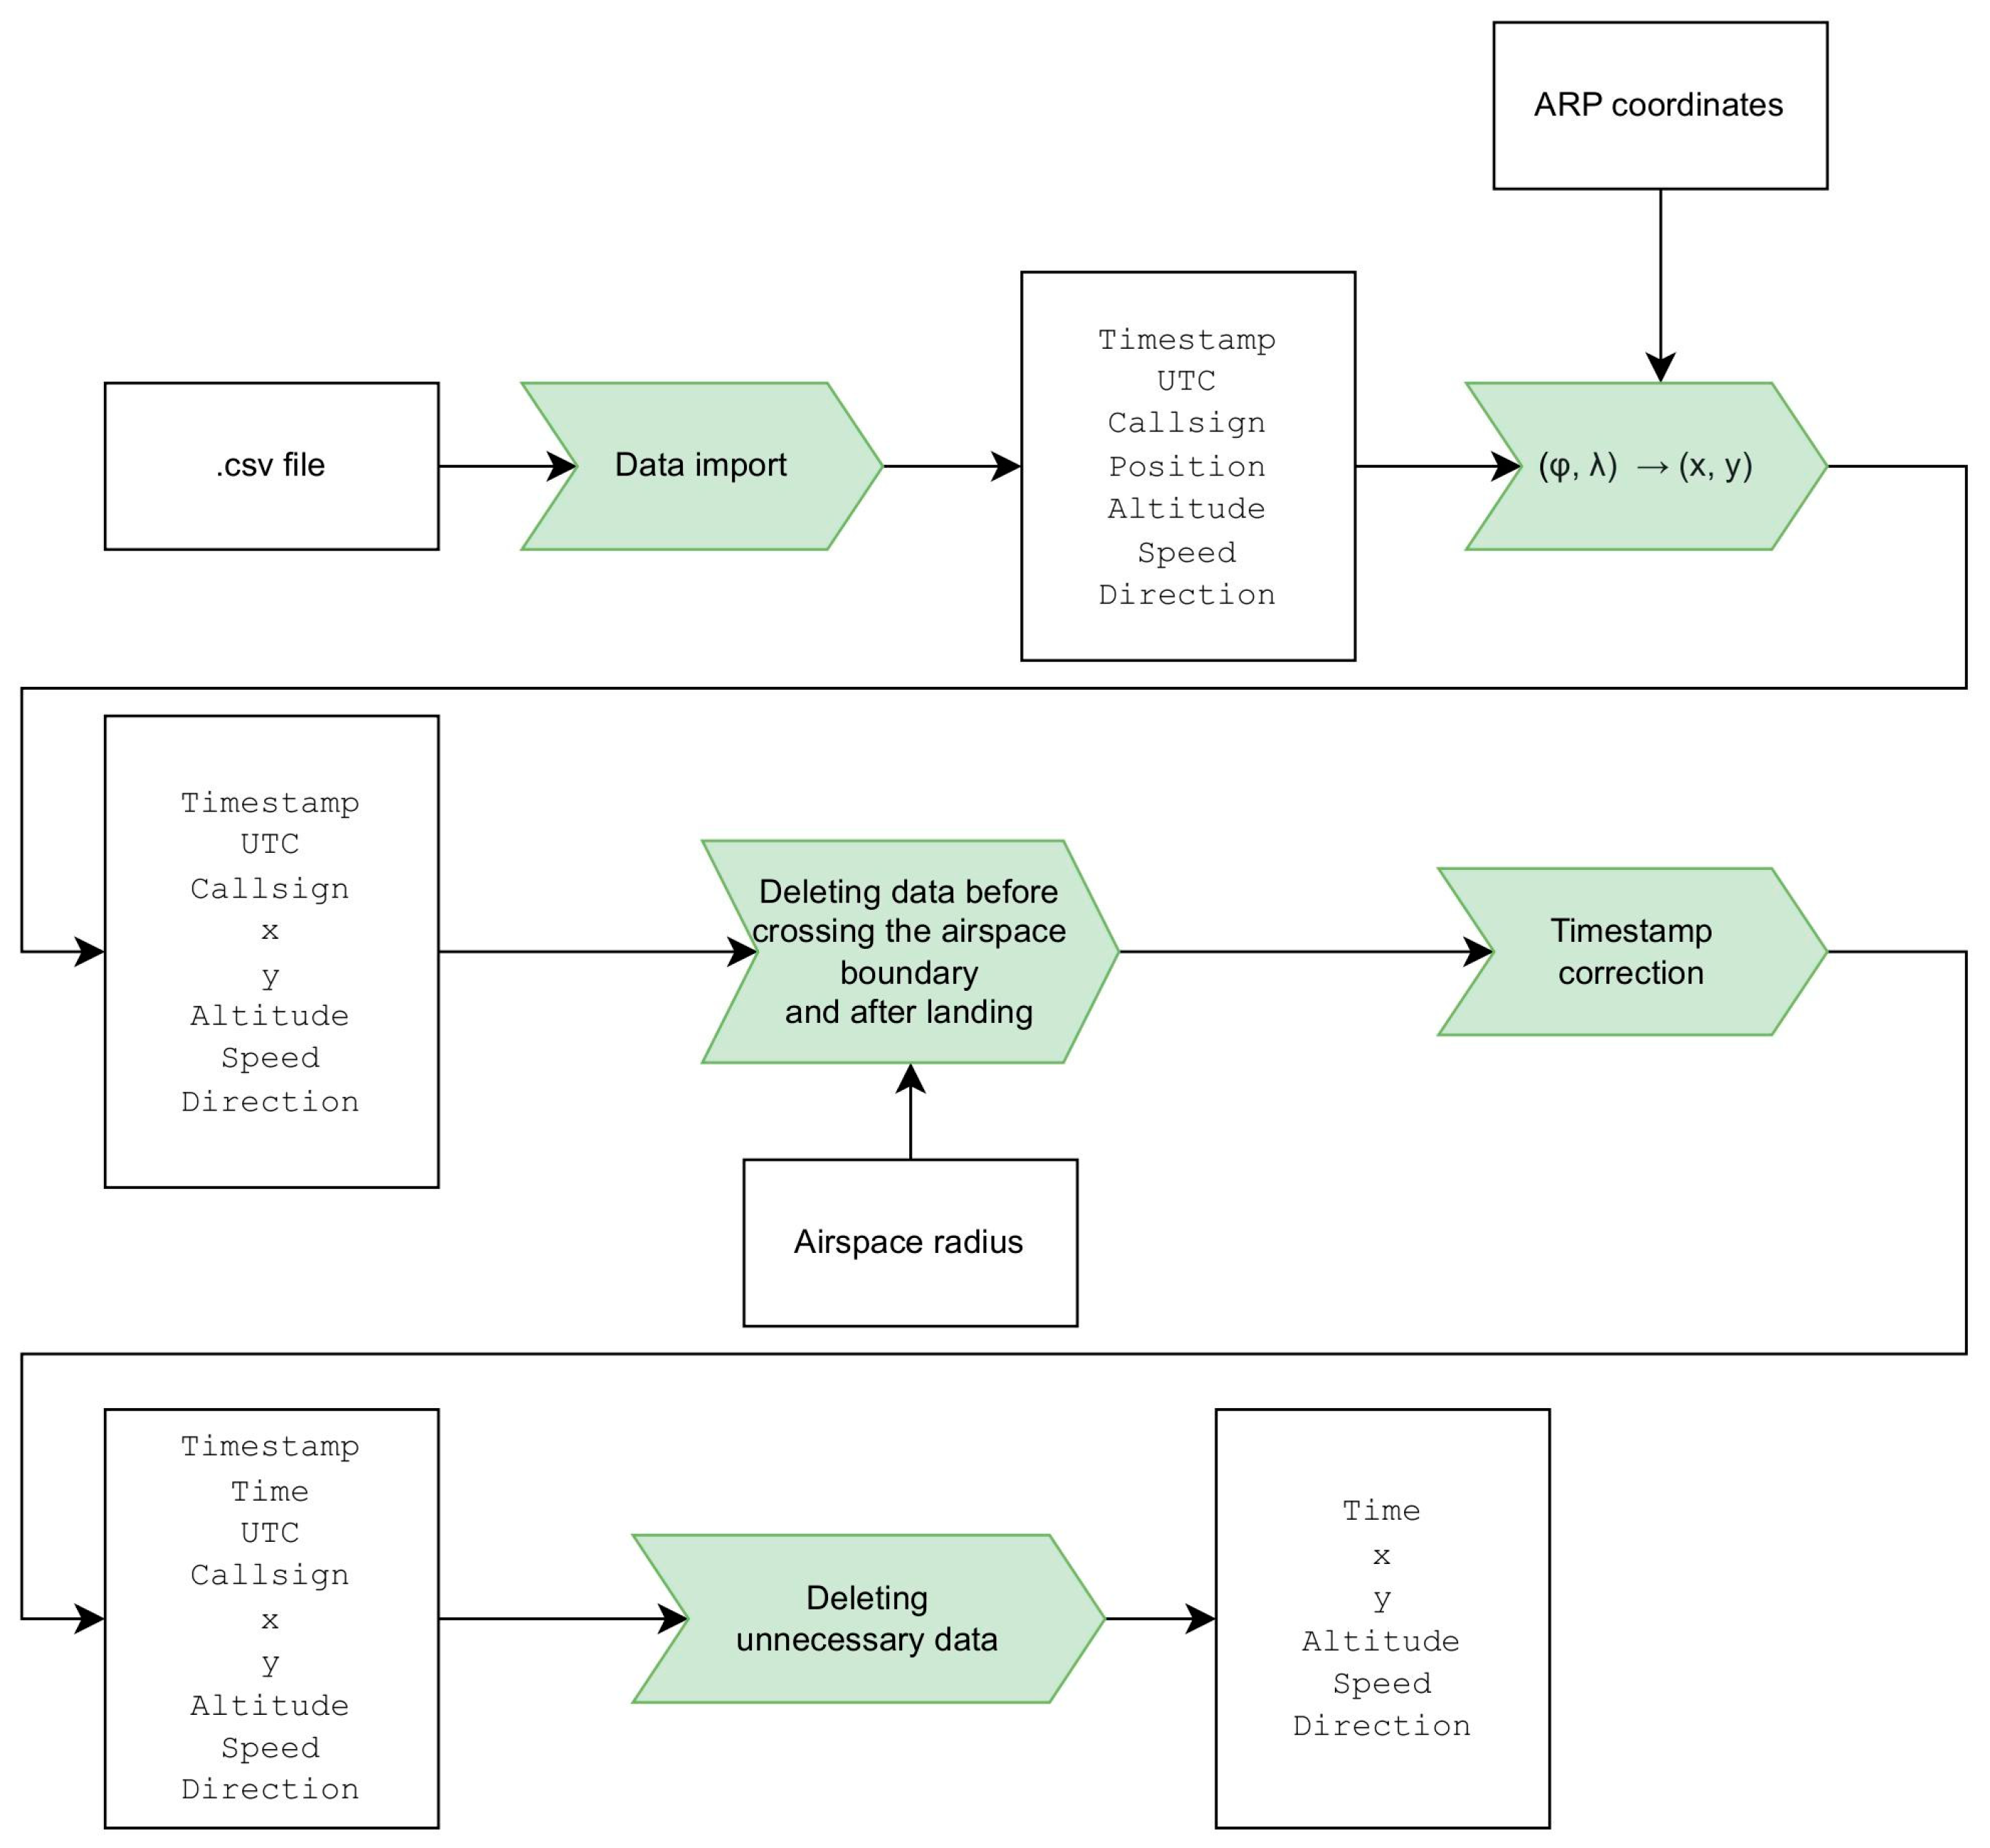
The first stage of the system development process involves normalizing the data describing aircraft trajectories to extract the segment relevant to the warning system—specifically, from the moment the aircraft crosses the boundary of the analyzed airspace until landing. The source of flight trajectory data is the Flightradar24 website, which collects information from over 40,000 ADS-B receivers worldwide [
33]. These data can be downloaded in .csv format. The file includes the timestamp (
Timestamp), UTC date and time (
UTC), aircraft callsign (
Callsign), position coordinates (
Position), pressure altitude (
Altitude), groundspeed (
Speed), and course (
Direction). The time interval between successive lines in the file is not constant, typically ranging from a few to several seconds while the aircraft is in flight.
The parameters of the analyzed airspace are circle radius (25 NM) and ARP coordinates of the EPWA airport [
29] (52°09′57″ N 020°58′02″ E).
Normalization of the data describing trajectories (applies to Timestamp and Position values) included the following steps:
Importing data from a .csv file into the workspace;
Transforming geographic coordinates (angular values) into Cartesian coordinates (linear values), with the ARP as the center of the coordinate;
Identifying the moments when the aircraft crosses the airspace boundary and lands;
Removing data describing the trajectory before crossing the airspace boundary and after landing;
Adjusting the time stamp so that the moment of crossing the boundary of the analyzed area is set to 0.
In this way, the trajectory of all flights is represented in the Cartesian coordinate system, starting from the moment the aircraft crosses the analyzed airspace. In the subsequent stages, the following data are used:
Time from the moment of crossing the analyzed area (Time);
Coordinates (x, y);
Pressure altitude (Altitude);
Speed relative to the Earth (Speed);
Course (Direction).
The process described above is illustrated in the flowchart shown in
Figure 6.
The next step is to prepare a dataset for training the ANN. After collecting and normalizing the data describing the trajectories of
flights, the following scenario is simulated: the first aircraft crosses the boundary of the analyzed airspace, a specified time interval passes, and the second aircraft crosses the boundary. Both aircraft continue along their respective trajectories. If separation is lost before either aircraft reaches the ground, the case is classified as 1 (conflict). If separation is maintained, the case is classified as 0 (no conflict). As previously stated, a loss of separation occurs when horizontal separation is reduced to below 3 NM while vertical separation simultaneously drops below 1000 ft. The flowchart of the described algorithm is shown in
Figure 7.
After running the simulation for
flights and
different values of the time interval, the total number of training examples is given by the equation:
These data are stored in matrices, each of size , referred to as “conflict matrices”. The row number corresponds to the first flight (the aircraft that crosses the airspace boundary first), while the column number corresponds to the second flight (the aircraft that crosses the boundary second). Each cell contains either 0 or 1, as described earlier. In the tested program variant, delay values were used: 0, 30, 60, and 90 s. For and , this results in 10,000 and 160,000 training examples, respectively.
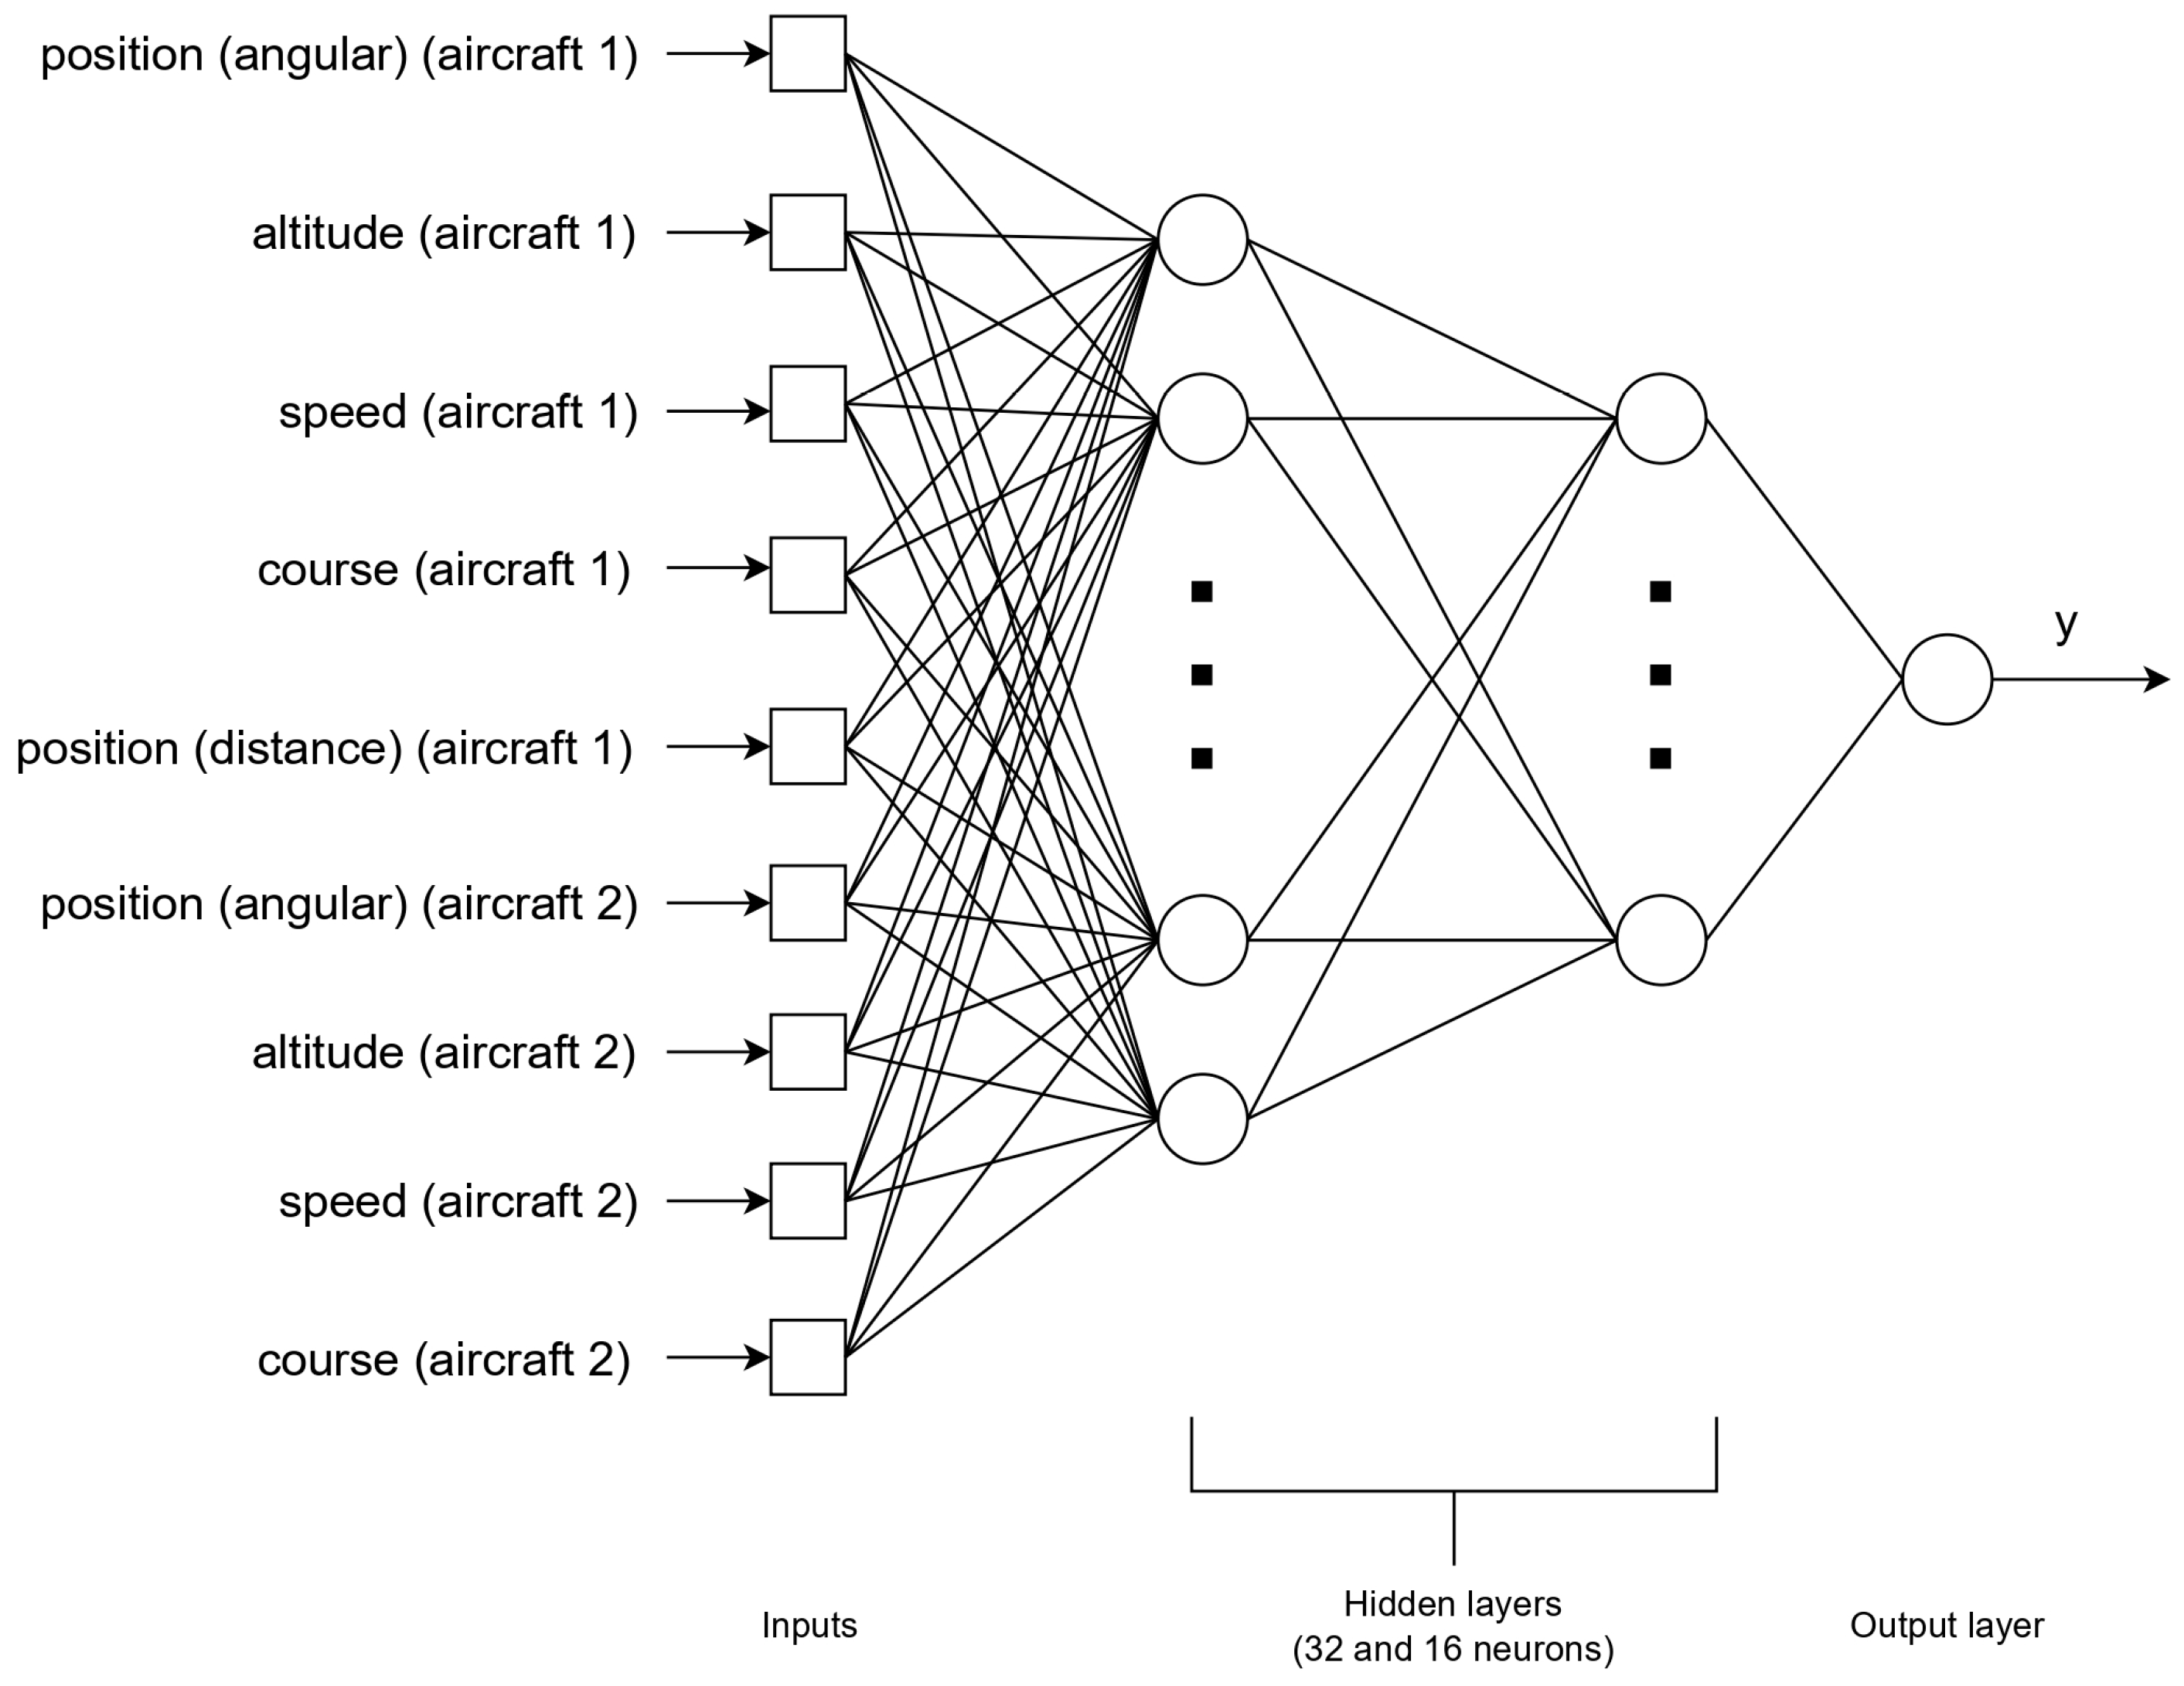
The neural network has 9 inputs, representing the following parameters at the moment the second aircraft crosses the boundary of the analyzed airspace: position (angular), altitude, speed and course of both aircraft, and distance of the first aircraft from the ARP. The distance of the second aircraft from the ARP is always equal to the radius of the analyzed airspace, so it does not need to be included as an additional input. The initial parameters described above were transformed into 9
-element input data vectors, corresponding to each of the
n examples. As stated in [
28], before training the neural network, all input data from the training set must be normalized to the range [0, 1]. Each value was normalized using the following general equation:
From the conflict matrices, an -element vector of correct responses (consisting of 0 and 1) was created. The training examples are provided to the network in the following form:
Input data: 9 -element vectors representing the initial parameters, normalized to the range [0, 1];
Output data: an -element vector containing correct responses (0 or 1).
The key element in creating a system is the neural network training process. Before starting the training process, it is necessary to define the appropriate parameters for the network structure and its training. The following basic parameters are included:
Network architecture;
Number of hidden layers and the neurons within them;
Activation functions used in the hidden layers;
Activation function used in the output layer;
Cost function;
Training algorithm;
Algorithm for dividing the input data into subsets: training data set, validation data set, and testing data set.
Considering the complexity of the problem and the suggestions in [
28], a feedforward network with 32 neurons in the first hidden layer and 16 neurons in the second hidden layer was selected. The network diagram is shown in
Figure 8.
The default hyperbolic tangent sigmoid function was retained as the activation function in the hidden layers. The default linear function in the output layer was changed to a hyperbolic tangent sigmoid function based on the recommendations in [
28], which suggest using log-sigmoid or hyperbolic tangent sigmoid functions for classification problems. The training process was conducted using the Levenberg–Marquardt algorithm, which is recommended for its fast convergence (fastest among the algorithms available in the Deep Learning Toolbox) [
28]. The applied parameters for the algorithm included an initial
(Mu) value of 0.001, a decrease ratio (
) of 0.1, and an increase ratio (
) of 10, where
values control the learning rate adaptation by balancing between gradient descent and Gauss–Newton optimization. The cost function is a measure of the difference between the values predicted by the model (network responses) and the true values. During the training process, the weight coefficients are adjusted to minimize the values of this function [
28]. The default Mean Square Error (MSE) function is retained.
Based on [
34] and the conducted trials, the following division of input data was carried out:
The network training process was conducted using the parameters described above. The indicators and values that can be used to assess the quality of the network’s performance are included in
Section 3. The training processes were carried out for
and
to evaluate the impact of increasing the number of training examples (flights) on the network performance.
The trained network (after the training process) returns a number in the range [0, 1] in response to 9 input data. From the point of view of the practical application of the developed system, it is necessary to convert this numerical value into a warning or its absence of one. Therefore, the threshold value of 0.3 was selected: a network response below 0.3 indicates no warning, while a response above 0.3 triggers a warning. The relatively low threshold value is based on the system’s assumptions regarding its preventive nature.
3. Results
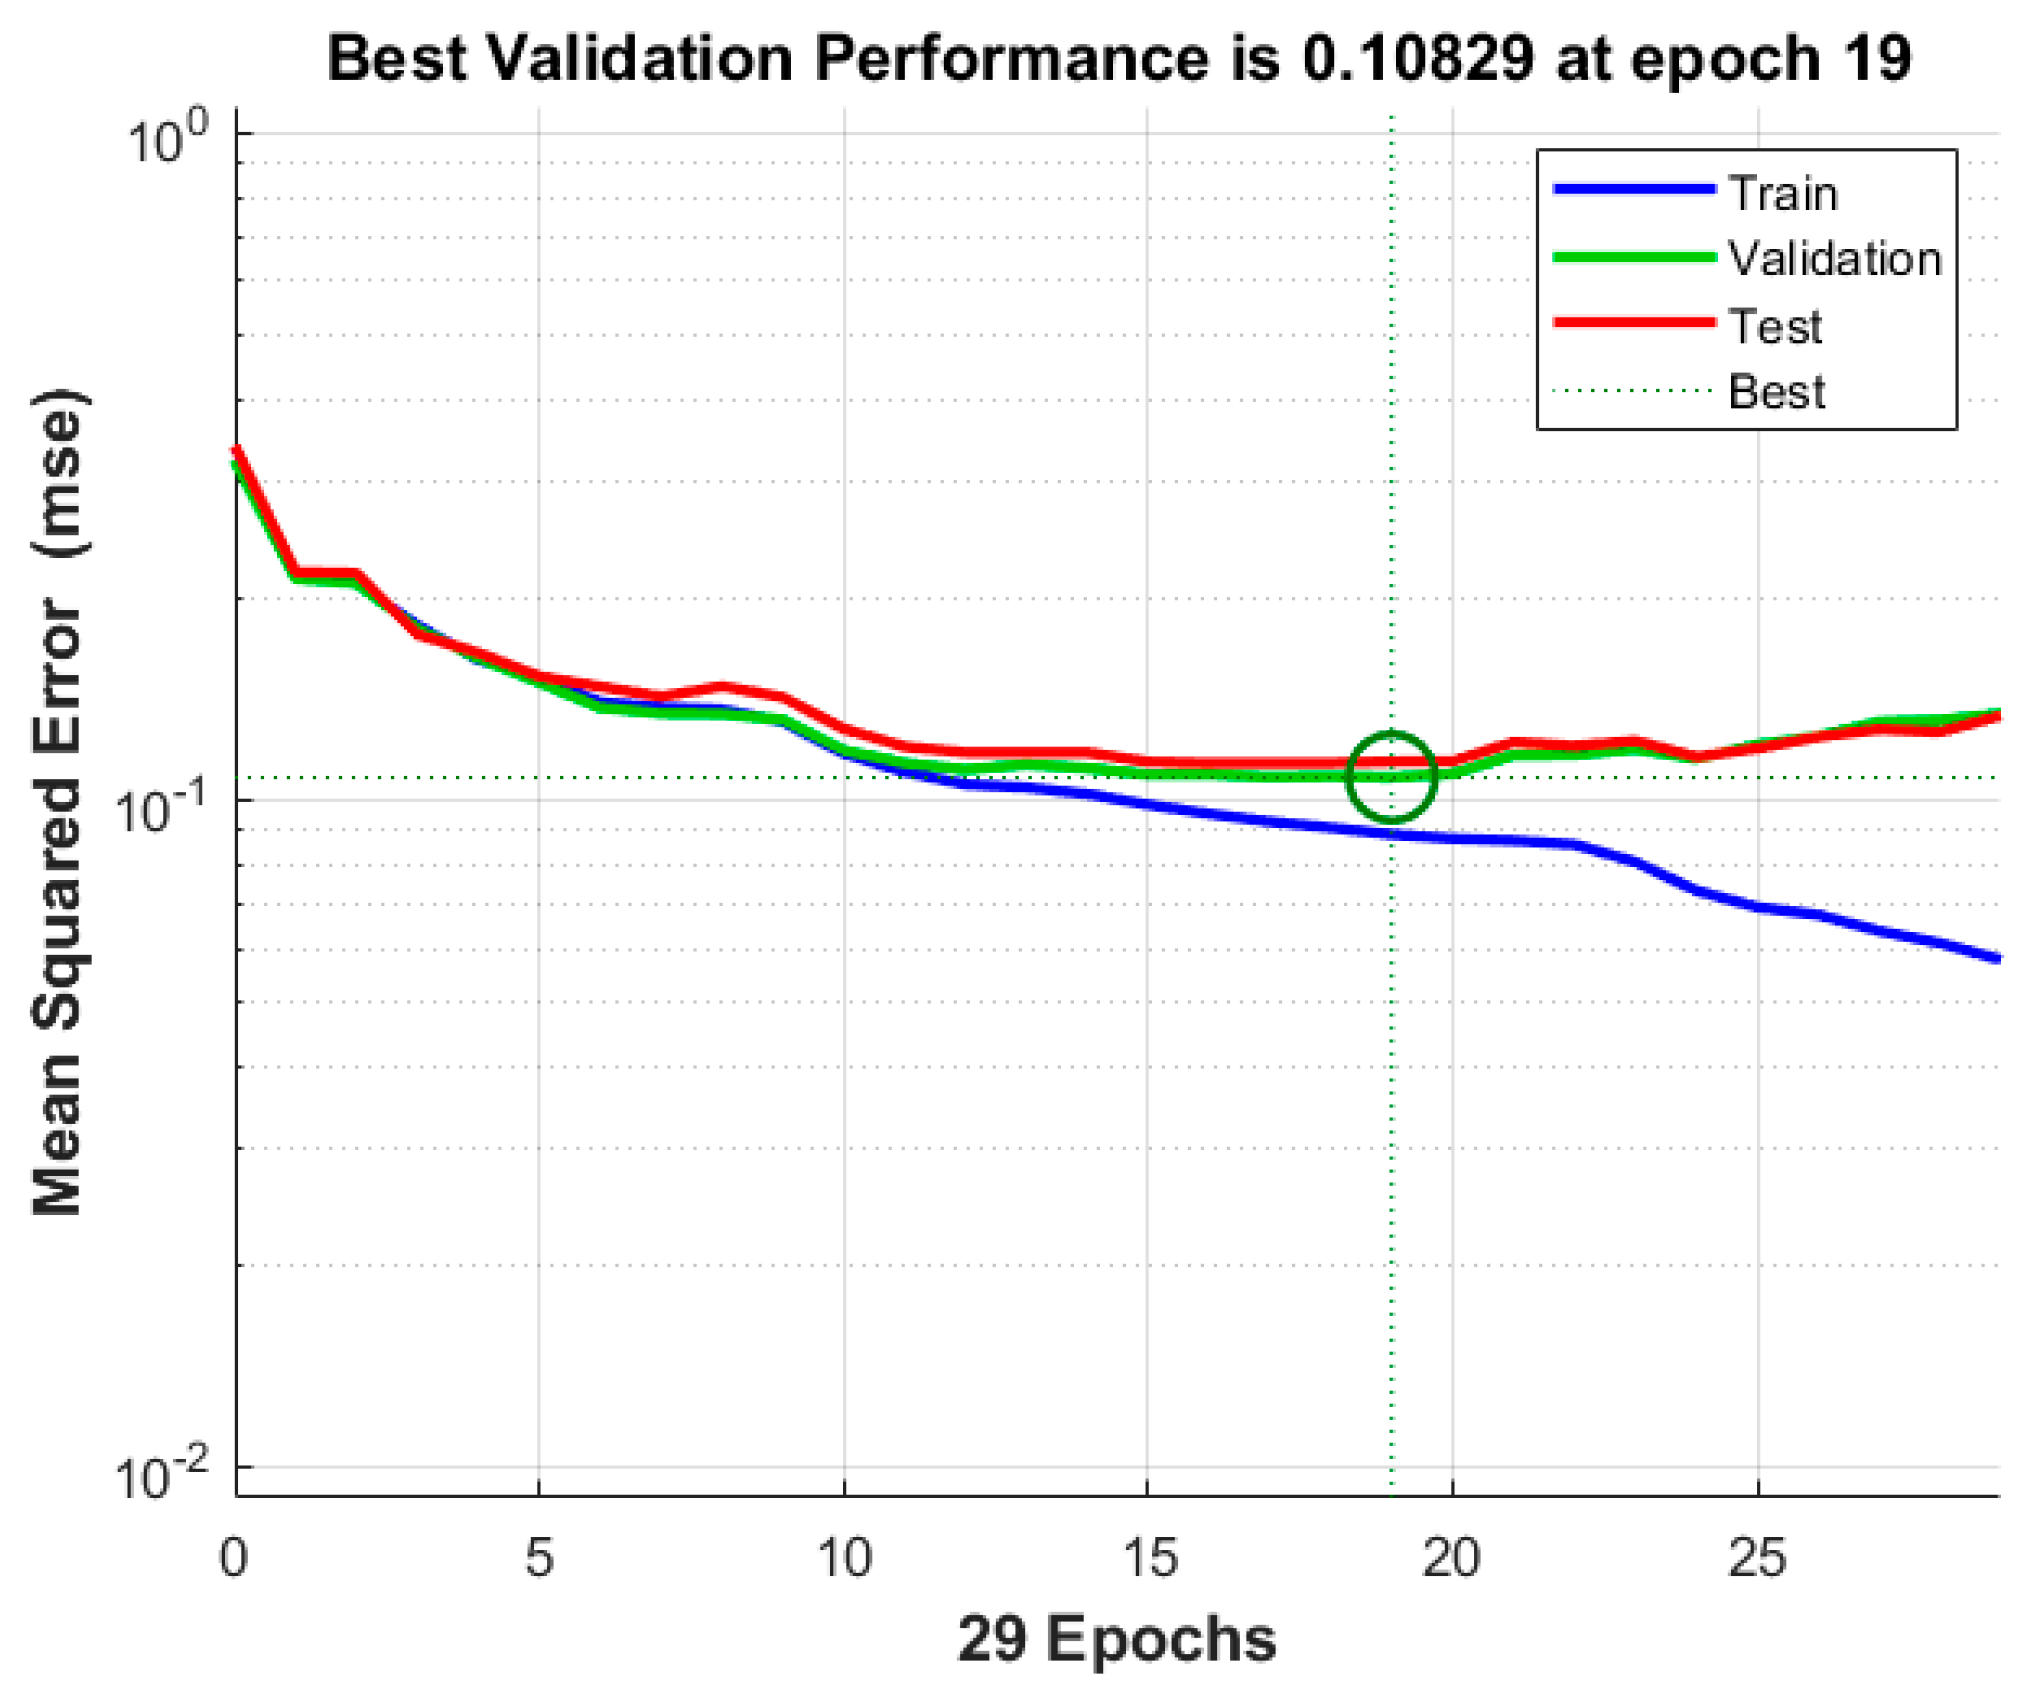
The visualization of the training process for
is presented in
Figure 9 and
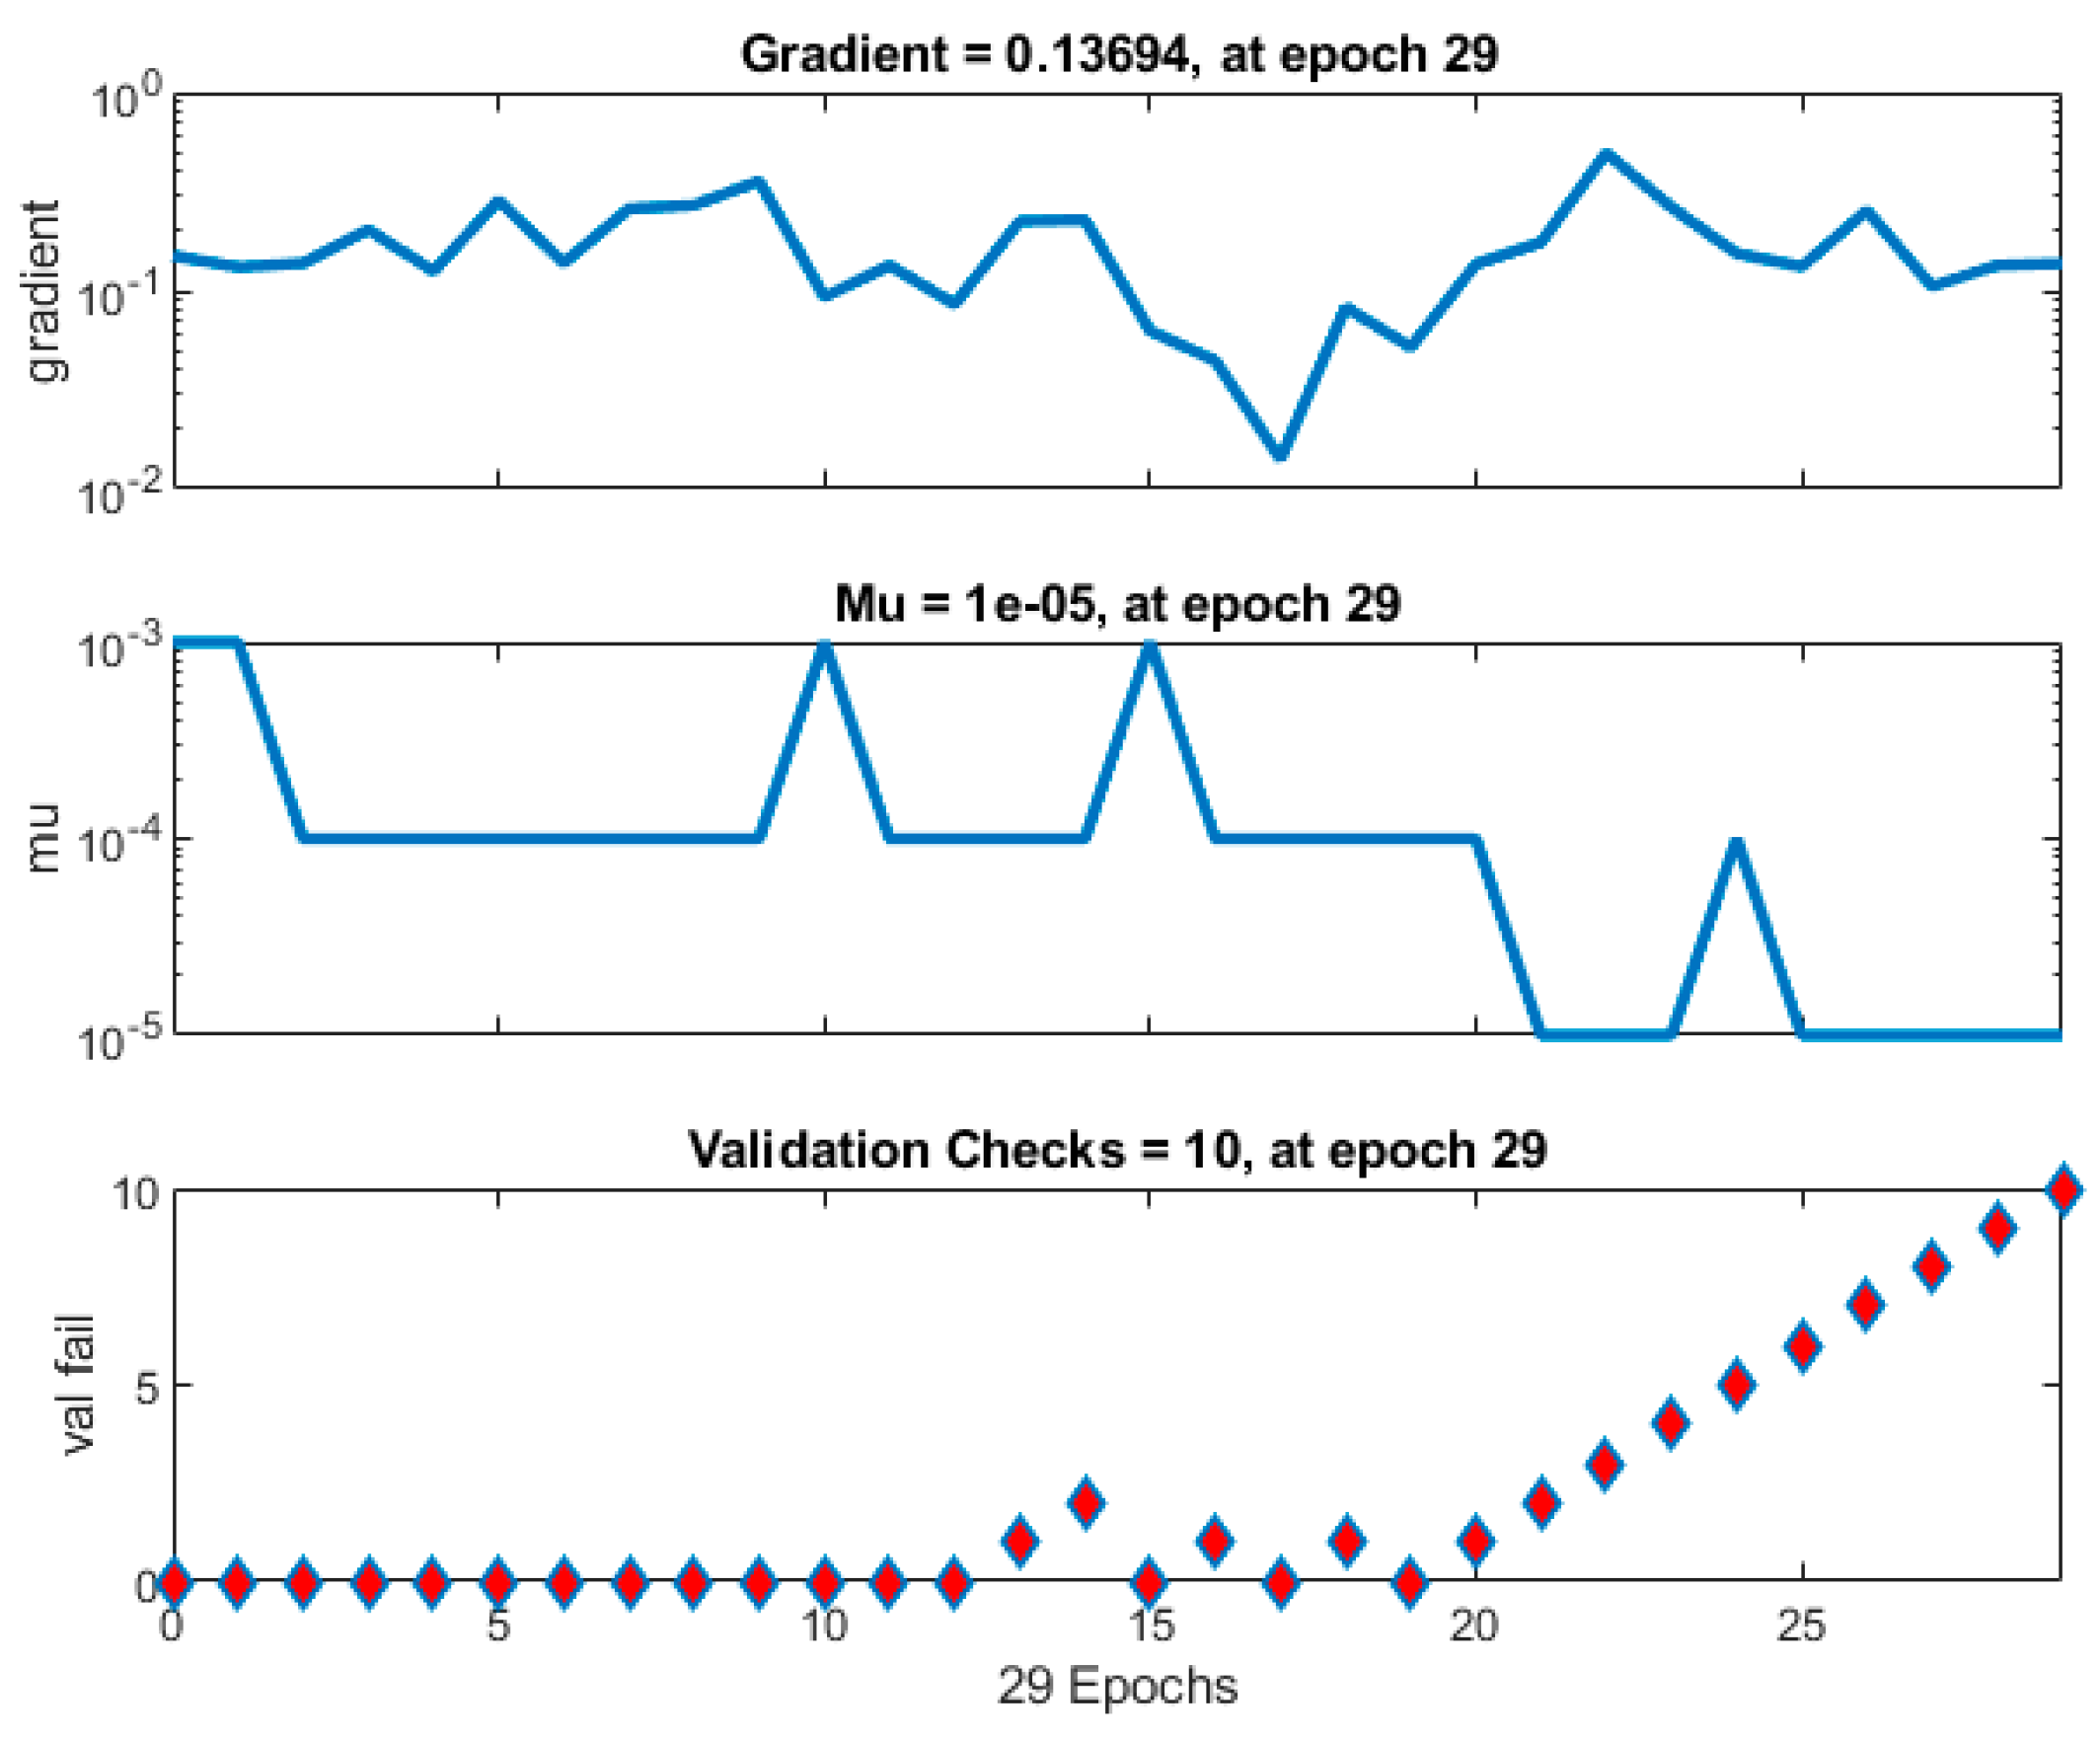
Figure 10.
Figure 8 shows the value of the MSE, which serves as the cost function for each of the three data subsets (training, validation, testing) as a function of the number of epochs. The lowest value of the cost function calculated for the validation data (MSE = 0.10829) and its corresponding epoch no. 19 are marked—this represents the final form of the network used in the remainder of the study.
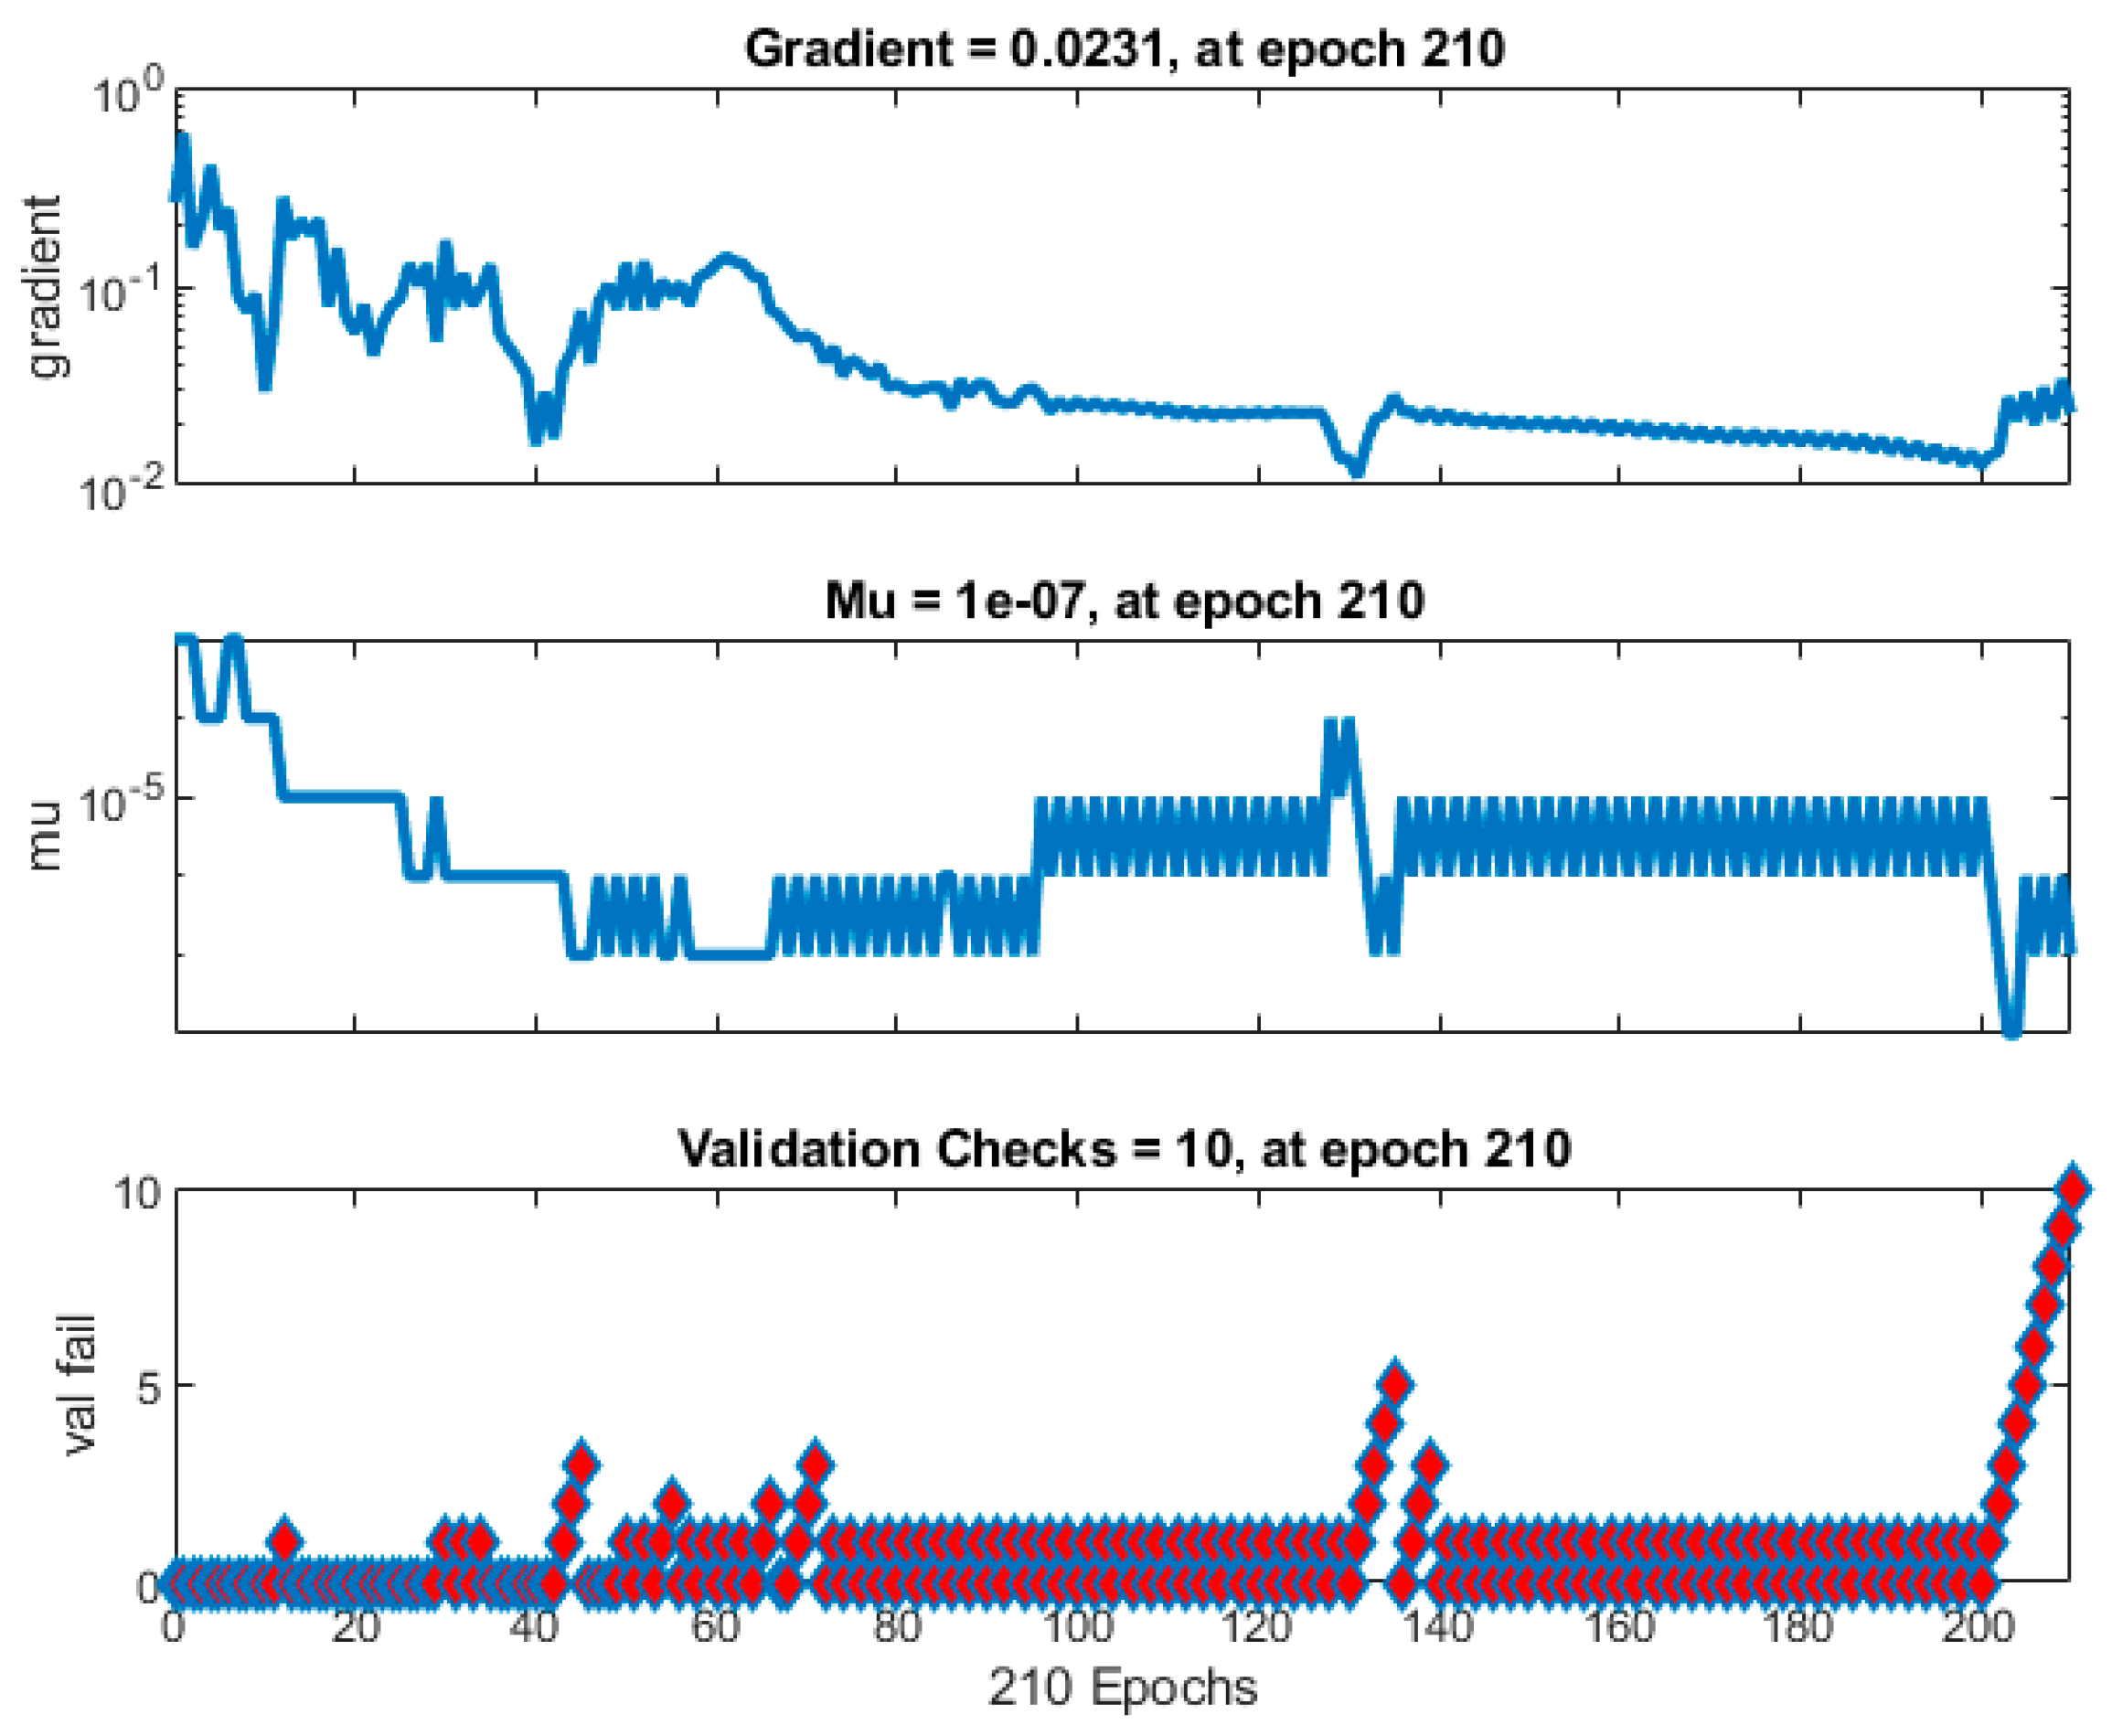
Figure 10 displays the values of Gradient, Mu, and Validation Checks as a function of the number of epochs. The training process was terminated as a result of exceeding the maximum number of failed validation checks, as further training would have led to overfitting the network.
The network’s performance can be assessed by analyzing the graphs in
Figure 11,
Figure 12 and
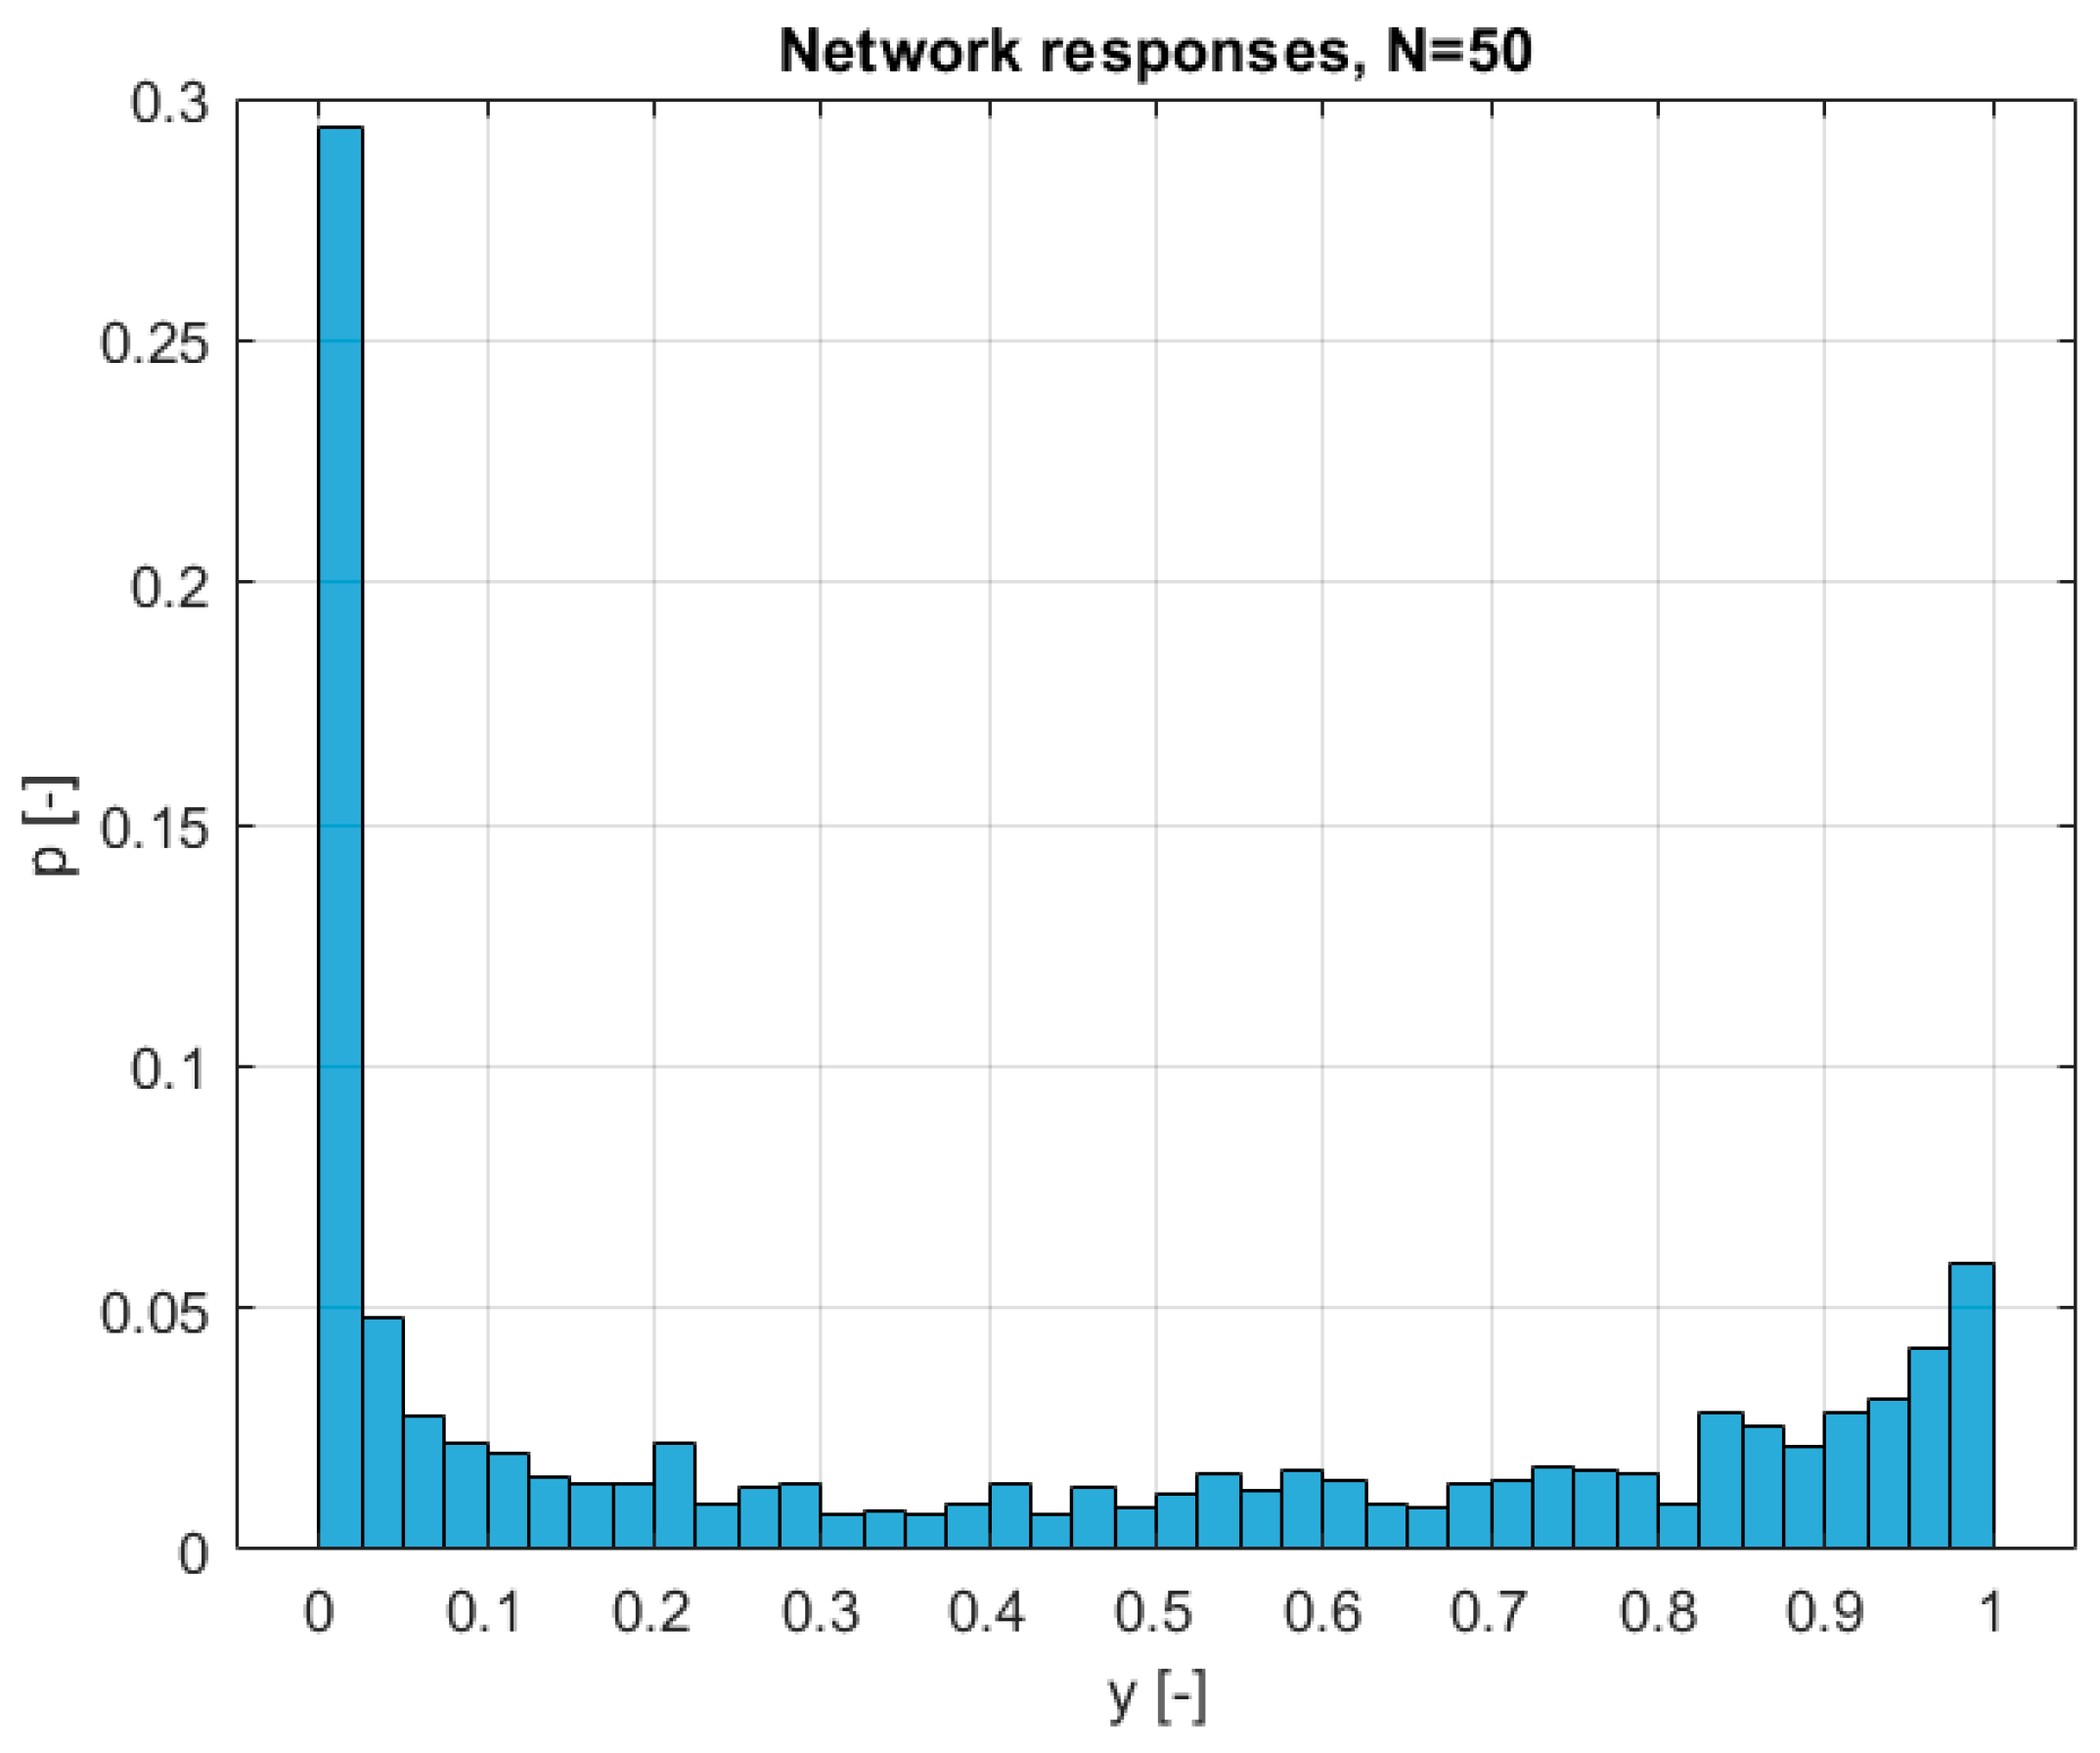
Figure 13, which are based on the testing data. The graph in
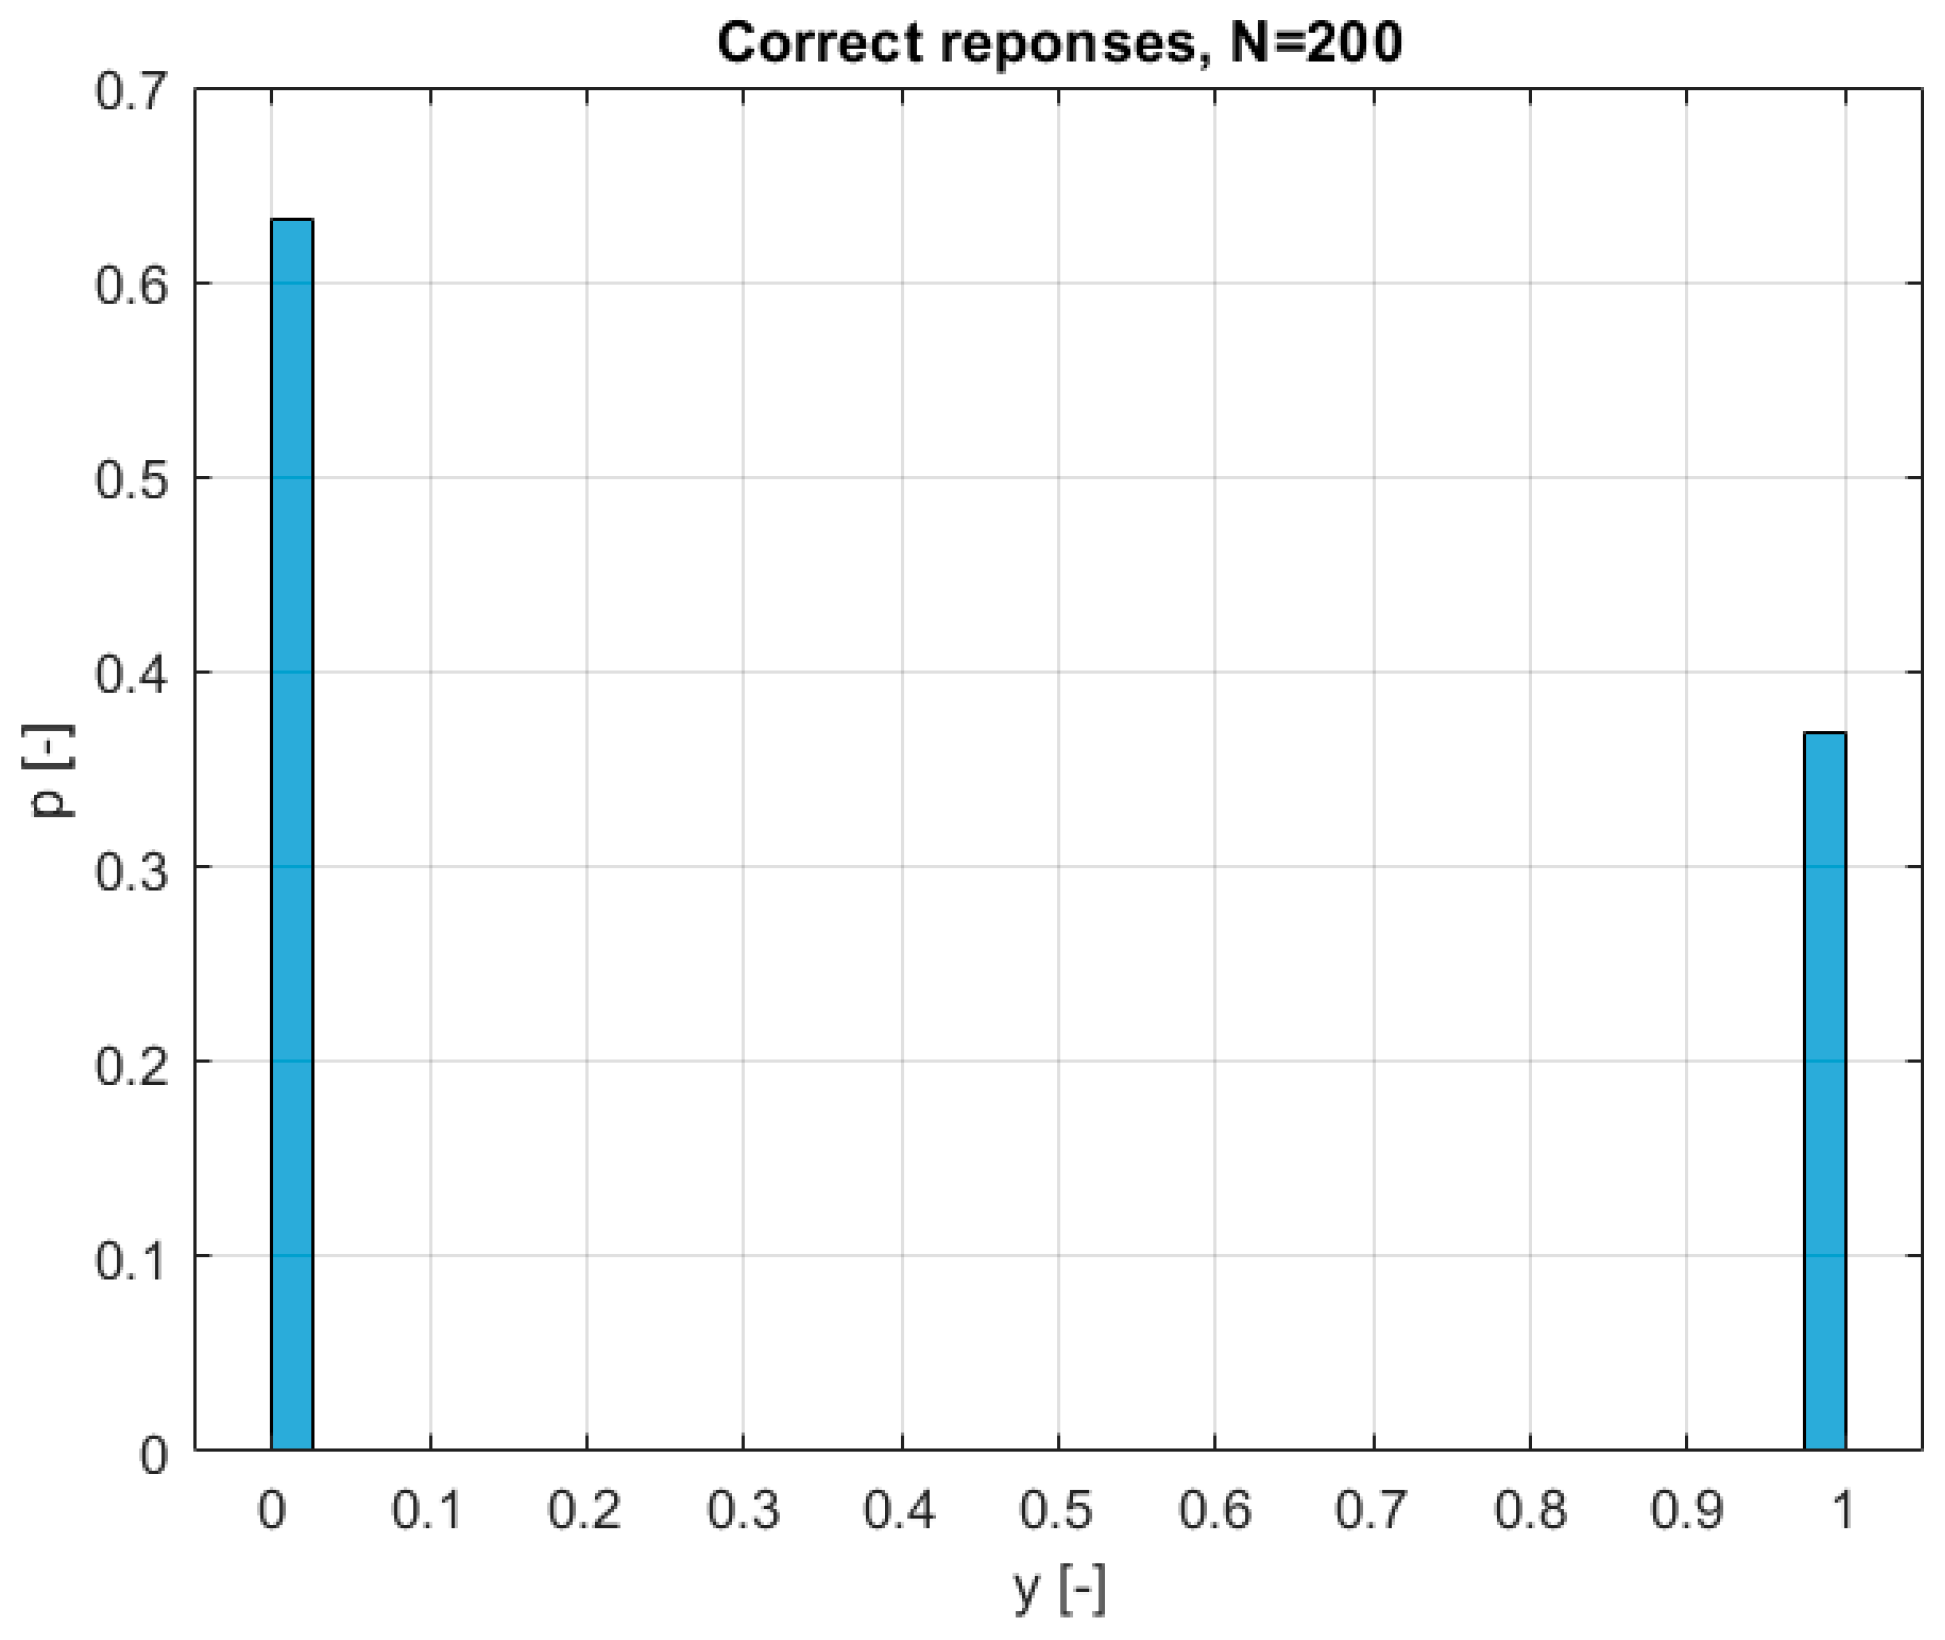
Figure 11 shows the normalized histogram (with the heights of the bars selected so that the sum of their areas is 1) of the network response—the percentage of responses
contained within the given intervals
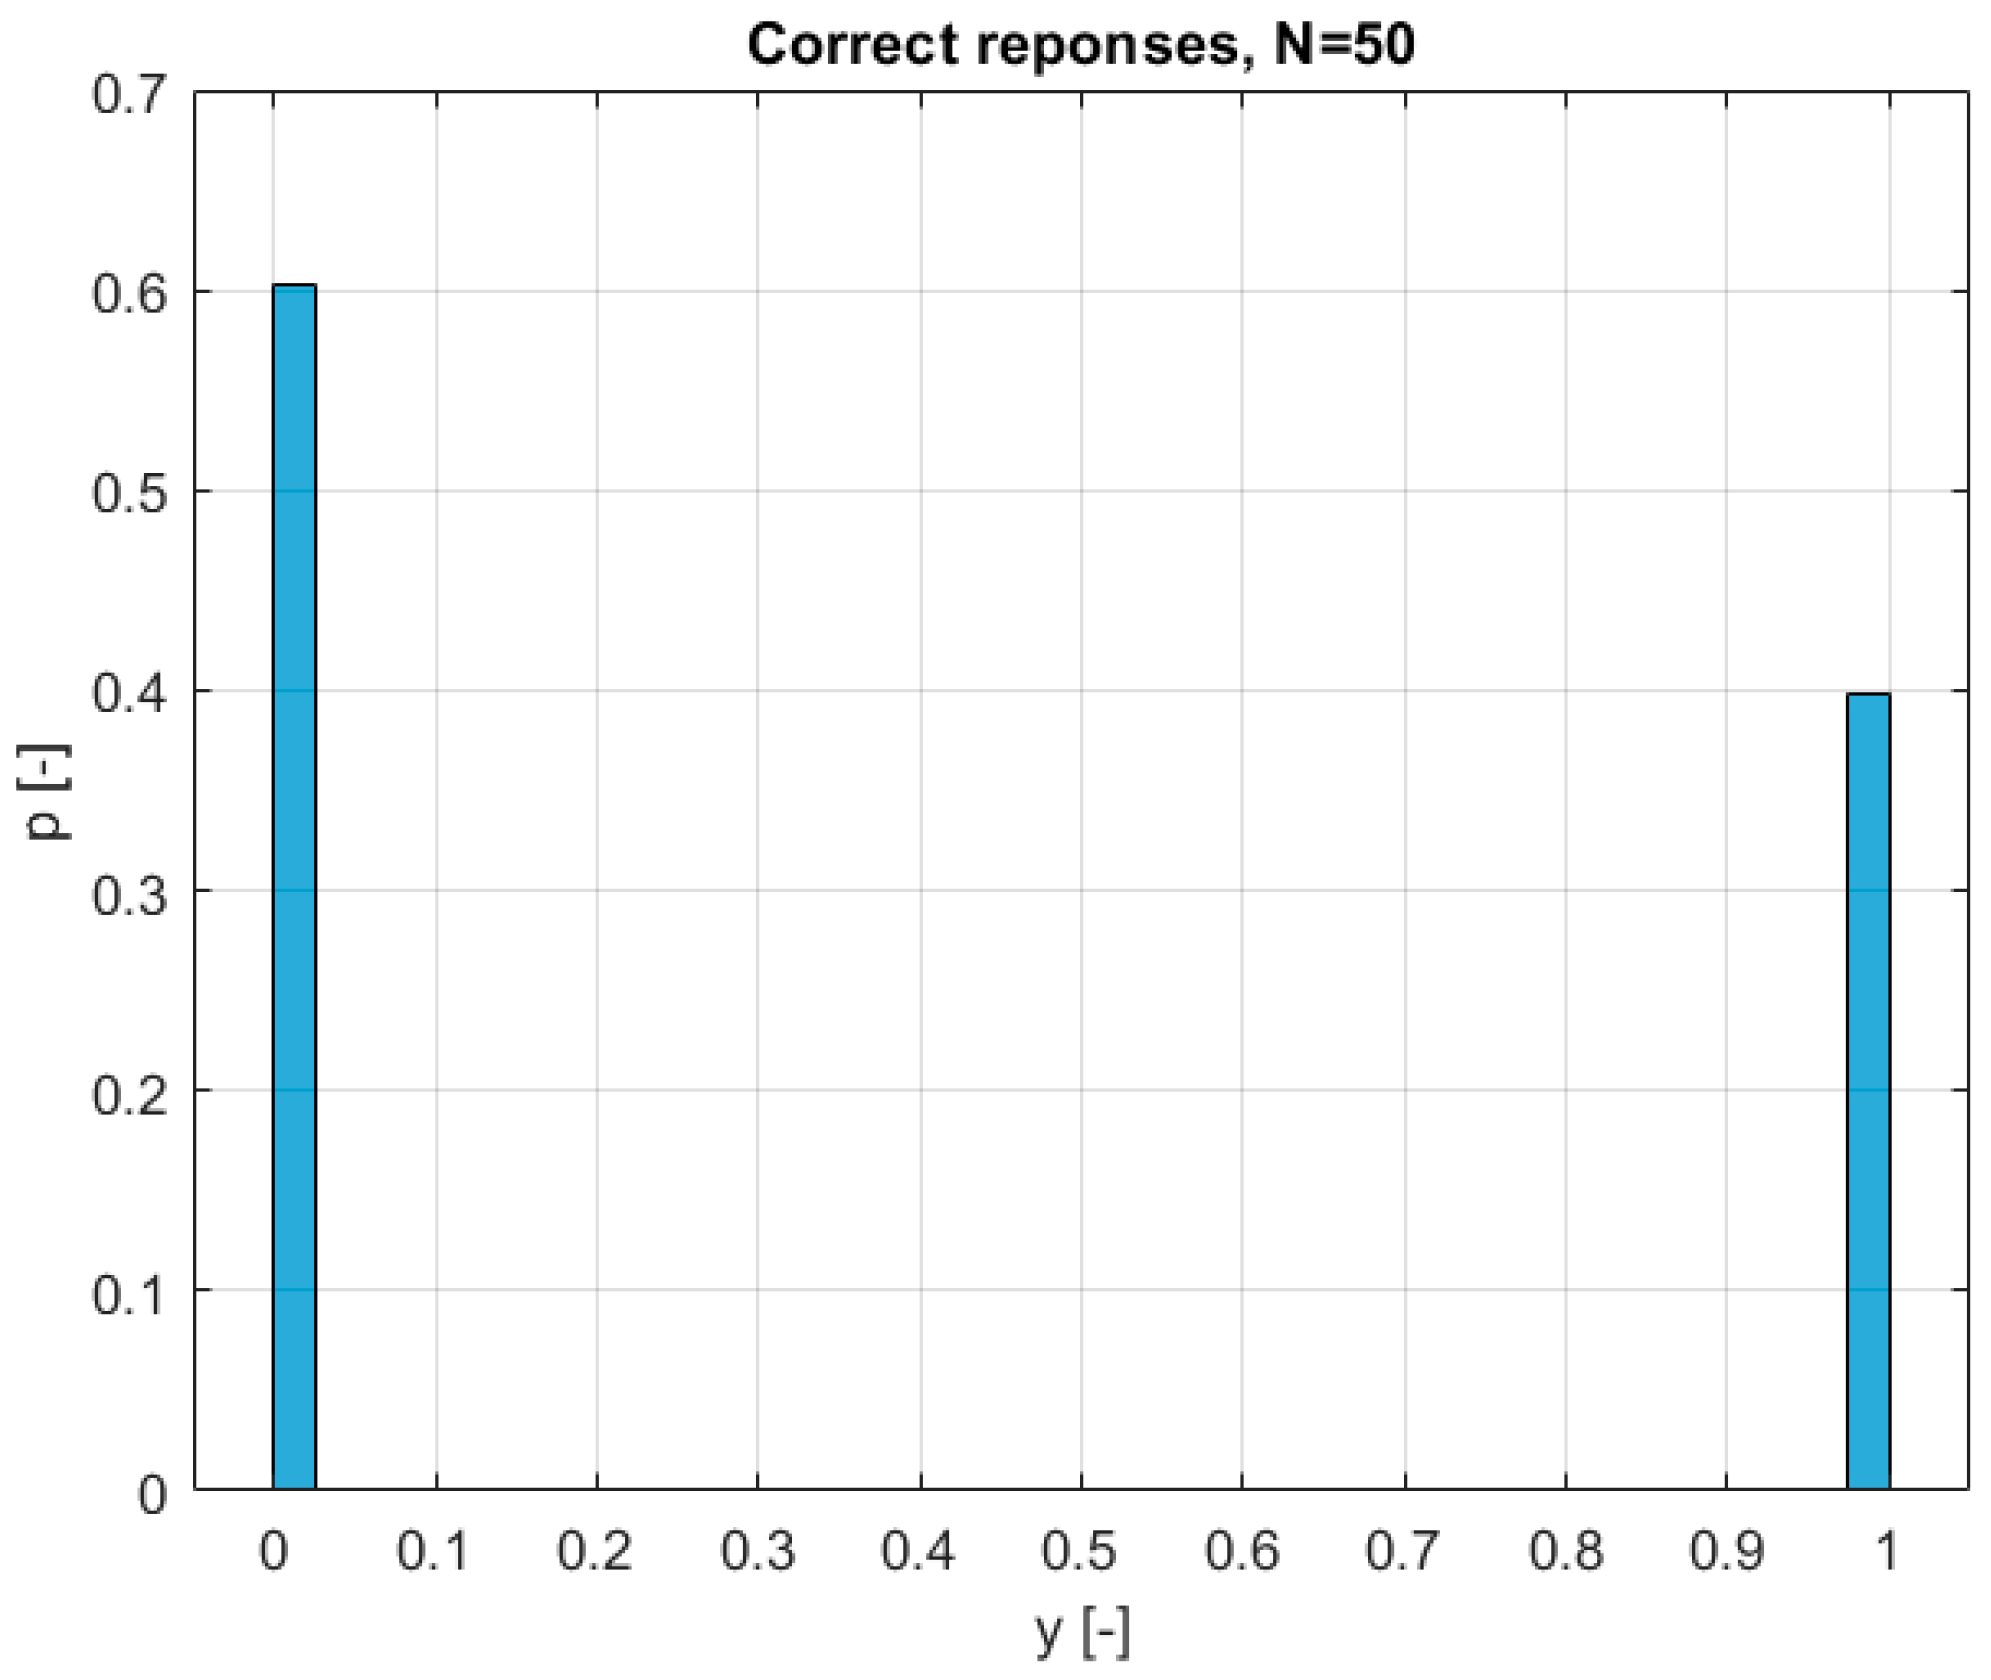
. In a perfectly functioning model, this histogram should be identical to the one in
Figure 12, which displays the normalized correct responses. The significant number of responses close to 0 and 1 indicates that the intended classification behavior was achieved. However, comparing the graphs in
Figure 11 and
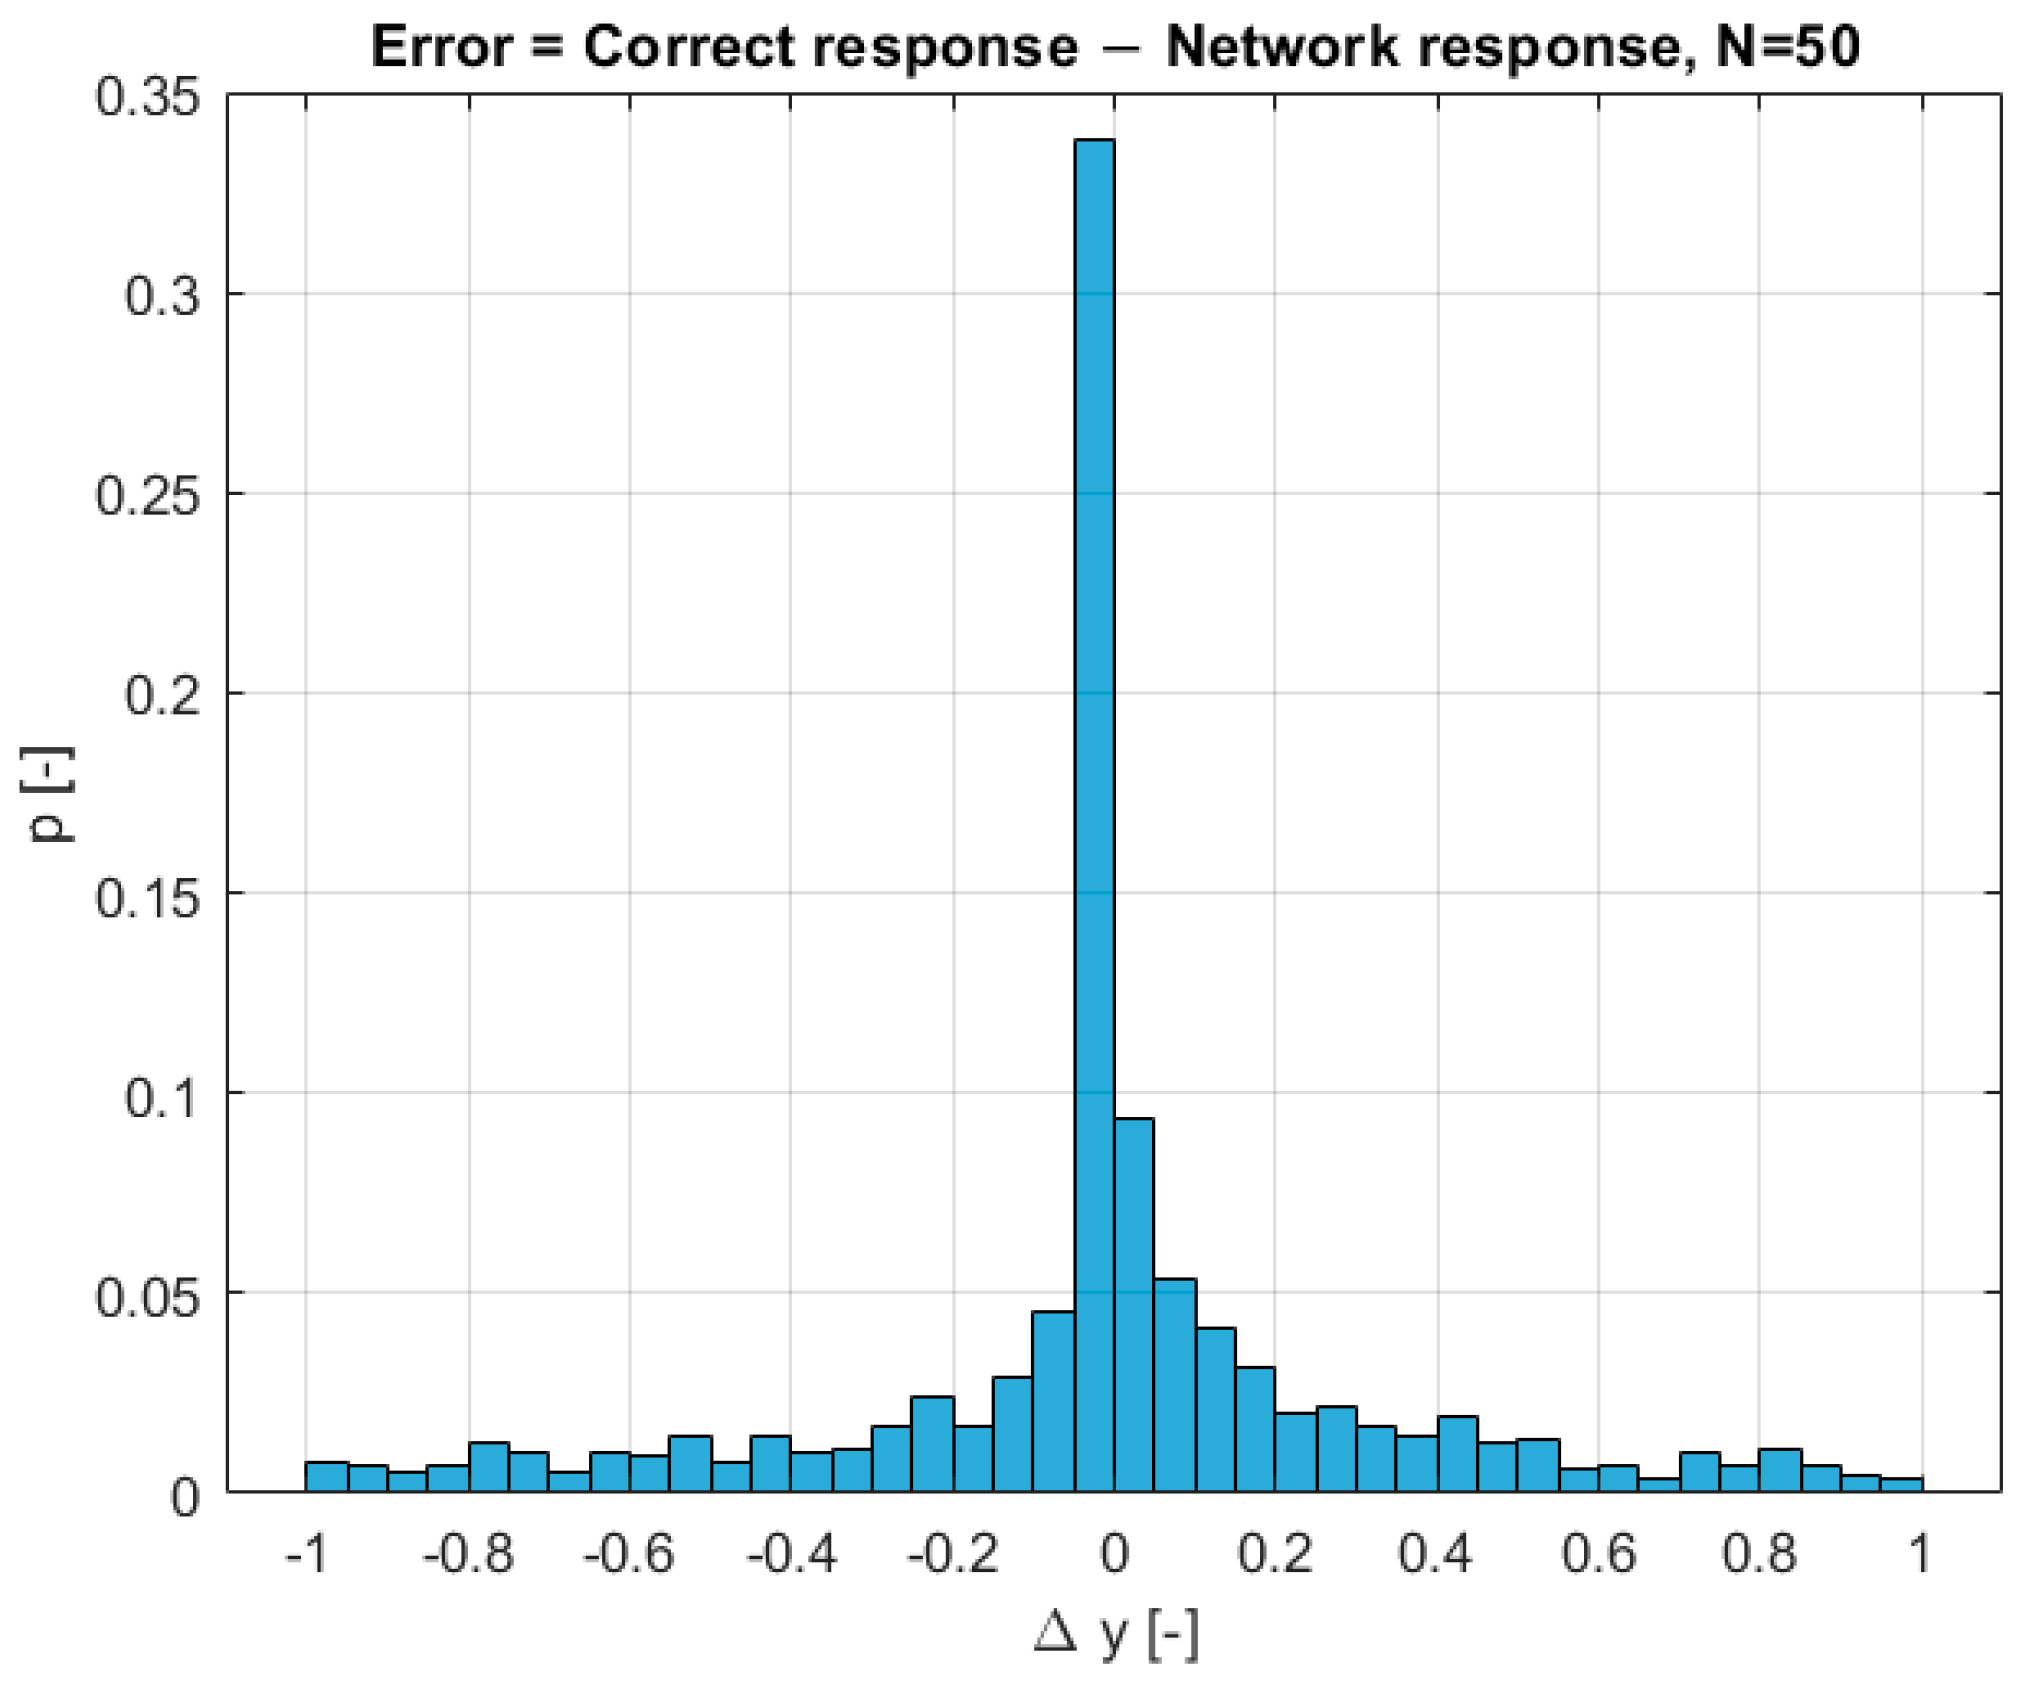
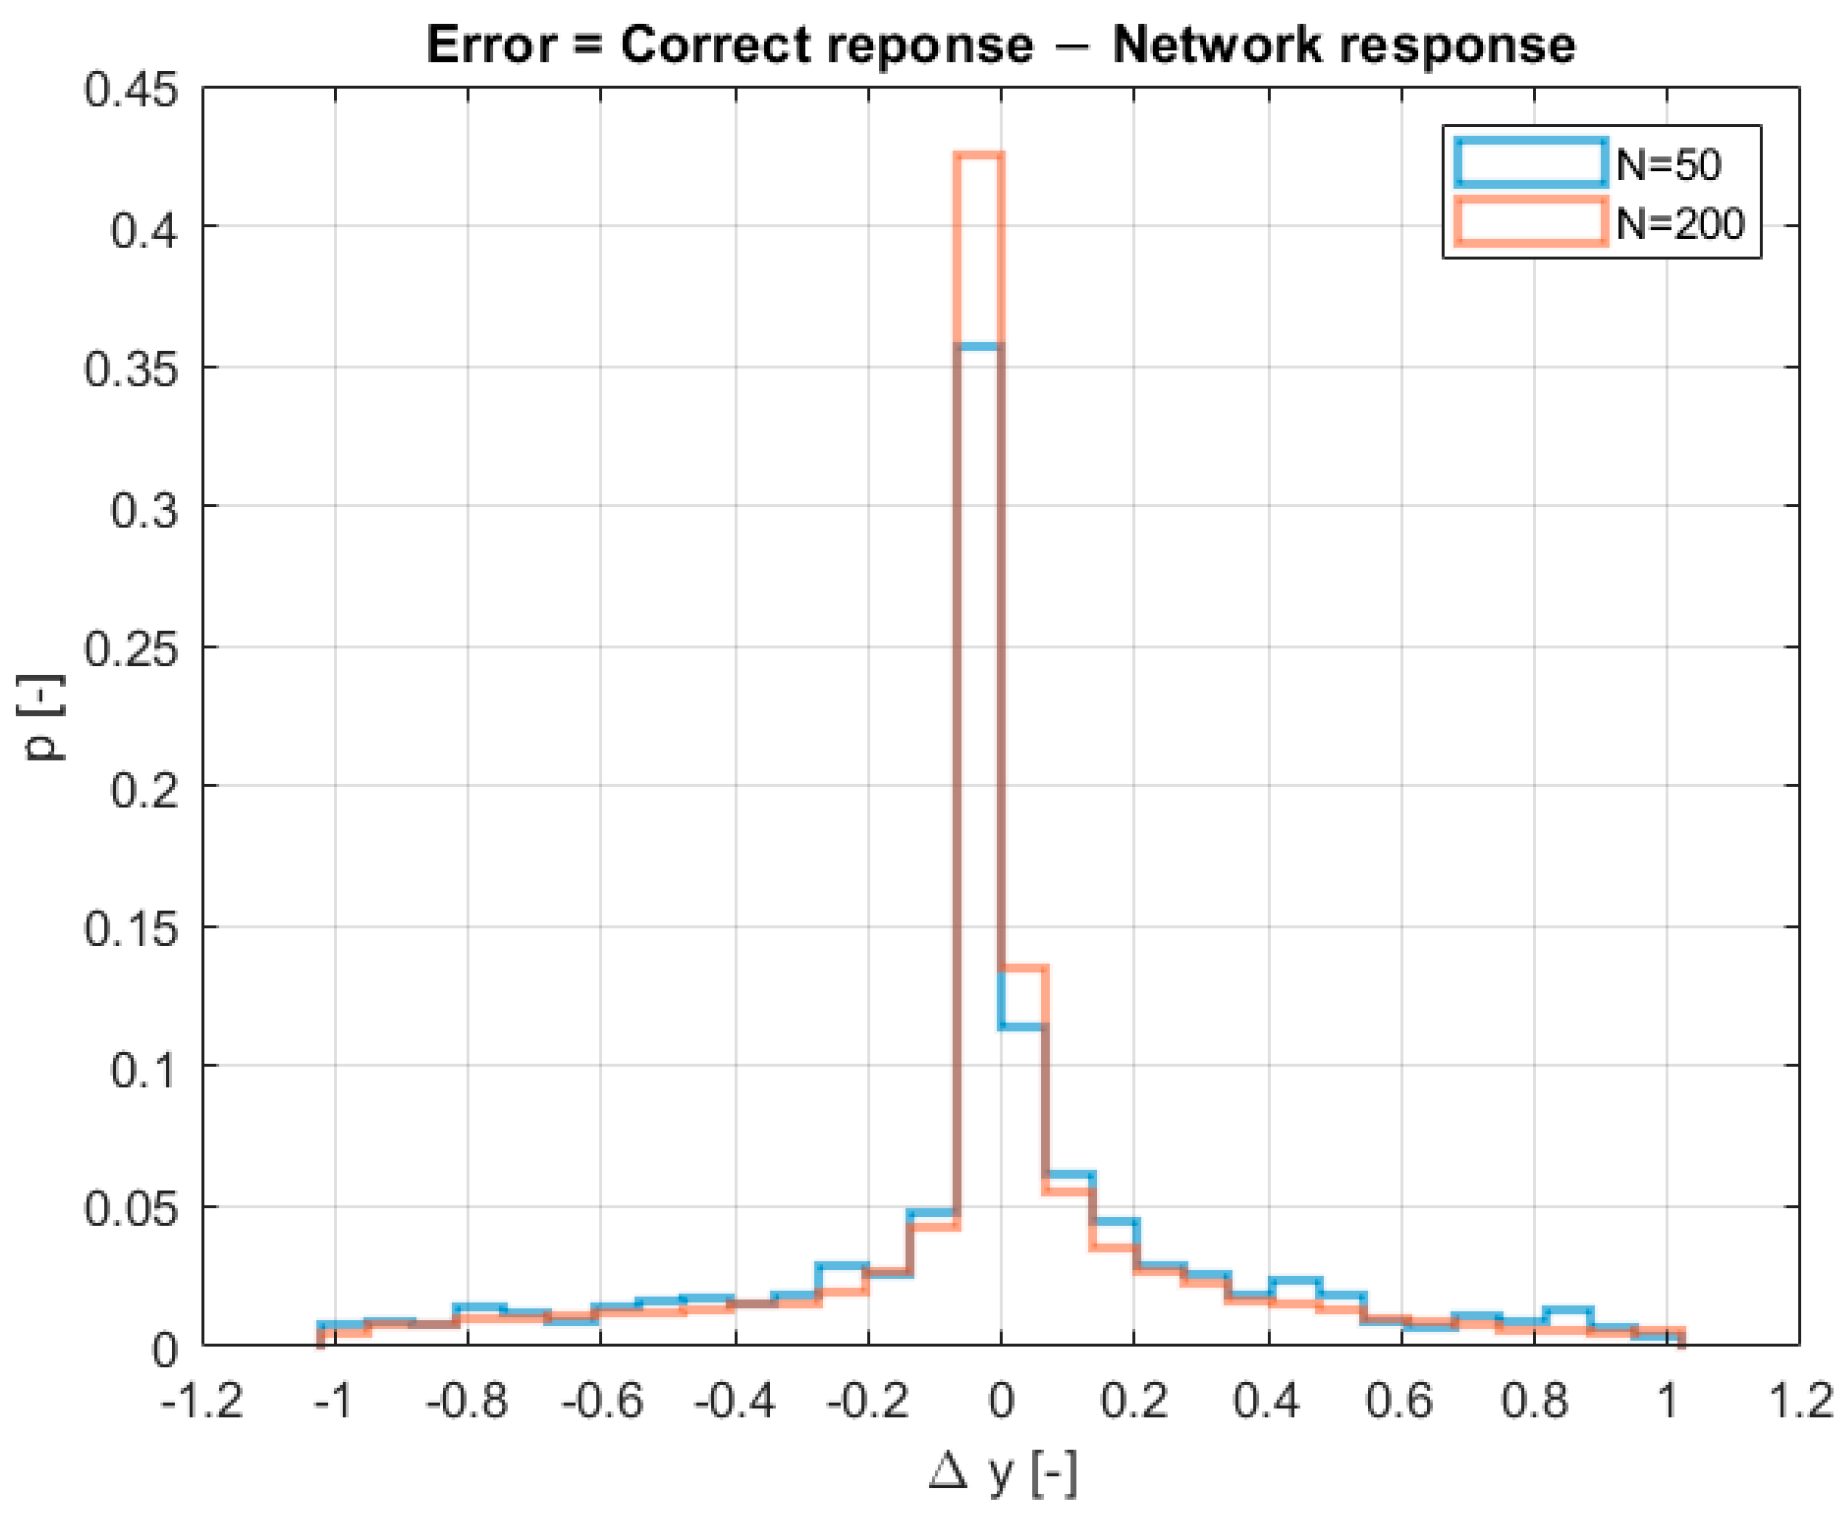
Figure 12 does not provide information into how closely the network responses align with the correct ones. Inferences in this area can be derived from the graph in
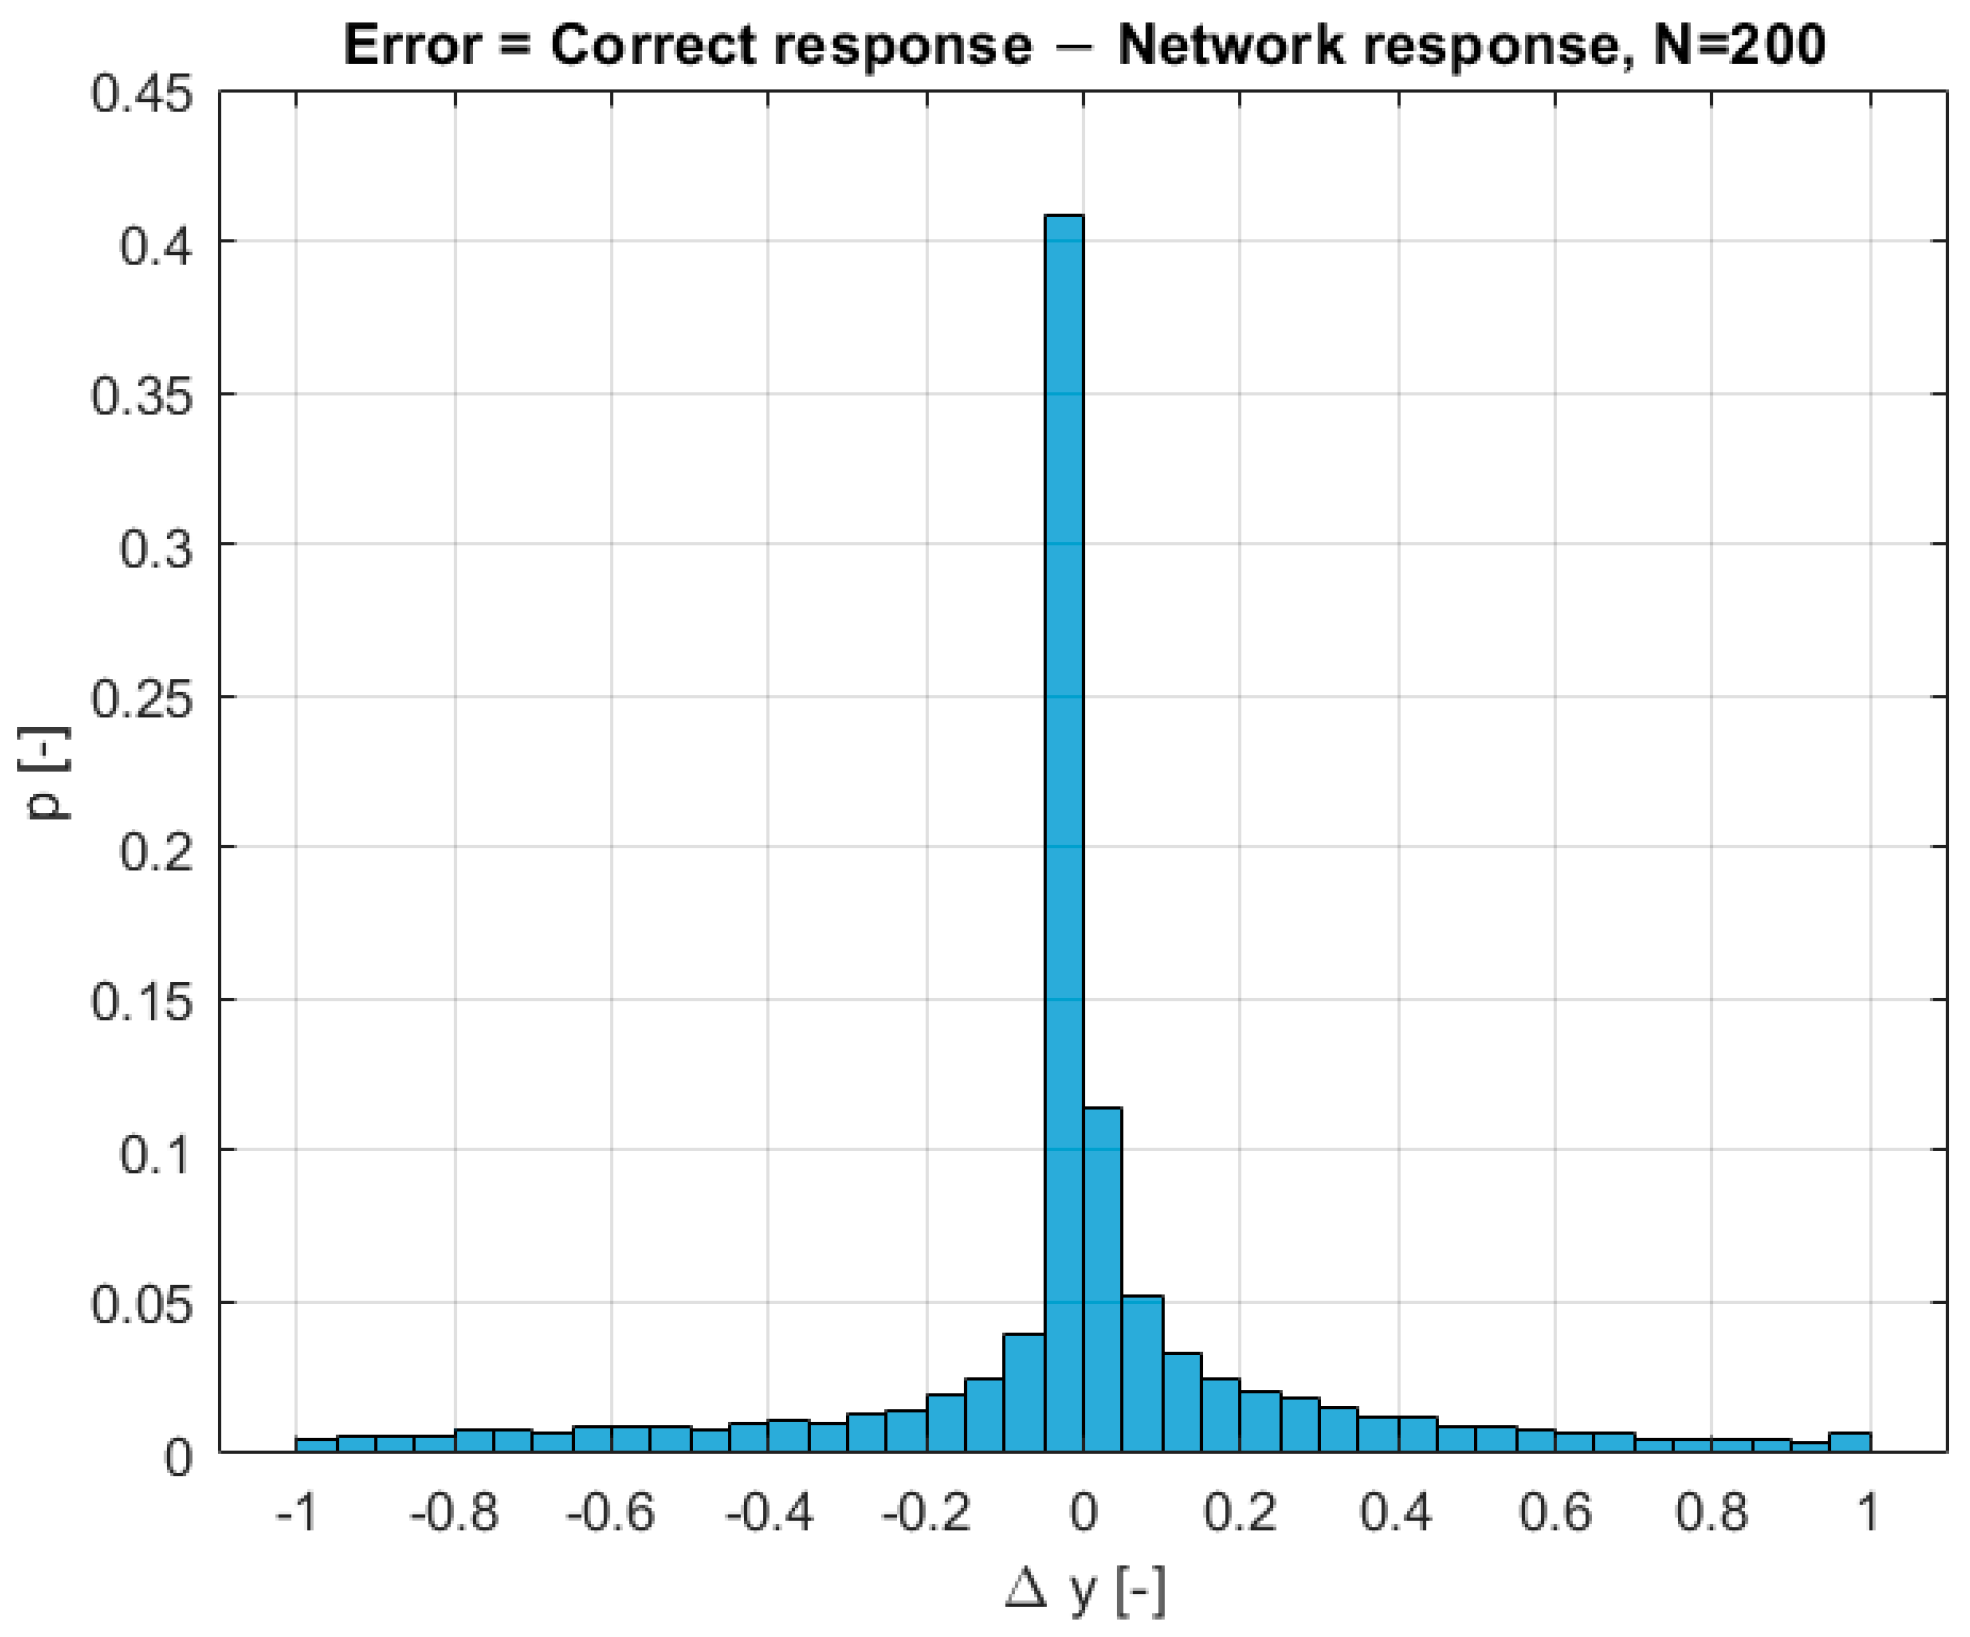
Figure 13, which contains a normalized histogram of the difference between the correct responses and the network responses (error
). A strong concentration of error values around 0 indicates that the network is working correctly in the vast majority of cases. The absence of a significant number of errors with values 1 and −1 indicates that there are few large errors (i.e., complete failures to recognize the conflict).
The effectiveness of the network can also be presented using a confusion matrix (
Table 2), which shows the percentage distribution of different combinations of network responses and correct answers (0 indicates no conflict, while 1 indicates a conflict). The smallest proportion is associated with undetected conflicts (4.40%). The proportion of incorrectly detected conflicts (false alerts) is 13.27%. Therefore, the overall assumptions of the system regarding its preventive nature are met. The overall effectiveness of the system is 82.33%.
A comparison of the performance of the network trained with a larger number of training examples allows us to draw conclusions about how increasing the number of training examples (to ) affects its operation. Therefore, the number of flights was increased from to , which, based on Equation (1), resulted in 160,000 training examples (16 times more than in the previously discussed scenario). All other parameters remained unchanged.
As in the case for
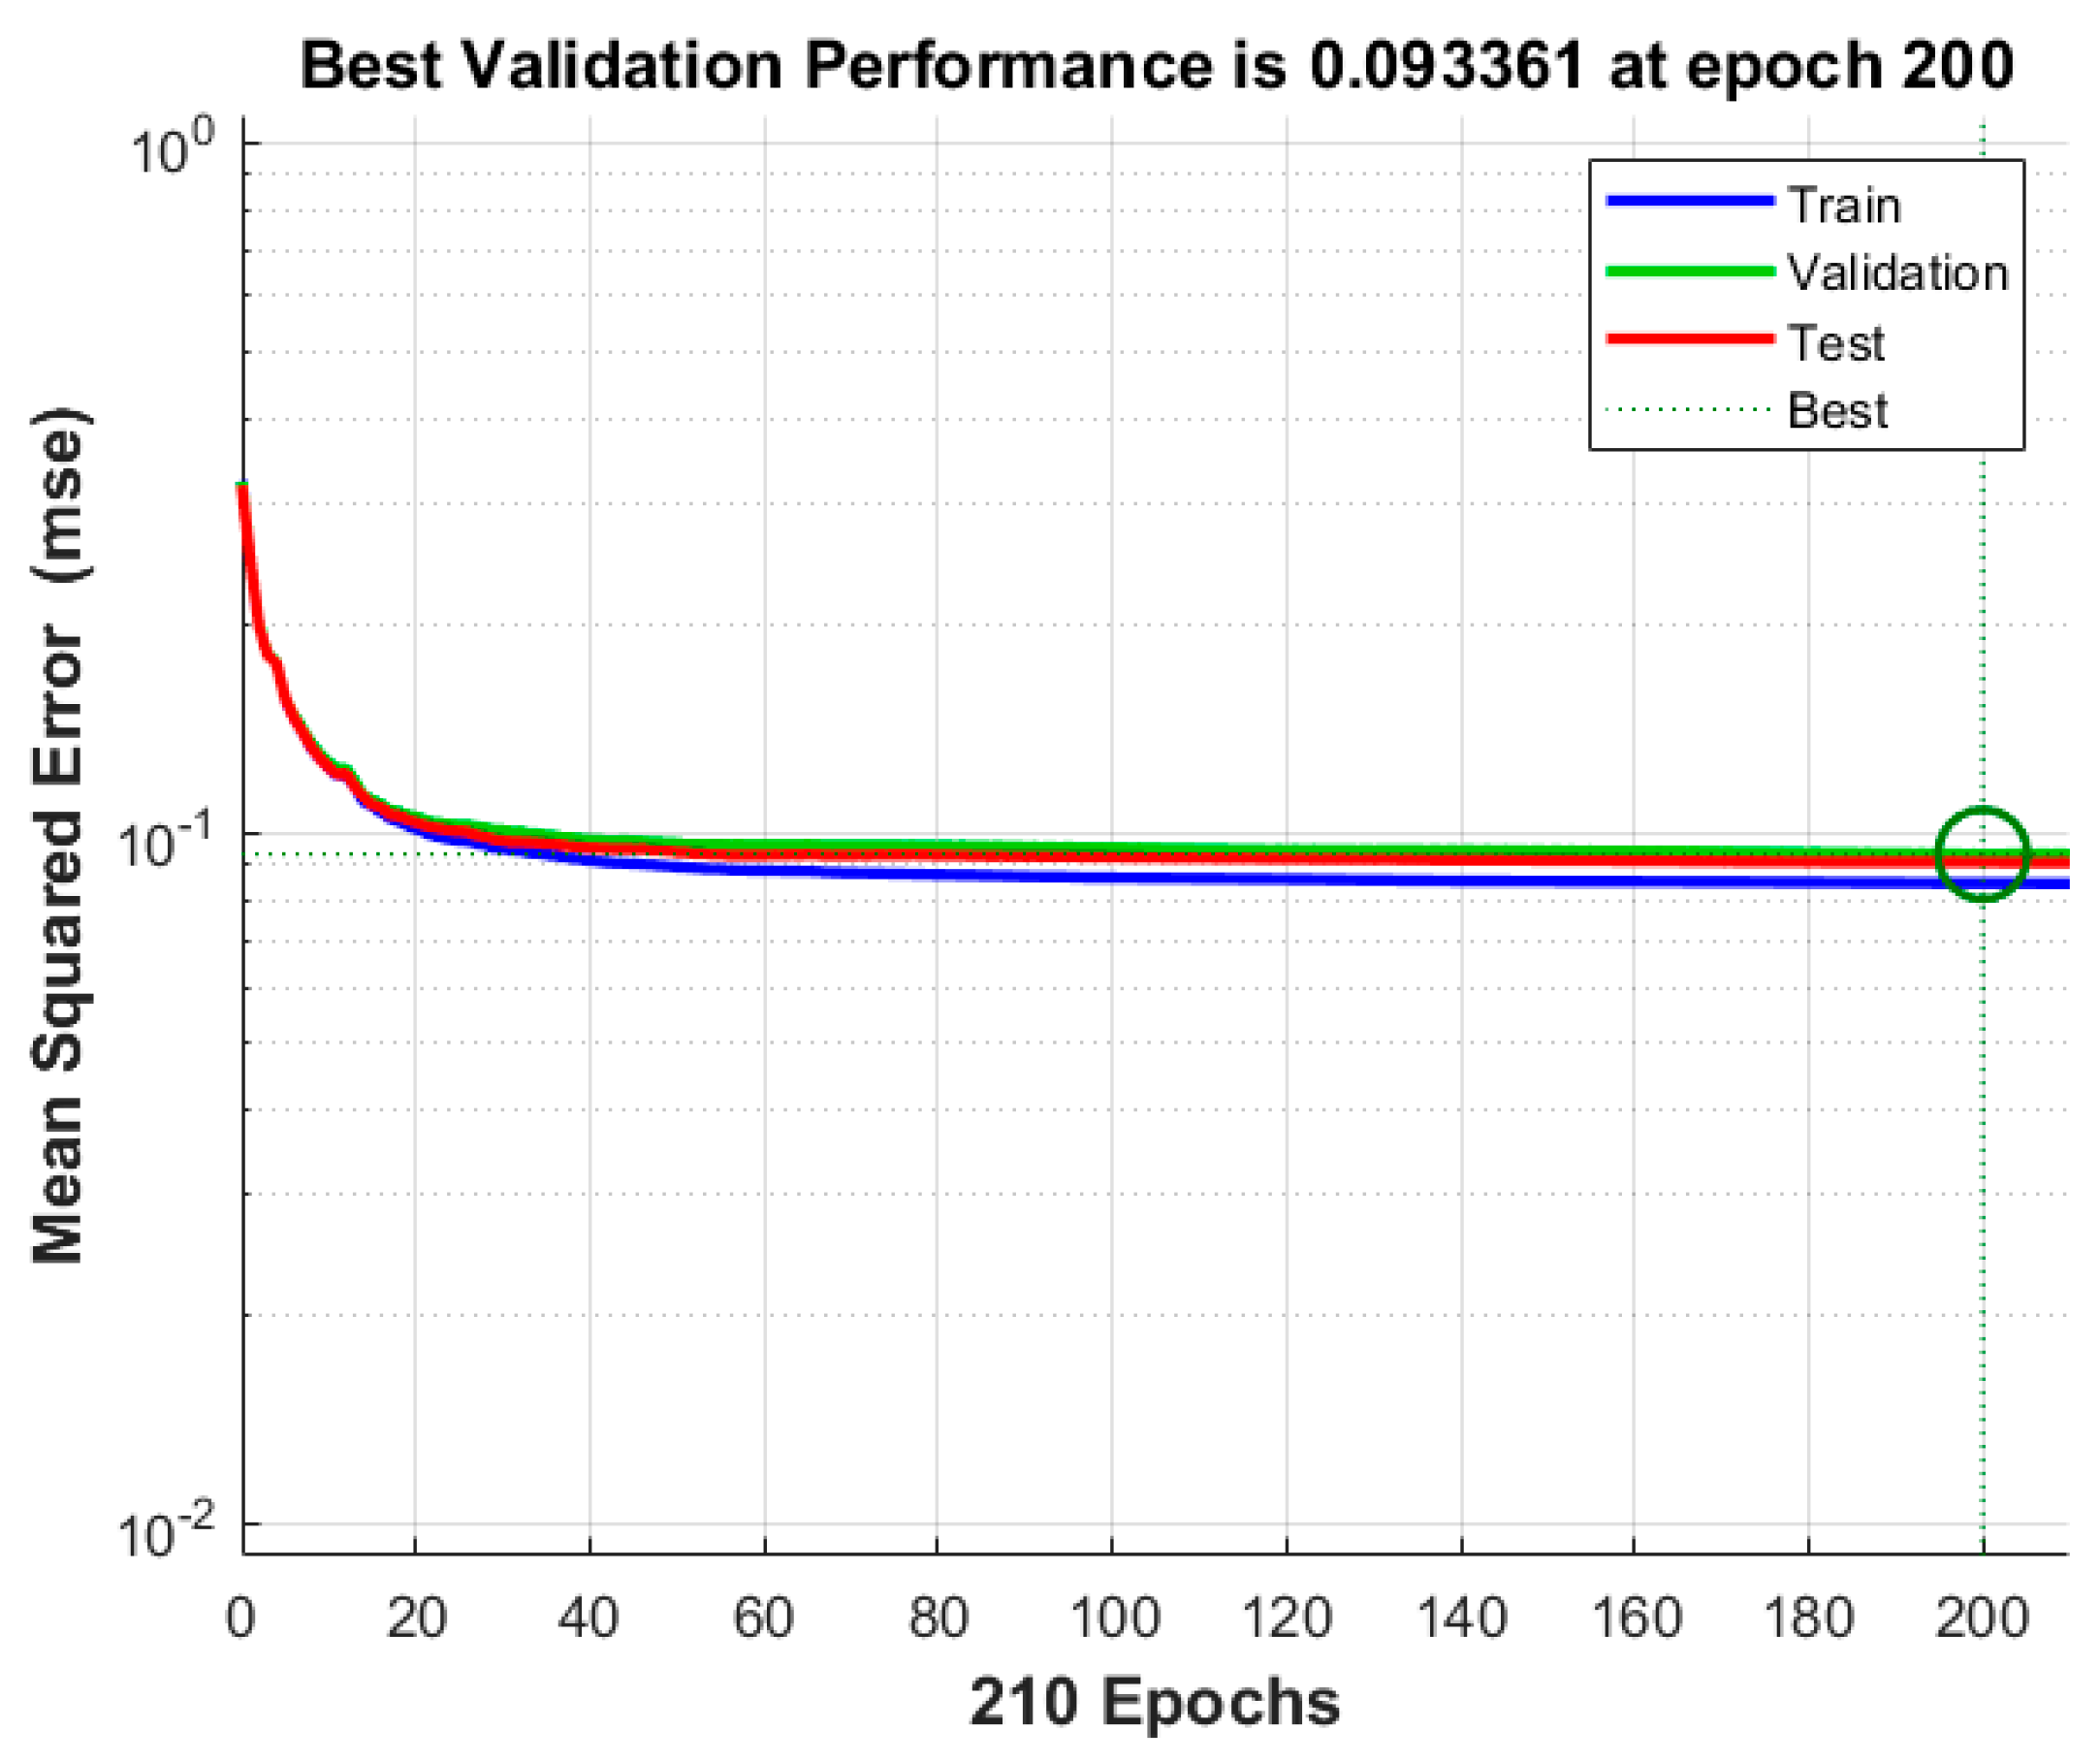
, the training process was terminated upon exceeding the maximum number of validation checks. The visualization of the training process is presented in
Figure 14 and
Figure 15. The lowest cost function value (MSE = 0.093361) for the validation data was achieved in epoch 200, which is 13.8% lower than the value obtained for
.
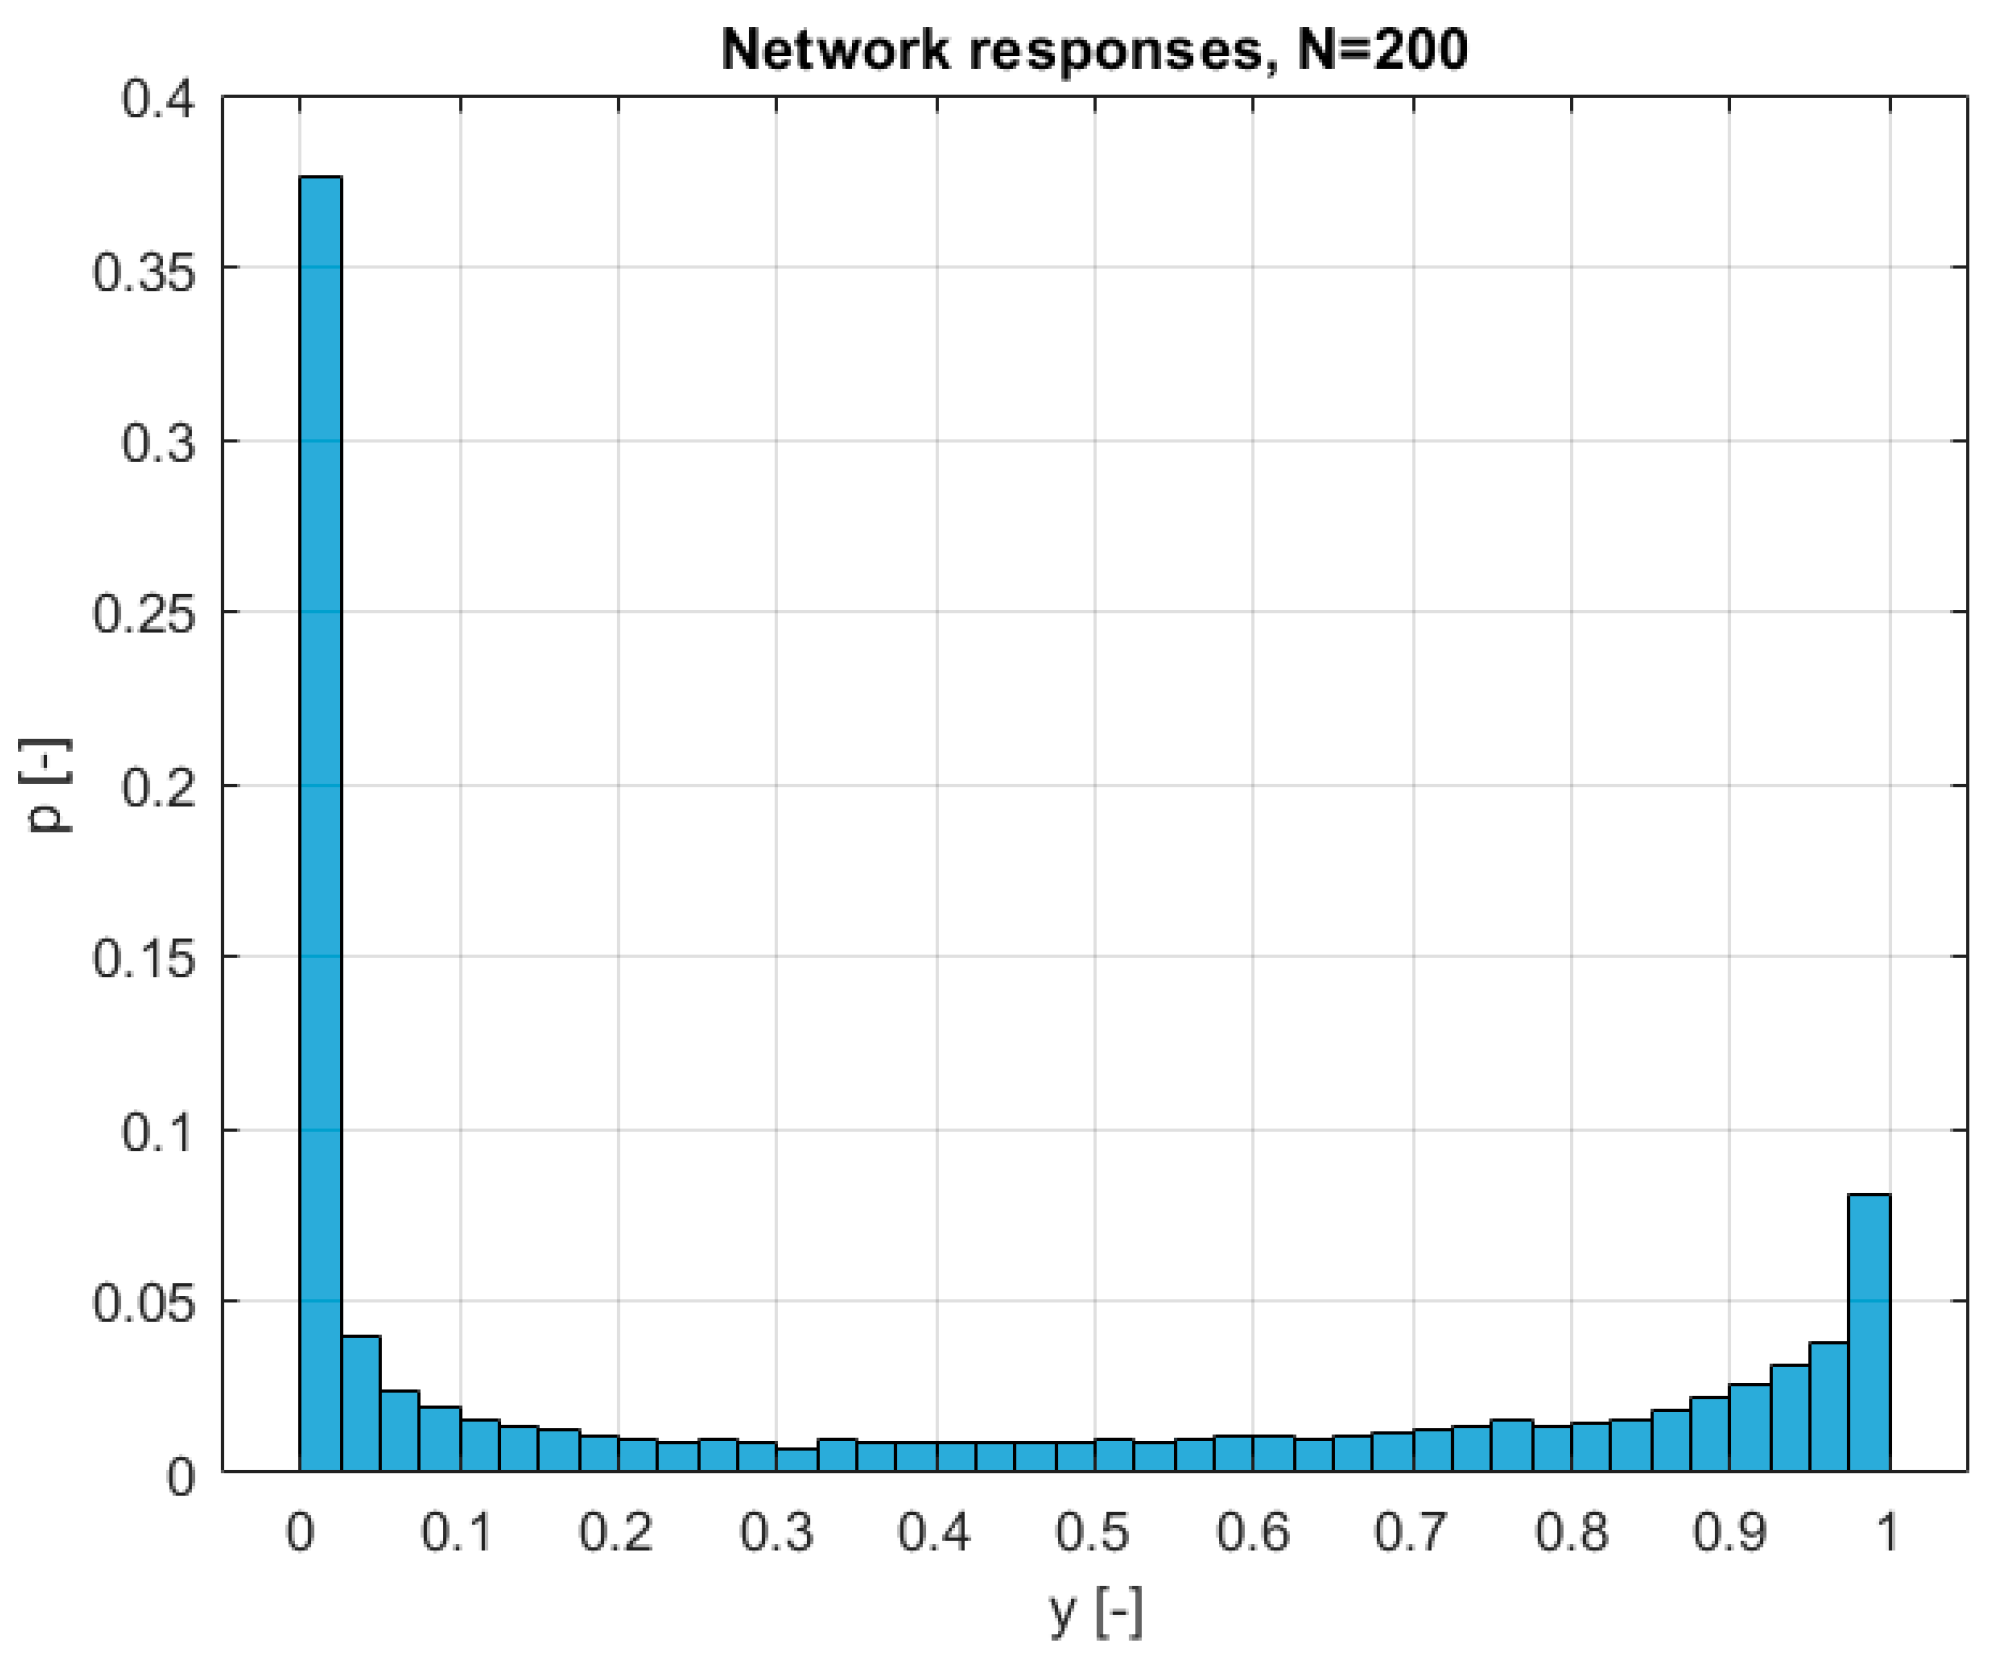
Comparing the network response histogram from
Figure 16 with that from
Figure 11, one can observe a clear improvement in the classification quality: there are fewer responses in the range of 0.2–0.8. The error histogram (
Figure 18) shows an even stronger concentration around the value 0. This is particularly evident when these histograms are overlaid in one coordinate system (
Figure 19). The advantage of the model with the number of flights
is clear: there are higher bars around values close to 0 and lower bars around values further away from 0.
The confusion matrix corresponding to the one in
Table 2 was created for an increased number of flights (
). It is presented in
Table 3.
Comparing the data from
Table 3 to the data from
Table 2, it can be stated that increasing the number of training examples (flights) significantly improved the classification efficiency of the network: the number of undetected conflicts decreased by 1.58 pp, while the number of incorrectly detected conflicts decreased by 2.16 pp. The overall efficiency of the system increased to 86.07%.
The analysis presented in
Section 3 allowed for a general assessment of the network’s responses. However, a key issue from the perspective of this study’s objective is whether the network can predict a conflict based on an initial situation that does not directly indicate one.
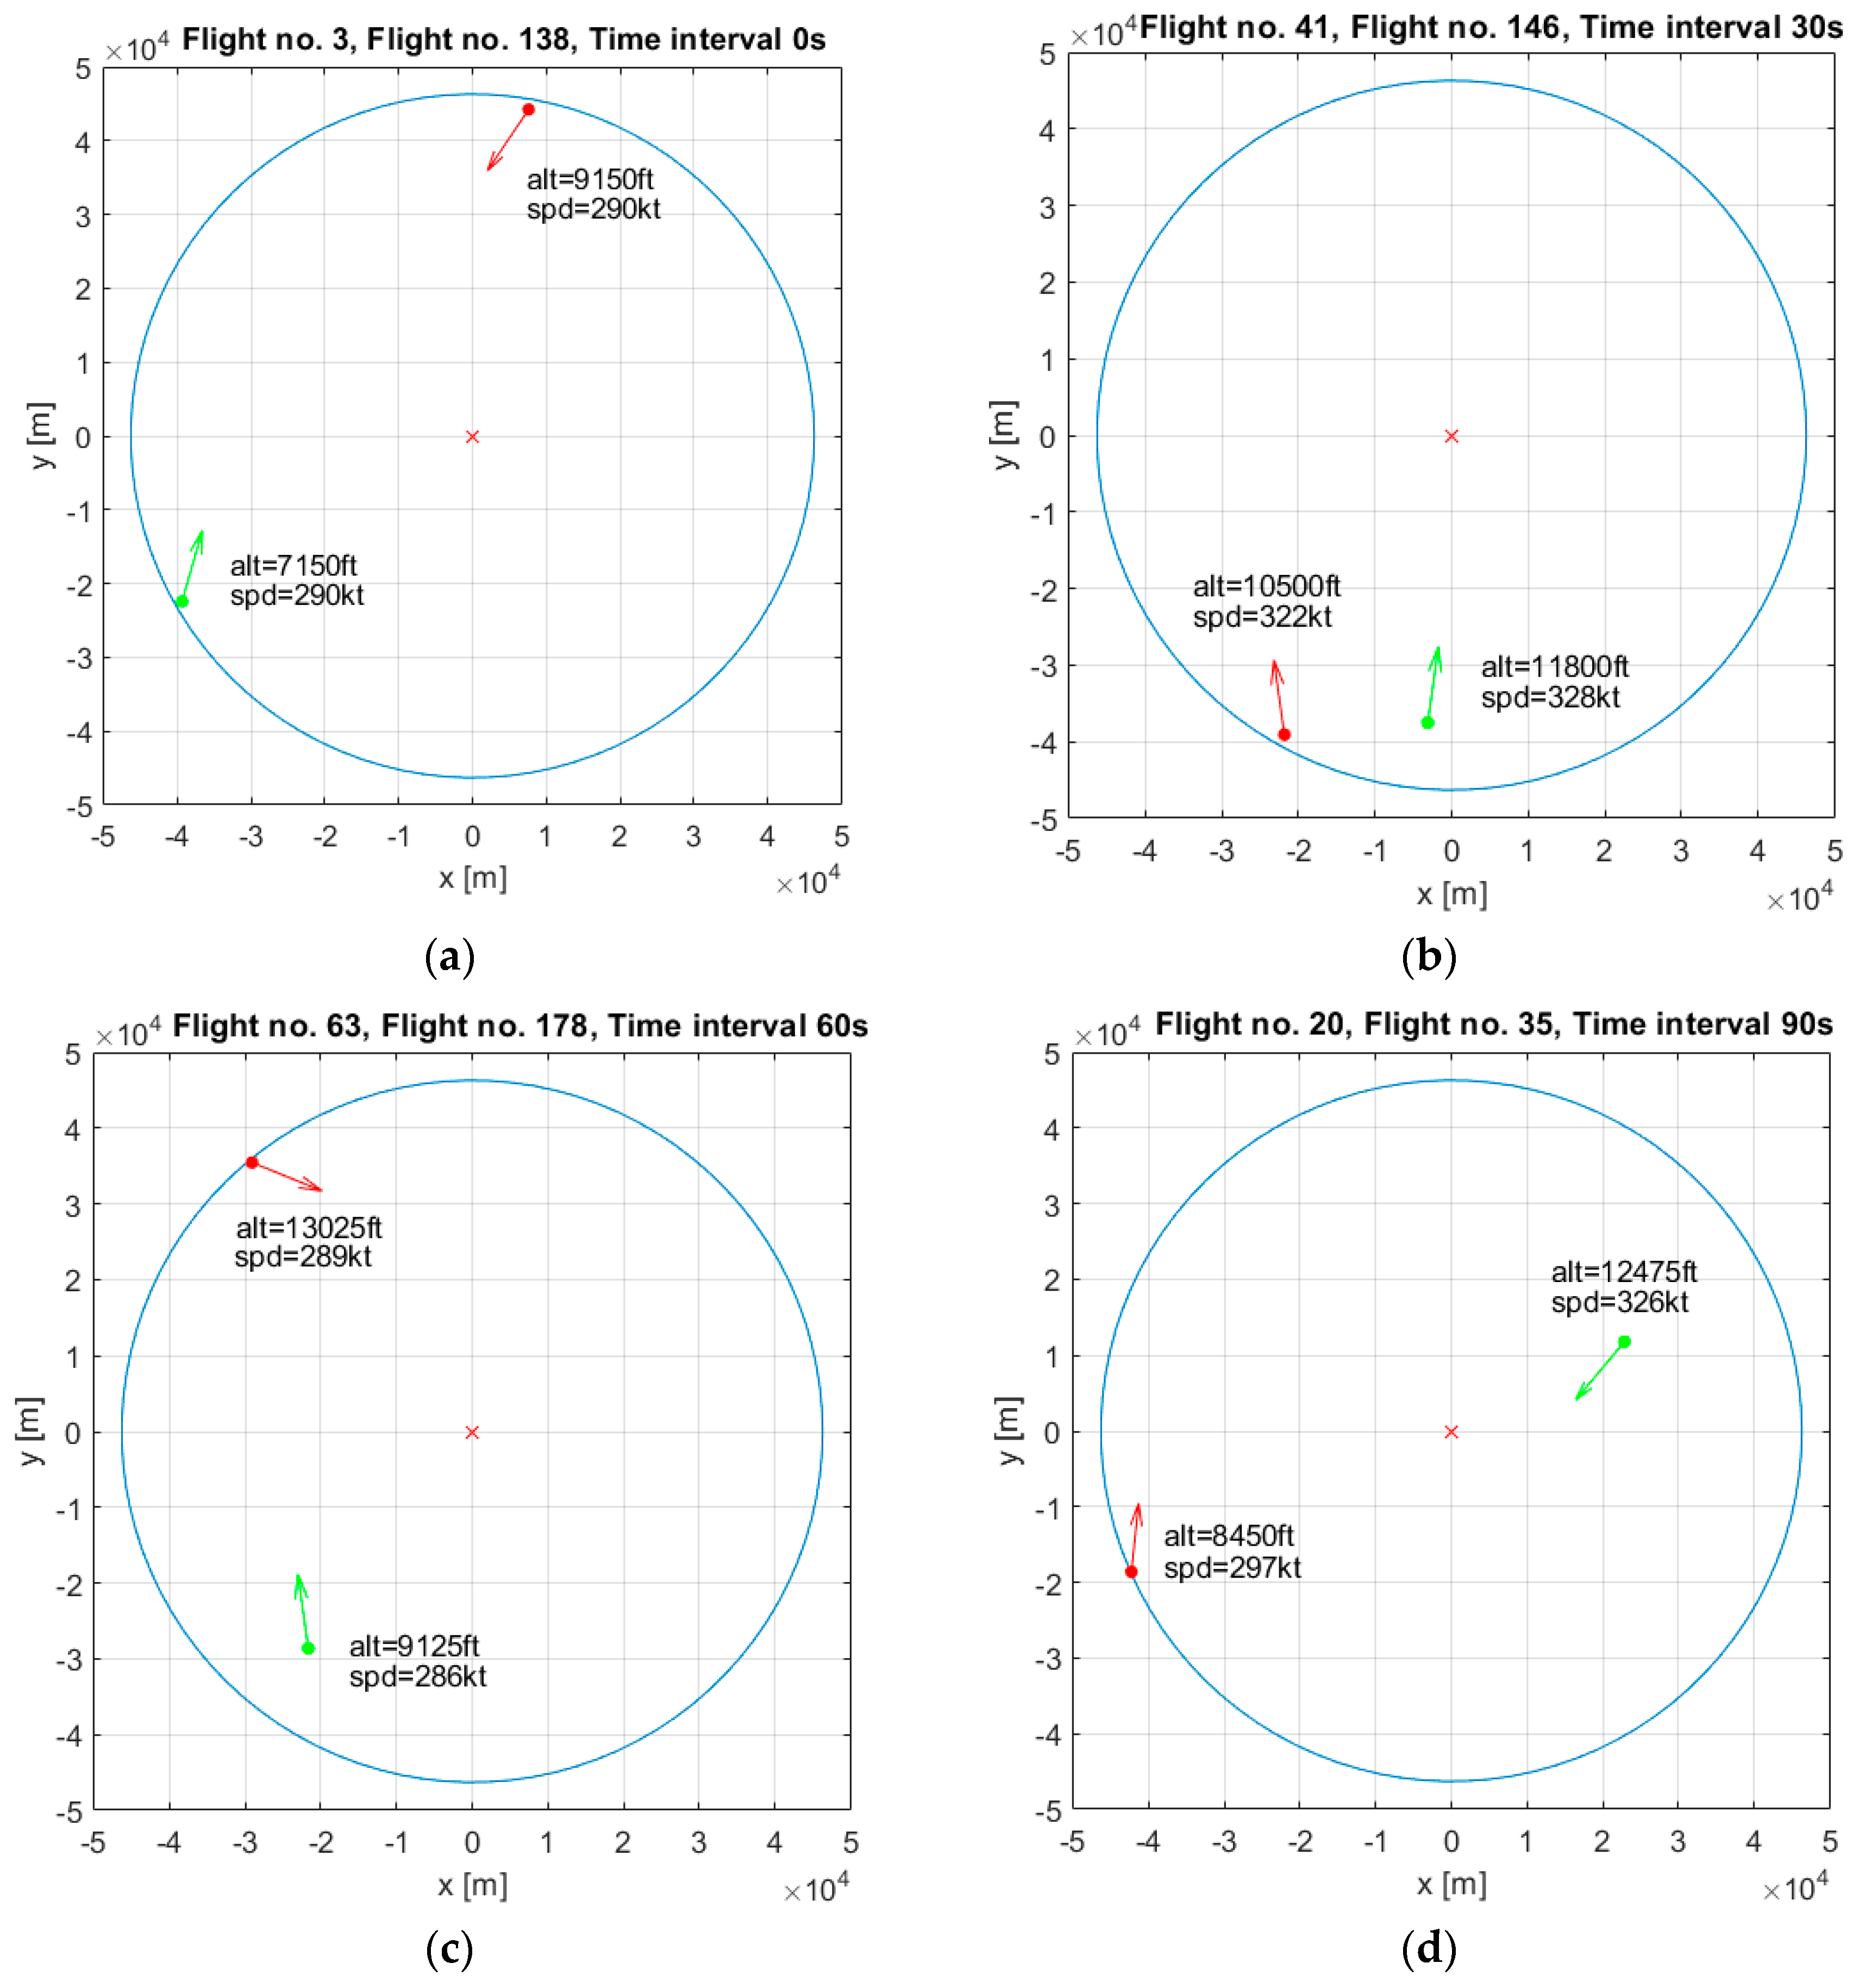
Figure 20 provides visualizations of example initial situations in which the network correctly predicted an impending conflict. These visualizations include the boundaries of the analyzed airspace (blue circle), the ARP of EPWA airport (red cross), the initial positions of both aircraft (marked with dots), their headings (represented by vectors proportional in length to their groundspeed), altitudes (denoted as “alt”), and speeds (denoted as “spd”). The aircraft that first crossed the airspace boundary is marked in green, while the one that crossed second is marked in red.
Based on the visualizations of initial situations in
Figure 20, it can be concluded that the system is capable of detecting future conflicts based on scenarios that do not directly indicate them. For example, it can identify conflicts involving aircraft with divergent tracks (
Figure 20b), a significant altitude difference (over 2000 ft) (
Figure 20c), or those that are relatively far apart upon entering the airspace (
Figure 20a).
Considering the characteristics of the systems discussed in
Section 1, none of them would be able to detect a conflict at such an early stage without additional external data (e.g., a flight plan data). The STCA and TCAS systems have time horizons that are too short (see
Table 1), while TCT and MTCD require external data on the planned flight trajectory.
4. Discussion
The performance of the trained neural network was analyzed, with particular emphasis on the impact of additional training (increasing the number of training examples). After increasing the number of flights from to , the overall accuracy reached 86.07% (an increase of 3.74 pp), the proportion of incorrectly detected conflicts (false alerts) was 11.11% (a decrease of 2.16 pp), and the proportion of undetected conflicts was 2.82% (a decrease of 1.58 pp).
The overall efficiency of the proposed system is therefore significantly lower than the one proposed in [
23], which reached 99%. This indicates that the problem of analyzing real (not simulated, as in [
22]) three-dimensional trajectories with significant and difficult to predict (radar vectoring) variations in altitude, speed, and course is considerably more complex than conflict detection in en-route airspace (examined in [
23]) using historical data retrieval. It is presumed that the trajectory retrieval method employed in [
23] would not be applicable in the dynamic and highly variable TMA environment.
Visualizations of the initial conditions, based on which the system predicted future conflicts, indicated that it is possible to detect a conflict even in cases where the initial conditions do not explicitly suggest its occurrence.
The presented analyses confirm that the developed system meets the established assumptions. However, certain areas requiring further improvement can be identified, which could significantly enhance the system’s effectiveness.
The first and most obvious improvement is increasing the number of training examples. Due to technical limitations, such as the availability of trajectory data and the hardware used for network training, the number of processed flights was limited to only 200. This is an exceptionally small number compared to the volume of operations conducted even within a single day in Europe [
1]. The comparison presented in
Section 3 demonstrated that additional training significantly improves the system’s performance. Therefore, utilizing historical flight data stored by EUROCONTROL could substantially enhance the system’s accuracy.
In its current version, the system operates under the assumption that all landing operations take place on a single runway at a given airport (RWY11 EPWA). This means that implementing the system at another airport or in a scenario where simultaneous landings occur on multiple runways would require collecting new training examples and retraining the network. For global implementation, automating the entire process would be necessary.
The parameter used to determine vertical separation is pressure altitude. When the reference pressure differs from 1013.2 hPa, this value deviates from the actual altitude. Incorporating a correction for reference pressure into the system would improve the quality of training examples, which would likely translate into increased network performance.
The developed system operates entirely autonomously, meaning it does not rely on additional external data. A potential future enhancement could involve integrating the system with operational data, including planned flight trajectories, as proposed by [
23]. It can be assumed that such an approach would further improve the effectiveness of the early warning system.
The obtained results, along with the proposed development directions, demonstrate that an early warning system for air traffic control support, utilizing an ANN, can be a highly effective tool, potentially leading to its implementation in the near future.


