Article

A Modeling Approach for the Balanced Gliding Trajectory of a Hypersonic Vehicle with Pneumatic Iteration

1
College of Aerospace Engineering, Nanjing University of Aeronautics and Astronautics, Nanjing 210016, China
2
Beijing Institute of Space Mechanics and Electromechanics, Beijing 100094, China
3
Lanyu Nanjing Technology Co., Ltd., Beijing 100043, China
4
College of Automation Engineering, Nanjing University of Aeronautics and Astronautics, Nanjing 211106, China
*
Author to whom correspondence should be addressed.
Aerospace 2025, 12(11), 956; https://doi.org/10.3390/aerospace12110956 (registering DOI)
Submission received: 2 September 2025 / Revised: 23 October 2025 / Accepted: 24 October 2025 / Published: 26 October 2025

Abstract

This work presents a method for simulating balanced gliding trajectories of high-hypersonic flight vehicles, circumventing the challenges associated with trajectory modeling for these advanced vehicles. A typical hypersonic vehicle is used as a case study to create an external shape prototype. Aerodynamic simulations are performed using atmospheric data corresponding to various altitudes throughout the hypersonic flight. This process generates aerodynamic characteristic models for the vehicle across various Mach numbers and altitude conditions. Subsequently, ballistic modeling is conducted using the simulated aerodynamic data. The ballistic curve is refined iteratively during critical flight stages, taking into account the missile’s terminal guidance towards the target. As a result, the ballistic modeling curve is made relatively precise. Simulation results demonstrate that, compared to conventional equation-based ballistic curve modeling, the proposed iteration method yields ballistic curves that more accurately reflect actual flight conditions. This enhances flight state parameters and facilitates missile simulation for targeting moving objects. Notably, the terminal guidance accuracy error decreases from 0.12° to 0.03°, establishing a robust foundation for accurate ballistic modeling of hypersonic vehicles.

1. Introduction

Hypersonic flight vehicles refer to aircraft, whether winged or unwinged, capable of reaching speeds of at least Mach 5 in the near-space environment [1]. These vehicles can be categorized based on their propulsion features into two main types: boost–glide hypersonic flight vehicles and air-breathing cruise hypersonic flight vehicles [2,3]. Hypersonic gliding vehicles can be further classified into balanced gliding trajectories and leaping gliding trajectories based on their specific path characteristics. Balanced glide trajectories offer advantages such as gradual altitude variations, reduced thermal flux density, and lower peak dynamic pressure, as well as smoother curves for both angle of attack and bank angle. These features make them extensively useful in reentry guidance [4]. The United States of America (USA) has conducted numerous flight tests of the hypersonic vehicle HTV-2 [3]. Hypersonic vehicles have an exceptionally long range, which limits the feasibility of using basic tracking or proportional guidance methods that simply serve to aim and shoot. Effectively modeling the ballistic behavior of hypersonic balanced glide vehicles presents significant challenges that must be addressed for successful guidance.
Several studies have investigated techniques to optimize the vehicle reentry guidance process. Zhao et al. proposed a multi-stage approach utilizing Gaussian pseudo-spectral techniques to optimize reentry vehicle trajectories, accounting for diversions around no-fly zones [5]. This method segmented the entire flight into several phases. While the multi-stage approach addressed the issues related to trajectory optimization, it encountered various challenges when dealing with complex constraints. Zang et al. introduced an online guidance algorithm for hypersonic reentry vehicles with a high lift-to-drag (L/D) ratio, implementing a planar symmetric bank-and-yaw control approach [6]. This method generated viable trajectories during each guidance cycle of the reentry procedure. Although it addressed many limitations, its simplified approach struggled to effectively manage intricate flight conditions. Furthermore, Lu et al. explored glide guiding for hypersonic vehicles with a high L/D ratio. They developed a straightforward yet effective trajectory damping control feedback system using a predictor–corrector guidance algorithm to reduce oscillations during the glide phase [7]. Although this approach enhanced aerodynamic performance, its analysis of conditions was somewhat limited, leading to significant constraints. Bao et al. examined the control and guidance issues of variable-shape hypersonic vehicles, revealing that this strategy substantially improved aerodynamic properties and minimized terminal errors, albeit at the cost of increased vehicle loads and decreased efficiency [8]. Similarly, Hou et al. employed deep learning to investigate intelligent decision-making strategies for variable-configuration aircraft, addressing the challenges of optimal decision-making and constraint management while also factoring in errors [9]. Nonetheless, their approach only considered a single limitation and did not account for real atmospheric conditions. Current methodologies primarily focus on optimization computations derived from trajectory equations, often overlooking the direct impact of aerodynamic parameters on the trajectory. This presents opportunities for further research, particularly in targeting moving objects.
With the advancement of computational fluid dynamics (CFD), significant progress has been made in enhancing the efficiency and computational accuracy of aerodynamic simulations for hypersonic vehicles. Li et al. improved the Boltzmann flux solver, enabling accurate prediction of the thermal characteristics associated with hypersonic flow–heat structure issues [10]. Dong et al. considered various nonequilibrium effects in the flow field, as well as thermal radiation from the surface, catalytic effects, ablation effects, and thermal conduction within the thermal protection layer. These considerations effectively improved the accuracy of aerodynamic thermal calculations for hypersonic vehicles [11]. Additionally, Cao et al. proposed an adaptive fast smooth second-order sliding mode fault-tolerant control scheme, which significantly enhanced the system’s stability and robustness [12]. Consequently, employing CFD for simulation and optimization has become an effective modeling approach.
This work presents a balanced gliding ballistic modeling technique designed for hypersonic flight vehicles, specifically aimed at overcoming the challenges associated with ballistic modeling through aerodynamic iteration. The Mars-16B hypersonic gliding missile exemplifies a technology that integrates real aerodynamic data to achieve accurate ballistic trajectory modeling for targeting time-sensitive objects. By utilizing multiple iterations, the method effectively addresses the time-sensitivity issues involved in striking moving targets. Figure 1 depicts the research methodology of the aerodynamic iteration-based modeling technique used for developing the balanced gliding ballistic trajectory of hypersonic flight vehicles.
The aerodynamic iteration process involves conducting simulations based on shape reconstruction for aerodynamic analysis. Before performing these simulations, the Knudsen number is calculated, an appropriate simulation equation is selected, and aerodynamic coefficients are computed based on specific altitude and velocity conditions. These coefficients serve as inputs for ballistic modeling. If the ballistic deviation meets the required standards, the iteration process terminates; otherwise, altitude and velocity data from locations with significant deviations are used as feedback for further aerodynamic computations. This modeling approach generates simulated trajectory curves that closely resemble real flight conditions, thereby improving flight state parameters. It supports missile simulations targeting moving objects and provides crucial assistance for modeling the precise trajectory of hypersonic vehicles.

2. Model Method

2.1. Aerodynamic Model of Hypersonic Aircraft

2.1.1. Navier–Stokes (N-S) Equation

CFD aerodynamic computations rely on the Navier–Stokes (N-S) equations, which apply to continuous fluid flow and can model hypersonic vehicles in varying Knudsen number K n < 0.01 conditions. The N-S expressions comprise a series of equations for mass and momentum conservation. The system includes the continuity equation, shown as Equation (1), and the N-S equation, depicted as Equation (2), that apply to both incompressible and compressible flows [13,14,15]. Additionally, there is an energy equation, which is expressed mathematically in Equation (3), The full list of variables can be found in the Appendix A.
ρ t + ( ρ u ) = 0
ρ u t + u u = p + τ + f
( ρ E ) t + [ u ( ρ E + p ) ] = ( τ u ) q + ρ f u
In these equations, ρ denotes fluid density, u represents the velocity vector, t signifies time, is the divergence operator, τ symbolizes the viscous stress tensor, μ is the dynamic viscosity, λ s represents the second viscosity, p indicates fluid pressure, f is the external force per unit volume (e.g., gravity), E signifies total energy per unit mass, and q represents the heat flux vector.
p = ρ R T
These equations are defined by the ideal gas law, which incorporates the gas constant R and temperature T .
The upper limit for applying the classical first-order slip condition under standard conditions is K n = 0.1 . Alibeskok et al. introduced a second-order slip condition suitable for a broader spectrum of Knudsen numbers and was accompanied by the subsequent formulas for velocity slip and temperature jump [16]:
u s = u w + 2 σ v σ v K n l b K n u n w
T s = T w + 2 σ T σ T 2 γ s + 1 λ T T n w
where s represents the slip value, while the non-sliding wall surface value can be either first-order or second-order and is given by w , b = 0 / 1 , and the specific heat ratio is γ s .

2.1.2. Boltzmann Equation

The Boltzmann equation applies to both free-flow calculations and hypersonic aerodynamic analyses for K n > 0.1 . A unified equation for the gas molecule velocity distribution function was developed for supersonic flow conditions by incorporating gas molecule collision relaxation parameters v g along with local equilibrium distribution functions f N for simulation verification and analysis. The dimensionless representation is as follows [17,18,19]:
f g t + V m f g r = ν g ( f N f g )
f N = f M 1 + ( 1 P r ) c q 2 c 2 / T 5 5 P T / 2
f M = n / ( π T ) 3 / 2 exp ( c 2 / T )
ν g = 2 α ( 5 2 ω ) ( 7 2 ω ) 5 ( α i + 1 ) ( α i + 2 ) π 1 K n n T ( 1 χ )
K n = λ / L
In this equation, f g is the gas molecular velocity distribution function dependent on position space r , molecular velocity V m , and time t , and f M represents the local Maxwell equilibrium distribution function. Additionally, n , P , T signify gas molecular number density, pressure, and temperature, respectively; c denotes the thermal velocity of gas molecules; q is the heat flux vector; and P r is the dimensionless Prandtl number, which connects the gas viscosity transport coefficient u , specific heat C p at constant pressure, and thermal conductivity K using the following expression: P r = μ C p / K . Similarly, χ is the power exponent characterizing the interactions rules governing gas molecules, with ω and α i representing the interaction indices for hard-sphere and soft-sphere molecular models, respectively. K n signifies the flow regime control parameter that indicates the degree of gas rarity in each flow regime.

2.2. Ballistic Modeling Model

2.2.1. Kinetic Model

The boost phase occurs when the rocket engine propels the missile to achieve the required separation velocity. A dynamic model must account for the effects of propulsion, gravity, aerodynamic forces, and the coupling of rigid body motion. The dynamic model of the boost phase is formulated with missile dynamic equations that delineate the correlation between the forces exerted on the missile and its acceleration. The dynamic equations concerning the center of mass in the launch coordinate system are as follows [20,21,22]:
V ˙ = T cos α D m g sin γ γ ˙ = T sin α + L m V g cos γ V h ˙ = V sin γ r ˙ = V cos γ
Key parameters that influence speed (V) include the heading angle, altitude, range, propulsion, drag (D), lift (L), angle of attack ( α ), and time-varying mass ( m ).
Following separation, the vehicle transitions into the unpowered gliding phase, during which it fulfills the conditions for balanced gliding (where L equals centrifugal force). The equations that govern the six-degree-of-freedom dynamic system for dimensionless reentry of hypersonic vehicles can be formulated as follows [21,23,24]:
z ˙ λ ˙ ϕ ˙ v ˙ γ ˙ ψ ˙ = v sin γ v cos γ sin ψ / ( z cos ϕ ) v cos γ cos ψ / z D ¯ sin γ / z 2 L ¯ cos σ / v + ( v 2 1 / z ) cos γ / ( v z ) L ¯ sin σ / ( v cos γ ) + v cos γ sin ψ tan ϕ / z
Can be abbreviated as:
x ˙ = d x d τ = f x ( t ) , u ( t )
In the equation, x = z , λ , ϕ , v , γ b , ψ T , u = σ is the state variable functioning as the control variable, λ , ϕ , γ , ψ , σ represent the longitude, latitude, ballistic inclination, deflection angle, and tilt angle, respectively. Similarly, τ , z , v denote the dimensionless aspect of time, altitude, and velocity, respectively.
τ = t R 0 / g , z n = r r R 0 = R 0 + H R 0 , v n = V g R 0
The equations incorporate the Earth’s radius, time, gravitational acceleration, flight altitude, and speed.
The dimensionless lift and drag coefficients are represented by L ¯ = L / m g , D ¯ = D / m g , respectively, along with the lift force L and drag force D, which can be expressed as follows:
L = S ref 2 ρ V 2 C L D = S ref 2 ρ V 2 C D
In the equation, S r e f is the reference region associated with the airplane. The atmospheric density is determined using the exponential equation as follows [21,23,24]:
ρ = ρ 0 exp β r R 0 ρ 0 = 1.225 , β = 1 / 7200
In this equation, ρ 0 represents atmospheric density at sea level, β is attenuation coefficient, and r R 0 signifies altitude.
The pneumatic coefficient model can be represented as follows [21,23,24]:
C L = 0.0002602 α 2 + 0.016292 α 0.041065 C D = 0.86495 C L 2 0.03026 C L + 0.080505
Here, α denotes the angle of attack, C L represents the lift coefficient, and C D is the drag coefficient. This formula depicts an aerodynamic coefficient fitting equation derived for hypersonic flight conditions, capturing the nonlinear aerodynamic characteristics of hypersonic gliders. While C L typically increases with α , nonlinear effects become pronounced at hypersonic speeds, warranting a quadratic representation. The term −0.041065 indicates a small negative lift that persists at α = 0, while 0.01629 indicates the linear sensitivity of lift to α , and 0.0002602 accounts for nonlinear lift effects. In the C D expression, the value 0.080505 represents the zero lift–drag coefficient, 0.86495 denotes the induced drag coefficient (which is proportional to the square of lift), and −0.03026 accounts for lift–drag coupling effects.
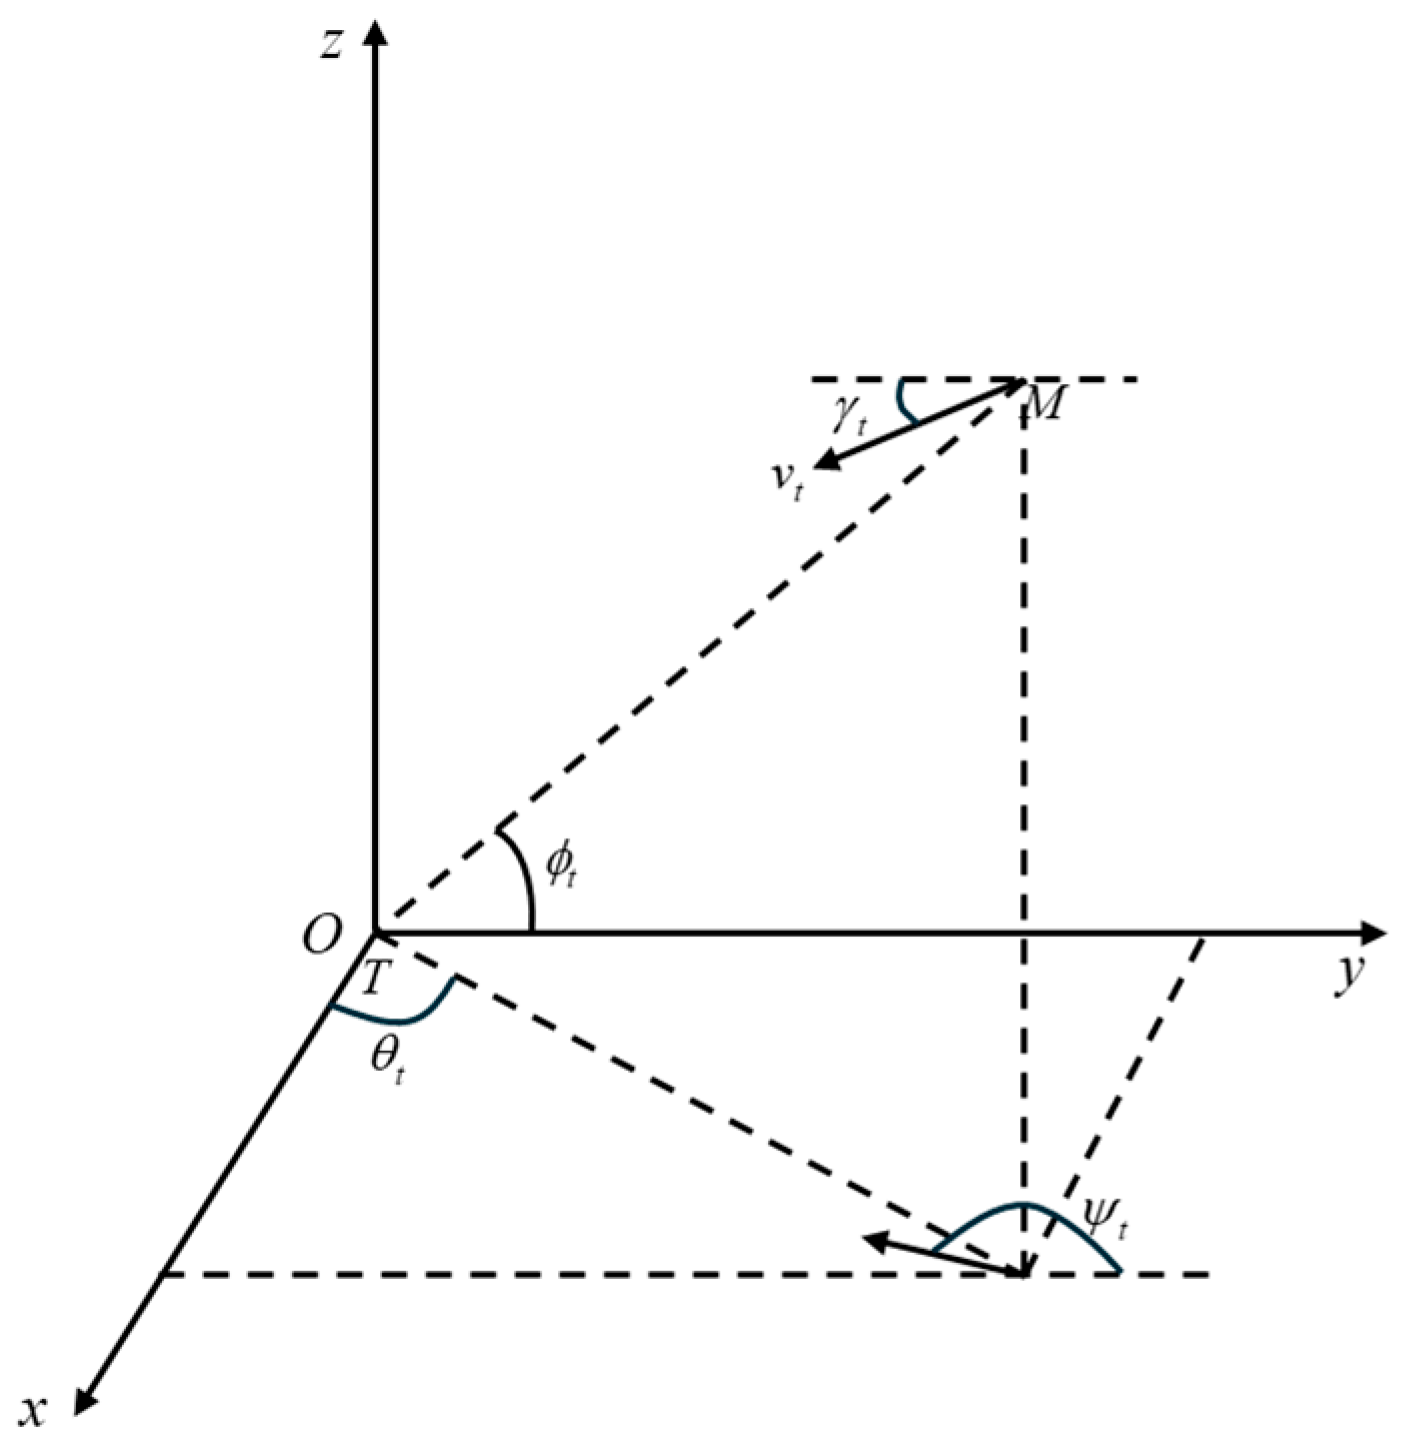
Next, a terminal guidance model is developed. In the terminal guiding phase, the missile executes real-time adjustments to ascertain the target’s location, considering their relative motion in three-dimensional space, as illustrated in Figure 2 [25,26,27].
As illustrated in Figure 2, the term O x y z denotes the ground coordinate system, where M and T represent the missile and target, respectively. Similarly, the distance between missile and target is shown as r t . The pitch and yaw line-of-sight angles are denoted by ϕ t and θ t , respectively. The direction presented in the illustration is considered positive. Furthermore, v t , γ t , ψ t denote the missile’s velocity, ballistic inclination, and deflection angles, respectively. The γ t direction indicated in the figure is positive, whereas the opposing direction is negative. Figure 2 also portrays the derivation of the equations governing the relative velocity between the missile and the target. The yaw rate lead angle can be mathematically represented as follows: η = θ + ψ t + ( π / 2 ) .
r ˙ = v ( sin ϕ sin γ cos η cos ϕ cos γ ) ϕ ˙ = v ( sin γ cos ϕ + cos γ sin ϕ cos η ) / r θ ˙ = [ v cos γ cos ( ψ + θ ) ] / ( r cos ϕ )

2.2.2. Constraint Model

Hypersonic high-lift ratio reentry vehicles experience flying limitations due to intricate factors, including heat flux density, overload, and dynamic pressure [28].
Q s = k h ρ 1 / 2 V 3.15 < Q s max ,
N = D 2 + L 2 / ( m g 0 ) < N max ,
q d = ρ V 2 / 2 < q d max ,
Here, Q s is the heat flux density, N is the total overload, q d is the dynamic pressure, k h is a constant coefficient, and D and L are the aerodynamic drag and lift, expressed analytically as D = C D q S and L = C L q S , respectively.

2.3. Pneumatic–Ballistic Coupling Iterative Algorithm Model

The model utilizes an offline aerodynamic database in conjunction with an online ballistic iteration strategy, enabling accurate predictions of the ballistic trajectory through multiple aerodynamic–ballistic coupling iterations. The procedure for the kth iteration is as follows [29]:
C L ( k ) = Interp ( A e r o D B , M a ( k ) , α ( k ) , h ( k ) )
X ( k + 1 ) = ODE - Solver ( F ( k ) , X ( k ) , t )
ϵ ( k ) = V ( k + 1 ) V ( k ) V ( k )
Equation (23) pertains to pneumatic interpolation, Equation (24) addresses ballistic recalculation, and Equation (25) involves assessing residual convergence.
Here, A e r o D B represents the aerodynamic database storing computed aerodynamic data, ϵ ( k ) denotes the residual (the relative velocity error at iteration k), X = [ r , V , q ] T signifies the system state variable, F indicates the net external force, and V represents the aircraft’s velocity.
In regions experiencing rapid pneumatic fluctuations (such as near shock waves), it is important to dynamically increase the quantity of sample sites, as follows:
C ^ L ( k + 1 ) = C L ( k ) + C L M a Δ M a ( k )
In this formula, the increment for querying the Mach number query is applied as Δ M a . If ϵ ( k ) < 10 4 , the maximum iteration count is reached, and the iteration process will terminate.

3. Simulation Verification and Analysis

3.1. Approximate Mars-16B Geometric Modeling

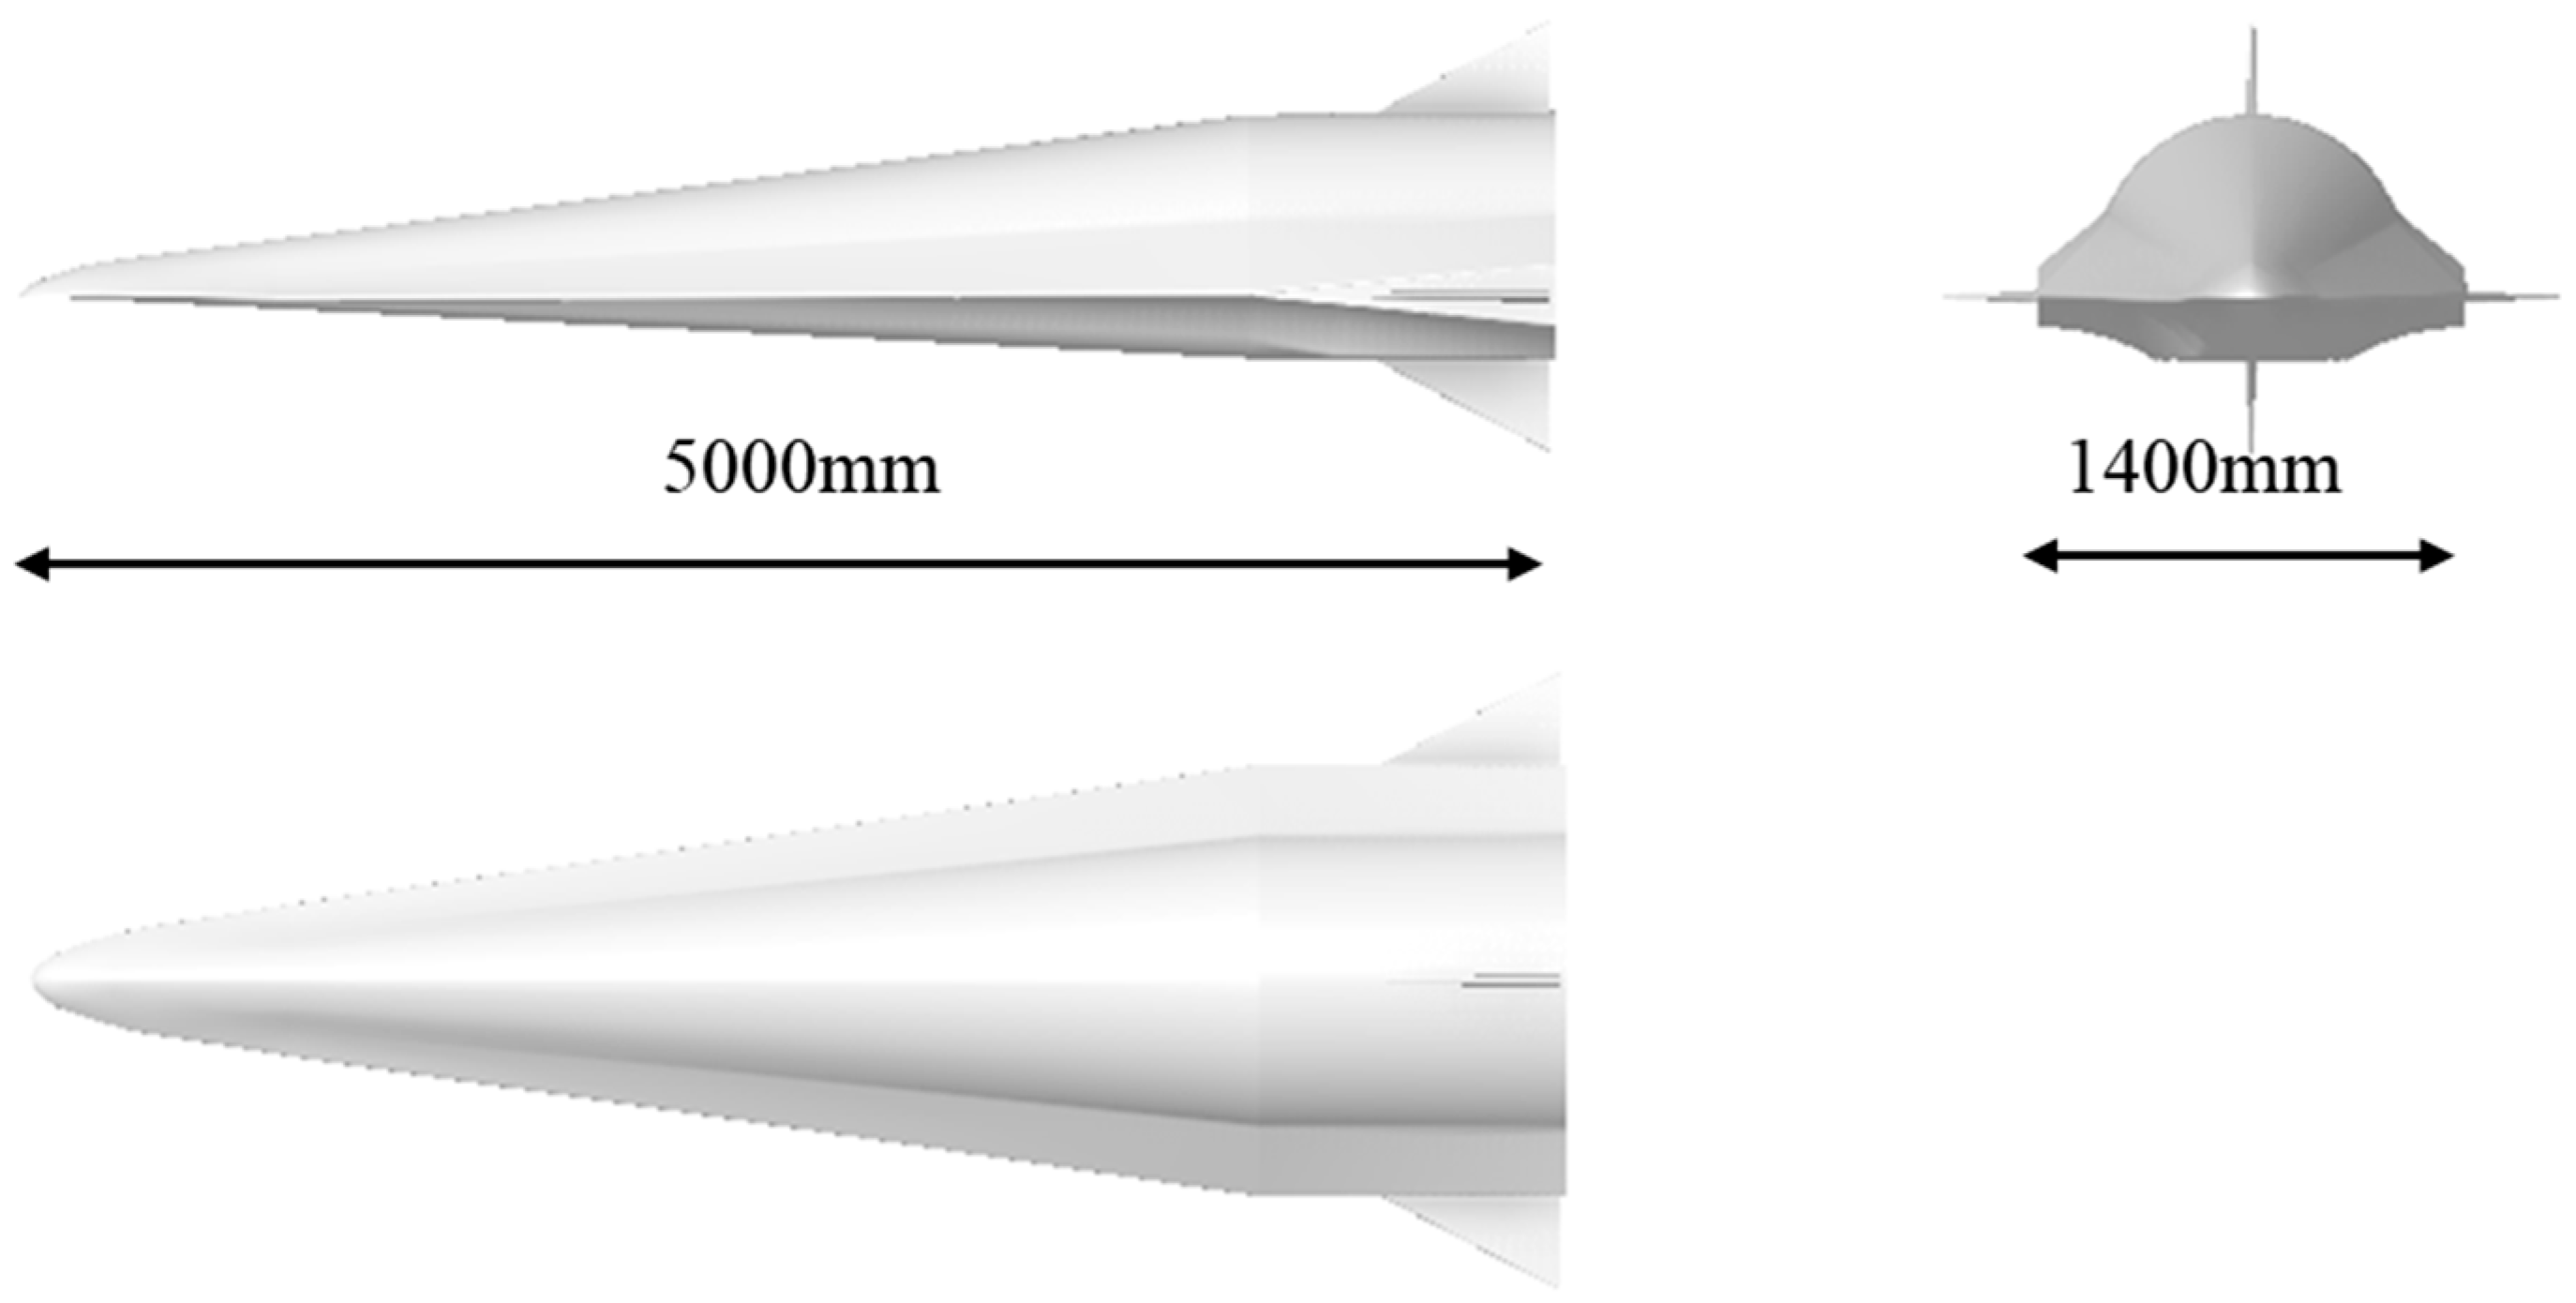
The aerodynamic design of the Mars-16B has not yet been publicly disclosed. Currently, only top, bottom, and side views are available, which provide insufficient information about its overall structure. Based on online sources and public literature, the Mars-16B features a wave-riding body structure that takes advantage of the aerodynamic properties generated by shock wave attachment at the leading edge. This enables efficient flight, characterized by a high L/D ratio and minimal wave drag. This research employs accessible resources, including authentic photographs, videos, and model images, to determine the dimensions of the Mars-16B through reverse modeling and to accurately reproduce its external shape. The specific data is shown in Table 1. Figure 3 displays the model image.

3.2. Pneumatic Calculations

3.2.1. Validation of Pneumatic Simulation Methods

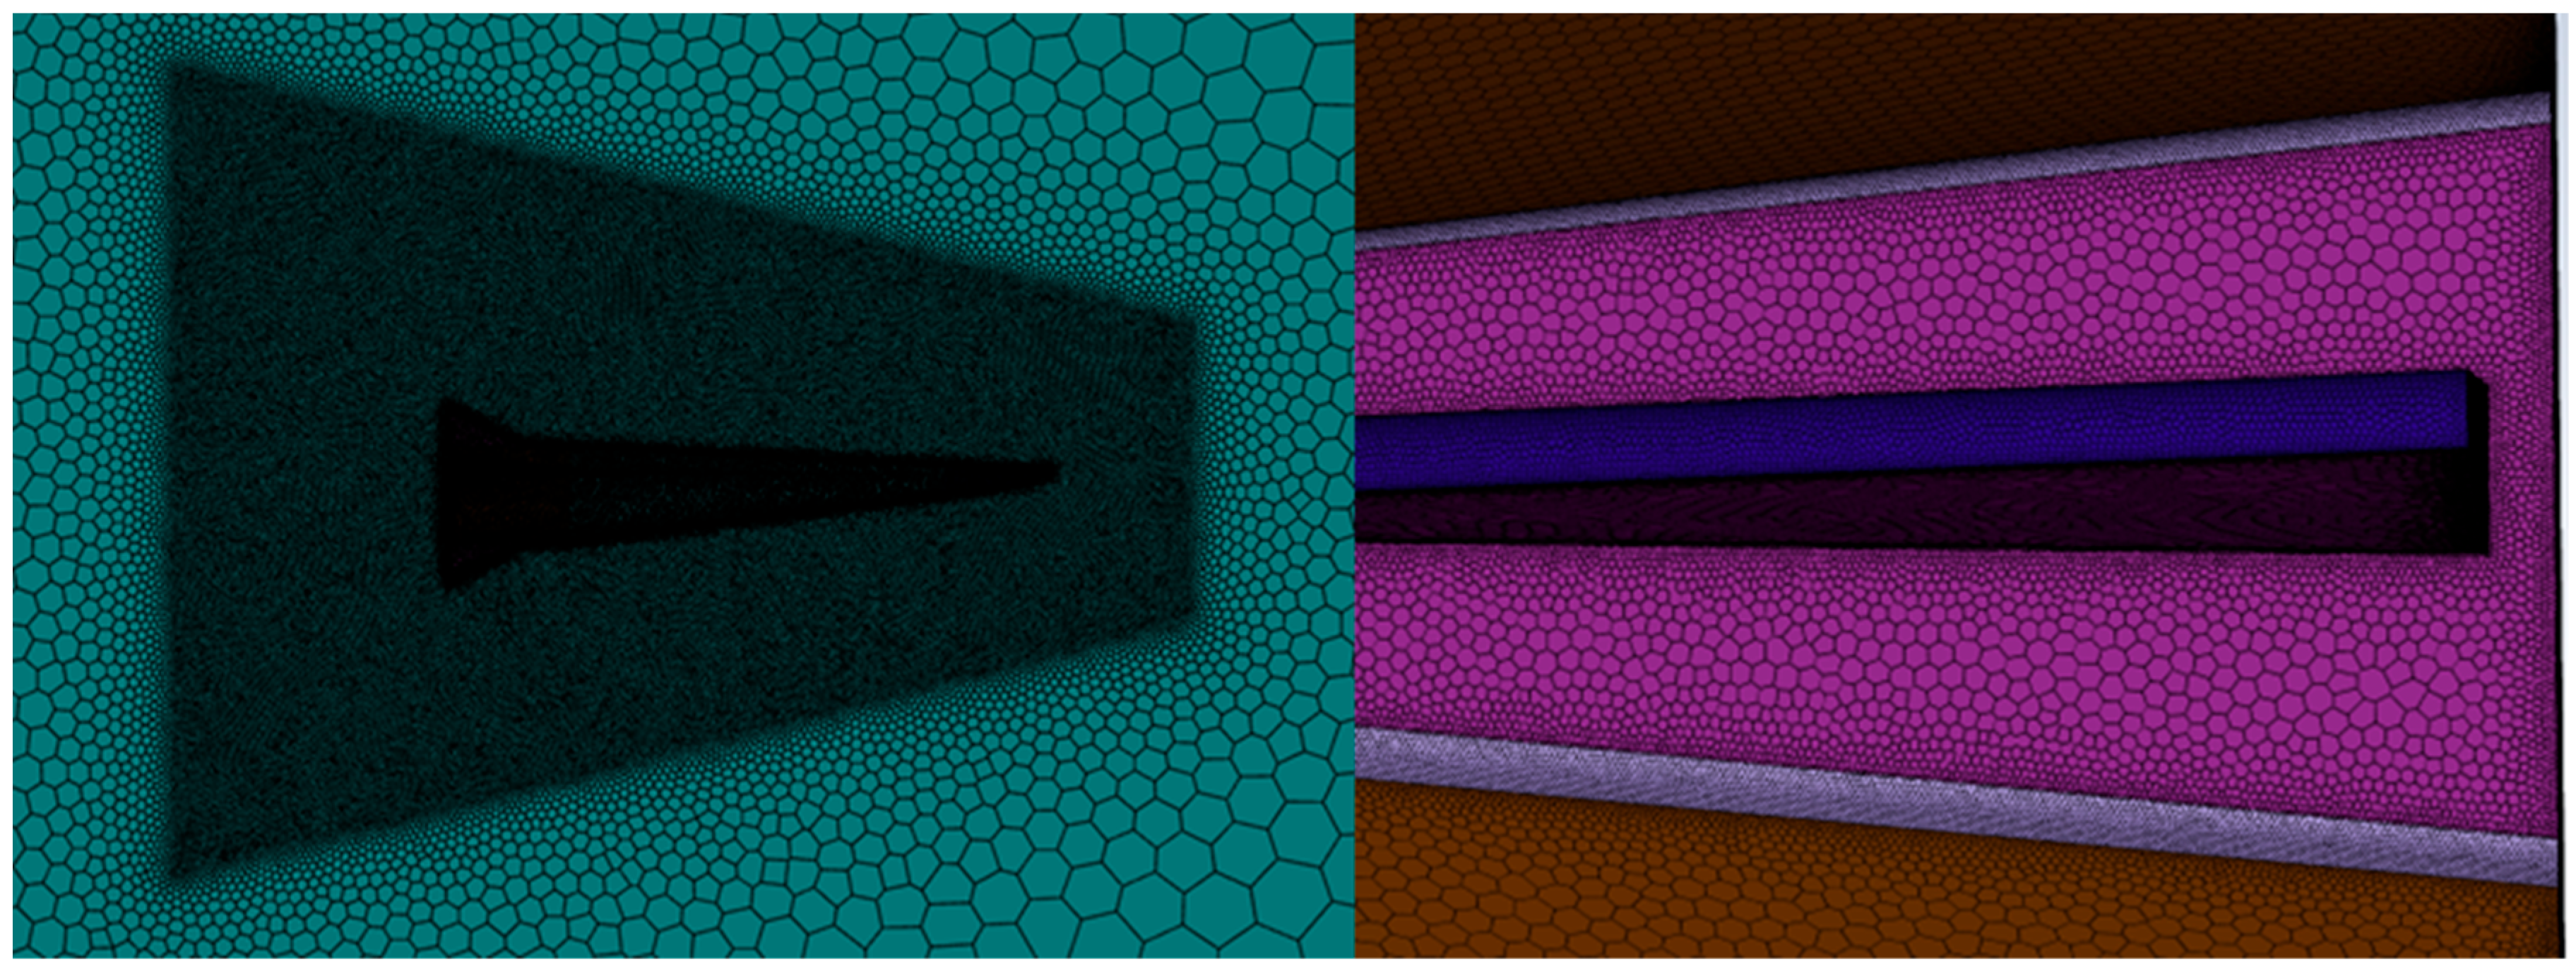
Pneumatic simulations for high-hypersonic flights are performed in this work using a k ω S S T turbulence model, a pressure-based implicit method, a two-temperature model, FMG initialization (which rapidly solves a simplified flow problem on a coarse mesh and then uses that approximate solution as the initial condition for progressively finer meshes), far-field pressure inlet boundary conditions, and a hexahedral basin mesh. Key computations include the CL, CD, L/D ratio, and pitch moment coefficient, along with α ranging from −15° to 30° in 2.5° increments for each altitude condition. It is noteworthy that the grid design must accommodate shock wave formation in hypersonic flow; therefore, the grid size is approximately 1 mm in the nozzle and control surface regions and 7 mm for the body grid. The fluid domain’s grid growth factor is set at 1.2. A densified region is, thus, created around the model based on its flow field to enrich the simulation of shock waves. The grid height for the initial layer is determined by assessing variations in altitude and velocity to effectively partition the grid. At an altitude of 0 km, the height of the first grid layer is 1.03218 × 10⁻⁶ m. The final body grid utilizes a polyhedral grid, which more effectively simulates hypersonic flow. The grid details can be seen in Figure 4. A grid independence verification indicates that the grid demonstrates no significant variations in CL at around 10 million grid points.
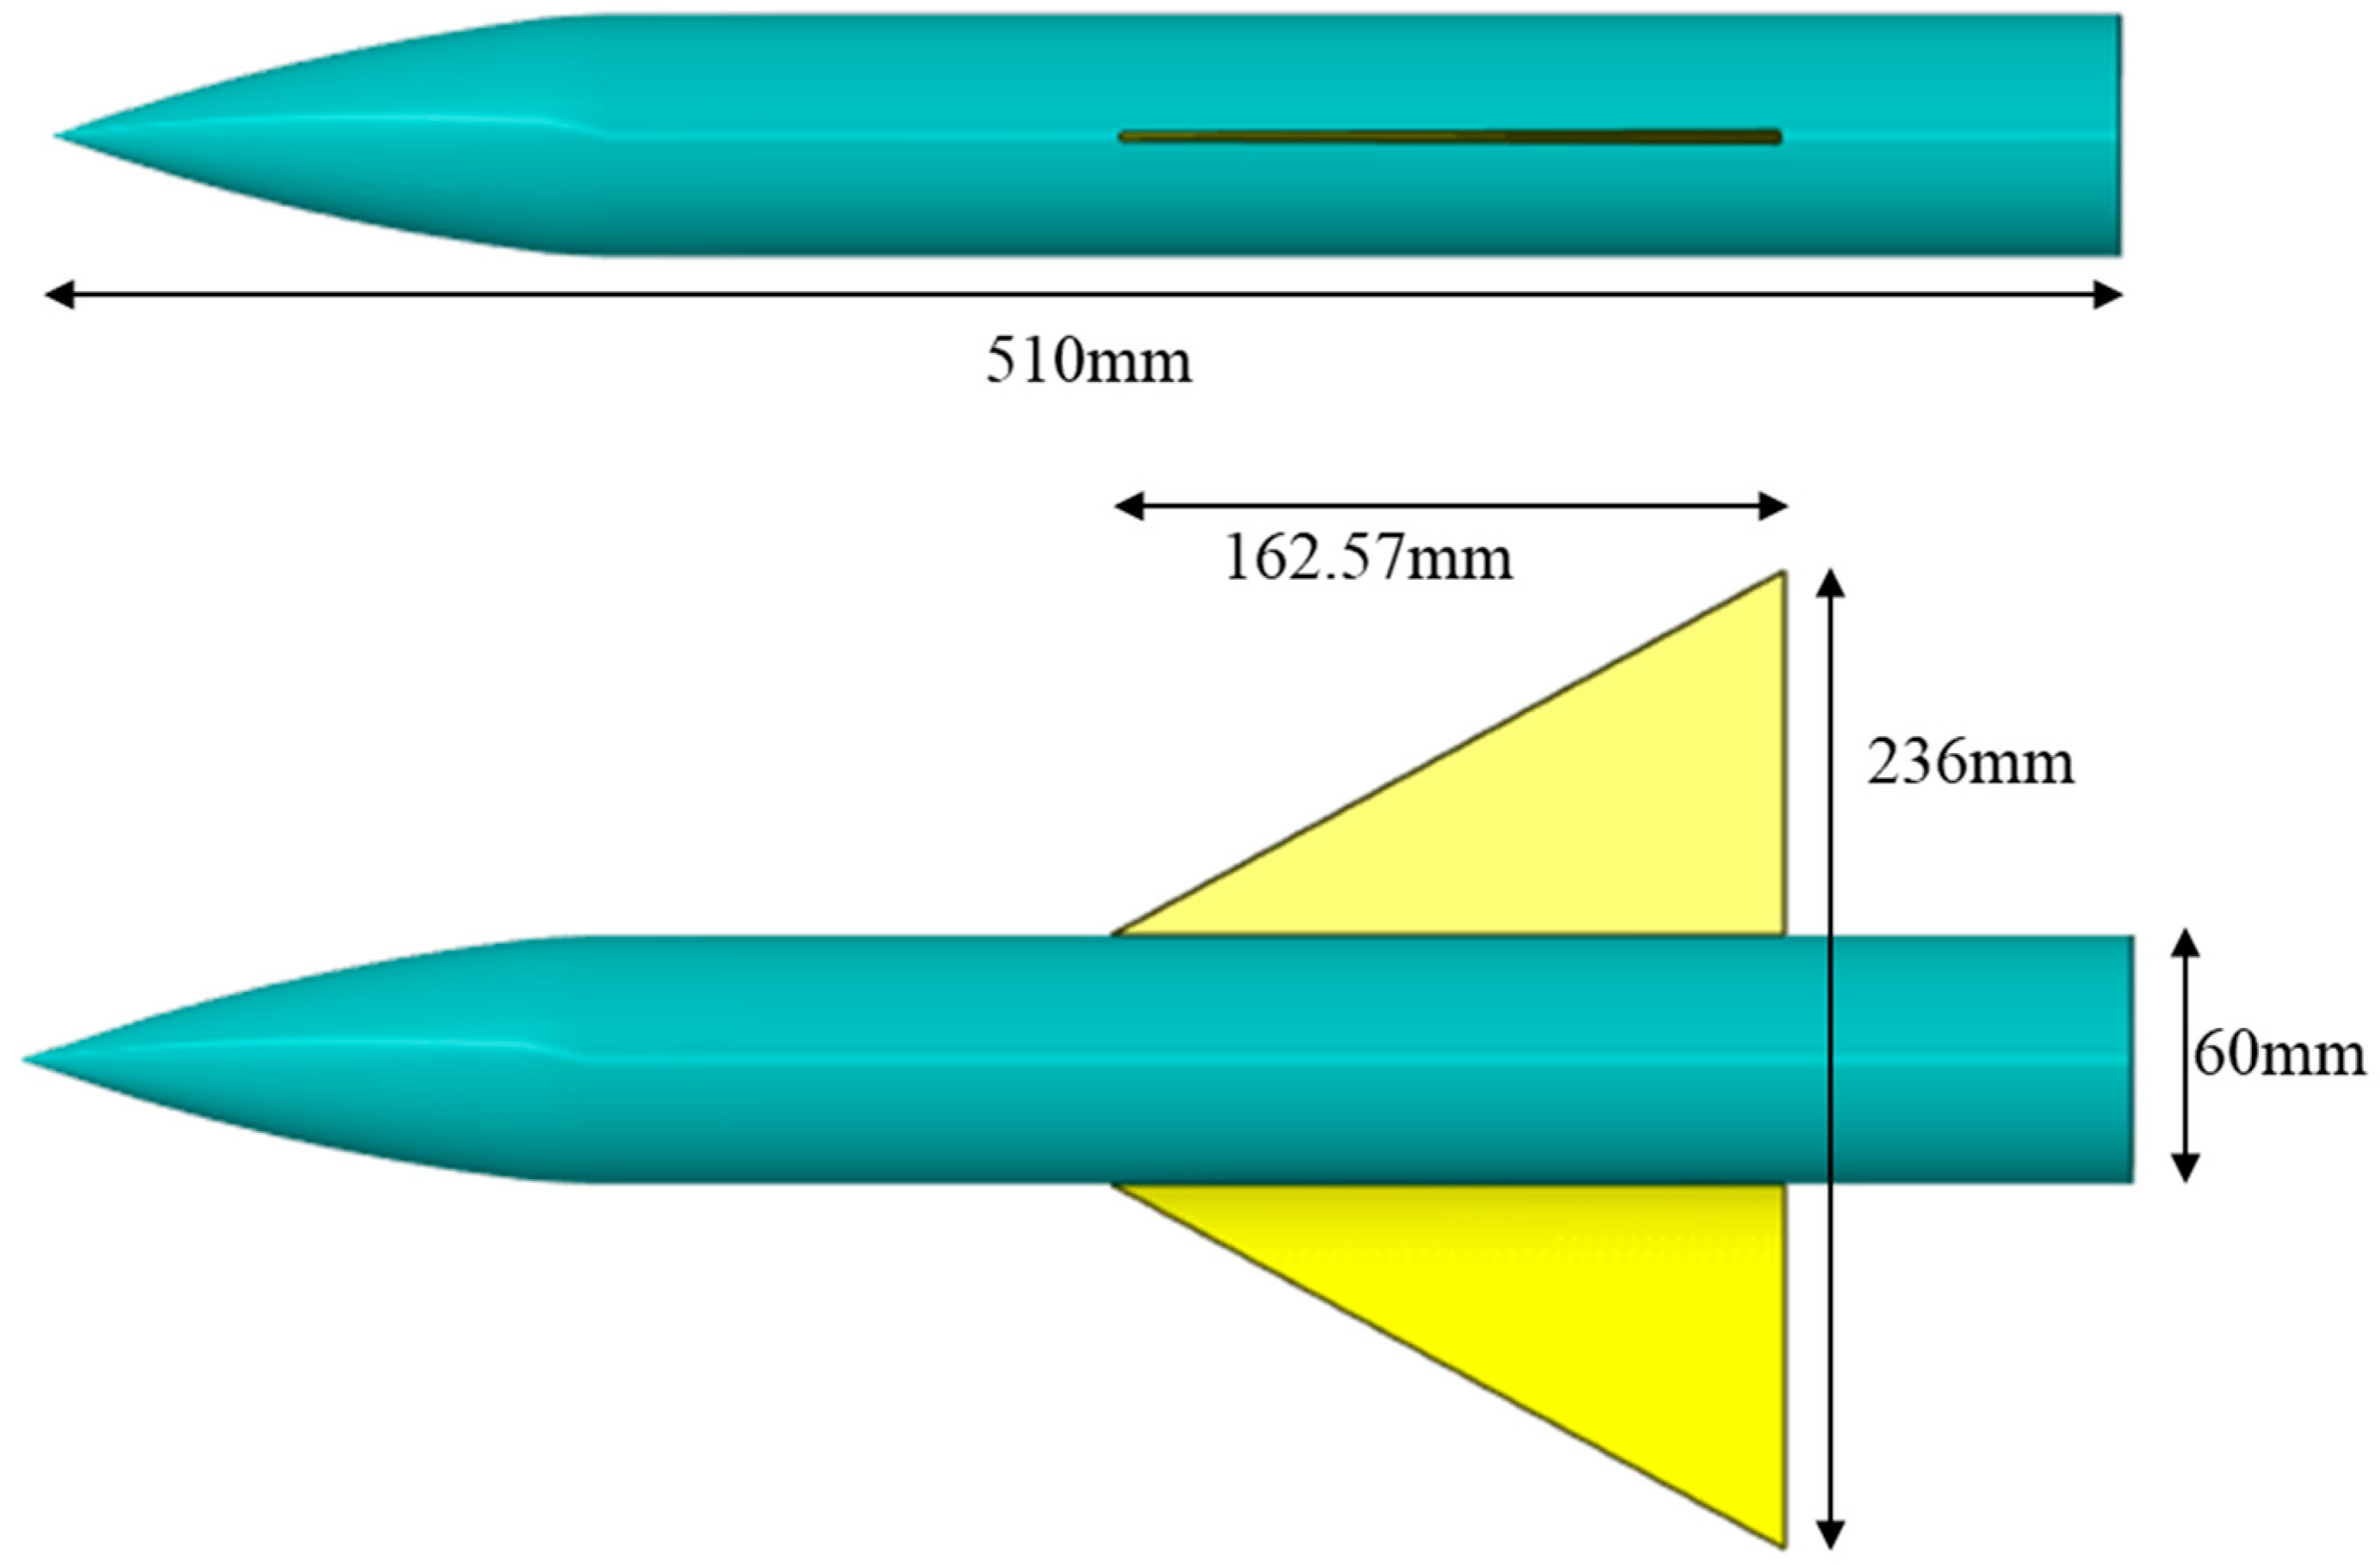
AGARD-B is a hypersonic aerodynamic methodology validation model that can be clearly distinguished from Mars-16B based on its geometric structure. Verification experiments were conducted to assess the accuracy of an aerodynamic method using the AGARD-B standard aerodynamic validation model. The data for the AGARD-B model corresponded to a Mach number of 5, a Reynolds number of 10.7 × 10⁶, a temperature of 216.65 K, a pressure of 12,576.8 Pa, and α range varying from 0° to 12° in 2° increments. The AGARD-B model is illustrated in Figure 5, Blue represents the body of the projectile, while yellow indicates the fins [30].
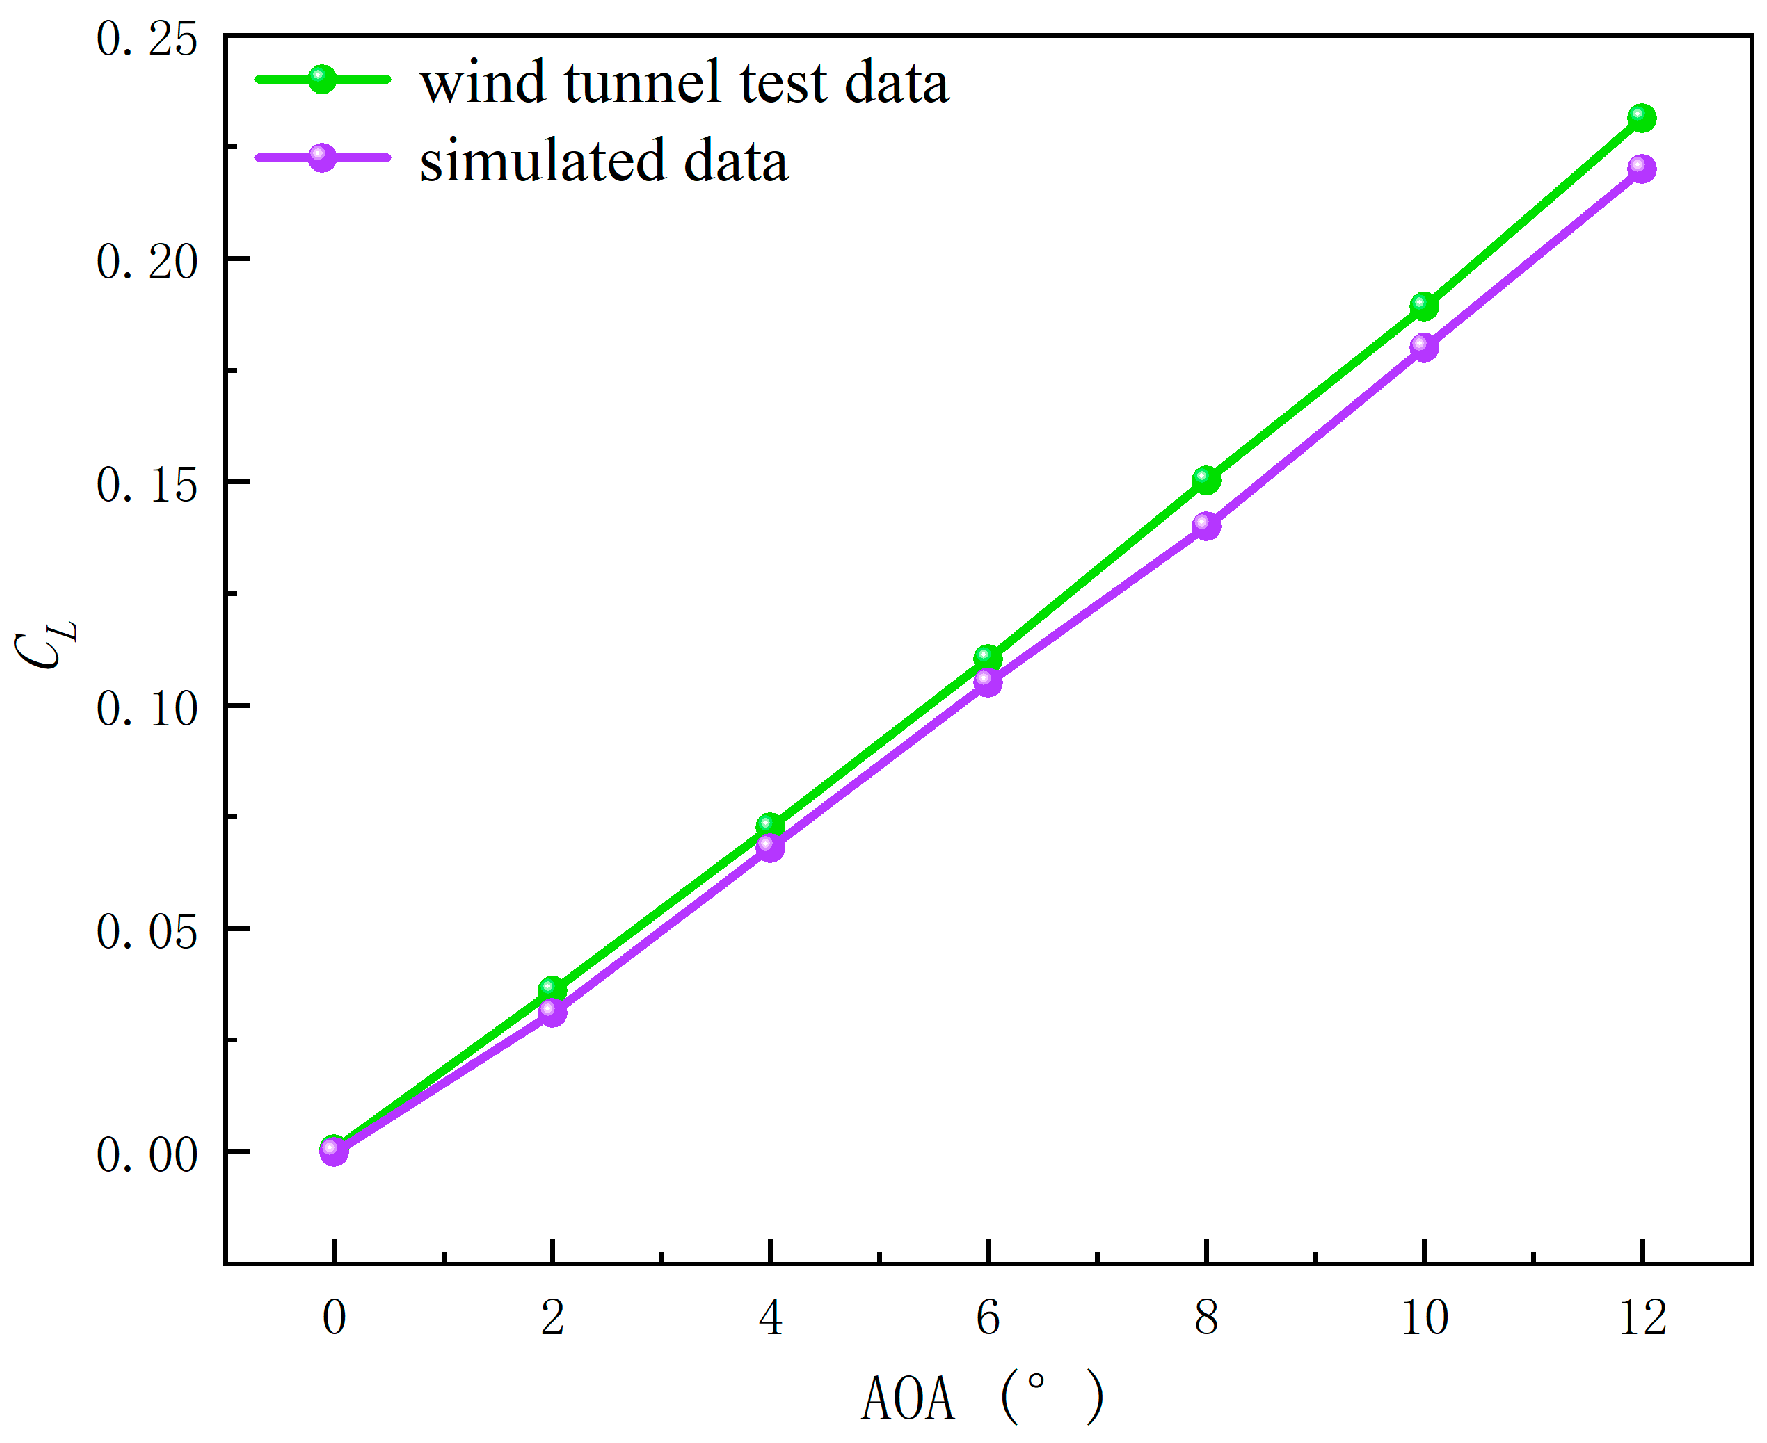
Numerical simulations were performed in strict accordance with the outlined boundary conditions, utilizing a second-order scheme, while maintaining the convergence error below an acceptable threshold of 10−4. Figure 6 presents a comparison of CL obtained from both wind tunnel measurements and numerical models. The maximum discrepancy between the simulated and experimental data is observed to be 4.3%, which confirms the effectiveness of the algorithm developed in this study for simulating hypersonic flow.

3.2.2. Pneumatic Calculations

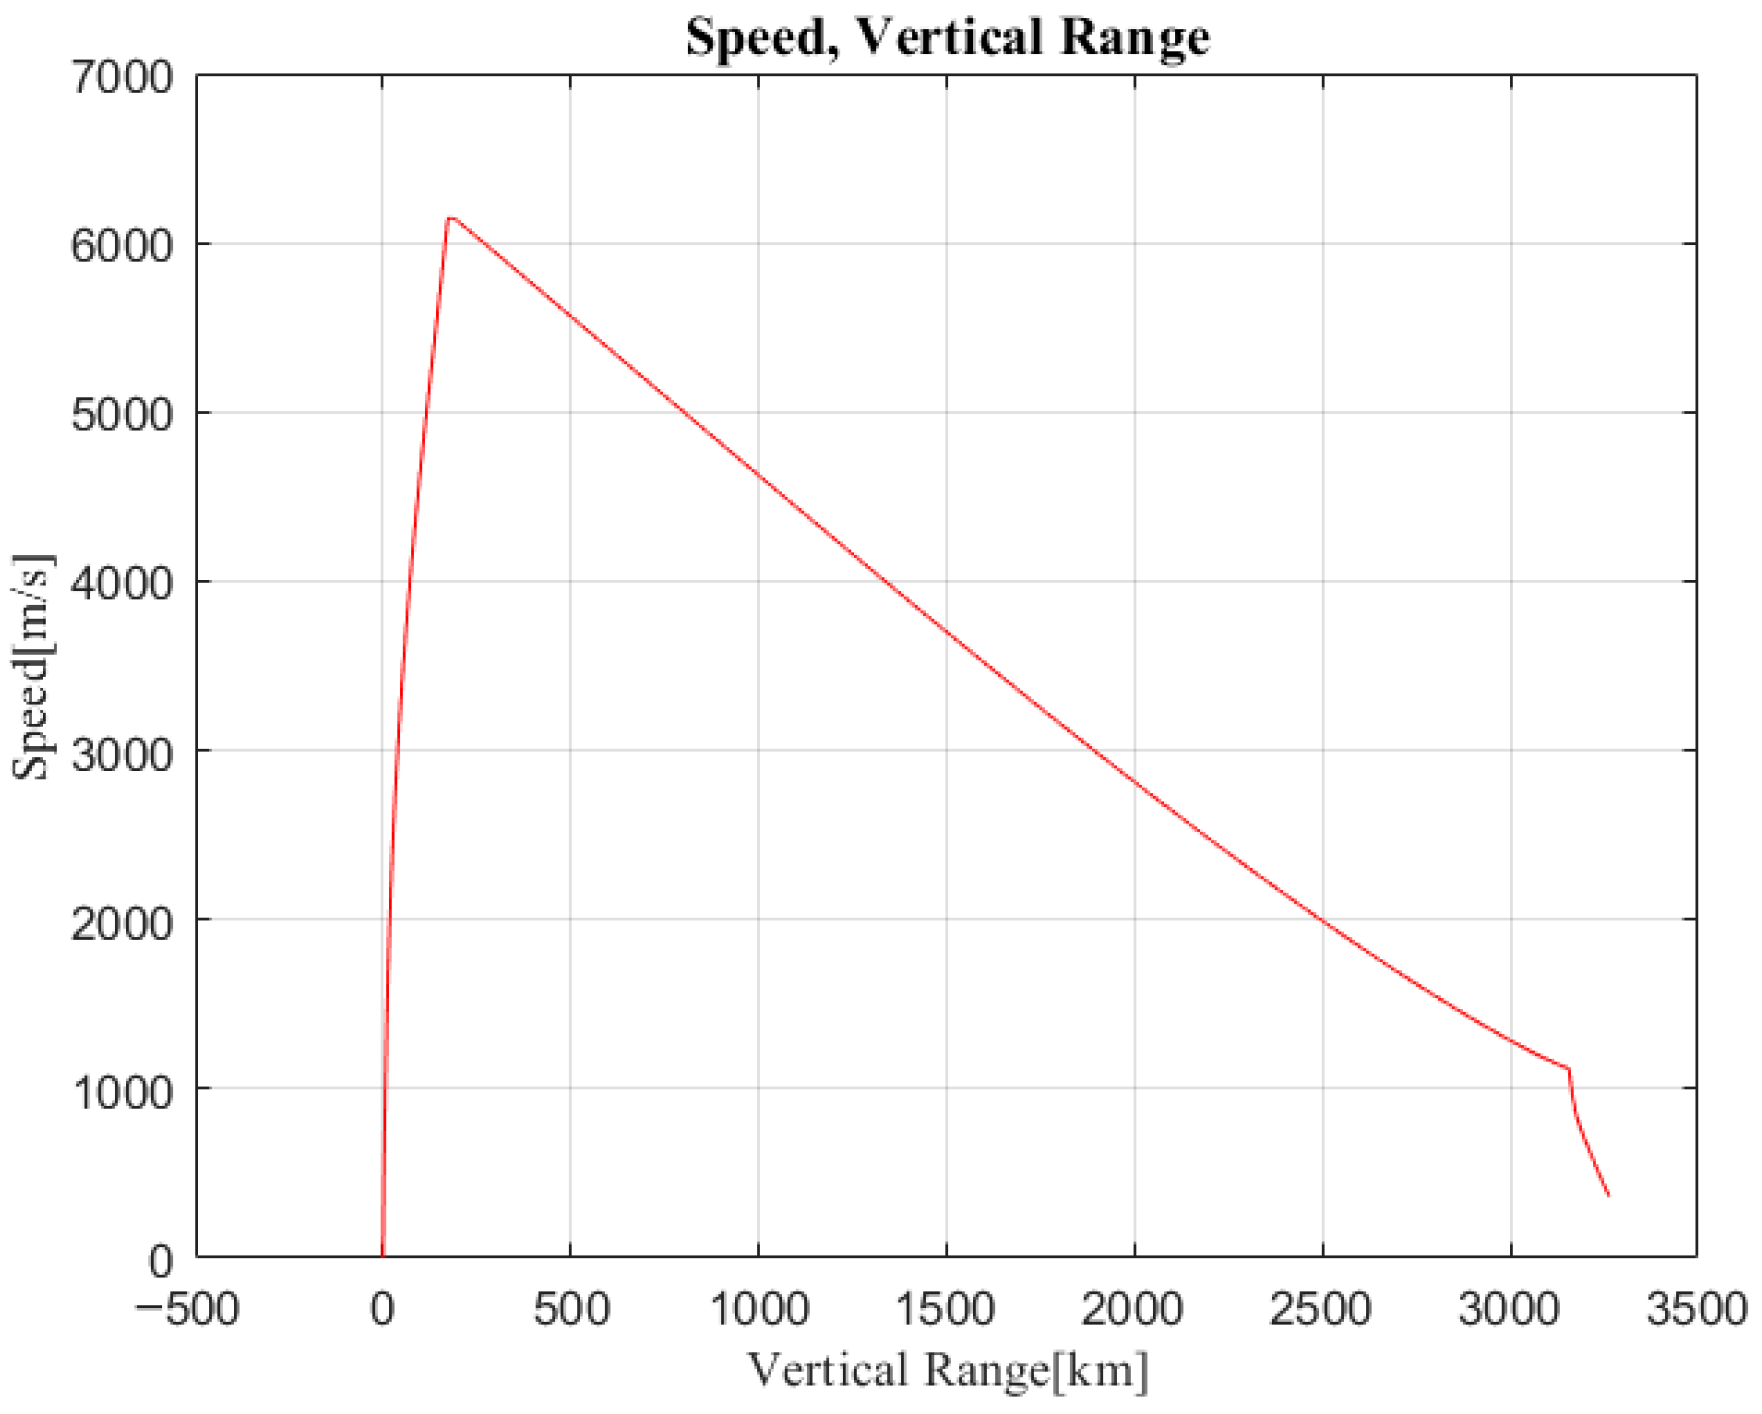
Aerodynamic properties substantially impact ballistic characteristics, and the outcomes of ballistic calculations, particularly those involving high-velocity profiles, subsequently influence the input parameters for aerodynamic assessments [8]. The trajectory of a hypersonic flying vehicle is modeled using ballistic equations that take into account factors such as the launch point, target point, and the missile’s bank angle. This modeling helps to initially determine the trends in flight altitude and velocity, as shown in Figure 7 and Figure 8, respectively.
The missile operates in three phases: boost, glide, and final guidance. It reaches a maximum altitude of approximately 59 km before descending. During the boost phase, the missile’s velocity increases rapidly, but it slows down during the unpowered glide phase until effective guidance is established. Aerodynamic calculations for altitude and velocity are influenced by variations in both factors, as indicated in Table 2.
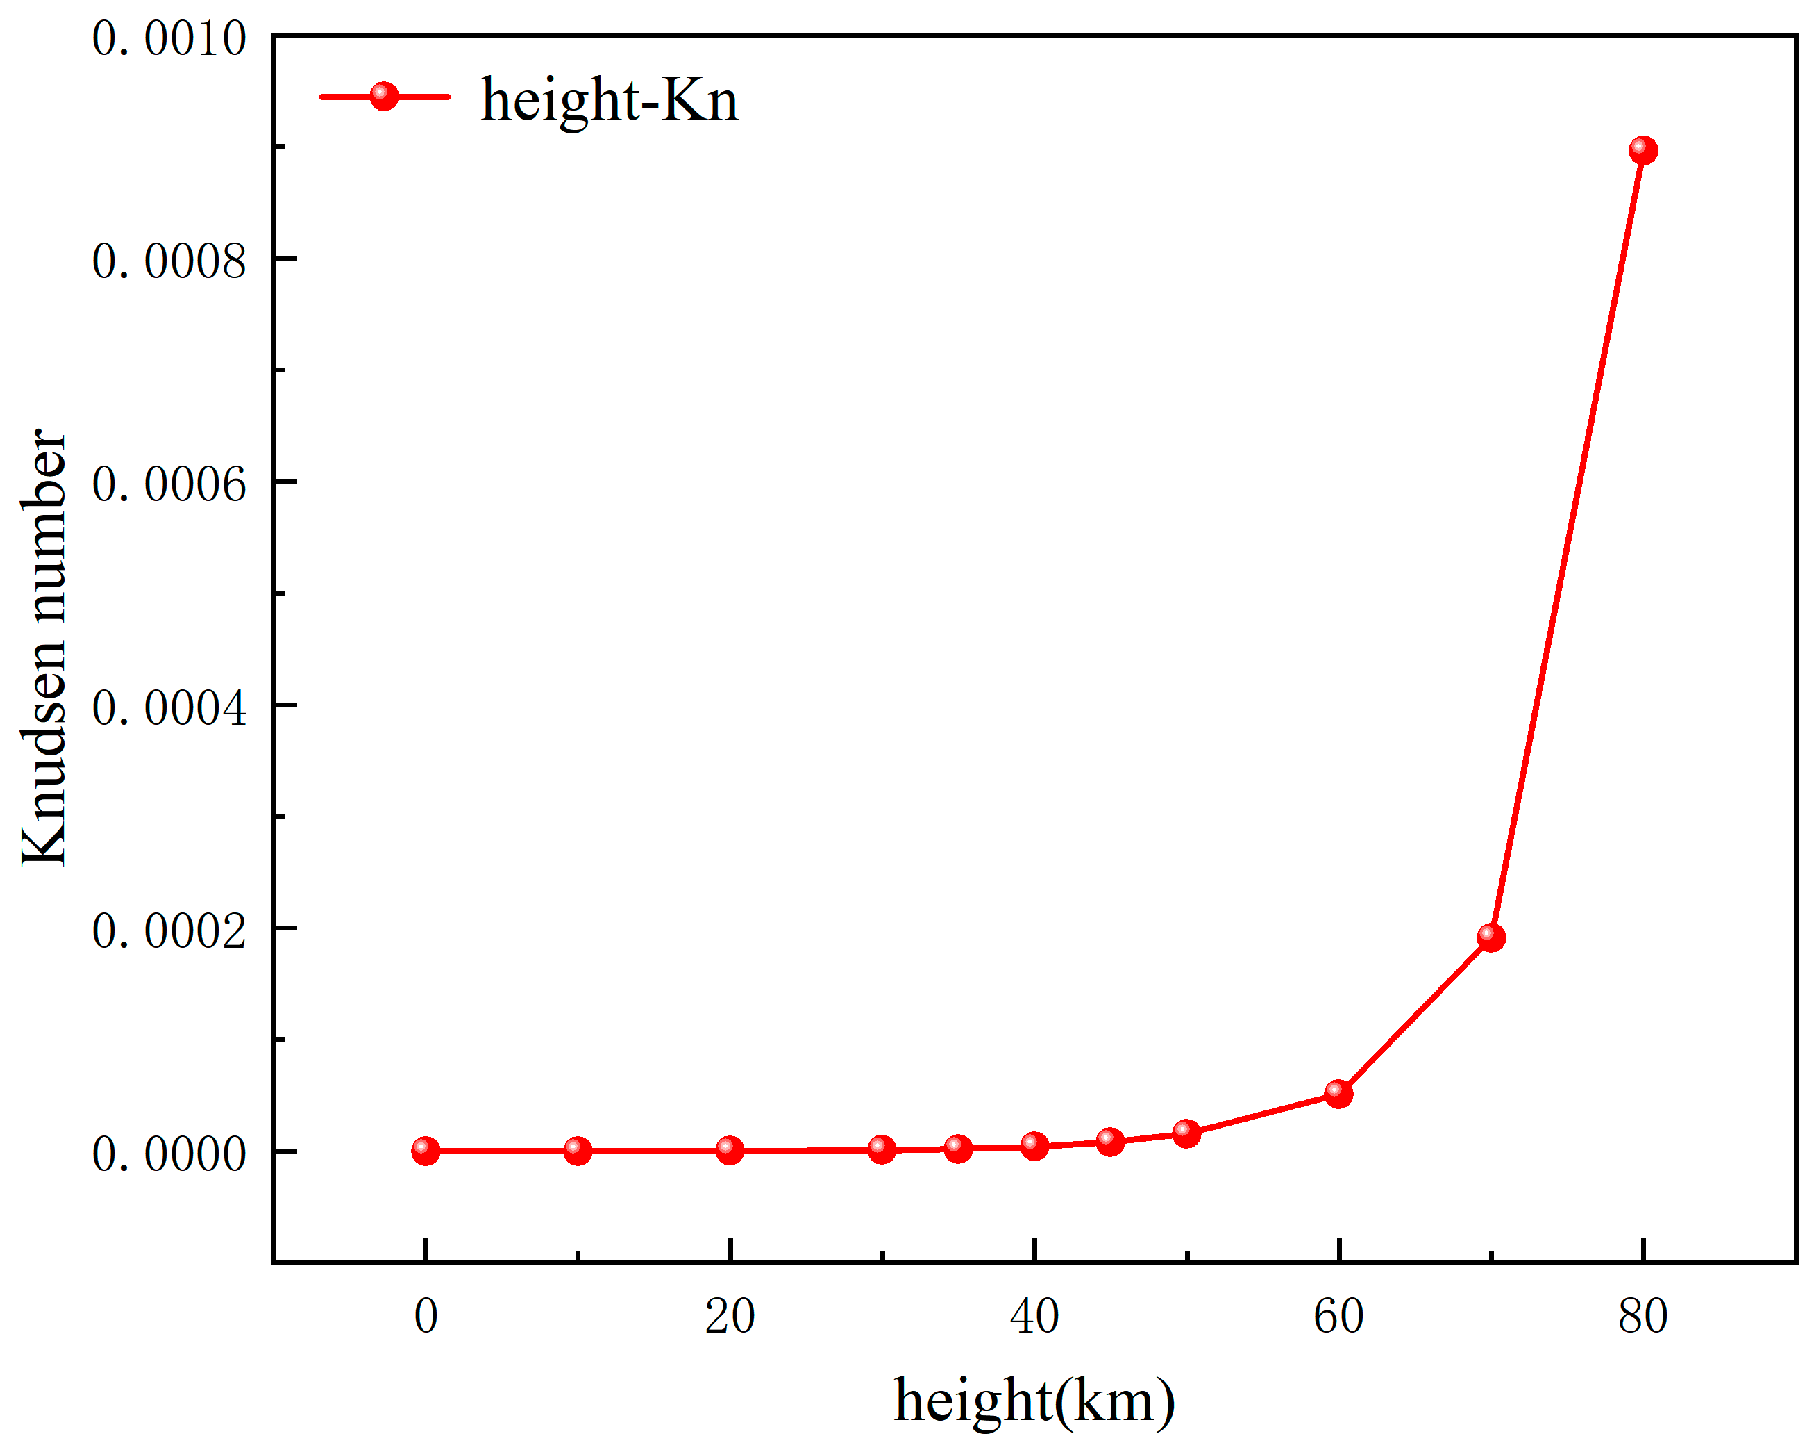
To compute the Knudsen number at different altitudes, 35 km as a reference altitude point has been used in this work. At this point, the Boltzmann constant k B = 1.380649 × 10 23   J / K , temperature T = 236.513   K , molecule diameter d 3.7 × 10 10   m , pressure p = 574.595   Pa , average molecular free path λ = k B T 2 π d 2 p 9.33 × 10 6   m , model characteristic length L = 5   m , and Knudsen number K n = λ L = 9.33 × 10 6 5 1.866 × 10 6 . With these values, it may be concluded that the N-S equations are applicable for computations at 35 km. The Knudsen number pertinent to aerodynamic iterations was also determined, with the findings demonstrating that the N-S equations hold true for calculations at all altitudes listed in Table 2. The trend in the Knudsen number can be seen in Figure 9.
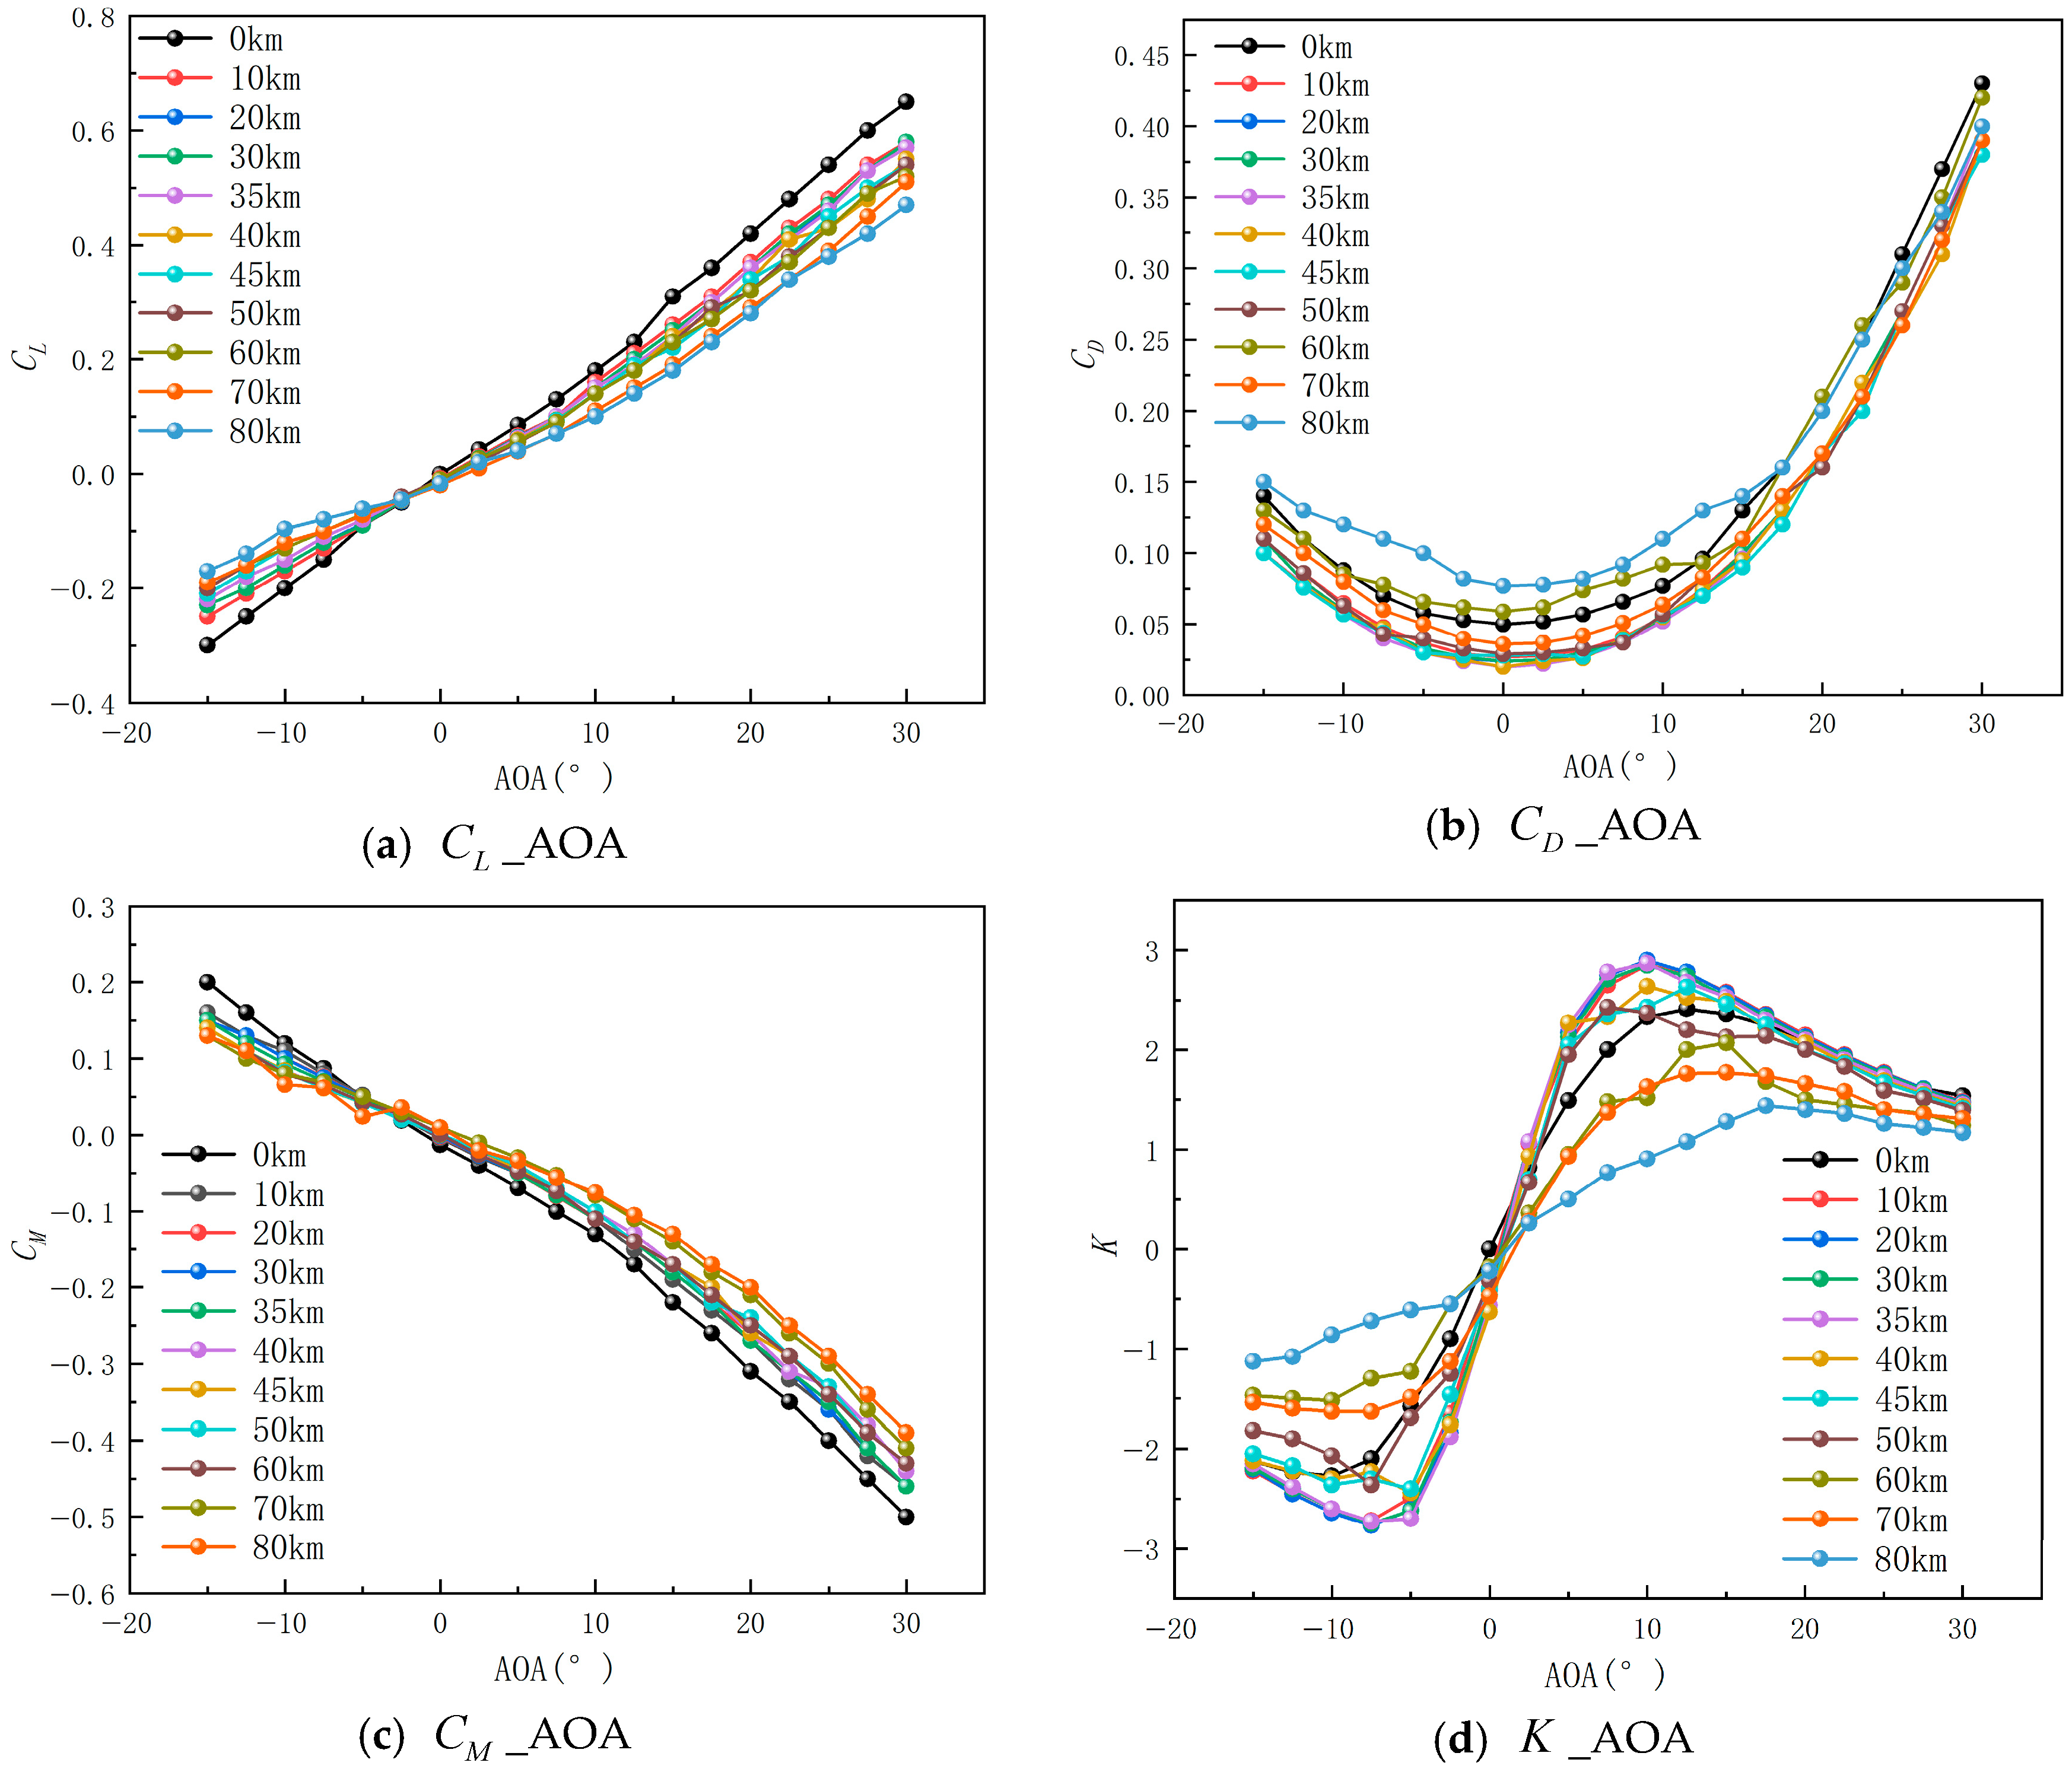
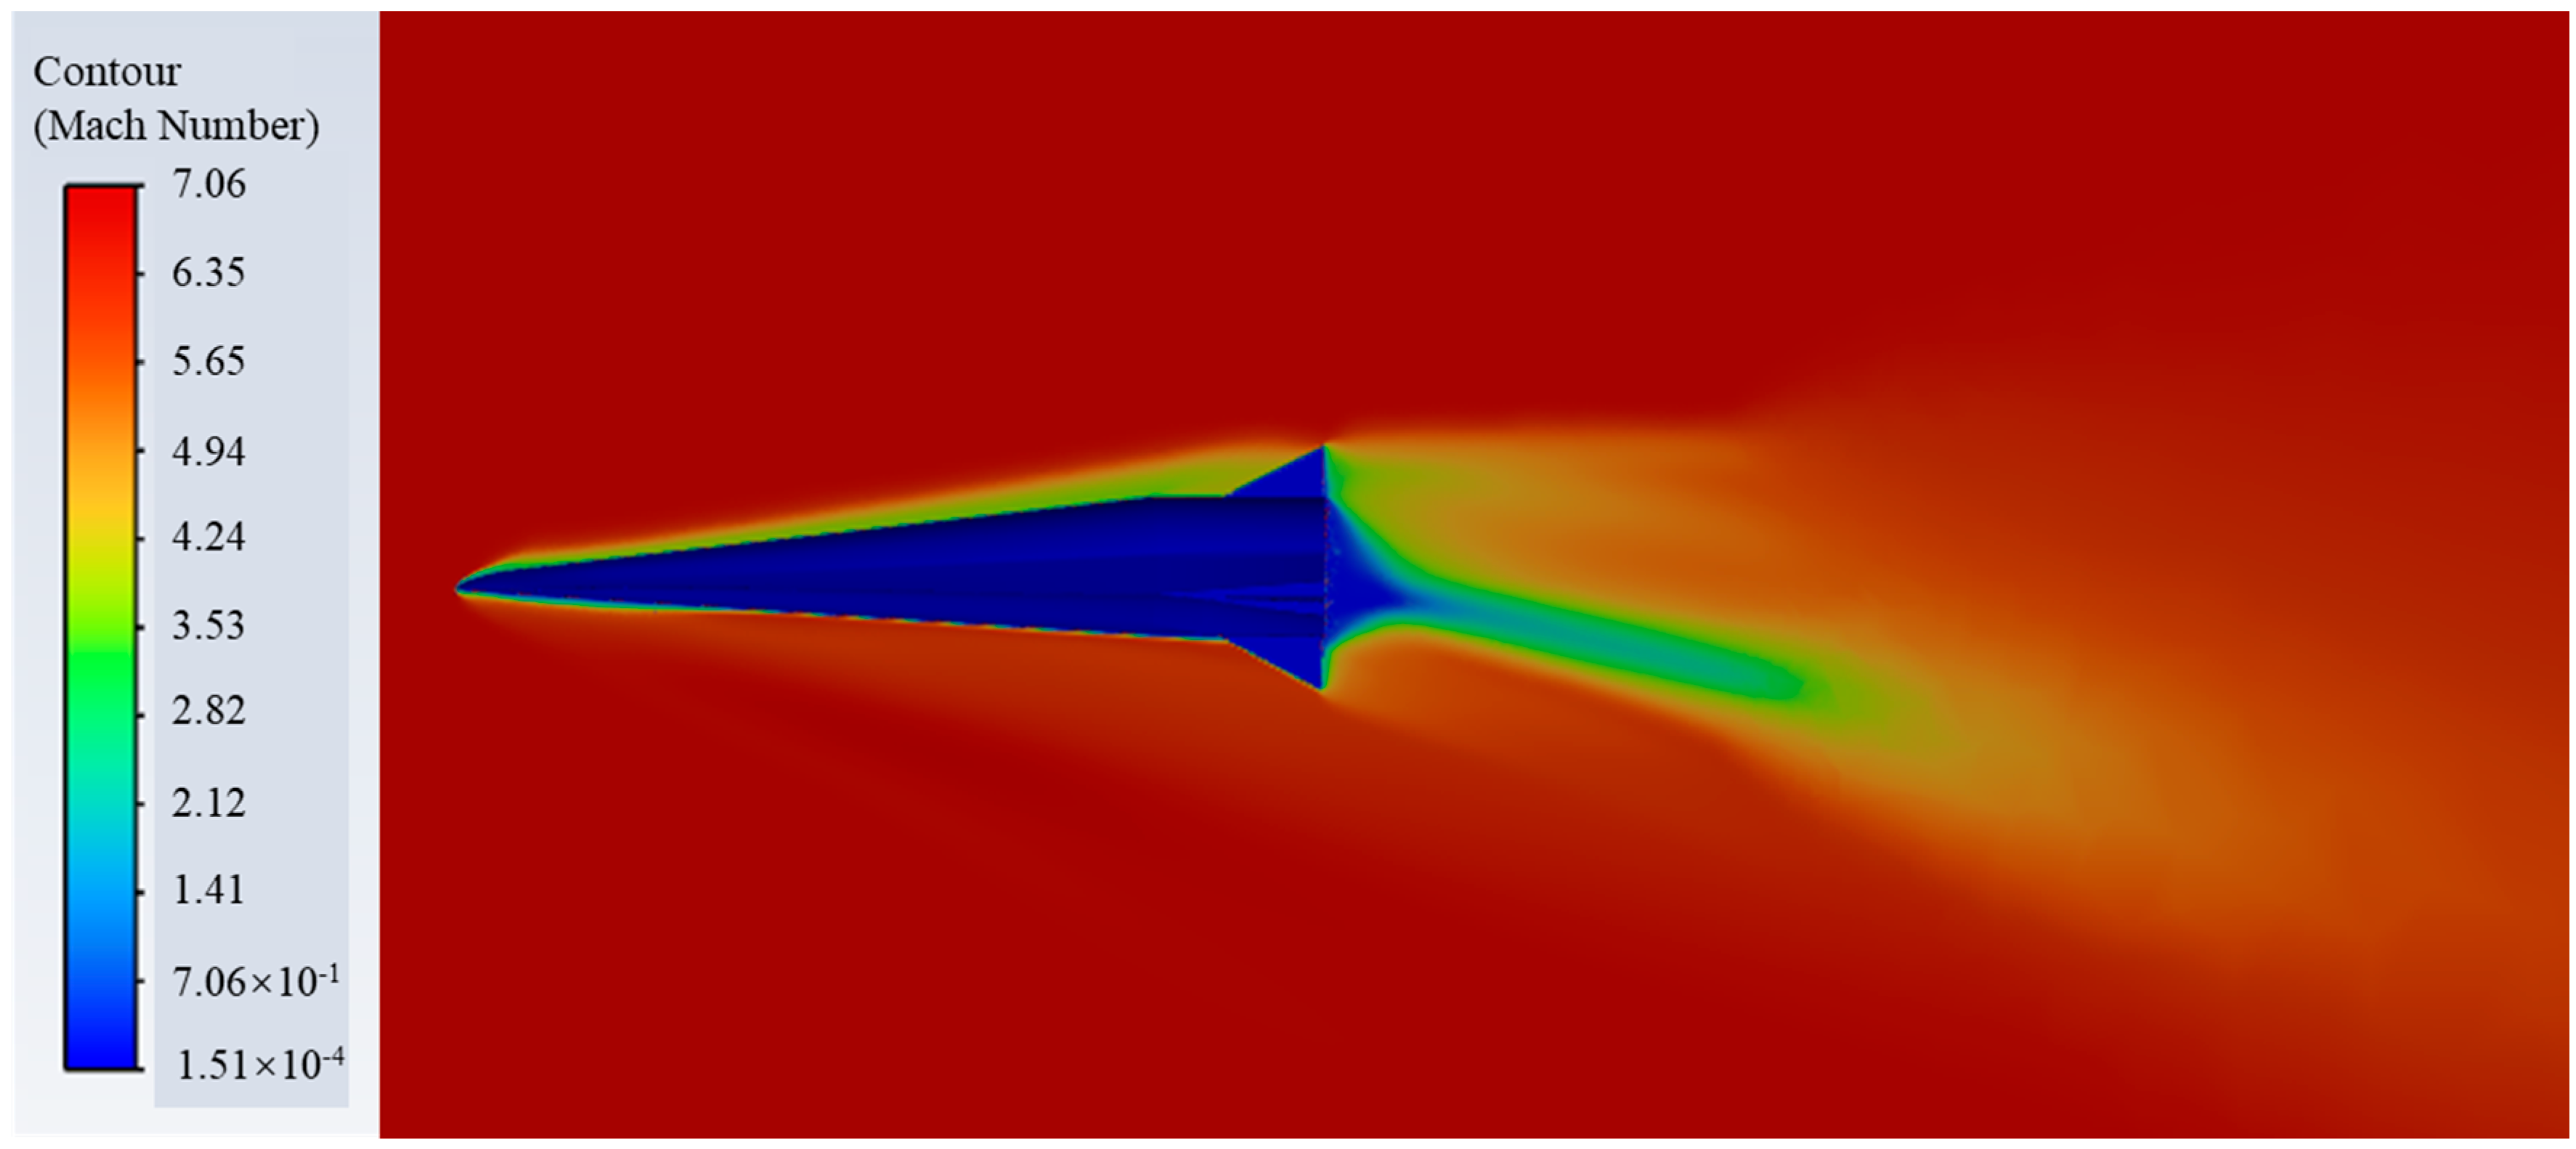
Based on aerodynamic simulations, the Mars-16B missile from North Korea demonstrates that CL remained largely unaffected at α of 0°. At an altitude of 35 km, the model’s center of pressure was approximately at 3.02 m, with static stability around 8%. In Figure 10a, CL demonstrated standard nonlinear behavior with respect to α. When α < 8 ° , the lift line slope was 0.15/deg, it was found to be consistent with predictions from thin-wing theory. However, as α increased such that 8 ° < α < 15 ° , the lift line slope decreased to 0.08/deg, indicating the onset of shock-induced separation, which aligned with the lift slope characteristics in classical aerodynamic theory. At an altitude of 50 km, a 1° increase in α led to an approximate 0.15 increase in CL. This supports the effective lift-generating mechanism facilitated by shock wave attachment in the wave-riding vehicle. In Figure 10b, within the α range of 10° to 15°, CD increased by 35%, due to intensified shock waves at the leading edge of the wave-riding vehicle happening as α increased. Additionally, Figure 10c shows that the pitch moment coefficient declined nonlinearly as α increased, with negative values signifying static stability for the aircraft. Figure 10d illustrates that the L/D ratio significantly decreased when α surpassed 15°, confirming the instability trends observed in Figure 10a,b, and establishing critical α limitations for ballistic modeling. The aircraft achieved its highest L/D ratio at various altitudes, which occurs at an α of around 10°, consistent with the shock wave attachment characteristics of wave-riding vehicles [31]. Figure 11 shows the shock wave and shock separation phenomenon.

3.3. Ballistic Modeling

3.3.1. Ballistic Modeling

The input parameters for ballistic simulation encompassed α, CL, and CD of the aircraft, along with additional characteristics specified in Table 3. The modeling considered the influences of Earth’s rotation and the attributes of the near-ellipsoid shape on mechanical properties. This technology enables real-time adjustments to the ballistic trajectory during the guidance phase, based on the target’s position. It utilizes the launch point, target location, heading angle, and velocity to create a time-sensitive target for terminal guidance.
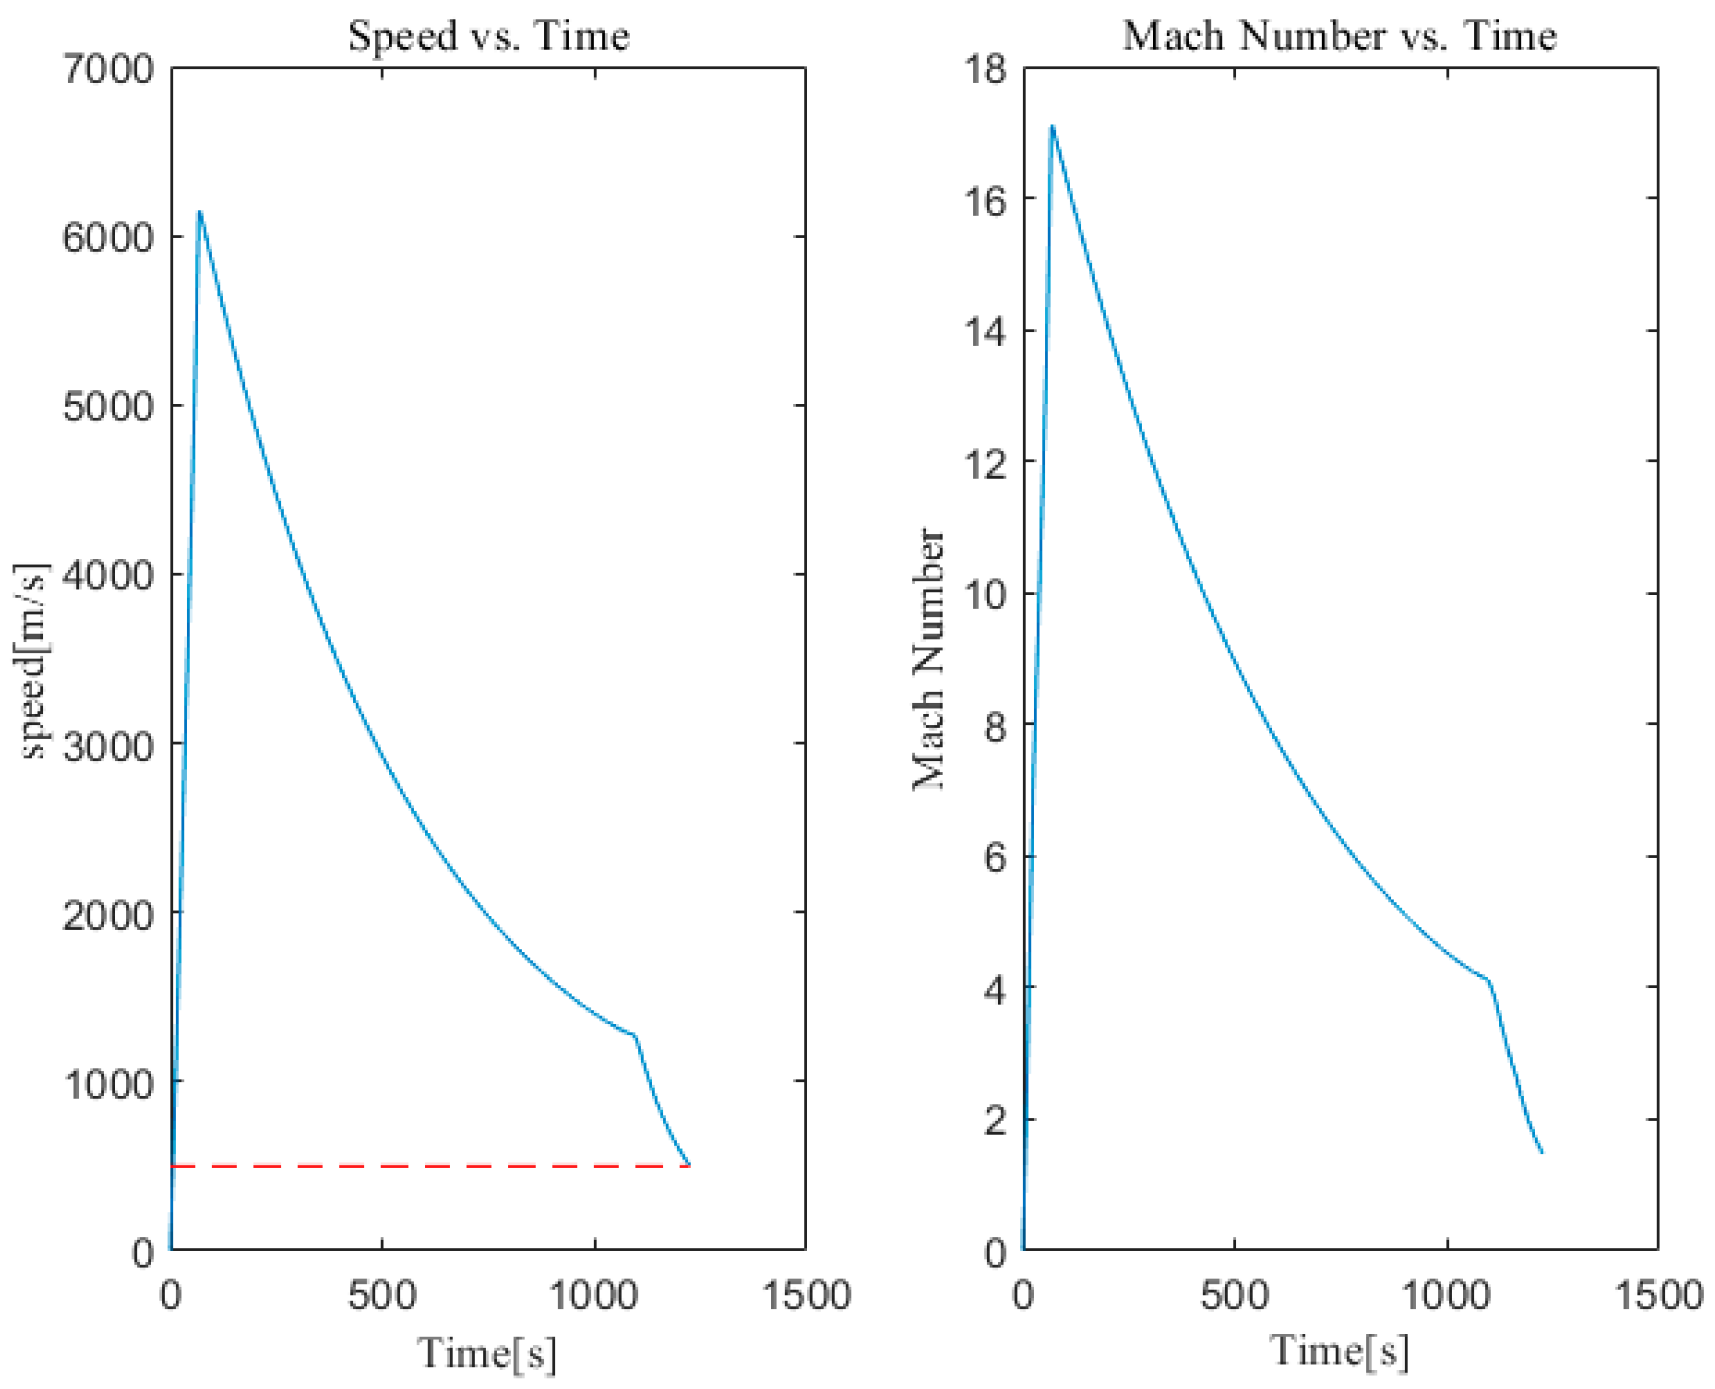
The iterative process began with aerodynamic calculations, followed by ballistic modeling based on the aerodynamic data. After each modeling cycle was completed, deviation calculations were performed according to the speed curve, as portrayed in Figure 12. Upon fulfillment of the iteration conditions, the process concluded; otherwise, those aerodynamic parameters that exhibited greater deviations were recomputed, with modifications in the ballistic input parameters leading to the re-execution of the ballistic modeling.
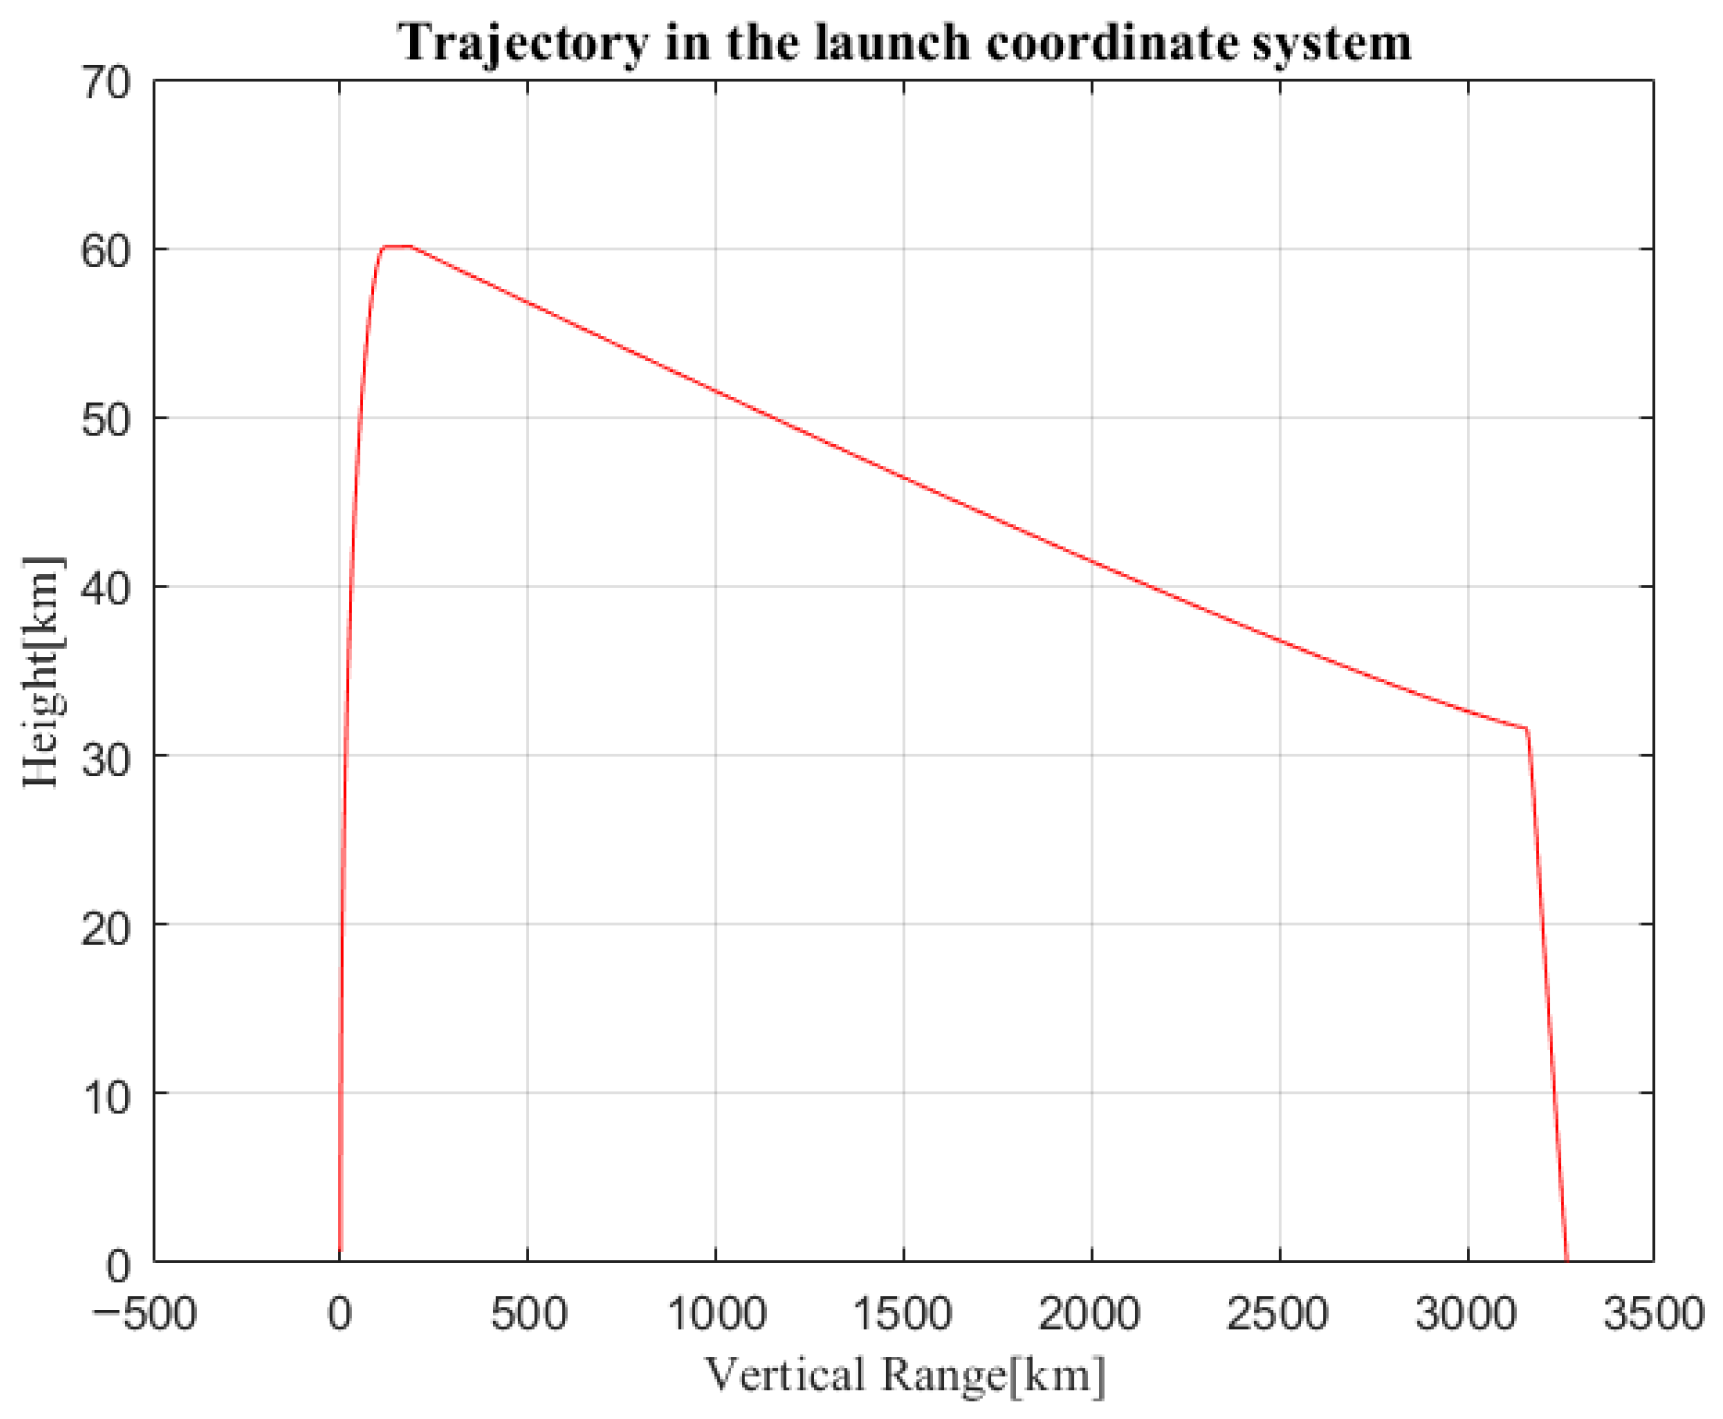
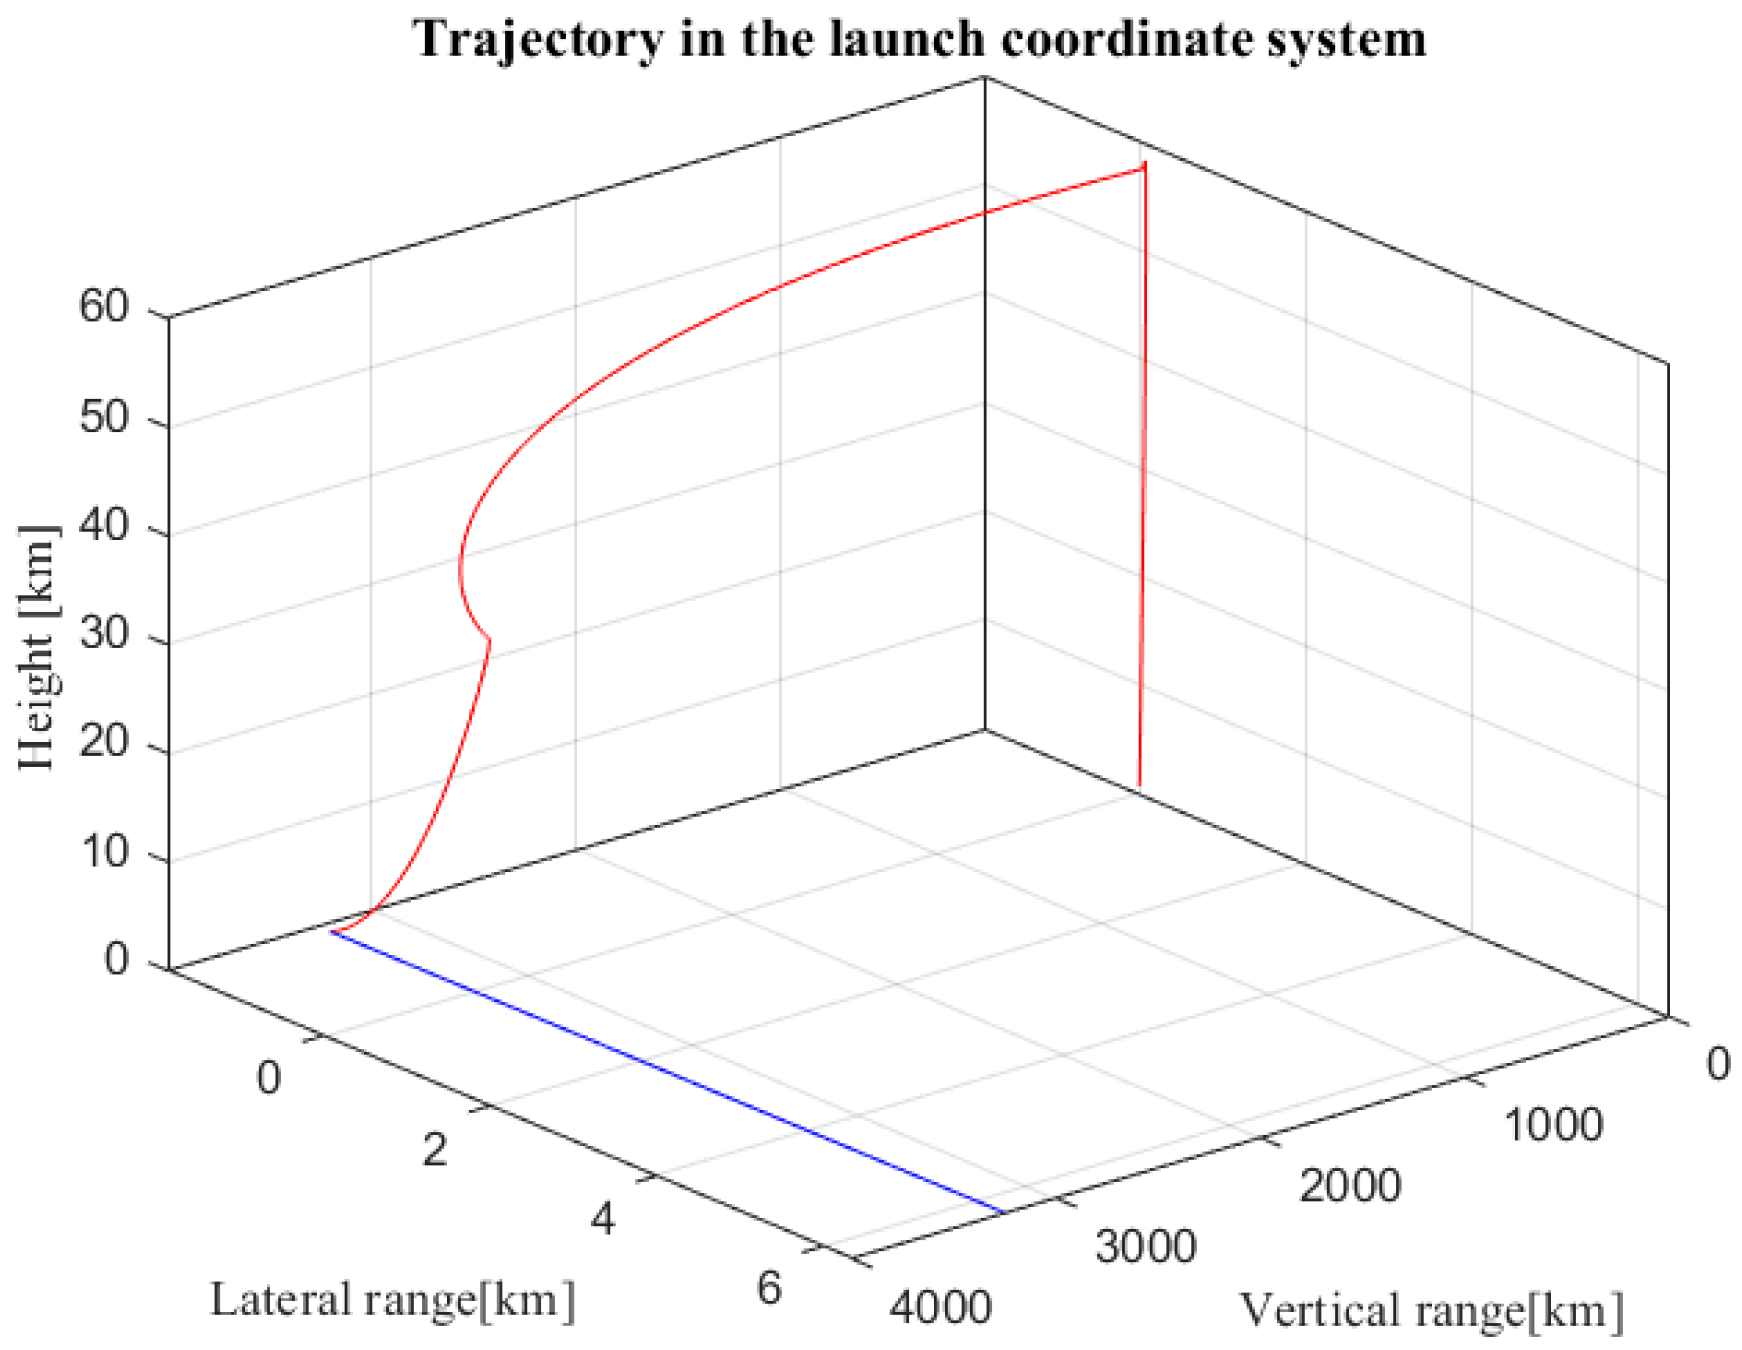
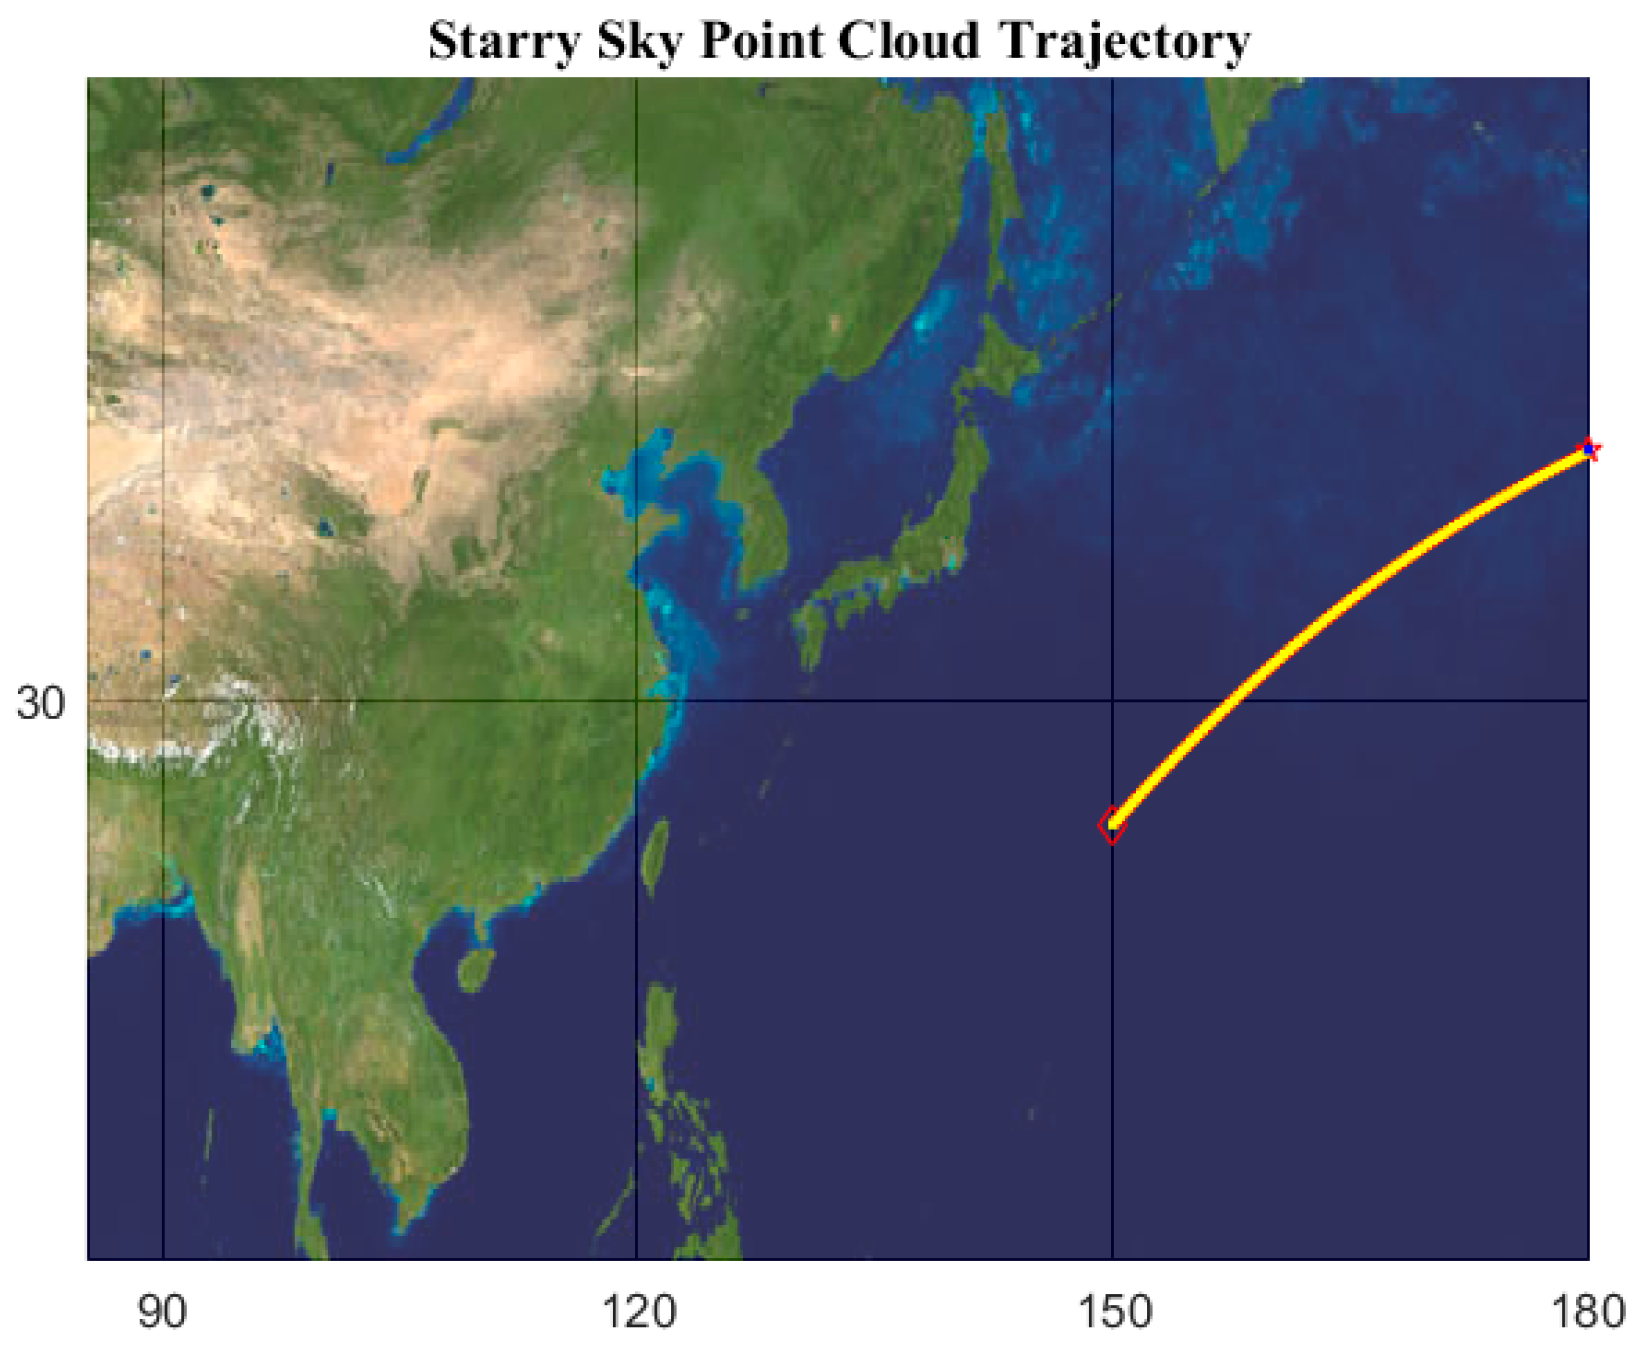
The outcomes of the ballistic modeling are presented in Figure 13 and Figure 14. Figure 13 illustrates the ballistic trajectory within the launch coordinate system. The missile was initially launched to its apex, stabilized, and then glided, eventually entering the guidance phase, where it exhibited pronounced lateral maneuvering control. The modeling results indicate that the ballistic curve aligned with the actual flight trajectory of a hypersonic vehicle and accurately reflected the ballistic curve. These results also encompassed the target’s mobility. During the terminal guidance phase, the missile’s trajectory diverged significantly due to the target drifting at a velocity of 17 m/s. The missile adjusted its trajectory through real-time modifications of the angle of attack and bank angle, with the convergence of the two trajectories signifying successful guidance and target annihilation. Figure 14 depicts the flyover to the target point in the Pacific Ocean, with a total range of approximately 3300 km, which aligns with a standard tactical strike range. The smoothness of the ballistic trajectory demonstrates effective altitude control during the balanced glide phase.
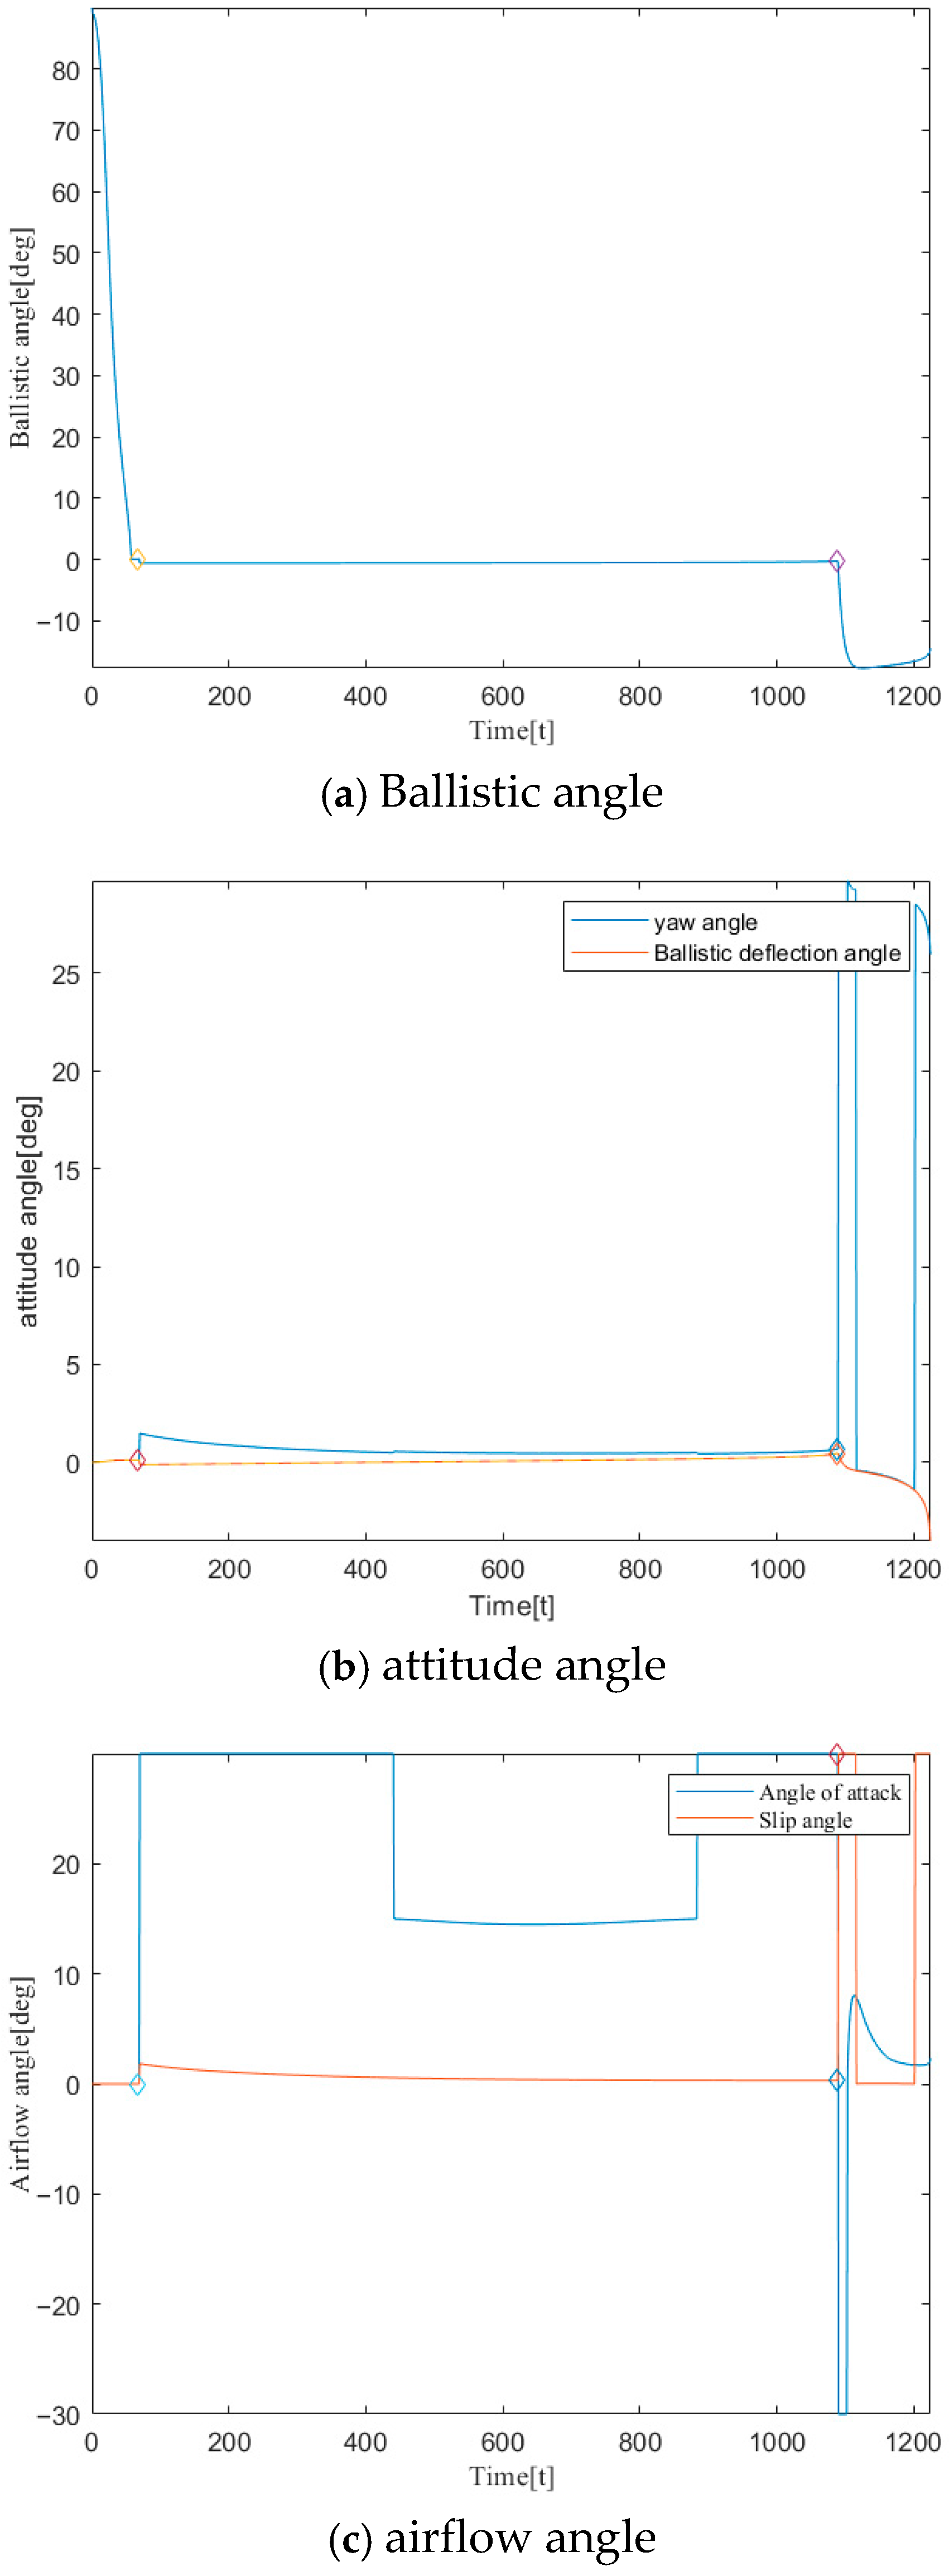
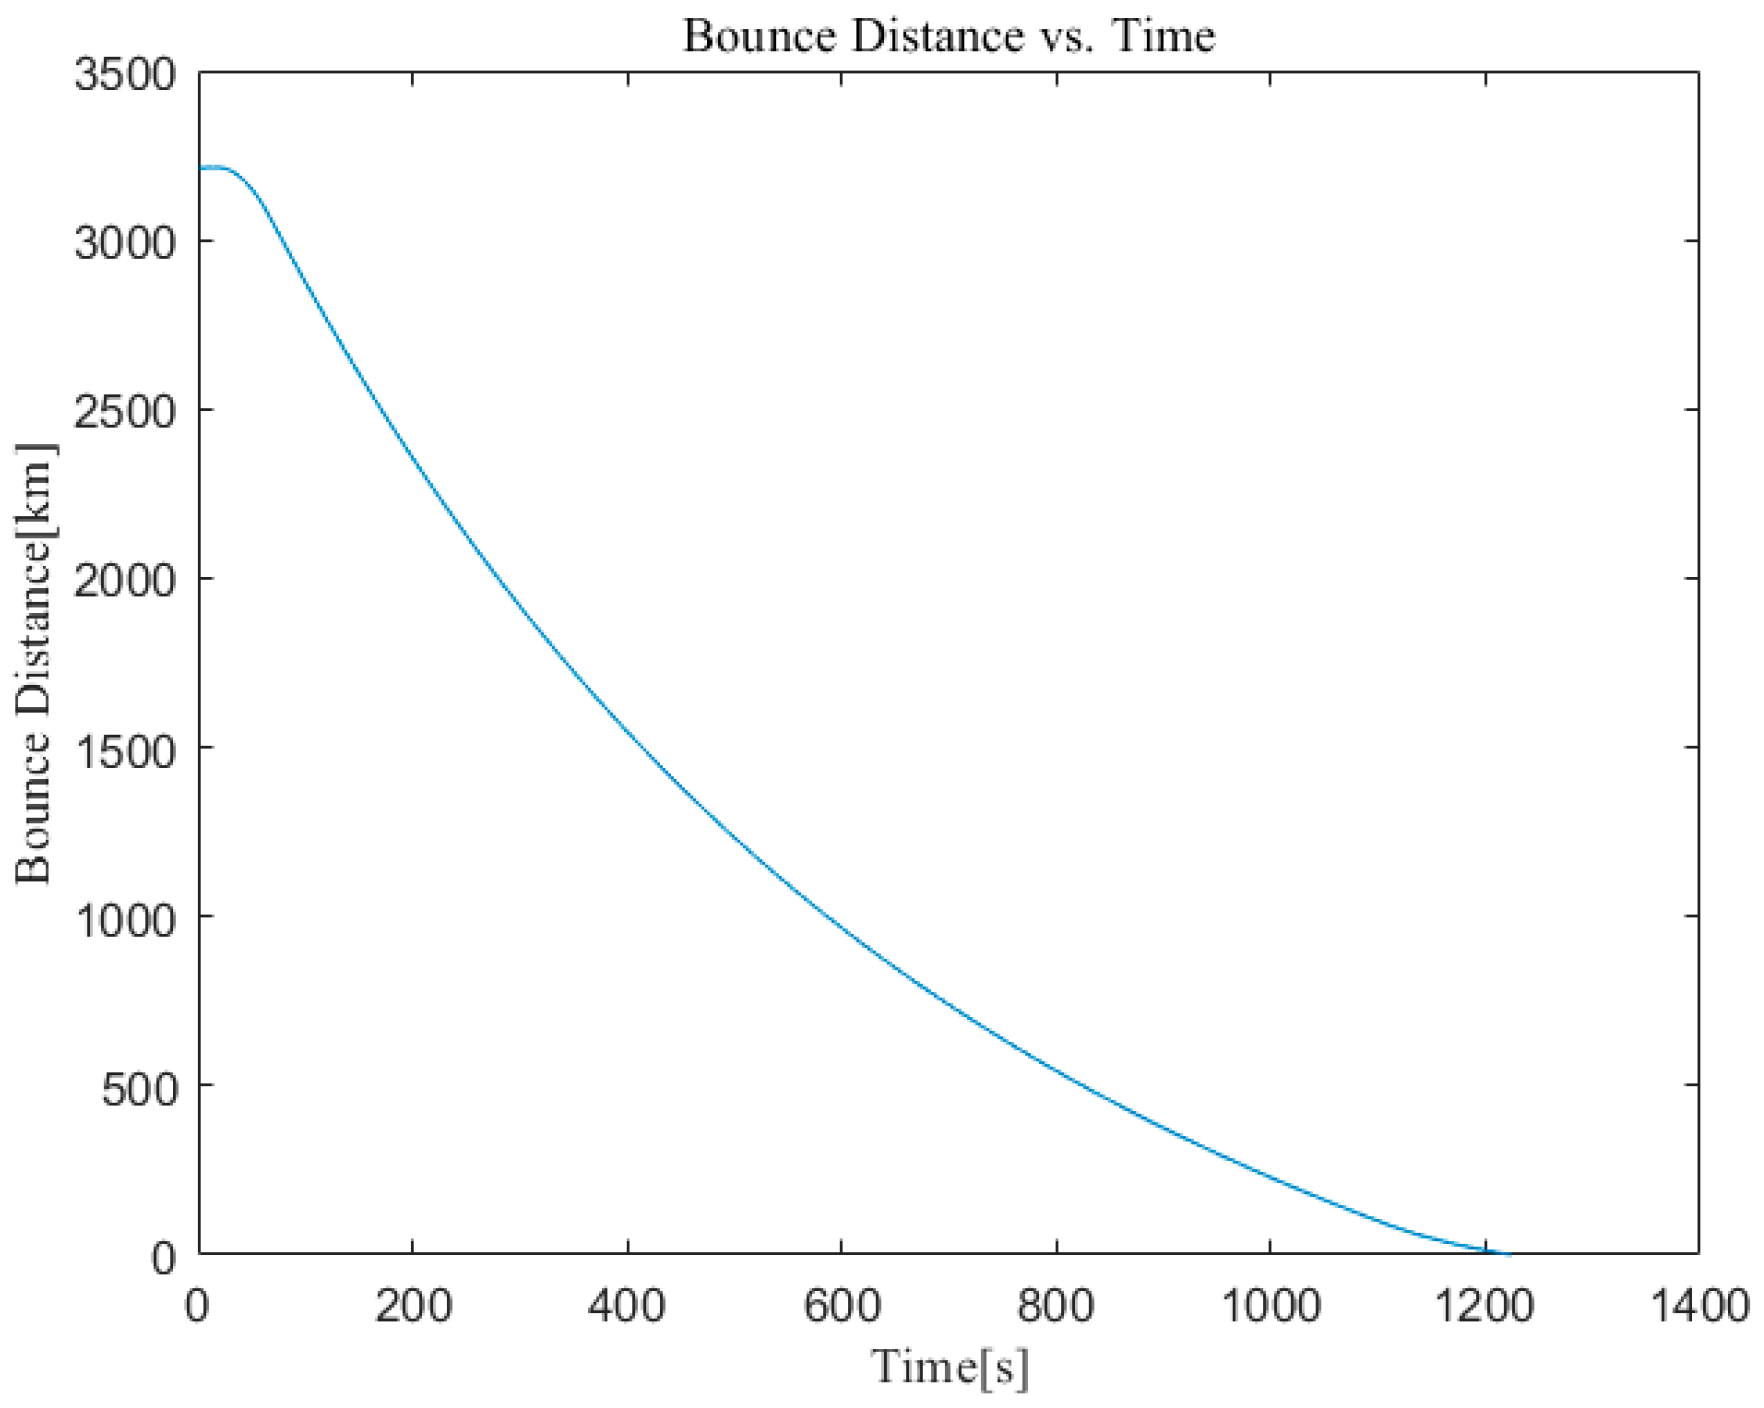
Figure 15 illustrates the dynamic response attributes of the control system through multi-dimensional parameter correlation. The parameters include yaw angle, ballistic inclination angle, ballistic deflection angle, angle of attack, and sideslip angle. Analyzing this data enhances our understanding of the missile’s flight conditions. During the boost phase, acceleration fluctuated significantly but stabilized in the glide phase, while the missile’s angle transitioned smoothly before achieving stability. The aerodynamic data indicated that the aircraft maintained a high L/D ratio for an α range between 5 and 15°, which was crucial since the aircraft spent most of its flight time within this range, ensuring excellent maneuverability. The red box in Figure 15b indicates a sharp change in angle, where the vehicle transitions from the boost phase to the glide phase, and then from the glide phase to the terminal guidance phase. Figure 16 depicts the variation in distance between the missile and its target, confirming the terminal precision of the guiding algorithm from a mission perspective. When the vertical coordinate reached zero, it was inferred that the target was struck.

3.3.2. Stability Verification

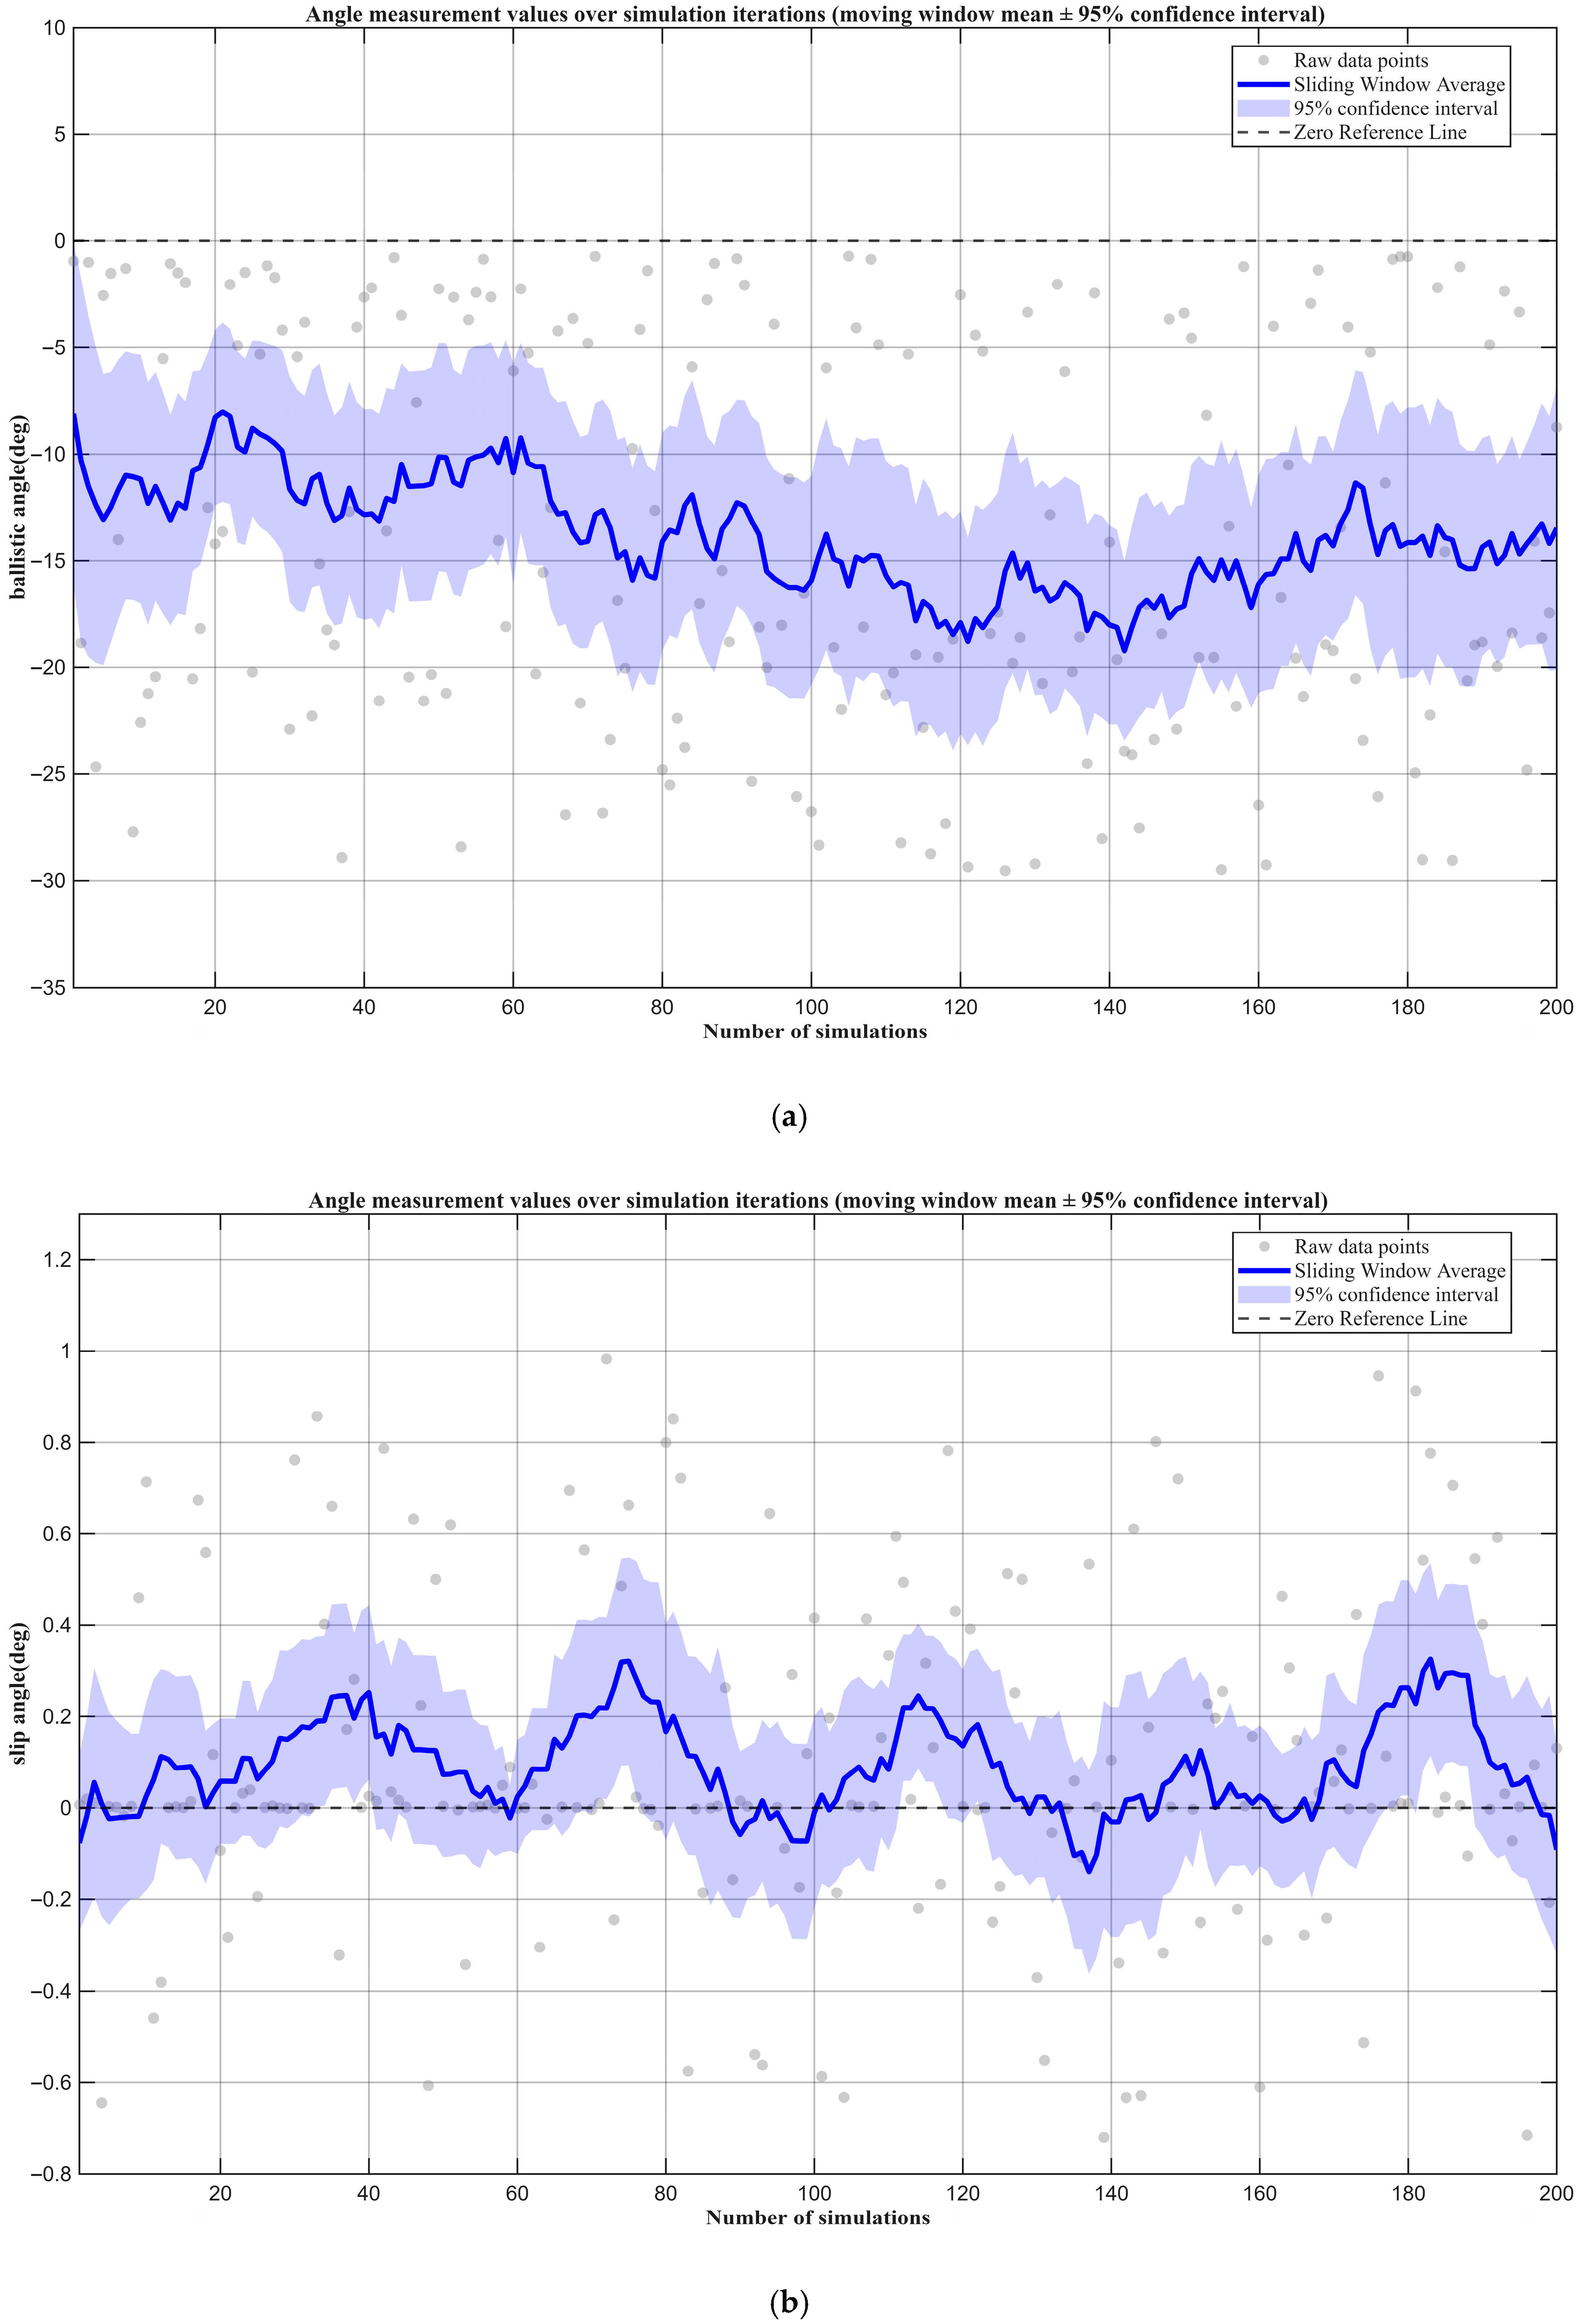
Due to the frequent limitations of simulation models in accurately representing real-world systems, Monte Carlo methods were employed to validate the resilience of ballistic trajectories during the simulation process. The missile–target placements were altered randomly, and 200 simulation trials were executed, considering initial conditions and parameter variations. The final ballistic parameters—deviation angle, yaw angle, and angle of attack—were then analyzed.
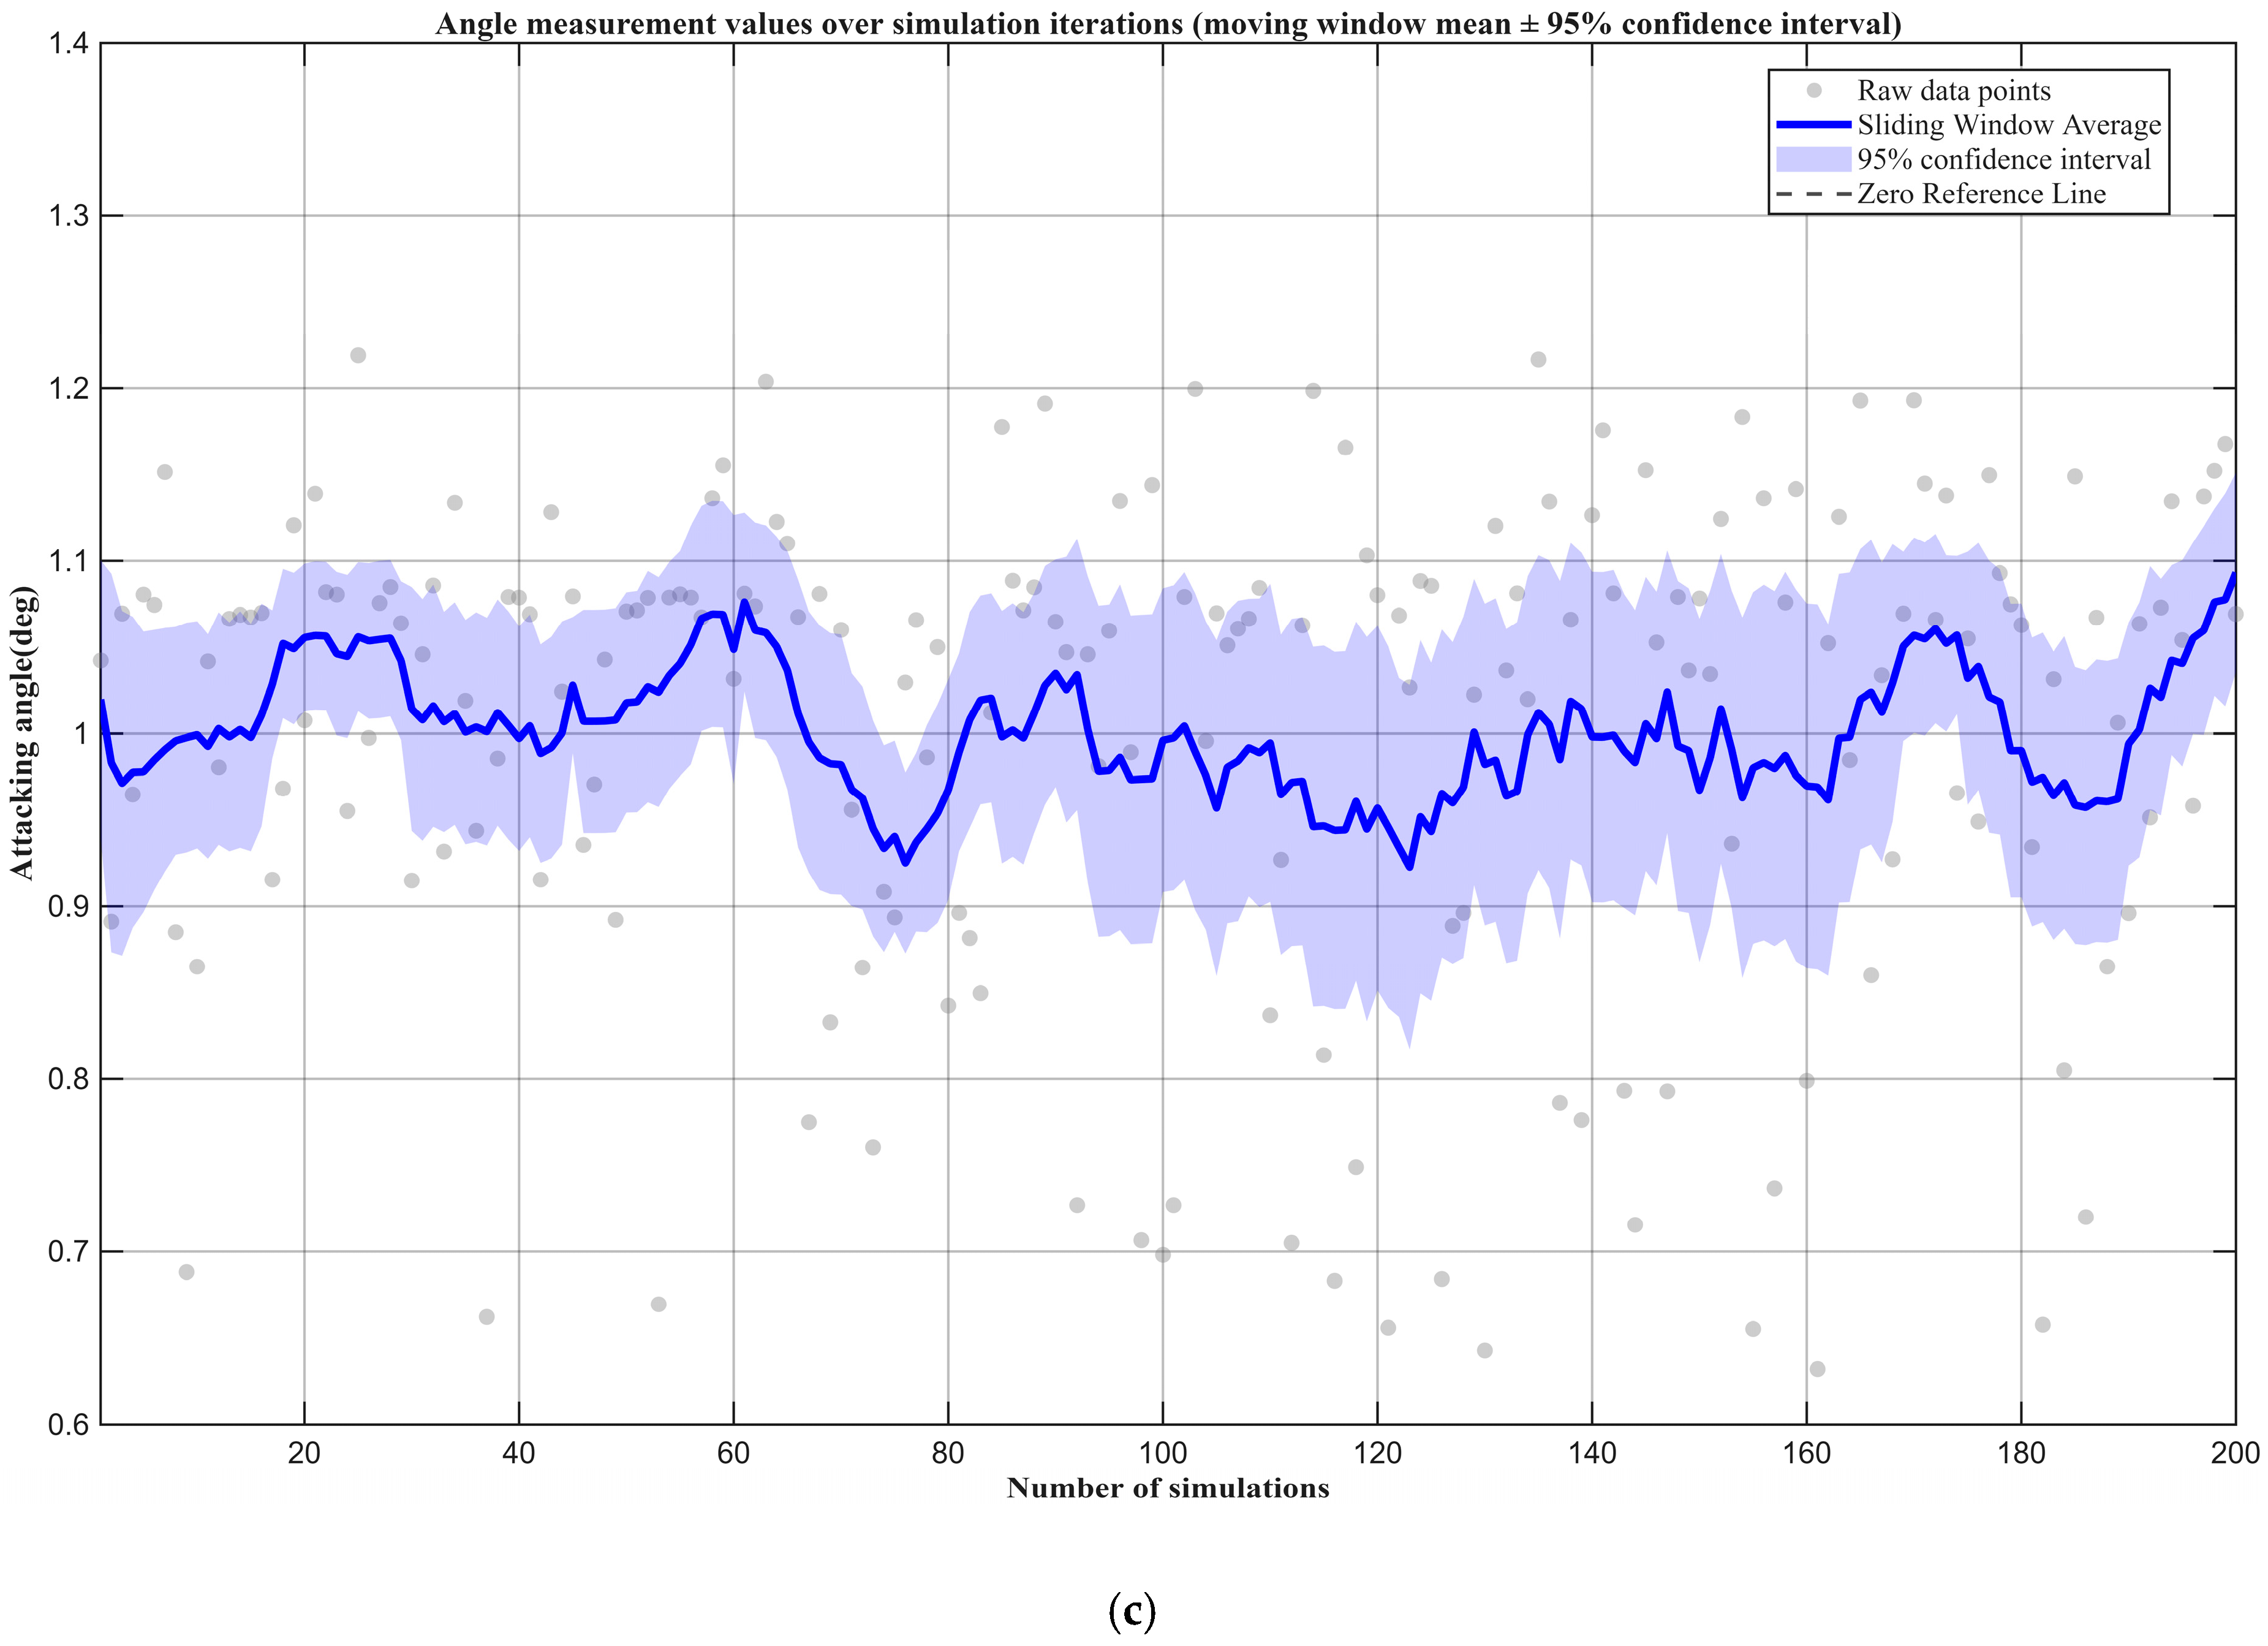
The results of the Monte Carlo simulation are presented in Figure 17a–c. The confidence intervals are predicated on the assumption of a normal distribution, utilizing a sliding window size of 15. CI signifies the confidence interval. Figure 17a illustrates that the average angle of ballistic inclination was observed to be −13.47° ( 95 % CI   [ 20.13 ° , 6.81 ° ] ) , while the ballistic deviation angle consistently remained negative throughout all 200 simulations during terminal guidance. This signified that the terminal attitude of missile guidance was found to be appropriate, ensuring a high success rate. In Figure 17b, the average angle of the missile’s lateral slip was −0.09° ( 95 % CI   [ 0.32 ° , 0.14 ° ] ) , demonstrating minimal lateral slip effects that do not substantially impact the missile’s terminal guidance. Figure 17c depicts that the average missile attack angle was 1.09° ( 95 % CI   [ 1.04 ° , 1.15 ° ] ) , which was maintained constantly to ensure adequate mobility during terminal guidance. The analysis of these three parameters confirms that the approach proposed in this study provides stable terminal guidance performance despite parameter perturbations, demonstrating significant robustness.

3.3.3. Correctness Analysis

Initial settings for the simulation were established, including vehicle mass of m = 900 kg, reference area of S = 2.0 m2, starting location (E 90°, N 50°), and destination (E 115°, N 40°). Using the same input parameters, the glide segment illustrated missile trajectories with outcomes derived from literature-based ballistic modeling and simulation [32].
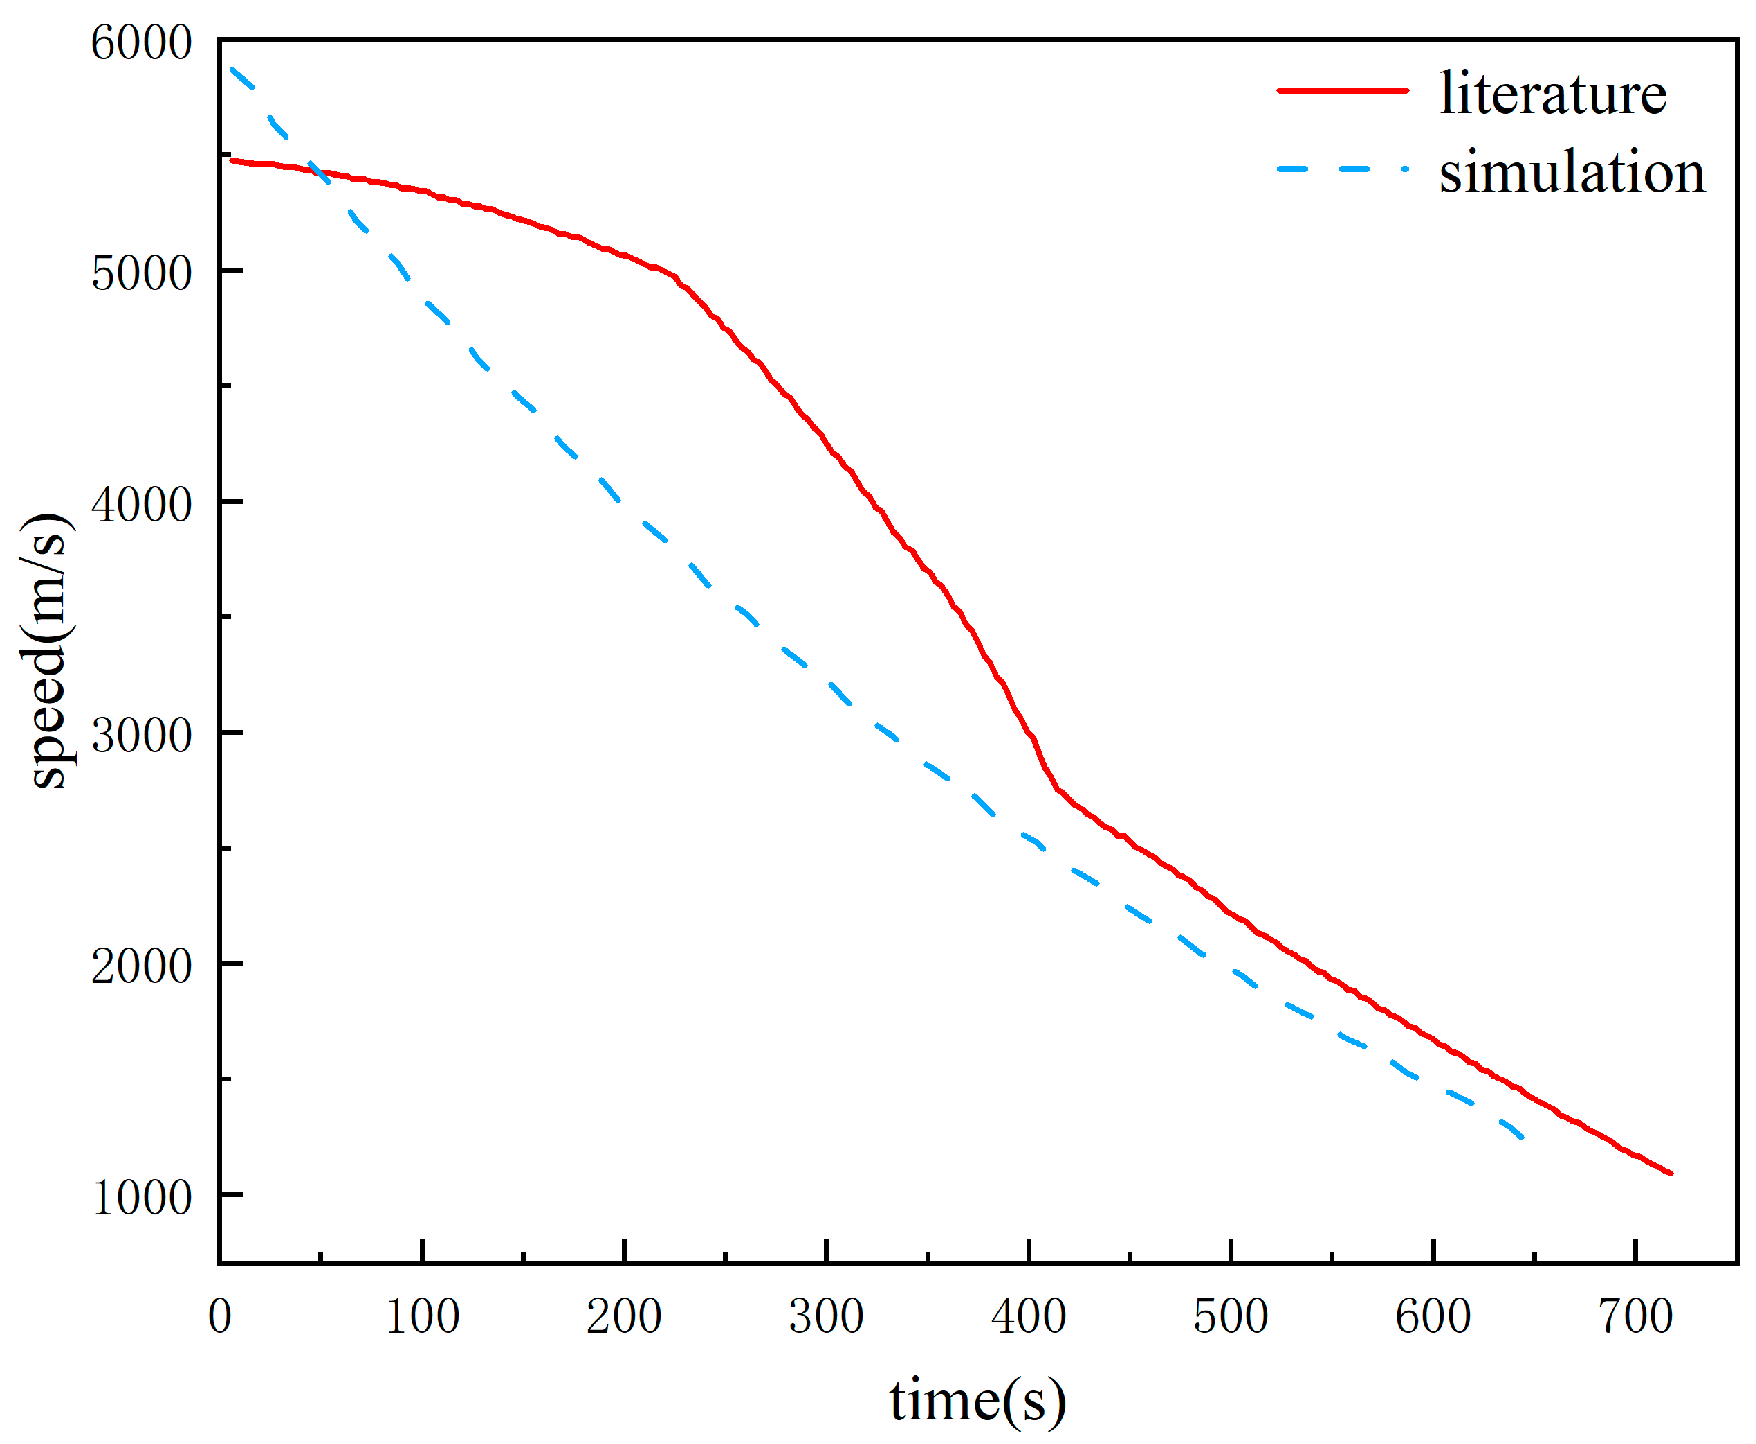
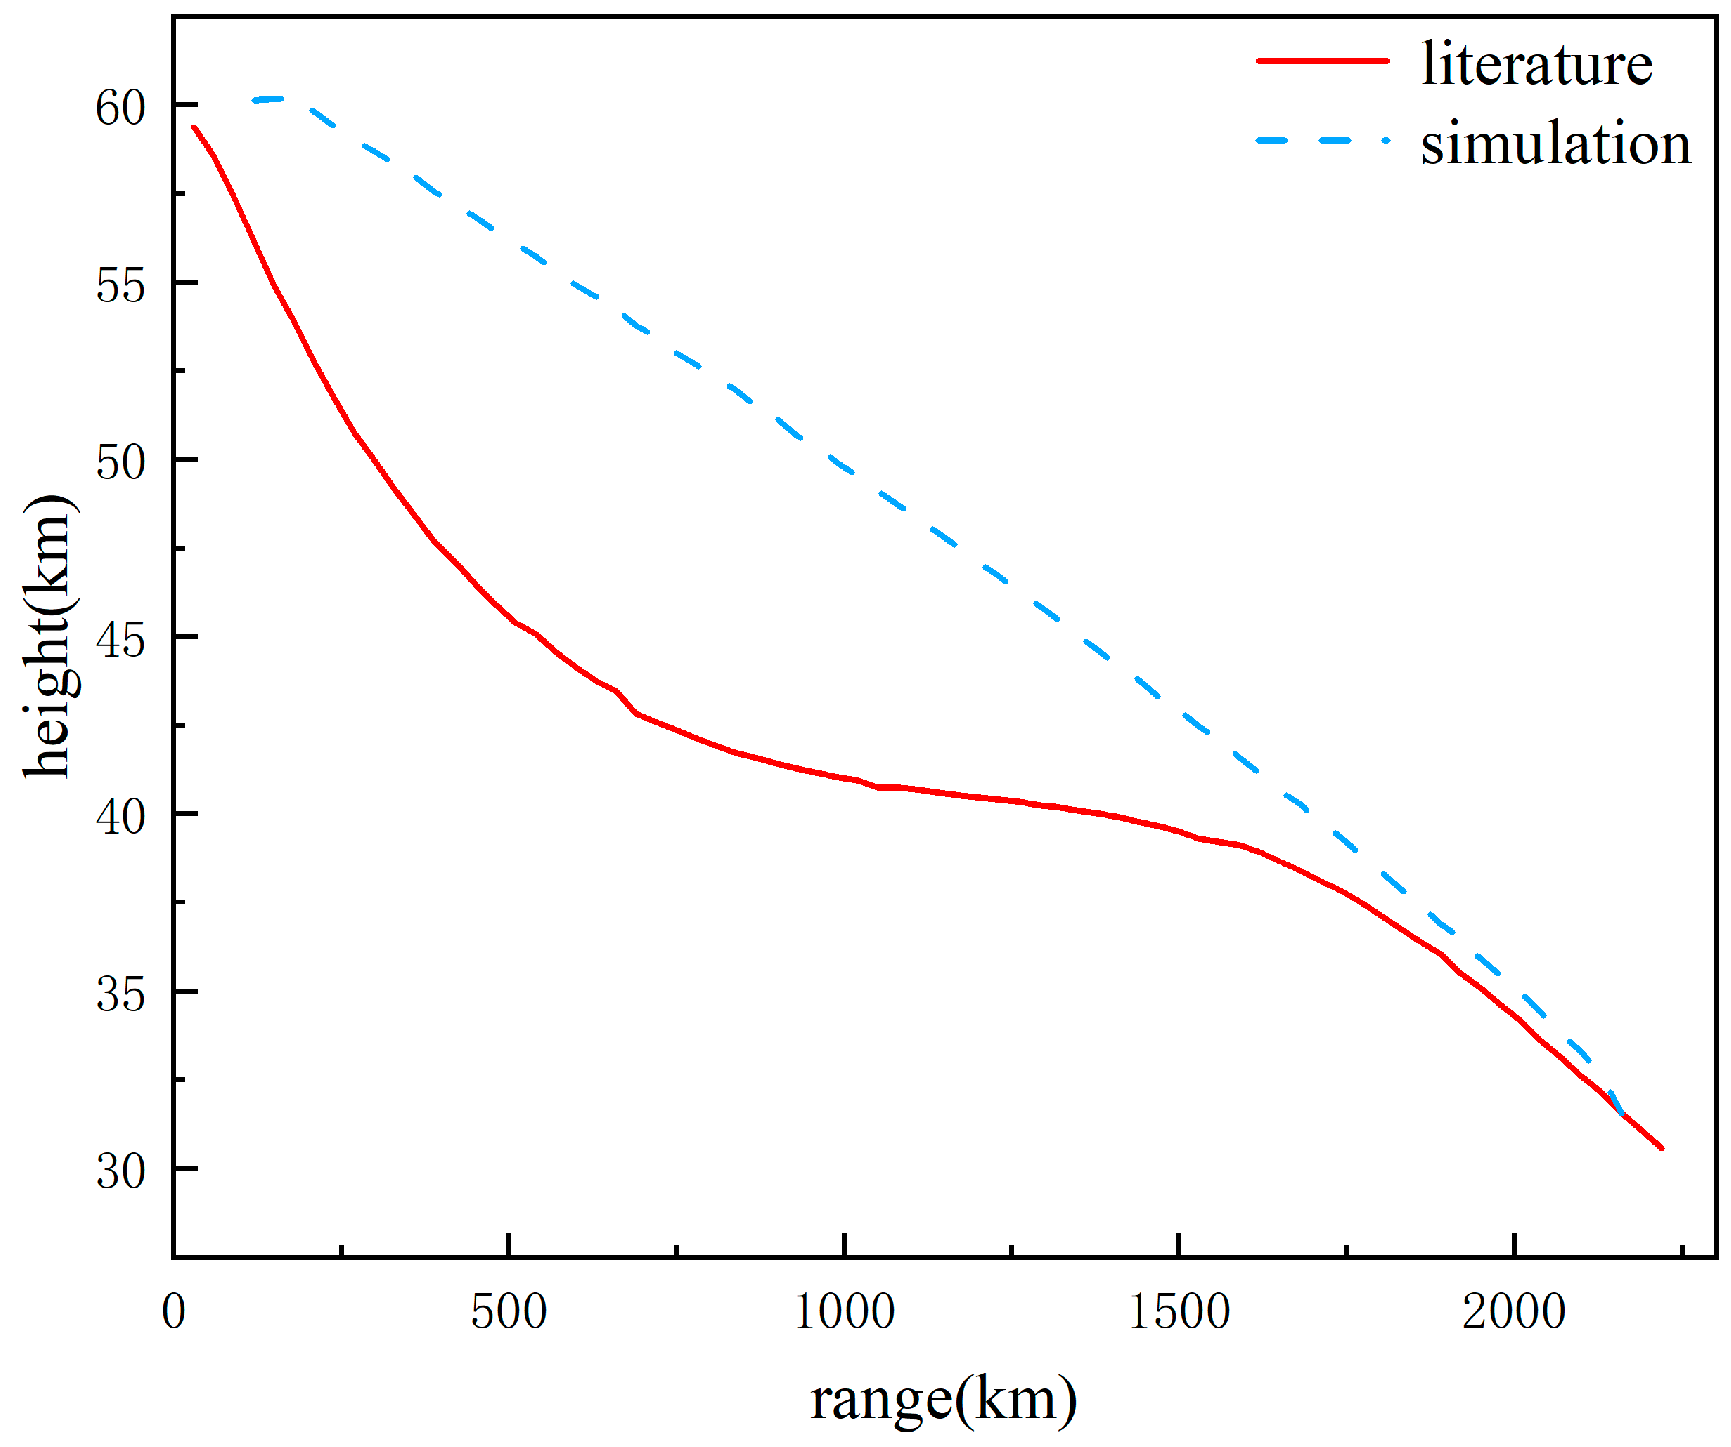
As evident from Figure 16, both ballistic modeling techniques effectively directed the vehicle towards the target. The technology discussed in this paper accurately replicated the vehicle’s flight attitude in the environment and facilitated ballistic maneuvering. Figure 18 illustrates the correlation between time and velocity. The initial and terminal velocities of both approaches exhibited minimal differences, suggesting that both systems successfully achieved fundamental velocity control throughout the initial acceleration and terminal guidance phases. Nonetheless, the strategy outlined in this study expedited the gliding process, enabling a stable gliding state to be reached more quickly during the gliding phase, while also maintaining a higher velocity. This indicated that aerodynamic iteration enhanced the L/D ratio and energy management of the aircraft, thereby minimizing speed loss and increasing the success rate of terminal penetration. Figure 19 illustrates the correlation between altitude and range. Both techniques support the missile’s gliding flight, keeping altitude within an acceptable range. The variation in altitude during the gliding phase was found to be more consistent with the proposed method, suggesting that aerodynamic iteration enhanced the equilibrium between lift and gravity, thereby reducing altitude fluctuations. Figure 20 displays the longitude–latitude trajectory. Both methods completed the flight from the origin to the destination; however, the approach presented in this paper accomplished the task more directly and quickly, exhibiting superior maneuverability during the terminal phase and a faster response to changes in target position. This validated the real-time effectiveness of the terminal guidance model. Finally, Table 4 juxtaposes the precision of the two modeling techniques. The proposed strategy significantly outperformed the conventional method in terms of terminal strike precision, which leveraged the capability of the proposed technique in accurately predicting the ballistic trajectories of hypersonic flight vehicles, thereby meeting the requirements for their ballistic modeling.

4. Discussion

This study addresses the challenges of replicating genuine flying conditions in the ballistic simulation of hypersonic vehicles. The work iteratively improves the ballistic modeling technique by reverse-engineering the hypersonic vehicle model and accurately calculating its aerodynamic statistics. This approach allows for the simulation of realistic air conditions, leading to more accurate ballistic modeling and providing support for the penetration methods of hypersonic vehicles.
The findings indicate that the aerodynamic data computed for the Mars-16B flight vehicle, which was reconstructed using the proposed method, demonstrate exceptional precision. At an altitude of 35 km, the model’s pressure center is approximately 3.02 m, static stability is measured at 35%, and the pitch moment coefficient exhibits a nonlinear decline with a corresponding increase in the α parameter. The negative result signifies that the aircraft maintains static stability, confirming the reliability and efficacy of the calculation method employed in this investigation.
Further analysis reveals that lift shows significant insensitivity at α of 0° in the hypersonic regime. When α < 8°, the lift line slope is 0.15/deg, which is consistent with thin-wing theory predictions. For 8° < α < 15°, the lift line slope decreases to 0.08/deg, signifying the onset of shock-induced separation effects, aligning with the lift slope characteristics outlined in classical aerodynamic theory. This finding is in excellent agreement with the work of Vladimir et al. [33].
This study utilizes iterative aerodynamic modeling in ballistic simulations to accurately replicate real flight ballistic curves and achieve precise terminal guidance. The investigation demonstrates that the ballistic trajectory formulated using this method significantly enhances the ballistic precision of hypersonic flight vehicles, with the terminal longitudinal error improving from 0.12° to 0.03°. Cheng et al. asserted that aerodynamic-based ballistic modeling techniques can enhance speed estimation accuracy by approximately 40–50% and acceleration estimation accuracy by around 20–50% [34]. The findings presented in this study showcased the reliability of the proposed methodology for application purposes.
Future recommendations include enhancing the iteration speed of this technology by creating an aerodynamic database or implementing deep learning algorithms to expedite ballistic modeling. Additionally, the influence of various factors, such as electromagnetic and aerodynamic thermal effects, on modeling outcomes should be thoroughly evaluated to improve modeling accuracy.

5. Conclusions

This work proposed the ballistic modeling of hypersonic vehicles for circumventing challenges associated with reproducing the real flight settings. It presented a modeling approach for the balanced glide trajectory of these vehicles through aerodynamic iteration. By utilizing numerical simulations, the method effectively modeled the exterior geometry of hypersonic vehicles. This research provides significant theoretical insights and practical value. It aims to reduce the costs of flight experiments and achieve more accurate trajectory predictions. The primary conclusions of this study are as follows:
(1)
The aerodynamic simulation results indicated that the Mars-16B aerodynamic model developed in this study displayed reasonable stability in the hypersonic regime. At α = 0°, the lift showed significant insensitivity, and CL increased in a nearly linear manner with altitude, which was consistent with the characteristics of classical aerodynamic theory. A negative pitch moment coefficient signified that the vehicle maintained static stability, preventing any loss of stability during flight.
(2)
The aerodynamic iterative ballistic modeling approach revealed that the missile navigated through various altitudes during flight, showcasing unique aerodynamic performance at each level. The aerodynamic iteration effectively modeled the actual flight trajectory curve and ensured precise terminal guidance. Compared to other ballistic modeling techniques, the proposed pneumatic iteration process enhanced the precision and stability of terminal guidance.
(3)
This work demonstrated that results obtained from imprecise aerodynamic formulas, such as those based on Newtonian flow theory, significantly differed from those derived from high-fidelity CFD data. This highlights the importance of accurate aerodynamic data in advanced design processes.
(4)
The approach outlined in this work advanced the development of hypersonic vehicle trajectory modeling techniques and enhanced the capabilities of existing technologies. These findings are particularly significant for simulating the balanced glide trajectory of hypersonic vehicles and for missile terminal penetration.
(5)
Simulation results indicated that the aerodynamic–ballistic coupling iteration process took, on average, 25% longer duration per run than the simplified model documented in the literature. However, the accuracy of the terminal guidance was markedly improved (with longitude error reduced significantly from 0.12° to 0.03°). This trade-off can potentially be optimized through offline pre-computation of aerodynamic databases. Additionally, employing smaller models or implementing deep learning for automated iteration could enhance the modeling accuracy of hypersonic aircraft, thereby facilitating their broader application in practical contexts.

Author Contributions

Methodology and writing—original draft preparation, Y.B.; investigation, resources, writing—review and editing, G.F.; data curation, Y.L.; visualization, Y.W.; supervision, P.W. All authors have read and agreed to the published version of the manuscript.

Funding

This research received no external funding.

Data Availability Statement

Dataset is available on request from the authors.

Conflicts of Interest

Author Yizhe Wang was employed by the company Lanyu Nanjing Technology Co., Ltd. The remaining authors declare that the research was conducted in the absence of any commercial or financial relationships that could be construed as a potential conflict of interest.

Appendix A

Table A1. Symbol Reference Table.
SymbolsMeaning
K n Knudsen number
ρ fluid density
divergence operator
τ viscous stress tensor
μ dynamic viscosity
λ s second viscosity
p fluid pressure
f external force per unit volume
E total energy per unit mass
q heat flux vector
R gas constant
T temperature
s slip value
w non-sliding wall surface value
γ s specific heat ratio
v g gas molecule collision relaxation parameters
f N local equilibrium distribution functions
f g gas molecular velocity distribution function
r position space
V m molecular velocity
t time
f M local Maxwell equilibrium distribution function
n gas molecular number density
P gas molecular number pressure
P r dimensionless Prandtl number
C p constant pressure
K thermal conductivity
χ power exponent
ω , α i interaction indices
K n flow regime control parameter
V Parameters for speed
γ heading angle
h altitude
r r range
T T propulsion
Ddrag
Llift
α angle of attack
m t time-varying mass
λ longitude
ϕ latitude
γ b ballistic inclination
ψ ballistic deflection angle
σ tilt angle
τ dimensionless time
z n dimensionless altitude
v n dimensionless velocity
R 0 Earth’s radius
g gravitational acceleration
H flight altitude
S r e f reference region
r t missile–target distance
ϕ t yaw line-of-sight angles
θ t pitch line-of-sight angles
v t missile velocity
γ t ballistic inclination
ψ t deflection angle
η yaw rate lead angle
Q s heat flux density
N total overload
q d dynamic pressure
k h constant coefficient
A e r o D B aerodynamic database storing
ϵ ( k ) residual
F net external force
V aircraft’s velocity
Δ M a Mach number query increment

References

  1. Xu, B.; Shi, Z. An overview on flight dynamics and control approaches for hypersonic vehicles. Sci. China Inf. Sci. 2015, 58, 1–19. [Google Scholar] [CrossRef]
  2. Kumar, G.N.; Ikram, M.; Sarkar, A.K.; Talole, S.E. Hypersonic flight vehicle trajectory optimization using pattern search algorithm. Optim. Eng. 2018, 19, 125–161. [Google Scholar] [CrossRef]
  3. Xiaodong, Y.; Shi, L.; Shuo, T. Analysis of optimal initial glide conditions for hypersonic vehicles. Chin. J. Aeronaut. 2014, 27, 217–225. [Google Scholar] [CrossRef]
  4. Ding, Y.; Yue, X.; Chen, G.; Si, J. Review of control and guidance technology on hypersonic vehicle. Chin. J. Aeronaut. 2022, 35, 1–18. [Google Scholar] [CrossRef]
  5. Zhao, J.; Zhou, R. Reentry trajectory optimization for hypersonic vehicle satisfying complex constraints. Chin. J. Aeronaut. 2013, 26, 1544–1553. [Google Scholar] [CrossRef]
  6. Zang, L.; Lin, D.; Chen, S.; Wang, H.; Ji, Y. An online guidance algorithm for high L/D hypersonic reentry vehicles. Aerosp. Sci. Technol. 2019, 89, 150–162. [Google Scholar] [CrossRef]
  7. Lu, P.; Forbes, S.; Baldwin, M. Gliding guidance of high L/D hypersonic vehicles. In Proceedings of the AIAA Guidance, Navigation, and Control (GNC) Conference, Boston, MA, USA, 19–22 August 2013. [Google Scholar]
  8. Cunyu, B.; Peng, W.; Guojian, T. Integrated method of guidance, control, and morphing for hypersonic morphing vehicle in glide phase. Chin. J. Aeronaut. 2021, 34, 535–553. [Google Scholar] [CrossRef]
  9. Hou, L.; Liu, H.; Yang, T.; An, S.; Wang, R. An intelligent autonomous morphing decision approach for hypersonic boost-glide vehicles based on DNNs. Aerospace 2023, 10, 1008. [Google Scholar] [CrossRef]
  10. Jiawei, L.; Jiangfeng, W.; Liming, Y.; Chang, S. A hybrid lattice Boltzmann flux solver for integrated hypersonic fluid-thermal-structural analysis. Chin. J. Aeronaut. 2020, 33, 2295–2312. [Google Scholar]
  11. Shuhua, Z.; Zhenyu, Y.; Wenwen, Z.; Weifang, C. Numerical simulation of hypersonic thermochemical nonequilibrium flows using nonlinear coupled constitutive relations. Chin. J. Aeronaut. 2023, 36, 63–79. [Google Scholar]
  12. Cao, L.; Liu, L.; Ji, P.; Guo, C. Adaptive Fast Smooth Second-Order Sliding Mode Fault-Tolerant Control for Hypersonic Vehicles. Aerospace 2024, 11, 951. [Google Scholar] [CrossRef]
  13. De Oliveira, H.B.; Khompysh, K.; Shakir, A.G. Strong solutions for the Navier–Stokes–Voigt equations with non-negative density. J. Math. Phys. 2025, 66, 041506. [Google Scholar] [CrossRef]
  14. Haçat, G.; Çibik, A.; Yilmaz, F.; Merdan, S.K. Optimal Control problems of NS-α and NS-ω turbulence models: Analysis and numerical tests. Numer. Algorithms 2025. [Google Scholar] [CrossRef]
  15. Wang, Y. Global well-posedness and large-time behavior for anisotropic inhomogeneous Navier-Stokes equations with mixed partial dissipation. Electron. Res. Arch. 2025, 33, 4284–4306. [Google Scholar] [CrossRef]
  16. Tripathi, V.K.; Maurya, R.K.; Mahajan, A. Nonlinear stability analysis of thermal convection in a fluid layer with slip flow and general temperature boundary condition. Chaos Solitons Fractals 2024, 187, 115426. [Google Scholar] [CrossRef]
  17. Evans, B.; Walton, S. Aerodynamic optimisation of a hypersonic reentry vehicle based on solution of the Boltzmann–BGK equation and evolutionary optimisation. Appl. Math. Model. 2017, 52, 215–240. [Google Scholar] [CrossRef]
  18. Li, Z.; Wu, J.; Jiang, X.; Ma, Q. A massively parallel algorithm for hypersonic covering various flow regimes to solve the Boltzmann model equation. Acta Aeronaut. Astronaut. Sin. 2015, 36, 201–212. [Google Scholar]
  19. Nee, A.; Chamkha, A.J. Interaction of Radiation and Turbulent Natural Convection: A Pseudo-Direct Numerical Study. Adv. Appl. Math. Mech. 2022, 14, 1567–1586. [Google Scholar] [CrossRef]
  20. Kumar, G.N.; Penchalaiah, D.; Sarkar, A.; Talole, S. Hypersonic boost glide vehicle trajectory optimization using genetic algorithm. IFAC-PapersOnLine 2018, 51, 118–123. [Google Scholar] [CrossRef]
  21. Sun, W.; Ma, P.; Wang, S.; Chao, T. Analytical Solutions for Hypersonic Glide Trajectory Based on Altitude–Velocity Profile. IEEE Trans. Aerosp. Electron. Syst. 2024, 60, 7423–7436. [Google Scholar] [CrossRef]
  22. Zhai, S.; Yang, J. Piecewise analytic optimized ascent trajectory design and robust adaptive finite-time tracking control for hypersonic boost-glide vehicle. J. Frankl. Inst. 2020, 357, 5485–5501. [Google Scholar] [CrossRef]
  23. Hu, J.; Chen, W. Steady glide trajectory planning method for hypersonic reentry vehicle. J. Beihang Univ. 2015, 41, 1464–1475. [Google Scholar]
  24. Yi, F.; Wei, T.; Yewei, G. Optimization of configuration and trajectory for hypersonic vehicles. Acta Aerodyn. Sin. 2014, 32, 800–805. [Google Scholar]
  25. Wang, K.; Yan, X.; Hong, B.; Nan, W.; Wang, P. A prediction and correction reentry guidance method based on BP network and deep Q-learning network. J. Northwestern Polytech. Univ. 2025, 43, 201–211. [Google Scholar] [CrossRef]
  26. Rizvi, S.I.; Linshu, H.; Dajun, X.; Shah, S. Trajectory optimisation for a rocket-assisted hypersonic boost-glide vehicle. Aeronaut. J. 2017, 121, 469–487. [Google Scholar] [CrossRef]
  27. Yu, W.; Chen, W.; Yang, L.; Liu, X.; Zhou, H. Optimal terminal guidance for exoatmospheric interception. Chin. J. Aeronaut. 2016, 29, 1052–1064. [Google Scholar] [CrossRef]
  28. Xie, Y.; Pan, L.; Gu, X.; Chen, J. Gliding trajectory optimization with multiple objectives and complicated constraints for hypersonic vehicles. J. Natl. Univ. Def. Technol. 2017, 39, 9–17. [Google Scholar]
  29. Candon, M.; Hale, E.; Balajewicz, M.; Delgado-Gutiérrez, A.; Muscarello, V.; Marzocca, P. Parameterization of nonlinear aeroelastic reduced order models via direct interpolation of Taylor partial derivatives. Nonlinear Dyn. 2024, 112, 17649–17670. [Google Scholar] [CrossRef]
  30. Damljanović, D.; Vuković, Đ.; Ocokoljić, G.; Ilić, B.; Rašuo, B. Wind Tunnel Testing of ONERA-M, AGARD-B and HB-2 Standard Models at Off-Design Conditions. Aerospace 2021, 8, 275. [Google Scholar] [CrossRef]
  31. Huang, W.; Ma, L.; Wang, Z.-G.; Pourkashanian, M.; Ingham, D.B.; Luo, S.-B.; Lei, J. A parametric study on the aerodynamic characteristics of a hypersonic waverider vehicle. Acta Astronaut. 2011, 69, 135–140. [Google Scholar] [CrossRef]
  32. Wei, H.; Cai, G.; Fan, Y.; Xu, H.; Wang, J.; Zhou, Z. Online Guidance for Hypersonic Vehicle Reentry Glide Phase. J. Beihang Univ. 2023, 51, 183–192. [Google Scholar]
  33. Frolov, V. Optimization of Lift-Curve Slope for Wing-Fuselage Combination. In Aerodynamics; IntechOpen: London, UK, 2019. [Google Scholar]
  34. Cheng, Y.; Tang, S.; Lyu, S.; Wu, M.; Qiao, H. Aerodynamic statistics-based trajectory estimation of hypersonic maneuvering target. IEEE Access 2020, 8, 227642–227656. [Google Scholar] [CrossRef]
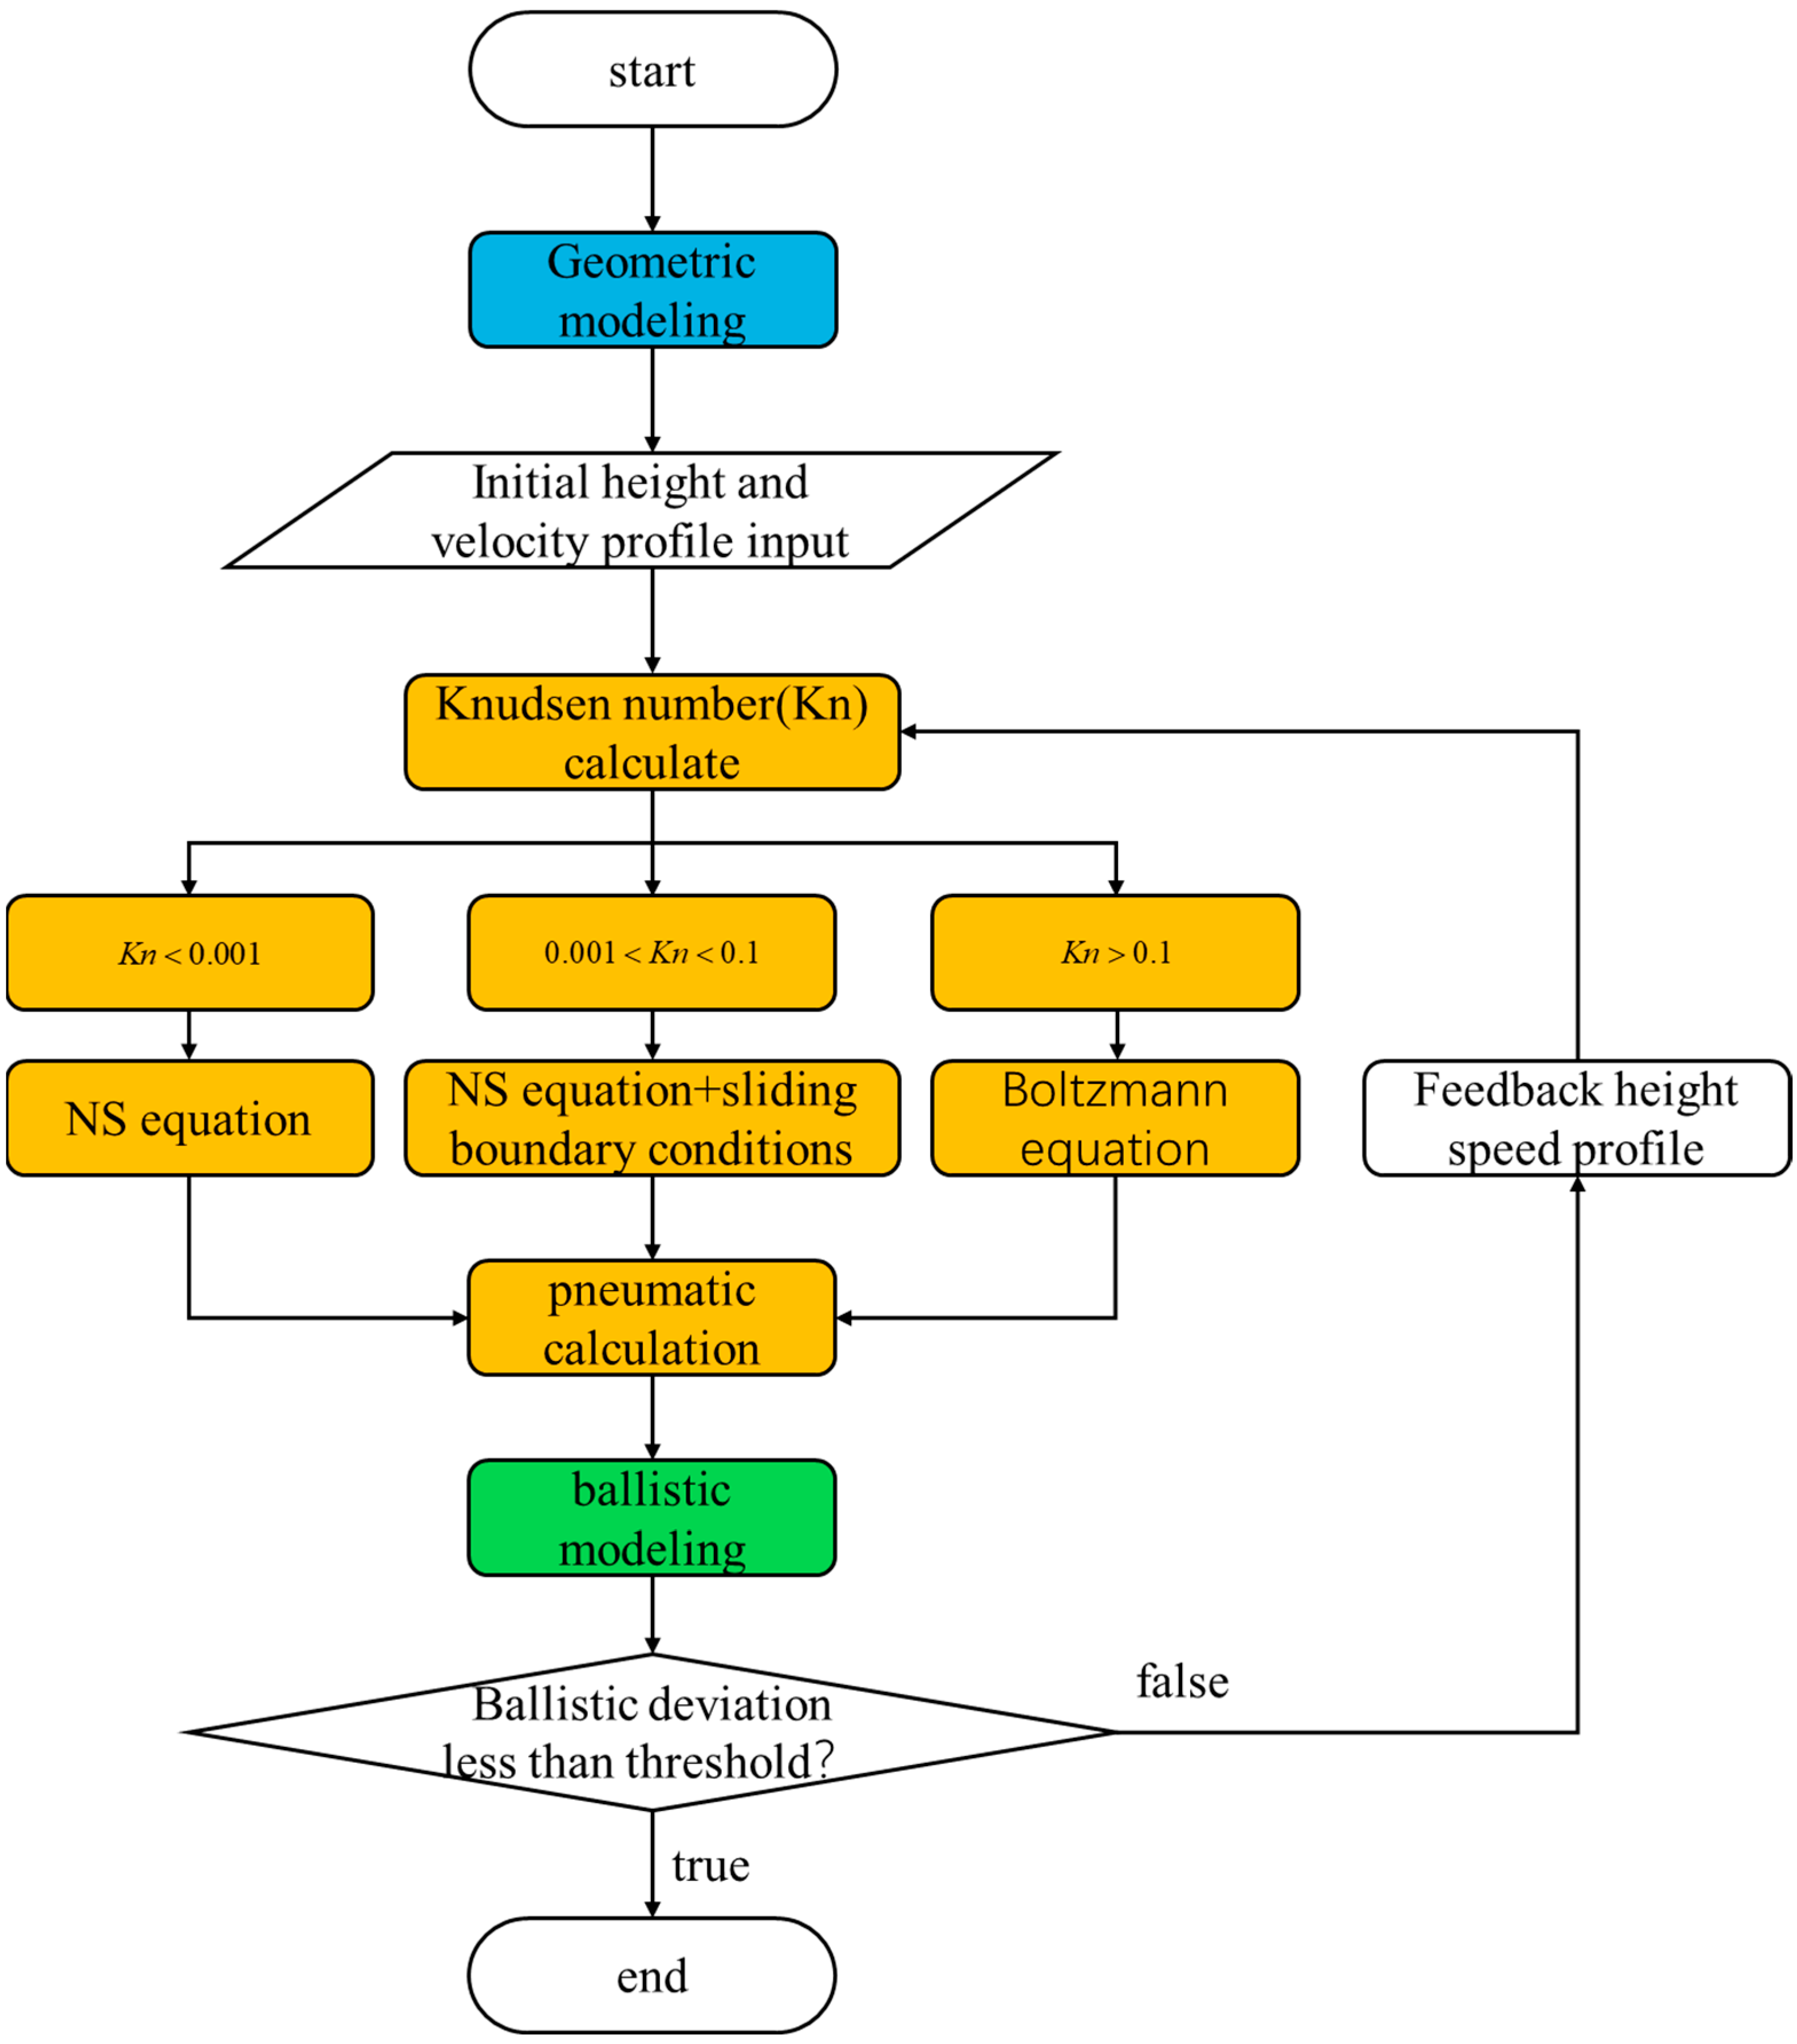
Figure 1. Pneumatic and ballistic simulation iteration process.
Aerospace 12 00956 g001
Figure 2. Schematic diagram of the relative motion between the missile and target.
Aerospace 12 00956 g002
Figure 3. Approximate Mars-16B model diagram.
Aerospace 12 00956 g003
Figure 4. Mars-16B model grid. (Left): Overall mesh densification diagram. (Right): Local detail near the rudder surface.
Aerospace 12 00956 g004
Figure 5. AGARD-B model.
Aerospace 12 00956 g005
Figure 6. Comparison of experimental and numerical simulation data for CL.
Aerospace 12 00956 g006
Figure 7. Height–range relationship.
Aerospace 12 00956 g007
Figure 8. Speed–range relationship.
Aerospace 12 00956 g008
Figure 9. Knudsen number curve.
Aerospace 12 00956 g009
Figure 10. Pneumatic data.
Aerospace 12 00956 g010
Figure 11. Shock Wave Diagram.
Aerospace 12 00956 g011
Figure 12. Speed–time curve.
Aerospace 12 00956 g012
Figure 13. Launch coordinate system trajectory.
Aerospace 12 00956 g013
Figure 14. Display of the trajectory on the map.
Aerospace 12 00956 g014
Figure 15. Flight state angle change.
Aerospace 12 00956 g015
Figure 16. Bounce distance.
Aerospace 12 00956 g016
Figure 17. Airflow angle. (a) Stability of Ballistic Angle. (b) Stability of slip Angle. (c) Stability of Attacking Angle.
Aerospace 12 00956 g017aAerospace 12 00956 g017b
Figure 18. Time–speed curve.
Aerospace 12 00956 g018
Figure 19. Range–altitude curve.
Aerospace 12 00956 g019
Figure 20. Longitude–latitude curve.
Aerospace 12 00956 g020
Table 1. Approximate Mars-16B Basic Parameters.
Physical QuantitySymbolUnitNumerical ValueNote
Weightm[kg]1400
VolumeV[m3]1.63Including rudder
Density ρ [kg/m3]858.9
Soaked areaSwet[m2]13.07Including rudder
Reference areaSplan[m2]13.07Without rudder
Reference lengthL[m]5
Reference widthB[m]1.4Without rudder
Floor area ratior[-]0.37
Center of gravityxg[m]2.64
Table 2. Pneumatic calculation height and Mach number correspondence table.
Height (km)Speed (m/s)Mach Number
010002.9
1014004.7
2016005.4
3017005.6
3521006.8
4027008.5
4530009.2
50330010.0
60350011.1
70350011.8
80350012.4
Table 3. Ballistic modeling input parameters.
SymbolNumerical Value
Launch longitude (°)150°
Launch latitude (°)25°
Launch elevation (m)667
Target initial longitude (°)180°
Target initial latitude (°)40°
Maximum height (km)59
Minimum glide altitude (km)24
Active range (km)168
Maximum range of terminal guidance (km)82
Target speed (m/s)17
Target heading angle (°)91
Table 4. Accuracy verification.
ParametersMethod of This PaperTraditional Approach
Terminal longitude error 0.03 ° 0.12 °
Terminal latitude error 0.02 ° 0.15 °
Maximum height deviation±1.2 km±3.5 km
Simulation time4.5 h5.6 h
Disclaimer/Publisher’s Note: The statements, opinions and data contained in all publications are solely those of the individual author(s) and contributor(s) and not of MDPI and/or the editor(s). MDPI and/or the editor(s) disclaim responsibility for any injury to people or property resulting from any ideas, methods, instructions or products referred to in the content.