Abstract
In this paper, a novel solution- and moving boundary-adaptive Cartesian grid strategy is proposed and used to develop a computational fluid dynamics (CFD) solver. The new Cartesian grid strategy is based on a multi-block structure without grid overlapping or ghost grids in non-fluid areas. In particular, the dynamic grid adaptive operations, as well as the adaptive criteria calculations, are restricted to the grid block boundaries. This reduces the grid adaptation complexity to one dimension lower than that of CFD simulations and also facilitates an intrinsic compatibility with moving boundaries since they are natural grid block boundaries. In addition, an improved hybrid immersed boundary method enforcing a physical constraint of pressure is proposed to robustly implement boundary conditions. The recursively regularized lattice Boltzmann method is applied to solve for fluid dynamics. The performance of the proposed method is validated in simulations of flow induced by a series of two- (2D) and three-dimensional (3D) moving boundaries. Results confirm that the proposed method is adequate to provide efficient and effective dynamical grid refinements for flow solutions and moving boundaries simultaneously. The considered unsteady flow physics are accurately and efficiently reproduced. Particularly, the 3D multiscale flow induced by two tandem flapping wings is simulated at a computational time cost about one order lower than that of a reported adaptive Cartesian strategy. Notably, the grid adaptations only account for a small fraction of CFD time consumption, about 0.5% for pure flow characteristics and 5.0% when moving boundaries are involved. In addition, favorable asymptotic convergence with decreasing minimum grid spacing is observed in the 2D cases.
1. Introduction
During the past decades, the Cartesian grid-based lattice Boltzmann (LB) method has been widely accepted as an efficient and effective computational fluid dynamics (CFD) approach for various unsteady flow simulations (e.g., multiscale flow, multiphase flow, and combustion) [1,2,3,4]. This is mainly due to advantages of both the Cartesian grids (e.g., easy grid generation for complex boundary geometries, perfect mesh quality, and simple discretization of the LB equations) and the LB method (e.g., explicit time marching scheme, linear convection term, simple parallel implementation and low numerical dissipation). However, due to the geometric symmetry refining of Cartesian grids is usually isotropic, hence resulting in an exponential increase in the grid number as well as the computational time cost. The problem becomes crucial in simulations of multiscale flows and/or flows induced by moving boundaries, because the refined area might be significantly enlarged by the fluid dynamics and/or the boundary movements [5,6]. Although many adaptive Cartesian grid methods have been proven effective in relieving the challenge [6,7,8], more efficient adaptive strategies are still in high demand to solve complex problems.
Adaptive Cartesian grids have long been deemed a promising solution to several substantial challenges of CFD, such as tedious mesh generation work, dependence on professional mesh generation software, and uncertainties caused by non-ideal mesh quality [9]. The topic has been extensively studied and various adaptive Cartesian grid strategies have been proposed within both the traditional Navier–Stokes paradigm [10,11,12,13,14,15] and the relatively new LB framework [8,16,17]. The effectiveness of adaptive Cartesian grids in improving numerical accuracy and reducing cost, especially when complex boundary geometries are involved, has been repeatedly verified in simulations of the unsteady wake of blunt objects [7,13,16,17,18], flow induced by multiple and/or moving objects [7,8,10], interface evolution in multiple-phase flow [19], and compressible flow with shocks [18,20].
In these successes, two prominent advantages of Cartesian grids for the implementation of adaptive refinement have been emphasized. First, compared to body-fitted meshes identified by the location in physical computer memories, Cartesian grids can be self-marked by the integrals proportional to their coordinates. This feature allows Cartesian grids to identify their neighboring nodes directly based on physical positions. Assisted by tree-like data structures, it could facilitate convenient and efficient basic operations during adaptive refinements, such as searching for a specific node, adding new nodes, and deleting redundant nodes [7]. Second, in terms of mesh quality, Cartesian grid refinement is usually realized by halving local grid spacings without deteriorating mesh quality as the adaptive refinements of body-fitted meshes usually do [21,22].
However, many of the reported adaptive Cartesian grid strategies are mainly suitable for static boundaries, and many of those considering moving boundaries require ghost grids in non-fluid areas [6,7]. The preference of ghost grids in combination with diffused immersed boundary treatments (e.g., the classic one proposed by Peskin [23]) is favorable to avoid the complexity caused by fresh grids immediately after a moving boundary. Despite that, ghost grids also lead to considerable redundant computational cost, which is especially true when ghost grids are part of the finest grid blocks [6,7]. Moreover, most of the reported solution-adaptive Cartesian grid strategies require calculation of the adaptive criteria, which is also considerably expensive [6,18]. To circumvent these drawbacks and facilitate efficient high-fidelity simulations of complex flow induced by moving boundaries, it is desirable to develop more efficient solution-adaptive Cartesian grids that are simultaneously adaptive for moving boundaries without ghost grids.
The lattice Boltzmann (LB) method is an explicit time–space coupling scheme with an intrinsic compatibility with Cartesian grids. Different from the traditional macroscopic CFD methods that directly solve the Navier–Stokes equations, the LB method is a mesoscopic alternative focused on the possibility distribution functions of fluid particles [3]. Simplified from the continuous Boltzmann equation, the LB method solves a finite set of possibility distribution functions by taking an effective discretization of the full velocity space according to the Gaussian integral theorem [24]. Meanwhile, a linear time relaxation procedure is adopted to model particle collisions [10]. Theoretically, the LB equations can be restored to the weakly compressible Navier–Stokes equations with second-order accuracy [25,26,27]. Based on Cartesian grids, the LB method can be expressed by two local procedures, i.e., a stream process and a collision process. Among the various LB models (e.g., the well-known BGK [28] and MRT [29] models), the recursively regularized (RR) LB method [30,31] applies a distinguishing nonlinear reconstruction of the non-hydrodynamic moments of the distribution functions from the hydrodynamic ones. The method is praised for high computational efficiency as well as favorable numerical stability [32,33].
Different from traditional CFD methods with a sophisticated taste for body-fitted meshes, the LB method intrinsically relies on proper boundary treatments to bridge the staggered Cartesian boundary grids with general curved boundary geometries [3,34]. Some of the reported boundary treatments directly reconstruct the LB distribution functions by mimicking the bounce-back behavior of particles hitting a wall, e.g., the widely used bounce-back (BB) method and its various improved variants [6]. These mesoscopic boundary treatments are usually simple to implement without ghost grids but might not be related to macroscopic boundary conditions in one-to-one maps.
Many boundary treatments for Cartesian grids are developed from a macroscopic view. The aforementioned diffused immersed boundary (IB) method models the presence of boundaries as an external force diffused among the surrounding Cartesian grids, e.g., the classic IB method proposed by Peskin [23] and various improved strategies [7,34]. This kind of method is usually relatively easy to implement, but the boundaries cannot be accurately resolved as sharp interfaces. In contrast, the cut-cell method treats boundaries as sharp interfaces by taking full advantage of the exact local intersections between the boundary interfaces and the staggered Cartesian grids [35]. Due to the geometric complexity, especially for 3D moving boundaries, many applications of the cut-cell method are focused on 2D static boundary problems [34,36].
The hybrid immersed boundary method is proposed to combine the advantages of the diffused IB method and the cut-cell method [37]. In this method, macroscopic variables at boundary grid nodes are reconstructed from the surrounding domain nodes without ghost grids so that an external force is implicitly imposed and the boundary is resolved as a sharp interface [34,37]. The velocity boundary condition is usually of the Dirichlet type or the Neumann type, and an interpolation could be used in the reconstruction of velocity [38,39]. In contrast, the density or pressure at physical boundaries is usually of neither the Dirichlet type nor the Neumann type, i.e., both their values and/or gradients at boundaries are not explicitly prescribed. In many steady high Reynolds number applications with thin boundary layers, this problem is omitted by assuming a Neumann boundary condition, i.e., , but this might not be applicable for relatively low Reynolds numbers, unsteady flows, and/or moving boundaries. In these cases, the Poisson equation is usually solved for the required pressure [38,40].
This paper aims to develop a novel dynamic adaptive Cartesian grid strategy facilitating simultaneous adaptability for flow solutions and moving boundaries so that complex flow with moving boundaries can be efficiently simulated with high fidelity. To achieve this, an improved hybrid IB method is proposed to provide efficient and robust flow information reconstructions for boundary grid nodes. The RR-LB method is adopted to solve for fluid dynamics in the weakly compressible regime. Following this section, the RR-LB algorithm is briefly introduced in Section 2, the novel adaptive Cartesian grid strategy is presented in Section 3, and the improved hybrid IB boundary treatment is detailed in Section 4. Then the proposed method is validated and assessed in a series of 2D and 3D flow simulations considering static or moving boundaries in Section 6. Finally, some critical conclusions are drawn in Section 7.
2. The Recursively Regularized (RR) Lattice Boltzmann (LB) Method
The RR-LB method is applied to solve for fluid dynamics. The method maintains the simple BGK framework by applying a single relaxation time. Specifically, the RR-LB method is decomposed into two cyclic processes, i.e., a streaming process and a collision process. The streaming process can be expressed as
where is the ith distribution function, is the coordinate vector, is the ith discrete characteristic velocity, t is the time, is the time step and is the ith distribution function after collision. After the streaming step, the collision process occurs as
where is the single relaxation time and is the ith off-equilibrium distribution function. Theoretically, the numerical collision frequency is determined as
where is the lattice sound speed satisfying , with and being the grid spacing. The macroscopic variables are related to as
with and p being the fluid density, velocity and pressure, respectively.
The off-equilibrium is determined as
with being the ith equilibrium distribution function, determined as
where is the weight factor associated with and is the identity matrix.
Following Coreixas et al. [24], for the classical D2Q9 and D3Q27 models, can be expressed as
with being the ith Gaussian–Hermite tensor and being the nth coefficient tensor. Different from the classic BGK collision model, which directly uses in Equation (5) (or Equation (7)), the RR method [30] applies a nonlinear reconstruction of by dropping the high-order () terms in Equation (7). The first four Gaussian–Hermite tensors are formulated as
and the corresponding coefficient tensors are recursively related as
As illustrated in Equation (9), the term could be calculated either from or from the macroscopic velocity gradients. Notably, the above recursive regularization process significantly improves the numerical stability by directly filtering out the potentially unstable high-order moments, and the nonlinear reconstruction in Equations (7)–(9) is not compatible with the linear MRT framework [24].
To facilitate synchronization between two different grid spacings, the equilibrium distribution functions as well as the macroscopic variables remain unchanged, while the off-equilibrium distribution functions are related as [16]
where the subscripts c and f represent the coarse and fine grid spacings, respectively.
As demonstrated in Equations (1) and (2), the LBM adopts an explicit time–space coupling strategy. For weakly compressible flows, the maximum velocity is widely accepted to be less than 0.3, which is consistent with the stability analysis of the LBM [26]. In the rest of this paper, the well-known D2Q9 and D3Q27 LB models will be used in 2D and 3D simulations, respectively.
3. Algorithm of the Novel Adaptive Cartesian Grid Strategy
The efficient solution- and moving boundary-adaptive Cartesian grid system is a fundamental contribution of this paper. In the following, details of the novel strategy are dissected into three parts: the basic characteristics, the solution-adaptive algorithm, and the moving boundary-adaptive algorithm.
3.1. Basic Characteristics
In order to reduce unnecessary computation as much as possible, as illustrated in Figure 1, the grid system is based on a multi-block structure without grid overlapping between adjacent blocks or ghost grids in non-fluid areas. A minimum number of five grid layers is enforced in every grid block to avoid contact between the inner boundary and the outer boundaries. Intuitively, the flexible control of grid layers is necessary to realize the grid adaptability for flow solutions, which is critical to provide high-fidelity flow simulations using the fewest grid cells possible. These basic features are essential improvements compared to the purely geometry-adaptive strategy reported in Ref. [7], where ghost grids and prescribed grid distribution are fundamental factors.
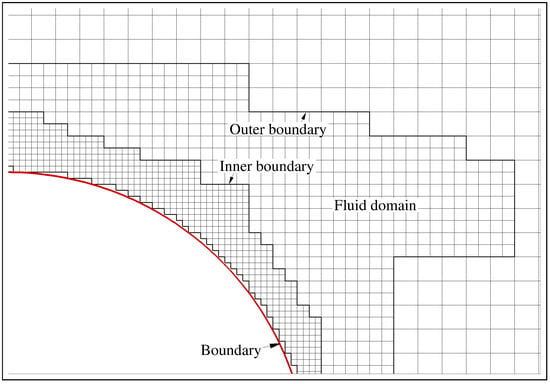
Figure 1.
Illustration of the new solution- and moving boundary-adaptive Cartesian grid.
3.2. Solution-Adaptive Algorithm
Figure 2 demonstrates the adaptive grid algorithm for flow solutions. The process begins with the calculation of two criteria at the outer boundary of a grid block. If either of the adaptive criteria exceeds the prescribed threshold values, a refining process is triggered. Apart from that, the refining process could also be triggered when the minimum number of grid layers between an outer node and the inner boundary of the block is less than five. In contrast, if both the criteria are lower than a fraction (e.g., 0.25) of the threshold values, a coarsening process is triggered. A small fraction, 0.25, is chosen to relieve the triggering frequency. Following Coirier and Powell [10], the adaptive criteria are determined as
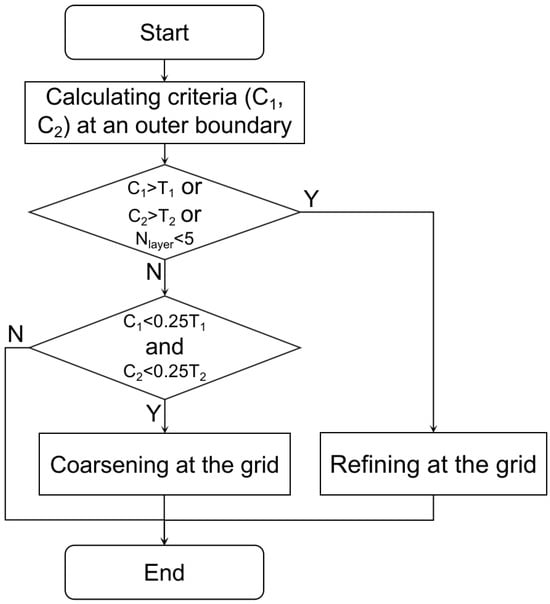
Figure 2.
Solution-adaptive grid algorithm. and are threshold values for the adaptive criteria and , respectively.
The threshold values ( is the reference velocity) are used.
Figure 3 illustrates the refining and coarsening processes at an outer grid boundary. When a refining process is triggered (e.g., at A), new fine grids (e.g., D, E, F, and G) are firstly added to fill all the connected coarse cells (e.g., the cell ABDC). Then the coinciding node (e.g., at A) on the inner boundary of the coarse block is deleted so that the original block boundary BAC changes to be BDC. The coarsening process is exactly the opposite. Taking D for instance, when a coarsening process is triggered, all the connected fine nodes (e.g., E, F, and G) are firstly deleted so that the original block boundary BDC changes to be BAC. Accordingly, the newly emerging coarse inner boundary nodes (e.g., A) are added to the coarse block.
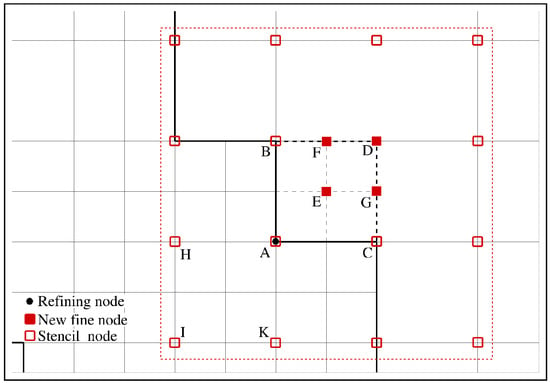
Figure 3.
Grid adaptive process for flow solutions. For a refining process, A is the grid node to be refined. D, E, F and G are the newly added fine nodes, and the coarse node at A will be deleted. All the coarse nodes (or the overlapping fine nodes like H, I, K) indicated by empty squares will be used to reconstruct the flow information at the newly added fine node. For a coarsening process, D is the grid node to be coarsened. D, E, F and G will be deleted and a new coarse node will be added at A.
The flow information at the newly added coarse nodes and the fine nodes that coincide with coarse ones is reconstructed from the coinciding nodes through the information synchronization mechanism between two grid blocks introduced in Section 2. For the newly added fine nodes not coinciding with coarse ones, the flow information is reconstructed through quadratic polynomial interpolations from that at the surrounding coarse nodes within the range of two grid spacings (if a coarse node is missing, the coinciding fine one will be used, e.g., H, I, or K). The regular and well-centered stencil is favorable for smooth and stable interpolations. Still, the information synchronization mechanism is applied before the interpolations.
It should be noticed that the above information reconstructions put an emphasis on the smooth transition between grid blocks without guaranteeing the conservation of mass and momentum. Considering that the potential deviation is mainly produced in the quadratic polynomial interpolations and can be expressed as a truncation error in the order of , it could actually be deemed a minor disturbance within the second-order accurate LB method.
3.3. Moving Boundary-Adaptive Algorithm
The moving boundary-adaptive grid processes are directly simplified from the above solution-adaptive ones by taking the boundary grids as the inner boundary of the block and ignoring the fine grid-related operations. As demonstrated in Figure 4, the processes are triggered when a moving boundary sweeps over a Cartesian node (e.g., D). The node will be deleted if it is already in the fluid area. Otherwise, it will be added as a new node. The flow information at a new boundary grid node is reconstructed using the proposed immersed boundary treatment detailed in the next section (i.e., Section 4).
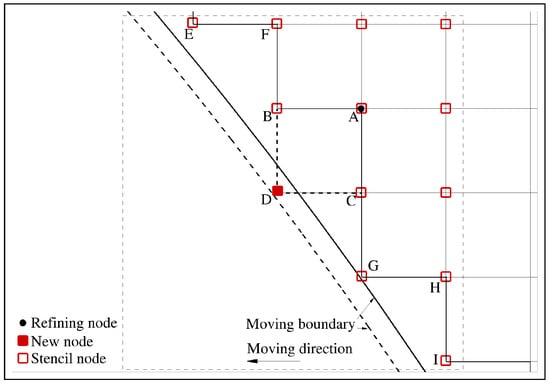
Figure 4.
Grid adaptive process for a moving boundary. The boundary moves across the node D. If the boundary moves to the left, a new grid node will be added at D, and the surrounding nodes indicated by empty squares (e.g., A, B, C, E, F, G, H, I) will be used to reconstruct the flow information at D. Otherwise, if the boundary moves to the right, the already existed grid node D will be deleted, and the previous domain node A becomes a boundary grid node.
4. The Improved Hybrid Immersed Boundary (IB) Treatment
To facilitate robust information reconstruction at boundary grid nodes, especially the fresh ones immediately following a moving boundary (see Figure 4), an improved hybrid IB treatment requiring no ghost grid is proposed to accurately implement the non-slip boundary condition.
Following Jacob et al. [32], the required distribution functions at boundary grid nodes are reconstructed from macroscopic variables (e.g., and ) as well as their gradients according to the RR-LB theory (see Equations (6)–(9)). Different from many existing IB methods, the improved hybrid IB method manages to avoid extrapolation of or solving the Poisson equation in the reconstruction of density (or pressure) by enforcing a physical gradient constraint according to the Navier–Stokes equation, i.e.,
where the subscript n indicates the component normal to the local boundary, is the boundary acceleration, S is the shear strain tensor, is the material derivative, and all the variables are on the boundary surface. It should be noticed that Equation (12) is mainly valid for weakly compressible flow since the assumption is applied.
Since the physical constraint in Equation (12) includes velocity and its gradient (e.g., the viscous term), they are reconstructed before . As shown in Figure 5, following Ref. [32], a reference point (e.g., C) immersed in the fluid domain normal to the boundary with a distance is introduced to assist the macroscopic reconstruction. The required macroscopic flow information at the boundary grid node B is calculated using that at the reference point C and the perpendicular projection A.
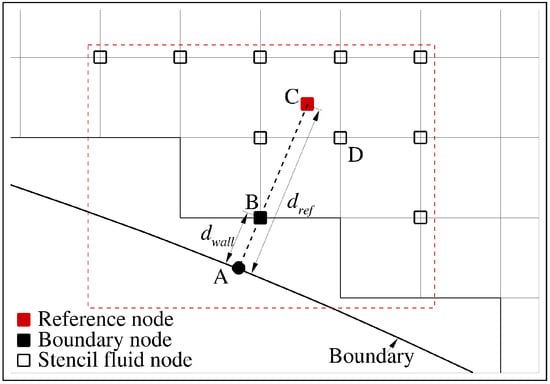
Figure 5.
Sketch of the immersed boundary method. B is the boundary grid node to be reconstructed. A is the perpendicular projection on the boundary. C is a reference point on the line AB with a distance away from the boundary. Domain nodes are denoted by empty squares (e.g., D).
First, the flow information at the reference point C, including and , is calculated from the surrounding domain nodes (e.g., D) satisfying (, with N being the number of dimensions) through a polynomial interpolation. Specifically, quadratic interpolation is preferred once the stencil is suitable. Otherwise, linear interpolation is preferred until the stencil is not applicable, in which case the boundary treatment is terminated by holding the variables from the previous step unchanged.
Based on this, the desired velocity at B is determined through linear interpolation with second-order accuracy, i.e.,
where the subscripts A, B and C are referred to the points shown in Figure 5 and is the wall distance of B. The velocity gradient at B directly takes that at the reference point C without deteriorating the second-order accuracy.
For the desired density at B, a linear interpolation using and the normal gradient of at A (), i.e.,
Using instead of in Equation (14) is favorable to avoid extrapolation as the latter might be smeared by . Similarly, could be determined as
By combining Equation (12) with Equation (15), the gradient could be determined as
where directly takes its value at the reference point (e.g., C).
Apparently, numerical singularity when can be avoided by adjusting .
Furthermore, the ratio between the two terms in the denominator of Equation (17), i.e., , can be related to the time step as
where the aforementioned relations , and are applied. When a small is used so that the velocity change is much less than the sound speed (e.g., , which is called the “high time resolution assumption” in the following), the above ratio is much less than one (e.g., 0.05), and thus is negligible compared to . By neglecting , Equation (17) is then simplified as
Since is always satisfied for incompressible flows and usually satisfied in weakly compressible flow simulations with high time resolutions, Equation (19) is preferred for the sake of simplicity in this paper.
5. Program Implementation
An in-house CFD solver is developed by implementing the RR-LBM together with the improved IB method based on the proposed solution- and moving boundary-adaptive Cartesian grid system.
To facilitate convenient and efficient basic operations for both grid adaptations and CFD calculations, each grid block is organized in a flexible data structure following Xu et al. [7]. Specifically, all grids in a block are stored in an extensible sequence of compact physical memories. Meanwhile, they are effectively sorted in a balanced binary tree (see Figure 1 in Ref. [7]). The compact memories are able to provide efficient data traversal, while the balanced binary tree is ready for efficient basic grid operations, including searching for a node, deleting a redundant node, and adding a new node.
Considering that only local calculations and/or operations are involved throughout the whole algorithm (i.e., the adaptive grid method, the RR-LB method, and the improved IB method), excellent parallel performance can be expected. The solver is coded in the MPI framework using the well-known C/C++ language (version 11). To obtain a clear performance validation of the whole method, including the time consumption caused by the adaptive grid operations, parallelization-related complexity is avoided by using one CPU in the following simulations.
6. Validation and Discussion
The validation is scheduled to assess the performance of the proposed method in detail in a 2D context by considering cases from a static cylinder and oscillating cylinders in different flow conditions to flapping foils with significantly different kinematics. Then a representative case with 3D complex moving boundaries, i.e., two tandem infinitely thin dragonfly wings flapping out of phase, is simulated for a preliminary validation of effectiveness in a 3D context. All simulations are run using one CPU on an ordinary laptop equipped with i5-13500H CPUs.
6.1. Sensitivity of the Adaptive Criteria-Related Parameters
Before going further, sensitivity of the adaptive criteria-related parameters, including the exponent in Equation (11) and the threshold values, is assessed. Considering that the adaptive criteria-related parameters directly work during the solution-adaptive process, the well-documented classical vortex shedding flow induced by a 2D static cylinder at Re = 100 is simulated. Three exponents (i.e., 1.0, 1.5 and 2.0) as well as five threshold values (i.e., 0.4, 0.2, 0.1, 0.05 and 0.025 ) are considered. A minimum grid spacing (D is the cylinder diameter) together with a corresponding time step is used. The maximum grid spacing is , resulting in eight grid blocks in total. Far-field boundaries about 100D away from the cylinder are used. All the simulations terminate at to obtain fully developed regular vortex shedding flow.
Figure 6 and Figure 7 show time histories of the resulting lift () and drag () coefficients, respectively. In general, both and are only slightly affected by the varying parameters. However, observable high-frequency disturbance of can be observed in Figure 6a when the exponent is 1.0 and the threshold value is . The high-frequency disturbance is associated with vorticity contours not smoothly resolved using relatively coarse grids (see Figure 8a). The problem is then effectively removed by increasing the exponent to ≤1.5 and/or decreasing the threshold value to (see Figure 6, Figure 8 and Figure 9).
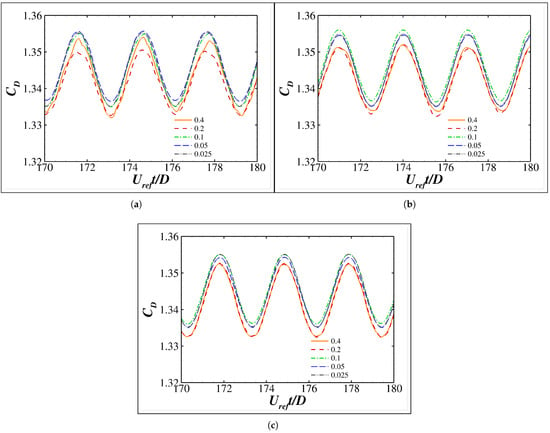
Figure 6.
Time histories of the drag coefficient for different exponents ((a) 1.0., (b) 1.5., and (c) 2.0.) and threshold values (). Results are shifted within half a vortex shedding period to present in phase.
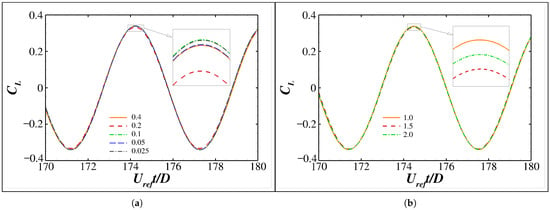
Figure 7.
Time histories of the life coefficient for different threshold values with the exponent being 1.0 (a) and for different exponents with the threshold value being 0.4 (b). Results are shifted within half a vortex shedding period to present in phase.
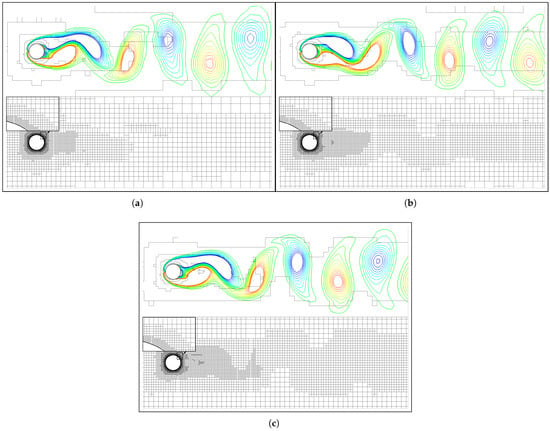
Figure 8.
Vorticity contours (from −1 (blue) to 1 (red) ) and the corresponding grid distributions for different exponents ((a) 1.0, (b) 1.5, and (c) 2.0) with the threshold value being 0.4.
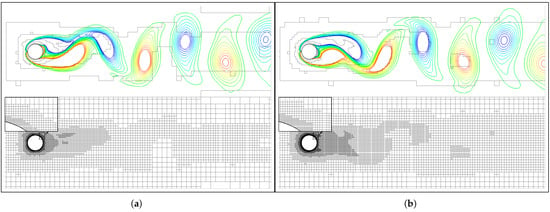
Figure 9.
Vorticity contours (from −1 (blue) to 1 (read) ) and the corresponding grid distributions for different threshold values ((a) 0.2 and (b) 0.1) with the exponent being 1.0.
Conclusively, the adaptive criteria in Equation (11) and the threshold values (0.1) are well selected to reproduce the considered vortex shedding flow in direct numerical simulations.
6.2. Two-Dimensional Flow over a Cylinder
The classical vortex flow induced by a static or moving circular cylinder at Reynolds numbers (Re) around 100 is widely used to validate basic characteristics of numerical schemes. In the following, flow over a static cylinder and that induced by an oscillating cylinder with and without a free stream are considered in sequence.
6.2.1. Flow over a Static Cylinder
The canonical flow over a 2D static circular cylinder with alternatively shedding vortices is simulated to validate and assess the solution-adaptive grid capability of the proposed method in a 2D context. The minimum grid spacing varies from to 0.02, with the corresponding time steps varying from to 0.002, respectively. The maximum grid spacing is fixed at , and the number of grid blocks varies from 11 to 7. Still, the far-field boundaries are about 100D away from the cylinder, and the simulations are terminated at .
Figure 10 shows the vorticity contours as well as the corresponding solution-adaptive grid distributions for different minimum grid spacings. The natural vortex shedding process is smoothly resolved with high resolutions in all these simulations. All the grid distributions exhibit effective adaptability for the vortex evolution in a similar manner, i.e., local refinements move in phase with the vorticity concentrations and the stronger vortices are resolved with finer grids. Meanwhile, the refined minimum is mainly restricted to the vicinity of the boundary, indicating that a minimum of is sufficient to reproduce the unsteady fluid dynamics in the wake.
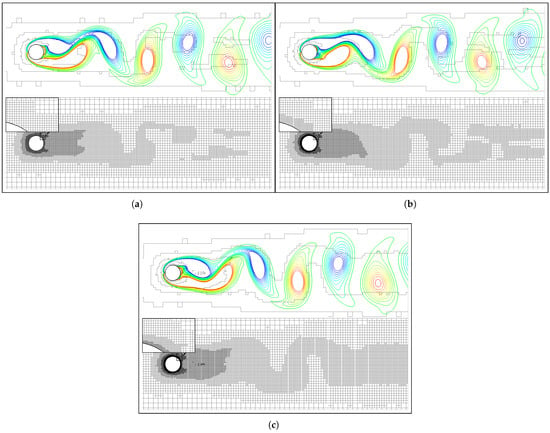
Figure 10.
Vorticity contours (from −1 (blue) to 1 (red) ) and the corresponding grid distributions at with different minimum grid spacings (). (a) . (b) . (c) .
Figure 11a,b show time histories of the drag coefficient () and the lift coefficient (), respectively. Both and are smoothly resolved and converge favorably, with the minimum grid spacing continuously halved. Clear asymptotic behaviors of and are achieved for (see Figure 11a,b). Moreover, as shown in Figure 12, the time-averaged drag coefficient converges at a super-linear rate of about 1.95 when the minimum grid spacing decreases. It should be noticed that this convergence is different from the conventional grid convergence because the decreased minimum grid spacing is only a local refinement near the boundary. Therefore, the nearly quadratic convergence rate is more related to the second-order accurate hybrid IB method proposed in Section 4. In addition, all the data shown in Table 1, including the vortex shedding Strouhal number, time-averaged , and oscillating amplitudes of and , show good agreement with those reported from different studies.
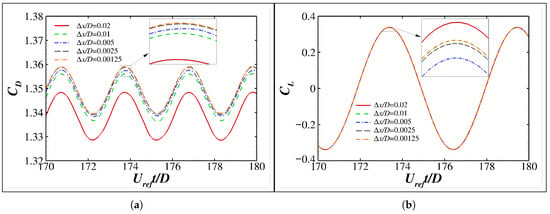
Figure 11.
Time histories of the drag (a) and lift (b) coefficients of a static cylinder at . Results are shifted within half a vortex shedding period to present in phase.
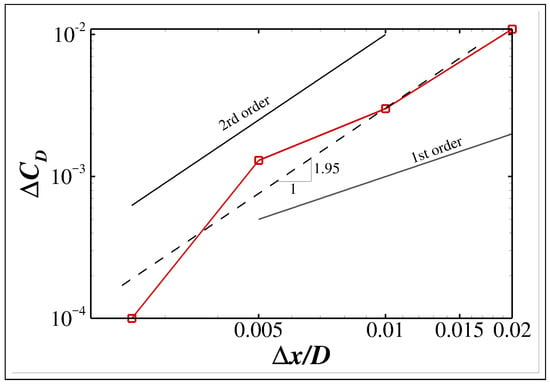
Figure 12.
Convergence rate of drag coefficients with decreasing minimum grid spacing. is defined as . The convergence is different from the conventional grid convergence because decreasing only causes local grid refinement in the vicinity of the boundary.

Table 1.
Force coefficients of a static cylinder at . , is the time-averaged drag coefficient, and and are the oscillating amplitudes of the drag and lift coefficients, respectively.
Table 2 shows the time consumption. The simulations are efficiently conducted; e.g., the simulation with is finished in about half an hour on an ordinary laptop using one CPU. In particular, the solution-adaptive grid adjustments only account for a small percentage ranging from 0.51% to 0.67% of the total time consumption, indicating that the block boundary-confined solution-adaptive refinement strategy is quite efficient and almost independent of the applied minimum grid spacings.

Table 2.
Wall time consumption in simulations of 2D flow over a static cylinder at . and are the total time consumption and that caused by grid adaptations per dimensionless time unit (), respectively.
6.2.2. A 2D Cylinder Oscillating in a Quiescent Flow
To validate and assess the simultaneous grid adaptability for unsteady flow purely induced by moving boundaries in a 2D context, a cylinder oscillating sinusoidally in a quiescent flow is simulated. Following Dütsch et al. [45], the setup with a maximum velocity (, with f and A being the flapping frequency and amplitude, respectively)-based Reynolds number () of 100 and a Keulegan–Carpenter number () of five is considered. The oscillating frequency and amplitude are determined accordingly as and , respectively. At , the cylinder is in the middle position and moves to the left.
According to Section 6.2.1, the minimum grid spacing together with is associated with well-converged results and thus is used in the current simulation. The maximum grid spacing is 1.28D, and eight grid blocks are used in total. The far-field boundaries are about away from the cylinder, and the simulation is terminated at the end of the 30th oscillating cycle.
Results are shown in Figure 13, Figure 14 and Figure 15. As shown in Figure 13, the vorticity contours at three representative instants are smoothly resolved with high fidelity, and the dynamical grid refinements are properly distributed, i.e., conforming well to both the flow characteristics and the moving boundary. Meanwhile, the velocity profiles along four vertical lines at shown in Figure 14 agree well with the experimental and numerical data reported in Ref. [45]. More details of the resultant drag coefficient () shown in Figure 15 also compare well with the data reported in Ref. [45]. In addition, as listed in Table 3, by using one CPU on an ordinary laptop, the simulation takes only 8.38 s per dimensionless time unit () on average, while the dynamic grid adaptations account for 5.12% of that.
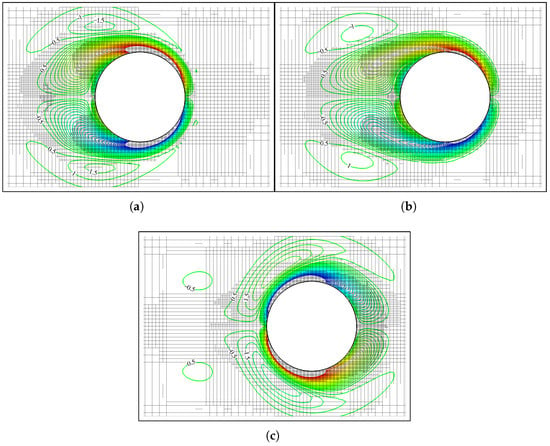
Figure 13.
Vorticity contours (from −15 (blue) to 15 (red) ) and the corresponding adaptive grid distributions of a 2D cylinder oscillating in a quiescent flow. (a) . (b) . (c) .
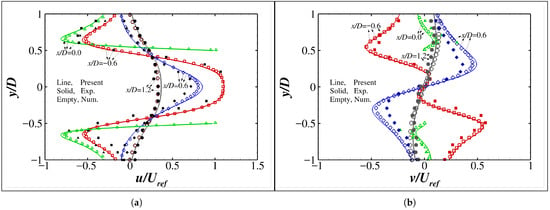
Figure 14.
Velocity profiles at in the simulation of a 2D cylinder oscillating in a quiescent flow. The results reported in Ref. [45] are included for comparison. (a) Horizontal velocity u. (b) Vertical velocity v.
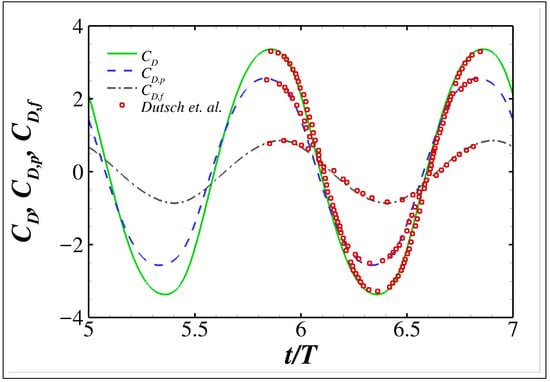
Figure 15.
Time histories of the drag coefficient as well as the friction drag coefficient and pressure drag coefficient of a 2D cylinder oscillating in a quiescent flow. The numerical results reported in Ref. [45] are included for comparison.

Table 3.
Wall time consumption in simulations of 2D flow purely induced by an oscillating cylinder. and are the total time consumption and that caused by grid adaptations per dimensionless time unit (), respectively.
6.2.3. A 2D Cylinder Oscillating in a Uniform Flow
To validate and assess the simultaneous grid adaptability of the proposed method for unsteady flow induced by moving boundaries in an incoming flow, a cylinder oscillating sinusoidally perpendicular to a uniform free stream is simulated. Following Guilmineau and Queutey [46], the setup with , , and the frequency ratio (with being the natural vortex shedding frequency) varying from 0.8 to 1.2 is considered. At , the cylinder is in the middle position and moves upward, and thirty oscillation cycles are covered in each simulation.
Still, the minimum grid spacing together with , the maximum grid spacing , far-field boundaries about away from the cylinder and eight grid blocks are adopted in the simulations. By conducting a simulation with to , is determined as , which is exactly the same as that reported in Ref. [47].
Representatively, Figure 16 and Figure 17 present the vorticity contours and grid distributions at the extreme upper position during the 30th oscillating cycle for and 1.1, respectively. The vortices are clearly resolved at high fidelity, and the corresponding grid distributions demonstrate effective adaptability for the unsteady flow physics and moving boundaries simultaneously. In particular, the abrupt change in vorticity sign (from negative at to positive at ) in the near wake is well reproduced [46].
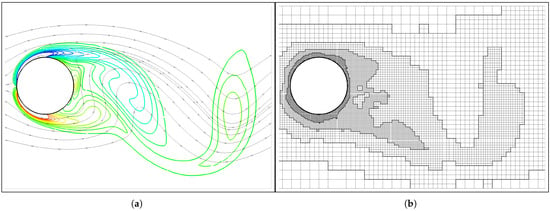
Figure 16.
Vorticity contours (from (blue) to 10 (red) ) and streamlines (a) and the corresponding grid distribution (b) at the extreme upper position during the 30th oscillating cycle with .
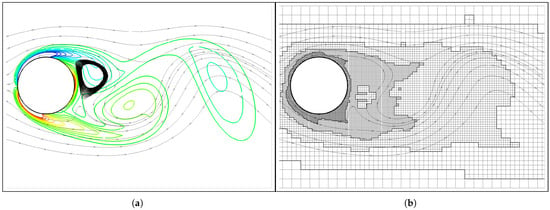
Figure 17.
Vorticity contours (from (blue) to 10 (red) ) (a) and the corresponding grid distribution (b) at the extreme upper position during the 30th oscillating cycle with .
Moreover, the resulting drag and lift coefficients as well as the surface pressure coefficient shown in Figure 18 agree well with those reported in Ref. [46]. The observable discrepancy in for can be attributed to the fact that the vortex shedding is no longer a classic single-frequency process, resulting in as well as and at the same position varying from cycle to cycle (see Figure 19a,b for ).
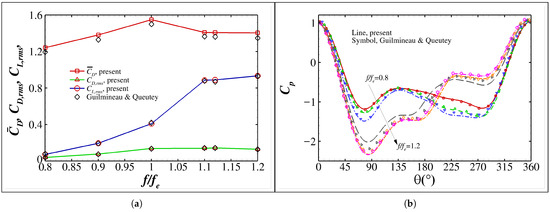
Figure 18.
(a) Force coefficients and (b) pressure coefficient at the extreme upper positions of a cylinder oscillating in a uniform flow with . In (a), is the time-averaged drag coefficient and and are the root mean square of the oscillating parts of the drag and lift coefficients, respectively. In (b), the lines and the symbols using a same color are associated with a same value of .
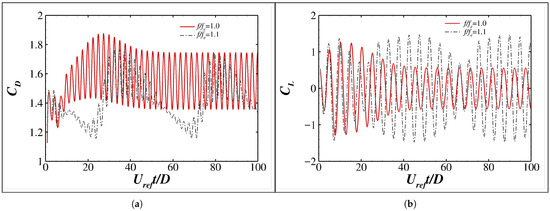
Figure 19.
Time histories of (a) drag coefficients and (b) lift coefficients of a cylinder oscillating in a uniform flow with and 1.1.
Table 4 presents the averaged time consumption. The simulations are conducted efficiently, similar to the above cases. Grid adaptations with a static boundary (i.e., ) account for only 0.59% of the total time consumption, and the percentage with moving boundaries grows to about 3.7%.

Table 4.
Wall time consumption in simulations of a 2D cylinder oscillating in a uniform flow. and are the total time consumption and that caused by grid adaptations per dimensionless time unit (), respectively.
6.3. Two-Dimensional Flapping Foils
In order to validate and assess the proposed method in simulating flows induced by generally complex moving boundaries, flapping foils with two different kinds of kinematics, i.e., one generating propulsion and the other extracting power from surrounding flow, are simulated. The flapping motion is prescribed as a pitching motion () leading a heaving motion () by a phase of , i.e.,
where f is the flapping frequency, c is the chord length, and and are the heaving and pitching amplitudes, respectively. Four minimum grid spacings (i.e., ) together with four corresponding time steps (i.e., ) are considered in the simulations. The maximum grid spacing is fixed at , and the far-field boundaries are about away from the boundaries. The number of grid blocks varies accordingly from 8 to 12.
6.3.1. Propulsive Flapping NACA0012 at
Following Tian et al. [48], a NACA0012 foil generating propulsion by performing sinusoidal heaving and pitching motions simultaneously in a uniform flow at is simulated with , , and .
Representatively, Figure 20a–c display the vorticity contours at the extreme upper position for the first three minimum grid spacings. The unsteady flow physics are resolved at high fidelity, with the grid block shapes conforming to these vorticity concentrations and the flapping foil effectively. Noticeably, the refined finest grids are distributed not only along the boundary and but also at the cores of vorticity concentrations (e.g., the vortex V1) and can affect the vortex evolution observably. For example, the orientation of the vortex V1 shown in Figure 20a for is obviously different from that shown in Figure 20b,c for and 0.0025, respectively. Consistently, the resulting drag shown in Figure 21a is not smoothly resolved using but then, together with the lift coefficients shown in Figure 21b, exhibits favorable asymptotic convergence with decreasing minimum grid spacing for . Moreover, the converged values indicate significant propulsion (negative ) generation and agree very well with the data reported in Ref. [48].
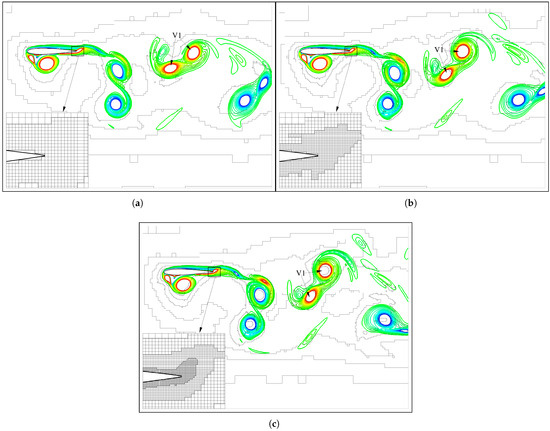
Figure 20.
Vorticity contours (from −20 (blue) to 20 (red) ) and corresponding grid distributions indicated by the block boundaries at the extreme top position in the simulations of a propulsive flapping foil. (a) . (b) . (c) .
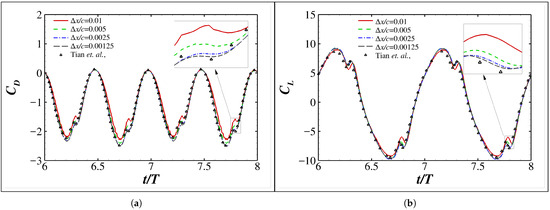
Figure 21.
Time histories of the (a) drag coefficients and (b) lift coefficients of a propulsive flapping NACA0012 foil. The numerical data reported in Ref. [48] are included for comparison.
The averaged time consumption is listed in Table 5. The well-converged results with can be efficiently simulated at a cost of 24.93 min per flapping cycle using one CPU on an ordinary laptop. Similar to the oscillating cylinder cases in Section 6.2, the time consumption caused by the grid adaptations only accounts for a small fraction (ranging from 1.80% to 2.96%) of the total time consumption.

Table 5.
Wall time consumption in simulations of a propulsive flapping NACA0012 foil per flapping cycle. and are the total time consumption and that caused by the dynamic grid adaptations, respectively.
6.3.2. Power Extracting Flapping NACA0015 at
Following Kinsey and Dumas [49], a sinusoidally flapping NACA0015 foil extracting power from a uniform free stream at with large heaving and pitching amplitudes, i.e., , and , is simulated.
Results are shown in Figure 22 and Figure 23. As shown in Figure 22a–c, the vortices are smoothly resolved, with the adaptive grids effectively refined. Similar to the above flapping NACA0012 foil cases, the refined minimum grids are able to improve the solution fidelity at vortex cores and can affect the vortex evolution observably. For example, due to a relatively coarse grid spacing, the leading edge vortex (LEV) shown in Figure 22 for is observably less concentrated than those shown in Figure 22b,c for . The influence to some relatively weak vortices (e.g., V1 and V2 shown in Figure 22) is more apparent. Consistently, the resulting drag and power coefficients shown in Figure 23a,b are not smoothly solved using but then converge favorably with decreasing minimum grid spacing for . Moreover, the converged values agree well with those reported in Ref. [49].
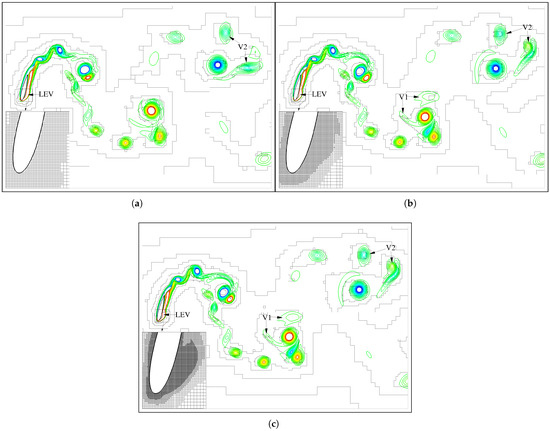
Figure 22.
Vorticity contours (from (blue) to 10 (red) ) and grid distributions indicated by grid block boundaries at the middle position in the simulations of an energy-harvesting flapping foil for three minimum grid spacings. (a) . (b) . (c) .
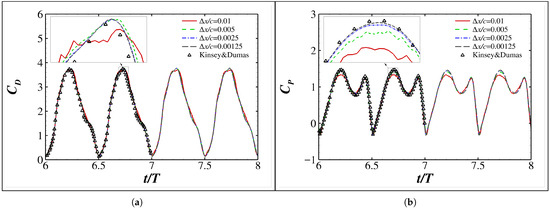
Figure 23.
Time histories of (a) drag coefficients and (b) power coefficients of an energy-harvesting flapping NACA0015 foil. The numerical results reported in Ref. [49] are included for comparison.
The averaged time consumption is shown in Table 6. Similar to the above propulsive flapping NACA0012 cases, the well-converged results with are efficiently simulated at a cost of 27.29 min per flapping cycle using one CPU on an ordinary laptop, and the time cost caused by the grid adaptations only accounts for a small fraction ranging from 2.63% to 3.32% of the total time consumption.

Table 6.
Wall time consumption in simulations of an energy-harvesting flapping NACA0015 foil per flapping cycle. and are the total time consumption and that caused by the dynamic grid adaptations, respectively.
6.4. Tandem Flapping Wings of a 3D Hovering Dragonfly
In order to validate and assess the simultaneous grid adaptability of the proposed method for multiscale flow induced by complex moving boundaries in a 3D context, two tandem dragonfly wings flapping in a hovering flight are simulated. The wing geometries [50] (see Figure 24a) and flapping kinematics [51,52] (see Figure 24b) measured from real dragonflies are adopted in the simulations. According to these natural measurements, the wings have spans of about 5 cm and mean chord lengths of about 1 cm and flap at a frequency of 36 Hz within a stroke plane at an angle of to the horizontal plane (see Figure 24a). Moreover, the forewing and the hindwing flap with a phase difference of [51]. As illustrated in Figure 24a,b, both stroke and pitching motions are performed, with kinematics determined as
and
respectively. A vertical mirrored plane is applied to mimic the potential interaction between wings on different sides of a four-wing dragonfly. The Reynolds number based on the mean chord length ( cm) and the maximum tip velocity ( cm = 11.31 m/s) is about 4000. Four flapping cycles of a single hindwing and two tandem wings are simulated using a minimum grid spacing of and a corresponding time step of . The maximum grid spacing is , and six grid blocks are generated in total. The far-field boundaries are about away from the wings. Since the Mach number is and the ratio in Equation (18) is , both the weakly compressible flow assumption and the high time resolution assumption are well satisfied, allowing the proposed method to be used.
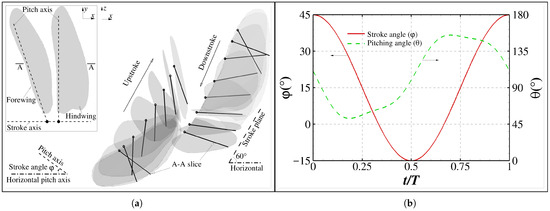
Figure 24.
(a) Wing geometries and (b) flapping kinematics. In (a), the wings conduct stroke motion around the stroke axis (aligned with the dragonfly body) and pitching motion around the pitch axis simultaneously. An up-stroking forewing and a down-stroking hindwing are presented, with the leading edge indicated by empty circles. The pitch angle is defined as the angle from the stroke plane to a wing plane.
The resulting lift coefficient of the hindwings shown in Figure 25 as a function of time compares well with the experimental data reported in Ref. [52]. Particularly, the maximum values of around for both a single hindwing and a hindwing in tandem with a forewingare accurately predicted by the simulations [52]. The most obvious discrepancy occurs during the hindwing supination in a downstroke, and it could be at least partially attributed to the fact that the wing shapes shown in Figure 24 are different from those used in Ref. [52].
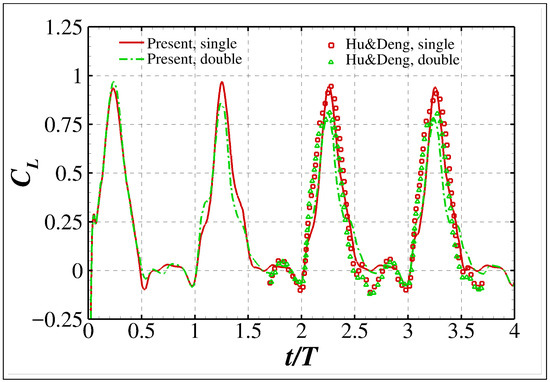
Figure 25.
The lift coefficient (, with L being the z-component of the resultant force and S being the hindwing area). The experimental results reported in Ref. [52] are included for comparison.
The flow characteristics as well as the adaptive grid distributions are shown in Figure 26. As can be seen, due to the effective grid adaptability, the multiscale vortical structures induced by the flapping wings are resolved with high resolutions. In particular, the attached leading edge vortices (LEVs), which are responsible for the high values of maximum around shown in Figure 25, as well as their attenuation due to the fore–hindwing interaction, are clearly captured in the simulations.
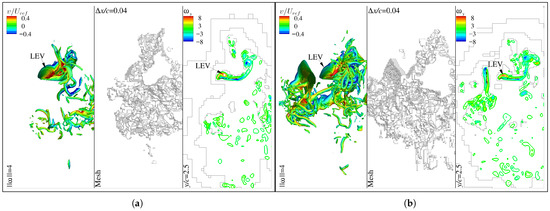
Figure 26.
Vortical structures (indicated by iso-surfaces of the vorticity magnitude ), adaptive grid distributions, and lateral vortices in the middle-span plane (from left to right in each figure) around the middle of a downstroke of the hindwings. The magnitude () and spanwise component () of the vorticity are normalized by . is the normalized spanwise velocity. (a) Single hindwing, . (b) Two wings, .
The averaged time consumption is presented in Table 7. The data show that the proposed method is so efficient that the multiscale flow induced by one and two complex 3D flapping wings could be simulated using 2.5 and 3.63 h per cycle, respectively, using one CPU on an ordinary laptop. This computational time cost is about one order lower than that (55.68 and 67.2 CPU hours) reported in Ref. [7] using a purely geometry-adaptive Cartesian strategy (both the kinematic parameters and the minimum grid spacing are the same). In addition, the grid adaptations only cause a small fraction (2.83% and 3.39% for one and two wings, respectively) of the total time consumption. This is quantitatively consistent with the above 2D cases, indicating that the advantageous efficient grid adaptivity provided by the proposed method is robust and almost independent of the complexities of the simulated problems.

Table 7.
Wall time consumption in simulations of 3D flapping wings of a hovering dragonfly per flapping cycle. and are the total time consumption and that caused by the dynamic grid adaptations, respectively.
7. Conclusions
In this paper, an effective and efficient adaptive Cartesian grid strategy, featuring simultaneous adaptability for flow solutions and moving boundaries, is proposed. The Cartesian grid system is based on a multi-block structure without grid overlapping between two adjacent blocks or ghost grids in non-fluid areas. The dynamic grid adaptability-related criteria calculations and basic grid operations (e.g., deleting redundant grid nodes and adding new grid nodes) are all restricted to the grid block boundaries. The distinguishing feature not only reduces the complexity of grid adaptation by one dimension, but also provides intrinsic compatibility with moving boundaries. Apart from that, within the weakly compressible flow regime, an improved hybrid IB method is proposed to provide efficient and robust flow information reconstruction for boundary grids (including fresh grids immediately following a moving boundary) by enforcing a physical gradient constraint according to the Navier–Stokes equation. Combined with the well-known recursively regularized lattice Boltzmann method, the proposed advantageous features are finally merged into a CFD solver.
Simulations reproducing various 2D unsteady flows, including those induced by static and oscillating cylinders as well as different kinds of flapping foils, are conducted to validate and assess the proposed method in detail. After that, a representative 3D multiscale flow induced by two tandem flapping wings is simulated for a preliminary validation of the proposed method in a 3D context. Results confirm that the proposed method is adequate to provide efficient simulations of unsteady flows with high fidelity, even if complex moving boundaries are involved. The 3D multiscale flow induced by two tandem flapping wings of a hovering dragonfly is efficiently simulated using about 3.6 h per flapping cycle using one CPU on an ordinary laptop. The computational time cost is about one order lower than that of a reported Cartesian grid strategy. Meanwhile, the grid adaptive process for flow solutions is shown to account for a small fraction around 0.5% of the total CFD simulations, and the percentage increases to between 1.8% and 5.12% when moving boundaries are involved. In addition, in all the considered 2D flow simulations, the proposed method is able to provide clear asymptotic convergence with decreasing minimum grid spacings.
Conclusively, the proposed method is a pretty promising framework for getting rid of tedious mesh generation tasks and achieving favorable compromises between accuracy and cost for CFD simulations. In the future, more extensive tests on the potential effect of the dynamic grids in simulations of different flow solutions (e.g., acoustics and turbulence) will be conducted to extend the method for more general industrial applications.
Author Contributions
Conceptualization, L.X.; methodology, L.X.; software, L.X.; validation, L.X.; formal analysis, L.X.; investigation, L.X.; resources, Z.G.; data curation, Z.G.; writing—original draft preparation, Z.G.; writing—review and editing, L.X.; visualization, Z.G.; supervision, Y.G.; project administration, Y.G.; funding acquisition, N.Z. All authors have read and agreed to the published version of the manuscript.
Funding
This research was funded by the National Natural Science Foundation of China, grant number 12302379. Professor Xu also acknowledges the technical support from the Computing Center in Xi’an.
Institutional Review Board Statement
Not applicable.
Informed Consent Statement
Not applicable.
Data Availability Statement
The original contributions presented in this study are included in the article. Further inquiries can be directed to the corresponding author.
Conflicts of Interest
The authors declare no conflicts of interest.
Abbreviations
The following abbreviations are used in this manuscript:
| CFD | Computational Fluid Dynamics |
| 2D | Two-Dimensional |
| 3D | Three-Dimensional |
| AMR | Adaptive Mesh Refinement |
| MRT | Multiple Relaxation Times |
| RR | Recursively Regularized |
| IB | Immersed Boundary |
References
- Aidun, C.K.; Clausen, J.R. Lattice-Boltzmann method for complex flows. Annu. Rev. Fluid Mech. 2010, 42, 439–472. [Google Scholar] [CrossRef]
- Zarghami, A.; Looije, N.; Van den Akker, H. Assessment of interaction potential in simulating nonisothermal multiphase systems by means of lattice Boltzmann modeling. Phys. Rev. E 2015, 92, 023307. [Google Scholar] [CrossRef] [PubMed]
- Hosseini, S.; Karlin, I. Lattice Boltzmann for non-ideal fluids: Fundamentals and Practice. Phys. Rep. 2023, 1030, 1–137. [Google Scholar] [CrossRef]
- Hosseini, S.A.; Boivin, P.; Thévenin, D.; Karlin, I. Lattice Boltzmann methods for combustion applications. Prog. Energy Combust. Sci. 2024, 102, 101140. [Google Scholar] [CrossRef]
- Sugaya, K.; Imamura, T. Unsteady turbulent flow simulations on moving Cartesian grids using immersed boundary method and high-order scheme. Comput. Fluids 2021, 231, 105173. [Google Scholar] [CrossRef]
- Wang, Y.; Wu, Y.; Zeng, Y.; Jiang, M.; Liu, Z. An immersed boundary lattice Boltzmann method on block-structured adaptive grids for the simulation of particle-laden flows on CPUs/GPUs. Comput. Phys. Commun. 2025, 314, 109674. [Google Scholar] [CrossRef]
- Xu, L.; Tian, F.B.; Young, J.; Lai, J.C. A novel geometry-adaptive Cartesian grid based immersed boundary–lattice Boltzmann method for fluid–structure interactions at moderate and high Reynolds numbers. J. Comput. Phys. 2018, 375, 22–56. [Google Scholar] [CrossRef]
- Cheng, Z.; Wachs, A. An immersed boundary/multi-relaxation time lattice Boltzmann method on adaptive octree grids for the particle-resolved simulation of particle-laden flows. J. Comput. Phys. 2022, 471, 111669. [Google Scholar] [CrossRef]
- Slotnick, J.P.; Khodadoust, A.; Alonso, J.; Darmofal, D.; Gropp, W.; Lurie, E.; Mavriplis, D.J. CFD Vision 2030 Study: A Path to Revolutionary Computational Aerosciences; Technical Report NF1676L-18332; Boeing: Arlington, VA, USA; Stanford University, Massachusetts Institute of Technology, National Center for Supercomputing Applications: Stanford, CA, USA; Pratt & Whitney United Technologies Corp.: East Hartford, CT, USA; University of Wyoming, NTRS Research Center: Langley Research Center (LaRC): Laramie, WY, USA; Langley Research Center (LaRC): Hampton, VA, USA, 2014.
- Coirier, W.J.; Powell, K.G. Solution-adaptive Cartesian cell approach for viscous and inviscid flows. Aiaa J. 1996, 34, 938–945. [Google Scholar] [CrossRef]
- English, R.E.; Qiu, L.; Yu, Y.; Fedkiw, R. An adaptive discretization of incompressible flow using a multitude of moving Cartesian grids. J. Comput. Phys. 2013, 254, 107–154. [Google Scholar] [CrossRef]
- Zhang, X.J.; Zhu, Y.S.; Yan, K.; Zhang, Y.Y. New immersed boundary method on the adaptive Cartesian grid applied to the local discontinuous Galerkin method. Chin. J. Mech. Eng. 2018, 31, 22. [Google Scholar] [CrossRef]
- Péron, S.; Benoit, C.; Renaud, T.; Mary, I. An immersed boundary method on Cartesian adaptive grids for the simulation of compressible flows around arbitrary geometries. Eng. Comput. 2021, 37, 2419–2437. [Google Scholar] [CrossRef]
- Meng, S.; Zhou, D.; Yuan, X.; Li, X.; Chen, H.; Bi, L. Enhanced strategy for adaptive Cartesian grid generation with arbitrarily complex 3D geometry. Adv. Eng. Softw. 2022, 174, 103304. [Google Scholar] [CrossRef]
- Qi, X.; Wang, Z.; Zhu, J.; Tian, L.; Zhao, N. High-order discontinuous Galerkin method with immersed boundary treatment for compressible flows on parallel adaptive Cartesian grids. Phys. Fluids 2024, 36, 116139. [Google Scholar] [CrossRef]
- Filippova, O.; Hänel, D. Grid refinement for lattice-BGK models. J. Comput. Phys. 1998, 147, 219–228. [Google Scholar] [CrossRef]
- Valero-Lara, P.; Jansson, J. A non-uniform staggered Cartesian grid approach for lattice-Boltzmann method. Procedia Comput. Sci. 2015, 51, 296–305. [Google Scholar] [CrossRef]
- Luo, C.; Bi, L.; Meng, S.; Gao, H.; Yuan, X.; Tang, Z. A novel algorithm for fluid dynamics simulation with cell-adaptive Cartesian grids and immersed boundary method. Phys. Fluids 2025, 37, 046122. [Google Scholar] [CrossRef]
- Lauricella, M.; Tiribocchi, A.; Succi, S.; Brandt, L.; Mukherjee, A.; La Rocca, M.; Montessori, A. Thread-safe multiphase lattice Boltzmann model for droplet and bubble dynamics at high density and viscosity contrasts. Phys. Fluids 2025, 37, 072111. [Google Scholar] [CrossRef]
- Qi, X.; Yang, Y.; Tian, L.; Wang, Z.; Zhao, N. A parallel methodology of adaptive Cartesian grid for compressible flow simulations. Adv. Aerodyn. 2022, 4, 21. [Google Scholar] [CrossRef]
- Johnson, A.; Tezduyar, T. Mesh update strategies in parallel finite element computations of flow problems with moving boundaries and interfaces. Comput. Methods Appl. Mech. Eng. 1994, 119, 73–94. [Google Scholar] [CrossRef]
- Bonfiglioli, A.; Paciorri, R.; Di Mascio, A. The role of mesh generation, adaptation, and refinement on the computation of flows featuring strong shocks. Model. Simul. Eng. 2012, 2012, 631276. [Google Scholar] [CrossRef]
- Peskin, C.S. Flow patterns around heart valves: A numerical method. J. Comput. Phys. 1972, 10, 252–271. [Google Scholar] [CrossRef]
- Coreixas, C.; Wissocq, G.; Puigt, G.; Boussuge, J.F.; Sagaut, P. Recursive regularization step for high-order lattice Boltzmann methods. Phys. Rev. E 2017, 96, 033306. [Google Scholar] [CrossRef]
- Qian, Y.H.; D’Humières, D.; Lallemand, P. Lattice BGK models for Navier-Stokes equation. Europhys. Lett. (EPL) 1992, 17, 479–484. [Google Scholar] [CrossRef]
- Lallemand, P.; Luo, L.S. Theory of the lattice Boltzmann method: Dispersion, dissipation, isotropy, Galilean invariance, and stability. Phys. Rev. E 2000, 61, 6546–6562. [Google Scholar] [CrossRef]
- Xu, L.; Yu, X.; Regenauer-Lieb, K. An immersed boundary-lattice Boltzmann method for gaseous slip flow. Phys. Fluids 2020, 32, 012002. [Google Scholar] [CrossRef]
- Bhatnagar, P.L.; Gross, E.P.; Krook, M. A model for collision processes in gases. I. Small mmplitude processes in charged and neutral one–component systems. Phys. Rev. 1954, 94, 511–525. [Google Scholar] [CrossRef]
- d’Humières, D. Multiple–relaxation–time lattice Boltzmann models in three dimensions. Philos. Trans. R. Soc. Lond. A Math. Phys. Eng. Sci. 2002, 360, 437–451. [Google Scholar] [CrossRef]
- Malaspinas, O. Increasing stability and accuracy of the lattice Boltzmann scheme: Recursivity and regularization. arXiv 2015. [CrossRef]
- Mattila, K.K.; Philippi, P.C.; Hegele, L.A. High-order regularization in lattice-Boltzmann equations. Phys. Fluids 2017, 29, 046103. [Google Scholar] [CrossRef]
- Jacob, J.; Malaspinas, O.; Sagaut, P. A new hybrid recursive regularised Bhatnagar–Gross–Krook collision model for lattice Boltzmann method-based large eddy simulation. J. Turbul. 2018, 19, 1051–1076. [Google Scholar] [CrossRef]
- Feng, Y.; Boivin, P.; Jacob, J.; Sagaut, P. Hybrid recursive regularized thermal lattice Boltzmann model for high subsonic compressible flows. J. Comput. Phys. 2019, 394, 82–99. [Google Scholar] [CrossRef]
- Sotiropoulos, F.; Yang, X. Immersed boundary methods for simulating fluid–structure interaction. Prog. Aerosp. Sci. 2014, 65, 1–21. [Google Scholar] [CrossRef]
- Clarke, D.K.; Salas, M.D.; Hassan, H.A. Euler calculations for multielement airfoils using Cartesian grids. AIAA J. 1986, 24, 353–358. [Google Scholar] [CrossRef]
- Meyer, M.; Devesa, A.; Hickel, S.; Hu, X.; Adams, N. A conservative immersed interface method for Large-Eddy Simulation of incompressible flows. J. Comput. Phys. 2010, 229, 6300–6317. [Google Scholar] [CrossRef]
- Fadlun, E.; Verzicco, R.; Orlandi, P.; Mohd-Yusof, J. Combined Immersed-Boundary Finite-Difference Methods for Three-Dimensional Complex Flow Simulations. J. Comput. Phys. 2000, 161, 35–60. [Google Scholar] [CrossRef]
- Seo, J.H.; Mittal, R. A sharp-interface immersed boundary method with improved mass conservation and reduced spurious pressure oscillations. J. Comput. Phys. 2011, 230, 7347–7363. [Google Scholar] [CrossRef]
- Li, C.G.; Bale, R.; Wang, W.; Tsubokura, M. A sharp interface immersed boundary method for thin-walled geometries in viscous compressible flows. Int. J. Mech. Sci. 2023, 253, 108401. [Google Scholar] [CrossRef]
- Capizzano, F.; Cinquegrana, D. Applying a Cartesian method to moving boundaries. Comput. Fluids 2023, 263, 105968. [Google Scholar] [CrossRef]
- Williamson, C.H.K. Oblique and parallel modes of vortex shedding in the wake of a circular cylinder at low Reynolds numbers. J. Fluid Mech. 1989, 206, 579–627. [Google Scholar] [CrossRef]
- Linnick, M.N.; Fasel, H.F. A high-order immersed interface method for simulating unsteady incompressible flows on irregular domains. J. Comput. Phys. 2005, 204, 157–192. [Google Scholar] [CrossRef]
- Le, D.; Khoo, B.; Peraire, J. An immersed interface method for viscous incompressible flows involving rigid and flexible boundaries. J. Comput. Phys. 2006, 220, 109–138. [Google Scholar] [CrossRef]
- Berthelsen, P.A.; Faltinsen, O.M. A local directional ghost cell approach for incompressible viscous flow problems with irregular boundaries. J. Comput. Phys. 2008, 227, 4354–4397. [Google Scholar] [CrossRef]
- Dütsch, H.; Durst, F.; Becker, S.; Lienhart, H. Low-Reynolds-number flow around an oscillating circular cylinder at low Keulegan–Carpenter numbers. J. Fluid Mech. 1998, 360, 249–271. [Google Scholar] [CrossRef]
- Guilmineau, E.; Queutey, P. A numerical simulation of vortex shedding from an oscillating circular cylinder. J. Fluids Struct. 2002, 16, 773–794. [Google Scholar] [CrossRef]
- Lu, X.Y.; Dalton, C. Calculation of the timing of vortex formation from an oscillating cylinder. J. Fluids Struct. 1996, 10, 527–541. [Google Scholar] [CrossRef]
- Tian, F.B.; Wang, Y.; Young, J.; Lai, J.C.S. An FSI solution technique based on the DSD/SST method and its applications. Math. Model. Methods Appl. Sci. 2015, 25, 2257–2285. [Google Scholar] [CrossRef]
- Kinsey, T.; Dumas, G. Parametric study of an oscillating airfoil in a power-extraction regime. AIAA J. 2008, 46, 1318–1330. [Google Scholar] [CrossRef]
- Norberg, R. The pterostigma of insect wings an inertial regulator of wing pitch. J. Comp. Physiol. 1972, 81, 9–22. [Google Scholar] [CrossRef]
- Norberg, R. Hovering flight of the dragonfly Aeschna Juncea L., kinematics and aerodynamics. In Swimming and Flying in Nature; Wu, T.Y.T., Brokaw, C.J., Brennen, C., Eds.; Springer: Boston, MA, USA, 1975; pp. 763–781. [Google Scholar]
- Hu, Z.; Deng, X.Y. Aerodynamic interaction between forewing and hindwing of a hovering dragonfly. Acta Mech. Sin. 2014, 30, 787–799. [Google Scholar] [CrossRef]
Disclaimer/Publisher’s Note: The statements, opinions and data contained in all publications are solely those of the individual author(s) and contributor(s) and not of MDPI and/or the editor(s). MDPI and/or the editor(s) disclaim responsibility for any injury to people or property resulting from any ideas, methods, instructions or products referred to in the content. |
© 2025 by the authors. Licensee MDPI, Basel, Switzerland. This article is an open access article distributed under the terms and conditions of the Creative Commons Attribution (CC BY) license (https://creativecommons.org/licenses/by/4.0/).