1. Introduction
Since the end of the Cold War, military and civilian organizations have actively pursued atmospheric flight faster than Mach 5. Technological advancements drove the development of the North American X-15 rocket plane, the Boeing X-20 “Dyna-Soar”, the Rockwell Space Shuttle Orbiter, the X-30 “National Aerospace Plane”, and the USAF/Boeing X-51 Waverider, among others. In this work, we derive insight by looking to the lessons learned by the X-15 program. At its inception, the leadership recognized that aerodynamic design capable of “good stability and control at high Mach numbers” was a “major problem to be solved”. The X-15 had to have satisfactory flying qualities across all mission phases—boost climb, ballistic/zero-gee, reentry, approach, and landing.
Neil Armstrong, then a NASA pilot, flew one of the most extraordinary missions in the X-15 program. A dramatization of his piloting comprises the opening scenes of the 2018
First Man feature film. On the fourth test flight featuring the MH-96 Adaptive Flight Control System (AFCS), mission control instructed Armstrong to first exceed Mach 5, then execute a 4-gee pullup to hold altitude during reentry [
1,
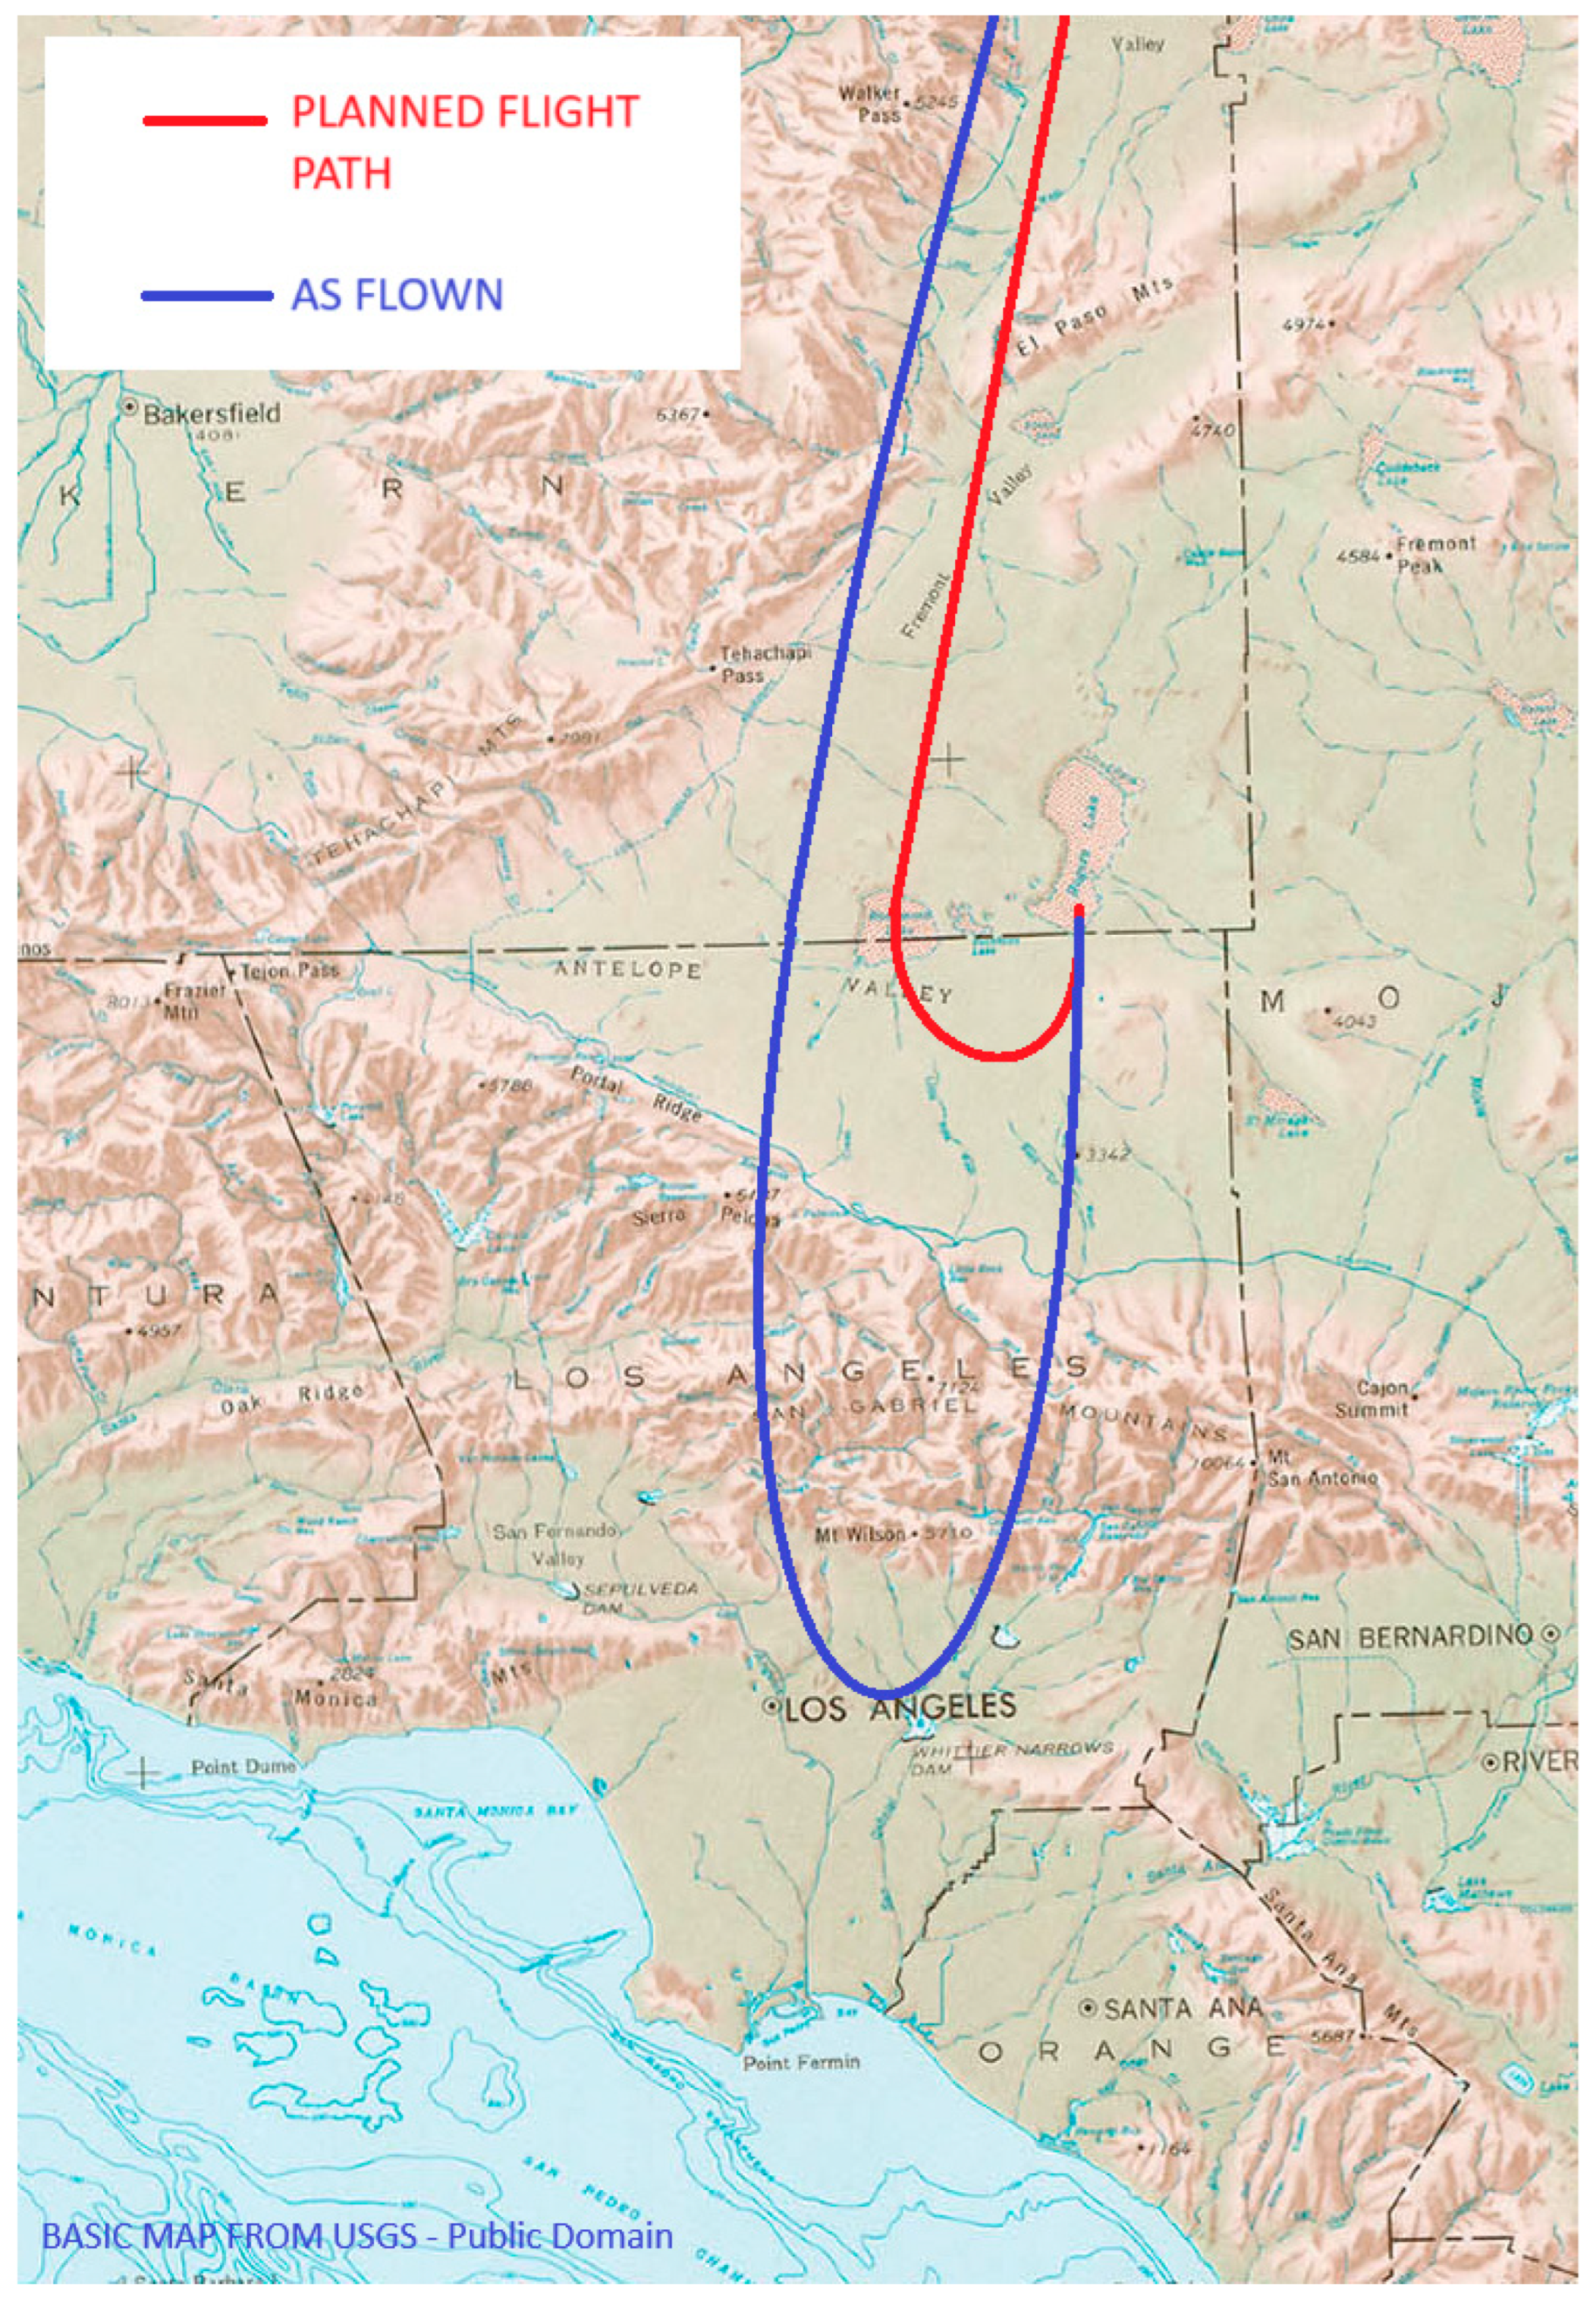
2]. In the flight test, Armstrong deviated considerably from his planned course; see
Figure 1. Post flight, it became clear that Armstrong “attempted to pushover with the pitch stick while the α hold mode opposed his commands” [
3]. His general loss of lateral/directional control occurred as the pitch control automatic system fought his stick inputs.
In order to design future airframes, stability and control screening methodologies must be developed to foresee potential flying qualities issues before the vehicle enters detail design and/or flight testing. While modern controls can theoretically command the motion of a multi-axis unstable bare airframe, to do so may well require an impractical quantity of control power, an unattainable decomposition of attainable moments, or excessive bandwidth. This work focuses on developing controllability risk-assessment metrics which can be applied to “preliminary design” type aerodynamic data; as a consequence, we prefer compact algebraic forms to complex matrix operations or optimization processes. Consequently, our approach focuses upon finding novel applications of otherwise classical analysis methods to assist design synthesis.
We use these methods to predict both the bare-airframe low-order system dynamic response as well as the closed loop response using McRuer’s “equivalent stability derivative” method [
4]. We leverage MIL-F-8785C and MIL-STD-1797, which are deeply rooted in subjective pilot ratings, to characterize favorable from unfavorable “equivalent low-order system” dynamics [
5,
6]. McRuer’s method synthesizes the effective value of a dynamic derivative based upon bare-airframe dynamic derivatives, quasi-static aerodynamic control-power derivatives and proportional feedback gains. While it neglects temporal effects such as group delay, which contribute to real-world feedback limits involving self-exciting gain and phase margins, it remains a tool to help us evaluate the potential for a closed-loop system to be free from control saturation when exposed to defined perturbations. Absent such screening methods, a team might select a poorly performing airframe concept for detail design.
Similarly, we use the Bihrle-Weissman Criteria to identify potentially destabilizing adverse yaw [
7,
8]. This approach to analysis post-dates the X-15 design, flight test, and lessons-learned analysis [
9,
10]. Classical control systems connect each command channel to a specific aerodynamic control surface—for example, in the case of the X-15 lateral stick motion to differential horizontal tail motion. The Bihrle-Weissman Criteria consider whether the “cross-talk” between the yaw and roll moments developed by the “aileron” will overpower the directional stability of an airframe which otherwise exhibits positive “stick-fixed” static directional stability. Similarly, MIL-F-8785C and MIL-STD-1797 call out maximum permissible sideslip excursions resulting from uncoordinated lateral-stick commands [
5,
6]. These standards complement but differ from the Weissman Criteria. If considerable “aileron-to-rudder interconnect” gains are required to mitigate either problem, additional reserve control power must be dedicated to its implementation at the preliminary design level. While the Bihrle-Weissman Criteria clearly identify some designs as being spin-resistant as opposed to spin-prone, it finds other designs having ambiguous spin-susceptibility. This work also identifies candidate “secondary factors” that trigger the lateral/directional upsets that emerged from the X-15 flight test program.
This paper will present short-form equations which predict the approximate rigid-body dynamic response of an aircraft; discuss established equivalent low-order system bandwidth and damping norms developed by the USAF for MIL-F-8785C and MIL-STD-1797; and introduce McRuer’s “equivalent stability derivative” approach. Because all simulation and equation-based analyses depend upon a foundational aerodynamic model, and since the surviving X-15 wind tunnel database proved incomplete, we will introduce VORLAX, a potential-flow panel-method code, to estimate the missing static and dynamic data [
11,
12,
13]. Finally, we will analyze the flight envelope of the X-15 at the reentry mass property conditions to identify the confluence of aerodynamic problems which caused Armstrong to experience controllability challenges.
2. Methods to Evaluate Flying Qualities
Flyable aircraft must be stable and controllable. High-speed vehicles differ from conventional aircraft in that they must (1) fly in an extreme heating environment, (2) operate at very low and very high dynamic pressures, and (3) have very weak inherent aerodynamic damping at high flight speeds. While the flight’s nature is much more extreme than for low-speed vehicles, we believe that the factors that lead to good flying qualities are not exclusive to low- or high-speed aircraft [
8]. Indeed, both the X-15 and the Space Shuttle Orbiter were engineered to conform with then-extant MIL standards for flying qualities [
5,
6,
14]. In more recent years, Wang et al. [
15] have used similarly classical approaches and language to characterize a desirable control system for a supersonic tailless configuration.
Kwiek et al. [
16] note as we do the especial challenges with bandwidth and damping found during hypersonic flight at low dynamic pressure. One byproduct of flight at high true airspeed is the dominance of inertial over aerodynamic forces in dynamic motion, that is, that inherent aerodynamic damping becomes progressively less effective as speeds rise; rigid body motions scale with the square root of the dynamic pressure. Taken together, the bare-airframe response, which might have been satisfactory at subsonic speeds, becomes unacceptably unresponsive and poorly damped under hypersonic conditions.
2.1. Coordinate Reference Frames for Database Generation
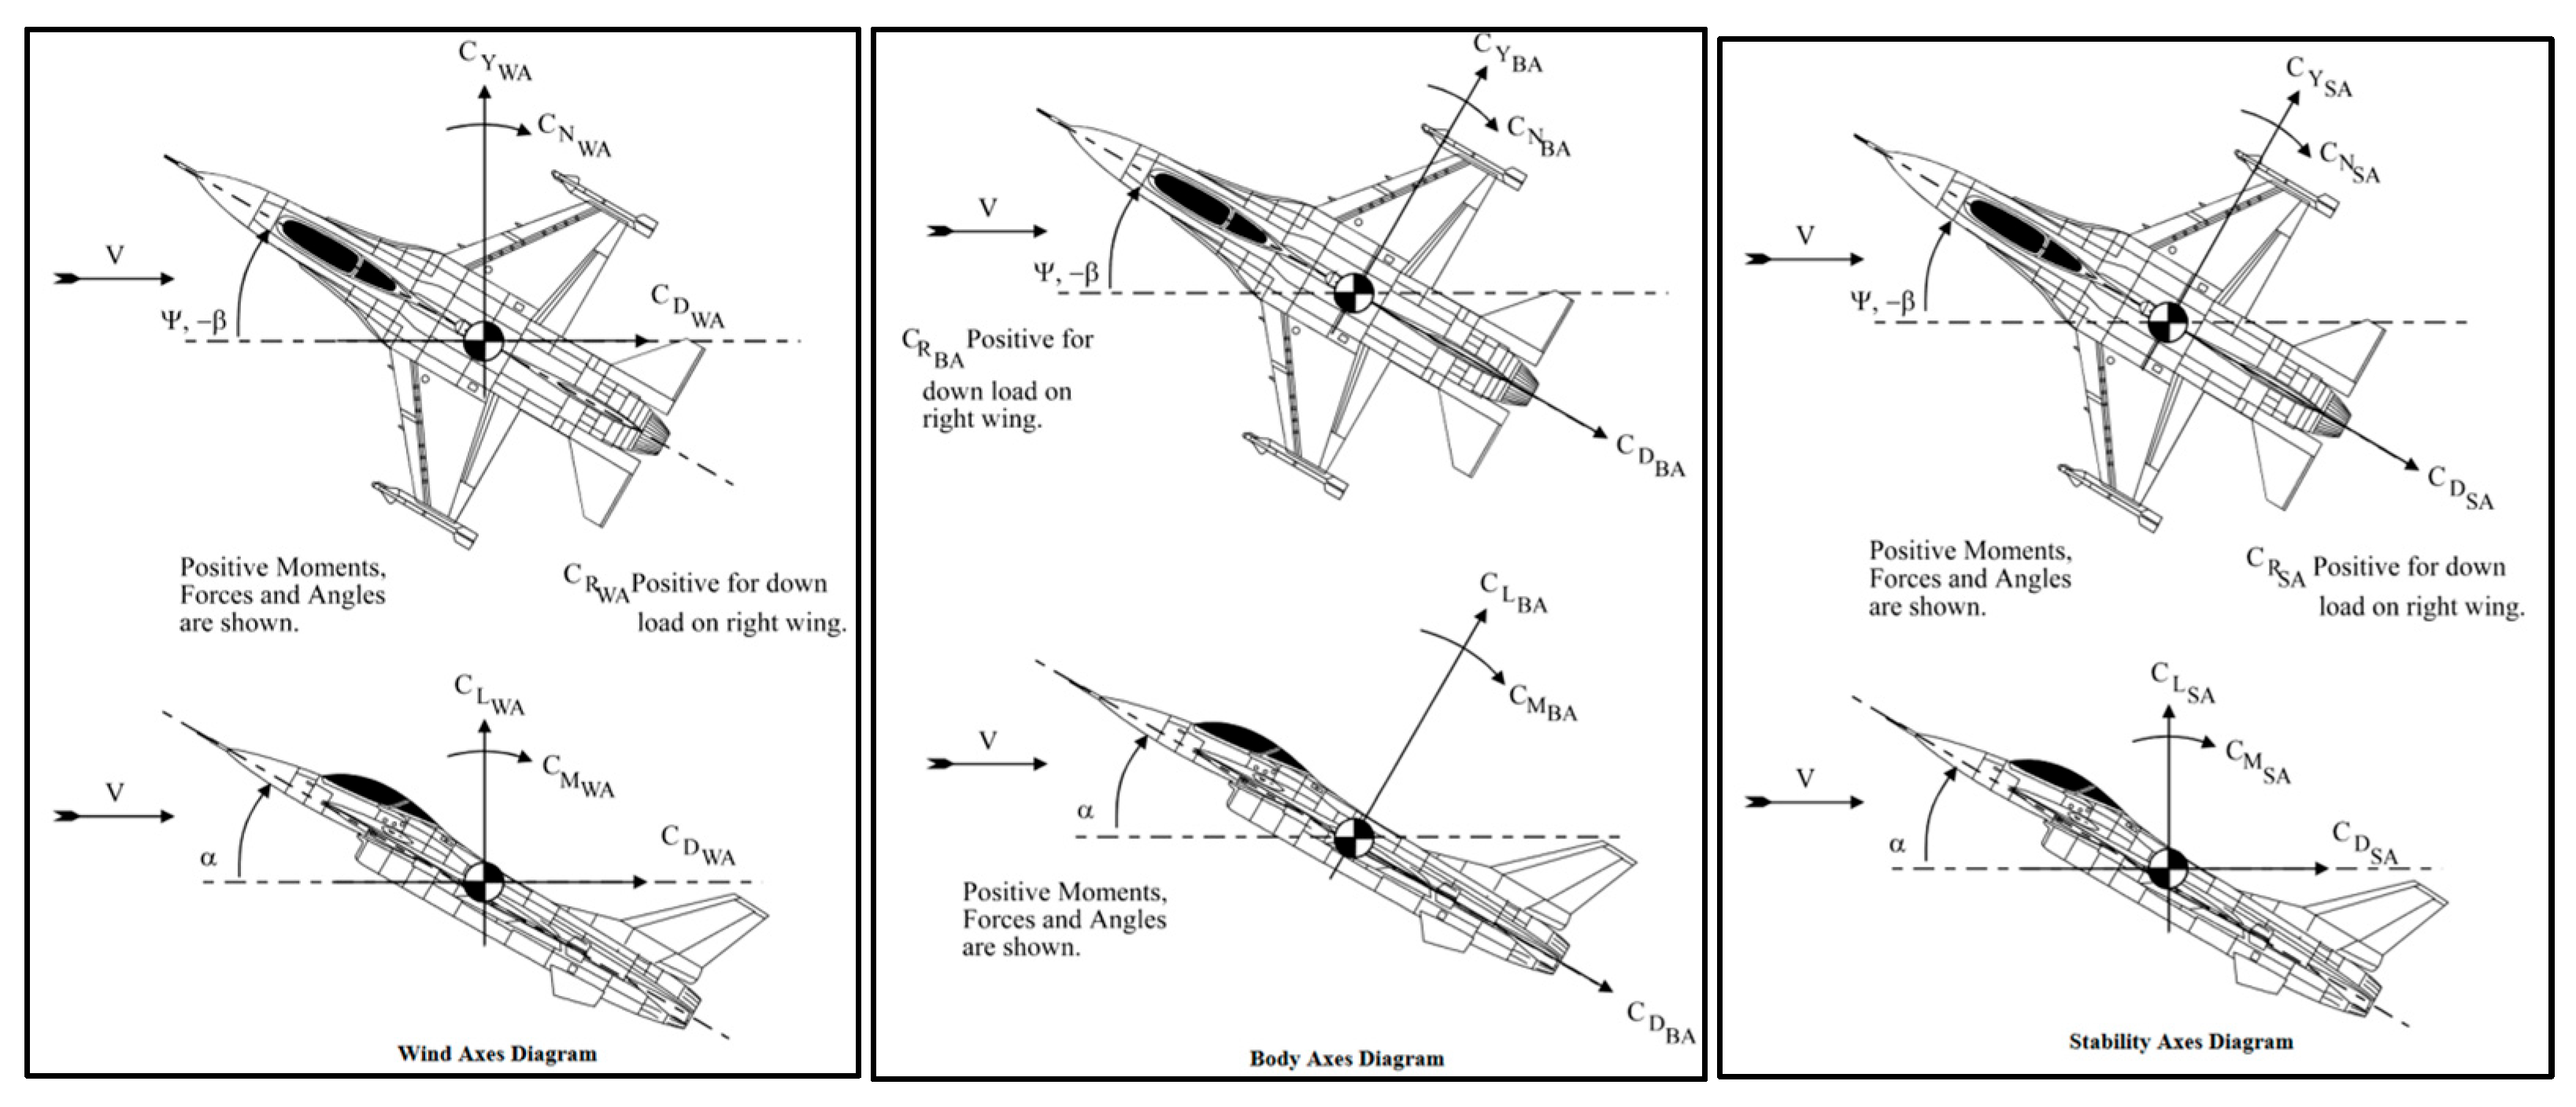
Aircraft motion may be characterized in terms of three axis translations (up–down, left–right, front–back) and three axis rotations (pitch, roll, and yaw) all acting upon the aircraft’s moment reference point. We may align these motions either in a wind-axis reference frame, a body-axis, or the commonly used stability-axis reference frame; see
Figure 2. The stability-axis features a wind-oriented reference frame in pitch (x-z plane) and body-axis frame in roll and yaw (
x-y and
y-z planes) [
17].
2.2. Approximate Longitudinal Rigid Body Dynamic Response
We follow the work of Roskam [
18] and Yechout [
19] to simplify the classical aircraft equations of motion to estimate aircraft modes under a rigid-body, small-perturbation approximation. This approximation assumes that the aircraft does not exhibit significant structural bending or torsion and that the wind velocity perturbations are small, such that they are linearized. Approximating an aircraft as a rigid body is a necessary assumption to yield the dynamic equations that follow in this section.
Typical performance specifications for flying qualities define desired motions for steady level flight (nZ = 1) as well as maneuvering flight (nZ ≠ 1, climb/descend, accelerate/decelerate, and roll into and out of banked turns).
While pitch trim is an essential component of steady level flight, it is not the only criterion. The equilibrium trim point needs to be stable. To achieve inherent static stability, the aerodynamic center (AC) must be placed behind the center of gravity (CG) for all operating conditions. For most low-speed aircraft, the AC position is a function of the Mach number and angle of attack but does not change appreciably as the control surfaces deflect.
We may approximate the inherent short-period, rigid-body oscillatory mode of the aircraft (frequency in rad/s) at a given speed (
M) and angle of attack (
α) as
For an aircraft with irreversible control surfaces lacking a feedback control system to alter the short-period frequency, the value
dCm/dα represents the bare-airframe aerodynamic properties. Following McRuer [
4], a feedback control system can synthesize an “apparent” static stability if its control surfaces deflect proportionally to sensed deviations from the desired trimmed angle of attack [
8].
Similarly, we may estimate the short-period damping ratio as
where the pitch angular acceleration due to the pitch rate is
and the normalized vertical acceleration due to the angle of attack is
where
V∞ is the aircraft velocity in feet per second of true airspeed [
8,
18]. On an aircraft with irreversible control surfaces lacking a feedback control system, the value of
Cmq represents its fundamental “bare-airframe” pitch damping [
8,
18,
19]. Alternatively, we may synthesize an apparent pitching moment due to the pitching rate [
8,
13].
The presence of the true airspeed in the denominator of both terms controlling the damping ratio is important for high-speed flight because the effective damping ratio declines inversely proportional to the true airspeed given a constant
Cmq and
dCL/dα. As the airspeed increases from 200-KTAS to 4000-KTAS (i.e.,
M ≈ 0.3 → 6) while holding the dynamic pressure constant, damping declines by a factor of ~20 [
8]. Thus, even statically stable high-speed airframes, which inherently develop favorable stick-fixed, short-period frequencies, will need closed-loop feedback augmentation to provide the level of damping needed to successfully perform their intended mission. It is straightforward to estimate the aerodynamic derivative values that a closed-loop system must synthesize to achieve a desired damping ratio. Following McRuer [
4], the needed pitch damping derivative (
Cmq)
required may be estimated as
We must also consider a second longitudinal oscillatory mode, the Phugoid; where kinetic energy (i.e., airspeed) and gravitational potential energy (i.e., altitude) freely exchange with one another [
18,
19]. The Phugoid expresses itself as a surging motion where a gain in altitude is associated with a loss of airspeed. At speeds greater than Mach 5, kinetic energy greatly exceeds potential energy; thus, a lightly damped Phugoid mode may traverse a wide variation in altitude [
8].
The Phugoid natural frequency (in rad/s) may be approximated by
and the consequent damping ratio as
Note the presence of the true airspeed in the denominator of the Phugoid frequency equation. The faster we fly, the slower the Phugoidal rigid-body mode becomes.
2.3. Approximate Lateral/Directional Rigid Body Dynamic Responses
Since aircraft have no inherent pendulum stability, they remain “top side up” only when they display stable lateral/directional oscillatory “Dutch Roll” motions. They also may display stable or unstable non-oscillatory behaviors in the pure Direction, Roll, and Spiral Mode flight paths.
Dutch Roll Mode is an oscillatory mode coupling roll and yaw motions [
8,
18,
19,
20]. Its frequency, in rad/s, may be estimated by
where
. Note that the values of directional stability (
dCn/dβ) and dihedral effect (
dCl/dβ) feeding this equation must be given per degree of sideslip referenced to the body axis. So long as
> 0, the aircraft will oscillate. At low angles of attack,
dCn/dβ dominates
; as the angle of attack increases, the dihedral effect may play an additional stabilizing role especially for slender, swept configurations where
Izz/Ixx >> 1 [
8,
19,
20].
Directional divergence is the byproduct of a statically unstable airplane in yaw; this is highly unfavorable. If
< 0, we estimate the divergent instability in terms of its Time-to-Double; see Equation (9):
For an oscillatory system, the Dutch Roll damping ratio is approximated by [
13,
18,
19]:
where the normalized lateral acceleration due to sideslip is
and the yaw angular acceleration due to yaw rate is
Once again, the presence of the true airspeed in the denominator of both terms controls the damping ratio; the damping scales are inversely proportional to the true airspeed given a constant
Cnr and
dCY/dβ in the lateral/directional frame. Thus, as with the short-period mode, we see a need for closed-loop feedback augmentation to achieve satisfactory Dutch Roll damping at very high airspeeds [
8]. Using McRuer’s [
4] “equivalent stability derivative” paradigm, we may estimate the yaw damping derivative required to generate a specific frequency and damping ratio as
and its roll damping derivative counterpart as
Roll Mode is a first-order convergence/divergence mode seen as a tendency to damp the roll rate when the pilot executes a bank maneuver. It is typically defined with the roll time constant,
τr: the time taken to achieve 63% of the peak roll rate upon steady aileron input.
τr is independent of the magnitude of the roll control input. If
τr < 0, the aircraft is unstable and behaves unpredictably in response to roll commands. If
τr < 0.1 s, the aircraft is extremely (possibly excessively) responsive to roll inputs. Conversely, if
τr is too long, the airplane is so sluggish as to degrade maneuvering performance. The MIL-STDs suggest that Level 1 flying qualities require
τr < 1.4 s; for Level 2,
τr < 3.0 s; and for Level 3,
τr shall not exceed 10 s; any time constant greater than 10 s is considered to be so unresponsive as to be uncontrollable [
5,
6].
We may estimate
τr by
where the roll angular acceleration due to roll rate is
For slender high-speed vehicles, the roll time constant will depend greatly upon the flight dynamic pressure; at low dynamic pressures, τr may prove to be objectionably long, whereas at high dynamic pressures, τr may prove to be objectionably short.
The Spiral Mode is another first-order convergence/divergence metric that manifests itself as a tendency for an aircraft to roll into an ever-tightening spiraling turn (unstable) or roll out of a turn back to wings-level flight (stable) [
18,
19]. We may estimate
τs by
where the Spiral Mode root is
and the roll angular accelerations due to sideslip and yaw rates are
and
and the yaw angular accelerations due to sideslip and yaw rates are
and
When s < 0, Spiral Mode is stable; this is good. If s > 0, Spiral Mode is unstable [
18,
19]. For Level 1,
τs > 12 s; for Level 2,
τs > 8 s; for Level 3,
τs > 4 s; any time constant below 4 s is considered to be so unstable as to be uncontrollable [
6].
2.4. Bandwidth Limitations
To ensure the aircraft can respond to pilot inputs, MIL-F-8785C and MIL-STD-1797 provide preferred equivalent low order system frequencies and damping ratios for flight phases and aircraft types [
5,
6]. These documents define the “Control Anticipation Parameter” (CAP) as a critical screening parameter. CAP defines a range of acceptable longitudinal rigid-body frequencies in terms of pitch responsiveness:
and
In
Section 5, we will see that high-altitude flight drives both frequency and responsiveness towards zero.
For Level 1 flying qualities, both MIL-F-8785C and MIL-STD-1797 specify the short-period damping ratio
ζsp > 0.35; under no circumstances should it fall below the uncontrollable boundary of 0.15 [
5,
6]. The MH-96 AFCS tested on Neil Armstrong’s X-15 aimed to achieve subjective “deadbeat damping” and scheduled a
ζ > 0.5 on all three axes [
21]. When below maximum gains, the controller provided exceptional Level 1 flying qualities with assistance from the reaction control system (RCS) in near-vacuum flight.
For a Class IV aircraft, like the X-15, MIL-F-8785C and MIL-STD-1797 also suggest that the frequency,
ωdr, and damping ratio,
ζdr, of the lateral/directional oscillations following a yaw disturbance input shall exceed the following minimums in
Table 1 [
5,
6]. In comparison with the short-period, pilots can tolerate significantly lower frequencies and weaker damping in lateral/directional oscillations.
2.5. Lateral/Directional Control Coupling and Inertia Coupling
Lateral/directional control coupling occurs when commanded lateral rolling moments (
dCl/dδa) produce unintentional yawing moments (
dCn/dδa); this is an innate byproduct of aerodynamic control. Ideally, the unintentional yawing moment is of the same sign as the rolling moment: proverse yaw-due-to-aileron. In the unfavorable case, the yawing moment is of the opposite sign to the rolling moment: adverse yaw-due-to-aileron. If the innate static dihedral effect (
dCl/dβ < 0) is strong enough at the developed sideslip angle (
β > 0), it may overwhelm the commanded rolling moment and lead to an apparent “control reversal”. This dynamic mode is exceedingly difficult to arrest and is likely to lead to a loss of control of the vehicle [
7,
8,
20].
The onset of control-coupling may be predicted by the Lateral Control Departure Parameter,
LCDP:
If
LCDP < 0, roll command inputs are likely to lead to a spin [
7,
8,
20].
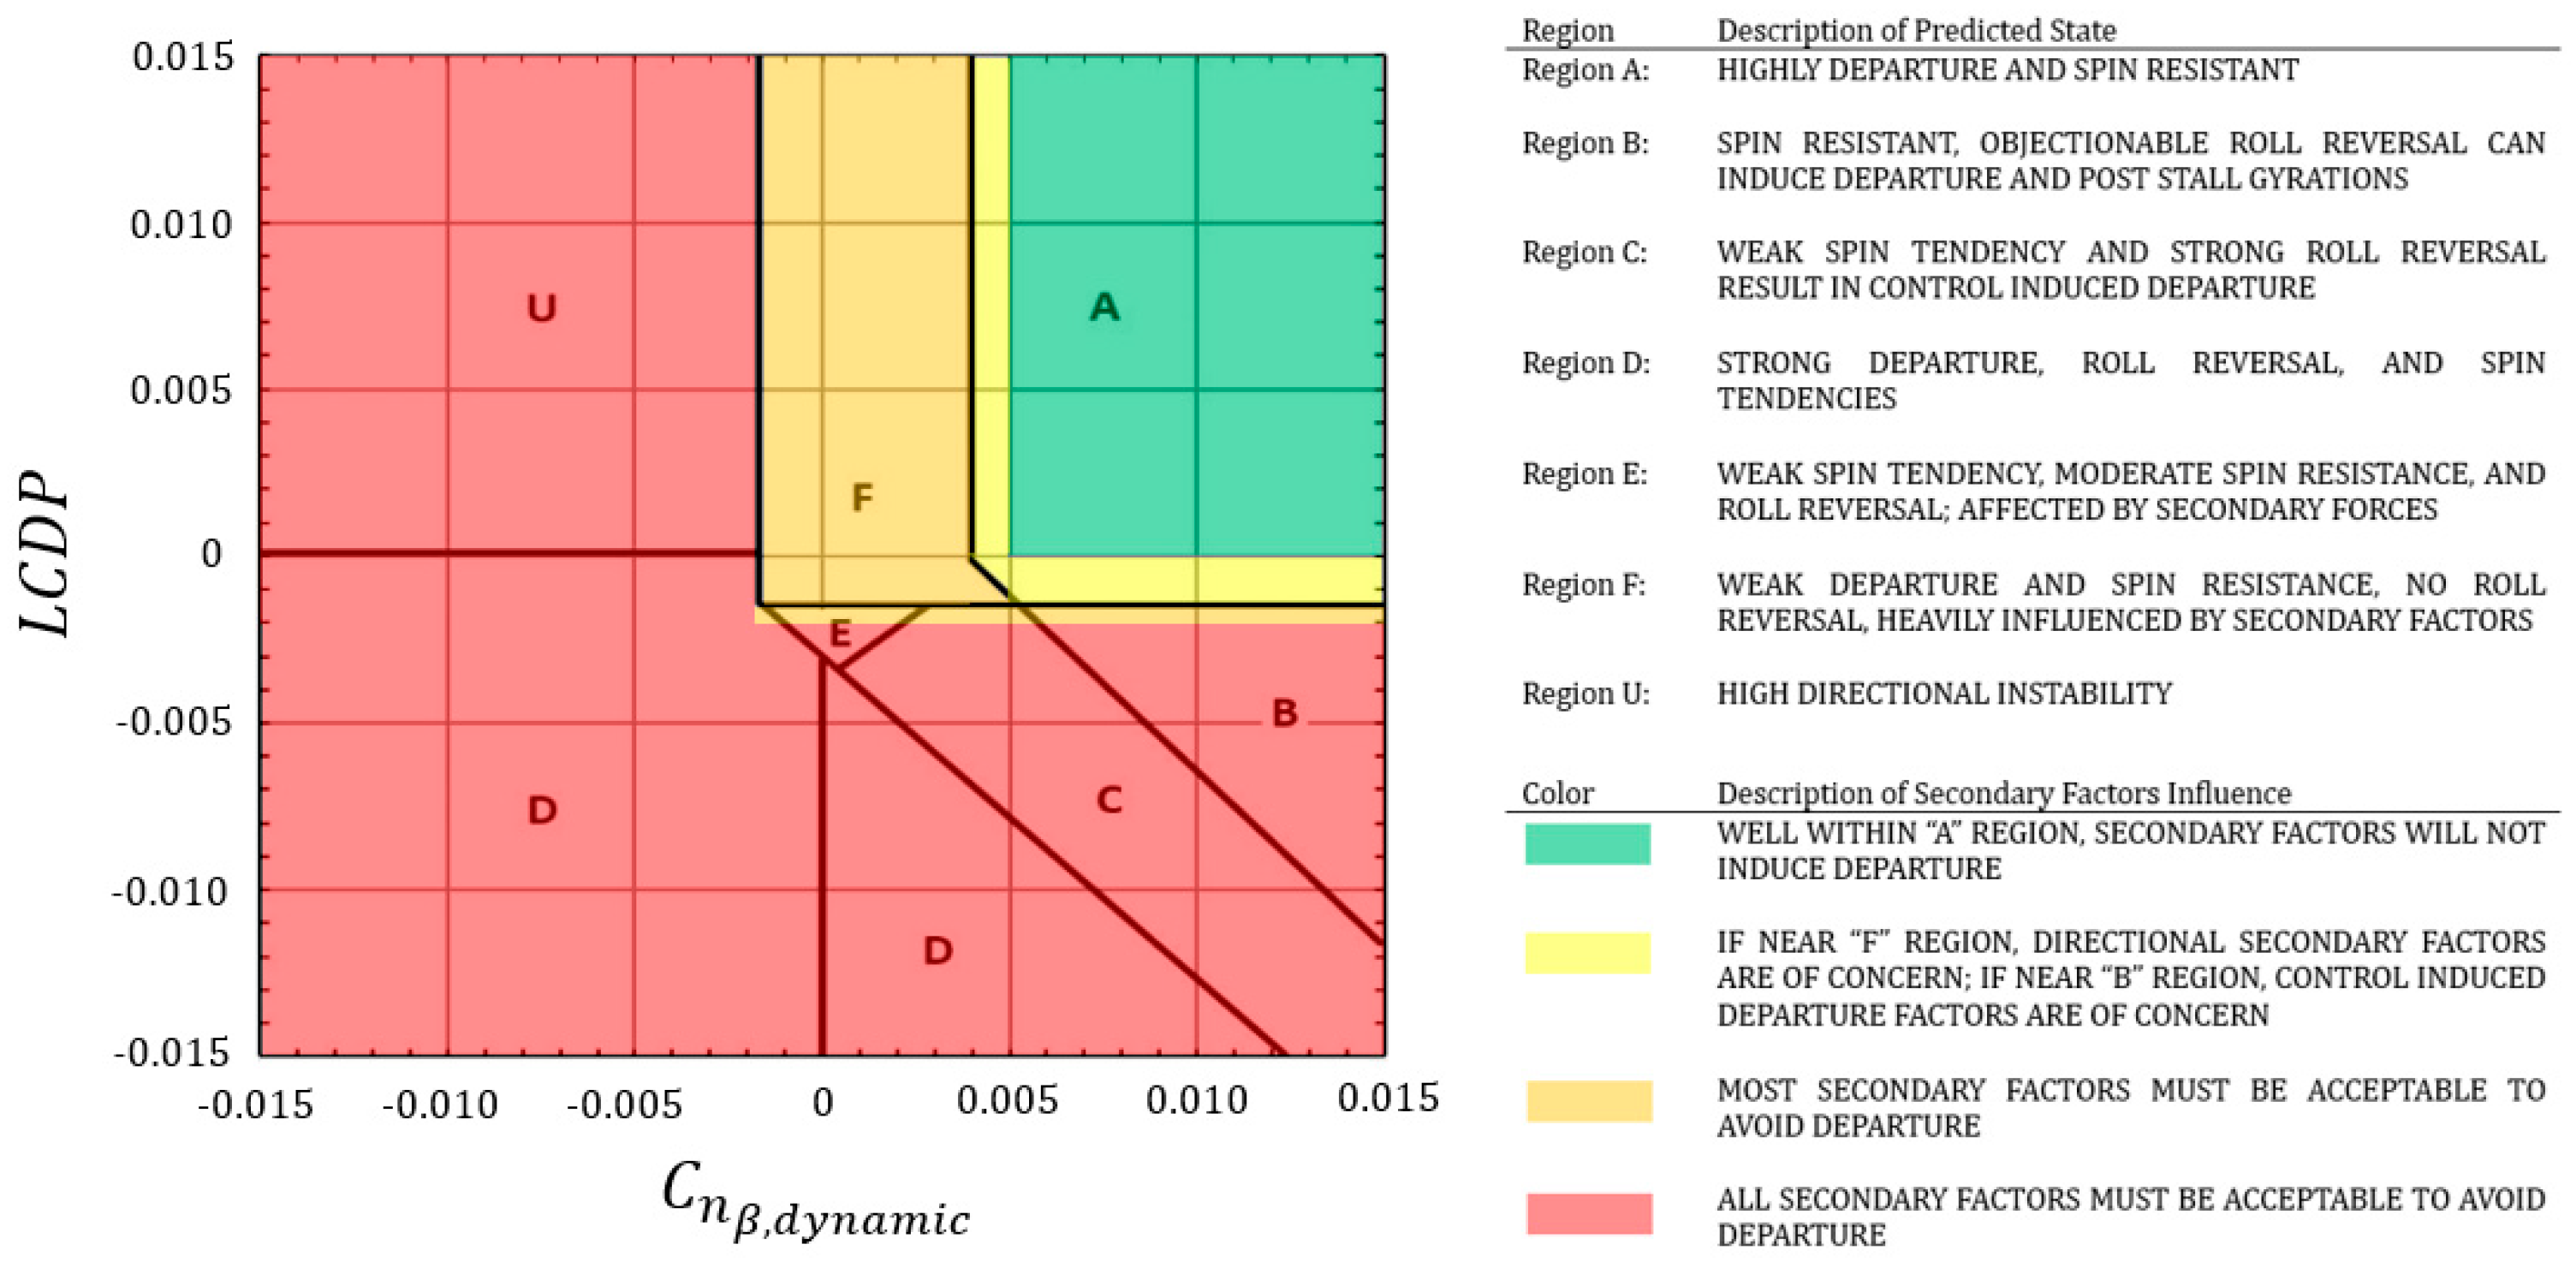
The Bihrle-Weissman criteria categorize lateral/directional departure resistance in terms of
and
LCDP [
7]. Takahashi, Griffin, & Grandhi [
8] present an evolved Bihrle-Weissman chart for high-speed aircraft following Skow’s criteria from AGARD CP-235 [
22]; see
Figure 3.
Prolonged flight in each category is expected to yield its description. Pilots desire departure and spin-resistance—operating in “Region A” that corresponds to Level 1 type behavior. Level 2 or Level 3 behavior is associated with flight in Region F, where the aircraft needs to be flown with additional care and attention. Operation in Regions “B”, “C”, “D”, “E,” or “U” will likely lead to loss of control.
Classical theory decouples the longitudinal (i.e., short-period and Phugoid) from the lateral/directional (i.e., Dutch Roll, roll, and spiral) modes [
17,
18]. In reality, energy can exchange between the longitudinal and lateral/directional rigid-body modes. When an airplane experiences lateral motion, some energy can bleed into longitudinal motions and vice versa. Philips [
23] identified the ratio
as the critical factor determining energy exchange between the short-period and Dutch Roll Modes. For the X-15, this value is ~0.93; it is highly prone to inertia coupling.
2.6. X-15 Adaptive Flight Control System (AFCS)
The early days of the X-15 program saw the vehicle controlled by a fixed-gain, basic feedback Stability Augmentation System (SAS). The third X-15 model introduced the more complex MH-96 Adaptive Flight Control System (AFCS). This system featured adaptive gains, with the yaw rate gyroscope controlling both the vertical stabilizer surface as well as differential elevon deflections. Favored by pilots, the MH-96 seemingly improved flying qualities, especially in the exoatmospheric flight phase [
21,
24]. The AFCS featured adaptive gains that would slowly increase until it reached a defined maximum gain or observed incipient limit-cycle oscillations [
24]. The maximum permissible gains were a function of frequency. In addition, the system would augment aerodynamic control with reaction control system jets as the gains peaked.
This system, engineered to operate at the cusp of dynamic instability, functionally employed much greater feedback than was available under the earlier pilot-selectable fixed-gain SAS. The MH-96 aggressively deflected the control surfaces in response to rigid-body motions and would often rate-limit and produce limit-cycle oscillations in flight [
13,
21,
24,
25].
The MH-96 AFCS synthesized damping as a function of basic pitch (
q), yaw (
r), and roll (
p) rates—a pure proportional controller with zero integral or derivative feedback [
3]. This renders the X-15 especially amenable to McRuer’s “equivalent stability derivative” analytical approach [
4]. The control system featured autopilot “hold modes” for the pilot to engage to decrease the workload:
α, θ, ϕ, and
ψ to hold the angle of attack, flight path angle, bank angle, and/or heading angle, respectively. Neil Armstrong utilized these on Flight 3-4-8 [
2,
21]. Each control surface actuator mode is fed a singular or multiple channel(s) of control gains which we define as
K in Equations (26)–(28) below.
where
KYAR for the yaw damper is a channel of aileron–rudder interconnect gains to correct for sideslip when rolling [
3,
25].
and
Cmq,
Cnr, and
Clp are the bare-airframe aerodynamic damping derivatives. Notice that not all of the gain/control surface derivative terms have the same sign, a byproduct of convention. We estimate each of these gain values for a given rigid-body frequency by reverse-engineering the MH-96 AFCS. The maximum gain values that the controller was allowed to reach were found from Reference [
3]. While this study only considers aerodynamic control, the X-15 also featured a mono-propellant reaction control jet system comprising a total of twelve thrusters, eight of which are used for pitch and yaw, and four for roll [
25]; these were used with ”bang-bang” control logic for operation at extremely low dynamic pressure [
25].
3. Methods to Estimate Flight Conditions Which Lead to a Loss of Controllability
The preserved record of X-15 wind tunnel data is both inconsistent, due to evolving developmental configurations, and often incomplete due to limited sideslip data [
26]. This available data proved insufficient to provide a complete analysis using either the above-mentioned screening parameters or to populate a time-step-integrating 6-DOF simulation. To alternatively capture stability and control insight from Neil Armstrong’s flight in the X-15, we analyzed its underlying aerodynamic characteristics, kinematic performance, and dynamic behavior. See
Table 2 (overleaf) for our estimate of Armstrong’s “as flown” X-15 geometry. As the surviving wind tunnel data is incomplete and inconsistent, our aerodynamic analysis database relies upon a “cocktail” of empirical and computational methods. We determined that the large, lower ventral fin was in place and actuated as a rudder in tandem with the dorsal fin [
1]. We also use a “supersonic sandwich panel” model to represent the dual-windward facing surfaces of the wedge tails.
Our simulation database uses VORLAX to develop both primary static forces and moments as well as dynamic derivatives [
11,
12]. Because VORLAX is an inviscid code, we empirically adjust zero-lift-drag to match the flight test data [
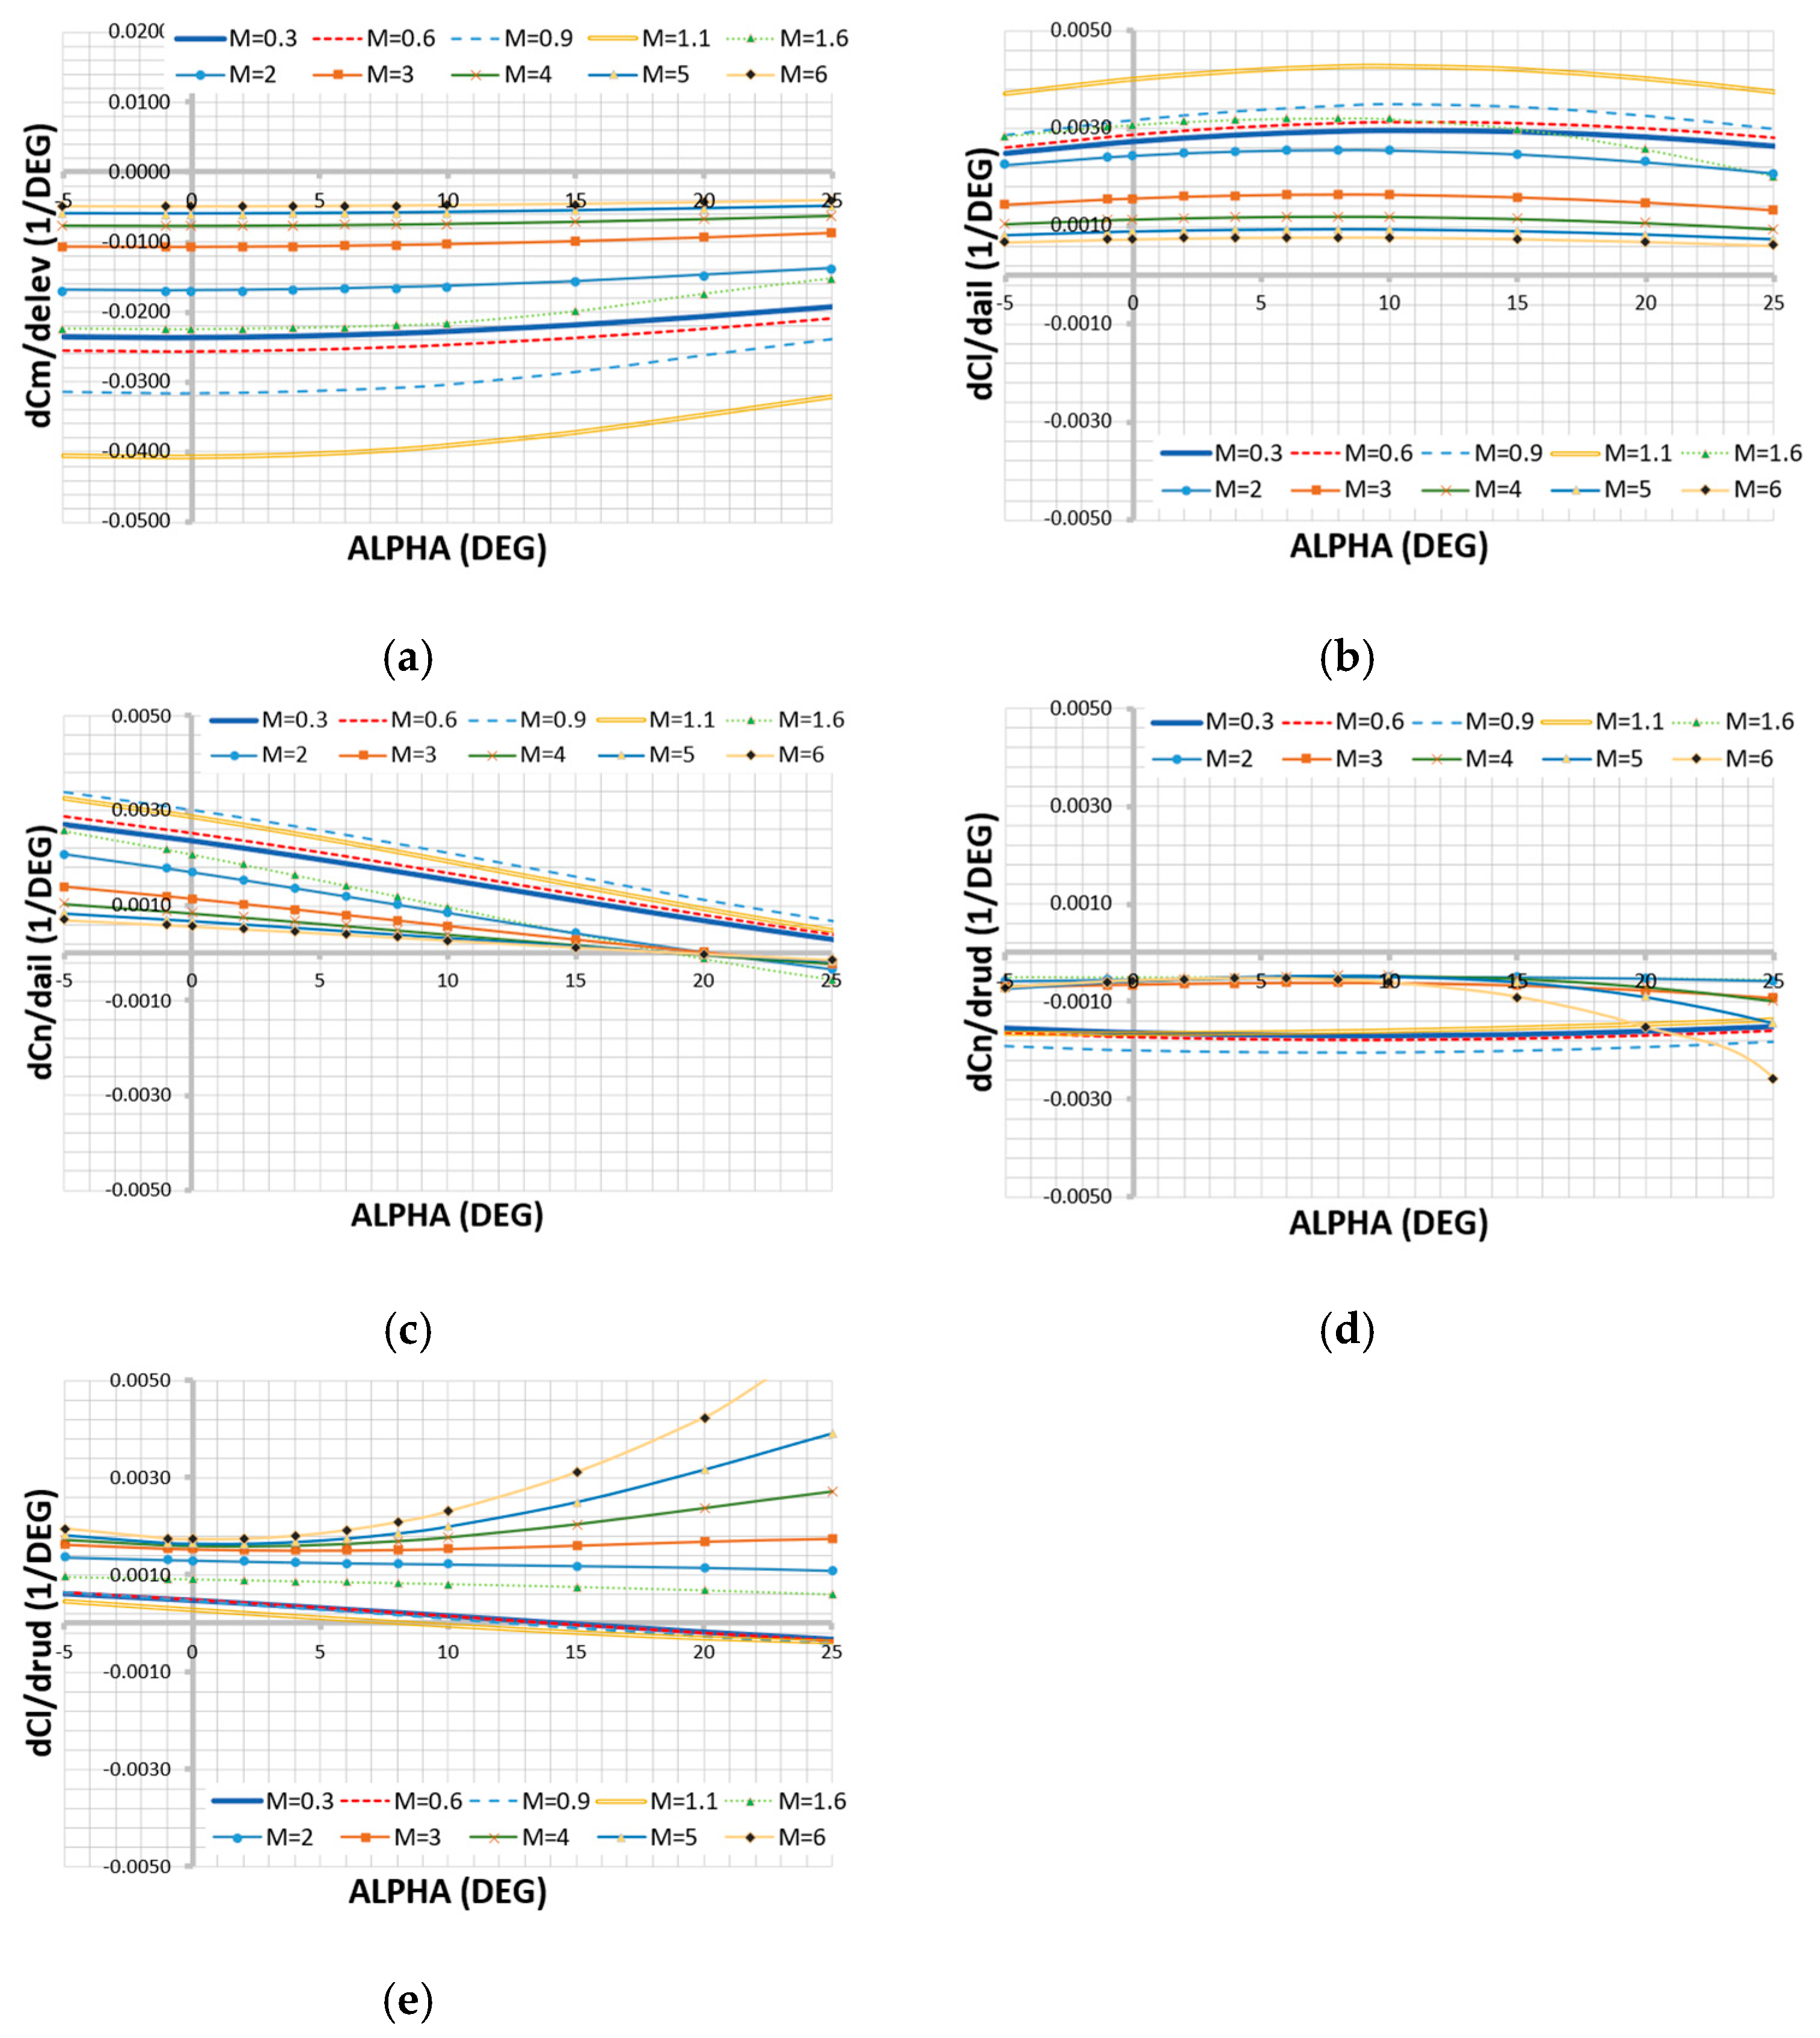
27]. We also plot the estimated control power of the X-15’s movable surfaces; see
Figure 4.
As stated in
Section 2, the unintended consequences of deflecting a control surface can be motion about a separate axis. For the X-15 model tested, both cross-control derivatives
dCn/dδa and
dCl/dδr produce adverse motions at moderate-to-high angles of attack for various Mach numbers; see
Figure 4c,e. In response to this, the X-15 mission planners avoided scheduled flights in regions with predicted adverse control. A NASA report from the program notes that “at a Mach number of approximately 3.0 and an angle of attack greater than 10°, the airplane was uncontrollable without damping augmentation… caused by an unfavorable combination of the yawing moment due to aileron deflection” (
dCn/da) [
21].
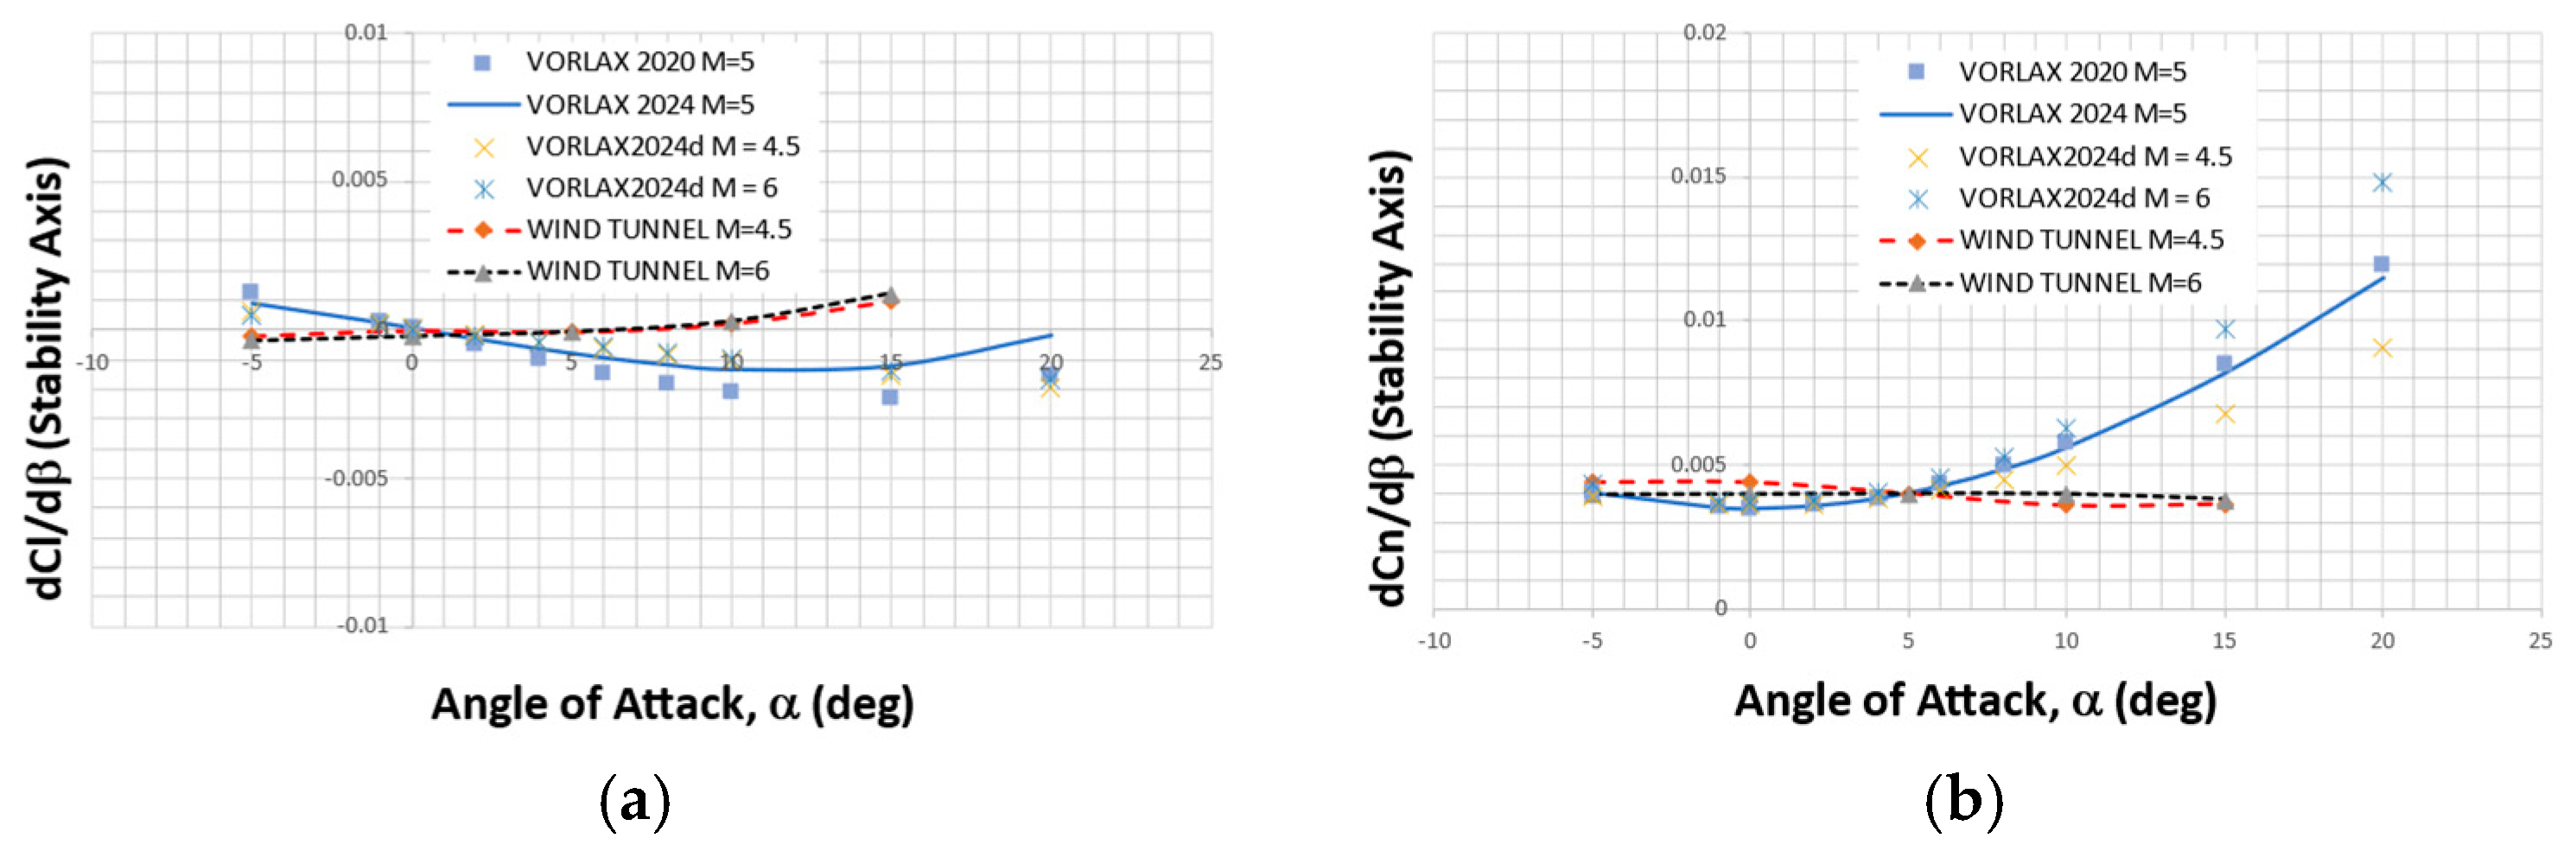
To better validate the accuracy of VORLAX, we compare the panel method results to the currently available X-15 NASA wind tunnel data; see
Figure 5 [
8,
13]. We show the comparison at the highest speeds we expect to simulate. At low angles of attack, VORLAX and the wind tunnel agree for both lateral and directional stability. At high angles of attack, VORLAX may slightly overpredict the directional stability effectiveness of both the dorsal and ventral side vertical tails working to stabilize the vehicle. At high angles of attack, the dorsal tail is expected to be shadowed from the flow path by the fuselage; VORLAX may not necessarily capture this effect. However, VORLAX clearly calculates the loss of rolling moment stability once the force produced by the ventral tail overcomes the dorsal side (
dCl/dβ) becomes positive at high α in
Figure 4. This was possible after a correction term in VORLAX was decreased to more accurately calculate the dihedral effect under all flight conditions.
4. Results from Flight Envelope Analysis of Quasi-Static Screening Parameters
We may screen flying qualities for any configuration using either a “point-performance” or a “mission-performance” perspective. Point-performance “Skymaps” present screening metrics as a function of speed and altitude for a given set of mass properties and load factor; this permits us to analyze high-speed aircraft stability and control from a full-flight-envelope perspective using the screening criteria of MIL-STD-1797 and MIL-F-8785C.
In this section, we first demonstrate the basic trimmable 1-gee flyable envelope of the X-15 during atmospheric reentry conditions on Armstrong’s flight. We then highlight what we consider to be the three most important “dynamic behavior” parameters as a function of speed and altitude: (1) the unaugmented bare-airframe Dutch Roll damping, (2) the propensity for energy exchange between the Dutch Roll and short-period modes, (3) its spin-resistance as predicted by the Bihrle-Weissman criteria.
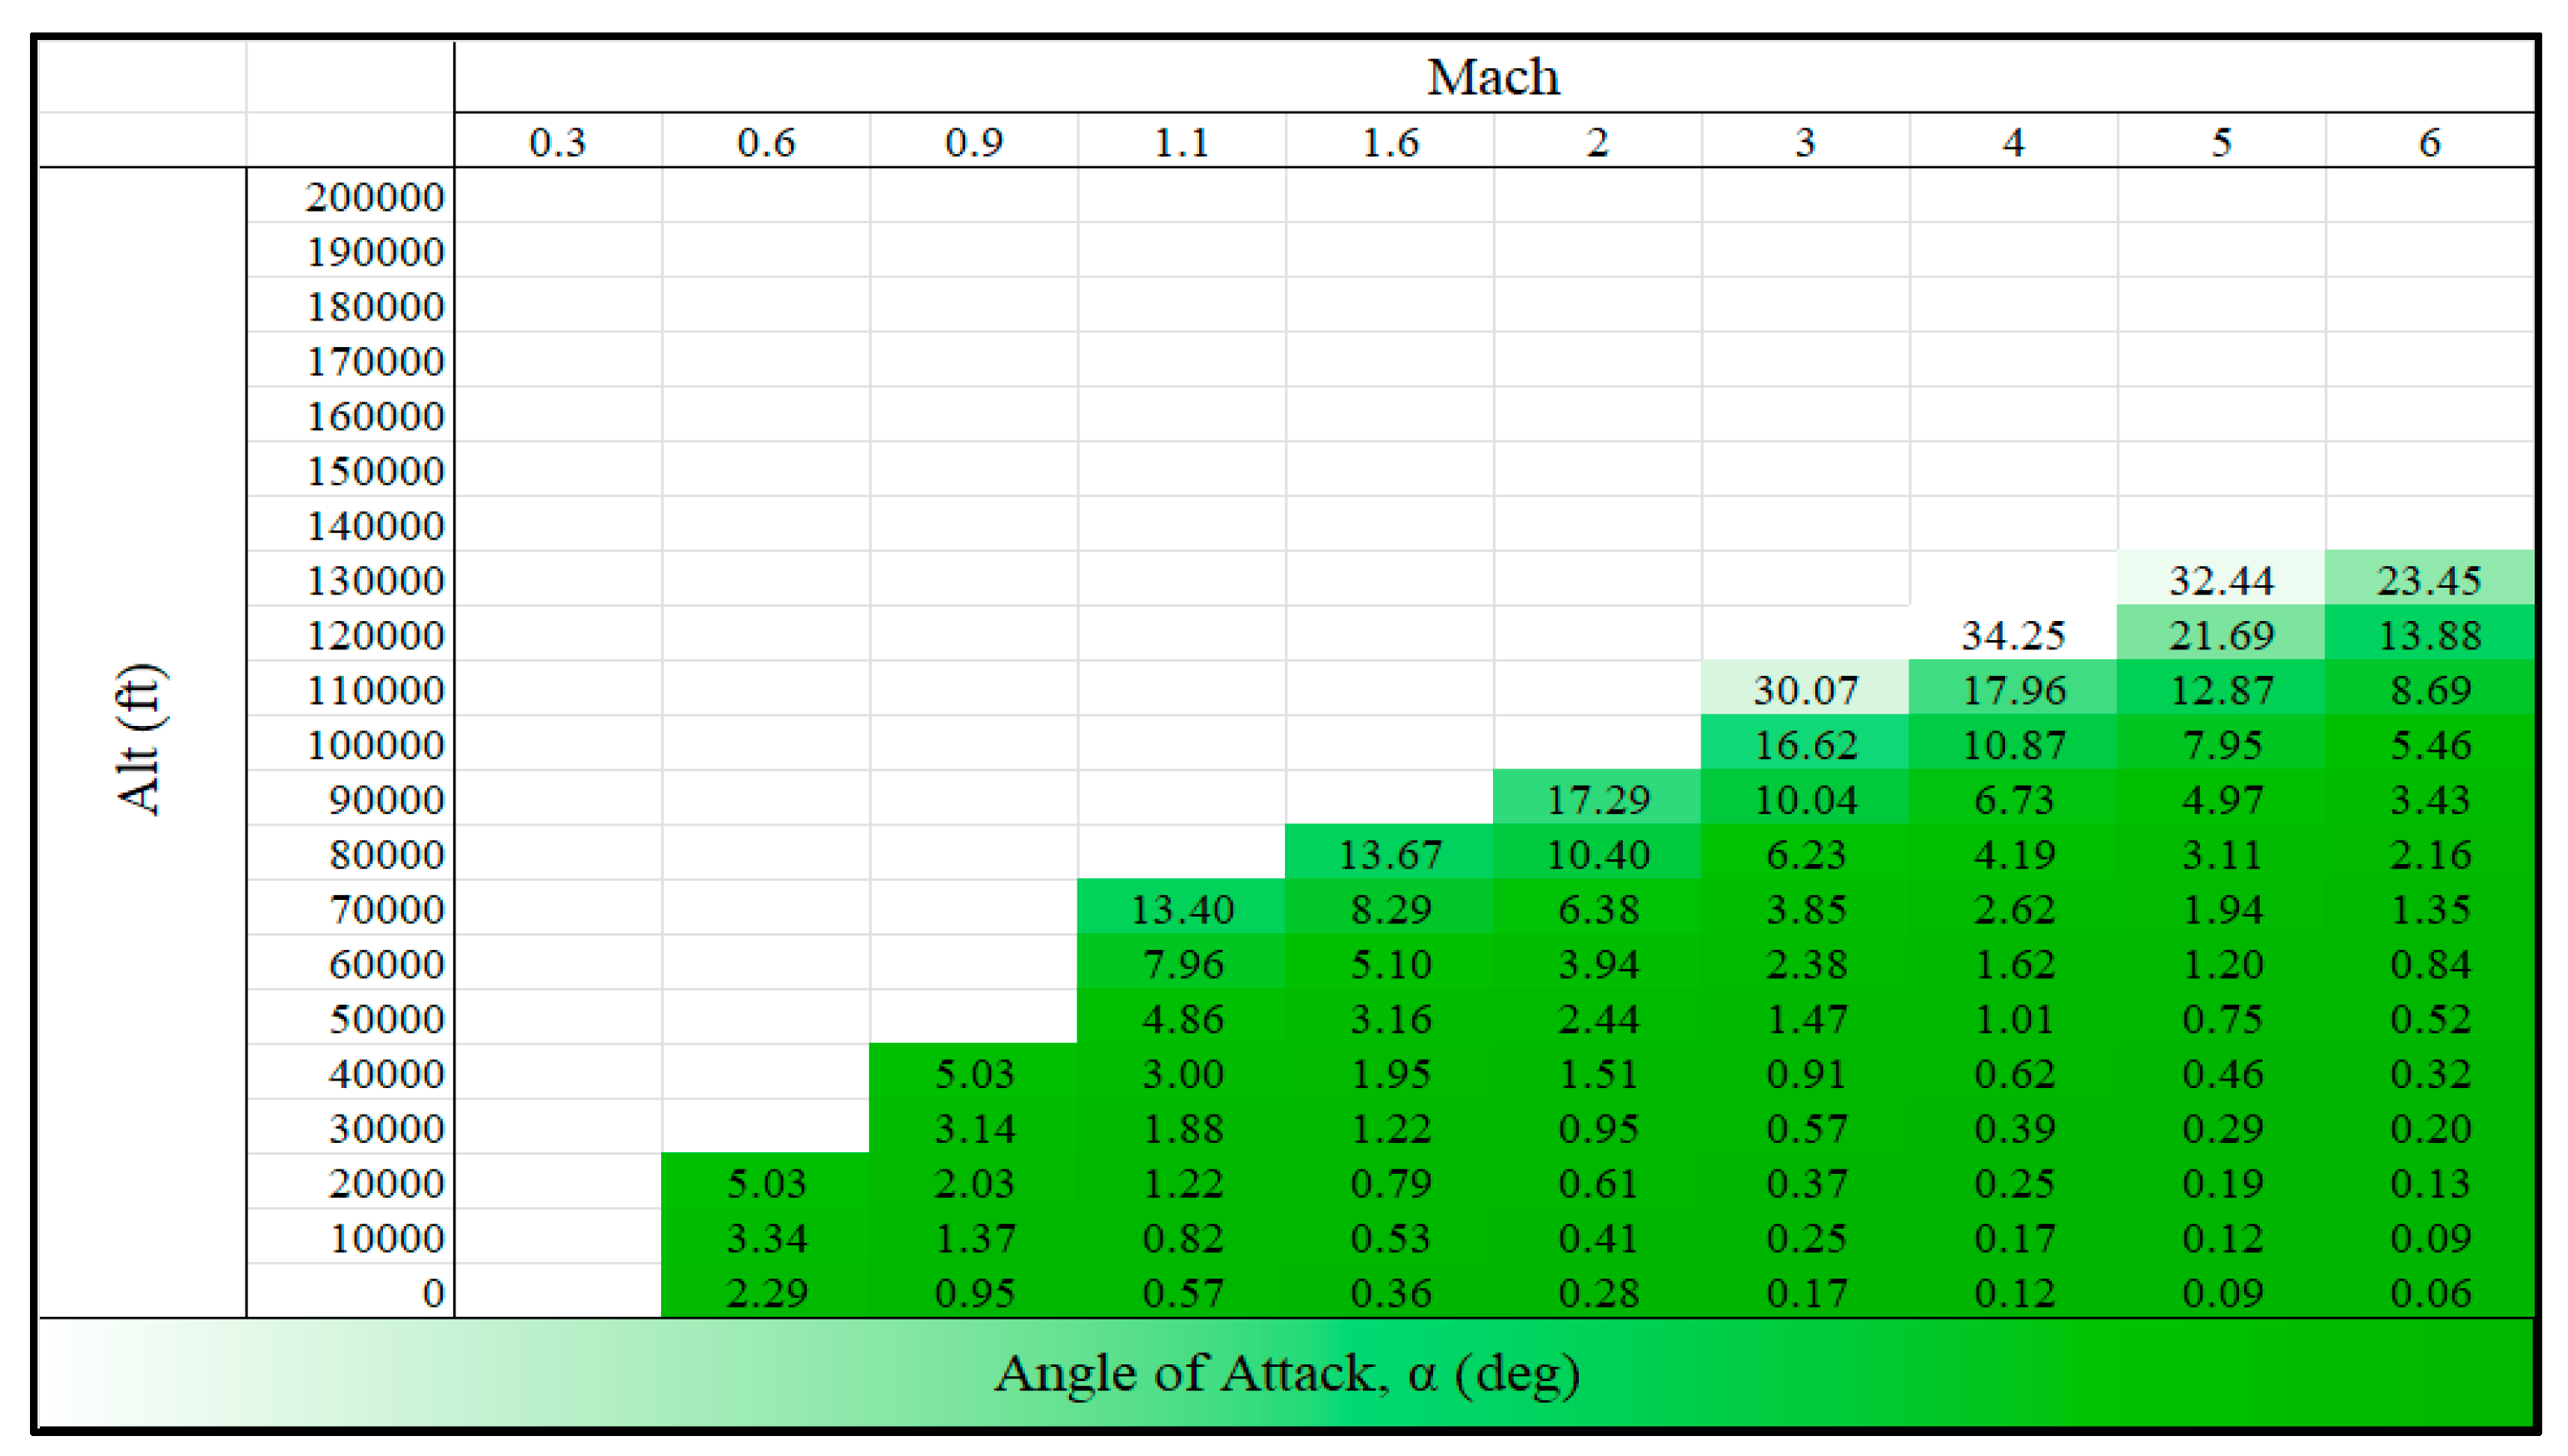
Consider first the
nZ = 1 flyable envelope of the X-15 after complete fuel exhaustion (W = 14,000 lbm) as a function of speed and altitude; see
Figure 6. Here, we see that the X-15 is unable to maintain level gliding flight above 130,000 ft within its trimmable angle-of-attack capability at the highest speeds it flew at. As Neil Armstrong skipped off of the atmosphere at around 90,000 ft altitude and Mach 3, the “Skymap” data near this flight condition is of interest [
2,
3]. In terms of controllability criteria, the damping ratios in both the short-period and Dutch Roll Modes tend to weaken with high-altitude, low-dynamic-pressure flight phases compared to what they would be at sea level. This causes diminished control and warrants synthetic damping and reaction controls under these flight conditions.
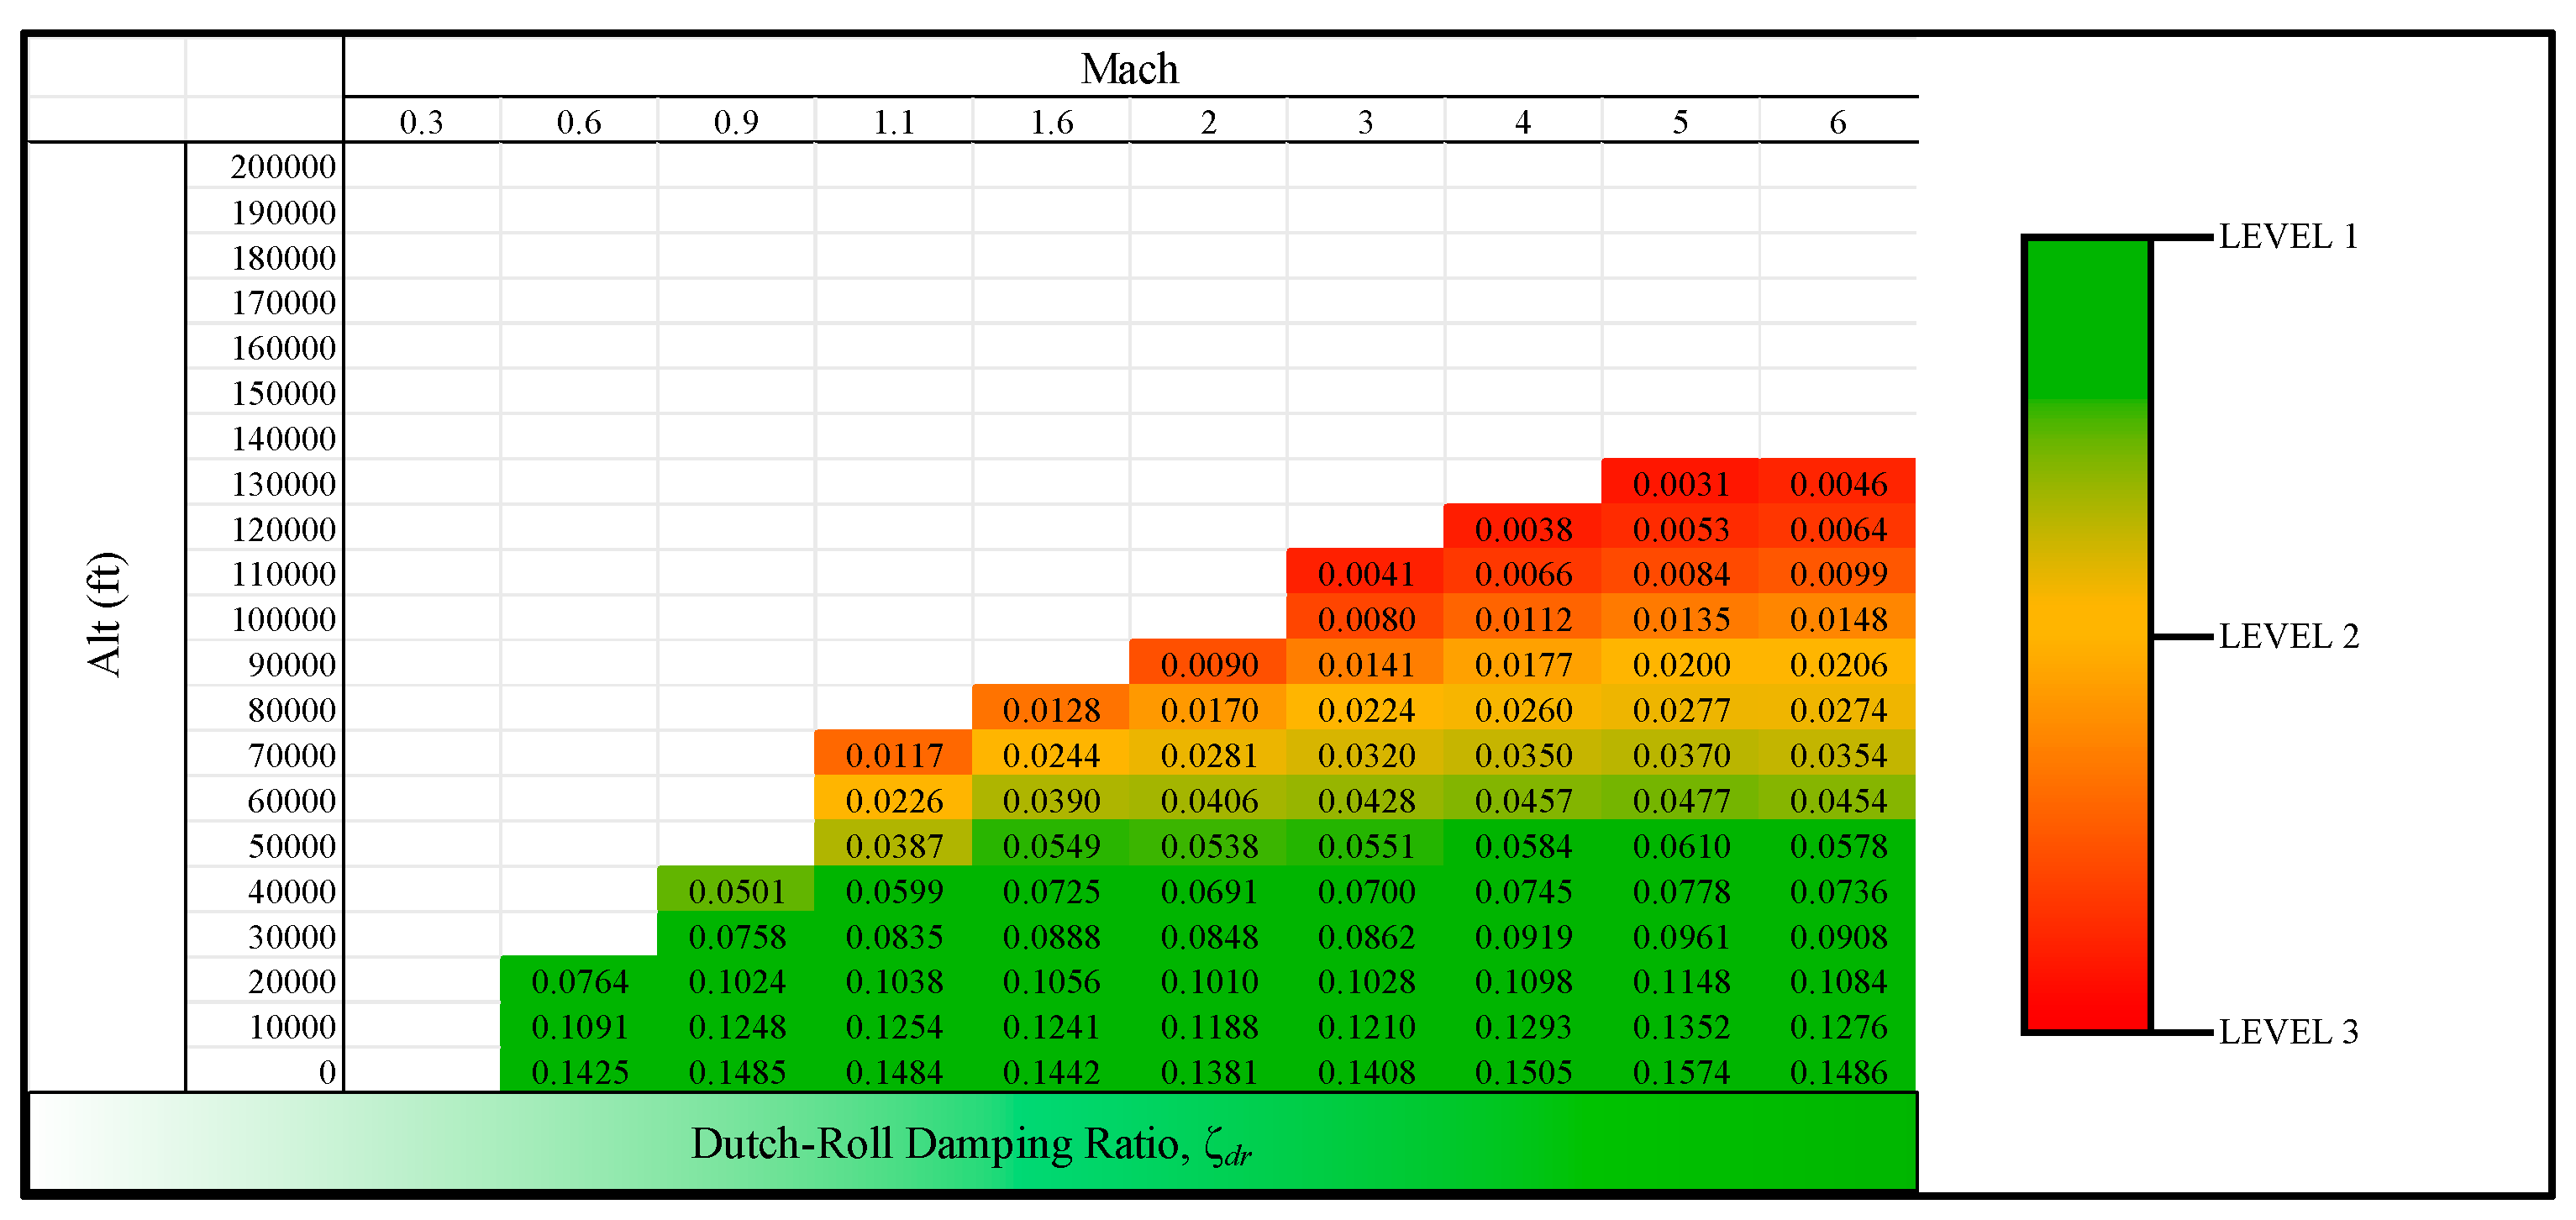
The “Skymap” for Dutch Roll damping predicts unfavorable damping near the top of the flight envelope; see
Figure 7. As the “Skymap” data is calculated as unaugmented with open-loop controls, the X-15 in flight required most of its damping from its synthetic, closed-loop controller and reaction control system [
21,
25]. At high altitudes in the flight envelope,
ζDR < 0.1, essentially undamped; contrast this with pilots who prefer subjective “deadbeat” damping,
ζDR > 0.5 [
21]. As for the aircraft natural frequencies, low damping combined with a cross-coupled short-period and Dutch Roll Mode can likely lead to uncontrollability.
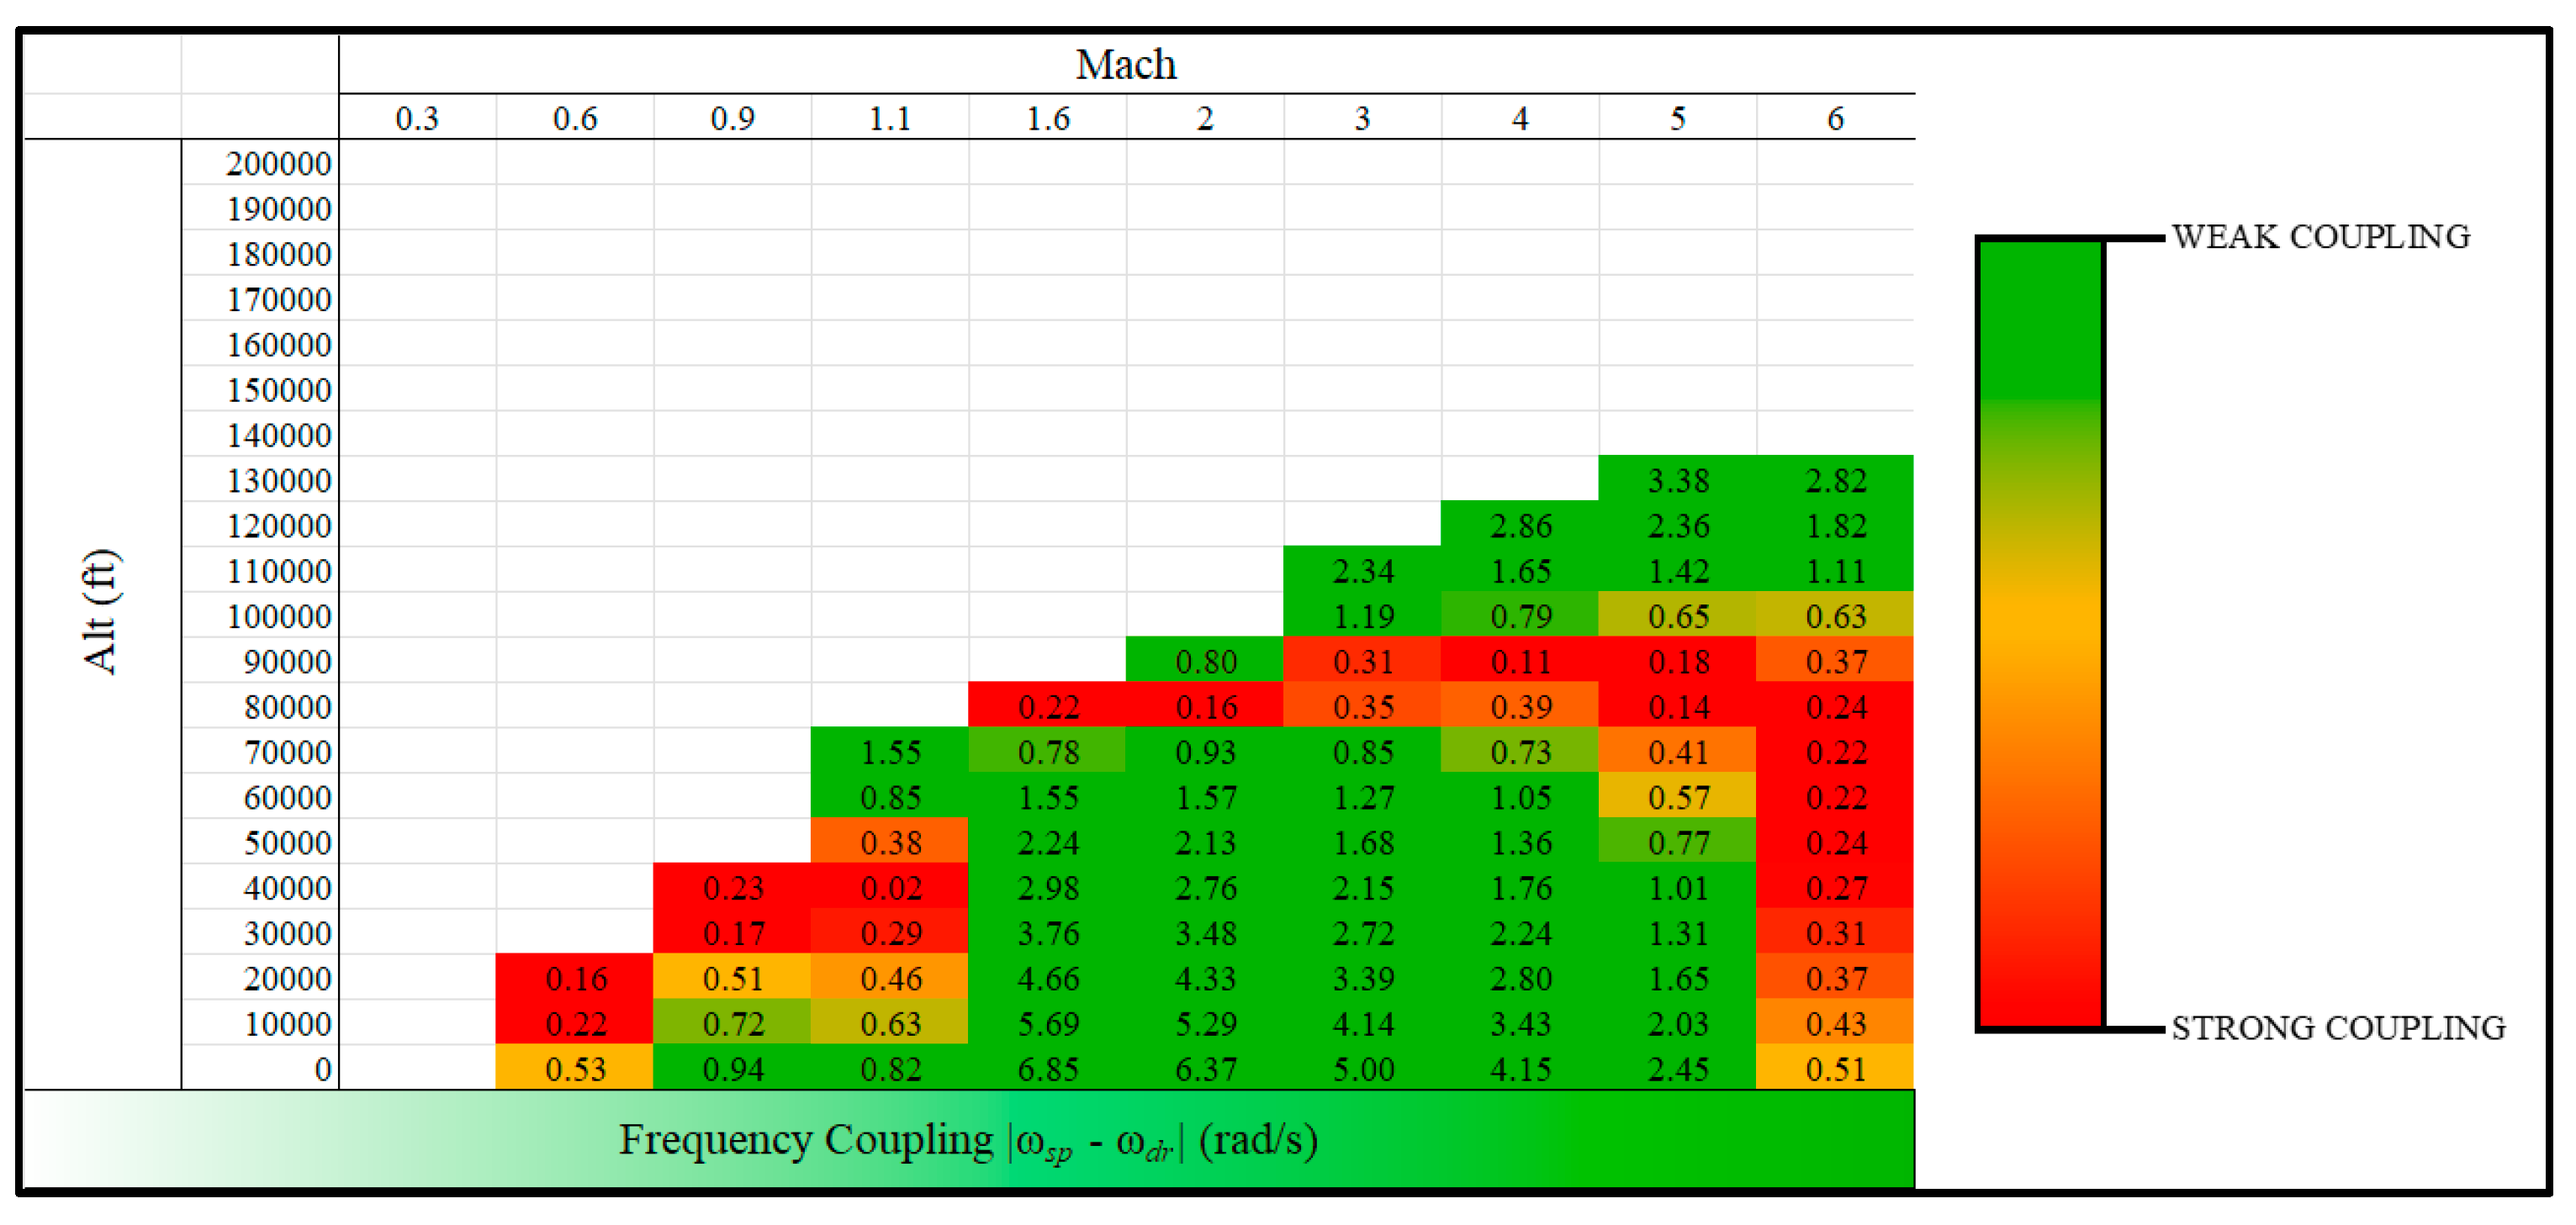
The interference of short-period and Dutch Roll frequencies is apparent throughout the flight envelope; see
Figure 8. Although MIL-STDs do not show robust evidence of assessing cross-coupling metrics, Day [
20] voices his concerns about high-speed frequency and inertia coupling. Prolonged cross-coupled flight would have a much more negative impact on an aircraft’s flying qualities compared to passing through a coupling barrier. There is a mix of weak and strong coupling in the corresponding reentry points, and Neil Armstrong may have encountered a cross-coupling scenario during his rise in altitude. The magnitudes of the individual frequencies themselves may also result in extreme pilot workload, as the investigation that follows will show.
In
Figure 9, we compute
and
LCDP and apply the Bihrle-Weissman Criteria (refer back to
Figure 2). We find that the X-15 had “borderline spin-susceptibility only at low altitudes;” far outside of its scheduled high-speed flight envelope. If we consider Mach 5 and 70,000 ft, this flight condition corresponds to a dynamic pressure of ~1640 lb/ft
2 which is nearing the vehicle’s reentry heating and structural limitations [
28]. The maximum planned reentry dynamic pressure on Armstrong’s flight was ~530 lb/ft
2 for comparison [
2]. From a preliminary analysis, “Skymaps” predict the overall flight trajectory to have yielded spin-resistance with no roll reversal issues.
5. Discussion—Quasi-Static Screening Parameters Applied to Armstrong’s Actual Mission Trajectory
We may also screen flying qualities for any configuration using a “mission-performance” perspective. Here, we time-step integrate a trajectory using a point-mass kinematic model while simultaneously tracking the relevant stability and control screening parameters. This provides a complementary viewpoint to assess flying qualities across “real” missions, since we compute stability and control parameters as a function of time and must schedule a possible trajectory given performance constraints from the aerodynamic database.
We analyze Flight 3-4-8 in this work, which Neil Armstrong piloted on 20 April 1962, flying in the third X-15 model (serial number 66672) [
1,
2,
3,
13]. It was flown with the ventral tail on (refer back to
Figure 5) and equipped with the unique ball-nose sensor to read altitude, airspeed, and attitude to Pilot Armstrong. An archive of the mission plan and post-flight commentary has been preserved by Raveling [
2]. Our basic kinematic simulation reasonably reflects the “as-flown” mission and incorporates the necessary flight phases for the flying quality analysis of an X-15 mission.
5.1. Basic Kinematic Trajectory
As this work focuses on applying a novel stability and control framework to high-speed vehicles to test their design conformance to modern flying qualities requirements, the time-step integration mission approach allows for this work’s main research question to be answered: How severe are hypersonic trajectories to a modern aircraft’s ability to maintain control? This mission approach was validated against the mission plan that Neil Armstrong aimed to adhere to; see
Figure 10.
Our simulation predicts a significant atmospheric bounce after Armstrong is instructed to hold a constant altitude, 4-gee pullup [
2,
10]. Similar to the open-loop data shown by Sagliano et al. [
29] for their SHEFEX-3 trajectory plan, our altitude and speed plots lead to an abrupt zero-gee to four-gee atmospheric skip.
Our simulation of Mach number shows a strong resemblance to the flight request and our simulation of altitude is within the instrument error boundaries shown as bars in
Figure 10 [
2,
13,
30,
31]. Our altitude and Mach representations of the flight are functions only of the panel model geometry and the mission code. In the mission code, we constructed this flight in terms of starting altitude, engine thrust setting, angle of attack/flight path angle, and speed/altitude “STOP” criteria. These criteria guide the precise calculations for Mach and altitude.
5.2. Longitudinal, Lateral, and Directional Dynamic Response
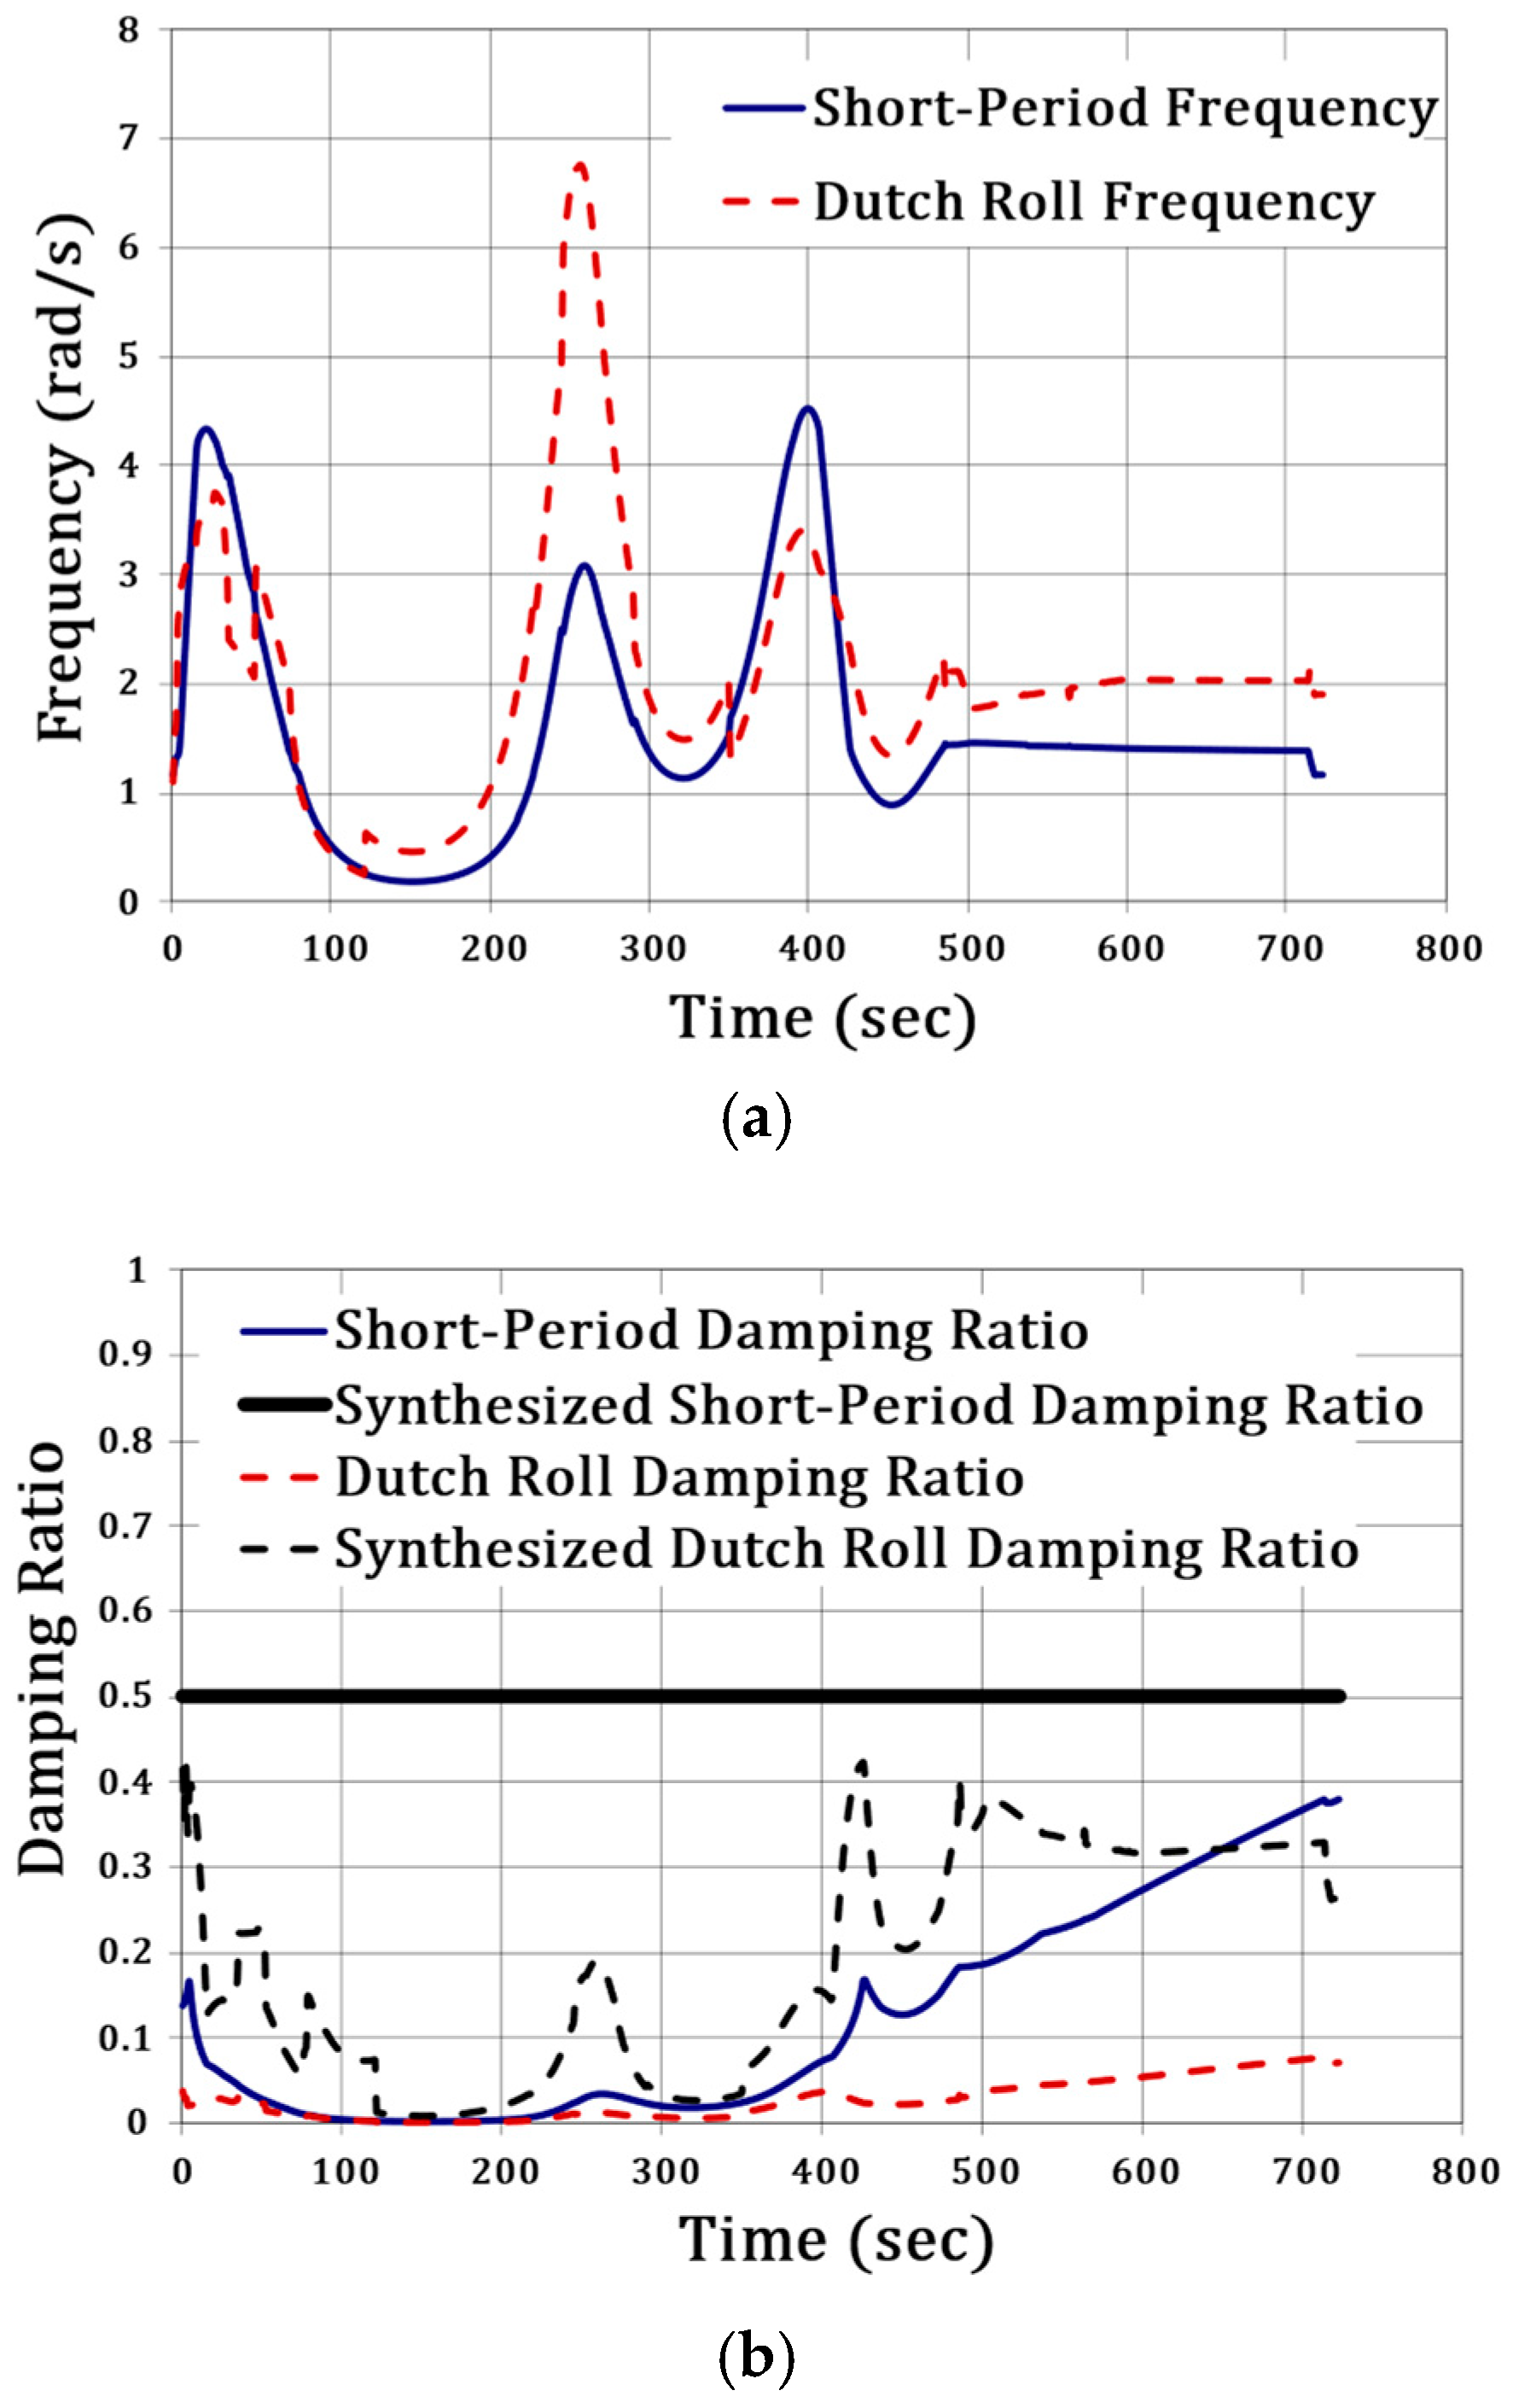
We begin our stability and controllability methodology by estimating stick-fixed rigid-body frequencies, as well as stick-fixed and augmented damping ratios; see
Figure 11, overleaf. Simulated short-period and Dutch Roll frequencies overlap with each other for the first 100 s of the mission; refer to
Figure 11a. This agrees with the frequency coupling “Skymap” and causes of difficult controllability due to the gee-loading and frequency overlap as the X-15 climbed in excess of 1000 ft/s during this phase. The rigid-body frequencies rise from their respective minimums (beyond the lower bounds of the CAP chart for ω
sp) until peaking just as Armstrong skips off of the atmosphere at ~260 s after launch. The Dutch Roll frequency peaks above 6 rad/s (~1-Hz). As demonstrated by Berger et al. [
32], high frequencies (near 10 rad/s and above) are associated with considerable phase lag, which Armstrong would also have experienced; this negatively impacts pilot/controller workload. The equivalent low-order system (ELOS) phase response of even second-order dominated modes can easily exceed 180
o in the presence of group delays. Note that the X-15 flight control team highlighted that the controller would be the most stressed—potentially overstressed with tendencies to self-excite oscillations—on reentry [
19]. Beginning at t = ~350 s, our predicted short-period and Dutch Roll frequencies overlap with each other for an extended period of time; we believe this portion of the flight will display marked inertia-coupling.
Figure 11b highlights where weak open-loop longitudinal and Dutch Roll damping exist; they are both unfavorable across the critical mission phases. Closed-loop longitudinal damping with synthetic
ζsp~0.5 can be attained with reasonable gains; thus, the X-15 presents the pilot with favorable longitudinal control. However, synthetic Dutch Roll damping cannot be held to be favorable even when the yaw controller operates at maximum gains for the entire flight; thus, we believe that Dutch Roll damping is an issue for the X-15 on any high-altitude flight.
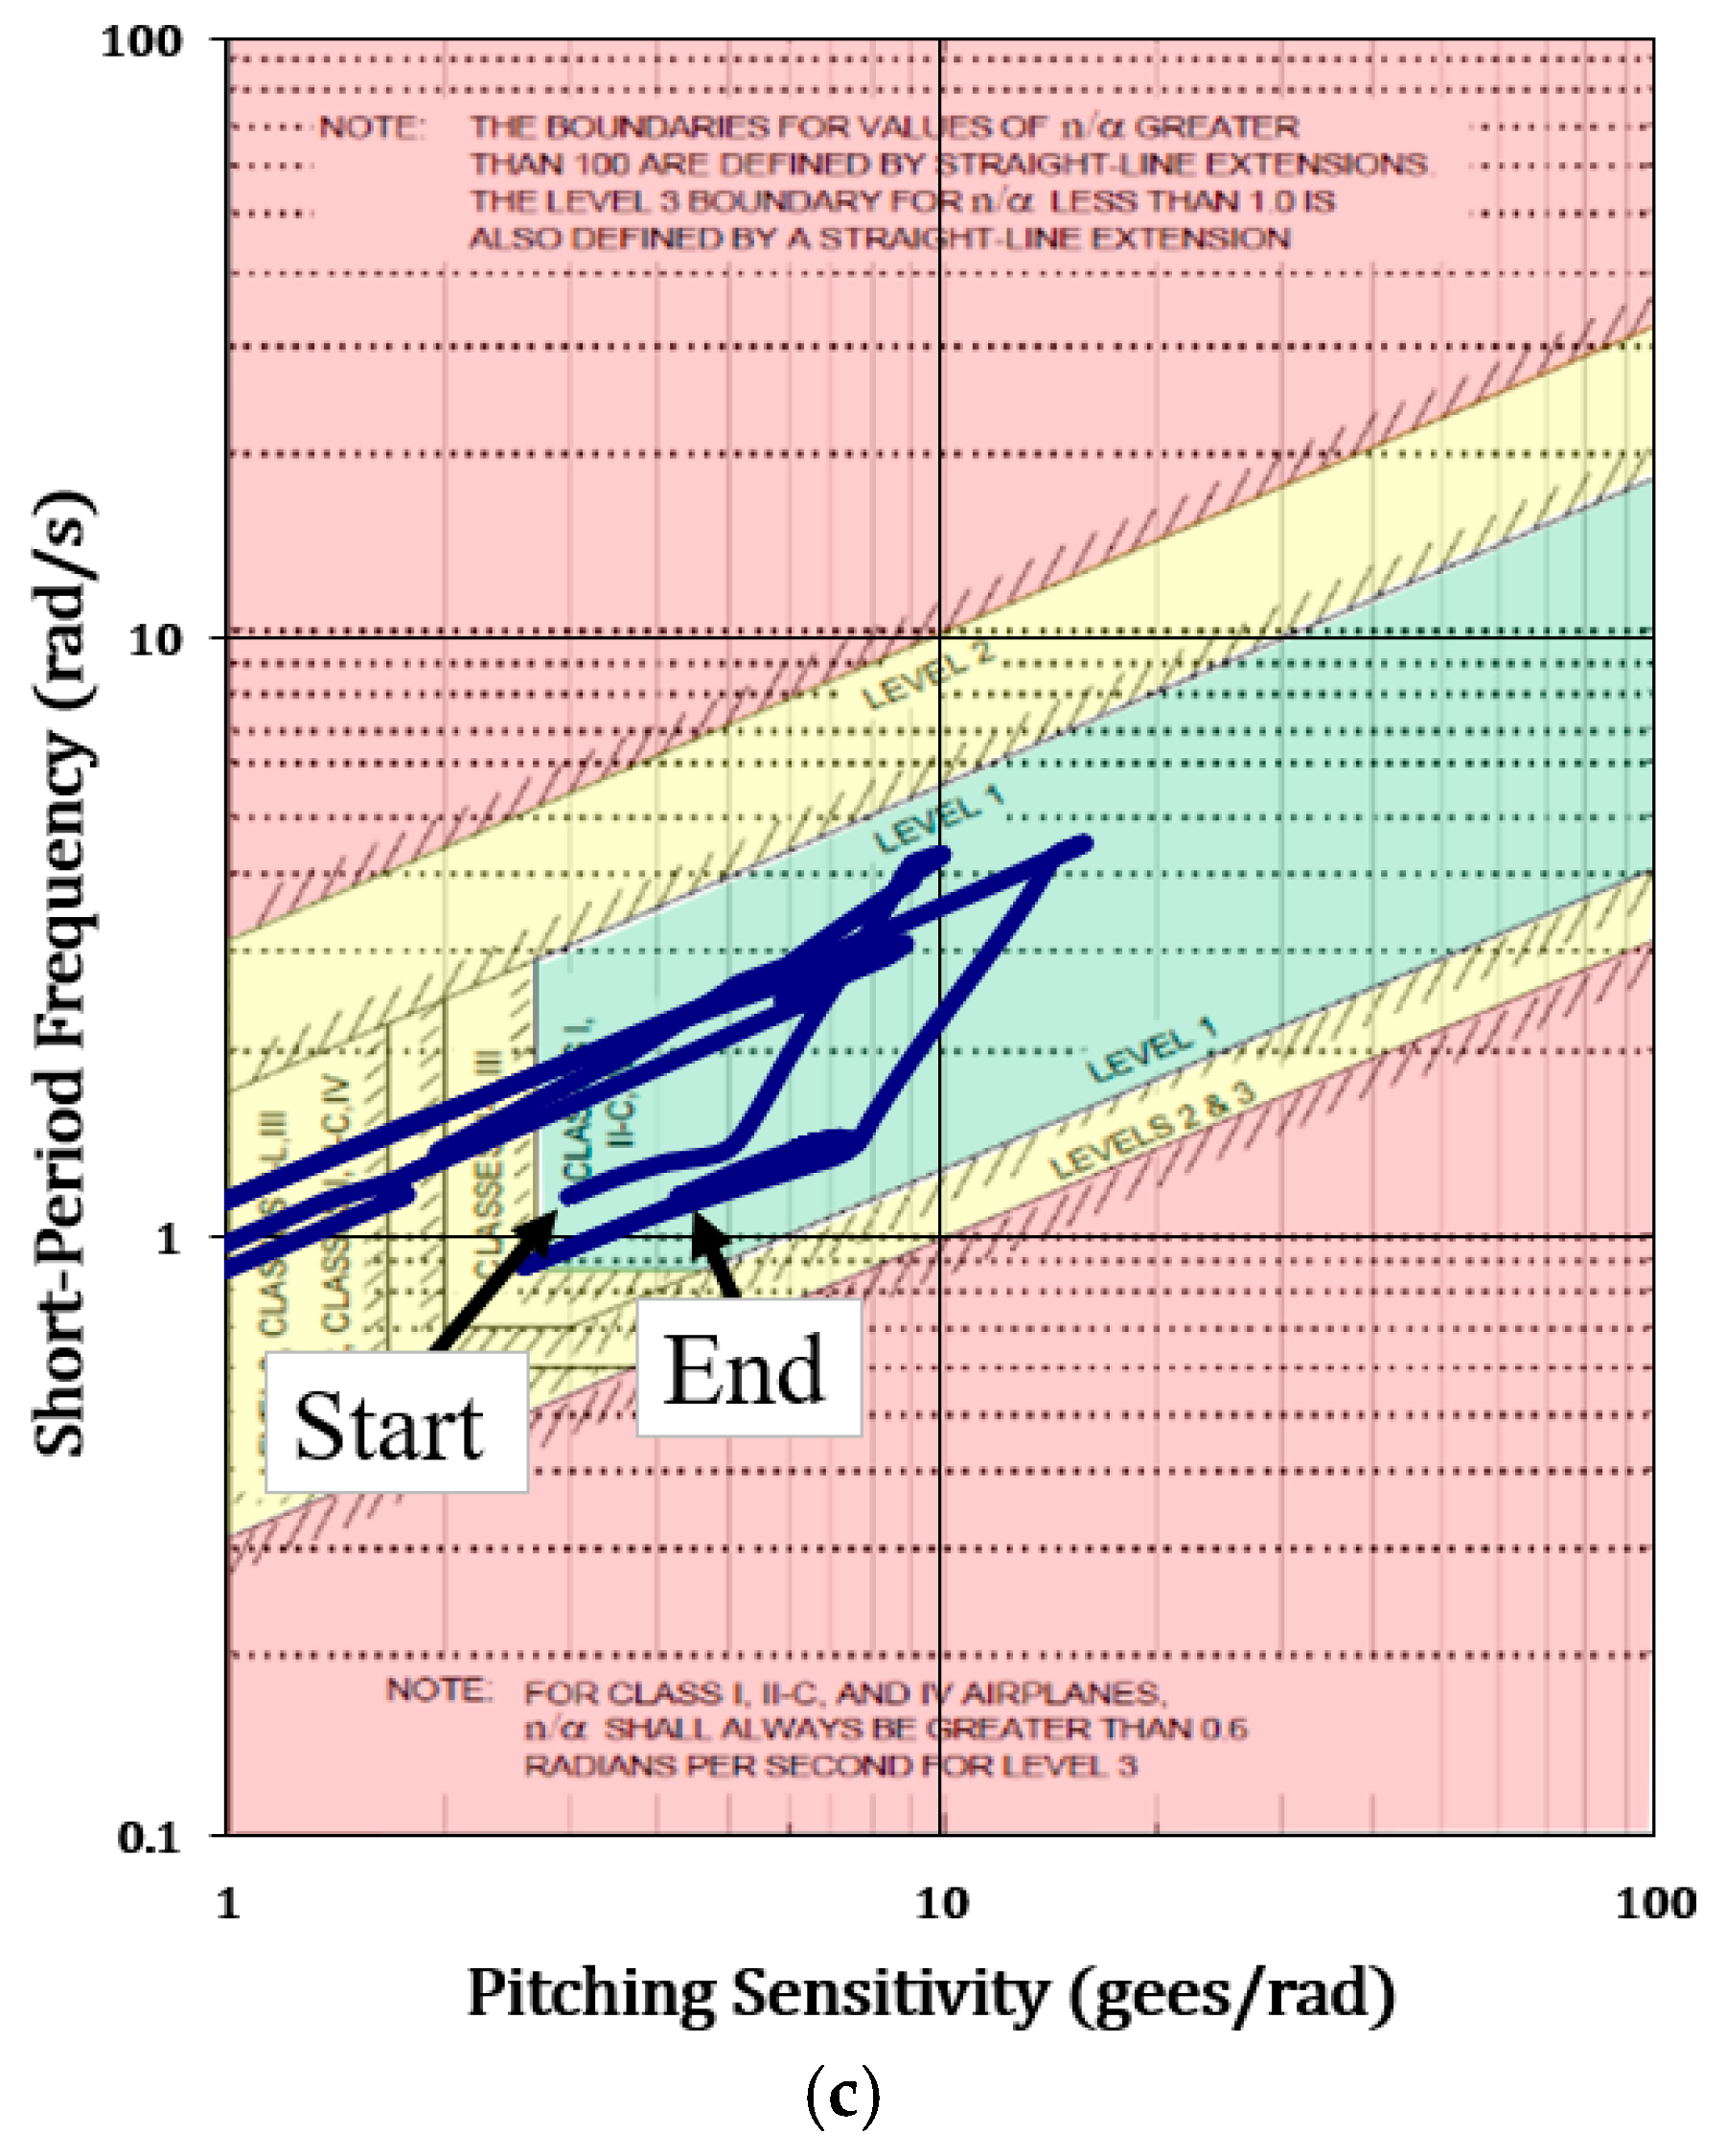
Figure 11c represents the Control Anticipation Parameter chart (CAP) [
5,
6]. It maps the aircraft response in the longitudinal mode domain and displays control criteria boundaries in accordance with the modern MIL-F-8785C flying quality requirements. As the X-15 leaves the atmosphere, its pitch responsiveness and short-period frequencies fall so low as to fall off the chart’s scale. This shows us that the X-15’s inherent aerodynamic control fell below Level 3 as it flew “over the top”. So long as the dynamic pressure is reasonable, it will otherwise exhibit Level 1 longitudinal responsiveness during the boost-climb, atmospheric reentry, approach, and landing.
5.3. Propensity for Adverse Control Response and Control Coupling
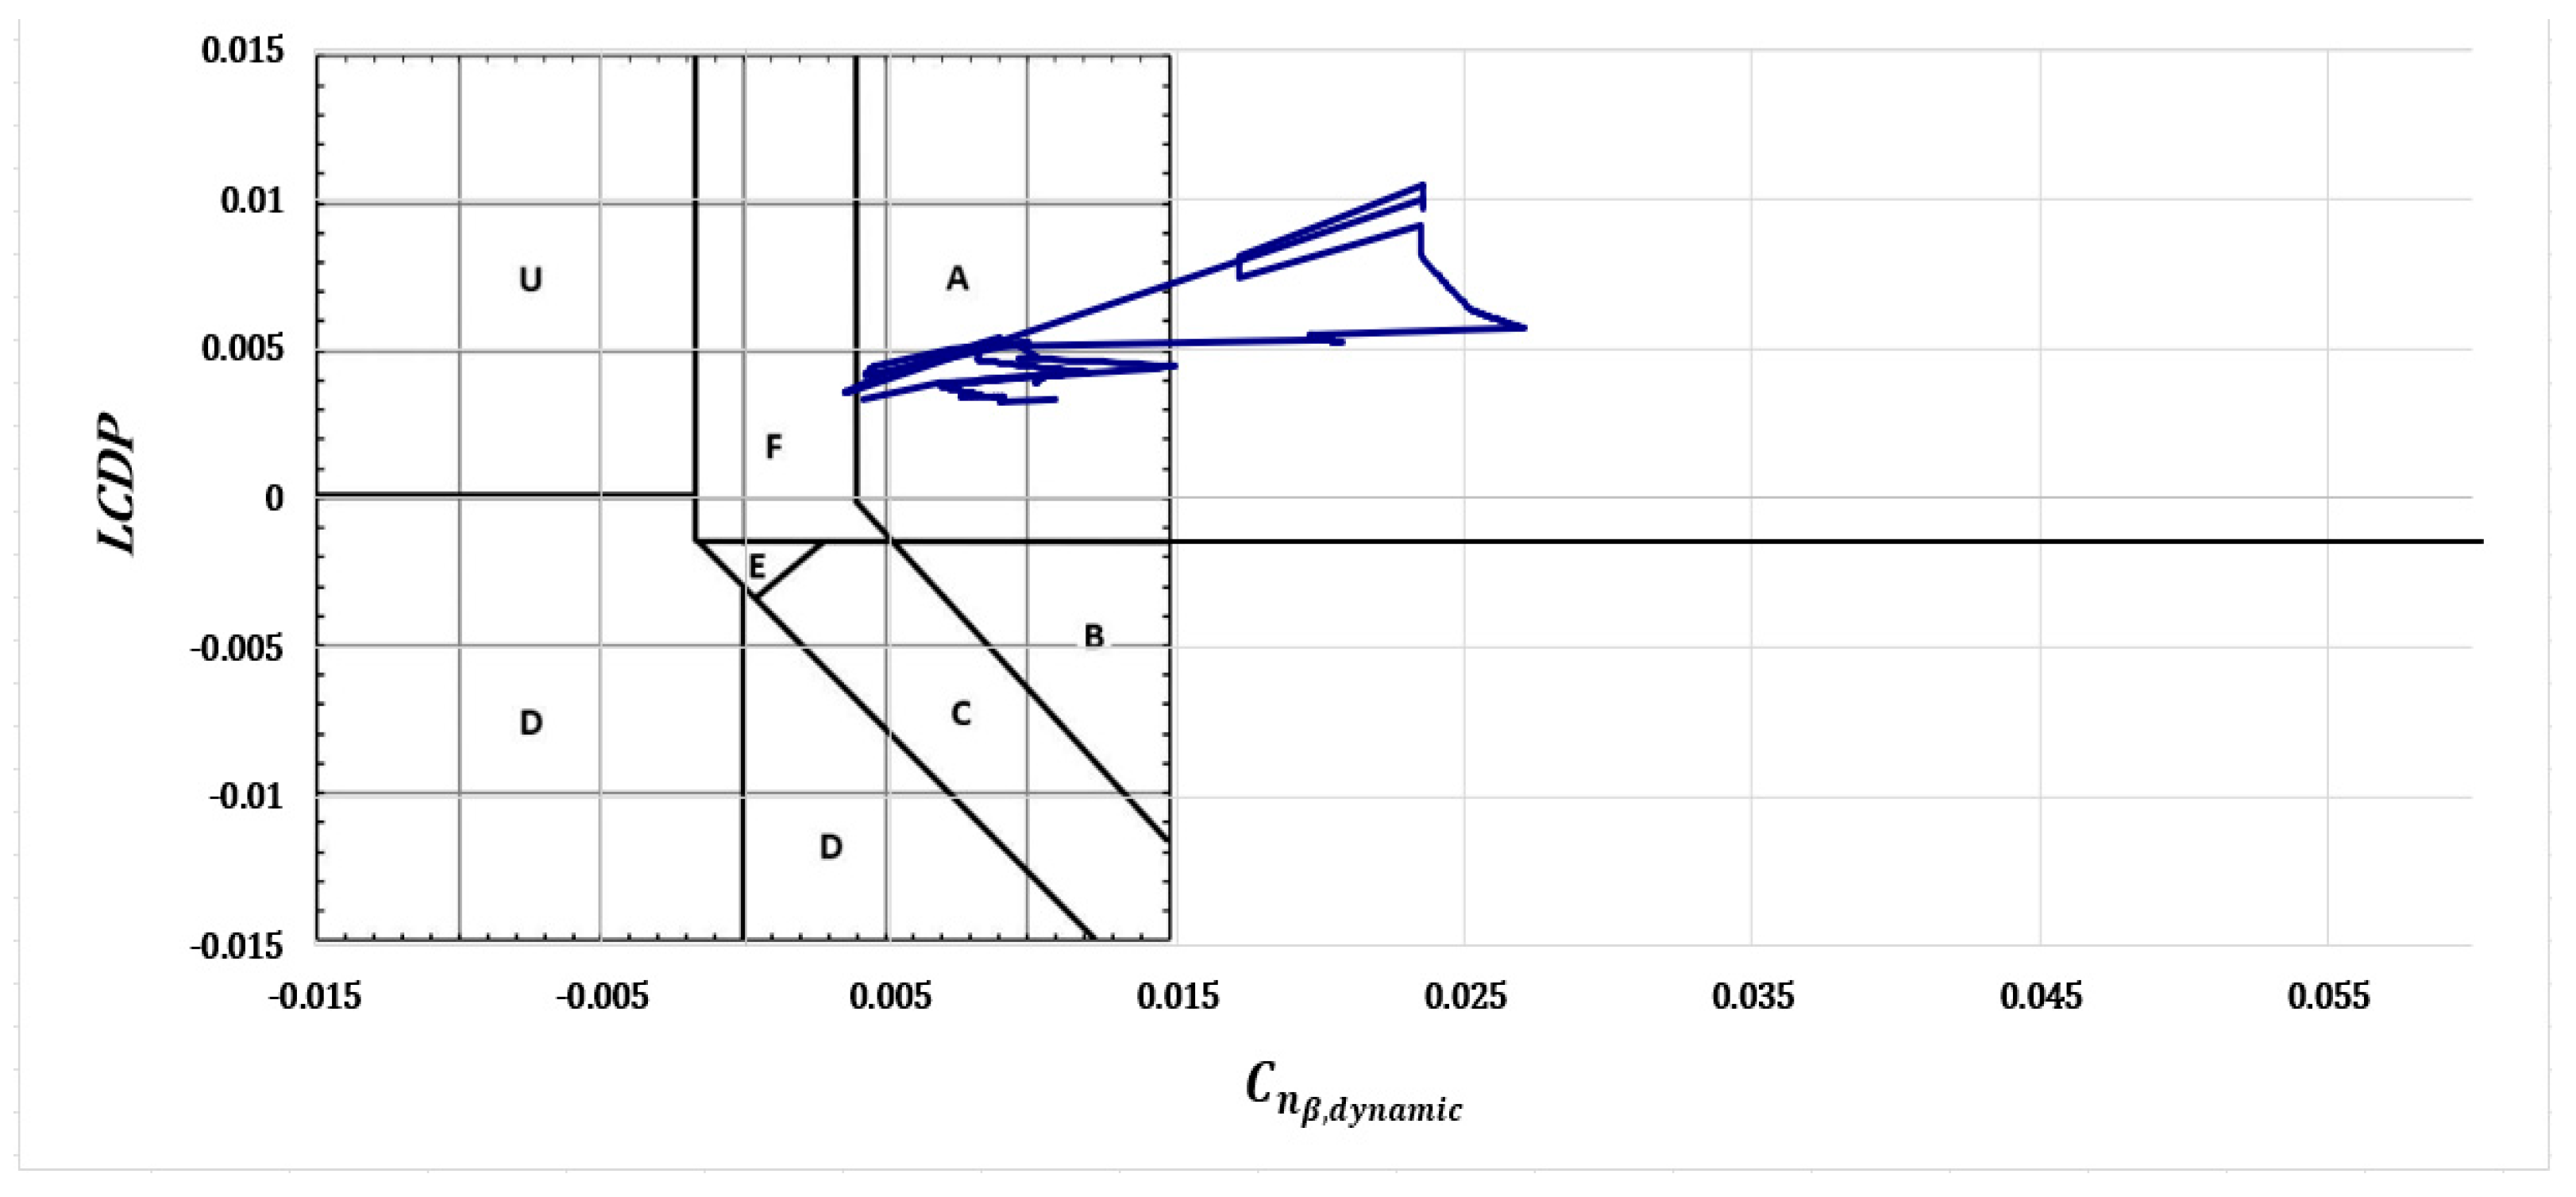
As discussed above, we believe that the Bihrle-Weissman chart is an excellent metric to determine the existence of adverse control coupling.
The X-15 is predicted to have been briefly in the “F” region as Armstrong completed the boost-climb phase around 85 s after launch; see
Figure 12. At a higher alpha, such as that flown on reentry,
increases so that the X-15 is well within the departure-resistant “A” region. Thus, it is unlikely that Neil Armstrong experienced issues with Dutch Roll stability and/or roll reversal during the atmospheric skip.
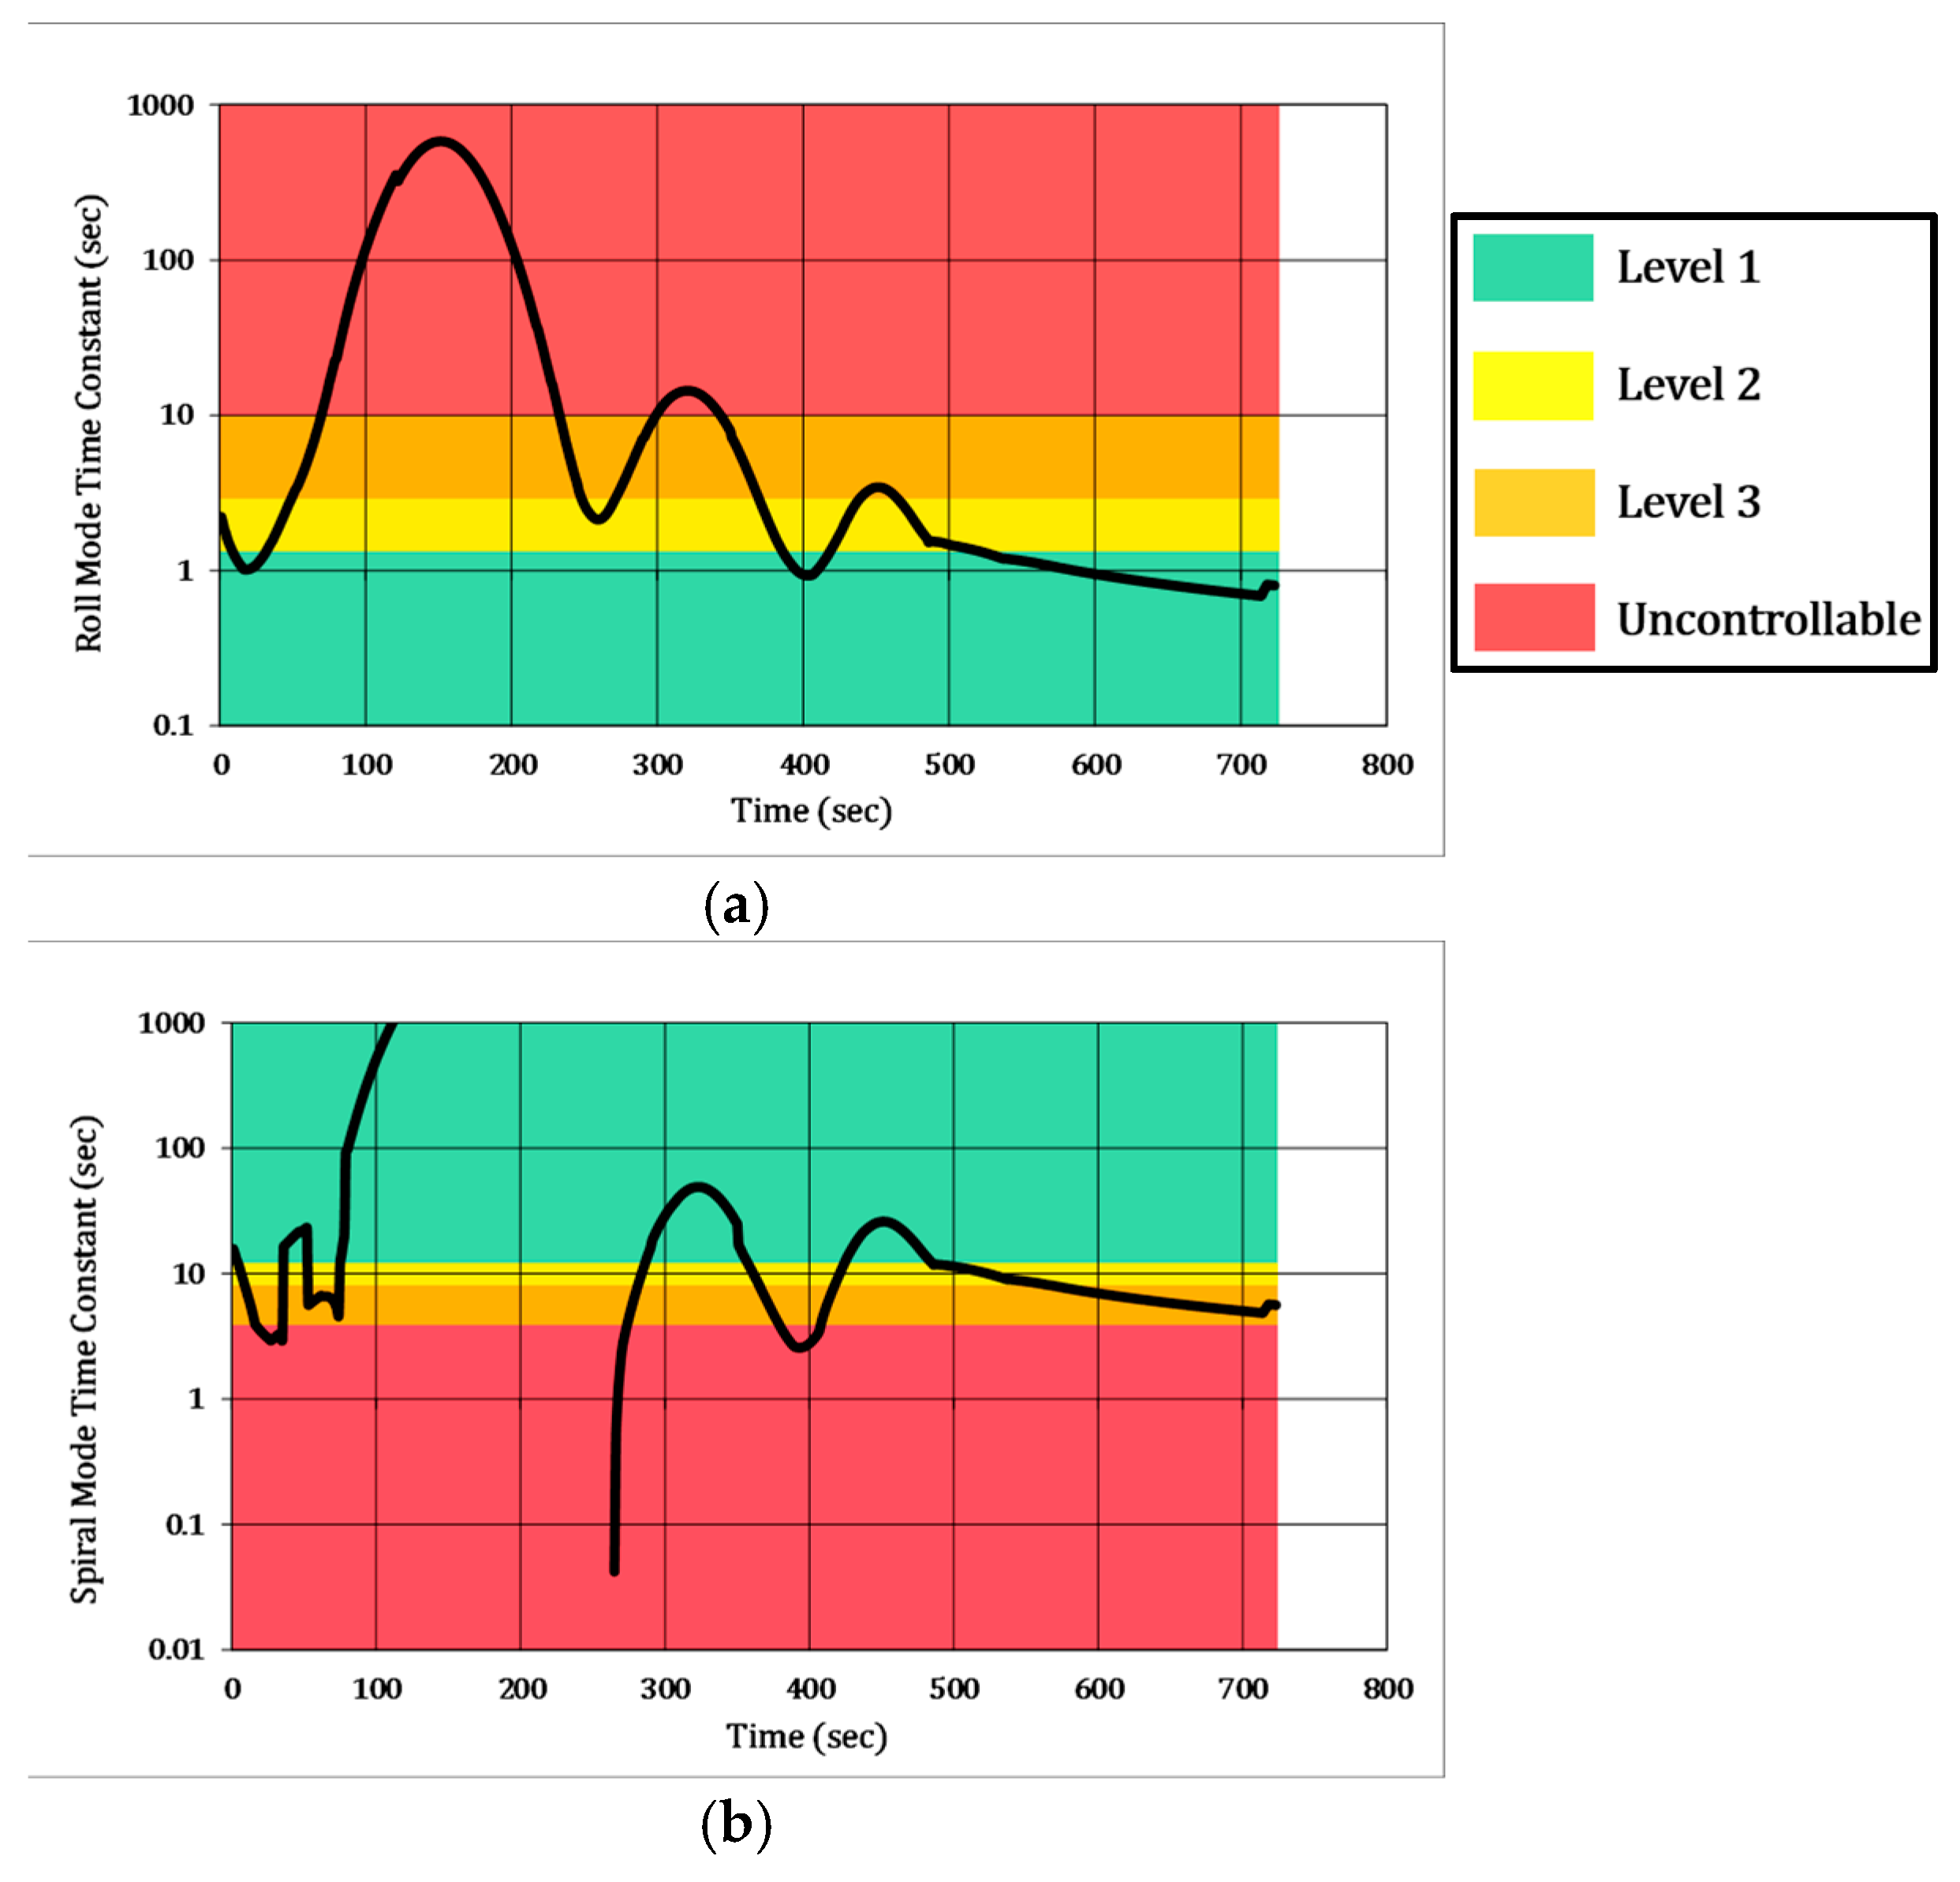
In addition, we see that the Roll and Spiral Mode time constants are unfavorable in certain areas of flight; see
Figure 13. In this, and subsequent figures, a red background corresponds to flight dynamic behavior likely to lead to a crash. Conversely, the green, yellow and orange background colors correspond to flight dynamics categorized as LEVEL 1, LEVEL 2 and LEVEL 3 respectively.
At low dynamic pressures (extremely high altitudes), Roll Mode is expected to be sluggish [
5,
6,
13]. It is not until Armstrong is below roughly 60,000 ft that the X-15 has enough aerodynamic control to have a desirable Roll Mode time constant. Past the 400 s mark of the simulation, the X-15 acquires sufficient roll control to make for a safe vehicle landing; see
Figure 13.
At high dynamic pressures, Spiral Mode becomes unfavorable due to the aircraft’s inherent tendency to increase the bank angle following a disturbance. We see Spiral Mode exhibit strong uncontrollable flying qualities near the 260 s mark; see
Figure 12. After Spiral Mode was very favorable and beyond the vertical limit of the chart, the rapid increase in dynamic pressure leading up to the atmospheric skip resulted in the asymptotic behavior as seen in
Figure 13, compared with
Table 3. This adds to the lateral/directional flying quality issues and high pilot workload that Neil Armstrong likely experienced as the mission deviated from the plan. Note that for similar high-speed, slender aircraft missions, Roll Mode and Spiral Mode are complete opposites under extreme flight conditions and never coincide in Level 1 flying quality; small Roll Mode and large Spiral Mode time constants will lead to better aerodynamic control.
5.4. Closed-Loop Longitudinal, Lateral, and Directional Dynamic Response
The X-15 engineering team became interested in adaptive gain stability augmentation due to the complex speed-, altitude-, and attitude-dependence of the required dynamic derivatives. The MH-96 system featured independent adaptive gains for pitch, roll, and yaw damping that would slowly increase feedback levels until they reached a defined maximum gain or the system detected incipient limit-cycle oscillations [
24]. By design, this system was engineered to set the feedback gains to operate with essentially zero gain margin and at the same time, this system paid no explicit attention to the phase margin [
24]. At the same time, our reverse-engineering of Armstrong’s flight shows that the AFCS provided much needed synthetic damping for all of the mission flight phases.
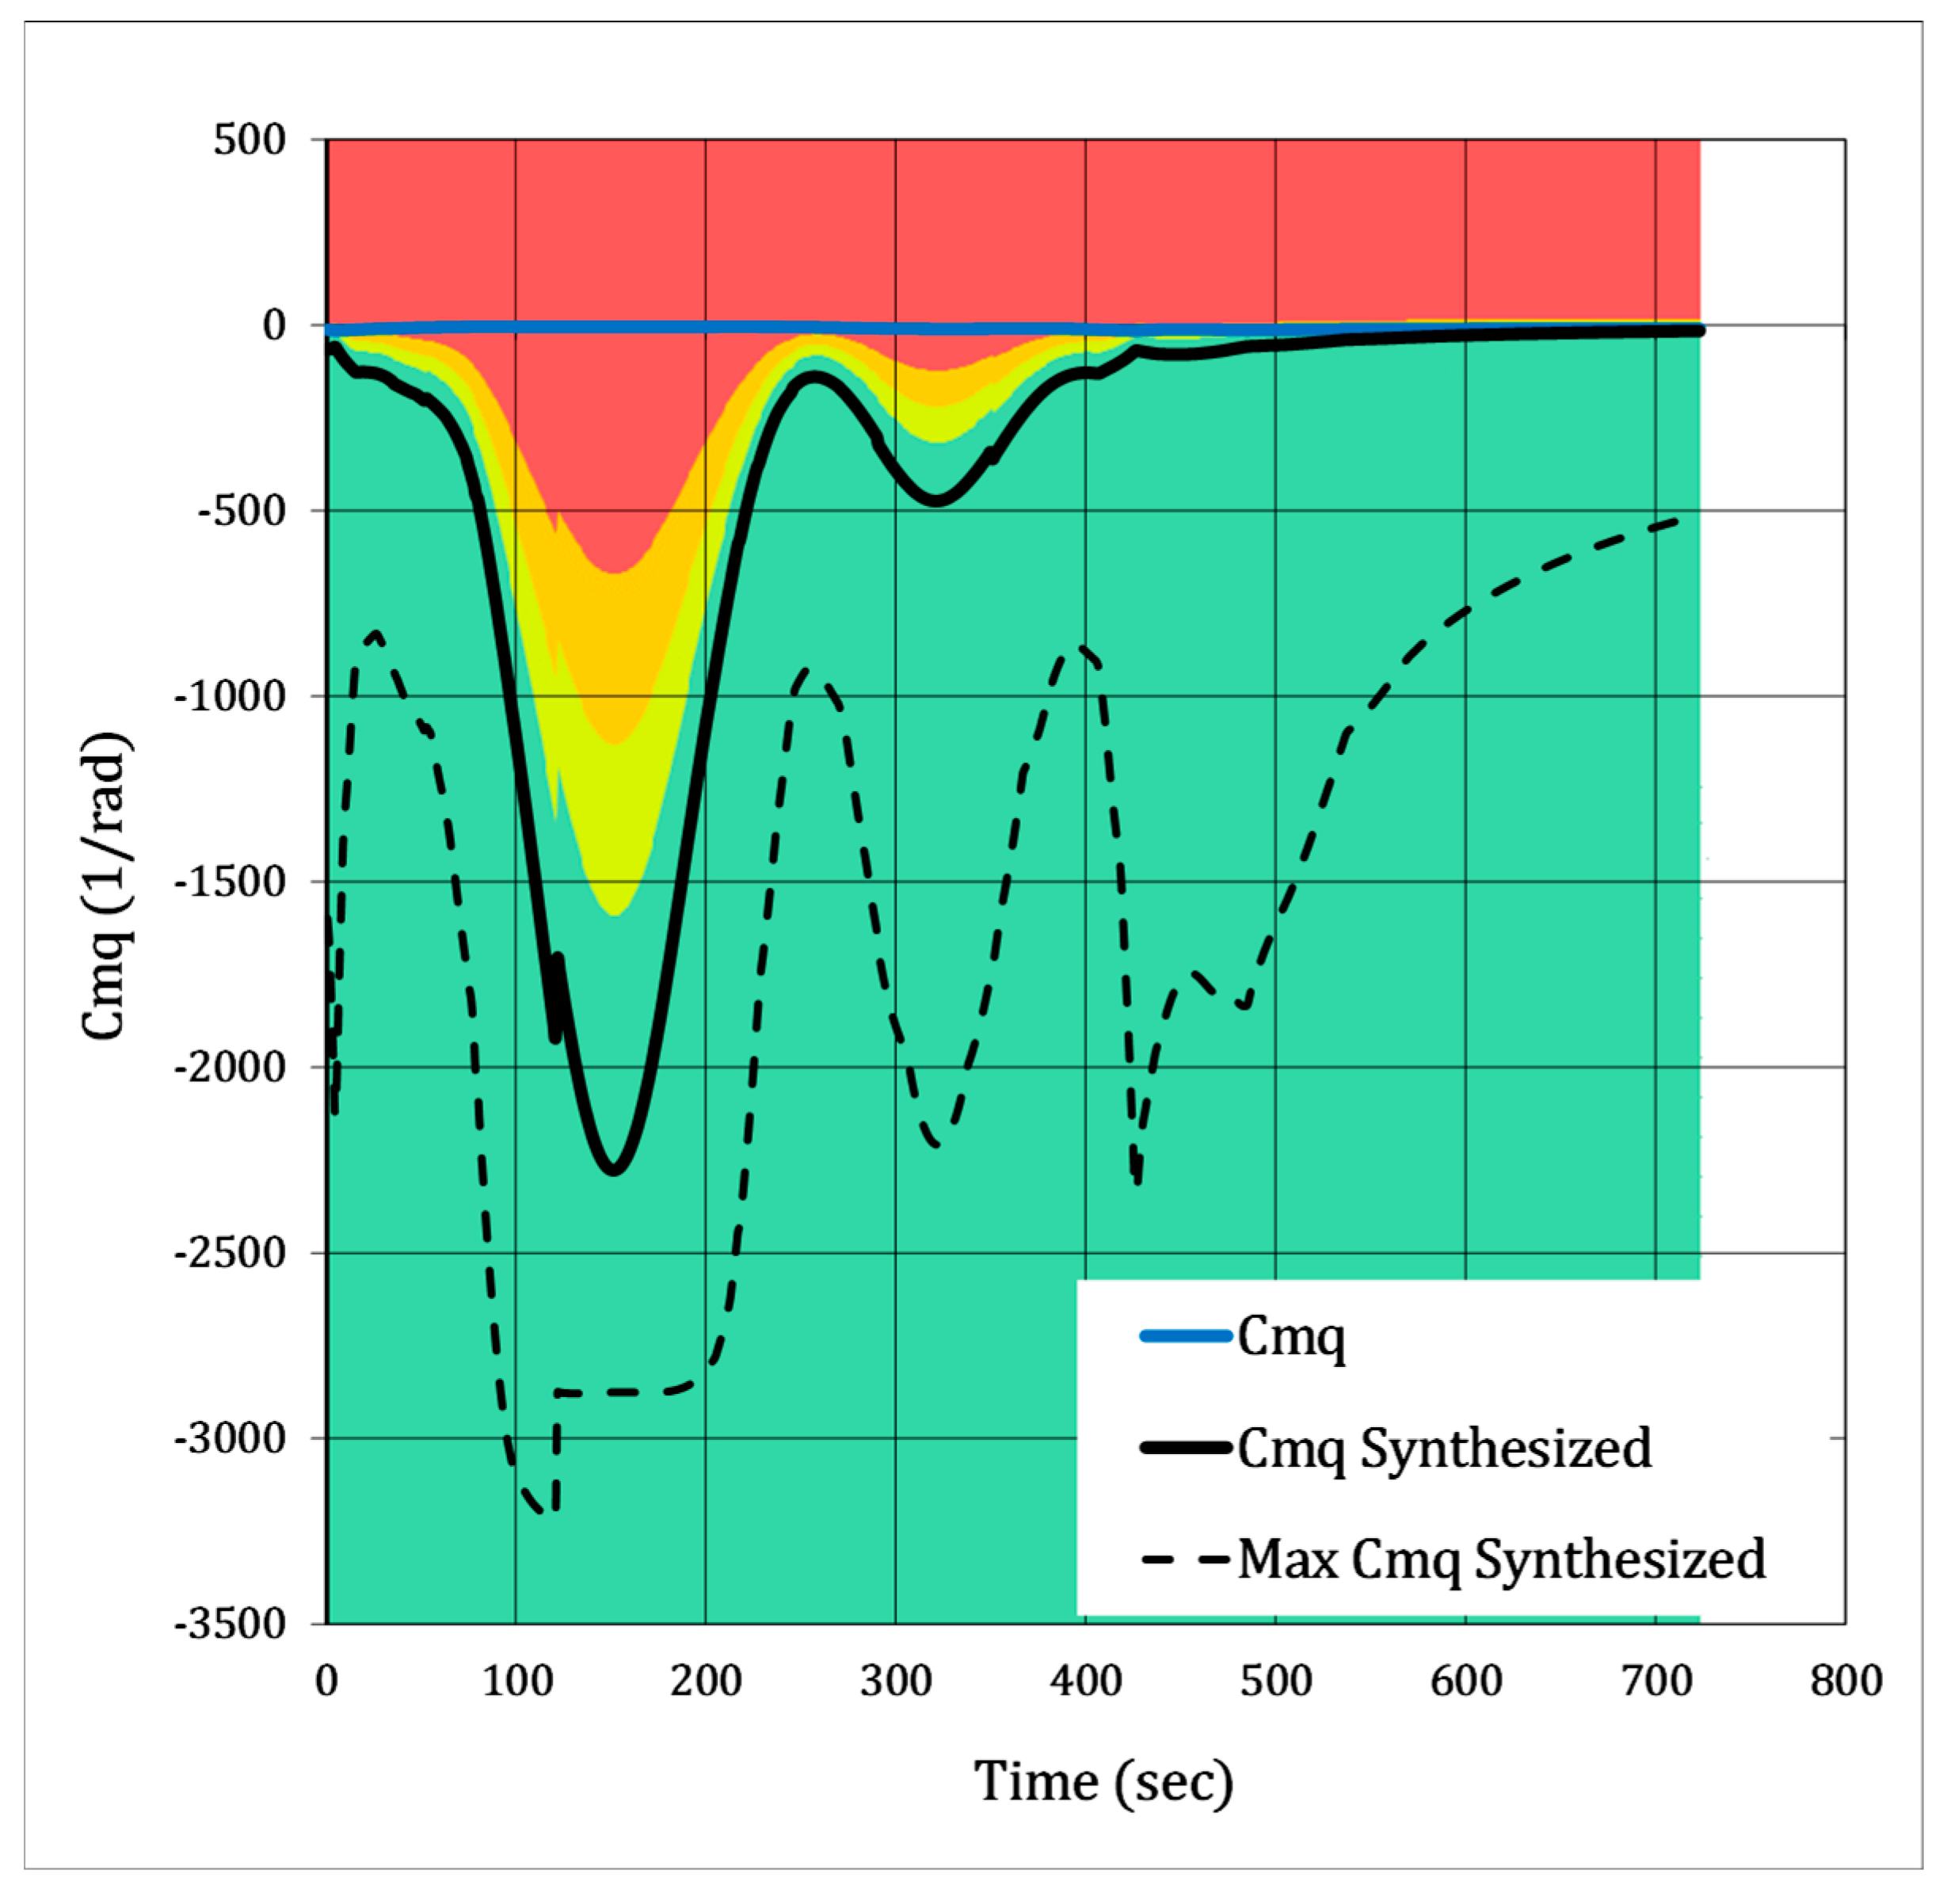
In
Figure 14 (overleaf), the “Max
Cmq Synthesized” data shows how favorable
Cmq could have been corresponding to the maximum available gains the control system would have allowed [
3,
9]. “
Cmq Synthesized” represents what the augmented
Cmq likely was on the flight, corresponding to the scheduled damping ratio of 0.5. The difference between these two lines is our estimation of how close the pitch controller would have been to outputting the maximum gains; the same logic applies to yaw and roll in
Figure 14 and
Figure 15.
As the gains at a damping ratio of 0.5 pass the Level 1 criteria for the entire flight, the pitch controller would have had little trouble making the X-15 controllable during Flight 3-4-8. Consequently, this flight in particular should not have used much reaction control in pitch. The closest we estimate the gains come to reaching the maximum values occurs during the “over-the-top” flight phase. This explains why “during entry from high altitude… the system gain [drops] correspondingly from its maximum value” [
21]. The need for synthetic damping on the X-15 is shown in the contrast between the unaugmented
Cmq and the synthesized data, where the base-airframe
Cmq (roughly equal to −1) is far worse than the Level 3 flying quality minimums where it is needed the most.
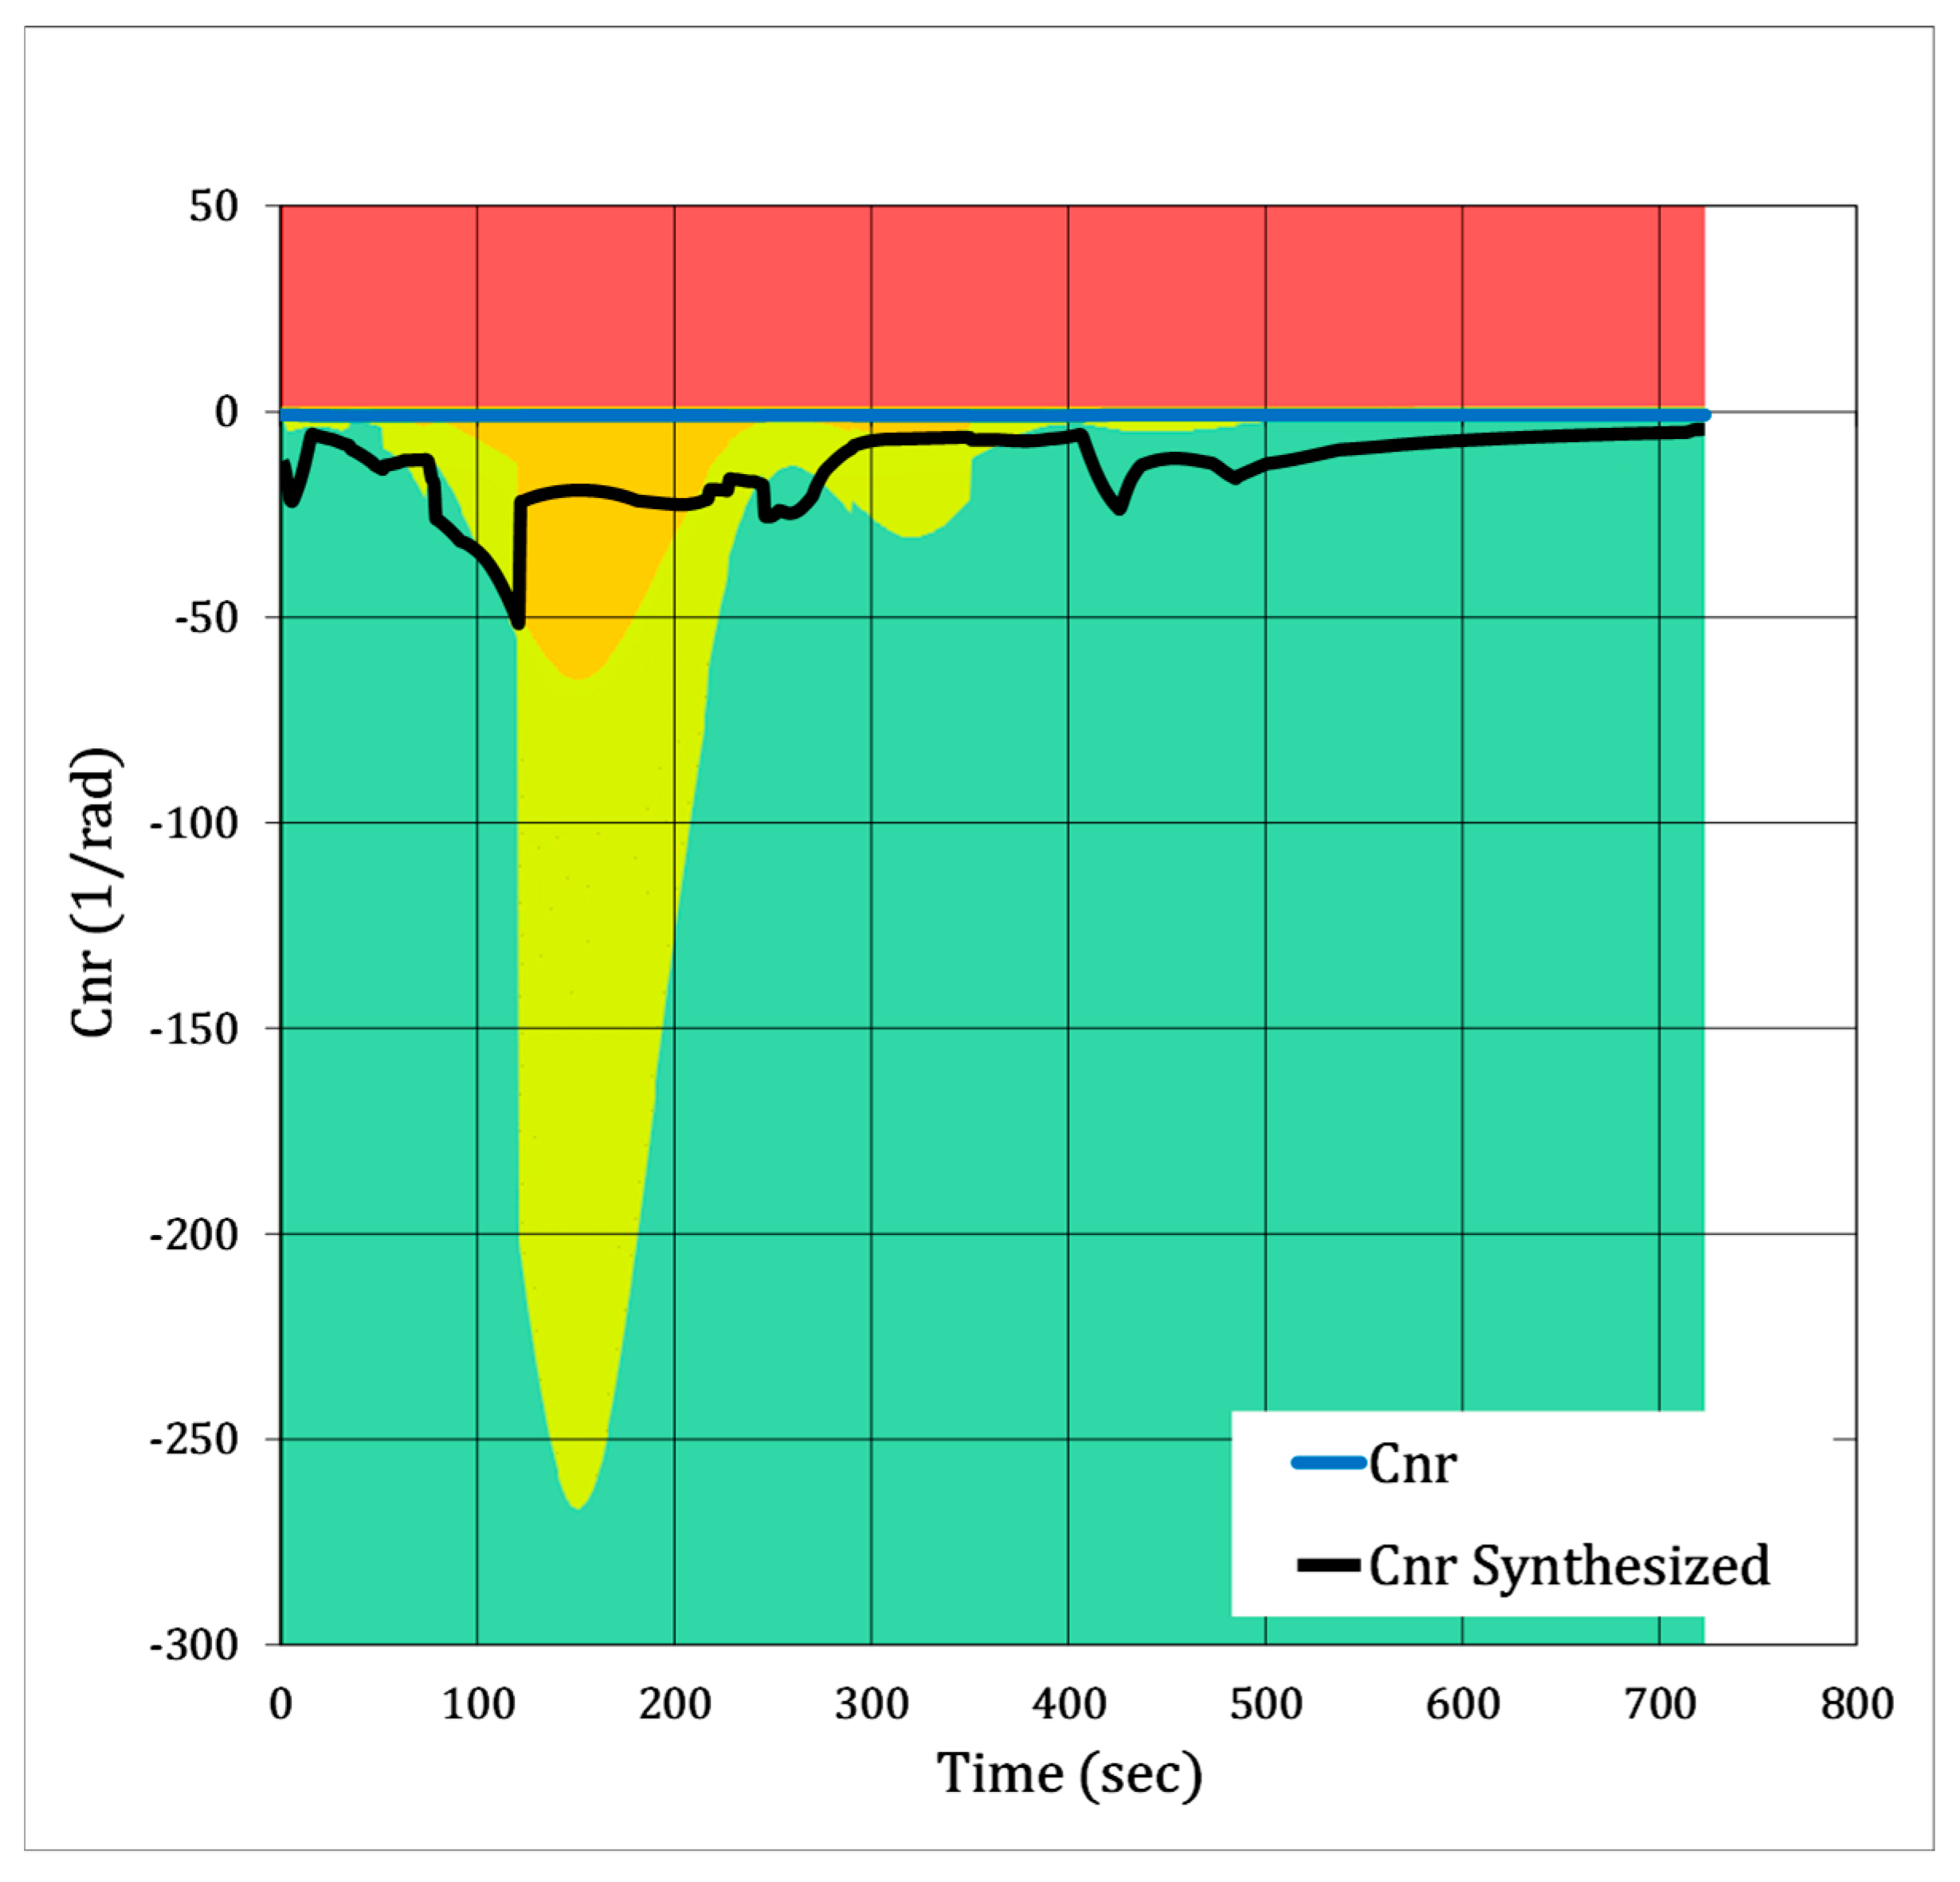
Yaw control with the AFCS was likely worse than pitch for Armstrong’s flight; see
Figure 15. We estimate the yaw controller to have been at maximum gain for the entire flight. The key stability and control areas of the flight span across Levels 1, 2, and 3, which strongly suggests that the required pilot workload is very unpredictable and unfavorable. The most uncontrollable area of flight in yaw is arguably during the atmospheric skip. Yaw damping is significantly diminished upon reentry, dropping from very favorable to very unfavorable flying qualities. Combined with the yaw controller, predicted to be at its maximum, this data strongly supports the claim that a confluence of lateral/directional danger zones was encountered on this mission. This exhibits how a high-oscillation Dutch Roll Mode cannot be easily solved by a complex AFCS as its controller-synthesized yaw damping is hardly more favorable than the aircraft’s open-loop capabilities.
The considerable cross-coupling between the rudder and elevon motions on the X-15 causes the
Cnr and
Clp plots to be less predictable than
Cmq; refer to Equations (26)–(28). Due to Equation (14), being absent any damping ratio and insufficient knowledge of how the MH-96 controller designers would have programmed the Roll Mode, we chose for the controller to achieve a 1.4 s Roll Mode time constant (Level 1 roll control) unless maximum gains were reached. The simulated controller is highly stressed at peak altitude and upon reentry; see
Figure 15 as the closed-loop roll gain approaches its maximum value for more than two minutes. At the atmospheric skip, roll damping control drops significantly from its peak. Only after Armstrong’s X-15 stops gaining altitude (~340 s) does the controller appear to back off from being overstressed, our simulation shows. This too adds to the intense pilot workload Neil Armstrong experienced, where the roll and yaw controllers operating at maximum gains, and potentially limit-cycle oscillating, left little room for error and reaction control assistance.
Available flight-test data shows that the roll controller limit-cycle oscillated 30 s prior to the skip [
3]. This aligns with the simulated data in
Figure 16, where the controller gains are near maximum and stressed for a prolonged period of time leading up to the atmospheric skip. NASA flight dynamics engineers were acutely aware of the severity of sustained limit-cycle oscillations and rate-limiting during a mission; control “saturation in one axis resulted in complete loss of control in the other axis” [
21]. In more recent years, Klyde & Mitchell [
33] have also expressed their concerns with the rate limiting of flight control surfaces leading to pilot-induced oscillations (PIO) from the first-ever X-15 flight (Flight 1-1-5). They explain that for closed-loop aircraft, “reaching a rate limit also means a sudden change in response dynamics as the aircraft transitions from the closed-loop to the open-loop response.”
Figure 14,
Figure 15 and
Figure 16 convey just how dangerous a complete loss of synthetic damping is; the aircraft will be uncontrollable at high speeds.
6. Summary and Conclusions
This work leverages McRuer’s “equivalent stability derivative” approach to find relevant simplified aircraft equations of motion that demonstrate consequential flying qualities trends in compact equations. Because MIL-F-8785C and MIL-STD-1797 also use an “equivalent low-order system” framework to establishing flying quality requirements in terms of frequencies and damping ratios, we followed their example to implement similar criteria in our work. We incorporate additional lateral/directional control metrics, the Bihrle-Weissman Criteria, not covered by modern MIL standard requirements to complete our novel stability and control framework to evaluate the suitability of candidate high-speed vehicle designs. Our novel contribution combines the “equivalent stability derivative” formulation with both a total flight envelope (speed/altitude contour plot) and a path integral (parameters following a given trajectory) to determine the presence or absence of flying qualities that diminish the probability of mission success.
Publicly available technical data including aerodynamics, mass properties, reference trajectories, and real flight experiences are needed to validate this novel framework. Our work reverse-engineered the North American X-15, in particular the standout “atmospheric skip” flight shown in this manuscript. We present a full aerodynamic database complemented with a time-step integrating mission simulation as well as point-performance “Skymap” plots. This basis data can substantiate both the broad kinematics (time, altitude, and distance) and the detailed dynamics (ELOS frequencies and damping ratios) exhibited by the actual aircraft in flight.
By analyzing the outputs of our analytical tools, this investigation demonstrates why high-gain feedback control to synthesize aerodynamic damping proved insufficient to fly many X-15 missions. When operated at low dynamic pressures, reaction control jets were needed to augment aerodynamic control. Under other conditions, exhibited during atmospheric reentry, the gain levels needed to synthesize Cmq < −1000 and Clp < −100 required for reasonable damping so as to render the system prone to control saturation and limit-cycle oscillation.
In hindsight, the X-15 must hold a 60–90° bank angle at high angles of attack to prevent an “atmospheric skip”—this maneuver is associated with the planned turn over Rosamond Dry Lakebed; return to
Figure 1. Telemetry shows that Armstrong was wings-level (bank angle of 0°) at the onset of the skip [
3]. Our simulation and reassessment of the flight show that an unsatisfactory Spiral Mode (
Figure 13), aggressive Dutch Roll frequency (
Figure 11a), and highly-stressed roll and yaw controllers at the onset of the atmospheric skip (
Figure 15 and
Figure 16) placed Neil Armstrong in an excessively high-workload environment.
One outcome of Armstrong’s experience was a revision of the X-15’s flying configuration. Later X-15 flights using the AFCS were largely successful, as a revised ventral configuration improved its lateral/directional stability under closed-loop control. More broadly, the lesson learned for future vehicle design is the need to consider the implications of very high feedback gains on basic lateral/directional parameters when selecting the basic aerodynamic configuration.
Author Contributions
This research paper was broadly conceptualized by T.T.T.; methodology, W.P.L.; software, T.T.T. and W.P.L.; validation, W.P.L.; formal analysis, W.P.L.; investigation, W.P.L. and T.T.T.; resources, R.V.G.; data curation, W.P.L.; writing—original draft preparation, W.P.L. and T.T.T.; writing—review and editing, R.V.G.; visualization, W.P.L.; supervision, R.V.G.; project administration, R.V.G.; funding acquisition, R.V.G. All authors have read and agreed to the published version of the manuscript.
Funding
The preparation of the work was supported through several funding mechanisms. Professor Takahashi was Visiting Faculty at the U.S. Air Force Institute of Technology under the SysPlus, Inc. managed Air Force Summer Faculty Fellowship program. Both Professor Takahashi and Mr. Lorenzo were also supported under the Postgraduate Research Participation Program at the U.S. Air Force Institute of Technology, administered by the Oak Ridge Institute for Science and Education through an interagency agreement between the U.S. Department of Energy and AFIT. ORISE is managed by ORAU under DOE contract number DE-SC0014664.
Data Availability Statement
Data are contained within the article.
Acknowledgments
This work is a heavily revised version of an abstract originally presented by Lorenzo, W.P., and Takahashi, T.T., titled “Reconstructing and Reassessing Neil Armstrong’s “First Man” Flight in the North American X-15”. It was given as AIAA 2024-2643 at the AIAA SciTech 2024 Forum, Orlando, FL, US, 8–12 January 2024; see Reference [
10]. The views expressed are those of the authors and do not reflect the official guidance or position of the United States Government, the Department of Defense, the United States Air Force, or the United States Space Force.
Conflicts of Interest
The authors declare no conflicts of interest. ORISE and SysPlus had no role in the design of the study; in the collection, analyses, or interpretation of data; in the writing of the manuscript; or in the decision to publish the results.
Distribution Statement A
Approved for public release: distribution is unlimited. Docket # 0701AFIT2024ENY06093. This material is declared a work of the U.S. Government and is not subject to copyright protection in the United States.
Abbreviations
The following nomenclature and nominal units are used in this manuscript:
| b | Wingspan, ft |
| Reference chord, ft |
| CL | Lift coefficient |
| Clp | Rolling moment coefficient due to dimensionless roll rate |
| Clr | Rolling moment coefficient due to dimensionless yaw rate |
| dCl/dβ | Rolling moment coefficient due to sideslip angle, 1/deg |
| dCL/dα | Lift coefficient due to angle of attack, 1/deg |
| Cnr | Yawing moment coefficient due to dimensionless yaw rate |
| Cnp | Yawing moment coefficient due to dimensionless roll rate |
| dCn/dβ | Yawing moment coefficient due to sideslip angle, 1/deg |
| Cnβ,dynamic | Dutch Roll stability coefficient, 1/deg |
| Cmq | Pitching moment coefficient due to dimensionless pitch rate |
| dCm/dα | Pitching moment coefficient due to angle of attack, 1/deg |
| dCY/dβ | Side force coefficient due to sideslip, 1/deg |
| Ixx | Mass moment of inertia about x-axis (rolling), slug ft2 |
| Ixz | Mass product of inertia about xz-axis, slug ft2 |
| Iyy | Mass moment of inertia about y-axis (pitching), slug ft2 |
| Izz | Mass moment of inertia about z-axis (yawing), slug ft2 |
| M | Mach number |
| nZ | Body normal load factor, g |
| n/α | Pitching sensitivity, g/rad |
| Dynamic pressure, lbf/ft2 |
| Sref | Wing reference area, ft2 |
| V∞ | Freestream velocity, ft/s |
| W | Aircraft weight, lb |
| α | Angle of attack, deg |
| β | Sideslip angle, deg |
| δa | Aileron deflection, deg |
| δe | Elevator deflection, deg |
| δr | Rudder deflection, deg |
| ζdr | Dutch Roll damping ratio |
| ζph | Phugoid damping ratio |
| ζsp | Short-period damping ratio |
| τdr | Dutch Roll Time-to-Double, s |
| τR | Roll Mode time constant, s |
| τS | Spiral Mode time constant, s |
| ωdr | Dutch Roll frequency, rad/s |
| ωph | Phugoid frequency, rad/s |
| ωsp | Short-period frequency, rad/s |
References
- Evans, M. The X-15 Rocket Plane: Flying the First Wings into Space; University of Nebraska Press: Lincoln, NE, USA, 2013; ISBN 978-0803228405. [Google Scholar]
- Raveling, P. X-15 Adventures: Flight 51 (3-4-8)—20 April 1962. Available online: https://www.sierrafoot.org/x-15/adventures/flight_051/flight_51.html (accessed on 1 May 2025).
- Lindahl, J.H.; McGuire, W.M.; Reed, M.W. Advanced Flight Vehicle Self-Adaptive Flight Control System. Part V. Acceptance Flight Tests. WADD TD-60-651 Vol V, May 1963.
- McRuer, D.T.; Graham, D.; Ashkenas, I. Aircraft Dynamics and Automatic Control; Princeton University Press: Princeton, NJ, USA, 1973; ISBN 978-0691600383. [Google Scholar]
- MIL-F-8785C; Military Specification: Flying Qualities of Piloted Airplanes. United States Department of Defense: Washington, DC, USA, 1980.
- MIL-STD-1797A; Flying Qualities of Piloted Aircraft. United States Department of Defense: Washington, DC, USA, 1995.
- Weissman, R. Status of Design Criteria for Predicting Departure Characteristics and Spin Susceptibility. In Proceedings of the AIAA Mechanics and Control of Flight Conference, Anaheim, CA, USA, 5–9 August 1974. AIAA 74–791. [Google Scholar] [CrossRef]
- Takahashi, T.T.; Griffin, J.A.; Grandhi, R.V. High-Speed Aircraft Stability and Control Metrics. Aerospace 2025, 12, 12. [Google Scholar] [CrossRef]
- Tremant, R.A. Operational Experiences and Characteristics of the X-15 Flight Control System; NASA TN-1402; NASA: Washington, DC, USA, 1971. [Google Scholar]
- Hodge, K.E. Proceedings of the X-15 First Flight 30th Anniversary Celebration; NASA CP-3405; NASA: Washington, DC, USA, 1991. [Google Scholar]
- Miranda, L.R.; Elliot, R.D.; Baker, W.M. A Generalized Vortex Lattice Method for Subsonic and Supersonic Flow Applications; NASA CR 2865; NASA: Washington, DC, USA, 1977. [Google Scholar]
- Takahashi, T.T.; Gaydusek, B.S.; Lorenzo, W.P. VORLAX 2024: Further Upgrades to a Legacy Potential Flow Solver. In Proceedings of the AIAA Sci Tech 2025 Forum, Orlando, FL, USA, 6–10 January 2025. AIAA 2025-0848. [Google Scholar] [CrossRef]
- Lorenzo, W.P.; Takahashi, T.T. Reconstructing and Reassessing Neil Armstrong’s “First Man” Flight in the North American X-15. In Proceedings of the AIAA Sci Tech 2024 Forum, Orlando, FL, USA, 8–12 January 2024. AIAA 2024-2643. [Google Scholar] [CrossRef]
- Myers, T.T.; Johnston, D.E.; McRuer, D. Space Shuttle Flying Qualities and Flight Control System Assessment Study; NASA: Washington, DC, USA, 1982; NASA CR-170391. [Google Scholar]
- Wang, Z.; Hu, L.; Fei, W.; Zhou, D.; Yang, D.; Ma, C.; Gong, Z.; Wu, J.; Zhang, C.; Yang, Y. High-performance attitude control design of supersonic tailless aircraft: A cascaded disturbance rejection approach. Aerospace 2023, 10, 198. [Google Scholar] [CrossRef]
- Kwiek, A.; Figat, M.; Goetzendorf-Grabowski, T. The Study of Selected Aspects of the Suborbital Vehicle Return Flight Trajectory. Aerospace 2023, 10, 489. [Google Scholar] [CrossRef]
- Alexander, M.G. Subsonic Wind Tunnel Testing Handbook; WL-TR-91-3073; United States Department of Defense WL/FIMM Wright-Patterson AFB: Dayton, OH, USA, 1991; Available online: https://apps.dtic.mil/sti/tr/pdf/ADA240263.pdf (accessed on 1 June 2023).
- Roskam, J. Airplane Flight Dynamics and Automatic Flight Controls; Pt. I and Pt. II; DAR Corporation: Lawrence, KS, USA, 1995. [Google Scholar]
- Yechout, T.R. Introduction to Aircraft Flight Mechanics, 2nd ed.; AIAA: Reston, VA, USA, 2014. [Google Scholar] [CrossRef]
- Day, R.E. Coupling Dynamics in Aircraft Design: A Historical Perspective; NASA SP-532; NASA: Washington, DC, USA, 1997. [Google Scholar]
- Flight Research Center. Experience with the X-15 Adaptive Flight Control System; NASA TN D-6208; NASA: Washington, DC, USA, 1971. [Google Scholar]
- Skow, A.M.; Titiriga, A. A Survey of Analytical and Experimental Techniques to Predict Aircraft Dynamic Characteristics at High Angles of Attack; AGARD CP-235; North Atlantic Treaty Organization: Neuilly-Sur-Seine, France, 1978. [Google Scholar]
- Philips, W.H. Effect of Steady Rolling on Longitudinal and Directional Stability; NACA TN-1627; NACA: Washington, DC, USA, 1948. [Google Scholar]
- Taylor, L.W., Jr.; Adkins, E.J. Adaptive Flight Control Systems—Pro and Con; NASA TM X-560008; NASA: Washington, DC, USA, 1964. [Google Scholar]
- Jarvis, C.R.; Lock, W.P. Operational Experience with the X-15 Reaction Control and Reaction Augmentation Systems; NASA TN D-2864; NASA: Washington, DC, USA, 1965. [Google Scholar]
- Gera, J. Exploratory Tests for an Airplane Stability and Control Effectiveness in a Low-Density Wind Tunnel at Mach Numbers of 3, 4.5, and 6; NASA TM X-1308; NASA: Washington, DC, USA, 1966. [Google Scholar]
- Saltzman, E.J.; Garringer, D.J. Summary of Full-Scale Lift and Drag Characteristics of the X-15 Airplane; NASA TN D-3343; NASA: Washington, DC, USA, 1966. [Google Scholar]
- Weil, J. A Review of the X-15 Program; NASA TN D-1278; NASA: Washington, DC, USA, 1962. [Google Scholar]
- Sagliano, M.; Mooij, E.; Theil, S. Adaptive Disturbance-Based High-Order Sliding-Mode Control for Hypersonic-Entry Vehicles. J. Guid. Control Dyn. 2017, 40, 521–536. [Google Scholar] [CrossRef]
- Cary, J.P.; Keener, E.R. Flight Evaluation of the X-15 Ball Nose Flow Direction Sensor as an Air Data System; NASA TN D-2923; NASA: Washington, DC, USA, 1965. [Google Scholar]
- Fischel, J.; Webb, L.D. Flight Information Sensors, Display and Space Control of the X-15 Airplane for Atmospheric and Near-Space Flight Missions; NASA TN D-2407; NASA: Washington, DC, USA, 1964. [Google Scholar]
- Berger, T.; Tischler, M.B.; Hagerott, S.G.; Cotting, M.C.; Gresham, J.L.; George, J.E.; Krogh, K.J.; d’Argenio, A.; Howland, J.D. Business Jet Fly-by-Wire Control Laws Handling Qualities Flight Test Assessment. J. Guid. Control Dyn. 2021, 44, 1498–1516. [Google Scholar] [CrossRef]
- Klyde, D.H.; Mitchell, D.G. Investigating the Role of Rate Limiting in Pilot-Induced Oscillations. J. Guid. Control Dyn. 2004, 27, 804–813. [Google Scholar] [CrossRef]
| Disclaimer/Publisher’s Note: The statements, opinions and data contained in all publications are solely those of the individual author(s) and contributor(s) and not of MDPI and/or the editor(s). MDPI and/or the editor(s) disclaim responsibility for any injury to people or property resulting from any ideas, methods, instructions or products referred to in the content. |
© 2025 by the authors. Licensee MDPI, Basel, Switzerland. This article is an open access article distributed under the terms and conditions of the Creative Commons Attribution (CC BY) license (https://creativecommons.org/licenses/by/4.0/).


