Article

Nonlinear High-Frequency Micro-Vibration Analysis and Control of a Wind Turbine Blade Based on the Differential Evolution Algorithm

1
College of Mechanical & Electronic Engineering, Shandong University of Science & Technology, Qingdao 266590, China
2
School of Mechanical and Automotive Engineering, Liaocheng University, Liaocheng 252059, China
*
Author to whom correspondence should be addressed.
Aerospace 2025, 12(11), 1023; https://doi.org/10.3390/aerospace12111023
Submission received: 27 September 2025 / Revised: 28 October 2025 / Accepted: 14 November 2025 / Published: 19 November 2025
(This article belongs to the Special Issue Experimental Fluid Dynamics and Fluid-Structure Interactions)

Abstract

Aiming at the nonlinear high-frequency micro-vibration (HFMV) phenomenon that would cause hidden faults of blade fracture failure of a wind turbine, this study calibrated a new type of HFMV aerodynamic force, elaborated on the nonlinear aeroelastic behavior of a 2D airfoil-based structural nonlinear system driven by HFMV aerodynamic forces, and proposed a control plan based on flutter suppression. Based on structural reinforcement based on a nonlinear tuned vibration absorber (NTVA), the flutter wind speed was increased, and artificial structural damping was introduced to analyze the flutter wind speed. The control planning adopted a new unified pitch control system based on the “screw rod–translational slider (nut)” transmission, which was driven by the hydraulic system to drive the ball screw and further drive the slider translation, achieving pitch motion. The control method adopted an optimal trajectory control and the optimal proportional-derivative (PD) controller adjustment technology based on the differential evolution algorithm (DEA). It achieved analysis of flap-wise bending/twist displacement responses, analysis of pitch angle changing, and display of slider driving force. The robustness of the control algorithm was validated by the control results displayed at different wind speeds near the flutter wind speed. The robustness of engineering applications for controlling performance was also validated on the controller hardware-in-the-loop simulation platform through an “object linking and embedding (OLE)” technology based on process control. Finally, the driving performance and wear consumption in engineering applications were discussed. On the basis of ensuring the control effect, the control algorithm was improved, and the fractional-order optimal PD control was adopted, so that the system could stabilize at the “0” consumption state when achieving flutter suppression.

1. Introduction

In order to improve the efficiency of wind power generation, wind power systems are moving towards large-scale development. Designing high-quality large blades is a difficult task, so it is necessary to study the fracture failure problem of large- and medium-sized wind turbine blades. The destructive fracture phenomena of large wind turbine blades and towers that have occurred around the world, especially in coastal areas, in recent years also indicate the necessity of researching this issue [1,2]. So far, most existing research has focused on the stall nonlinear aeroelastic stability problem of blades (i.e., stall flutter problem in coupled vibration under the combined action of structural nonlinearity and aerodynamic nonlinearity), the linear classical flutter problem under high wind speed, and the fracture failure problem caused by vibration under various turbulence and wake effects [3,4,5]. In some areas where wind power is widely used, researchers from the Institute of Engineering Thermophysics have successfully established a systematic analysis scheme for the structural ultimate failure of wind turbines under extreme wind conditions through three-dimensional computational fluid dynamics simulations of complex wind field characteristics and aeroelastic coupling analysis of wind turbine structures. They have also deduced and calculated the blade failure mode and location [6]. The blade host structure they adopted evolved from a basic structure and cross-sectional design to a fusion of multiple materials and fine structures, gradually overcoming the destructive effects of flutter.
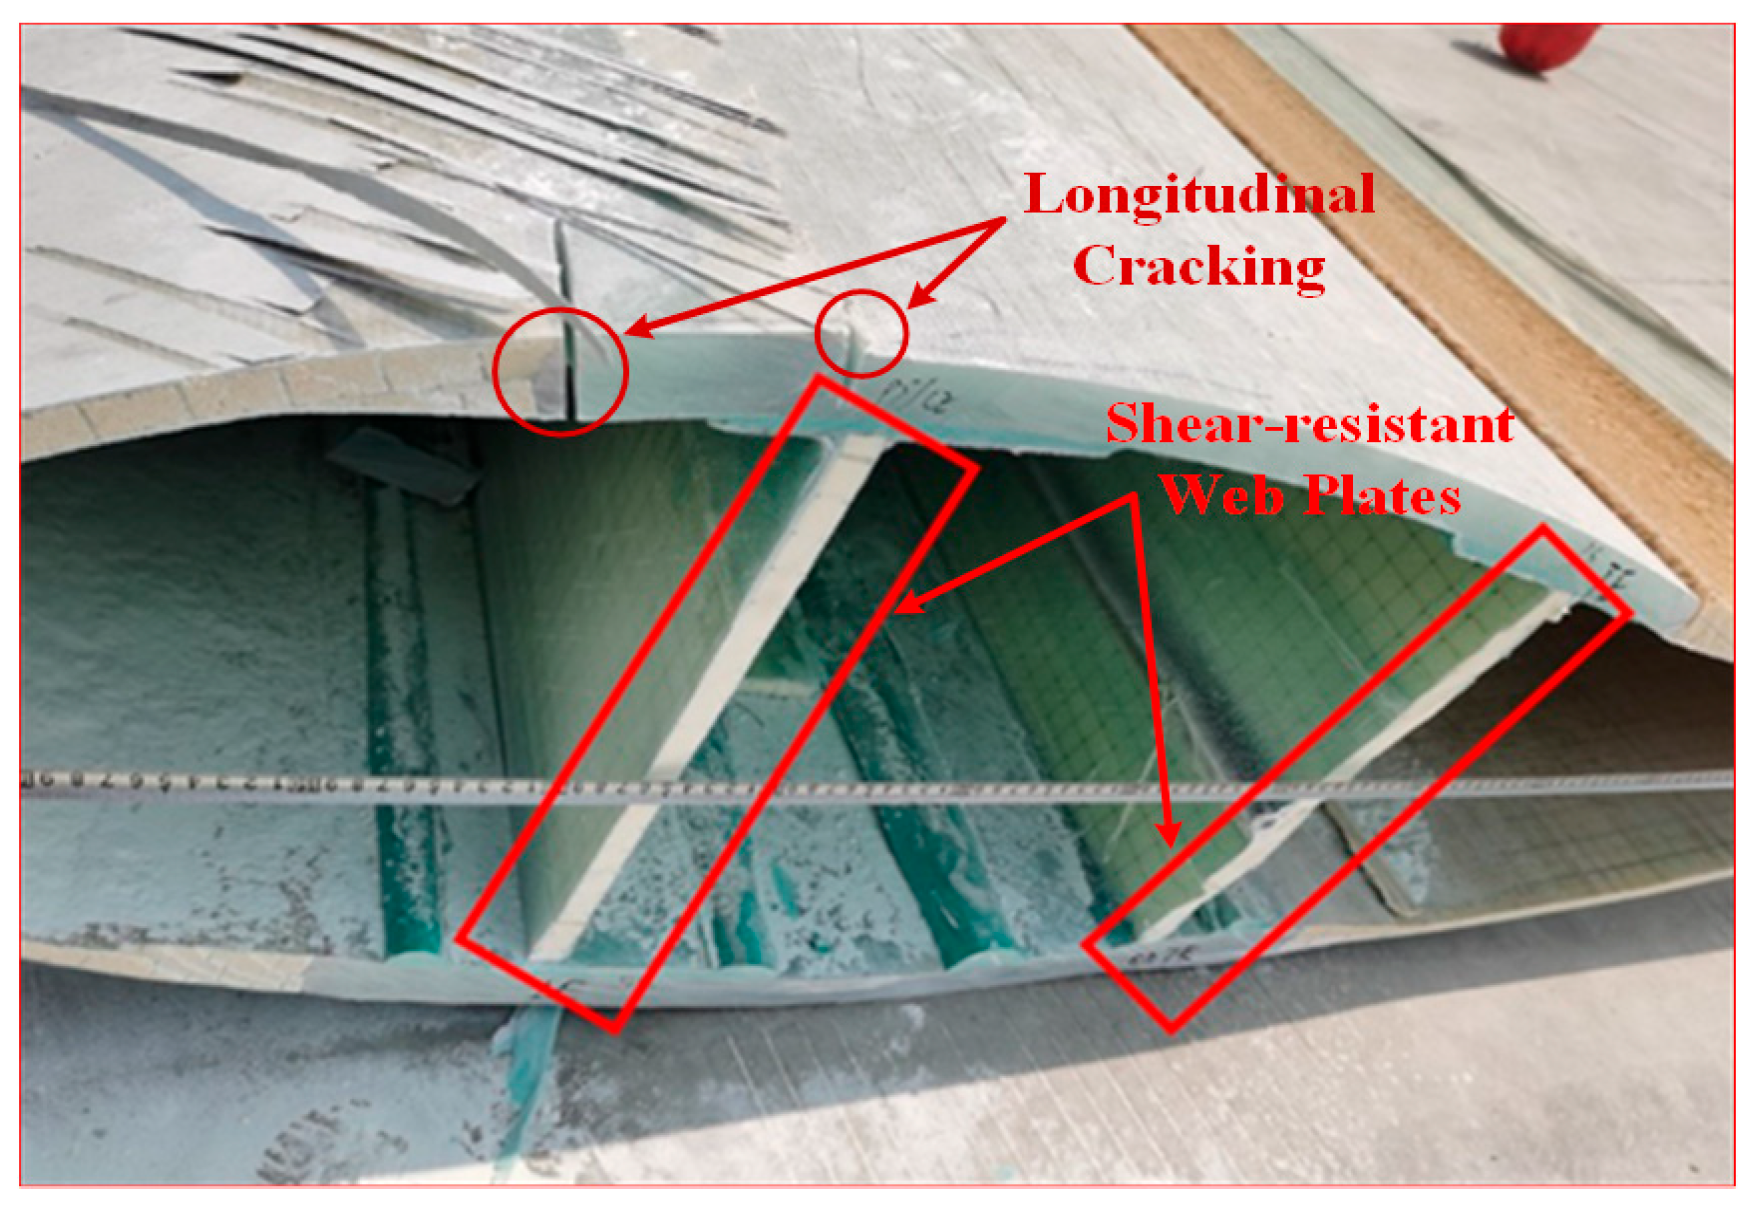
In practice, it has been found that a wind turbine under “normal operating conditions” will form a high-frequency micro-vibration (HFMV) phenomenon when the excitation frequency is close to a certain high-order (3–5 order) natural frequency (especially the natural frequency in the flapping direction) [7]. Due to long-term exposure to nonlinear HFMV conditions, composite blades may develop hidden crack defects (including structural defects such as cracking, delamination, and debonding within the skin, or misalignment of fillers within the skin structure). These hidden defects make the blade body more prone to explicit fracture failure [7] and longitudinal cracking of the matrix main beam under high-speed flutter conditions or extreme working conditions (implicit fracture failure can only be identified when removed for repair, as shown in Figure 1, where the carbon fiber matrix and resin debonding form hidden cracks, ultimately leading to longitudinal cracking of the carbon fiber matrix main beam) [6]. This type of longitudinal cracking of the substrate, which only occurs in tests with higher impact energy, occurs under higher impact energy after the blade experiences long-term HFMV effects, even with shear web support. Even for small wind turbines, this hidden crack defect located near high-stress areas often shortens the lifespan of the blades [8]. Zhang et al. [9] also noted that turbulent winds lead to an increase in aerodynamic loads and equivalent fatigue loads, resulting in low-amplitude high-frequency vibrations in the flapping direction that have more destructive effects. Liu et al. [10] also verified the existence of a low-amplitude high-frequency linear vibration (with flapping bending as the main mode) based on the composite material bending torsion coupling structure blade and proposed a vibration control method. Zhou et al. [11], based on a study of the overall machine mode, confirmed the existence of a small-amplitude and constant-amplitude high-frequency vibration phenomenon that linear vibration blades may have under conventional operating conditions. Linear quadratic control and H∞control were used to suppress linear flutter. Fan et al. [12] used a synchronous switch damping design to implement flutter suppression for HFMV in the flapping direction of composite blades under specific structures.
It should be noted that low-amplitude high-frequency vibration does not necessarily mean instability of the system’s motion state. On the contrary, in a certain sense, it can be regarded as a stable state, especially in the vibration of ecological organic airfoils and biomimetic airfoils. Due to its self-adaptive compensation function, it is precisely a sign of system stability [13]. However, in the physical structure of non-organic airfoils, even under “normal operating conditions”, long-term exposure to HFMV may result in hidden fatigue failures.
Therefore, this article focuses on the nonlinear HFMV phenomenon that has been rarely studied, starting directly from structural nonlinearity, analyzing HFMV based on 2D airfoils, and proposing control plans to achieve HFMV flutter suppression and eliminate hidden faults caused by fracture failure. The aerodynamic model is a newly calibrated HFMV aerodynamic model that matches bending/twist motion. At the same time, the nonlinear tuned vibration absorber (NTVA) was introduced to enhance the structure and increase the flutter wind speed, and artificial structural damping was introduced to analyze the flutter wind velocity. The control planning adopts a new type of pitch control system structure driven by a “screw rod–translational slider (nut)” structure, and the control method adopts optimal trajectory control based on the differential evolution algorithm (DEA) and optimal proportional-derivative (PD) controller [14] adjustment technology. The variable pitch transmission accuracy and sensitivity of the ball screw structure are high, making it easy to adjust and complement HFMV suppression. At the same time, it has high transmission efficiency and is also suitable for conventional power-controlled pitch movements. The robustness of control algorithms and the engineering application robustness of control performance were also tested separately. Finally, improvement measures for the control algorithm were discussed from the perspectives of energy and wear.

2. Structural Modeling and Motion Equations

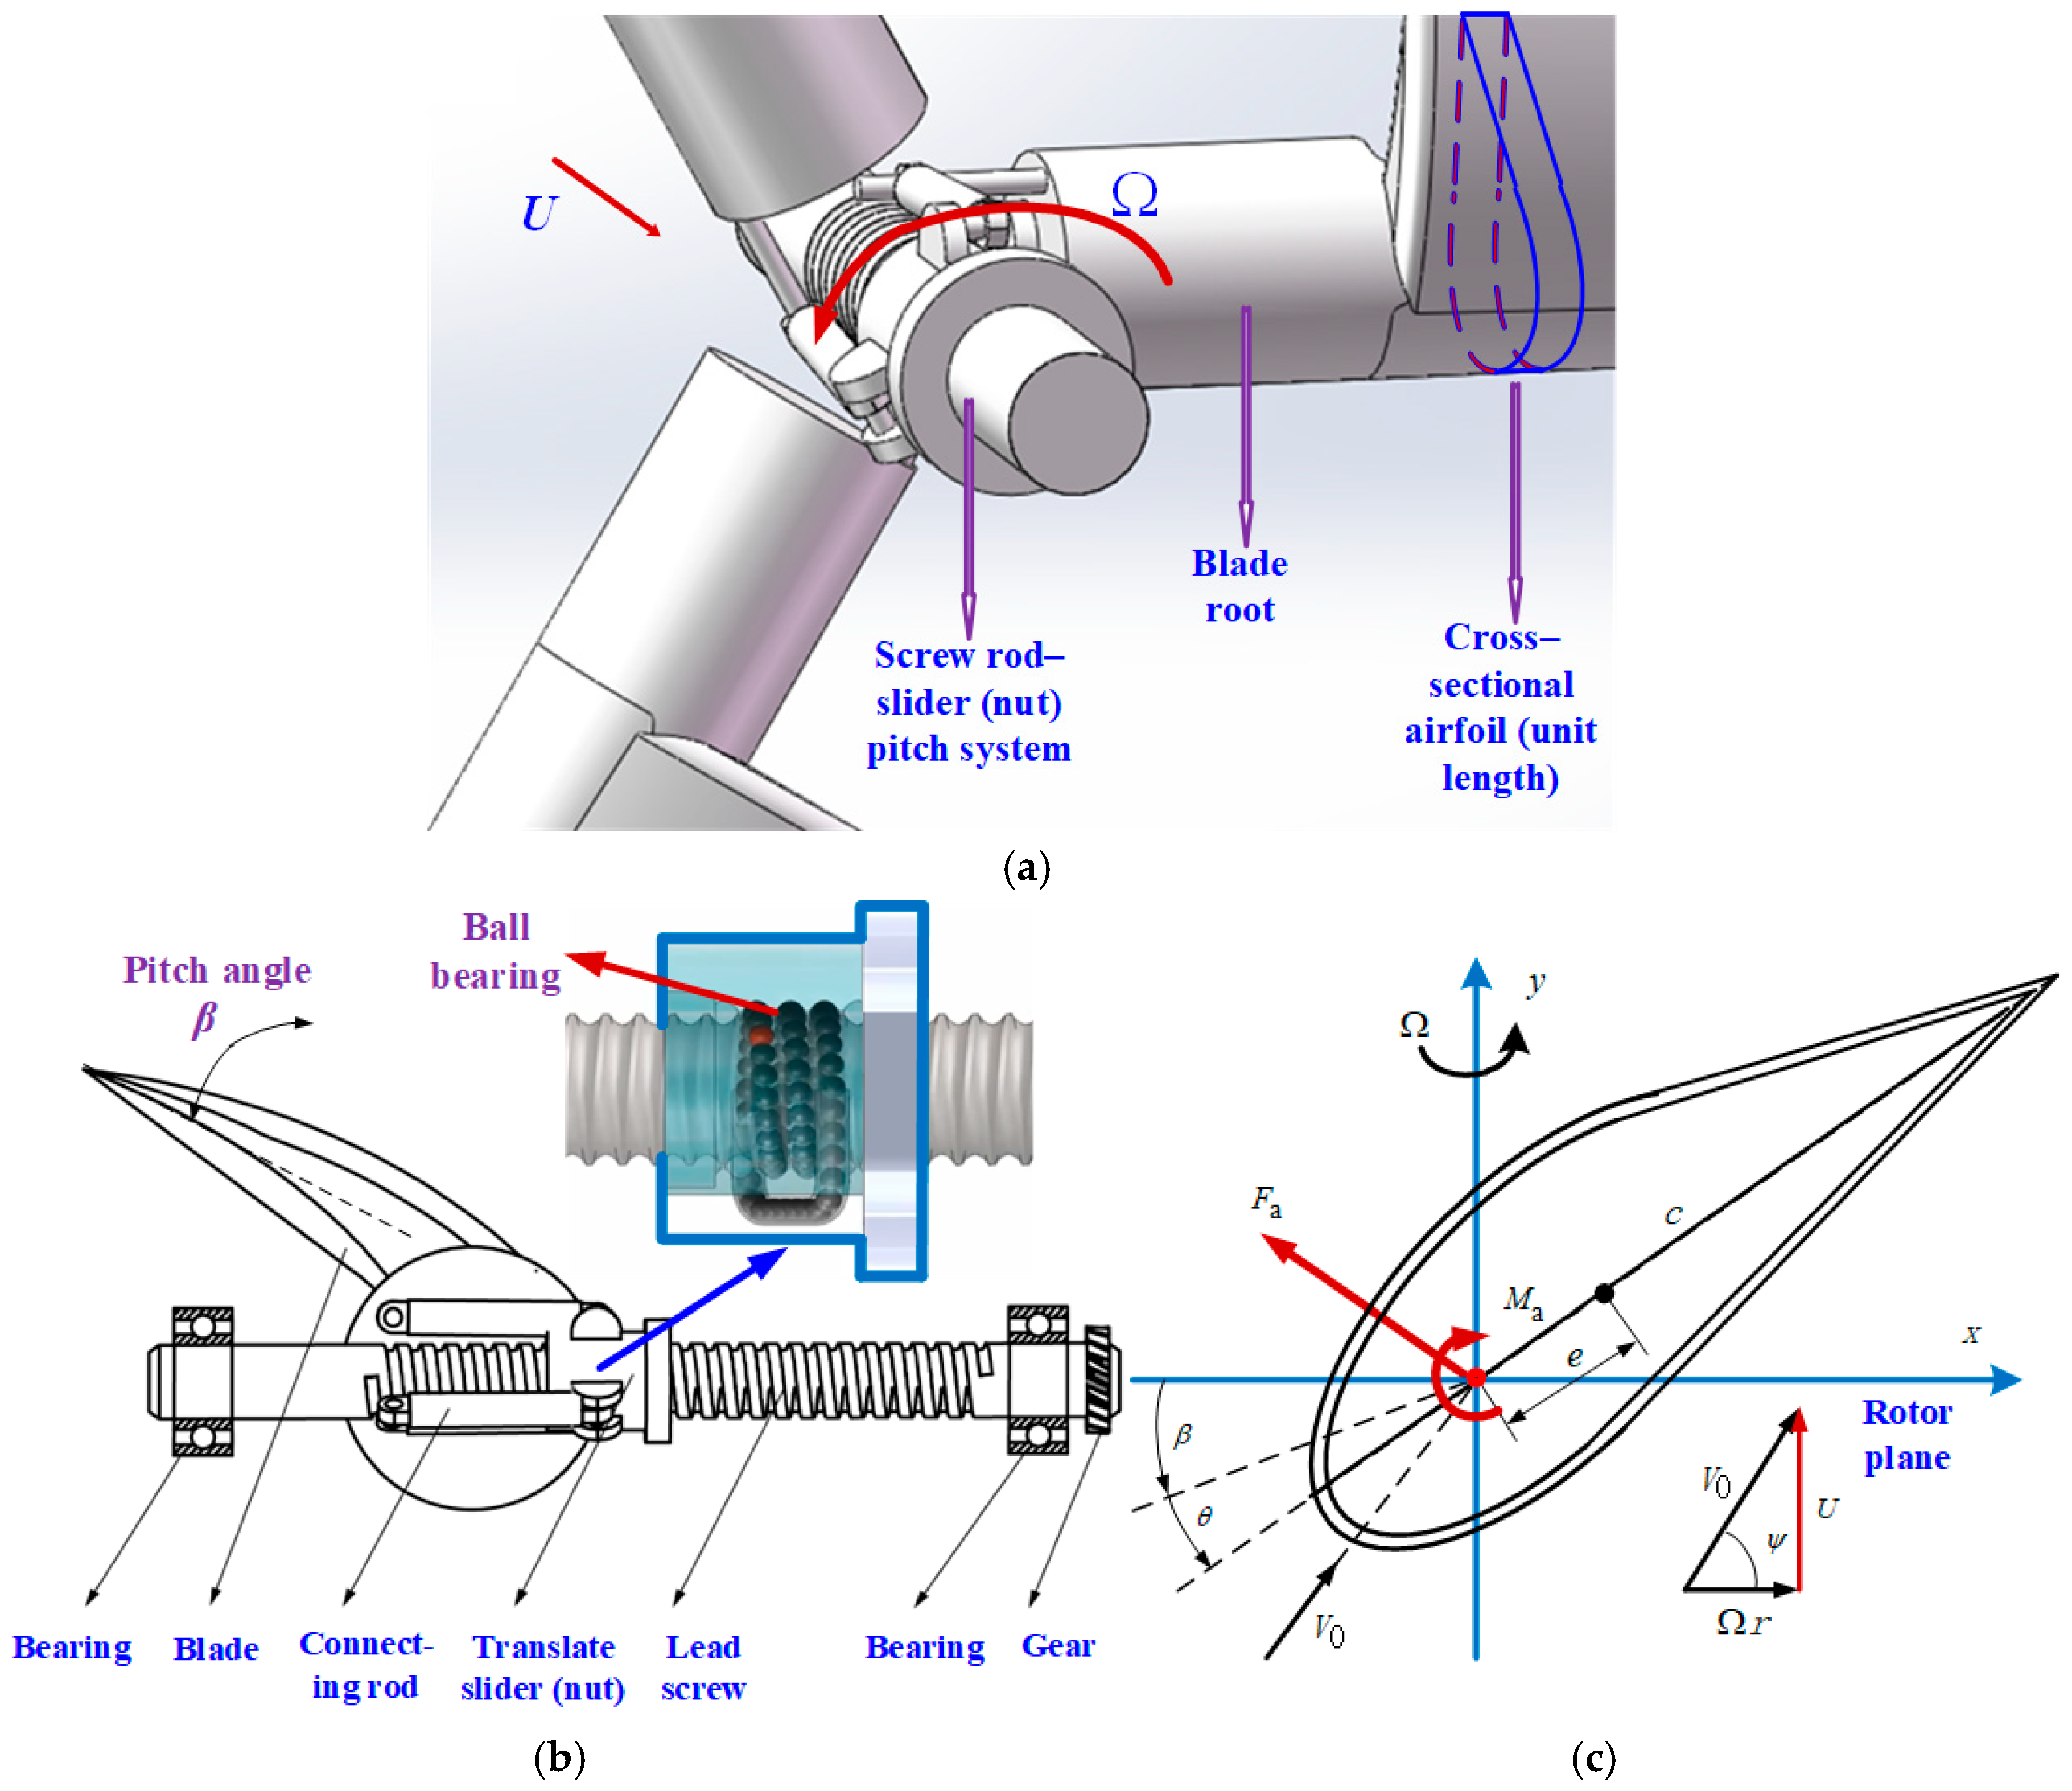
Figure 2a,b show the structural modeling of a three-bladed system driven by a screw–nut pitch structure. Considering the conventional operating conditions, high-frequency micro-amplitude flutter exhibits consistency in the three-bladed blades; therefore, a new unified pitch control system is adopted to achieve aeroelastic control. Figure 2c shows the cross-sectional airfoil parameters and HFMV aerodynamic forces.

2.1. Structural Principle

The working process of the pitch control system in Figure 2 is as follows: The screw and the driving gear are fixed in the circumferential direction through a flat head key, and the ball screw transmission process restricts the axial movement of the screw and the circumferential rotation of the translation nut. The two ends of the connecting rod are connected by a rotating pair, and the blade root rocker is rigidly connected to the blade. When the control center outputs the driving command signal, this design is aimed at large (medium) wind turbine blades. A rack and pinion piston cylinder is used to drive the gear, which further drives the screw to rotate. Its forward and reverse directions precisely achieve the forward and reverse strokes of the translation nut. During this process, the translation nut pulls the three blades to rotate together through the connecting rod, achieving the control effect of synchronously rotating the three blades of the wind turbine with the same pitch angle under the same driving. If targeting small- and medium-sized blades, a motor can be used to drive gears to achieve screw–nut pitch motion. At this time, based on the transmission ratio of the screw ball, the numerical calculation process of converting the motor rotation angle and pitch angle can be achieved. Alternatively, three motors can be used to drive three lead screws to achieve independent pitch control, making this pitch control system universal.
The meaning of the physical quantities in Figure 2 is as follows: Assuming that the distance between the cross-sectional position of a 2D airfoil with a unit length and the blade root length is r (m), and y (m) is the displacement in the flapping direction, x (m) is the lead-lag direction of blade oscillation; θ (rad) is the elastic twist displacement; β (rad) is the external pitch angle; U (m·s−1) is the wind speed; ψ (rad) is the inflow angle; c (m) is the chord length, and the half-chord length is b = c / 2 (m); Ω (rad·s−1) is the wind turbine speed; V 0 (m·s−1) is the inflow wind speed; e is the distance from the aerodynamic center to the elastic axis, and e (m); h (m) is the displacement of the nut; and F a (N·m−1) and M a (N·m) represent aerodynamic lift and aerodynamic torque per unit-length of wing profile, respectively.
This article mainly explores the methods and effects of flutter suppression. Therefore, a qualitative analysis method is adopted to simplify the structural modeling. The 2D airfoil section and nut with unit length are taken as the overall research objects, and the mass of the connecting rod in the pitch mechanism is ignored. The force of the interaction between the connecting rods is the internal force of the system, so there is a subsequent analysis of the motion equations.

2.2. Equations of Motions

Considering the HFMV effect of 2D airfoils, the nonlinear HFMV displacements are mainly manifested as flap-wise bending and twist coupling displacements [10]. Based on the Lagrange method, the bending–twist vibration equations for analyzing the aerodynamic load control effect can be obtained. The coordinate system of the equation can be described as { y , θ , h , β }, and the kinetic energy T and potential energy V of the system are derived as follows:
T = 1 2 I CG ( θ ˙ + β ˙ ) 2 + 1 2 M b h ˙ 2 + 1 2 ρ b [ y ˙ cos β + e ( θ ˙ + β ˙ ) sin ( θ + β ) β ˙ y sin β + h ˙ ] 2 1 2 ρ b [ y ˙ sin β + e ( θ ˙ + β ˙ ) cos ( θ + β ) + β ˙ y cos β ] 2 ,
V = 1 2 [ ω y 2 ρ b y 2 + ω θ 2 ( I CG + e 2 ρ b ) θ 2 ]
where I CG = 10 m∙kg is the moment of inertia and ω y = k y / ρ b and ω θ = k θ / ρ b are the natural angular frequencies in the two directions, respectively. Therefore, the section can be assumed to be suspended by linear springs k y and k θ . ρ b = 10 kg∙m−1 is the density of cross-sectional elements; M b = 30 kg∙m−1 is the equivalent slider mass relative to the cross-sectional element.
Lagrange analysis is applied to Formulas (1) and (2), ignoring nonlinear components above third order, to obtain the nonlinear motion equations:
y ¨ + 2 ξ y ω y y ˙ + ω y 2 y + h ¨ cos β + e ( θ ¨ + β ¨ ) sin θ + e ( θ ˙ + β ˙ ) 2 cos θ β ˙ 2 y = ρ b 1 cos ψ F a
θ ¨ + 2 ξ θ ω θ θ ˙ + ω θ 2 θ + β ¨ + h ¨ r E 2 sin ( θ + β ) + [ ( I CG + e 2 ρ b ) / ( I CG e 1 ) ] 1 ( y ¨ sin θ β ˙ 2 sin θ y + β ¨ y cos θ ) = 1 / ( I CG + e 2 ρ b ) M a
M b h ¨ ρ b ( 2 ξ y ω y y ˙ + ω y 2 y ) cos β = F pd
where ξ y and ξ θ are the damping ratios in the two directions, respectively; F pd is the driving force exerted by the screw on the nut; and r E 2 = ( I CG + e 2 ρ b ) / ( I CG e 1 ) is the equivalent elastic torsion radius.
When the airfoil is only subjected to micro-vibrations, considering structural nonlinearity, external pitch variation, and elastic torsion, HFMV forces not only include linear aerodynamic forces and quasi-steady state components but also inevitably have low-order nonlinear components. Reference [15] precisely discusses the nonlinear aerodynamic forces that include not only these three parts but also low-frequency effects, high-order nonlinearity, and other directional displacement effects and applies them to 2D airfoil analysis. Therefore, by ignoring the low-frequency effects and nonlinearity above third order in the aerodynamic forces of reference [15], and ignoring displacement effects other than bending–twist coupling, the HFMV aerodynamic forces applicable in the present study can be calibrated. Assuming the air density is ρ a , the expressions for aerodynamic forces F a and M a are:
F a = 2 π ρ a b V 0 [ ( b 2 V 0 ) y ¨ ( e b 2 V 0 ) ( θ ¨ + β ¨ ) + y ˙ + ( 1 e ) ( θ ˙ + β ˙ ) ]
M a = 2 π ρ a b V 0 [ ( e b 2 V 0 ) y ¨ b 2 V 0 ( 1 8 + e 2 ) ( θ ¨ + β ¨ ) + ( 1 2 + e ) y ˙ + b ( 1 2 e ) ( θ ˙ + β ˙ ) ]
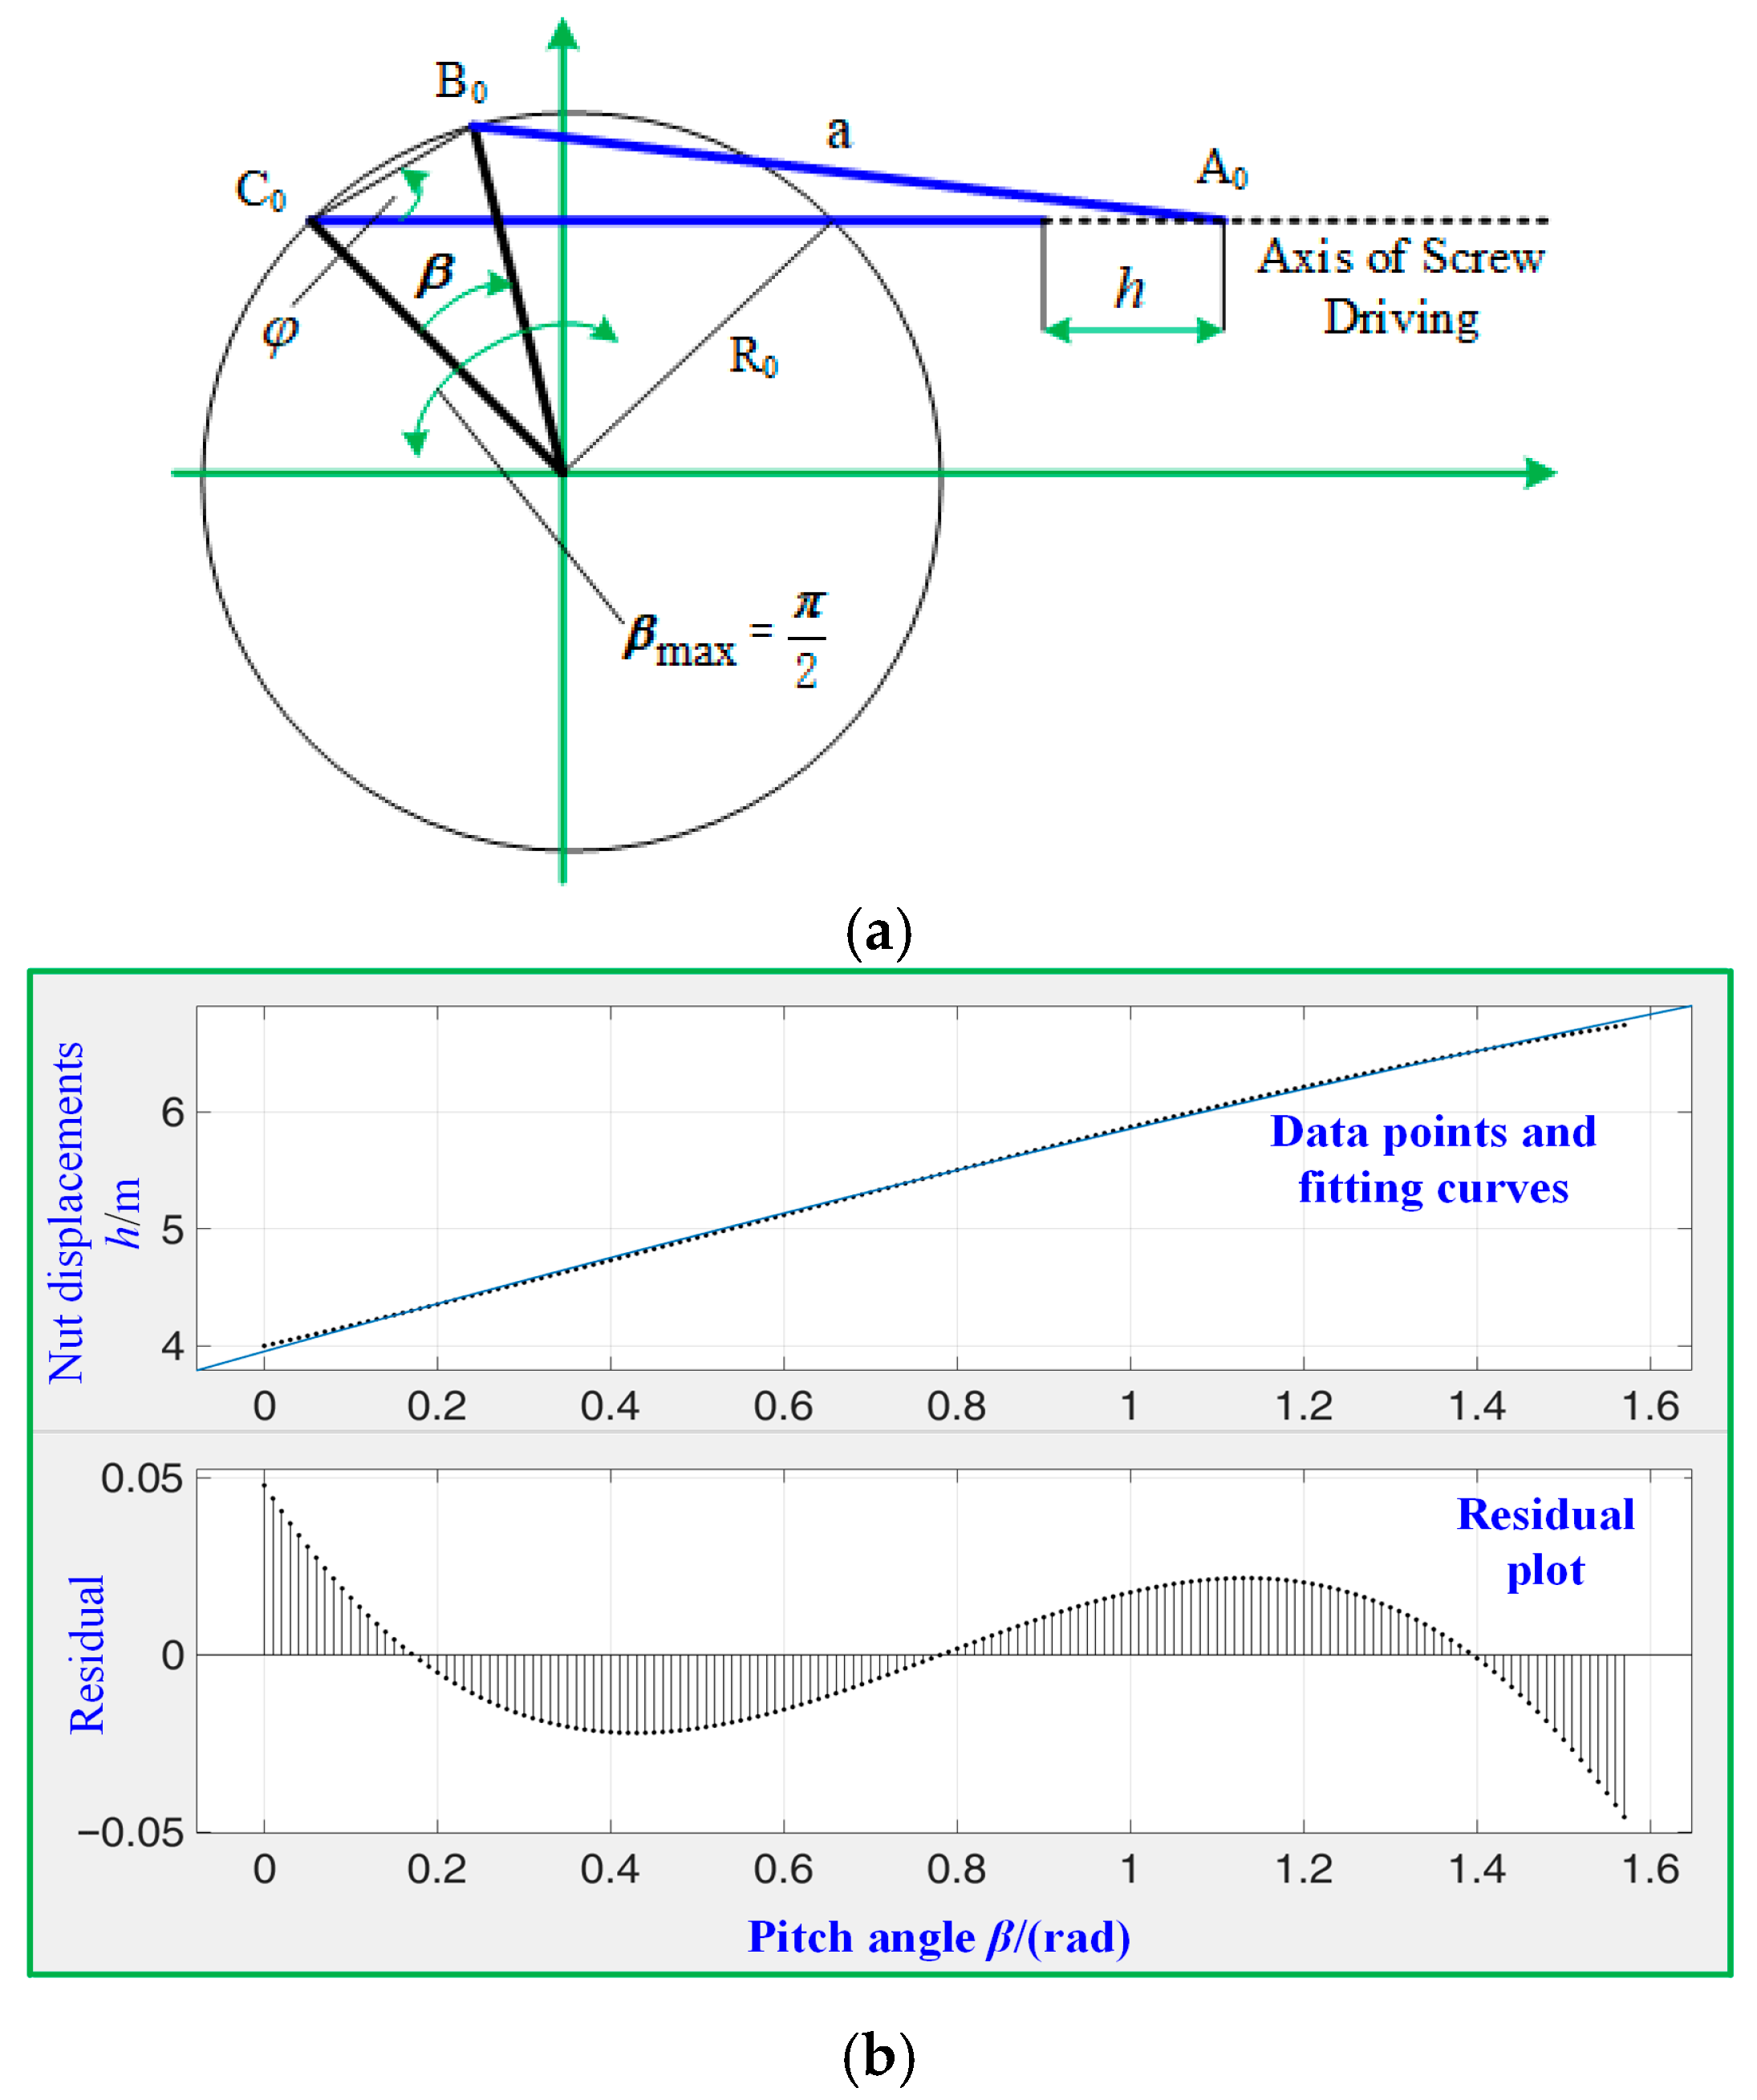
In Formulas (1)–(7), the relationship between the real-time pitch angle β and the translational displacement h of the nut can be described as a “quasi-four-bar mechanism”, with its core parameters being the distance R 0 between the blade root rocker and the center of the blade root bottom, and the length a of the connecting rod, as shown in Figure 3a. Assuming that β varies within the range of [0 π/2], with a design of R 0 = 0.8 m and a = 2 m, a nonlinear relationship between the pitch angle and the translational displacement of the nut can be obtained through trigonometric calculations. In A 0 B 0 C 0 , according to the Cosine Theorem, there exists:
cos φ = ( L B 0 C 0 2 + L A 0 C 0 2 L A 0 B 0 2 ) / ( 2 L B 0 C 0 L A 0 C 0 )
where L A 0 C 0 = a + h , L B 0 C 0 = 2 R 0 sin ( β / 2 ) , and φ = ( π β ) / 2 ( π β m a x ) / 2 . Hence, there exists:
h 2 h [ 2 a + 4 R 0 cos ( π 4 β 2 ) sin ( β 2 ) ] = 4 a R 0 cos ( π 4 β 2 ) sin ( β 2 ) [ 2 R 0 sin ( β 2 ) ] 2
Then, the data is fitted to approximate a quadratic polynomial relationship within the range of [0 π/2]: h = −0.1969 β 2 + 2.073 β + 3.952. Herein, the fitting confidence interval is 95%, the adjusted R-squared value of the goodness of fit is 0.995, the root mean square value is 0.01859, and the residual range fluctuates, as shown in Figure 3b, achieving excellent fitting effect.
Substituting h into Formulas (3)–(5) and setting the vector variable q = { y , θ , β } T , the nonlinear differential equation of the system can be obtained:
M ( q , q ˙ ) q ¨ + C ( q , q ˙ ) q ˙ + K ( q , q ˙ ) q + G ( q , q ˙ ) = [ 0 0 1 ] T F pd = τ

3. Structural Reinforcement and Flutter Wind Speed

HFMV is bound to occur near the flutter wind speed. If the flutter wind speed is large enough, HFMV will not occur under normal operating conditions. Therefore, increasing the flutter wind speed itself can suppress the HFMV phenomenon under normal operating conditions, which also makes the subsequent vibration control more meaningful for engineering applications.

3.1. Structural Enhancement Based on the NTVA

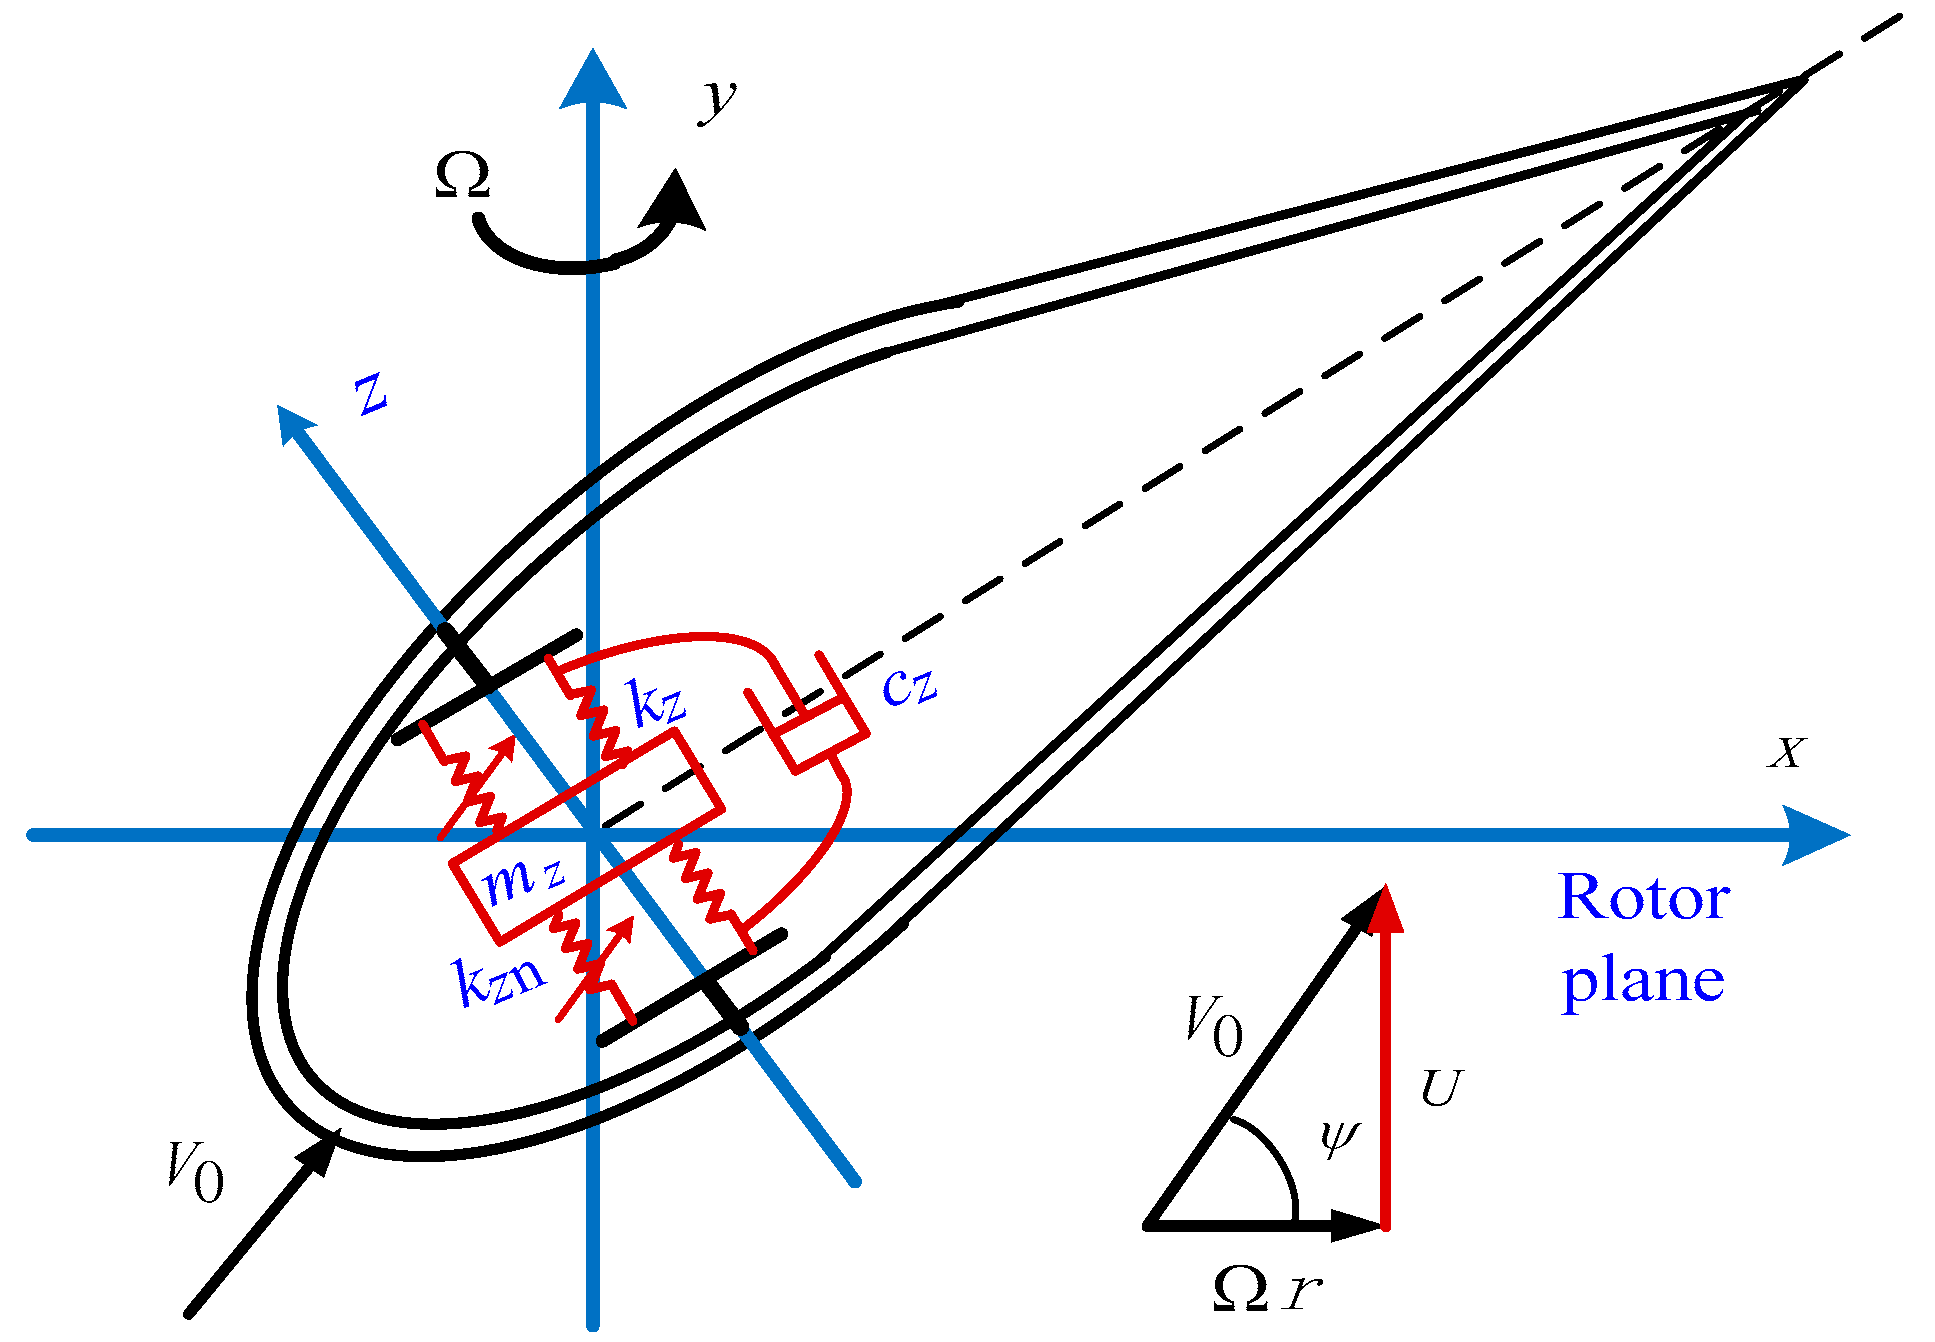
A clear and effective NTVA structure for structural reinforcement to increase flutter wind speed was designed in reference [16]. In the present study, the NTVA structure was arranged in the internal cavity of a thin-walled airfoil, as shown in Figure 4. Its parameters include linear stiffness k z , cubic nonlinear stiffness k z n , damping c z , and mass m z , where k z = m z ( ω z ) 2 , c z = ξ z m z ω θ , and k z n = ξ z m z ( ω θ / b ) 2 . Specifically, in reference [16], m z does not involve vibrations along the chordal direction. In order to fully match the operating conditions of reference [16] and reduce rotational effects, we try to make m z as small as possible; therefore, herein, m z = 0.1 ρ b .
According to reference [16], based on Formulas (3) and (4), the nonlinear motion equations of the system with an integrated NTVA structure are:
y ¨ + 2 ξ y ω y y ˙ + ω y 2 y + h ¨ cos β + e ( θ ¨ + β ¨ ) sin θ + e ( θ ˙ + β ˙ ) 2 cos θ β ˙ 2 y + ρ b 1 c z ( e θ ˙ + z ˙ + y ˙ ) + ρ b 1 k z ( e θ + z + y ) + ρ b 1 k z n ( e θ + z + y ) 3 = ρ b 1 cos ψ F a ,
θ ¨ + 2 ξ θ ω θ θ ˙ + ω θ 2 θ + β ¨ + h ¨ r E 2 sin ( θ + β ) + [ ( I CG + e 2 ρ b ) / ( I CG e 1 ) ] 1 ( y ¨ sin θ β ˙ 2 sin θ y + β ¨ y cos θ ) + ( I CG + e 2 ρ b ) 1 [ c z e ( e θ ˙ + z ˙ + y ˙ ) + k z e ( e θ + z + y ) + k z n e ( e θ + z + y ) 3 ] = 1 / ( I CG + e 2 ρ b ) M a
m z z ¨ + c z ( e θ ˙ + z ˙ + y ˙ ) + k z ( e θ + z + y ) + k z n ( e θ + z + y ) 3 = 0
Therefore, the new system equation is composed of Equations (11)–(13) and (5). Let the new vector variable be q = { y , θ , z , β } T , and the updated system of nonlinear differential equations can be obtained:
M ( q , q ˙ ) q ¨ + C ( q , q ˙ ) q ˙ + K ( q , q ˙ ) q + G ( q , q ˙ ) = [ 0 0 0 1 ] T F pd = τ

3.2. Calculation of Flutter Wind Speed Based on Artificial Structural Damping

The solution of flutter wind speed is based on a linear system: let F pd = 0 (without variable pitch driving) in Equation (14), and assume q = q 0 + ε q 1 , where ε is a small positive number; specifically, we take:
sin θ = sin θ 0 + ε cos ( θ 0 θ 1 ) ; cos θ = cos θ 0 ε sin ( θ 0 θ 1 )
Substituting (15) into system (14) and balancing the two sides of the equation with ε 0 and ε 1 , respectively, the algebraic equation system F q 0 = 0 and the linear perturbation equation system for the equilibrium position can be obtained:
M 0 q ¨ 1 + C 0 q ˙ 1 + K 0 q 1 = 0
In reference [17], a solution process for flutter wind speed based on artificial structural damping was introduced. Removing the damping term from system (16) and adding artificial structural damping, Equation (16) becomes:
M 0 q ¨ 1 + K 0 q 1 = D q
where D q is the damping force of the dissipative structure, described as:
D q = D ¯ q e i ω t = f ( g q , q ¯ , ω )
where g q is the damping coefficient of the artificial structure with degrees of freedom q .
By solving the generalized eigenvalues of (17), the damping coefficient g q can be obtained. For simplicity, Appendix A only shows the process of solving g q without the NTVA. Figure 5 shows the damping coefficients g y and g θ of flap-wise and twisting motions before and after NTVA enhancement, respectively, and also indicates the numerical value of the flutter wind speed ( g = 0 corresponds to the wind speed value). From (a), it can be seen that without the NTVA, the master mode during flutter is the torsional mode, and the flutter wind speed is approximately U = 6 m·s−1. From (b), it can be seen that when using NTVA enhancement, the main mode of flutter becomes the flap-wise mode, and the flutter wind speed increases, approximately U = 8 m·s−1. On the one hand, the flapping displacement of the main mode is easier to measure, which facilitates the construction of PD controllers for subsequent position compensation and engineering applications. Simultaneously, flapping as the main mode is more conducive to suppressing flutter. On the other hand, the effective increase in flutter wind speed has already played a role in suppressing HFMV. Therefore, in the following sections, we will further realize the flutter suppression effect based on intelligent control using U = 8 m·s−1. In addition, regarding the damping coefficient of the twist variable in Figure 5b, there are two special values around U = 2.5 m·s−1, which is the reason for the occurrence of singular values when solving eigenvalues. This could be a problem with the system itself, or it could be a problem with the solving algorithm. However, other damping coefficients show relatively small negative values, so they are not shown together in the figure. A smaller negative value also means that torsion will not exhibit resonance, and the torsion mode is a subordinate mode.

4. Optimal Control Based on the DEA

In system Equation (14), each matrix is a variable, and the variable matrices M , C , K , and G contain the first derivative of q , thus belonging to a typical nonlinear system. Meanwhile, due to the existence of [ 0   0   0   1 ] T , Formula (14) belongs to an underactuated system. Underactuated nonlinear systems often analyze stability through linearization, and directly solving nonlinear responses is difficult. Currently, adaptive inversion control [14] can be used to solve nonlinear responses and control the stability of the system. However, the design of the inversion algorithm control law and the selection of virtual control items are difficult, and the stability analysis process is complex. Therefore, in this design, the driving force F pd is designed as an approximately adjustable PD controller, and a differential evolution-based optimal trajectory control [18] method and a PD parameter optimization tuning method are used to achieve stability control of the system.

4.1. Optimal Trajectory Control

The purpose of micro-amplitude high-frequency control is to make the amplitude smaller and the frequency lower while trying to make the state variable vector converge to a fixed value as much as possible. For example, the target value is set as q d = [ 0   0   0   1 ] T . Through DEA, the optimal planning is carried out towards the target value. On the basis of ensuring that the system does not deviate from the target value, the PD control method is adopted to track the optimal trajectory and minimize energy consumption throughout the entire fluctuation process.
The optimization of the optimal trajectory is based on cycloid motion with a period of T E . Assuming the time to reach a steady state is 4 T E , due to energy conservation, the objective functions of the last three variables { θ , z , β } can be selected as:
J i = ω i 0 4 T E τ i q ˙ i d t + ( 1 ω i ) 0 4 T E Δ i ( t ) d t
where i = 2 ,   3 ,   4 . ω i   is the weight, τ i is the control input signal, and i is the difference between the actual tracking trajectory and the target value: Δ i ( t ) = q op i t j q r i ( t j ) ; herein, j = 1 ,   2 ,   3 , ,   2 n 1 . The DEA requires discretization of the cycloid, so the sampling interval is T E / ( 2 n ) , t j = j T E / ( 2 n ) . The construction of the objective function J 1 utilizes the indicators in Section 4.2. Therefore, the overall objective function J can be set as:
J = J 1 + J 2 + J 3 + J 4
The DEA requires experience to set appropriate algorithm parameter values. This design includes a maximum iteration number of 50, a population size of 50, and a search space dimension of 4 interpolation points. We use the DEA to optimize the objective function (20), to minimize it, and obtain the optimal trajectory. At the same time, we use the linear adjustment mutation method [18] to determine other parameter factors, including mutation factor F R and crossover factor C R . To obtain the continuous optimal trajectory, cubic spline interpolation is used for trajectory planning, and the vertical coordinate values of the interpolation points are continuously optimized through the DEA. The continuous function obtained by interpolation is used as the optimal trajectory for variable tracking. Since τ i depends on F pd , it is only necessary to set F pd as an independent PD control law.
The optimal discrete trajectory of the i -th variable is represented as:
q ¯ op i = [ q ¯ op i , 0 , q ¯ op i , 1 , . . . , q ¯ op i , 2 n ]
where the boundary condition for interpolating the i -th variable is q op i ( 0 ) = q ¯ op i , 0 = q 0 i , q op i ( T E ) = q ¯ op i , 2 n , q ˙ op i 0 = q ¯ ˙ op i , 0 = q ˙ 0 i = 0 , and q ˙ op i ( T E ) = q ¯ ˙ op i , 2 n = 0 . Therefore, there are interpolation nodes:
q op i ( t j ) = q ¯ op i , j , t j = j T E / 2 / n
The steps to achieve trajectory optimization and parameter optimization using differential evolution are as follows:
(1)
Randomly generate an initial population P ( 0 ) consisting of 50 individuals;
(2)
Initialize the approximate range of each parameter and set a maximum iteration number of 50;
(3)
Decode individuals in the population into corresponding parameter values and use these parameters to solve the cost function (Fitness J );
(4)
Use differential evolution operators (mutation, crossover) to operate on population P ( t ) and generate the next generation population P ( t + 1 ) ;
(5)
Repeat steps three and four until the trajectory (parameter) fluctuates and converges or reaches the predetermined target;
(6)
Finally, the above process can be optionally repeated, taking into account control accuracy and calculation speed, to determine the most suitable maximum iteration number for engineering applications.

4.2. Optimization Tuning of PD Parameters

Due to the cooperation of the global difference algorithm, it can effectively overcome the local convergence defects in conventional optimization methods. This algorithm is also applied to the tuning process of PD parameters K p and K d . The PD controller based on position compensation regarding flap-wise displacement can be described as:
F pd = K p y + K d ( d y / d t )
Similarly, using differential evolution to optimize PD parameters, the previous optimization steps are still followed, but the new cost function is:
J 1 = ω i 0 4 T E τ i q ˙ i d t + ( 1 ω i ) 0 4 T E u 2 ( t ) Δ i ( t ) d t
where u ( t ) is the controller output. Adding the squared term of the control input to the objective function can prevent excessive demand for control energy.
In addition, as the nonlinear system belongs to a strongly rigid system [14], in order to accelerate the simulation speed, the DAESSC solver in MATLAB (R2022b, MathWorks, Natick, MA, USA) was used to solve the nonlinear system equations and obtain acceleration performance during numerical solving. At the same time, because flap-wise waving is the primary mode, when the PD adjustment variable is selected as waving displacement, a sensing unit can be set at the cross-sectional position in engineering applications. A high-frequency pickup can be used to detect the “high-frequency micro-amplitude” acceleration signal, and after 1–2 integrations, the velocity and displacement signals can be obtained separately, thus using Equation (23) to achieve stability control.

5. Control Results and Discussion

Take the basic structural parameters and motion parameters as follows: r = 2 m, c = 1 m, ω y = 8 rad·s−1, ω θ = 2π rad·s−1, ξ y = 0.6, ξ θ = 0.1, ξ z = 0.85, and U = 8 m∙s−1. Taking the differential evolution weight ω i = 0.3, two optimization factors F R = 0.51 and C R = 0.88 are obtained from the trajectory optimization mentioned above. When optimized by the PD controller, the tuning parameter values K p = 0.4 and K d = 1.5 were obtained. The vibration control performance will be discussed from three aspects: vibration amplitude, vibration frequency, and time-domain convergence stability. The specific symbols and parameter values are shown in Table 1.

5.1. Control Result Analysis

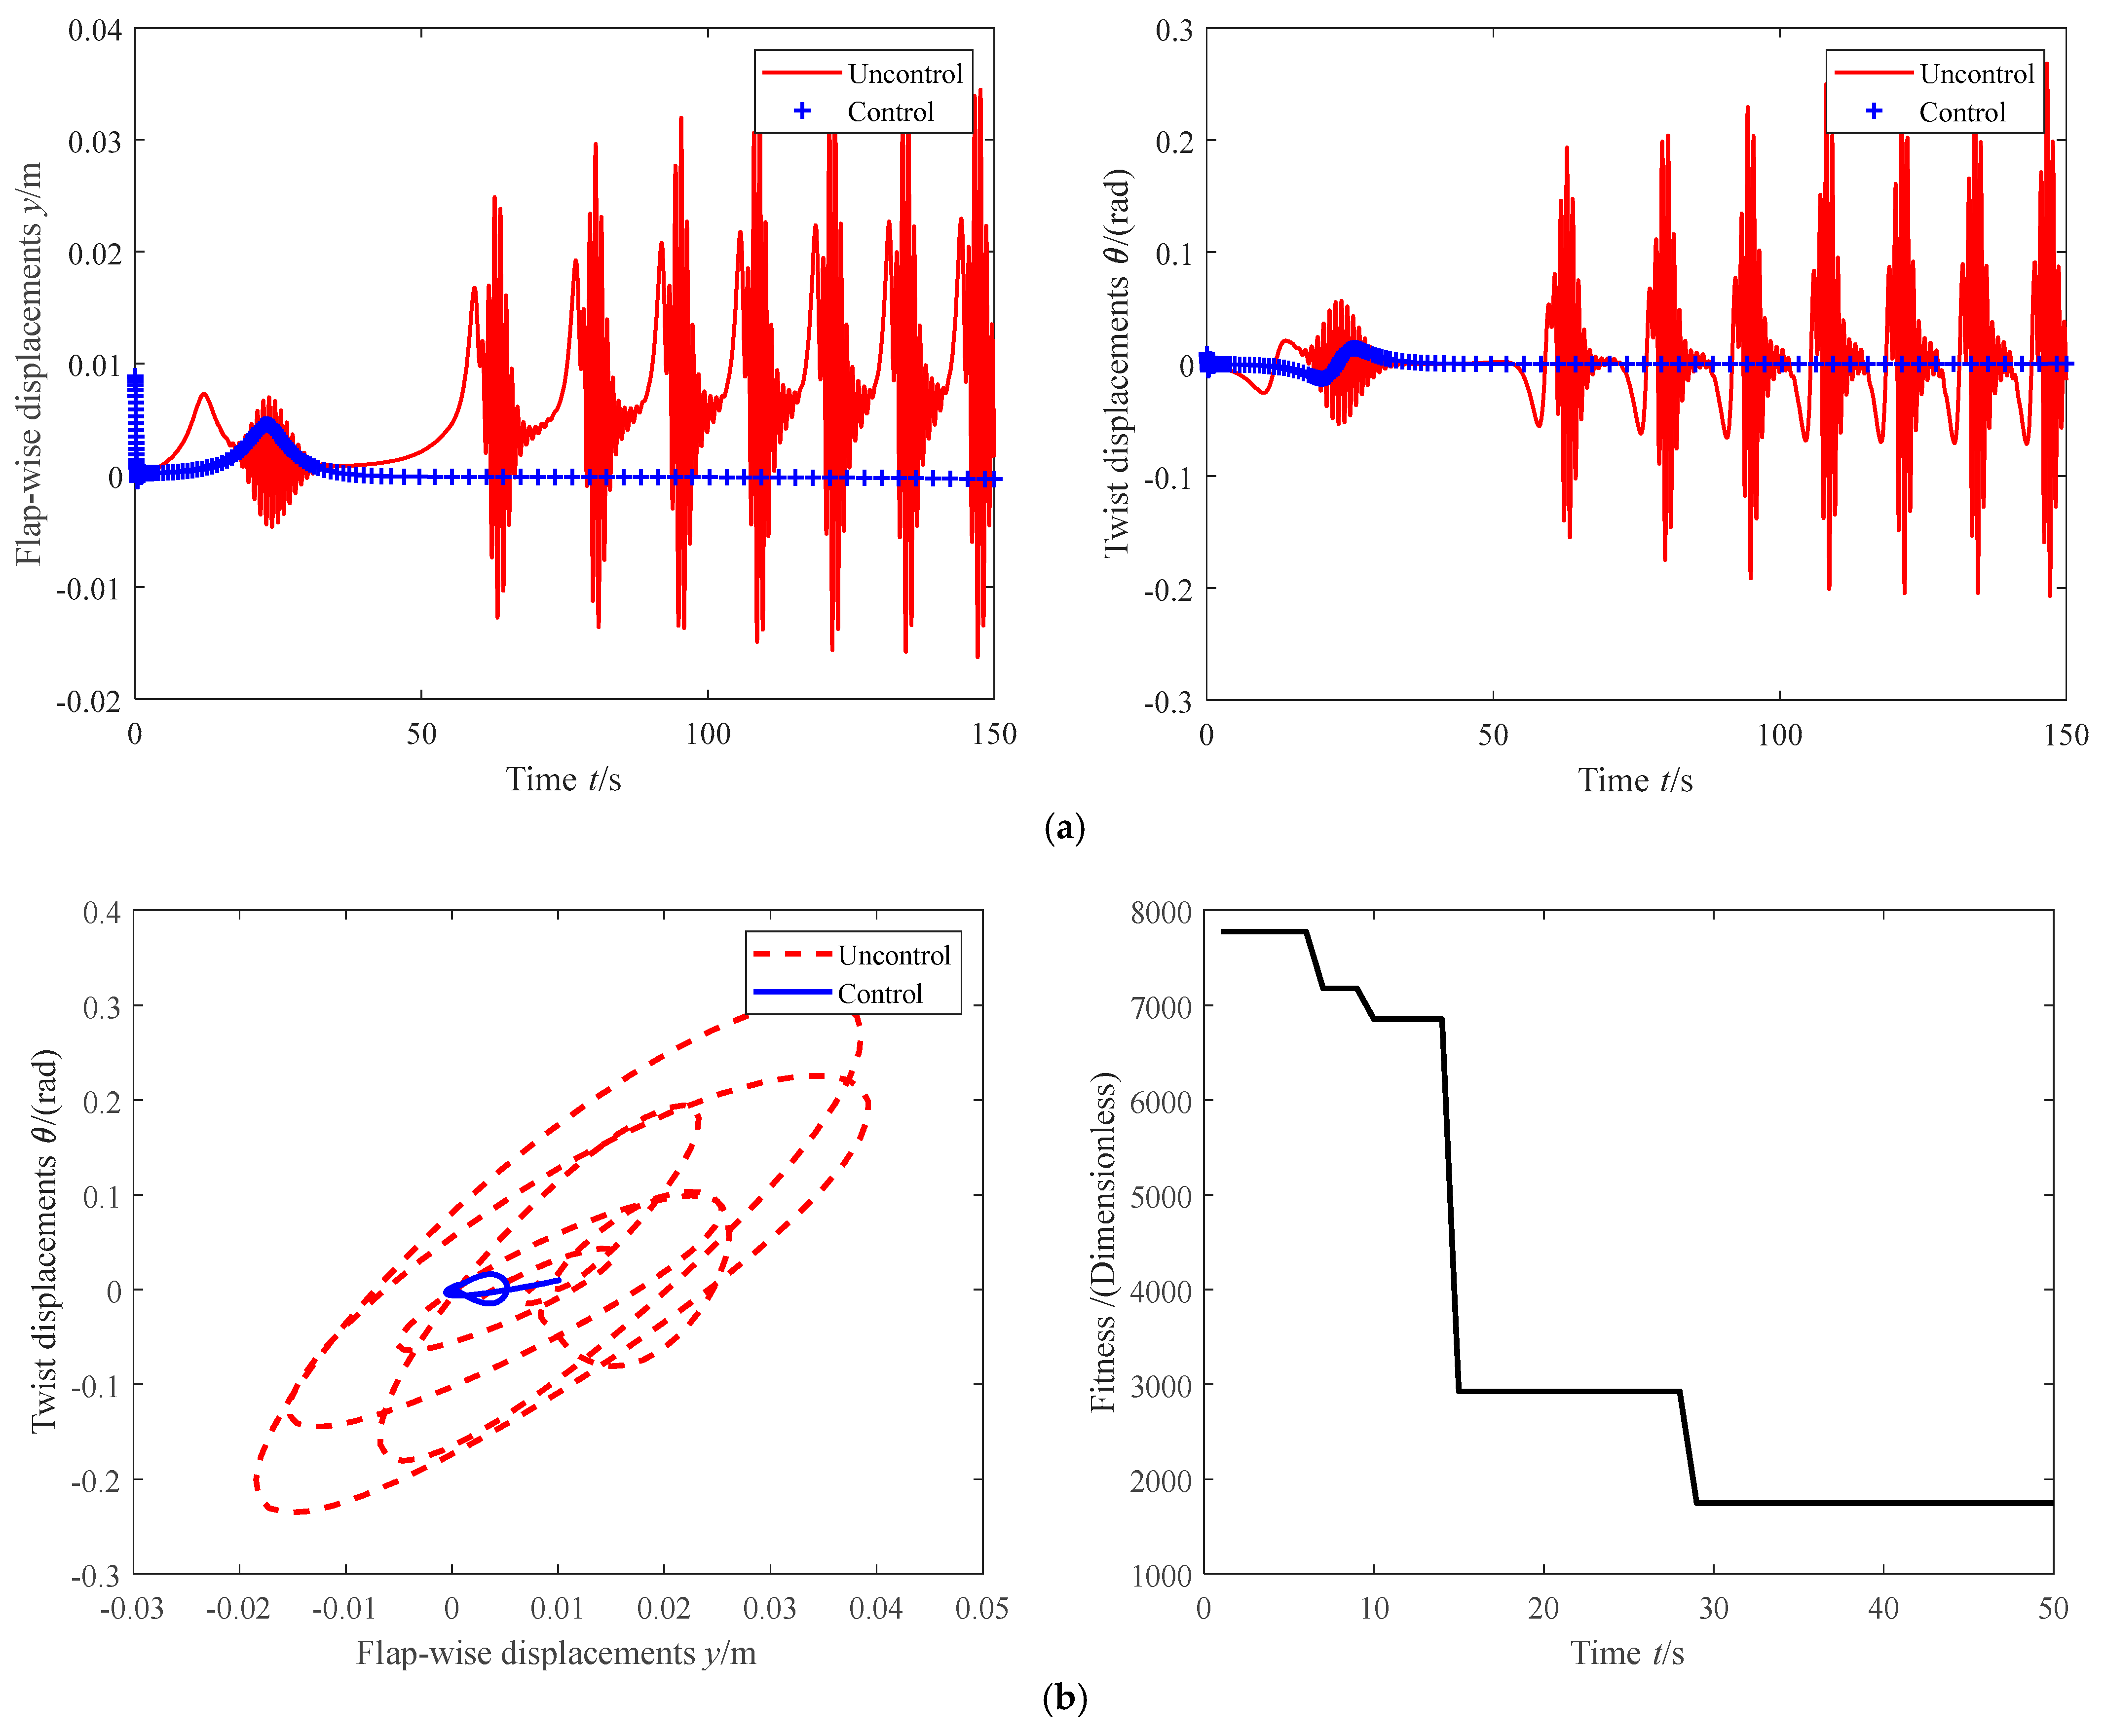
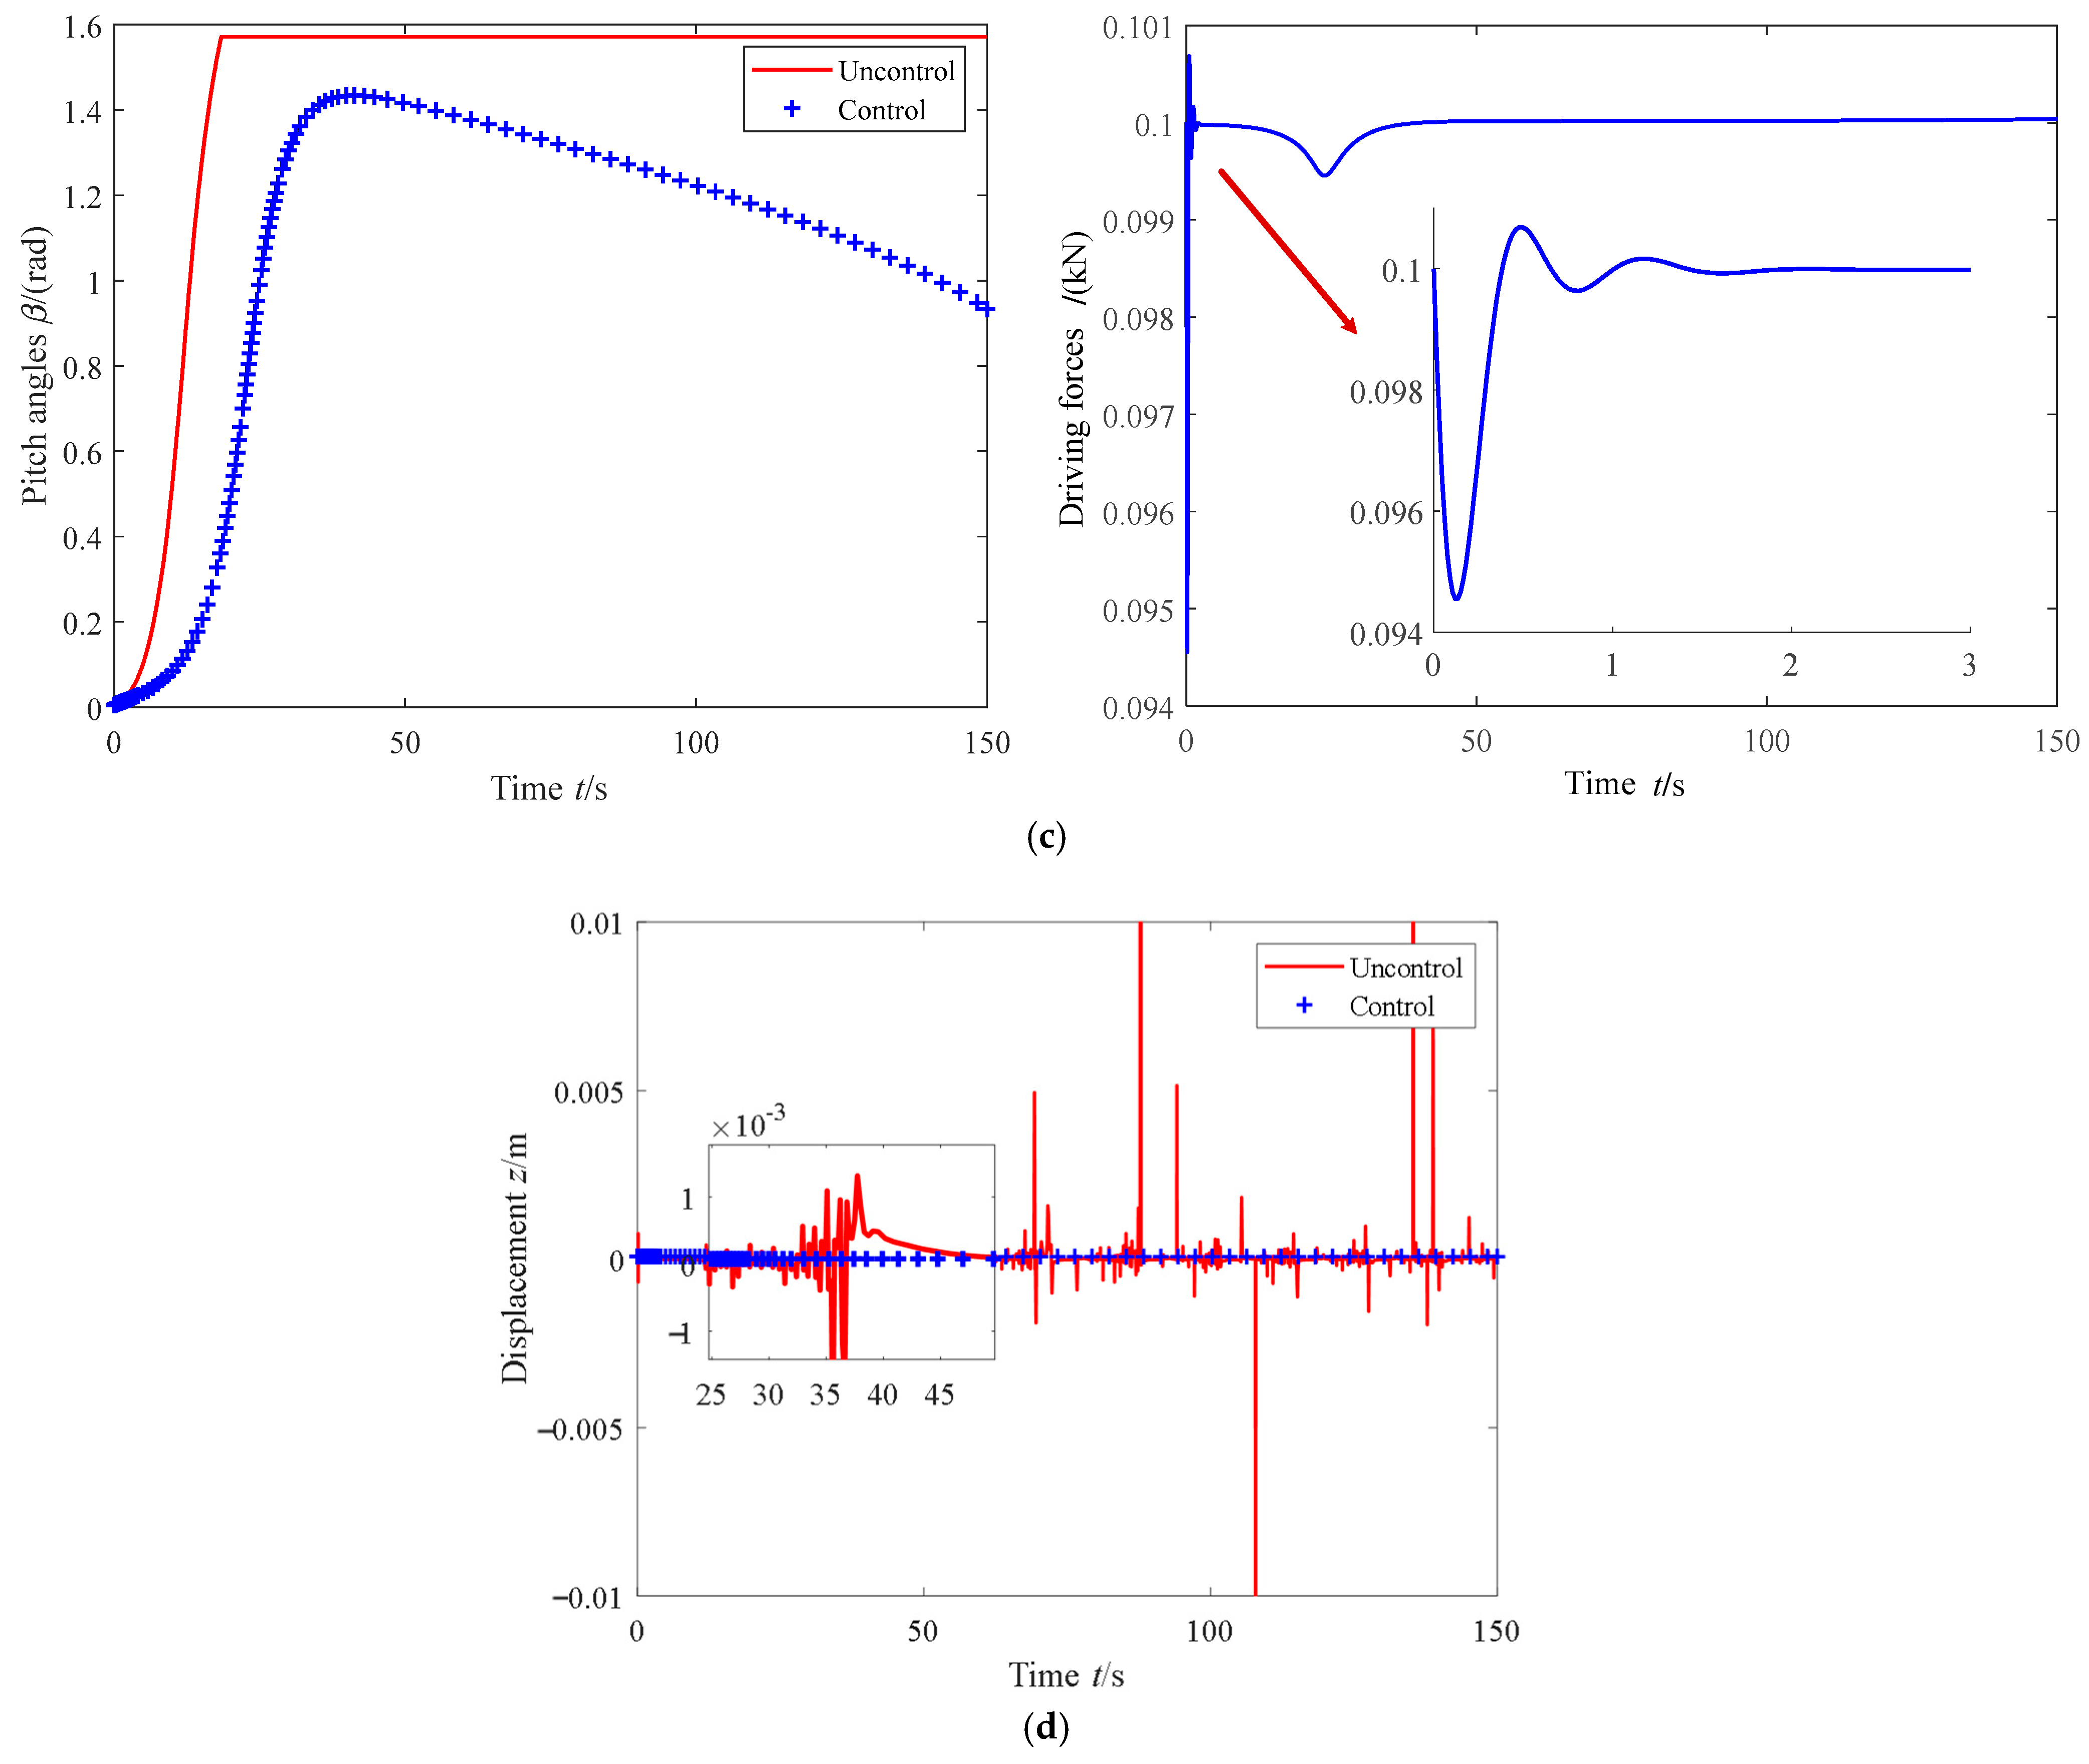
When U = 8 m∙s−1, Figure 6 shows the flapping displacement and twist displacement before and after control (a), the maximum fluctuation range of the phase plane and the differential evolutionary fitness of trajectory control (b), and the pitch angle and pitch driving force (c).
The uncontrolled swing displacement vibration shown in Figure 6a has a small amplitude of −0.02~0.04 m and belongs to nonlinear HFMV, while the uncontrolled torsional displacement also exhibits nonlinear HFMV. The time response of the two displacements is completely consistent with the original research intention. In addition, the HFMV characteristics demonstrated by the uncontrolled flapping/twisting displacement time-domain response also precisely verify the effectiveness of the HFMV aerodynamic forces used. After PD control, the amplitude of the two displacements significantly decreased within 30 s, and the vibration frequency rapidly attenuated, achieving flutter suppression. After 30 s, the vibration amplitude approached zero, and the time-domain response fully converged, achieving perfect stability control effect.
Figure 6b shows the maximum fluctuation range of the phase plane that controls the flapping/twisting displacement before and after starting from the initial value (0.01, 0.01) for a longer period of time from 0 to 200 s. As time goes by, the signal before control is limited to a specific finite range, indicating that HFMV will approximately exhibit a high-frequency constant amplitude vibration state. With the continuous passage of time, the sustained vibration will bring hidden defects, which is completely in line with the topic of this study. From the comparison before and after control, it can be seen that the maximum fluctuation range of the controlled variable is much smaller than that before control and converges to around 0, reflecting a good control effect. From the convergence process of the fluctuation trajectory, there is no bifurcation, and compared with that before control, it also reflects good dynamic performance.
Figure 6b also shows the fitness curve, which fully approaches a constant value after 30 s, that is, it reaches the steady-state value and achieves the tracking requirements set by the cost function while minimizing the total energy consumption of the system. At this point, reaching the optimal result also indicates that the set maximum iteration number of 50 has sufficient redundancy without affecting the iteration speed.
In Figure 6c, from the fluctuation in the pitch angle, the uncontrolled pitch angle follows F p d = 0 in Formula (5) and fluctuates. After 15 s, it quickly reaches π/2, which corresponds to the right limit position of the translational nut, and then loses the effect of continuing to attenuate aerodynamic loads. Therefore, in uncontrolled flapping/twisting displacement, it exhibits a nonlinear divergent state. Under PD control, the pitch angle returns before reaching the right limit. As time goes on, it will continue to fluctuate approximately periodically within [0 π/2], which can continuously attenuate aerodynamic loads. Therefore, it presents a convergent stable state in the controlled flapping/twisting displacement, achieving the purpose of flutter suppression.
From the fluctuation in the pitch driving force in Figure 6c, there is a rapid fluctuation within 3 s, but the fluctuation amplitude is not significant at 0.007 kN, followed by a slow fluctuation before 50 s. The impact force and intensity during the fluctuation process will not affect the safety of the pitch mechanical system and hydraulic energy system.
In this design, hydraulic energy can be provided by a feedback-type pressure-limiting variable pump (further driving the rack piston cylinder). Currently, the working pressure of the hydraulic pump is less than the limit pressure. Through feedback-type adaptive adjustment, it is also possible to limit the pressure after 50 s and maintain the driving force in Figure 6c around 0.1 kN, which is consistent with practice and theory. Therefore, it can achieve steady-state pitch control in engineering applications.
In addition, we incorporated the time response of NTVA mass under the condition of U = 8 m∙s−1, as shown in Figure 6d. It is evident that the advantages and characteristics of the NTVA are as follows:
(1)
The NTVA suppresses flutter through instantaneous impact, which is the essence of increasing flutter wind speed;
(2)
In uncontrolled situations (i.e., without differential evolution control), the instantaneous impact displacement of the NTVA mass exhibits even greater impact at positions with larger swing and torsional fluctuations, which is a manifestation of the flutter suppression effect;
(3)
Under the control of differential evolution, the instantaneous impact displacement of the NTVA mass also tends to stabilize, which not only reflects the effectiveness of the differential evolution algorithm but also the stability, reliability, and safety of the NTVA system itself, and demonstrates the rationality of the NTVA design;
(4)
Additionally, it should be noted that due to the focus of this article on flutter suppression through flapping and twisting, and the similar fluctuation characteristics of NTVA mass at different wind speeds, the time response of NTVA mass will not be shown in the subsequent diagrams.

5.2. Discussion of the Robustness of Control Methods

To verify the stability and algorithm robustness of vibration control, the control results under different wind speeds were compared. Considering that under normal operating conditions and with constant turbulence intensity, the average wind speed in the fractal characteristics of turbulence within a height of 70 m on land generally does not exceed 10 m·s−1, this design selects three different wind speeds, U = 5, 8, and 10 m·s−1, centered around the flutter wind speed U = 8 m·s−1, to sufficiently test the vibration control method and verify the stability robustness of the optimal trajectory control based on differential evolution and the algorithm robustness of differential evolution itself.
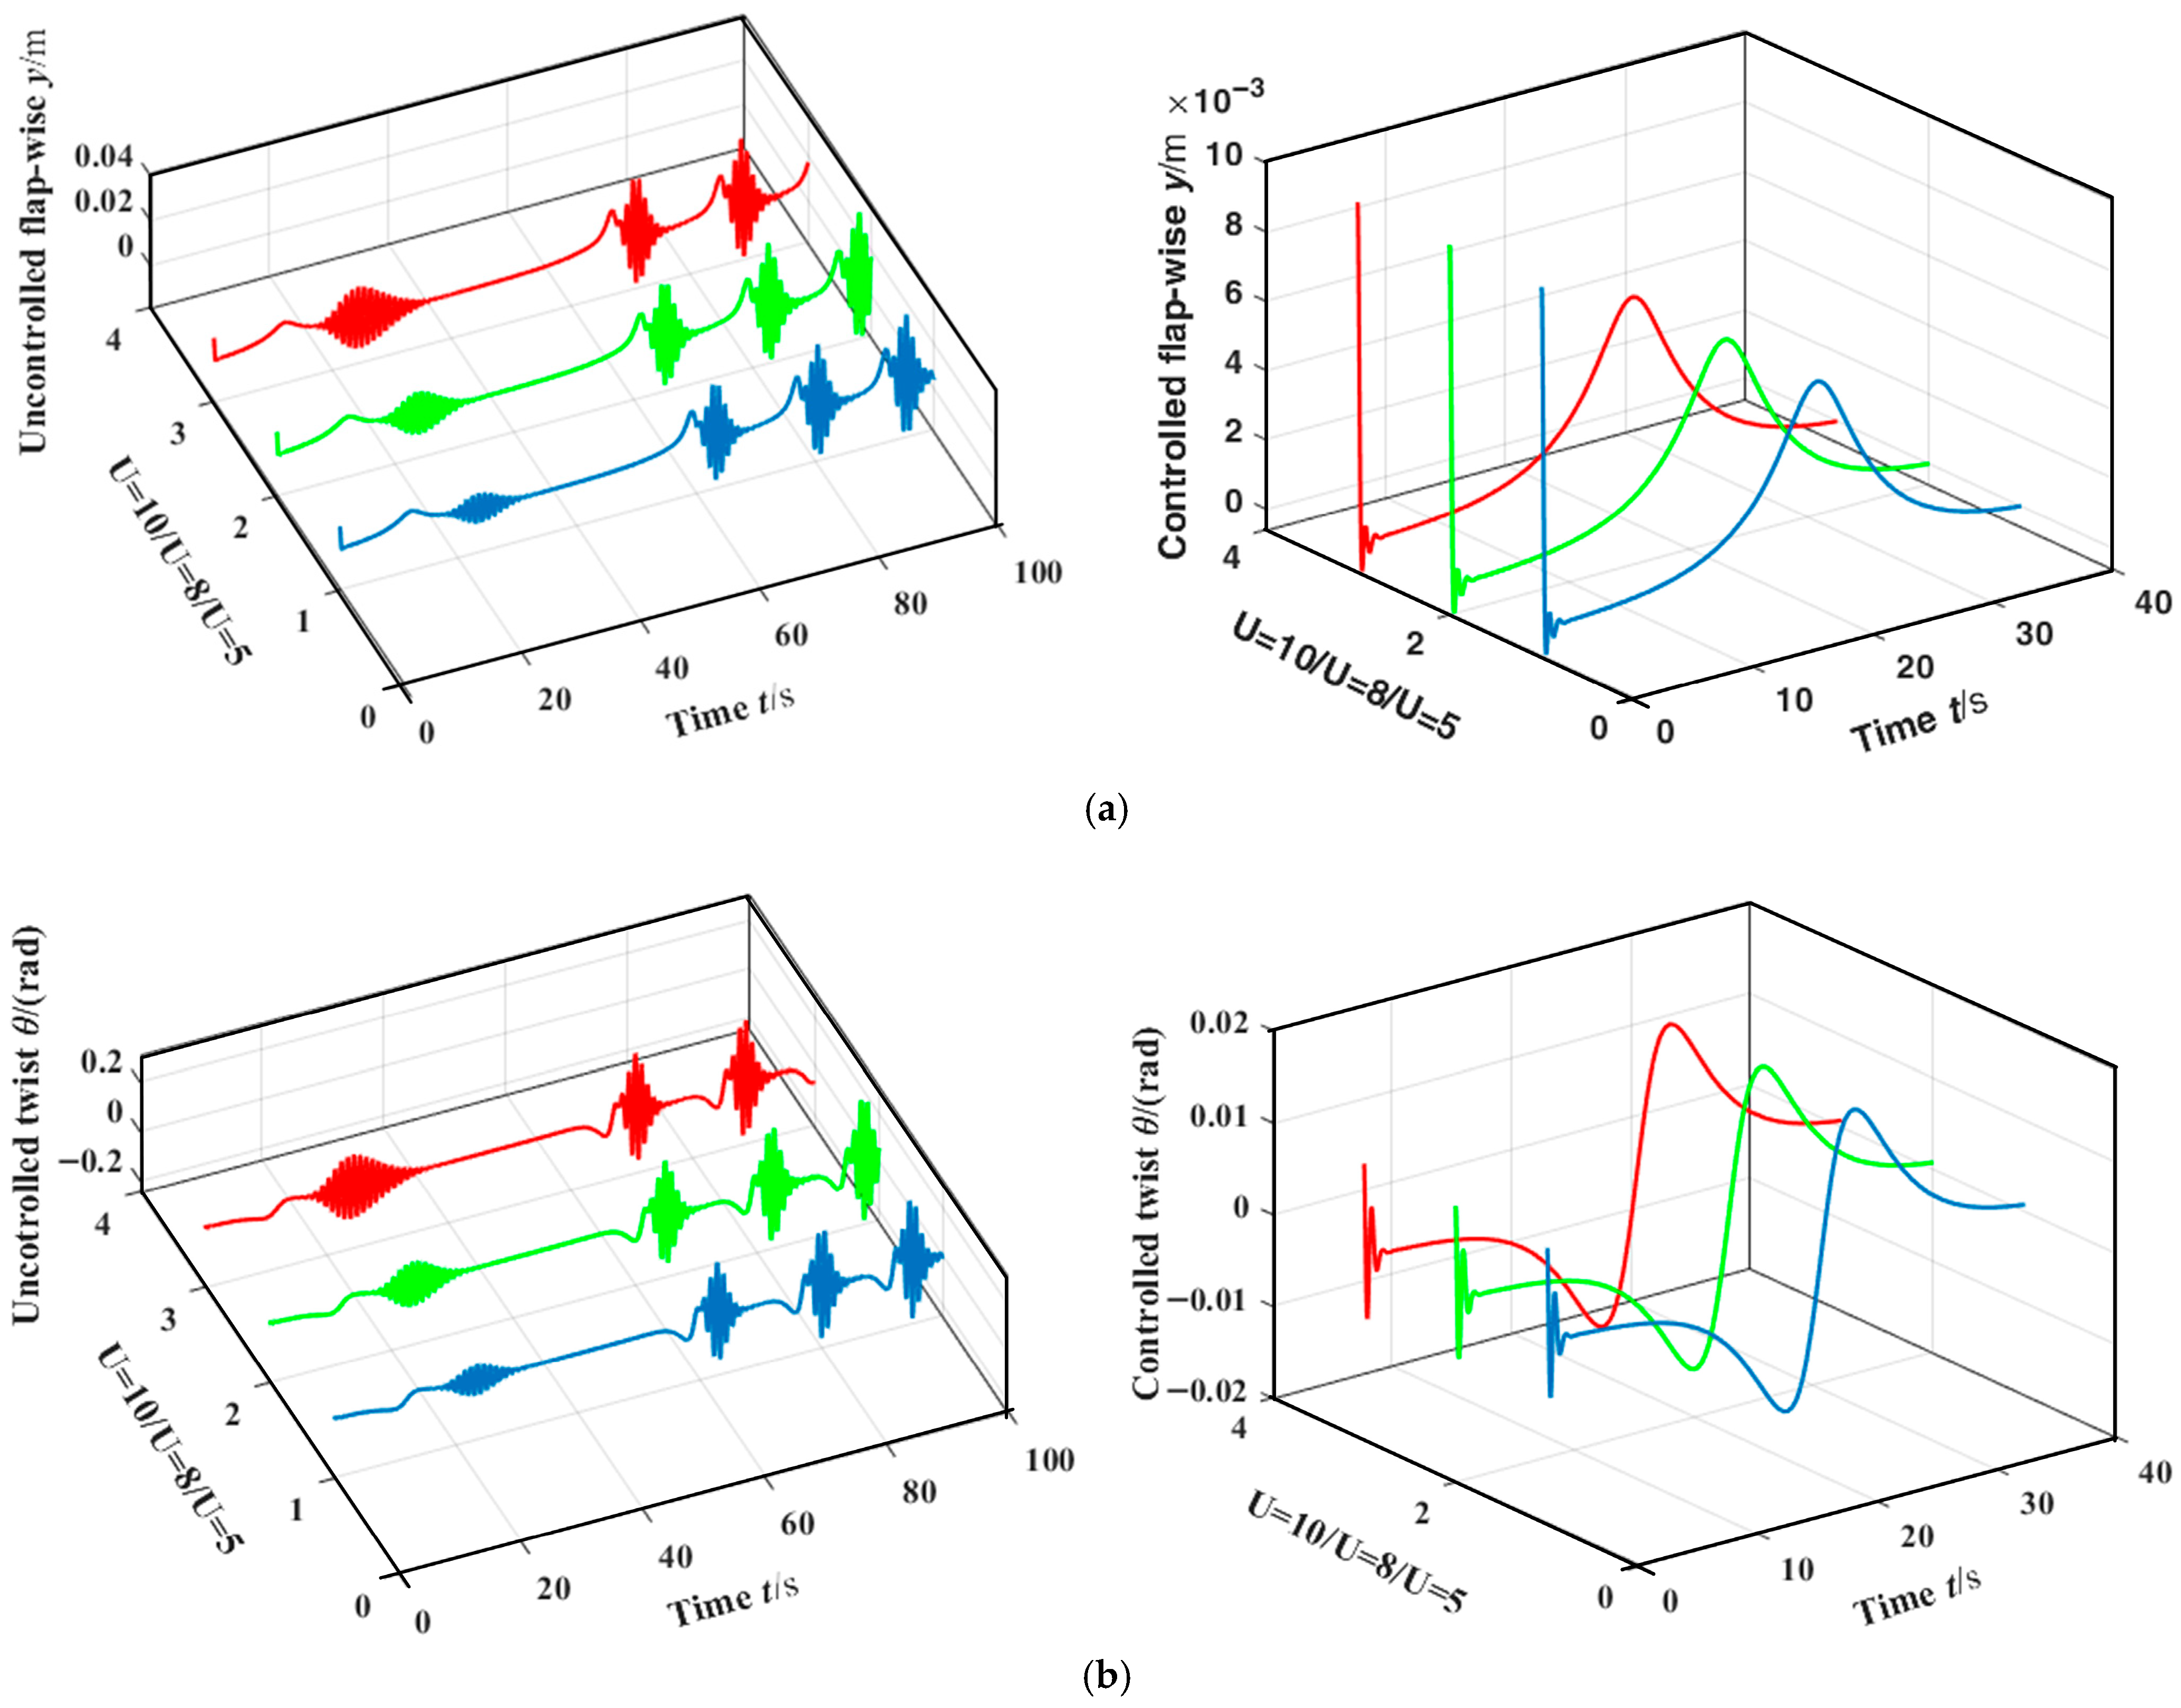
Figure 7 shows the flapping displacement response (a) and twist displacement response (b) before and after PD control under three different wind conditions. The uncontrolled flapping/twisting displacement under two wind conditions of U = 7 and 9 m·s−1 is very similar to the displacement fluctuation law under the wind condition of U = 8 m·s−1 in Figure 6, so only the nonlinear displacement fluctuation within 100 s is shown, which also belongs to the HFMV signal and is completely consistent with the research plan set at the beginning. At the same time, it further indirectly verifies the effectiveness of the HFMV aerodynamic forces in Formulas (6) and (7).
The controlled flapping/twist displacement is similar to that in Figure 6; it is completely in a convergent stable state after 40 s, and the stability robustness is verified. Therefore, Figure 7 only shows the comparison of the controlled flapping/twist displacement within [0 40] seconds. At the same time, the controlled amplitude and frequency decrease rapidly, and the trend of time-domain changes is basically consistent. The robustness of the control algorithm is also verified.
In addition, this design also considers engineering applications as much as possible. At present, most wind turbines use Programmable Logic Controller (PLC) hardware for real-time control. Due to the built-in PD module of programmable controllers, PD control based on optimized parameter tuning is more suitable for engineering applications. So, the engineering application robustness of algorithms also needs to be considered.
Due to the inability of programmable controllers to directly run various intelligent control theory algorithms, this design adopts an Object Linking and Embedding (OLE) communication technology based on process control: the optimal control and optimization process runs entirely in the MATLAB simulation environment of the PC, while the PD control strategy runs entirely in the hardware of the S7-200 programmable controller. The connection server between MATLAB and the controller hardware is set up through PC Access software, including variable definitions and data type settings. Through this OLE communication technology platform based on controller hardware in the loop simulation, the engineering application of optimal control algorithms can be achieved by directly connecting a PC and a programmable controller hardware system, as shown in Figure 8a. Figure 8c specifically illustrates the OLE communication plan based on the controller hardware in the loop simulation, including built-in MATLAB toolbox functions. Figure 8b shows the twisted displacement (blue color line) and the flap-wise one (red color line) after control at U = 8 m·s−1 through the Delta touch screen, which is consistent with the displacements (numerical values and trends of change) after control shown in Figure 6a. The feasibility of the control algorithms further verified the robustness of the algorithms in engineering applications.

6. Exploration of Driving Performance and Wear Consumption in Engineering Applications

Note that in uncontrolled situations, when the translation nut is in the right limit position and cannot continue to move (the pitch angle remains at π/2), the hydraulic system continues to provide hydraulic energy, and the variable displacement pump is in a high-pressure “flow unloading” state with zero output flow. At this time, the pump wear is relatively severe, which can cause safety issues. Under optimal PD control, the flow rate is automatically matched by a feedback-type pressure-limiting variable pump, and the hydraulic system pressure is maintained within a certain range of small fluctuations, with the driving force fluctuating around 0.1 kN. The driving force under the three wind conditions maintained a consistent trend of change, as shown in Figure 9 (upper level). As mentioned earlier, the pitch angle will continue to fluctuate periodically within the range of [0 π/2], achieving dynamic control. Due to the focus of this design on HFMV control under “normal operating conditions”, under optimal PD control, the hydraulic system will continue to operate under “normal pressure”, and the pitch mechanical system will also “continuously pitch”. Whether for hydraulic system components or mechanical system structures, wear and tear must be considered, and the reliability of system manufacturing must be more stringent.
Therefore, based on achieving the aforementioned control objectives, this design improves the optimal PD to the optimal fractional order (FO) PD control [19], and the mathematical expression of its controller in the complex frequency s -domain is as follows:
F p d ( s ) = K p + K d s μ
where the optimized tuning values of the three parameters are K p = 0.5, K d = 0.4, and μ = 1.269.
Due to the presence of the μ factor, as well as the high transmission accuracy and efficiency of the screw ball, it is convenient for differential adjustment, which can directly enhance the adjustment effect of the pitch angle β in Formula (5) (accelerate speed adjustment) and completely enable β to converge and stabilize at a certain value (which is greater than zero and less than π/2) after a period of time, as shown in Figure 10. In addition, after testing, it was found that the control effect of the optimal FOPD, whether vibration amplitude suppression, frequency control, or stability of time-domain convergence, is almost comparable to that of the optimal PD. Due to space limitations, it is not shown here.
When β converges and stabilizes, the translation nut of FOPD basically no longer shifts, and the driving force stabilizes around the “0” value, as shown in Figure 9 (lower position), which means that the “0” value of mechanical wear is consumed. The driving forces under the two algorithms in Figure 9 have completely consistent fluctuation amplitudes at the initial fluctuation moment, both limited to the range of 0.007 kN. However, in the process of approaching a steady state, the optimal FOPD fluctuation amplitude is smaller, which is one of its advantages. More importantly, the driving force of FOPD converges precisely around the “0” value, which also means that the hydraulic system exhibits pressure unloading. Under pressure unloading, hydraulic components, especially hydraulic pumps, also experience near-zero wear and tear. At this time, the remote-control port of the pilot relief valve set in the feedback-type pressure-limiting variable pump bypass is connected to the oil tank, and the system stabilizes at the “0” consumption state.
We note the following: (1) This article uses 2D airfoil vibration to qualitatively analyze blade flutter, rather than directly studying the nonlinear vibration of the entire 3D blade body itself. This is because, on the one hand, the 3D blade body itself can also be discretized into multiple independent 2D airfoil elements [20,21,22], which can achieve airfoil optimization and aerodynamic performance analysis. As mentioned in references [20,21], the 2D structure S809 airfoil was used to study the influence of the trailing-edge slot on aerodynamic performance and dynamic stall aerodynamic performance analysis, as well as the optimization and maximization of lift for asymmetric airfoils using class shape transformation and cross-sectional parameterization methods. Therefore, qualitative analysis has practical significance. On the other hand, the nonlinear system equations of 2D airfoils avoid the multi-variable (dozens of variables) system equations formed after the decoupling process of composite 3D blade bodies [10], making them more suitable for direct combination with high-end intelligent control algorithms (such as neural network algorithms, sliding mode control algorithms, etc.) [22] and exploring flutter suppression based on parameter progressive iteration and algorithm adaptive compensation. Alternatively, it can be combined with finite element analysis to directly reconstruct the frequency structure of the system [23], achieving flutter suppression with attached structures, such as Gurney flaps. (2) Although this study adopts a novel “screw–translational nut” transmission, it emphasizes not only the mechanical design itself but also the existence of the nonlinear HFMV phenomenon and its structural enhancement and control methods. This control method is also applicable to pitch systems based on other mechanical structural forms.

7. Discussion of Quantitative Comparisons

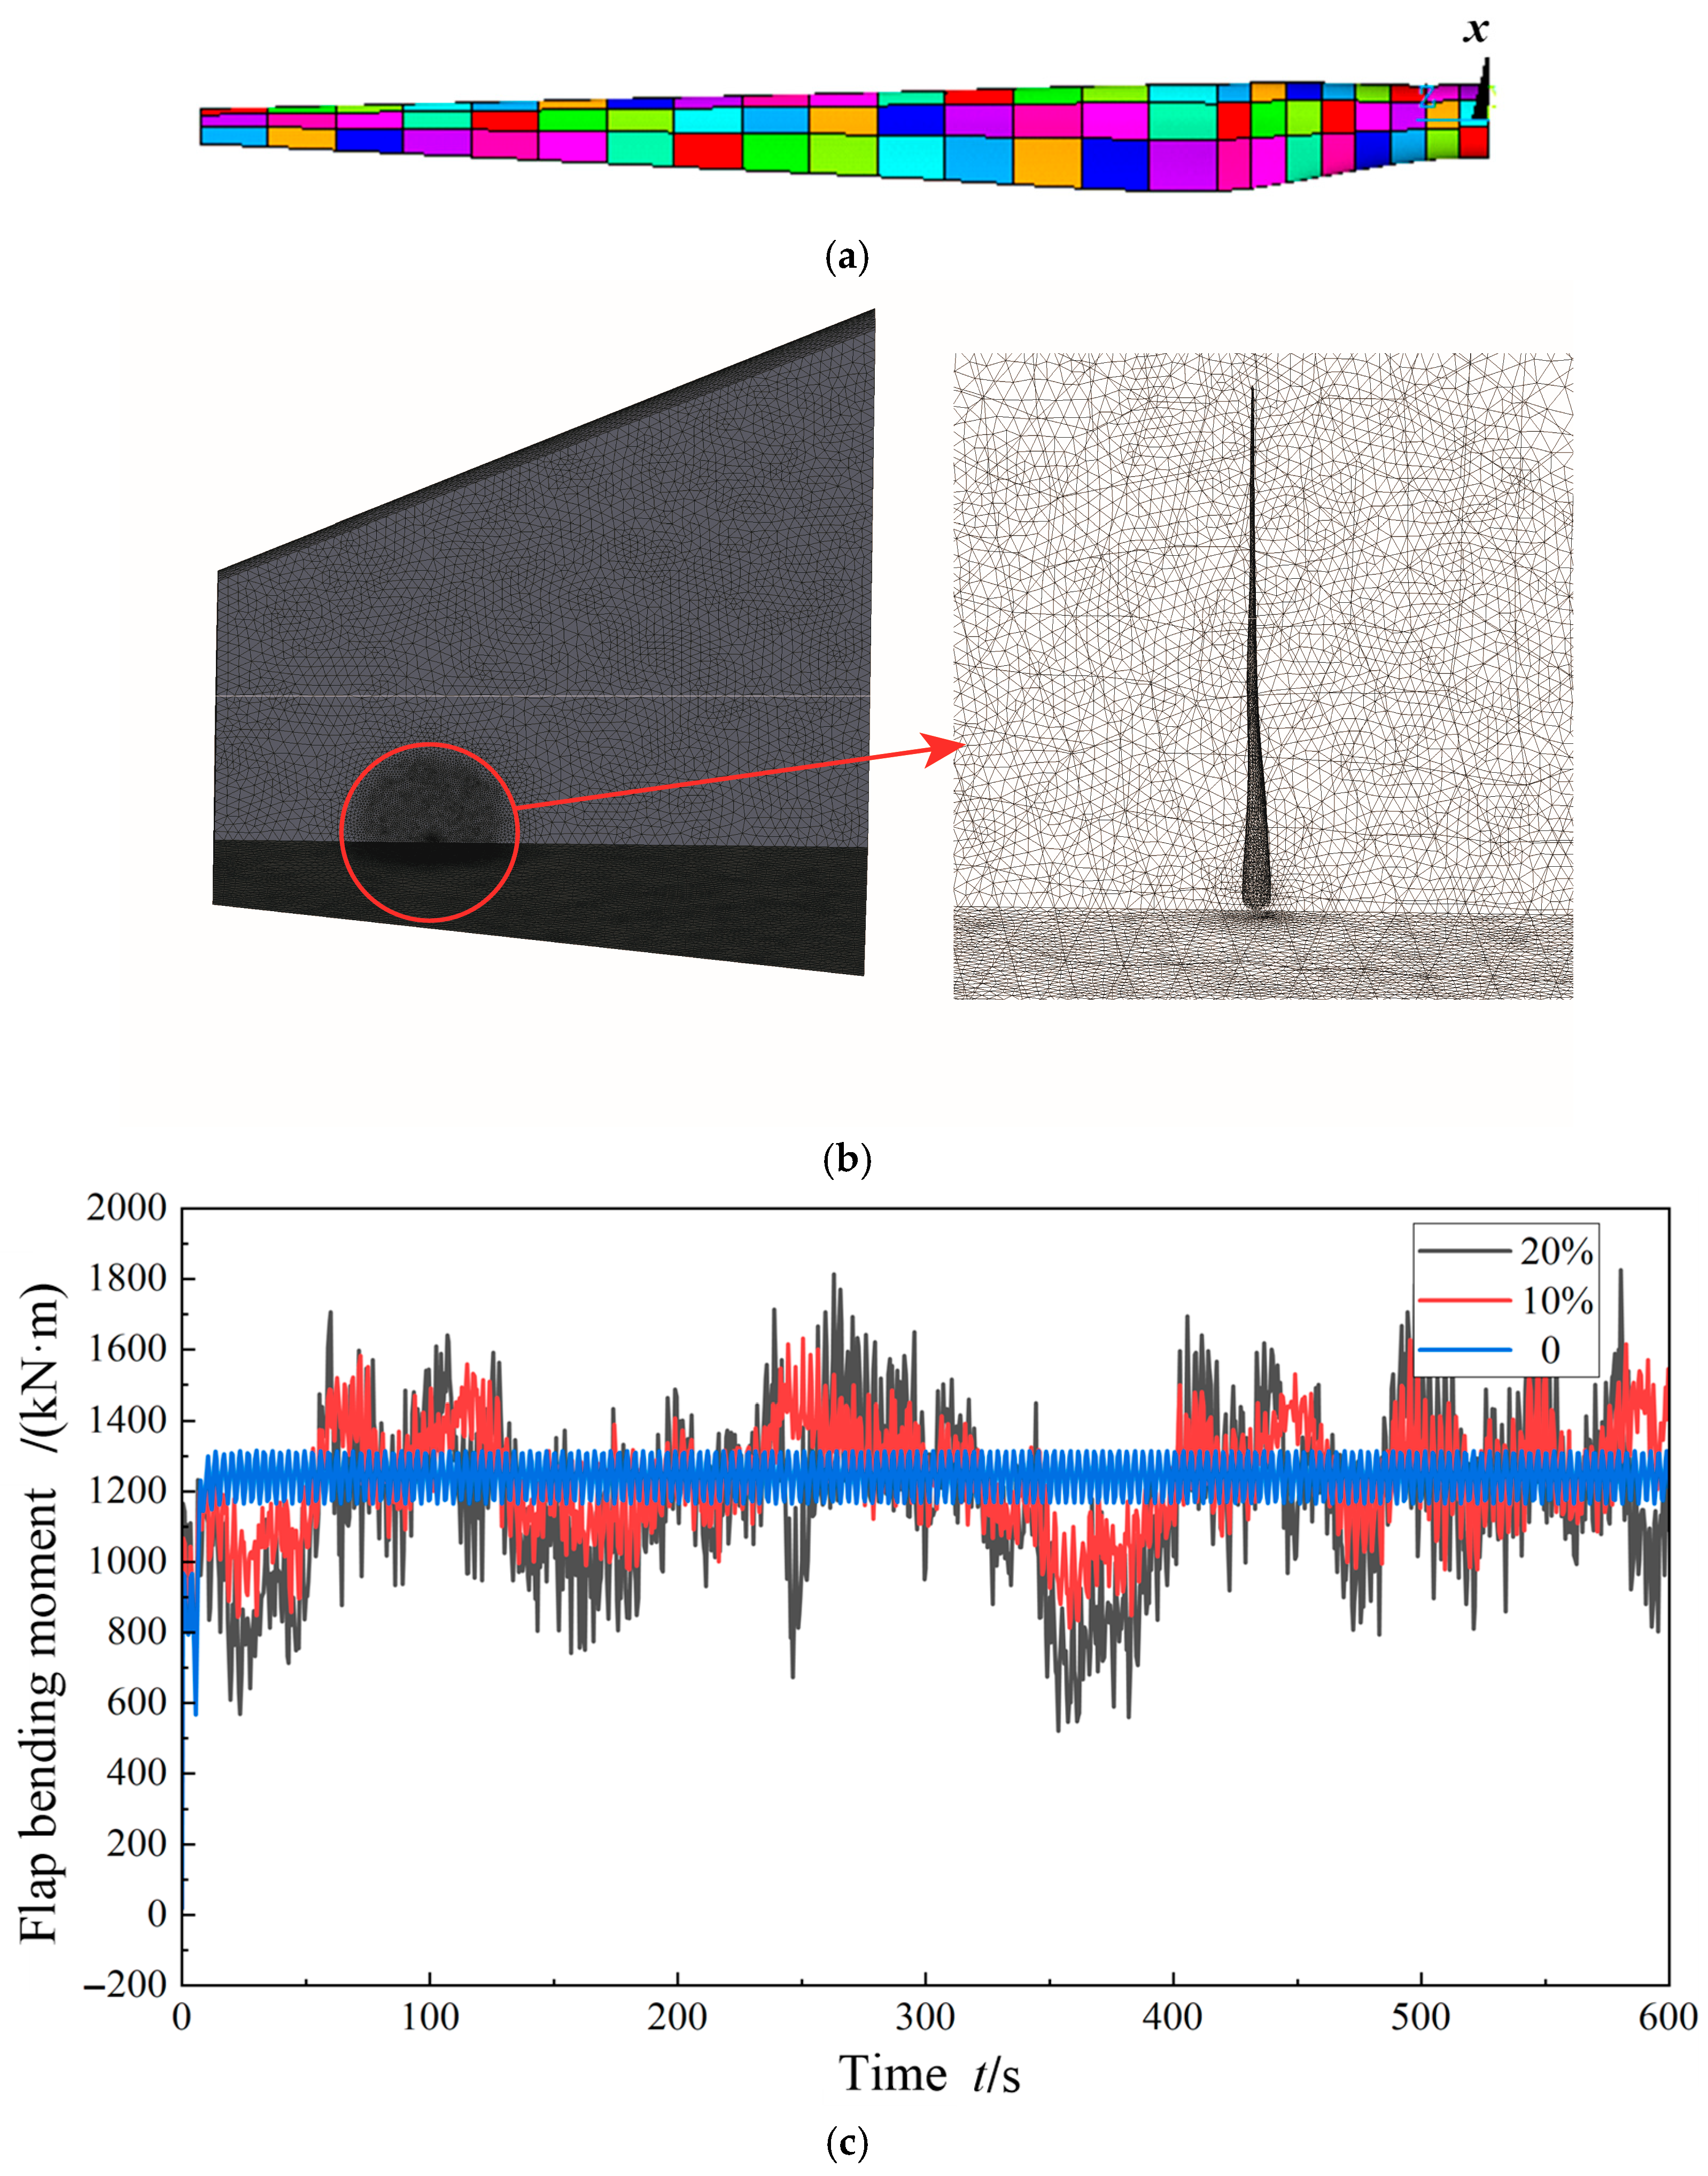
The research object proposed in this article is a discrete cross-sectional element, which is not a complete blade structure, making it difficult to build an experimental platform. However, under the action of HFMV aerodynamic forces, the flapping moment and torsional moment at the root of the 3D blade also experience high-frequency and small fluctuations, and the flapping moment is easy to measure. Therefore, we can use the fluctuation in the flapping moment at the root of the blade to verify the existence of high-frequency micro-vibrations. We will elaborate on this point below.
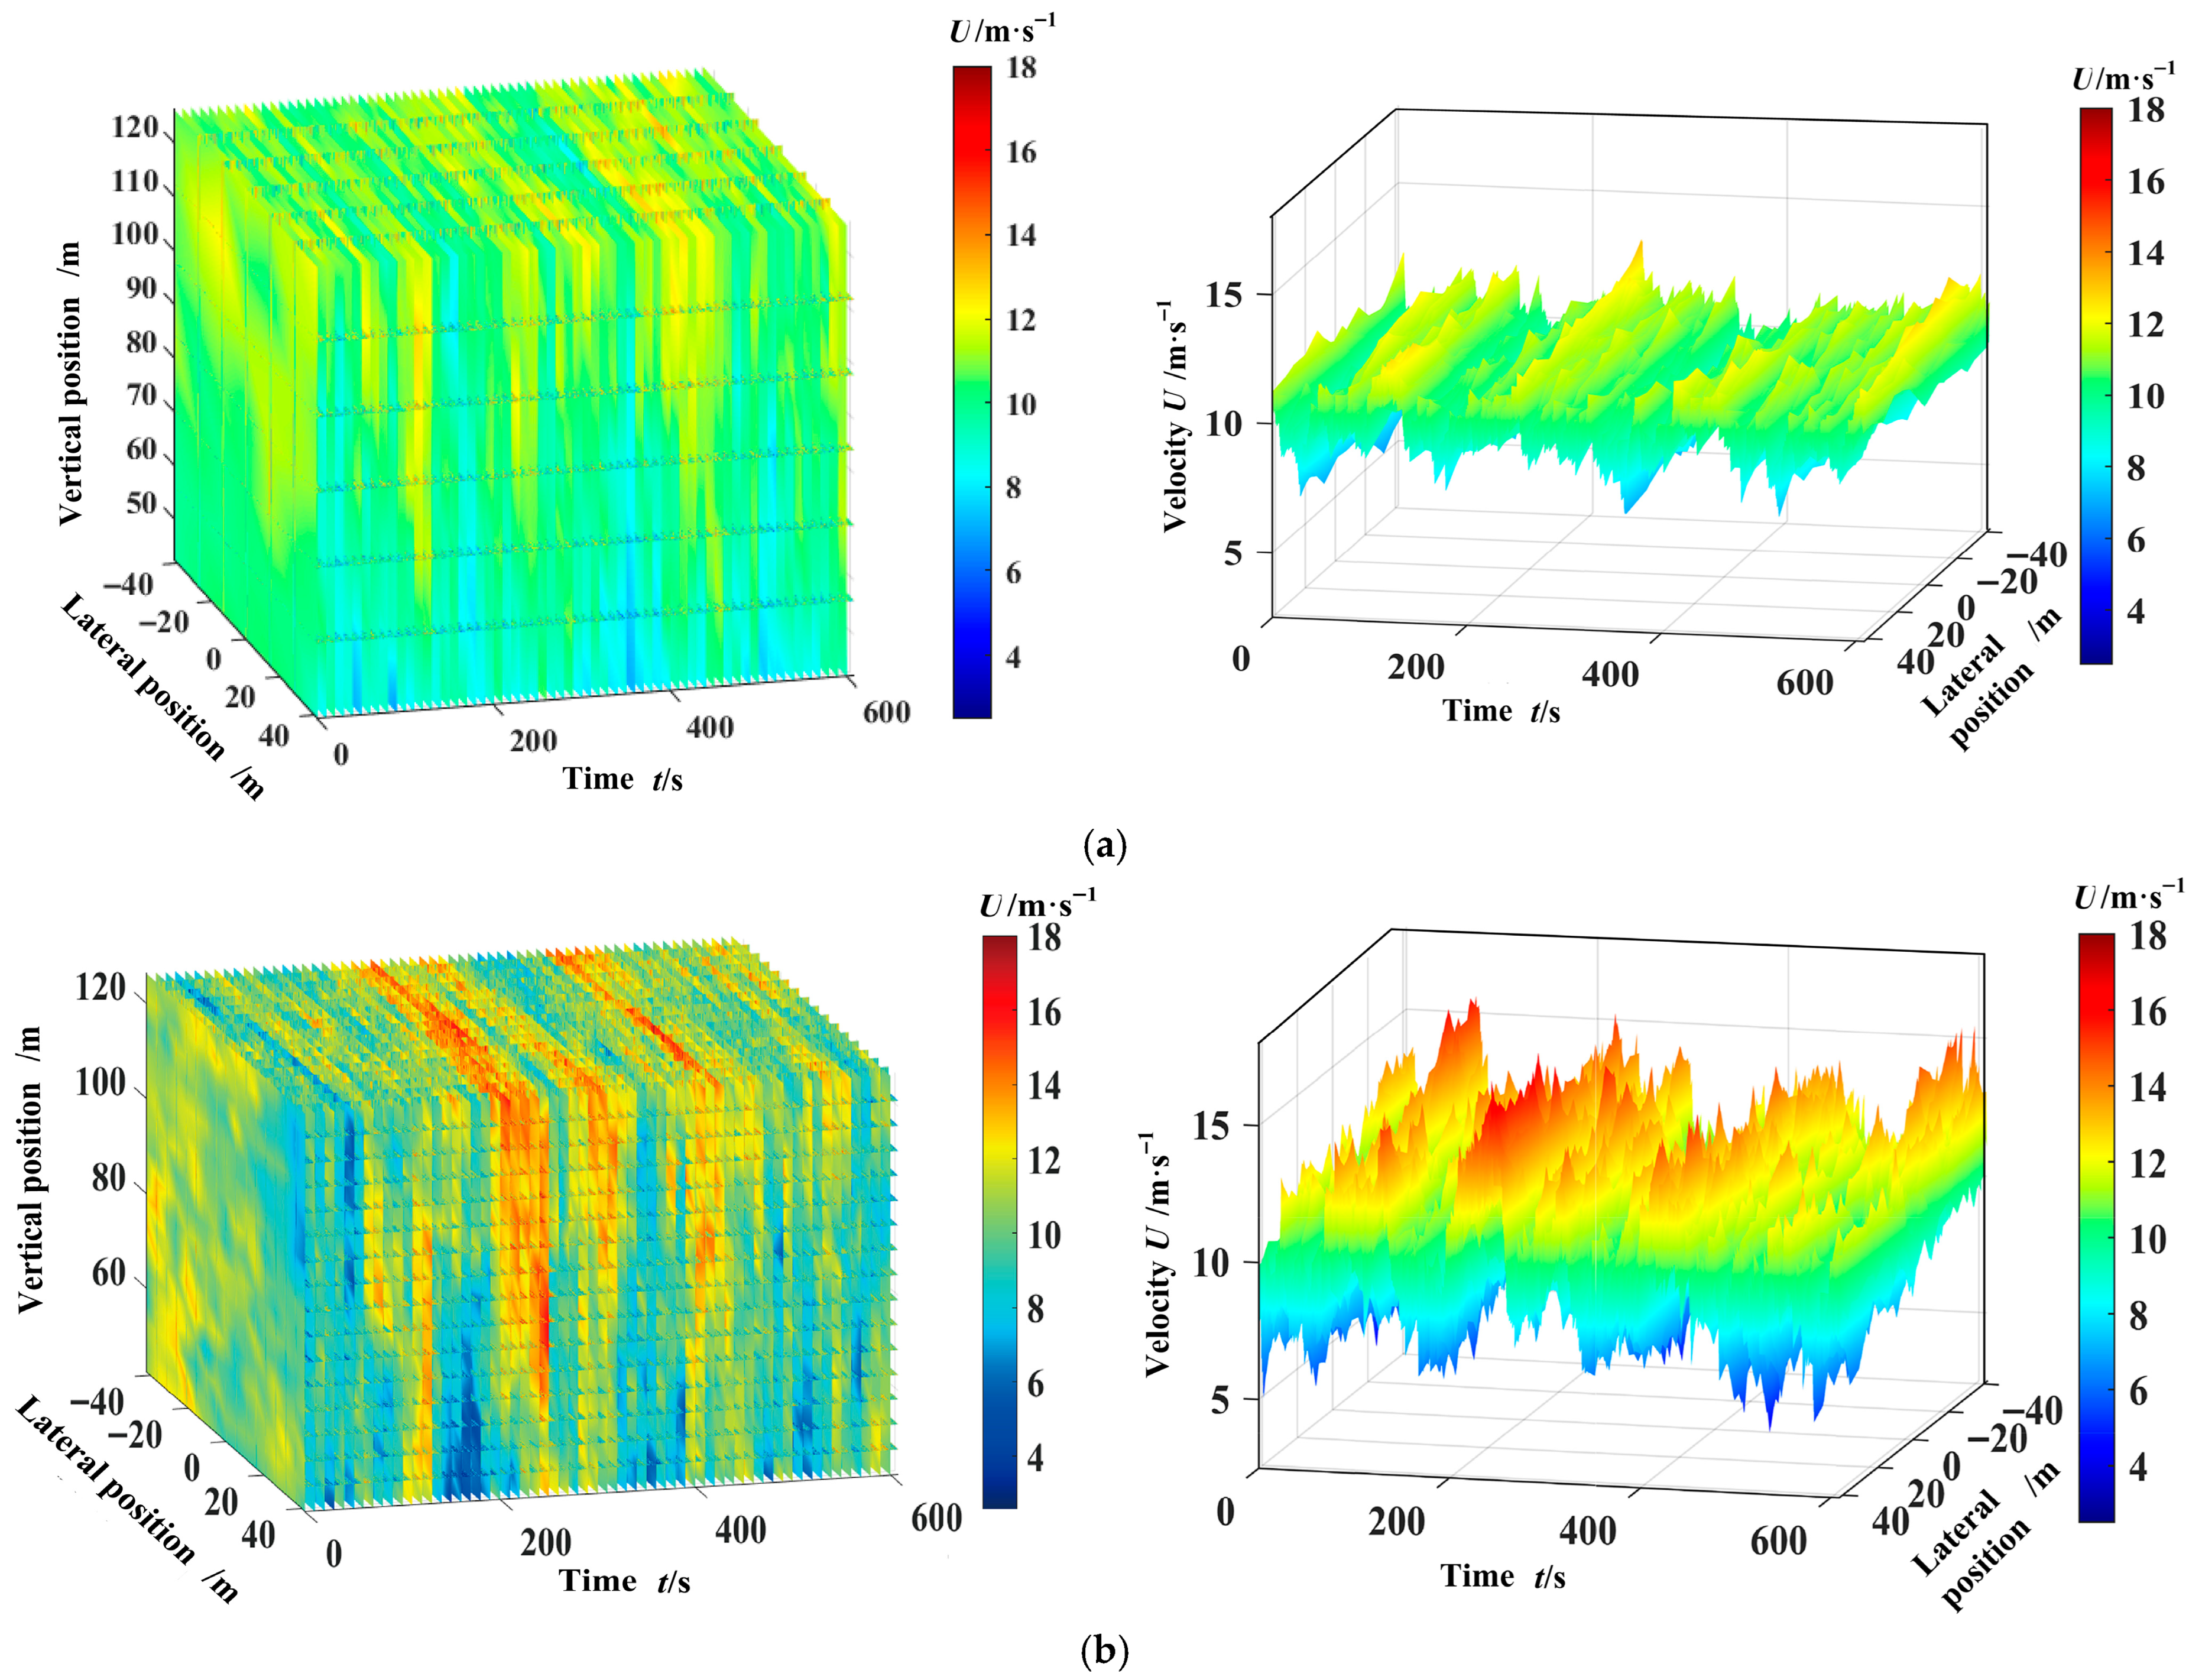
In fact, HFMV aerodynamics are already embedded in turbulent winds. Under turbulent wind excitation below moderate turbulence intensity, HFMV is likely to occur when the wing structure parameters meet certain conditions (such as the parameter values in this design). The research team members [24] generated turbulent winds based on the Kaimal model used in reference [25] and investigated the mechanism of the HFMV phenomenon. We simulated the wind speed distribution maps at different time points in the wind turbine rotor plane and hub height based on TurbSim’s turbulent wind [24] foundation database. Figure 11a,b show the wind speed distribution at different time points in the wind turbine rotor plane and hub height under 10% turbulence intensity and 20% turbulence intensity, respectively. The average wind speed set in both cases is 10 m·s−1.
Turbulence intensity less than or equal to 10% belongs to moderate to low turbulence. In the case of an average wind speed of 10 m·s−1, the HFMV value set in this article may be hidden within it. We set the total length of the composite blade to 18 m, including 15 basic airfoil units. The shell element of the composite material layer adopts ANSYS SHELL181 (2022, ANSYS Corp, Pittsburgh, PA, USA), which has unique advantages in dealing with nonlinear problems. The basic airfoil unit adopts a composite rectangular thin-walled structure as the host structure and is wrapped with a skin structure on the outside. The skin airfoil adopts the S825 airfoil. The physical parameters, such as stiffness and damping, of the composite rectangular element at the maximum chord length perfectly match the parameters in this article, while the physical parameter values of rectangular elements at other chord lengths are set proportionally according to the ratio of chord length at that position. The layering of the blades is carried out using the layout tab (with 45-degree layering) in the pre-processing module for material allocation, as well as setting the layering thickness and angle. Figure 12 shows the overall structure of the blade, the blade flow field and mesh division, and the root flapping moment.
In the above analysis, we used a rectangular cross-section as the host (adding skin structure) to directly replace the airfoil structure in designing composite structures. On the one hand, it is easy to match the structural parameters proposed in this paper, and on the other hand, the rectangular cross-section element (the same is true for the elliptical structure element [26] in our preliminary research) easily demonstrates the coupling of flapping bending and twist. We also further verified the feasibility of this replacement. Firstly, we considered the aerodynamic forces of HFMV and the nonlinear structural equation (including the NTVA structure) of the system as a whole, that is, as a rigid body of an aeroelastic system. Then, we linearized the rigid body of the aeroelastic system using the aforementioned method to obtain a linear system. We matched the mass matrix, damping matrix, and stiffness matrix of the linear system in finite element analysis. Finally, the vibration mode analysis of the aeroelastic rigid body was studied, and the various-order vibration modes of the rigid body system were obtained, as shown in Figure 13. In fact, as long as the structural parameters of composite materials meet certain conditions, the HFMV phenomenon can also be hidden in the stall vibration in reference [26]. However, we overlooked its existence due to our focus on extreme situations.
In Figure 13a–d, the colors in the modal shape diagram reflect the relative displacement of each point. The red area is the deformation concentration area, the blue area is the deformation smaller area, and the other colors are the transition areas in sequence. From Figure 13, it can be seen that in both cross-sectional cases, the first four frequencies of the aeroelastic rigid body system are first-order flapping, second-order flapping, third-order flapping, and first-order twist, reflecting the structure of flapping as the main mode. This is completely consistent with the main mode effect generated by adding the NTVA in Figure 5b, indicating that the application of the NTVA mentioned above is feasible. In addition, in Figure 13a–d, the finite element analysis not only demonstrates the consistency of the two cross-sectional vibration modes (including the presence of bending/twist coupling in the first three frequencies) but also shows the frequency comparison between the rectangular section and the S825 airfoil, which are 19.65:20.51, 122.69:124.82, 341.49:343.73, and 807.83:809.55, respectively. It can be seen that the comparative values of frequencies are also very close, which, in turn, confirms the feasibility of finite element structural analysis under the turbulent wind speeds mentioned above.
8. Conclusions

Preventing problems before they occur is far more meaningful in engineering than remedial measures. Nonlinear HFMV analysis of blades is based on the structural nonlinear system of 2D airfoils, and the aerodynamic force is calibrated as HFMV aerodynamic forces. Based on structural reinforcement, vibration suppression of HFMV was achieved through control planning, achieving the goal of eliminating hidden faults caused by fracture failure.
(1)
The mechanical structure of the control planning adopts a novel unified pitch control system structure of “screw–nut” transmission. The rolling friction of the screw–ball transmission is small and efficient, with high transmission accuracy and sensitivity. It is easy to match differential adjustment algorithms, achieving refined adjustment and efficient control. The feedback type variable pump drives the rack piston cylinder, which further drives the driving gear and drives the screw to rotate, thereby driving the translational slider to achieve variable pitch motion. By combining the discussion of driving performance and wear consumption, the relevant theories of 2D airfoil vibration and control have greater engineering significance.
(2)
Based on the DEA, the control method of control planning adopts the optimal trajectory control method and uses a compensation-based optimal PD controller to adjust, achieving the analysis of bending torsional displacement response, the analysis of pitch angle change, the display of displacement phase plane and differential evolution fitness, and the display of driving force. The robustness is verified by the control results displayed under different wind speed conditions. Finally, based on not affecting the control effect, the improved optimal FOPD algorithm is used to enable the system to stabilize in a “0” consumption state while achieving the flutter suppression target.
(3)
In engineering practice, when the flutter wind speed of the aeroelastic system is greater than the wind speed under normal operating conditions, HFMV actually does not occur, so increasing the flutter wind speed itself has positive significance. Based on constructing the NTVA, this design achieved structural enhancement, maximized the flutter wind speed of the aeroelastic system, and implemented the control process based on the flutter wind speed. The NTVA combined with the artificial structural damping flutter wind speed analysis method also has a positive engineering application value. In addition, the OLE communication planning based on controller hardware in the loop simulation also provides useful ideas for the engineering application of intelligent control algorithms.
(4)
Further research can be conducted on the following topics: Firstly, the HFMV phenomenon can occur in any blade material, but it is related to the specific performance parameters of the material. Therefore, exploring this phenomenon based on the damping and material parameters of composite material structures may have more scientific research value. Secondly, small pitch fluctuations can achieve powerful control effects, effectively changing the equivalent damping matrix and equivalent stiffness matrix coefficients of the entire aeroelastic system (including wind effects). Therefore, further exploration of other refined and regulated pitch systems and efficient matching control algorithms has engineering application value.

9. Patents

A patent [27] resulted from the work reported in this manuscript.

Author Contributions

T.L. conceived the original idea and wrote this manuscript; Q.C. edited this manuscript and processed the experimental data; G.C. supervised this study. All authors have read and agreed to the published version of the manuscript.

Funding

This research was funded by the Natural Science Foundation of Shandong Province of China, grant number ZR2022ME093.

Data Availability Statement

The data that support the findings of this study are available via email: liutingrui@sdust.edu.cn (T.L.) on reasonable request.

Acknowledgments

We would like to thank Changle Sun for his valuable suggestions on mechanical structural design and Shanyao Li for his finite element analysis, as well as Jian Wang for his vibration mode analysis.

Conflicts of Interest

The authors declare no conflicts of interest.

Abbreviations

The following abbreviations are used in this manuscript:
DEADifferential Evolution Algorithm
FOPDFractional Order PD
HFMVHigh-Frequency Micro-Vibration
NTVANonlinear Tuned Vibration Absorber
OLEObject Linking and Embedding
PDProportional Derivative
PLCProgrammable Logic Controller

Appendix A. The Solution Process of g q Without the NTVA

When there is no NTVA, q 1 = { y 1 , θ 1 } T . After linearization and removing the damping term and adding artificial structural damping, the equation is:
M 0 q ¨ 1 + K 0 q 1 = D q
where q 1 and D q are expressed as:
q 1 = y 1 θ 1 = y ¯ e i ω t θ ¯ e i ω t ,   D q = D y D θ = D ¯ y e i ω t D ¯ θ e i ω t = i g y ρ b ω y 2 y ¯ e i ω t i g θ 1 I CG + e 2 ρ b ω θ 2 θ ¯ e i ω t
where the matrix coefficients are:
M 0 = 1 W 1 b 2 V 0 W 1 e b 2 V 0 W 2 e b 2 V 0 1 W 2 b 2 V 0 ( 1 8 + e 2 ) ,   K 0 = ω y 2 0 W 0 I CG ρ b ω θ 2 ,
herein,
W 0 = 1 I CG + e ρ b ,   W 1 = 1 ρ b cos ψ 2 π ρ a b V 0 ,   W 2 = W 0 2 π ρ a b V 0
Therefore, Formula (17) can be rewritten as:
ω 2 M 0 y ¯ θ ¯ + K 0 y ¯ θ ¯ = ω 2 i g y ρ b y ¯ i g θ W 0 θ ¯
and further written as a generalized eigenvalue problem:
M 0 y ¯ θ ¯ = K 0 ω 2 + i g y ρ b i g θ W 0 y ¯ θ ¯
thus obtaining eigenvalues:
λ = ω y 2 ω 2 + i g y ρ b W 0 I CG ρ b ω 2 + i g θ W = λ R e + i λ I m
In fact, for flapping and twisting, ω can take different values, ω s y and ω s θ ; therefore, there is a further expression:
λ = ω y 2 ω s y 2 + i g y ρ b W 0 I CG ρ b ω s θ 2 + i g θ W = λ R e + i λ I m

References

  1. Liu, T.; Cui, Q.; Xu, D. Wind turbine composite blades: A critical review of aeroelastic modeling and vibration control. Fluid Dyn. Mater. Process. 2025, 21, 1–36. [Google Scholar] [CrossRef]
  2. Li, H.; Wang, B.; Li, G.; Cui, Y.; Su, Q.; Feng, Y.; Meng, H.; Li, Y. Response analysis of slender structures on a spar-type floating offshore wind turbine under three types of freak waves. Ocean Eng. 2025, 25, 120867. [Google Scholar] [CrossRef]
  3. Bianchini, A.; Balduzzi, F.; Rosa, D.D.; Ferrara, G. On the use of Gurney Flaps for the aerodynamic performance augmentation of Darrieus wind turbines. Energy Convers. Manag. 2019, 184, 402–415. [Google Scholar] [CrossRef]
  4. Hua, X.; Meng, Q.; Chen, B.; Zhang, Z. Structural damping sensitivity affecting the flutter performance of a 10-MW offshore wind turbine. Adv. Struct. Eng. 2020, 23, 3037–3047. [Google Scholar] [CrossRef]
  5. Dou, B.; Guala, M.; Lei, L.; Zeng, P. Wake model for horizontal-axis wind and hydrokinetic turbines in yawed conditions. Appl. Energy 2019, 242, 1383–1395. [Google Scholar] [CrossRef]
  6. Engineering Thermophysics Research Institute. In-Depth Exploration of Wind Turbine Blades: Understanding Their Basic Structure and Airfoil Design. Available online: https://baijiahao.baidu.com/s?id=1823514378729378871&wfr=spider&for=pc (accessed on 25 October 2025).
  7. Jauregui, B.I.; Angel, V.G.; Hernández, M.S.; Durazo-Romero, E.S.; Magaña-Almaguer, H.D.; Vargas-Osuna, L.E.; González, V.B. Experimental Analysis of low-energy impact damage in composite material airfoils. Fibers 2025, 13, 67. [Google Scholar] [CrossRef]
  8. Shakya, P.; Thomas, M.; Seibi, A.C.; Shekaramiz, M.; Masoum, M.A.S. Fluid-structure interaction and life prediction of small-scale damaged horizontal axis wind turbine blades. Results Eng. 2024, 23, 102388. [Google Scholar] [CrossRef]
  9. Zhang, D.; Liu, Z.; Li, W.; Zhang, L.; Cheng, L.; Hu, G. Fluid-structure interaction analysis of wind turbine aerodynamic loads and aeroelastic responses considering blade and tower flexibility. Eng. Struct. 2024, 301, 117289. [Google Scholar] [CrossRef]
  10. Liu, T.; Sun, C.; Li, S.; Zhang, X.; Liu, G. Active control method of trailing-edge flap for suppressing high-frequency vibration of wind turbine blades. Adv. Eng. Sci. 2021, 53, 166–174. [Google Scholar]
  11. Zhou, F.; Yang, J.; Pang, J.; Wang, B. Research on control methods and technology for reduction of large-scale wind turbine blade vibration. Energy Rep. 2023, 9, 912–923. [Google Scholar] [CrossRef]
  12. Fan, Y.; Hu, Y.; Wu, Y.; Li, L. Mechanism of interconnected synchronized switch damping for vibration control of blades. Chin. J. Aeronaut. 2023, 36, 207–228. [Google Scholar] [CrossRef]
  13. Taha, H.E.; Kiani, M.; Hedrick, T.L.; Greeter, J.S.M. Vibrational control: A hidden stabilization mechanism in insect flight. Sci. Robot. 2020, 5, eabb1502. [Google Scholar] [CrossRef] [PubMed]
  14. Xue, D.Y. Computer Aided Control Systems Design Using MATLAB Language, 4th ed.; Tsinghua University Publishing Company: Beijing, China, 2022; pp. 155–162. [Google Scholar]
  15. Kim, T.; Dugundji, J. Nonlinear large amplitude aeroelastic behavior of composite rotor blades. AIAA J. 1993, 31, 1489–1497. [Google Scholar] [CrossRef]
  16. Dhital, K.; Chouvion, B. Passive aeroelastic control of a near-ground airfoil with a nonlinear vibration absorber. Aerospace 2024, 11, 1043. [Google Scholar] [CrossRef]
  17. Pagwiwoko, C.P.; Jezequel, L. Analysing Non-Linear Flutter Vibrations Using System Dynamic Approach. Available online: https://www.intechopen.com/chapters/66567 (accessed on 27 September 2025).
  18. Liu, J. Robot Control System Design and MATLAB Simulation. In The Advanced Design Method, 2nd ed.; Tsinghua University Publishing Company: Beijing, China, 2023; pp. 104–112. [Google Scholar]
  19. Thach, N.D.; Shyam, K.; Rajesh, K.P. Fractional-Order System: Control Theory and Applications; MDPI: Basel, Switzerland, 2023. [Google Scholar] [CrossRef]
  20. Feng, J.; Zhao, Z.; Chen, M.; Jiang, R.; Liu, Y.; Wang, D. Study on dynamic stall characteristics of wind turbine airfoil under compound motion. Acta Energiae Solaris Sin. 2023, 44, 430–436. [Google Scholar]
  21. Akram, M.T.; Kim, M.-H. Aerodynamic shape optimization of NREL S809 airfoil for wind turbine blades using reynolds-averaged Navier Stokes model—Part II. Appl. Sci. 2021, 11, 2211. [Google Scholar] [CrossRef]
  22. Yi, C.H.; Sun, C.L.; Sun, Q.T.; Liu, T. Flutter suppression of wind turbine blade based on RBF compensation the sliding mode pitch control. J. Shandong Univ. Sci. Technol. 2021, 40, 109–117. [Google Scholar]
  23. Chang, L.; Yu, Y.; Liu, T. Aeroelastic vibration analysis of wind turbine blade with Gurney flap. Proc. Inst. Mech. Eng. Part C J. Mech. Eng. Sci. 2021, 235, 4913–4925. [Google Scholar] [CrossRef]
  24. Li, S. Blade Design, Aerodynamic Performance and Vibration Control of Large Wind Turbine. Master’s Thesis, Shandong University of Science & Technology, Qingdao, China, 2022. [Google Scholar]
  25. Cai, J.; Zhang, Y. Differences between Kaimal and Von Karman turbulence spectrum models in wind turbine load calculation. Wind Energy 2012, 3, 80–84. (In Chinese) [Google Scholar]
  26. Liu, T.; Cui, Q.; Zhao, K.; Gong, A. Stall nonlinear aeroelastic effects and active control of thin-walled composite blade with piezoelectric patches embedded. Proc. Inst. Mech. Eng. Part G J. Aerosp. Eng. 2023, 237, 2054–2073. [Google Scholar] [CrossRef]
  27. Liu, T.; Sun, C.; Zhang, X.; Li, S. A Unified Pitch System and Pitch Method for Small Wind Turbine Blades. CN112431717B, 26 November 2021. [Google Scholar]
Figure 1. Longitudinal cracking of the main beam of the base with web plate support.
Aerospace 12 01023 g001
Figure 2. The three-blade system based on pitch driving using a screw rod–nut structure. (a) Variable pitch system and wind turbine structure. (b) The screw rod–nut structure and the ball bearing. (c) The cross-sectional airfoil parameters and HFMV aerodynamic forces.
Aerospace 12 01023 g002
Figure 3. The fitting effect of nut displacement and pitch angle: (a) linkage mechanism and motion displacement relationship diagram; (b) the fitting effect of nut displacement h and pitch angle β .
Aerospace 12 01023 g003
Figure 4. The NTVA structure and parameters.
Aerospace 12 01023 g004
Figure 5. Artificial damping coefficient and flutter wind speed: (a) damping coefficient and flutter wind speed position without the NTVA; (b) damping coefficient and flutter wind speed position with NTVA enhancement.
Aerospace 12 01023 g005
Figure 6. Control result based on U = 8 m∙s−1: (a) the uncontrol/controlled flap-wise/twist displacements; (b) maximum fluctuation range of the phase plane and fitness curve; (c) pitch angles and the pitch driving force; (d) time response of NTVA mass.
Aerospace 12 01023 g006aAerospace 12 01023 g006b
Figure 7. Flap-wise/twist displacement responses before and after PD control under the three speed conditions (the three colored lines of red, green, and blue represent the fluctuations when U = 10, U   = 8, and U   = 5 m·s−1, respectively): (a) flapping displacement under three different wind conditions; (b) twist displacement under three different wind conditions.
Aerospace 12 01023 g007
Figure 8. Controller hardware system and OLE solution: (a) PLC system; (b) touch screen displaying the twist/flap-wise displacement after control; (c) OLE communication planning.
Aerospace 12 01023 g008
Figure 9. The driving force fluctuations under the two selected algorithms (the three colored lines of yellow, red, and blue represent the fluctuations when the average turbulent wind speeds are 10, 8, and 5 m·s−1, respectively).
Aerospace 12 01023 g009
Figure 10. The pitch angles based on FOPD (the three colored lines of yellow, red, and blue represent the fluctuations when U = 10, U = 8, and U = 5 m·s−1, respectively).
Aerospace 12 01023 g010
Figure 11. The wind speed distribution at different time points in the wind turbine rotor plane and hub height, respectively: (a) under 10% turbulence intensity; (b) under 20% turbulence intensity.
Aerospace 12 01023 g011
Figure 12. The overall structure of the blade, the blade flow field and mesh division, and the flapping bending moment: (a) the overall structure of the blade; (b) the blade flow field and mesh division; (c) the flap bending moment.
Aerospace 12 01023 g012
Figure 13. Comparison of various modes of vibration between the rectangular cross-section and S825 airfoil: (a) first-order flapping; (b) second-order flapping; (c) third-order flapping; (d) first-order twist.
Aerospace 12 01023 g013aAerospace 12 01023 g013b
Table 1. The blade parameters and other structure parameters.
SymbolQuantityValues
cChord length1 m
ωyNatural frequency8 rad·s−1
ωθNatural frequency2π rad·s−1
ρbMass per length of blade10 kg·m−1
ICGRotational inertia10 kg·m
UWind speed8, 5, 10 m·s−1
aSum of the lengths of the two connecting rods2 m
R0Crank radius0.8
ξyDamping ratio0.6
ξθDamping ratio0.1
ξzDamping ratio0.85
eDistance between the two centers0.1 m
ΩAngular frequency0.838 rad·s−1
MbEquivalent slider mass30 kg·m−1
rDistance between the cross-sectional element and the blade root2 m
Disclaimer/Publisher’s Note: The statements, opinions and data contained in all publications are solely those of the individual author(s) and contributor(s) and not of MDPI and/or the editor(s). MDPI and/or the editor(s) disclaim responsibility for any injury to people or property resulting from any ideas, methods, instructions or products referred to in the content.