Article

Construction of Sampling Disturbance Model of Lunar Surface

College of Environment and Civil Engineering, Chengdu University of Technology, Chengdu 610059, China
*
Author to whom correspondence should be addressed.
Aerospace 2025, 12(11), 1011; https://doi.org/10.3390/aerospace12111011
Submission received: 18 September 2025 / Revised: 6 November 2025 / Accepted: 10 November 2025 / Published: 13 November 2025
(This article belongs to the Section Astronautics & Space Science)

Abstract

This study establishes a dynamic evolution model of the physical and mechanical properties of lunar simulant as a function of sampling-induced disturbance on the lunar surface, aiming to eliminate design errors in sampling missions caused by neglecting the disturbance of lunar soil. A standard probe was inserted into the lunar soil simulant both before and after disturbance, and the variation in penetration resistance at the exact location was proposed as an indicator of the regolith’s disturbance state. Compression tests and disturbance tests were conducted on CUG-1A lunar soil simulant, with the experimental results subjected to regression analysis and neural network prediction. Based on the compression tests, a regression equation was derived relating the slope of the probe penetration resistance to the internal friction angle and density of the lunar soil simulant, showing a strong correlation between predicted and actual values. The disturbance tests provided penetration resistance curves under various disturbance conditions. By integrating these two components, a correspondence was established between the disturbance conditions and the internal friction angle and density of the lunar soil simulant. The predictive performance of three typical neural network algorithms—LM, BR, and SCG—with varying numbers of neurons was compared. The LM algorithm with 10 neurons was selected for its superior performance. Ultimately, a sampling disturbance model was developed to predict the internal friction angle and density of the lunar soil simulant based on disturbance conditions, demonstrating an extremely high correlation between predicted and actual values.

1. Introduction

As the closest celestial body to Earth, the Moon, with its abundant mineral and energy resources along with its unique space environment, has long been a significant focus of global space exploration efforts [1,2]. The successful completion of the three phases—orbiting, landing, and returning—of China’s Chang’e Project has established China as the third nation, after the United States and the former Soviet Union, to successfully retrieve samples from the Moon [3,4]. Regarding sampling methodologies, subsequent international missions have predominantly relied on unmanned, autonomous sampling operations, with the notable exception of the early Apollo program, which involved astronaut participation [5]. Experience from the Soviet Luna program indicated that unmanned deep drilling, due to its complex technology and tooling, was associated with a relatively high failure rate [6]. In contrast, shallow surface sampling offers advantages in terms of simpler technology and tools, leading to higher success rates, and thus serves as an effective complement to deep drilling [7,8]. The Chang’e missions successfully employed a combined approach of deep drilling and surface scooping to collect samples, with the sample mass obtained by surface scooping exceeding that from deep drilling [9]. In terms of sampling locations, the six successful Apollo landings collected approximately 382 kg of samples, including surface regolith and deep-seated rocks from various locations such as maria, rilles, and highlands [10]. The Luna program successfully gathered about 326 g of lunar soil from three different maria regions on the lunar nearside [10]. Chang’e-5 and Chang’e-6 collected approximately 3666 g of samples, comprising surface regolith and subsurface rocks, from a nearside mare and a farside basin region, respectively [11,12].
Studies have revealed that research on the surface lunar soil can provide detailed information regarding the early evolutionary history of the solar system, the properties of the solar wind and its radiation effects on exposed regolith, the record of meteorite impacts, as well as the composition, distribution characteristics, and evolutionary history of the lunar crust. Surface samples possess value equally important to that of deep-seated samples [4,13]. Consequently, the methodology for sampling the lunar surface regolith also requires in-depth investigation. Surface sampling techniques for lunar soil are highly flexible and variable, which undoubtedly increases the difficulty of theoretical analysis and optimal design [14]. Therefore, the design of lunar surface sampling operations necessitates a foundational theory based on the intrinsic physical and mechanical properties of the lunar soil, one that can be flexibly applied to different sampling methods. While the physical and mechanical properties of lunar soil in a static state are relatively straightforward to determine, the insertion of a sampling tool inevitably causes disturbance within a specific region of the soil. It remains challenging to determine whether the physical and mechanical properties within this disturbed zone change and, if so, whether such changes affect the further penetration of the sampling tool.
Currently, there is a lack of specific research on lunar soil disturbance, whereas studies on terrestrial soil disturbance are relatively abundant. As early as 1949, Hvorslev introduced the concept of soil disturbance, proposing the use of pore water pressure changes to assess the degree of disturbance [15]. Desai and Tom, based on compression tests, derived the e-lgp curve (the relationship curve between void ratio and the logarithm of pressure) and defined the degree of soil disturbance using changes in the void ratio (e) [16]. Hu Qi and Xu Sifa alternatively defined the degree of soil disturbance using yield stress and shear strength, respectively [17]. Xu Yongfu hypothesised that under the condition of isotropic strain, the degree of soil disturbance could be defined using shear strain (γ) and the axial strain (ε) generated under pure shear conditions [18]. It is evident that the quantitative description of soil disturbance predominantly relies on experimental measurements of changes in physical and mechanical properties to characterise the degree of disturbance. However, for granular materials like lunar soil, using traditional experimental methods to test these properties would inevitably induce secondary disturbance, making this approach unsuitable for assessing its disturbance state. Missions to other extraterrestrial bodies, such as the ESA Rosetta mission and the NASA InSight mission, have similarly demonstrated that standard laboratory measurement methods cannot be directly applied to determine their physical and mechanical properties. The established solution is to employ a Low Velocity Penetrator for in situ testing of the planetary surface [19,20]. This method was also employed in the self-recording penetrometers carried by Apollo 15 and Apollo 16 for lunar exploration [21]. During these missions, astronauts inserted a conical-tipped cylinder into the lunar soil, and a recorder documented the penetration depth and force. Following this established approach, this study proposes to use a conical-tipped probe inserted vertically into the lunar soil simulant both before and after disturbance. The change in the probe’s penetration resistance value at the exact location will be used to characterise the degree of disturbance in the lunar soil simulant.
This study integrates the common shovel-dig sampling method used in lunar surface sampling to conduct a quantitative analysis of the disturbance characteristics of lunar soil under various sampling conditions. It aims to establish a dynamic evolution prediction model for the physical and mechanical properties of lunar soil induced by such disturbance, thereby reducing design errors in sampling missions caused by neglecting regolith disturbance. The findings are expected to provide a theoretical foundation for the future establishment of a lunar space station.

2. Experimental Procedure

The experimental procedure is illustrated in Figure 1. According to the common shovel-dig sampling method on the lunar soil surface [22], a lunar soil simulant disturbance experiment was conducted to obtain determine the probe penetration resistance of the lunar soil simulant under various disturbance conditions. To correlate the penetration resistance with conventional physical and mechanical parameters, compression tests were also performed on the lunar soil simulant. These tests measured both the physical and mechanical parameters as well as the corresponding probe penetration resistance under different compaction conditions. A regression analysis was subsequently employed to establish the relationship between these two sets of variables. By using the probe penetration resistance as an intermediate variable, the results from both the disturbance tests and the compression tests were integrated to establish a direct correspondence between the disturbance conditions and the physical/mechanical parameters of the lunar soil simulant. This correspondence was then used to train a neural network model, ultimately yielding a predictive model capable of estimating the physical and mechanical parameters of the lunar soil simulant based on the given disturbance conditions.

3. Physical Experiments

3.1. Selection of Characteristic Parameters

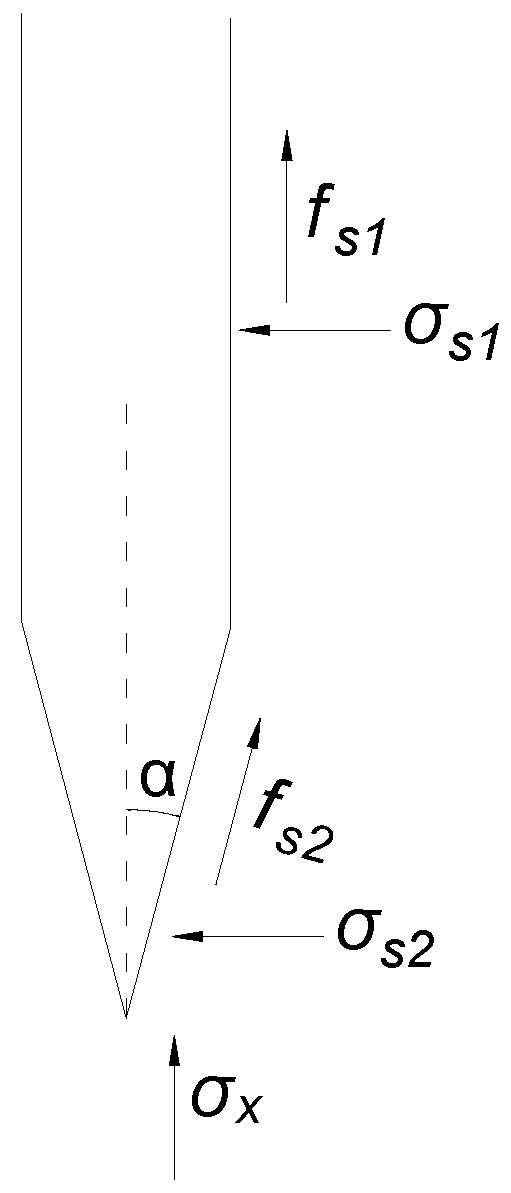
A theoretical analysis of the penetration resistance during probe insertion into the lunar soil simulant was conducted. This analysis serves two primary purposes: to validate the rationale for using variation in probe penetration resistance as an indicator of the degree of lunar soil disturbance, and to identify the relevant physical and mechanical characteristic parameters. The resistance experienced by the probe during penetration into the simulated lunar soil consists of two distinct components: frictional resistance along the shaft and end resistance at the tip. Figure 2 illustrates the geometry of the probe employed for measuring penetration resistance and the corresponding force distribution during its insertion into the simulated lunar soil. To facilitate the analysis of the probe’s force state, the probe is divided into two distinct regions: the conical tip and the lateral surface, each of which is subjected to separate force analysis. The lateral surface of the probe is primarily subjected to two types of forces: horizontal static soil pressure (σs1) and frictional stress (fs1) acting parallel to the surface. The conical tip is subjected to three distinct forces: horizontal static soil pressure (σs2), frictional stress (fs2) acting parallel to the conical surface, and the ultimate bearing capacity (σx) exerted by the simulated lunar soil. The penetration resistance experienced by the probe is defined as the resultant of all vertical component forces acting on it.
(1)
Stress analysis of the lateral surface
The frictional force acting on the lateral surface of the probe is induced by the static soil pressure (σs1) exerted on that surface.
f s 1 = μ σ s 1 = μ K γ h 1
where K—the static soil pressure coefficient of lunar soil, 1-sinφ;
φ—the angle of internal friction of lunar soil, °;
γ—unit weight of lunar soil, γ = ρg;
h1—the depth at any point along the lateral surface, m;
μ—the coefficient of friction between the lunar soil and the probe.
(2)
Stress analysis of the conical surface
The frictional force acting on the conical surface results from the resultant stress (σT), which is the vector sum of the static soil pressure (σs2) and the ultimate bearing capacity (σx) of lunar soil in the tangential direction of the conical surface.
σ s 2 = K γ h 2
where h2—the depth at any point along the conical surface, m;
The ultimate bearing capacity derived from the Tresca criterion is:
σ x = c N c + q N q = c N c + γ h 2 N q
where c—cohesion of lunar soil;
Nc, Nq—ultimate bearing capacity coefficient.
σ T = σ x sin α + σ s 2 cos α = c N c + γ h 2 N q sin α + K γ h 2 cos α
Determine the frictional stress (fs2):
f s 2 = μ σ T = μ c N c + γ h 2 N q sin α + K γ h 2 cos α
(3)
Force analysis of the lateral surface
The magnitude of the vertical force acting on the lateral surface of the probe is:
F 1 = b h f s 1 π R d h 1 = 1 2 μ K γ π R ( h 2     b 2 )
where b—the height of the tip of the probe cone, m;
h—the depth at which the tip of the probe cone is inserted into the soil, m.
(4)
Force analysis of the conical surface
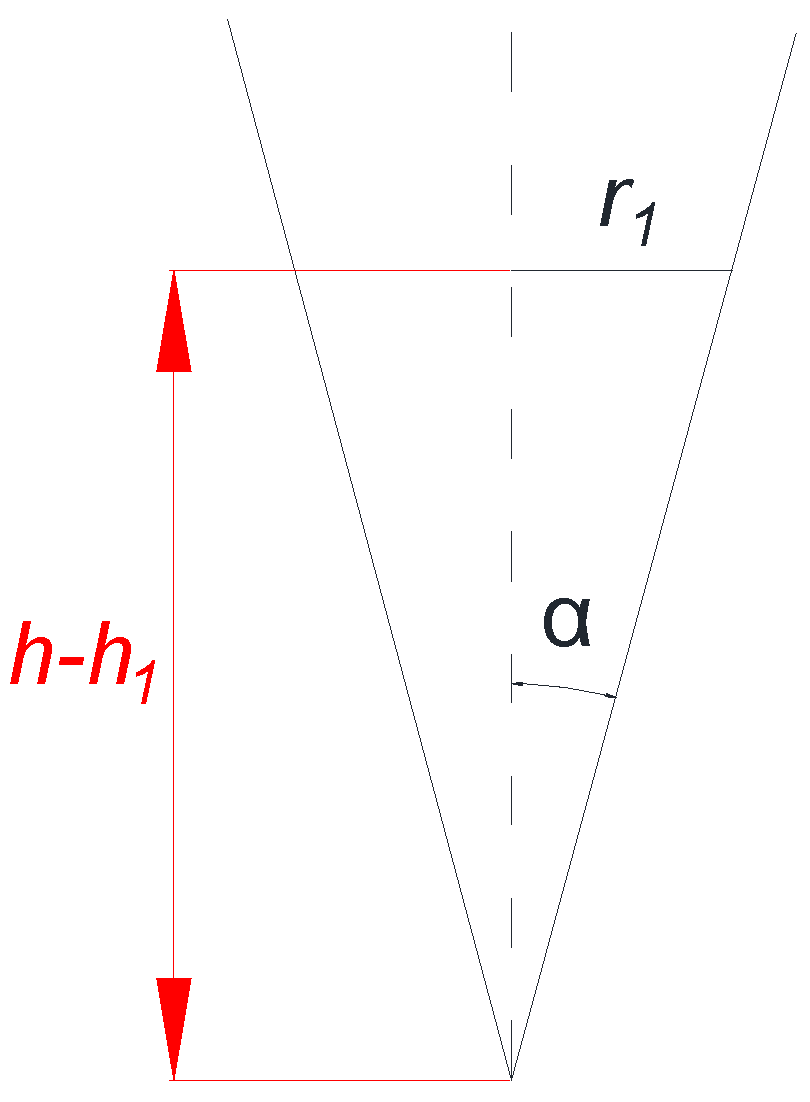
The dimensions of the probe tip are shown in Figure 3. The magnitude of the end resistance force exerted on the probe is:
F x = h b h σ X π R 2 2 · h     b b d h 2
where R—probe diameter, m.
r 1 = h h 2 tan α
where r1—the radius at any height of the probe tip, m.
The magnitude of the frictional resistance acting on the conical surface of the probe is:
F f = h b h f s 2 2 π r 1 d h 2 = μ 2 π tan α h b h c N c + γ h 2 N q sin α + K γ h 2 cos α h     h 2 d h 2
(5)
Penetration Resistance Analysis of the Probe
F = 1 2 μ 1 sin φ ρ g π R h 2 b 2 + π R 2 h b 4 b h b h c N c + ρ g h 1 N q d h 1                     + μ 2 π sin α h b h c N c + ρ g h 1 N q sin α + 1 sin φ ρ g h 1 cos α h h 1 d h 1
As derived from Equation (10), the penetration resistance of the probe at a given point in the lunar soil is related to the regolith’s density (ρ), internal friction angle (φ), and cohesion (c). When the regolith is disturbed, alterations in these physical and mechanical properties will inevitably lead to changes in the probe penetration resistance. Therefore, the variation in penetration resistance before and after disturbance can be utilised as a comprehensive indicator to characterise the degree of lunar soil disturbance. Studies indicate that lunar soil is an anhydrous, granular material, approximating a cohesionless soil, with minimal cohesion (c), which has a negligible impact on the experimental results [23]. Consequently, cohesion (c) can be treated as a constant during the disturbance process of the lunar soil simulant. Based on this, the internal friction angle (φ) and density (ρ) were ultimately selected as the characteristic physical and mechanical parameters to correlate with disturbance in this study.

3.2. Lunar Soil Simulant for Experiments

The lunar soil simulant used in this study is the CUG-1A type, developed by China University of Geosciences (Wuhan). It is generally loose, powdery, and greyish in colour, with relatively uniform particle size, no significant large grains, and good flowability. Its primary mineral composition includes olivine, pyroxene, and plagioclase, accompanied by minor minerals such as magnetite and apatite. The CUG-1A simulant exhibits highly similar chemical composition, mineralogy, and physical/mechanical properties to the lunar soil from the Apollo 14 landing site. Furthermore, low-density materials were incorporated during its production to reduce its bulk density, enabling it to approximate better the gravitational environment of the Moon [24]. Its physical and mechanical properties are listed in Table 1.
The influence of lunar gravity, as opposed to Earth’s gravity, on this study primarily manifests in its effect on the density of the lunar soil. To address this, the initial density of the lunar soil simulant was set to 1.598 g/cm3, a value approximating the actual density of lunar surface soil. No additional simulation of a low-gravity environment was implemented. However, the internal friction angle of this loose, low-density lunar soil could not be directly measured using conventional laboratory shear tests. For cohesionless, granular materials like lunar soil, both the internal friction angle and the angle of repose are manifestations of their internal frictional characteristics. The macroscopic behaviour of the internal friction angle is effectively represented by the angle of repose, with their values being approximately equal. Consequently, for granular materials such as lunar soil, the measured angle of repose can be validly used as a representative value for the internal friction angle.

3.3. Experimental Testbed

3.3.1. Compaction Experiment

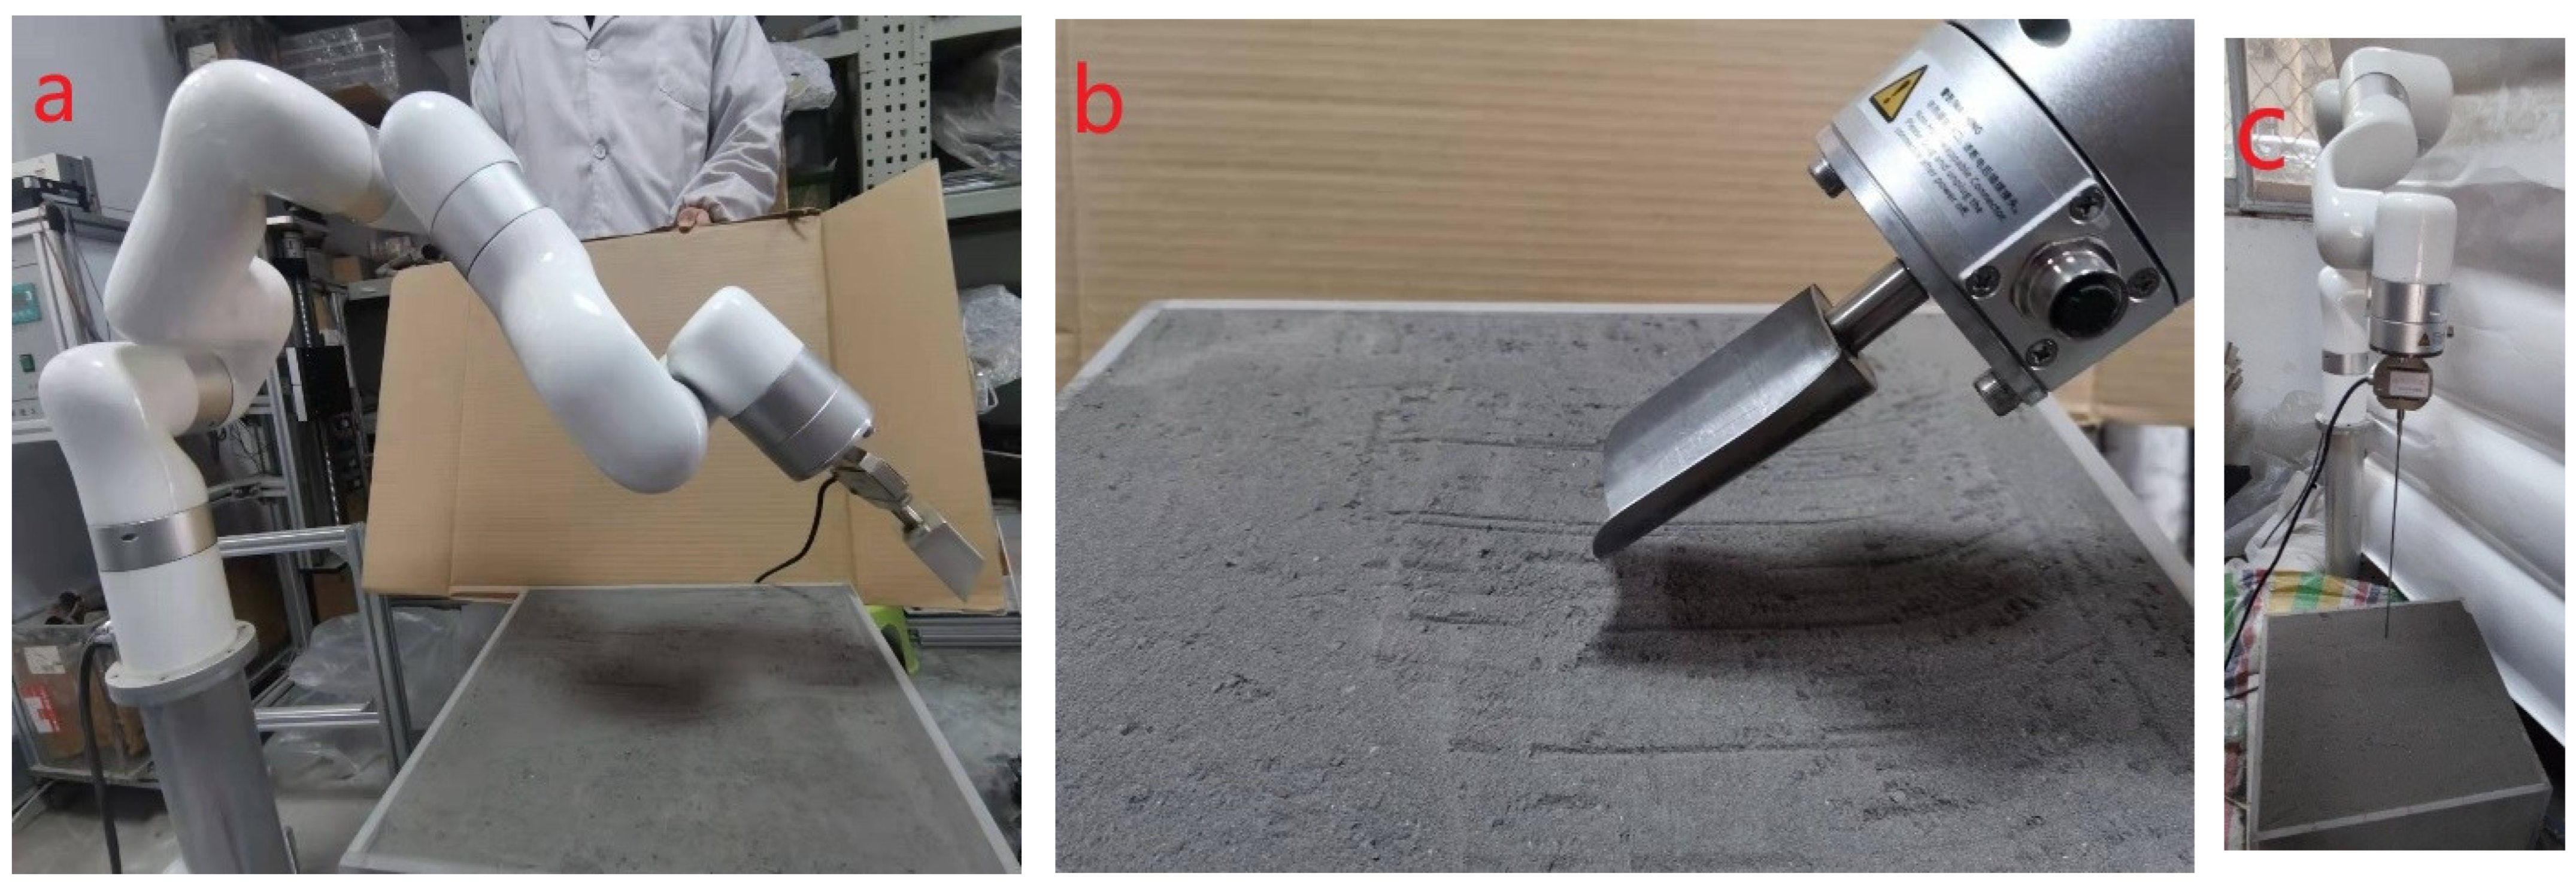
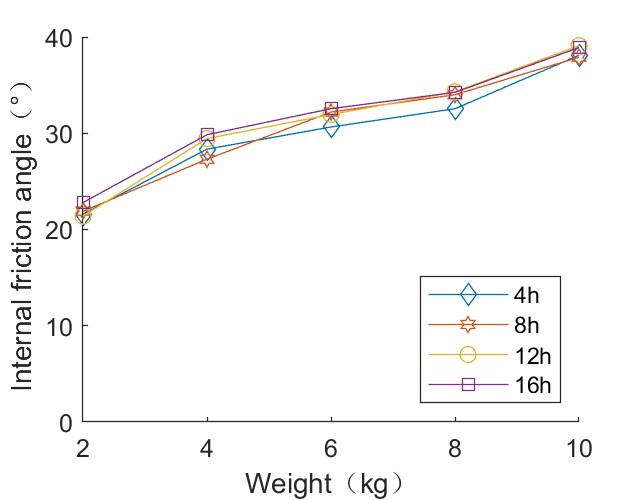
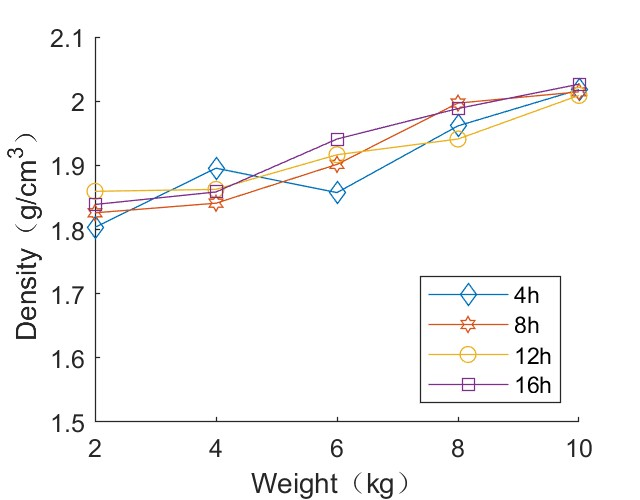
Although Equation (10) illustrates the theoretical relationship between the probe penetration resistance and the regolith’s internal friction angle (φ) and density (ρ), theoretical models are often based on idealised assumptions, leading to significant errors if applied directly. Therefore, this study established the empirical correspondence between probe penetration resistance and the parameters φ and ρ via compaction experiments. The experimental design involved applying pre-compaction weights of 2 kg, 4 kg, 6 kg, 8 kg, and 10 kg, each maintained for durations of 4 h, 8 h, 12 h, and 16 h, constituting a full-factorial experiment. Each test condition was repeated three times, and the average values were calculated for each. The density of the lunar soil simulant after compaction was measured as shown in Figure 4a,b. The angle of repose was measured as depicted in Figure 4c,d; these measured values were used as data for the internal friction angle (φ) of the lunar soil simulant. The probe penetration resistance was tested following the method illustrated in Figure 5c.

3.3.2. Disturbance Experiment

The experimental setup for the disturbance experiment consisted of an xArm6 intelligent 6-axis robotic arm, a tension-compression sensor, a USB-6218 data acquisition card, a sampling tool, and a probe. The xArm6 robotic arm comprises six joint modules, whose movements can be controlled via modular programming within its dedicated software, xArm6 Studio, enabling the end-effector to perform sampling actions under various experimental conditions. As illustrated in Figure 5, the procedure was as follows: First, the xArm6 robotic arm, equipped with the sampling tool as its end-effector, executed a predefined sampling motion to disturb the lunar soil simulant. The resistance force encountered by the sampling tool was measured by the tension-compression sensor attached to its upper section. Subsequently, the sampling tool was replaced with the probe. The robotic arm then inserted the probe vertically into the predetermined hole position. The penetration resistance experienced by the probe was recorded by the tension-compression sensor mounted on its upper end.
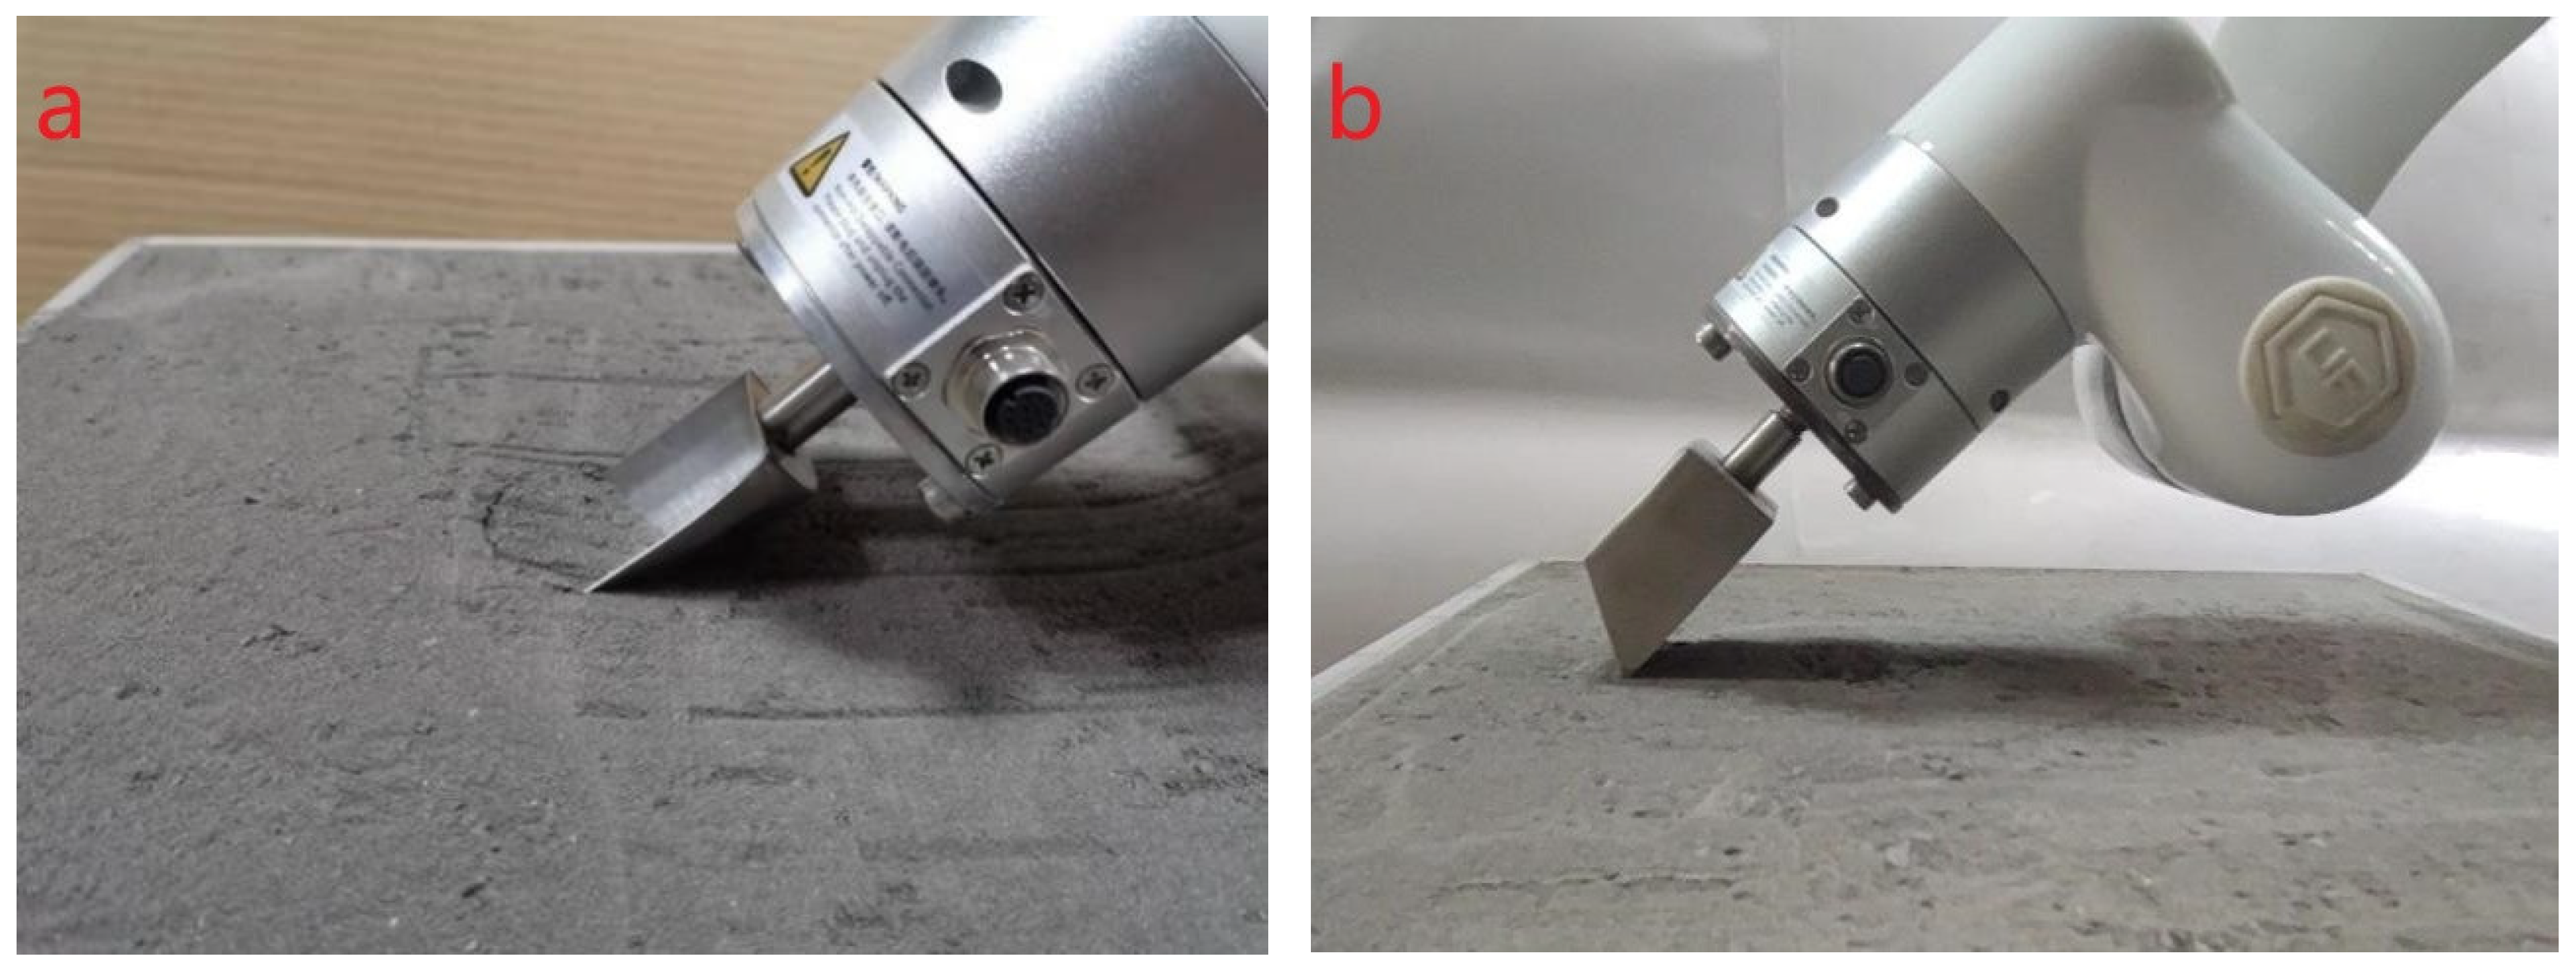
As shown in Figure 6a, the shovelling bucket utilised in the shovel experiment was fabricated by welding a semi-cylindrical steel plate to a semi-circular flat plate. The bucket, driven by the xArm6 robotic arm, was first inserted linearly into the lunar soil simulant at a specific entry angle for a predetermined displacement. It was then vertically withdrawn from the regolith surface. As shown in Figure 6b, the digging bucket used in the dig experiment was constructed by welding together three rectangular plates and two right-trapezoidal plates. Its sampling motion was provided by the rotational movement of Joint 5 of the xArm6 arm, resulting in an arcuate sampling path.
To investigate the influence of four factors—the bucket width of shovelling or digging, depth of shovelling or digging, speed of shovelling or digging, and the entry angle of shovelling—on the probe penetration resistance, a single-factor experimental design was employed. The levels for each factor are listed in Table 2. When varying one factor, the other three were held constant at their median values. The bucket disturbed the simulant according to the set sampling parameters. Subsequently, the probe was inserted 15 cm into the soil, and the penetration resistance data were recorded throughout the process. Each test condition was repeated three times, and the average value was calculated for each. To minimise interference between probe insertion points and container boundary effects, the probe insertion points were arranged as shown in Figure 7, with a spacing of 5 cm in the x-direction and 4.5 cm in the y-direction. The container depth was 18 cm. Prior to each disturbance test, the lunar soil simulant underwent drying and cooling treatments to mitigate the influence of moisture on the experimental results.
Figure 6. Bucket used in disturbance experiment. (a) The shovelling bucket; (b) The digging bucket.
Aerospace 12 01011 g006
Figure 7. Probe entry point bitmap.
Aerospace 12 01011 g007

3.4. Analysis of Experimental Results

3.4.1. Compaction Experiment Results

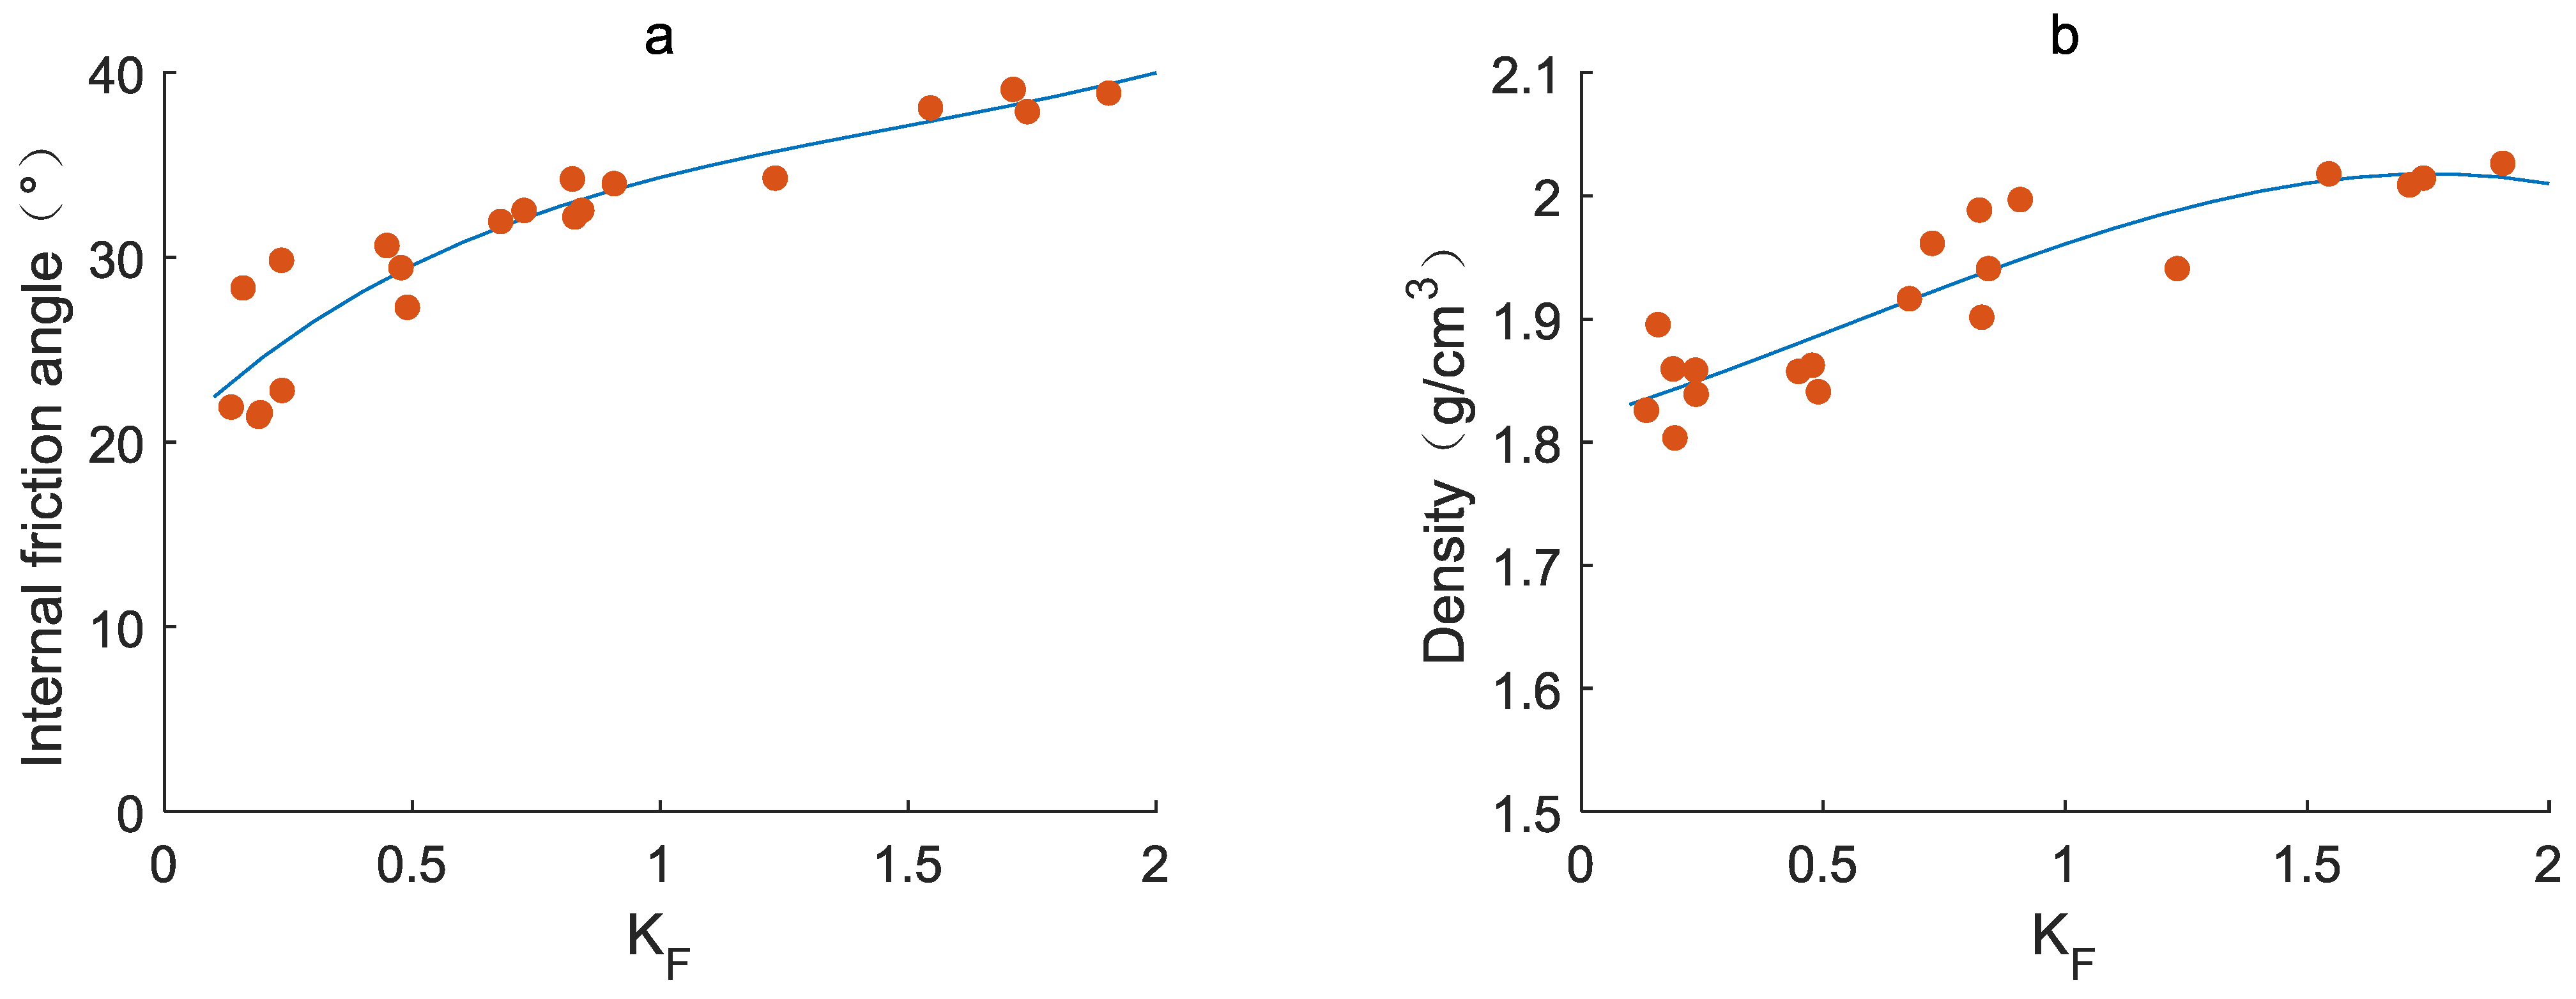
The internal friction angle and density data obtained from the compaction experiment are presented in Figure 8. The measured internal friction angle of the compacted CUG-1A lunar soil simulant ranged from 21.4° to 39.0°. The left panel of Figure 8 shows the variation of the internal friction angle with the applied load after different compaction durations. As illustrated, for a given compaction duration, the internal friction angle increases with the applied load. This is attributed to the higher degree of compaction, which reduces inter-particle porosity and enhances particle interlocking. Conversely, the compaction duration itself exhibited a negligible influence on the internal friction angle, as the lunar soil simulant rapidly reached a compacted state under the applied load, and prolonged duration did not significantly alter the density. The measured density of the compacted lunar soil simulant ranged from 1.804 g/cm3 to 2.027 g/cm3. The right panel of Figure 8 displays the variation in density with the applied load for different compaction times. Consistent with the trend observed for the internal friction angle, the density increases with the applied load for a specific compaction time. Similarly, the duration of compaction had a minimal effect on the final density of the lunar soil simulant.
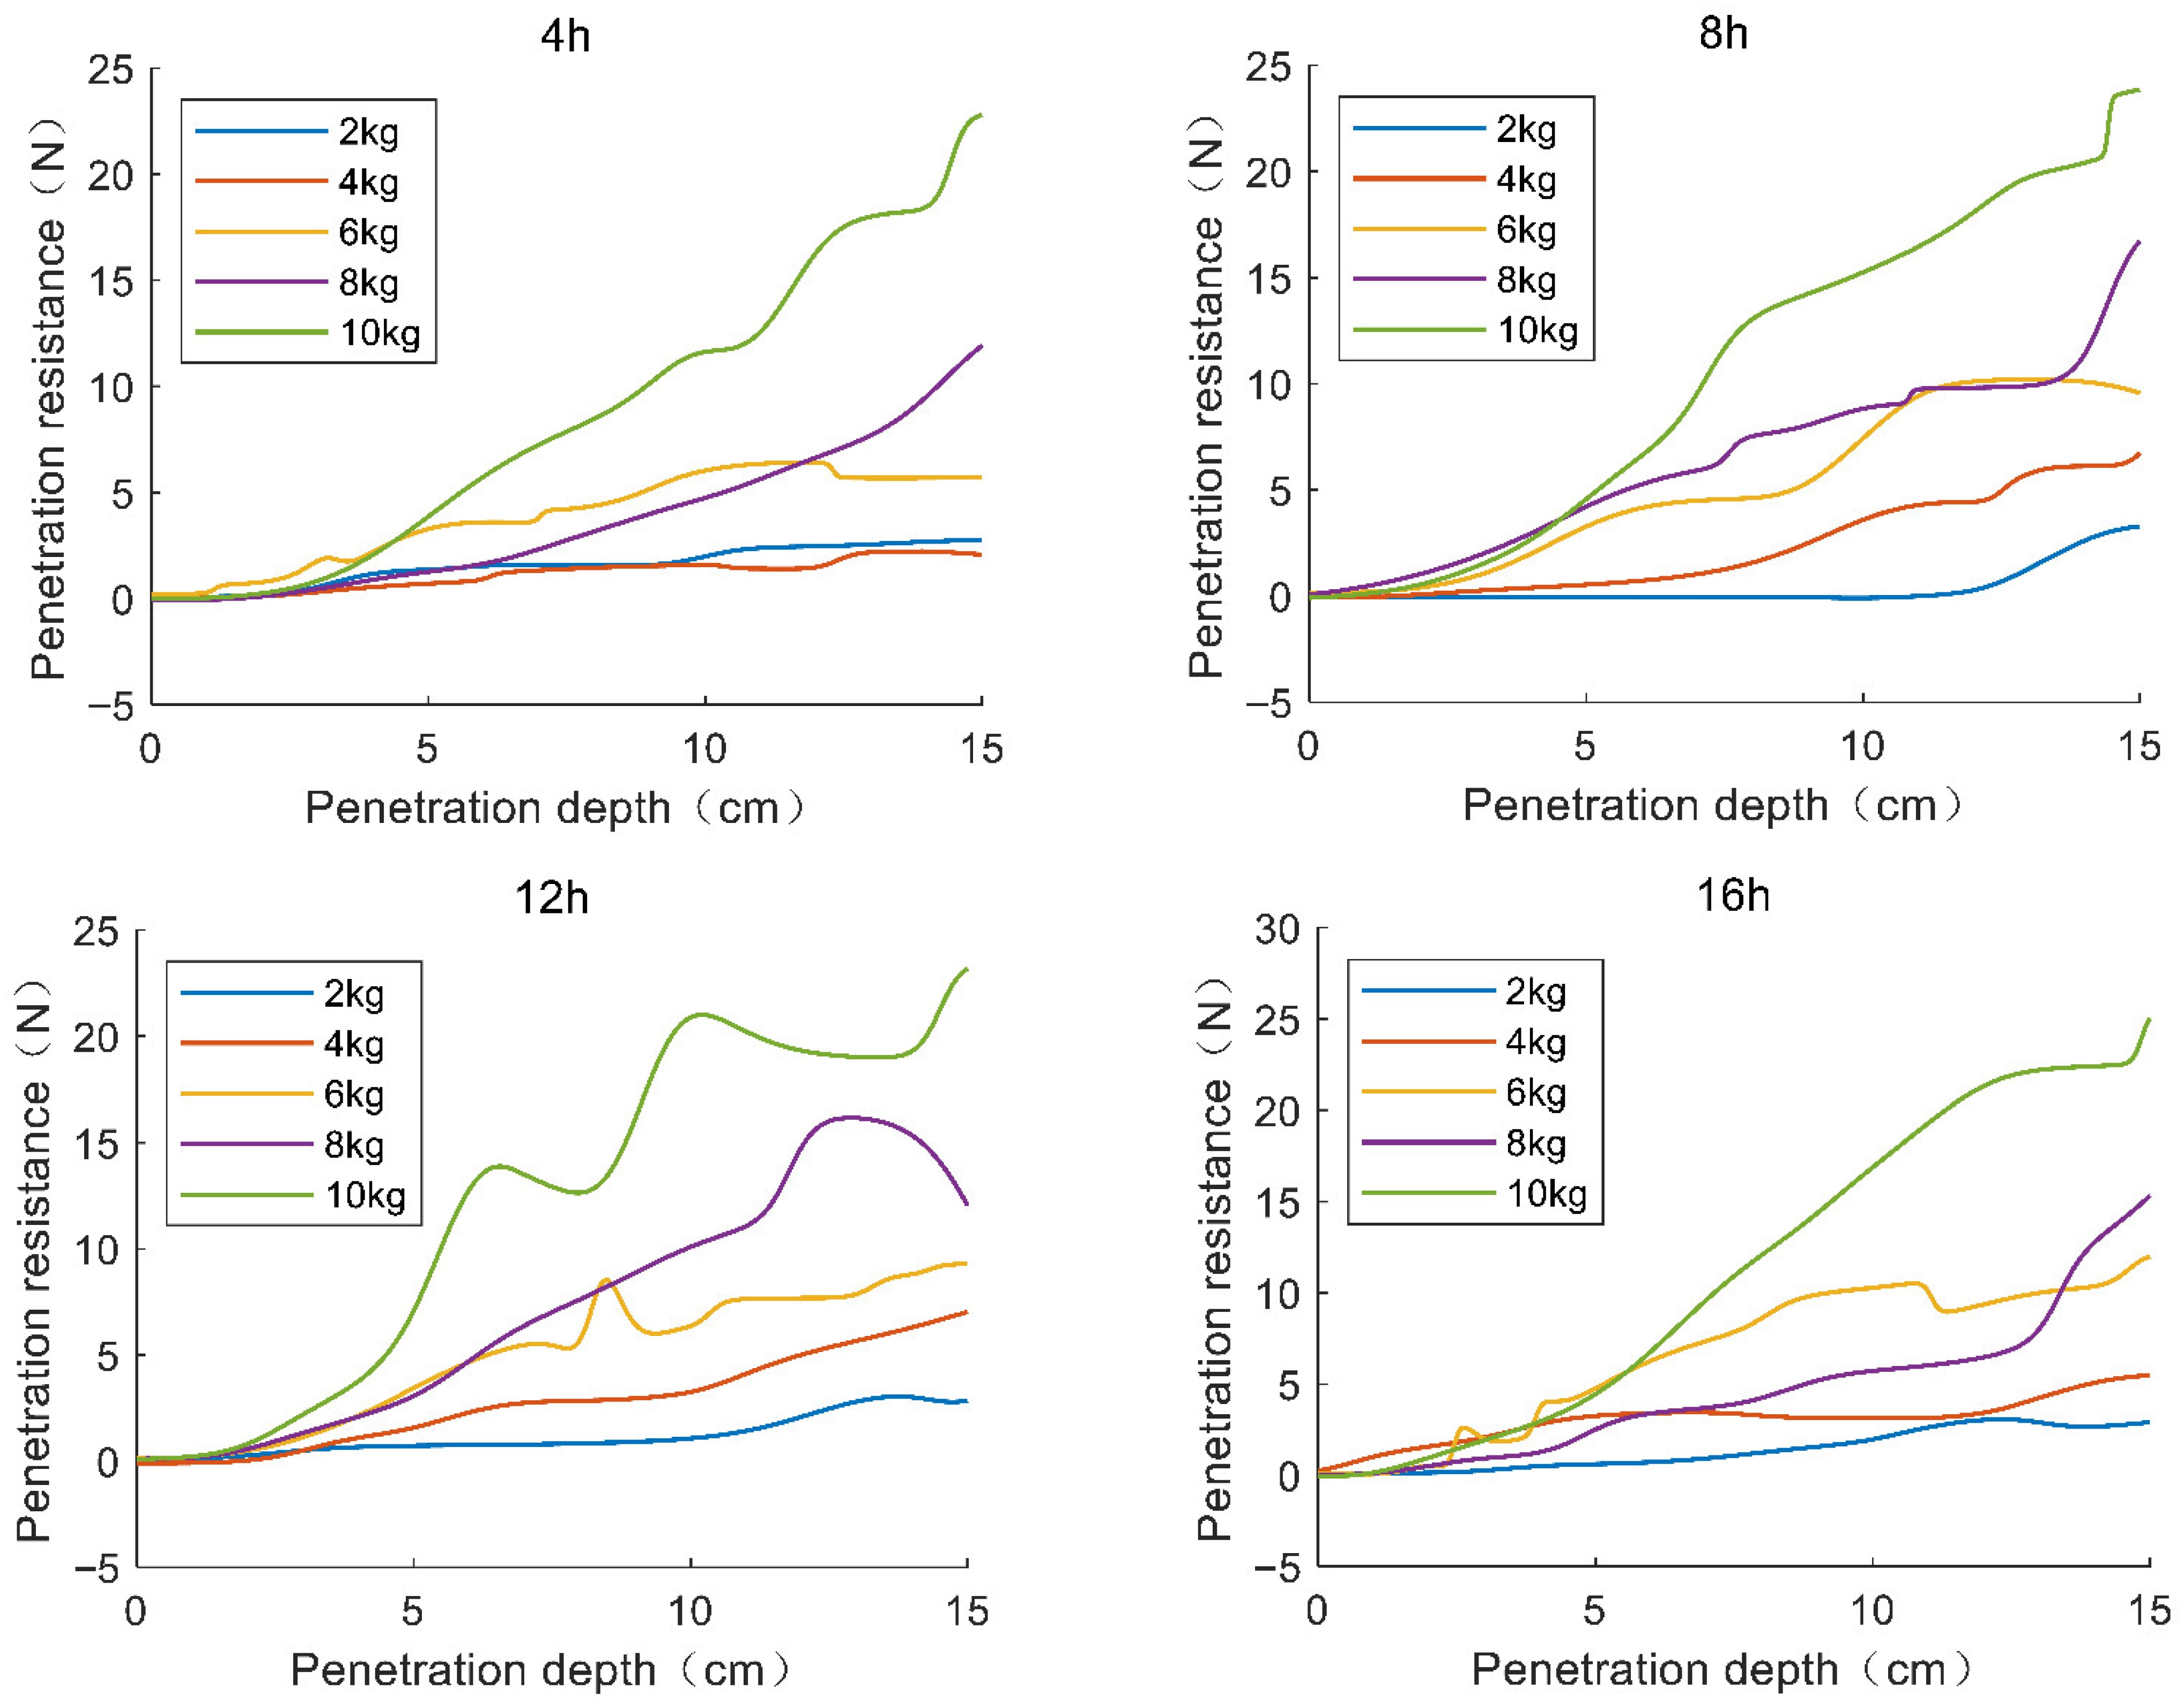
Figure 9 shows the probe penetration resistance curves of the lunar soil simulant after applying different loads for varying durations. As illustrated, the penetration resistance increases with the applied load. However, the high density of data points in each curve makes direct comparison and analysis difficult. Although the curves exhibit some fluctuations, they can be approximately represented as linear trends. Therefore, each penetration resistance curve can be characterised by two parameters: the peak resistance (Fmax) and the slope (kF). The magnitude of the peak value is influenced not only by the slope but also by the initial resistance value. Furthermore, as indicated by Equation (10), the internal friction angle (φ) and density (ρ) of the lunar soil simulant primarily affect the slope of the penetration resistance curve. Consequently, this study focuses on investigating the relationship between the slope of the penetration resistance curve (kF) and the simulant’s internal friction angle (φ) and density (ρ).
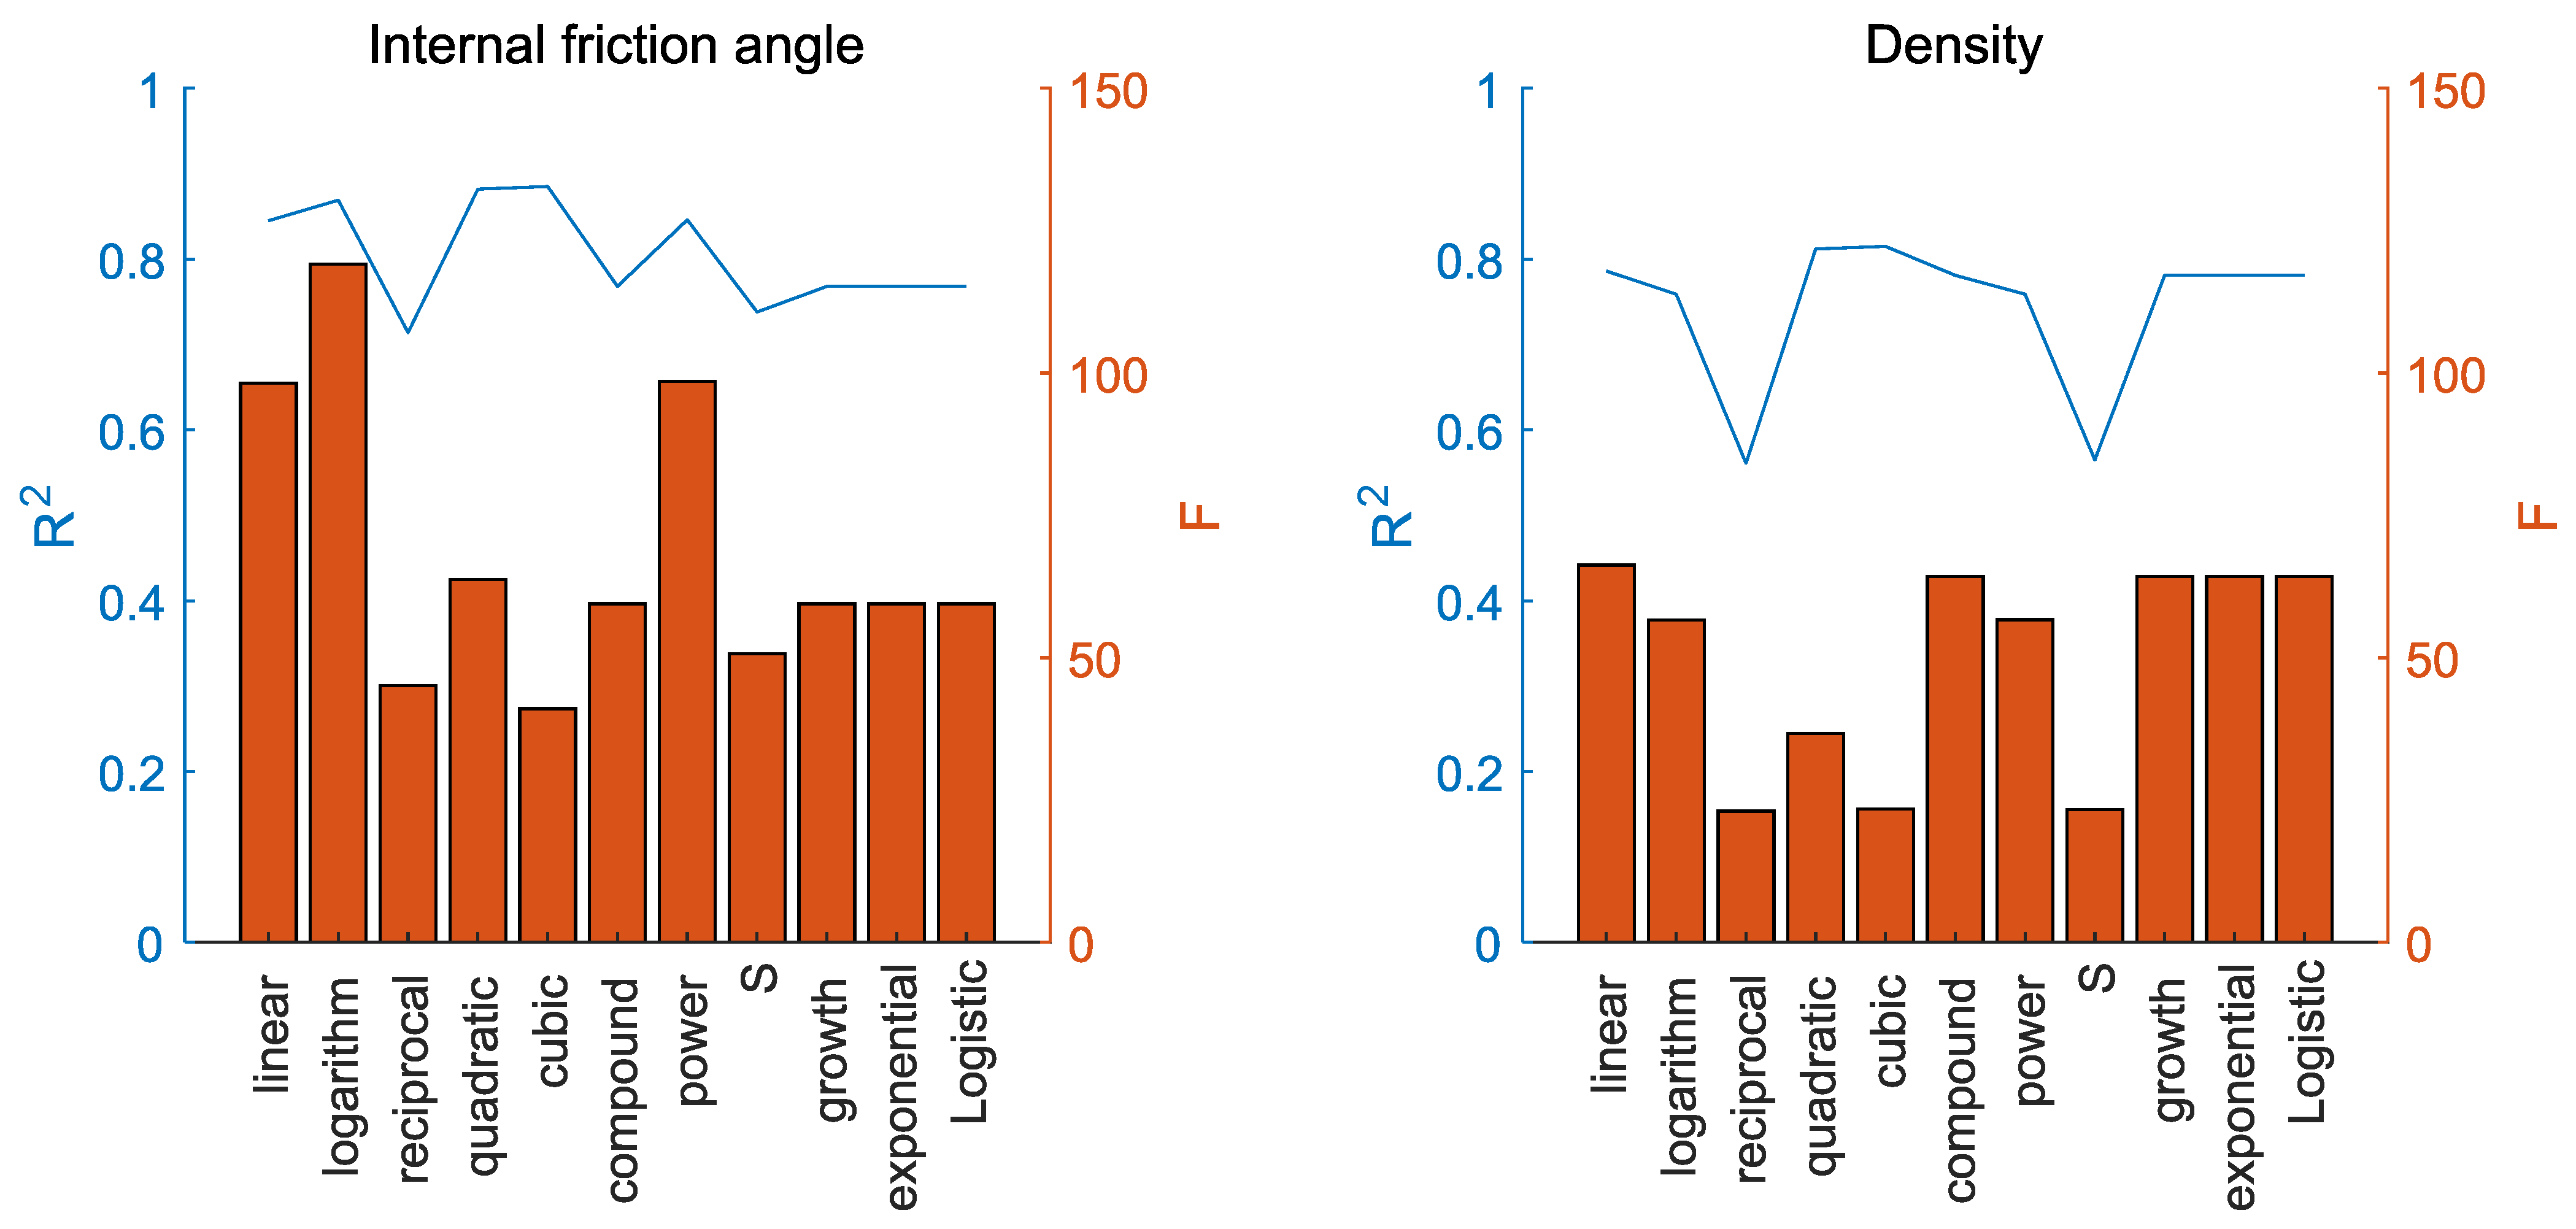
As indicated by Equation (10), a relationship exists between the slope kF and both sinφ and ρ. However, directly calculating the internal friction angle and density of the lunar soil simulant using Equation (10) results in significant errors. Therefore, regression analysis was performed on the experimental data to establish the relationship between kF and sinφ, ρ. A comparison of the prediction accuracy for various regression methods is shown in Figure 10. The curves in the figure represent the R2 values, while the histograms represent the F-values for each method. The left panel of Figure 10 shows the predictions for the internal friction angle. Among the methods evaluated, cubic regression achieved the highest R2 value (0.885) and the lowest F-value (41.038), indicating that its predictions are the most accurate in relation to the actual values. Consequently, the relationship between the internal friction angle φ of the lunar soil simulant and the penetration resistance slope kF is best represented by Equation (11). A comparison between the experimental data and the fitted model is shown in the left panel of Figure 11. The scatter points represent the experimental data for the internal friction angle, and the blue curve represents the fitted cubic regression model, demonstrating a high prediction accuracy.
φ = arcsin ( 0.064 k F 3 0.274 k F 2 + 0.530 k F + 0.363 )
The right panel of Figure 10 presents the prediction results for the density of the lunar soil simulant. The cubic regression achieved the highest R2 value (0.815) and the lowest F-value (23.430), indicating that its predictions are the most accurate in relation to the actual values. Therefore, the relationship between the density (ρ) of the lunar soil simulant and the slope of the penetration resistance (kF) can be expressed by Equation (12). A comparison between the experimental data and the fitted model is shown in the right panel of Figure 11, demonstrating a high prediction accuracy.
ρ = 0.035 k F 3 + 0.058 k F 2 + 0.120 k F + 1.818
Subsequently, the internal friction angle and density of the lunar soil simulant were calculated at different locations and under various experimental conditions. This was achieved by applying the probe penetration resistance data, measured under different disturbance conditions from the disturbance tests, shown in Equations (11) and (12).

3.4.2. Disturbance Experimental Results

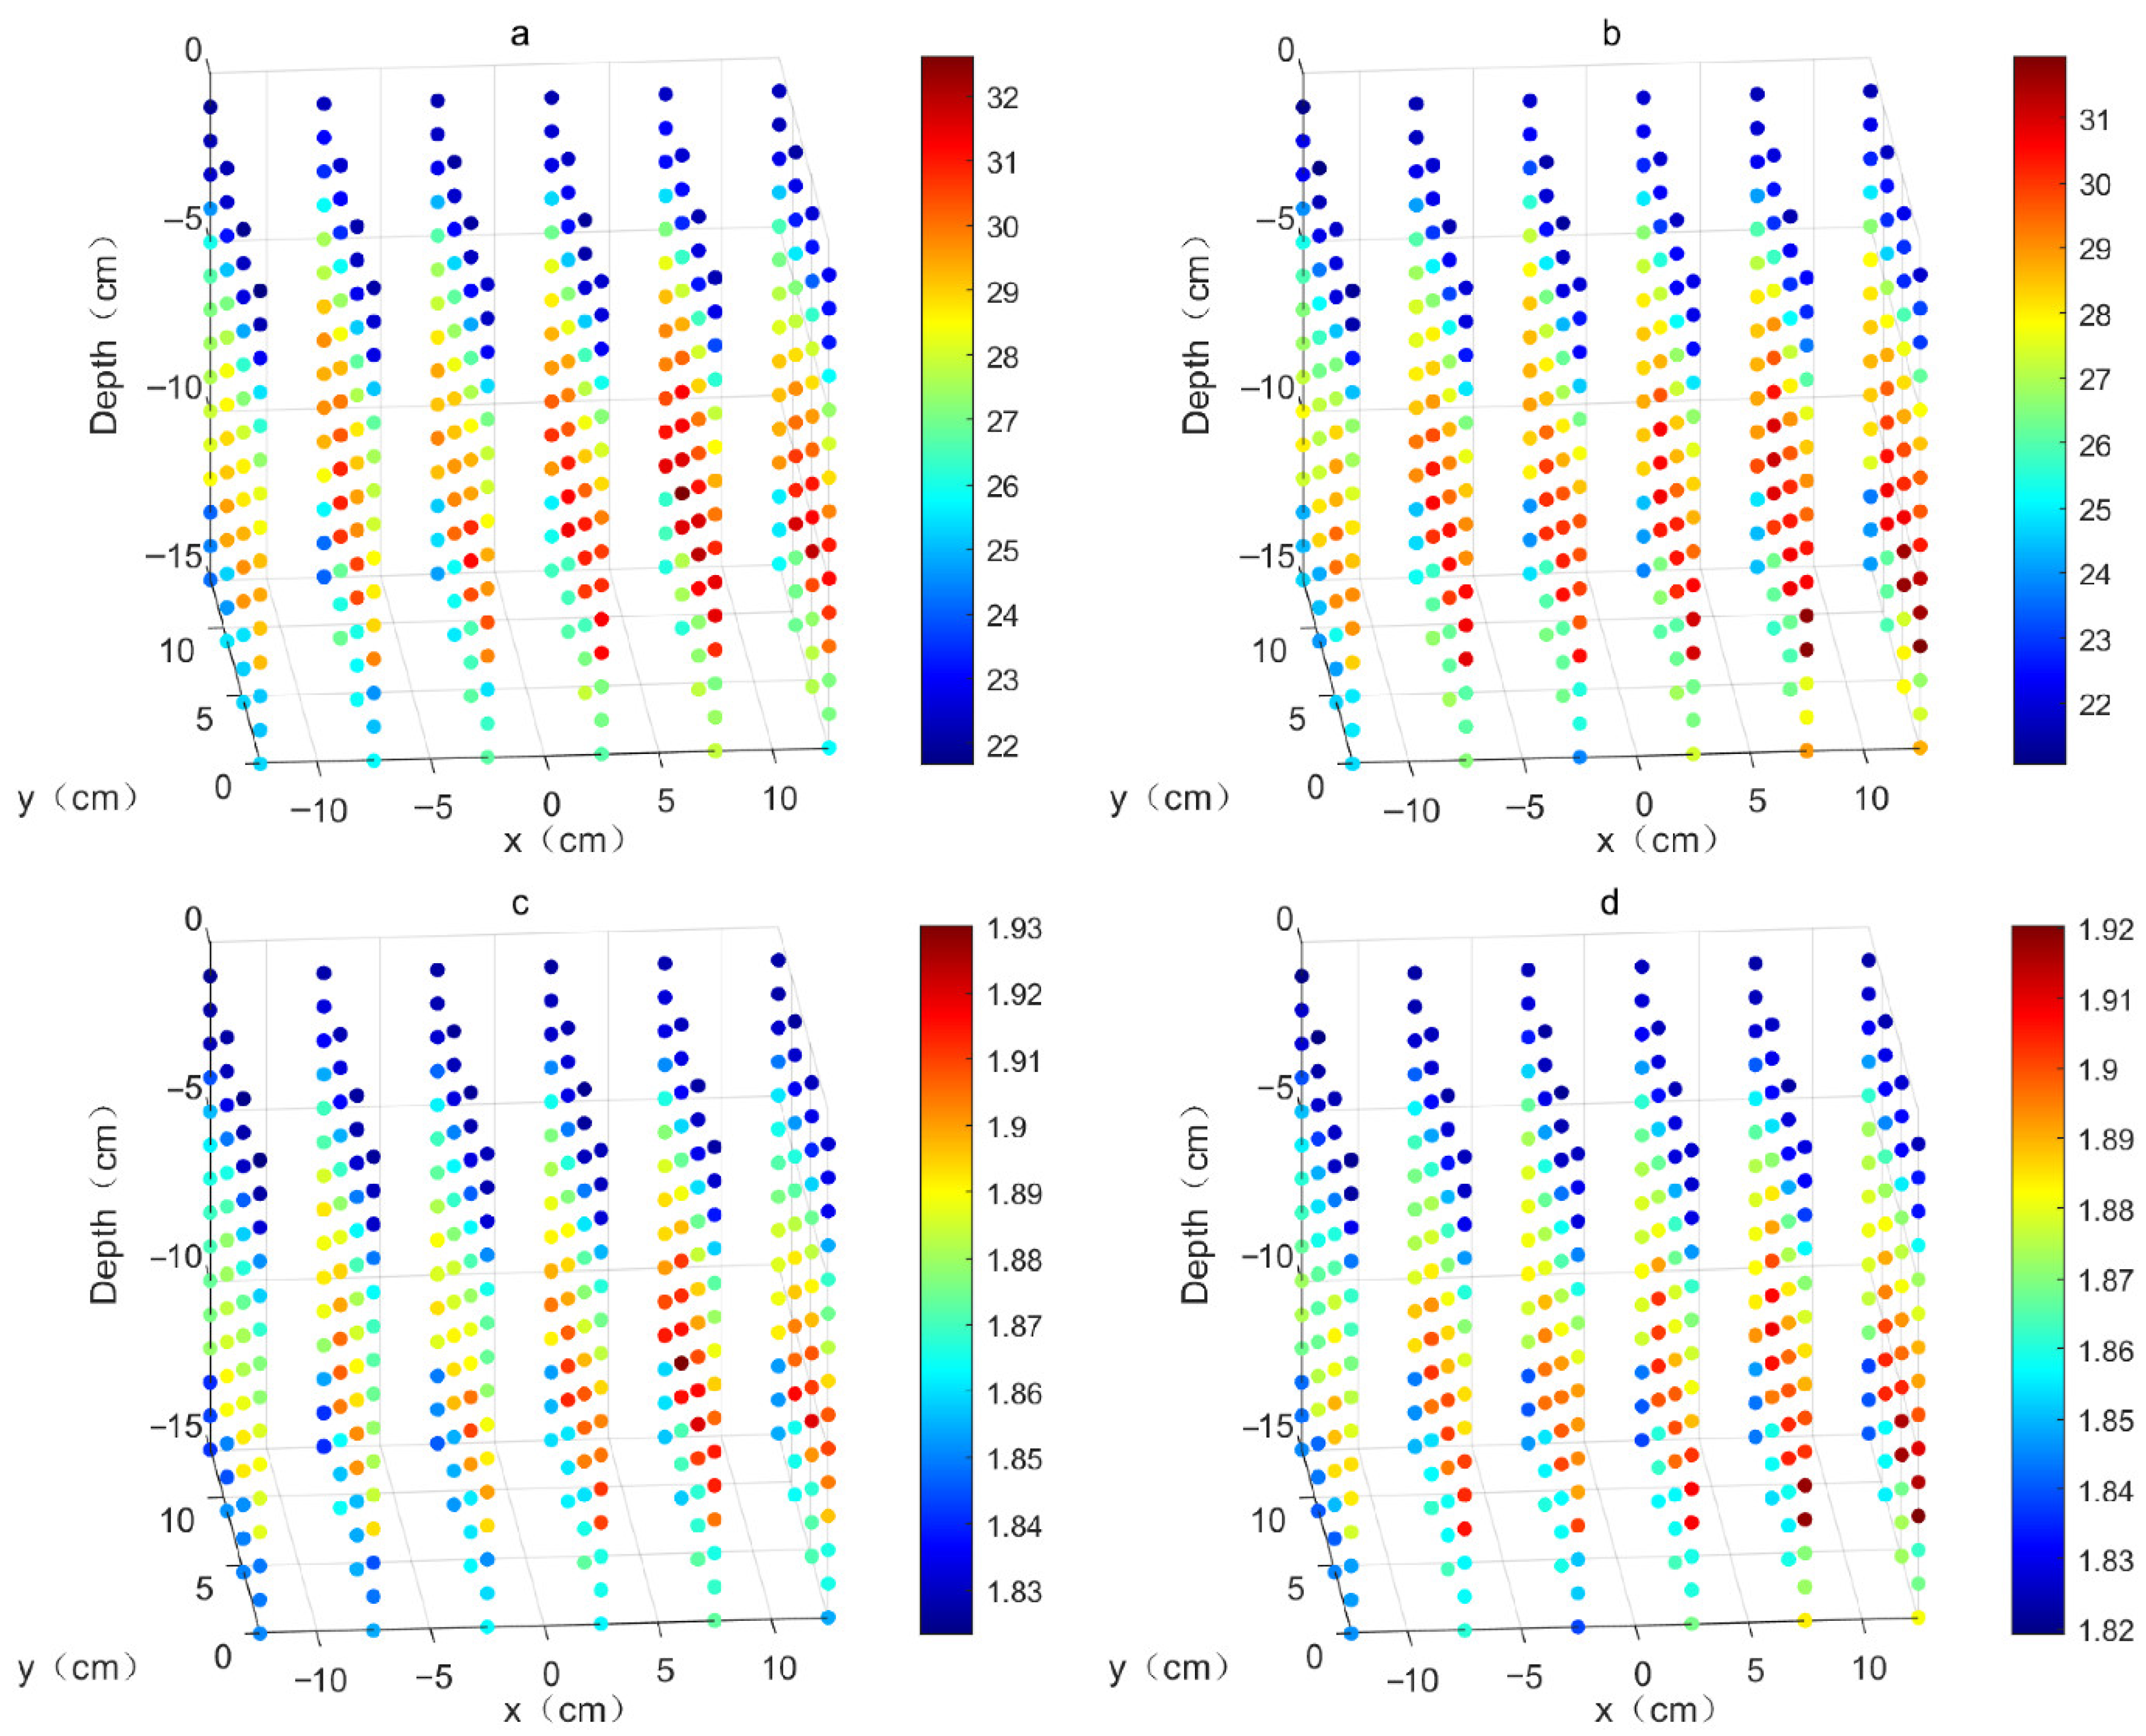
The USB-6218 data acquisition card was set to a sampling frequency of 100 Hz. During the probe’s insertion into the lunar soil simulant to a depth of 15 cm at each location, 1500 resistance data points were collected. The insertion depth was evenly divided into 15 segments. The slope of the penetration resistance was calculated for each segment using the corresponding 100 data points. These slope values were then used in Equations (11) and (12) to determine the internal friction angle and density of the lunar soil simulant for each depth segment. Due to the large volume of data, only partial results from the disturbance tests are presented in Figure 12. In the three-dimensional coordinate system of Figure 12, the x and y axes correspond to those defined in Figure 7, while the z-axis represents the penetration depth of the probe. The position of each scatter point in the 3D coordinate system indicates its physical location within the test container. The colour of each scatter point represents the calculated value of the internal friction angle or density at that specific position, as derived from Equations (11) or (12), respectively.

4. Disturbance Model Building

4.1. Algorithm Comparison

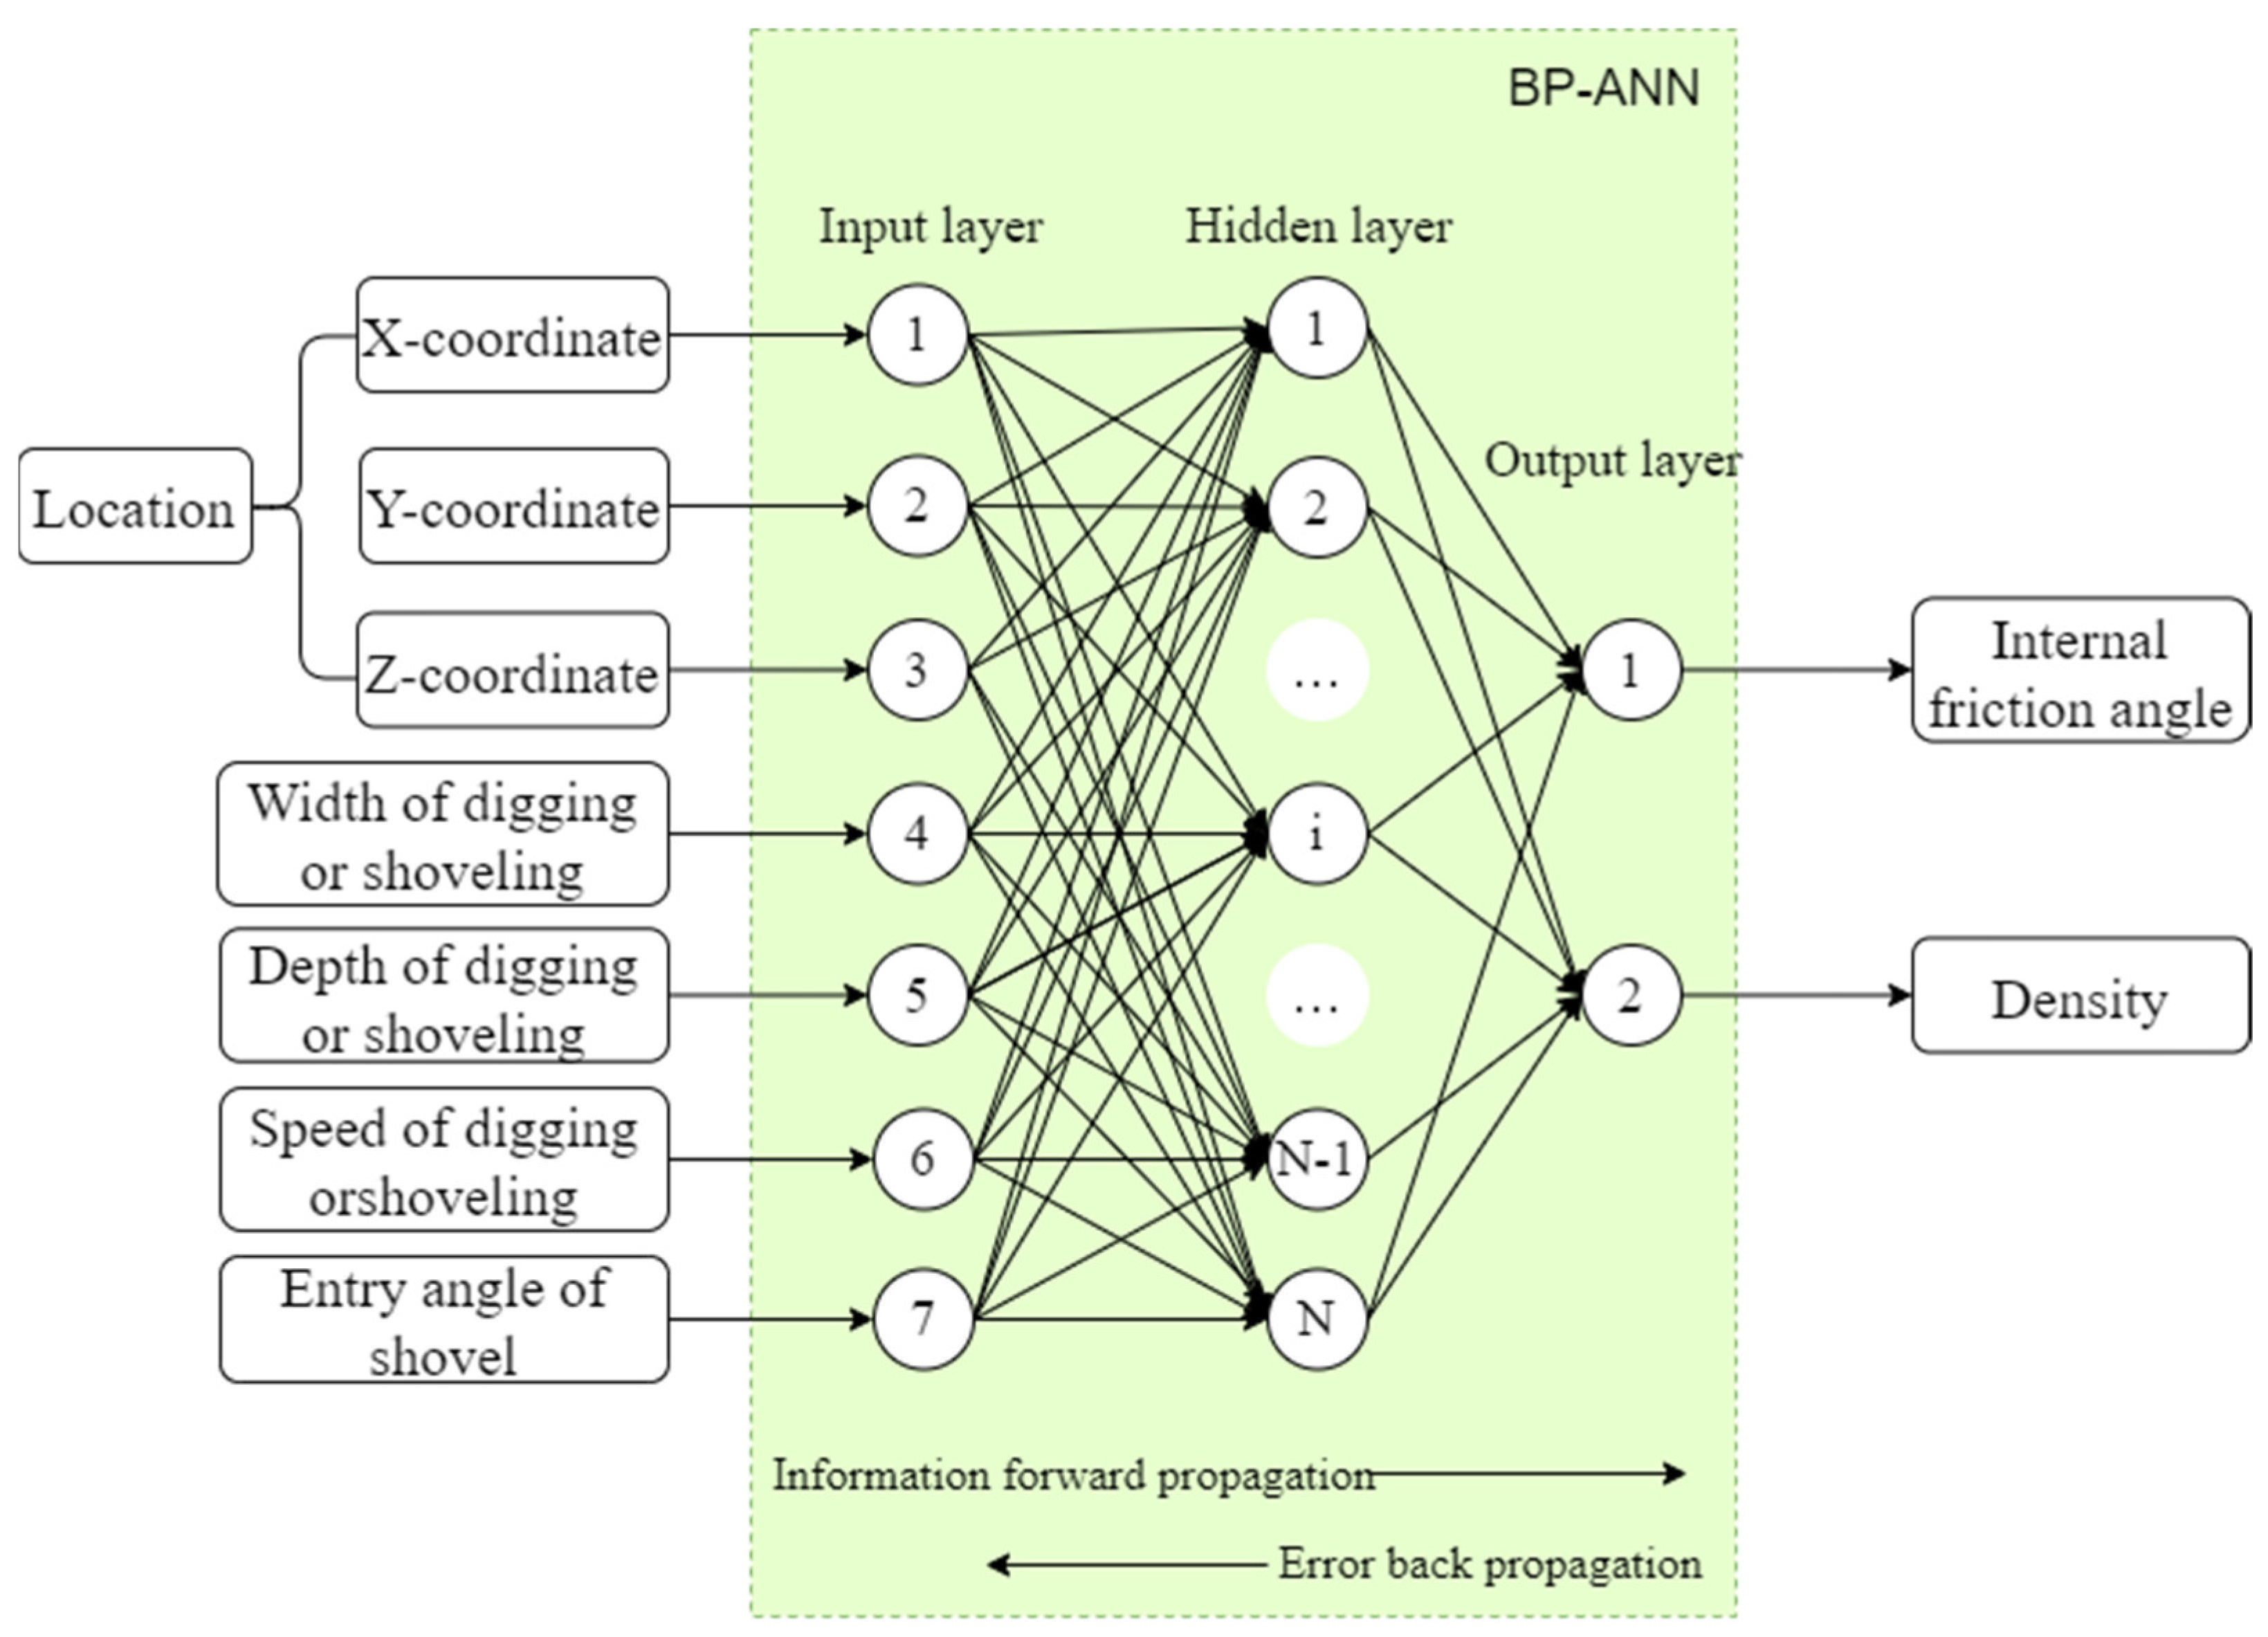
Based on the aforementioned experimental results, a model for lunar soil sampling disturbance was established. The objective of this model is to predict the mechanical characteristic parameters—internal friction angle (φ) and density (ρ)—of the lunar soil at different locations based on the disturbance conditions. This constitutes a typical multivariate nonlinear fitting problem, which can be addressed using a multilayer feedforward network trained by the error backpropagation algorithm (Back Propagation-Artificial Neural Network, BP-ANN) [25]. As illustrated in Figure 13, the input layer of the network in this study consists of seven parameters for the shovelling tests (and six parameters for the digging tests). These include three parameters related to spatial coordinates (x, y, z), along with the bucket width of shovelling or digging, depth of shovelling or digging, speed of shovelling or digging, and the entry angle of shovelling. The hidden layer requires the selection of an appropriate number of neurons. The output layer is designed to predict the two target parameters: the internal friction angle (φ) and density (ρ) of the lunar soil under the given experimental conditions.
This study compared three typical backpropagation algorithms: the Levenberg–Marquardt algorithm (LM), Bayesian Regularization (BR), and the Scaled Conjugate Gradient (SCG) [26,27]. The evaluation metrics included the mean squared error (MSE), the regression value (R), and the iteration times required for convergence. To determine the optimal prediction performance, the network was trained and evaluated separately on the datasets obtained from the shovelling tests and the digging tests [28]. The internal friction angle and density data acquired from the disturbance experiments constituted the datasets, comprising 3240 data points for the shovelling tests and 2520 for the digging tests. Each dataset was partitioned, with 70% of the data used for training, 15% for validation, and the remaining 15% for testing. Simulations and predictions were conducted using the three different algorithms and varying the number of neurons in the hidden layer (from 3 to 12). The predictive performance of each configuration was then compared.
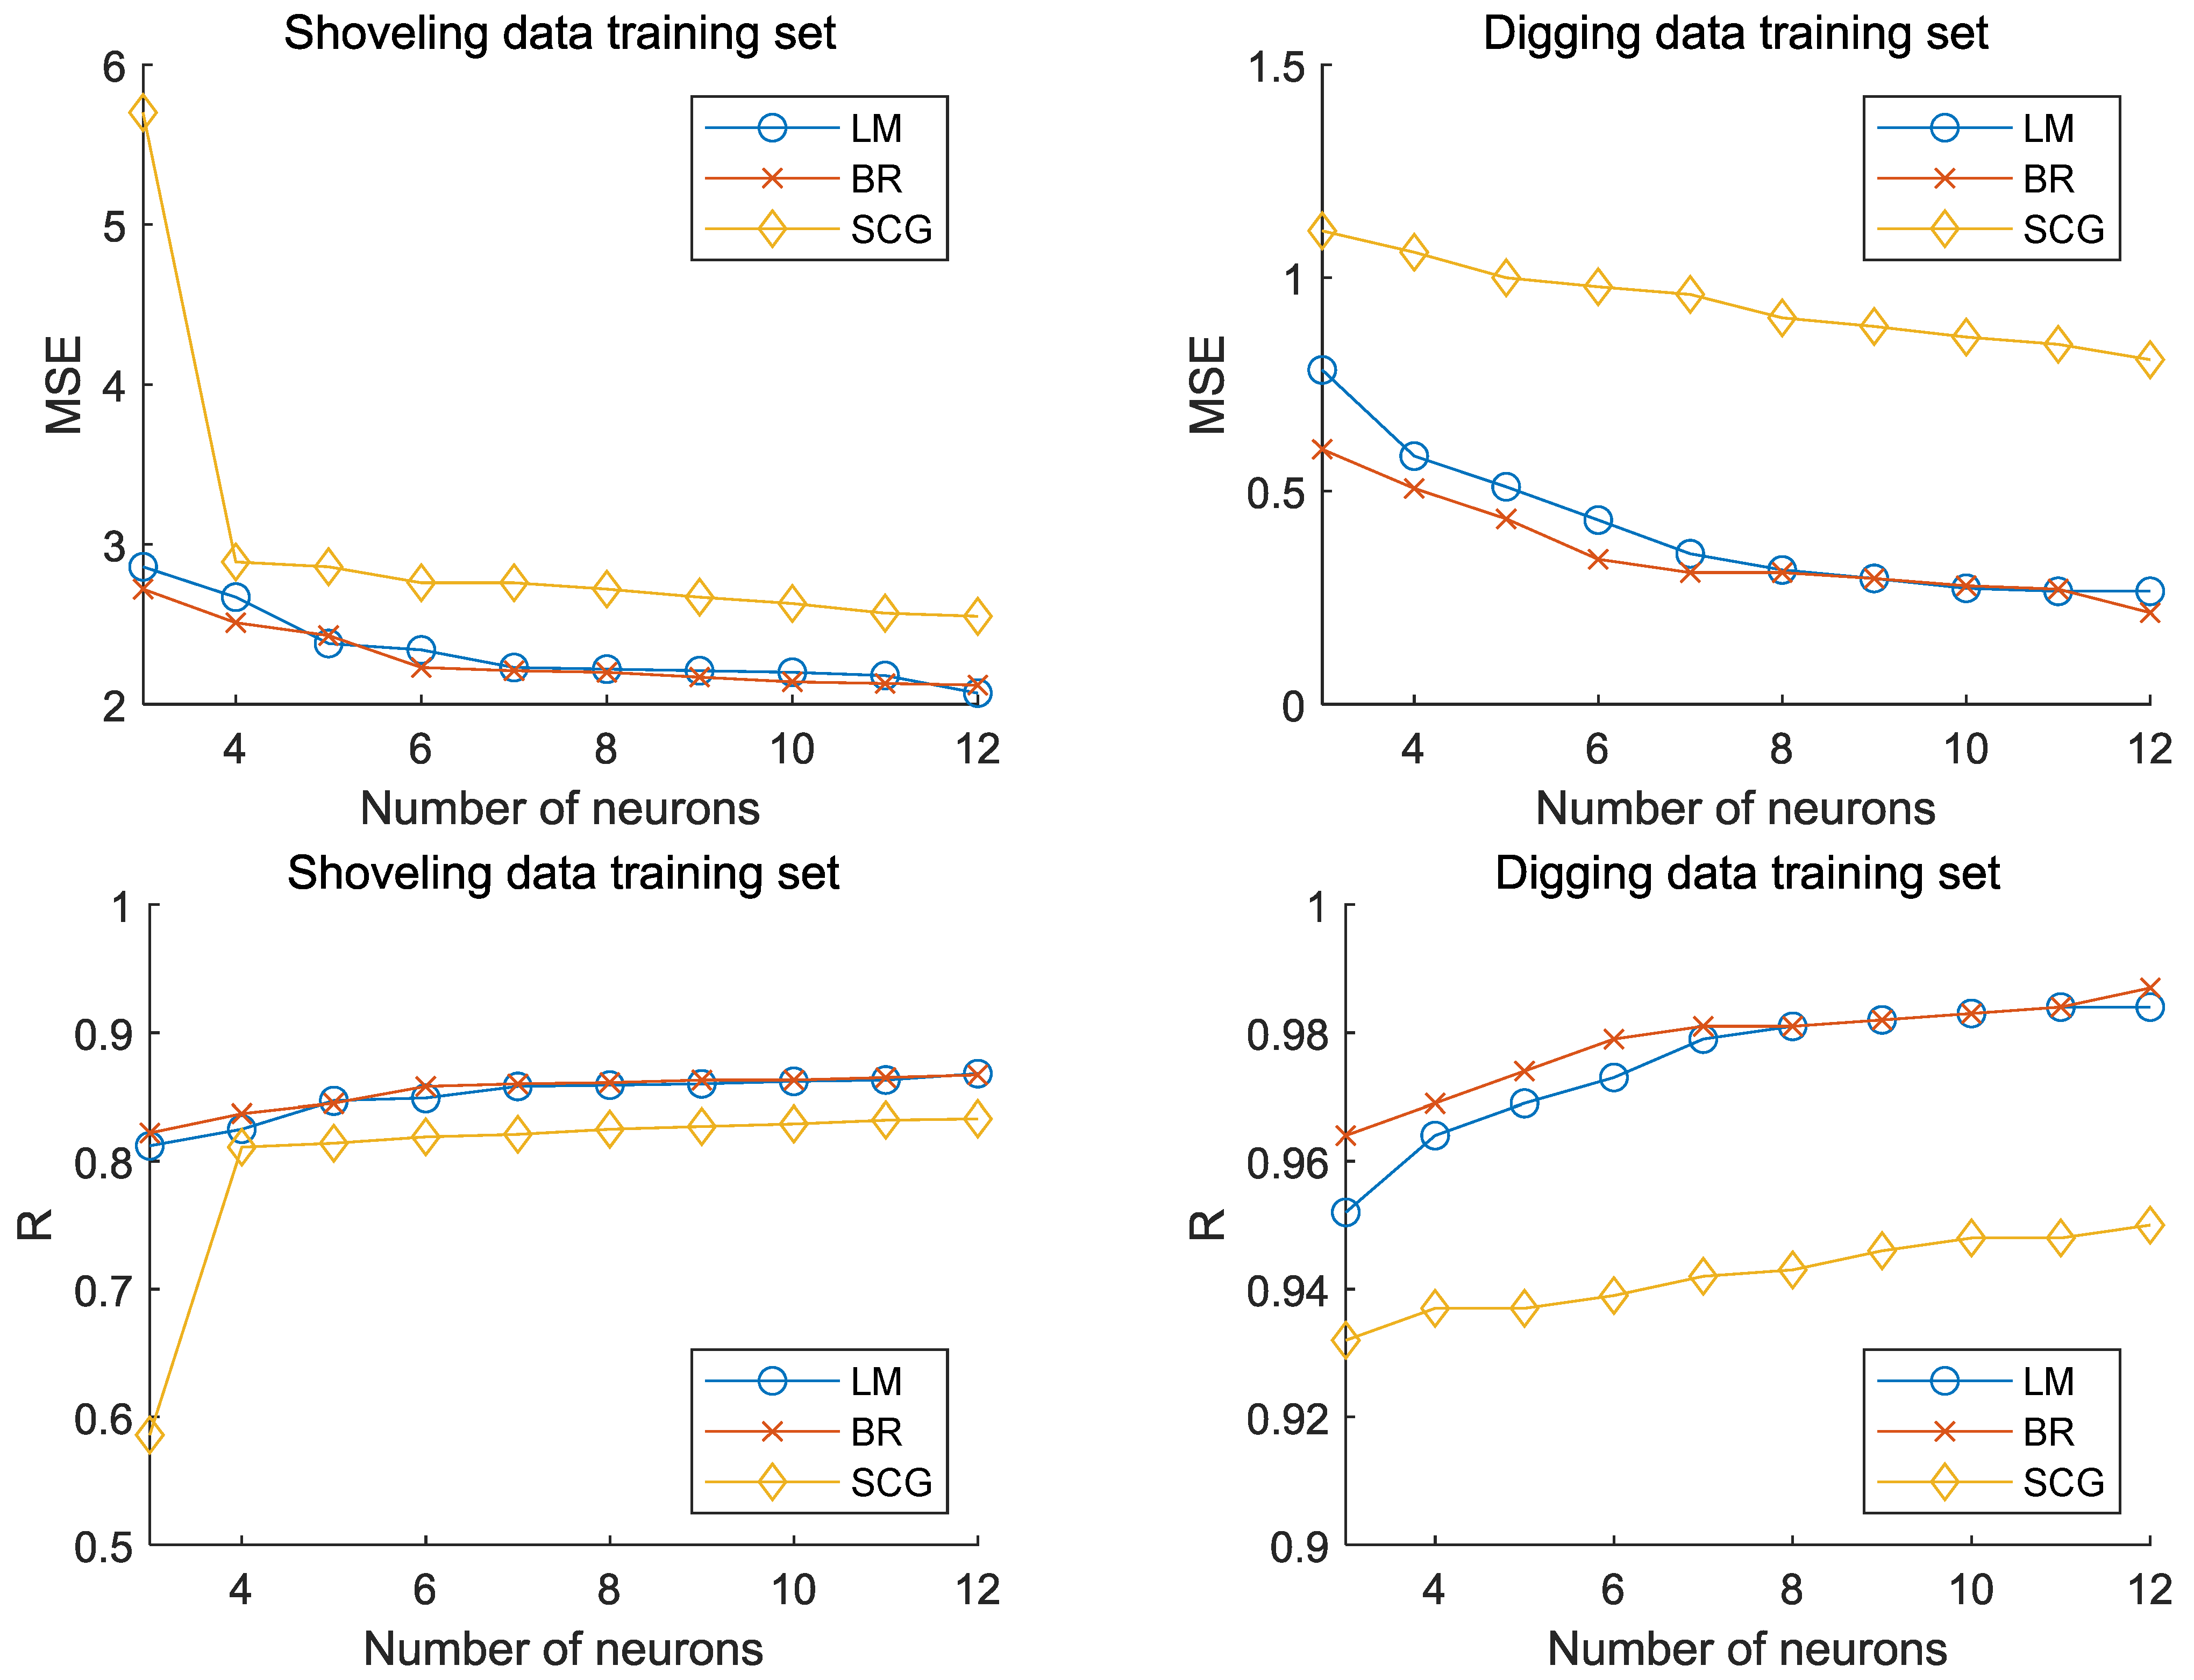
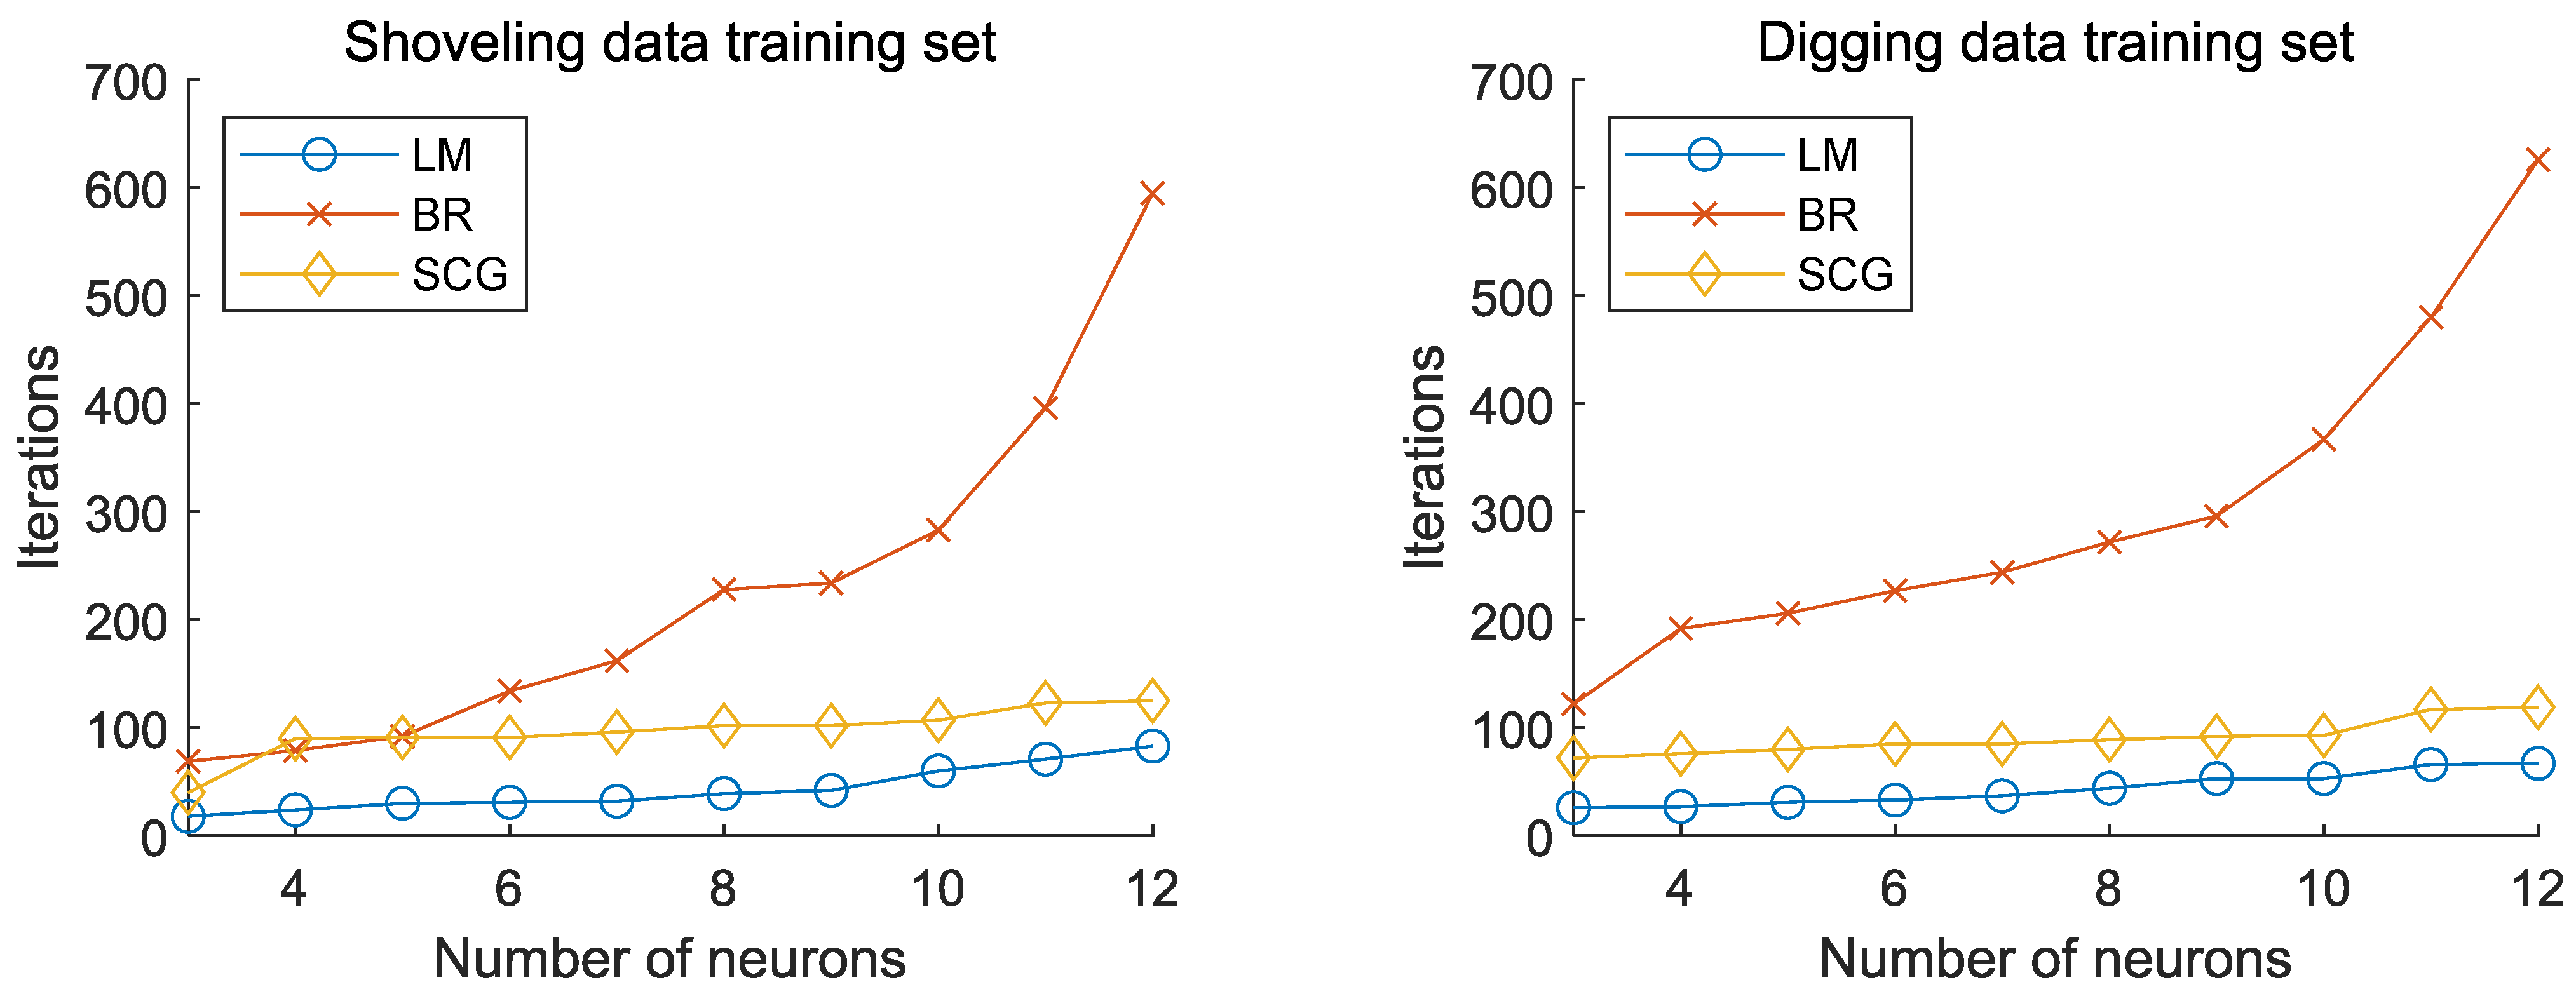
Figure 14 illustrates the training performance of the three algorithms—LM, BR, and SCG—with varying numbers of neurons (ranging from 3 to 12) on the training datasets for both the shovelling and digging tests. As shown in Figure 14, among the three algorithms, the BR algorithm achieves the most minor mean squared error (MSE) and an R-value closest to 1, indicating the highest prediction accuracy. However, its iteration times are significantly higher than those of the other two algorithms, resulting in the longest computational time. The LM algorithm exhibits a slightly higher MSE and a slightly lower R-value compared to the BR algorithm, suggesting a marginally lower computational accuracy. Nevertheless, it requires the fewest iteration times and the shortest computational time. The SCG algorithm exhibits the largest MSE and the smallest R-value, indicating noticeably lower computational accuracy than the other two, along with a higher number of iteration times compared to the LM algorithm. Figure 14 also reveals that as the number of neurons increases, the MSE values for all three algorithms decrease, while the R-values increase, demonstrating a consistent improvement in computational accuracy. However, this improvement inevitably comes at the cost of increased iteration times, meaning the computational time also rises accordingly [29].
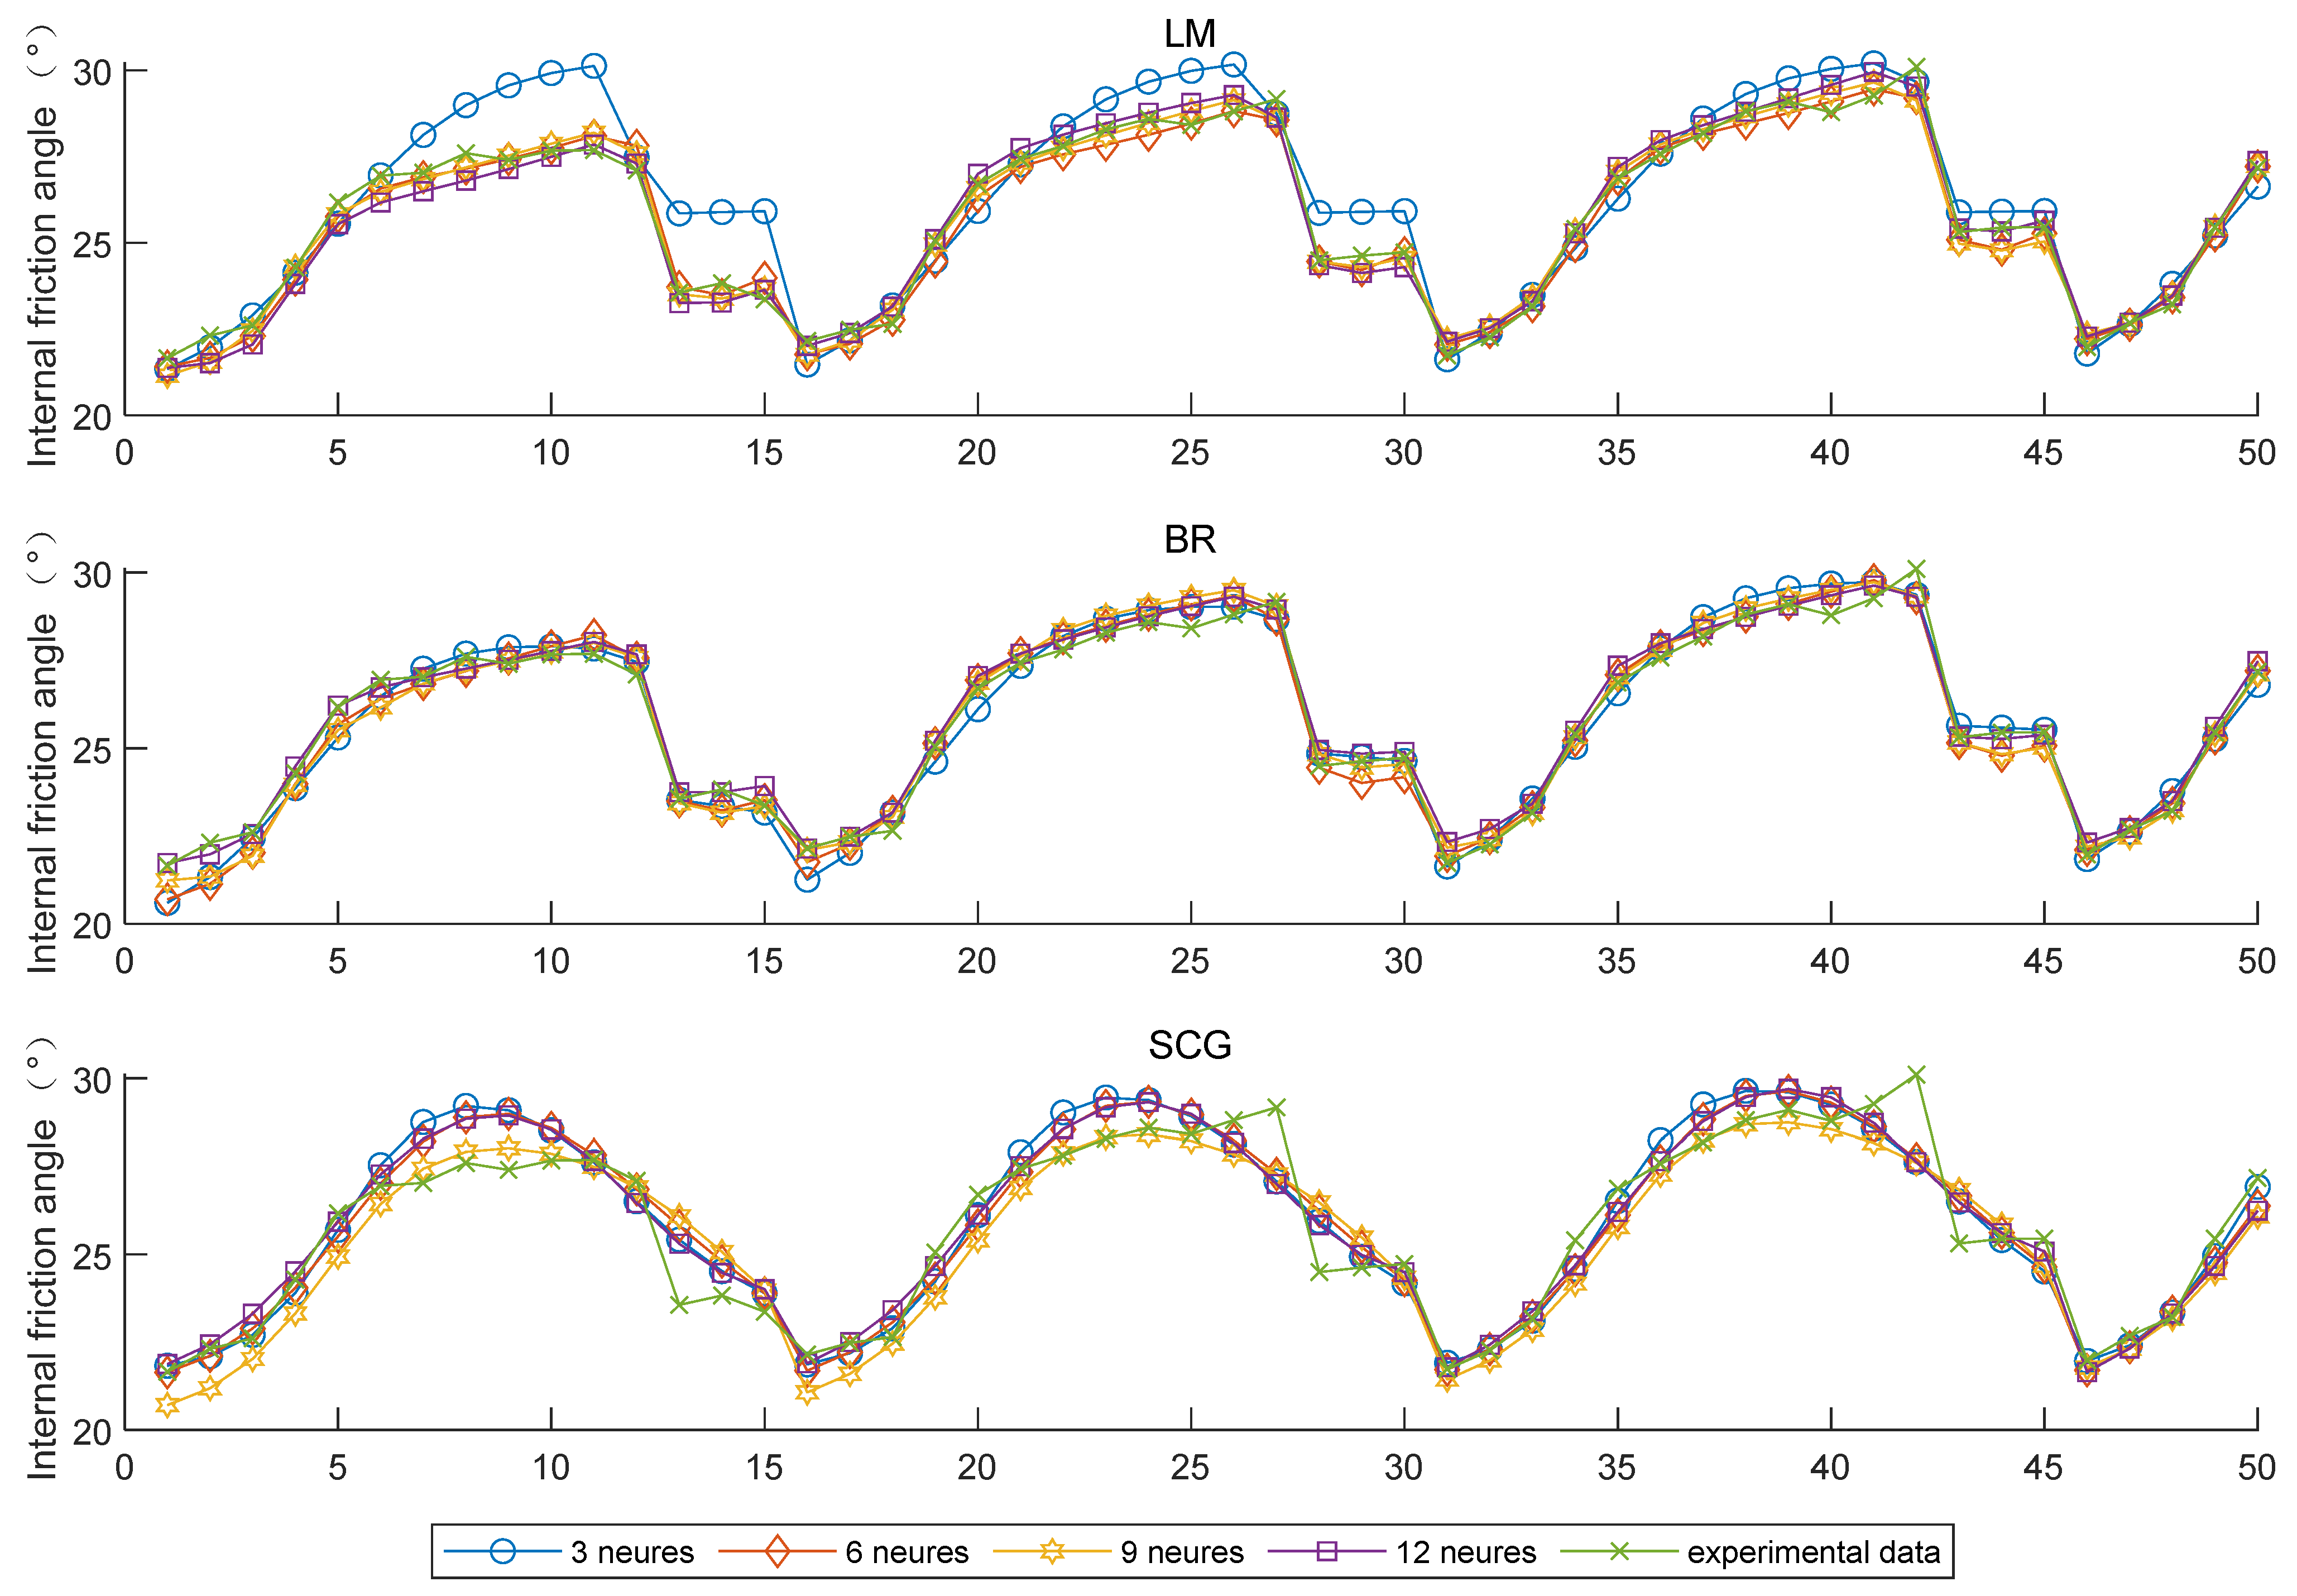
Figure 15 presents a comparison between predicted and actual values for partially digging datasets, using the three prediction methods and four different numbers of neurons (3, 6, 9, 12). As shown in the figure, for the LM algorithm, predictive accuracy is relatively poor with 3 neurons. However, the predicted values closely match the actual values when the number of neurons reaches 6 or more. The BR algorithm produces predicted values that are consistently close to the actual values across different neuron counts. In contrast, the SCG algorithm shows significant errors between its predicted values and the actual values. For both the LM and BR algorithms, as the number of neurons increases up to 12, the prediction curves gradually converge towards the actual values. However, when the number of neurons reaches 12, the neural network training exhibits good performance on the training set but poor performance on the test set, a phenomenon known as overfitting. Overfitting is a common issue in machine learning, typically caused by an overly complex network structure, insufficient training data, or a low signal-to-noise ratio in the training set. In this study, overfitting is primarily attributed to an excessive number of neurons, leading to an overly complex network architecture.
Based on a comprehensive evaluation of the prediction accuracy, computational efficiency, and overfitting tendencies of the three algorithms, the LM algorithm configured with a single hidden layer of 10 neurons was chosen as the optimal model for predicting the internal friction angle and density.

4.2. Prediction Results of BP-ANN

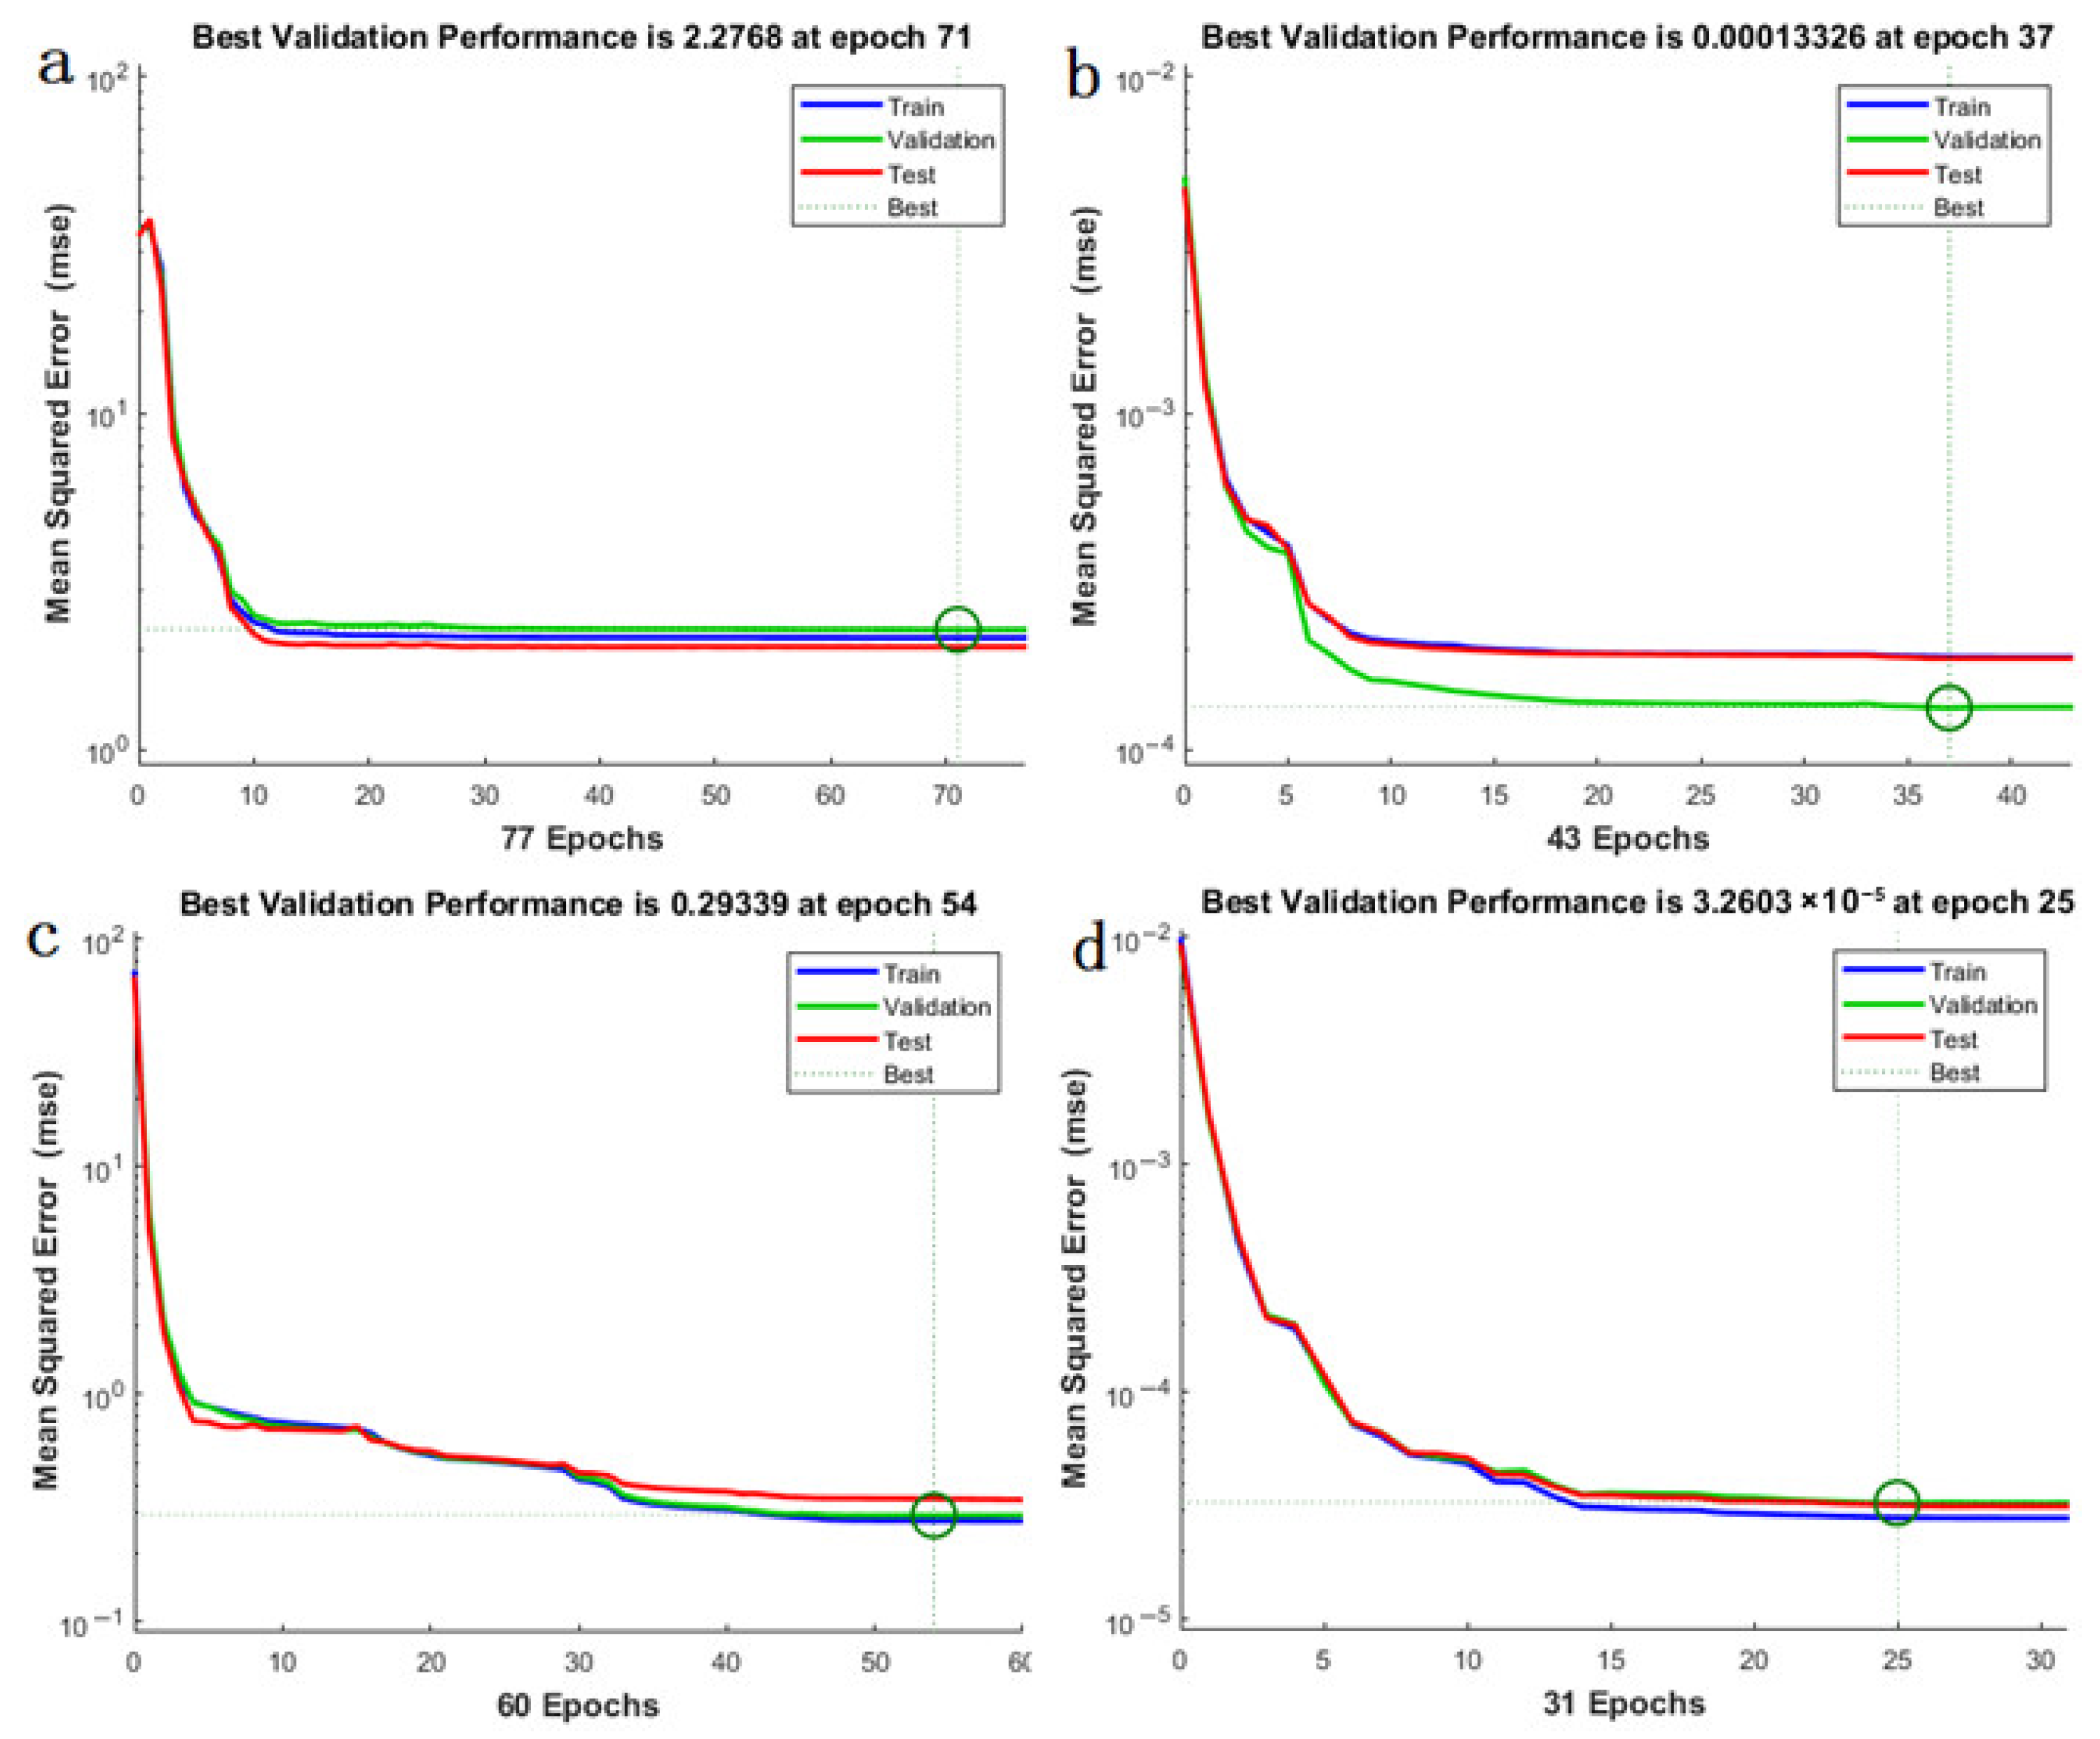
Figure 16 presents the iterative convergence curves for predicting the φ and ρ values of the shovelling test and the φ and ρ values of the digging test using the LM algorithm. As shown in the figure, the BP network required only 77, 37, 54, and 31 iteration times, respectively, to reduce the mean squared error of each dataset to its minimum value, specifically 2.2768, 1.3326 × 10⁻⁴, 0.29339, and 3.2603 × 10⁻⁵.
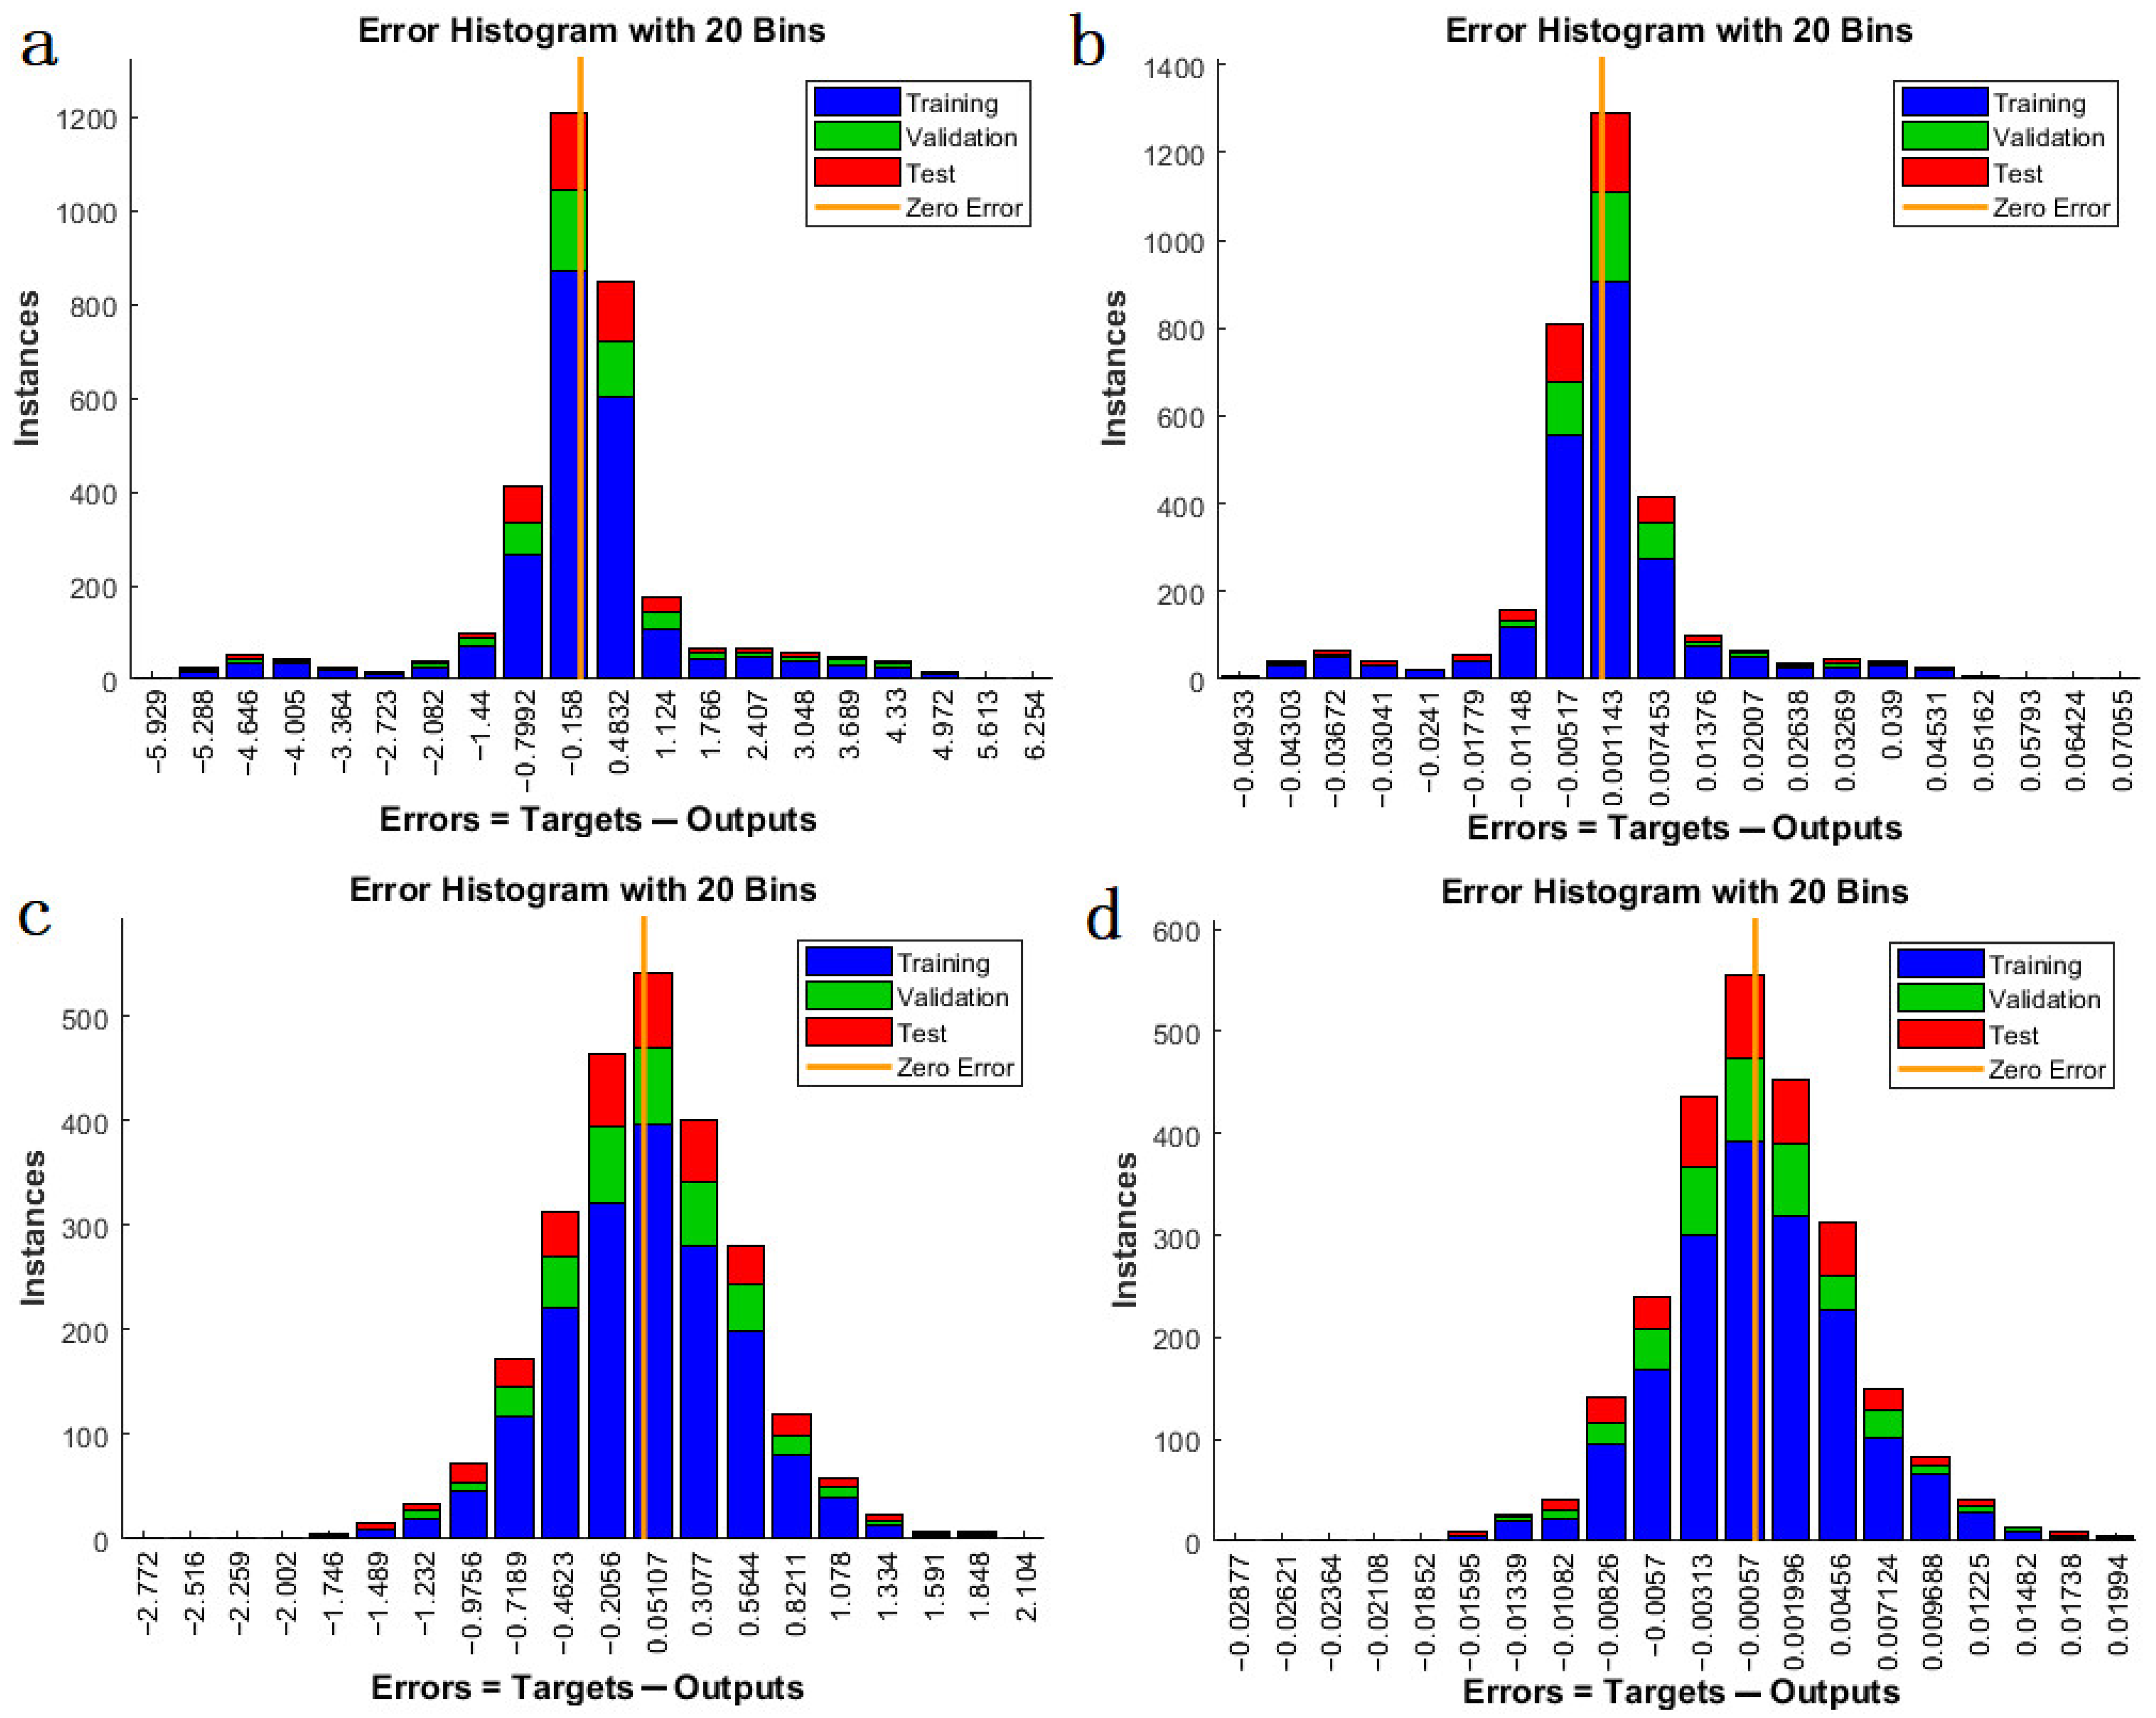
Figure 17 shows the error distribution of the predicted φ and ρ values for both shovelling and digging tests using the LM algorithm. The figure indicates that the errors between the predicted and actual values follow a normal distribution, with the majority of errors concentrated near zero. This demonstrates a high level of accuracy in the prediction results.
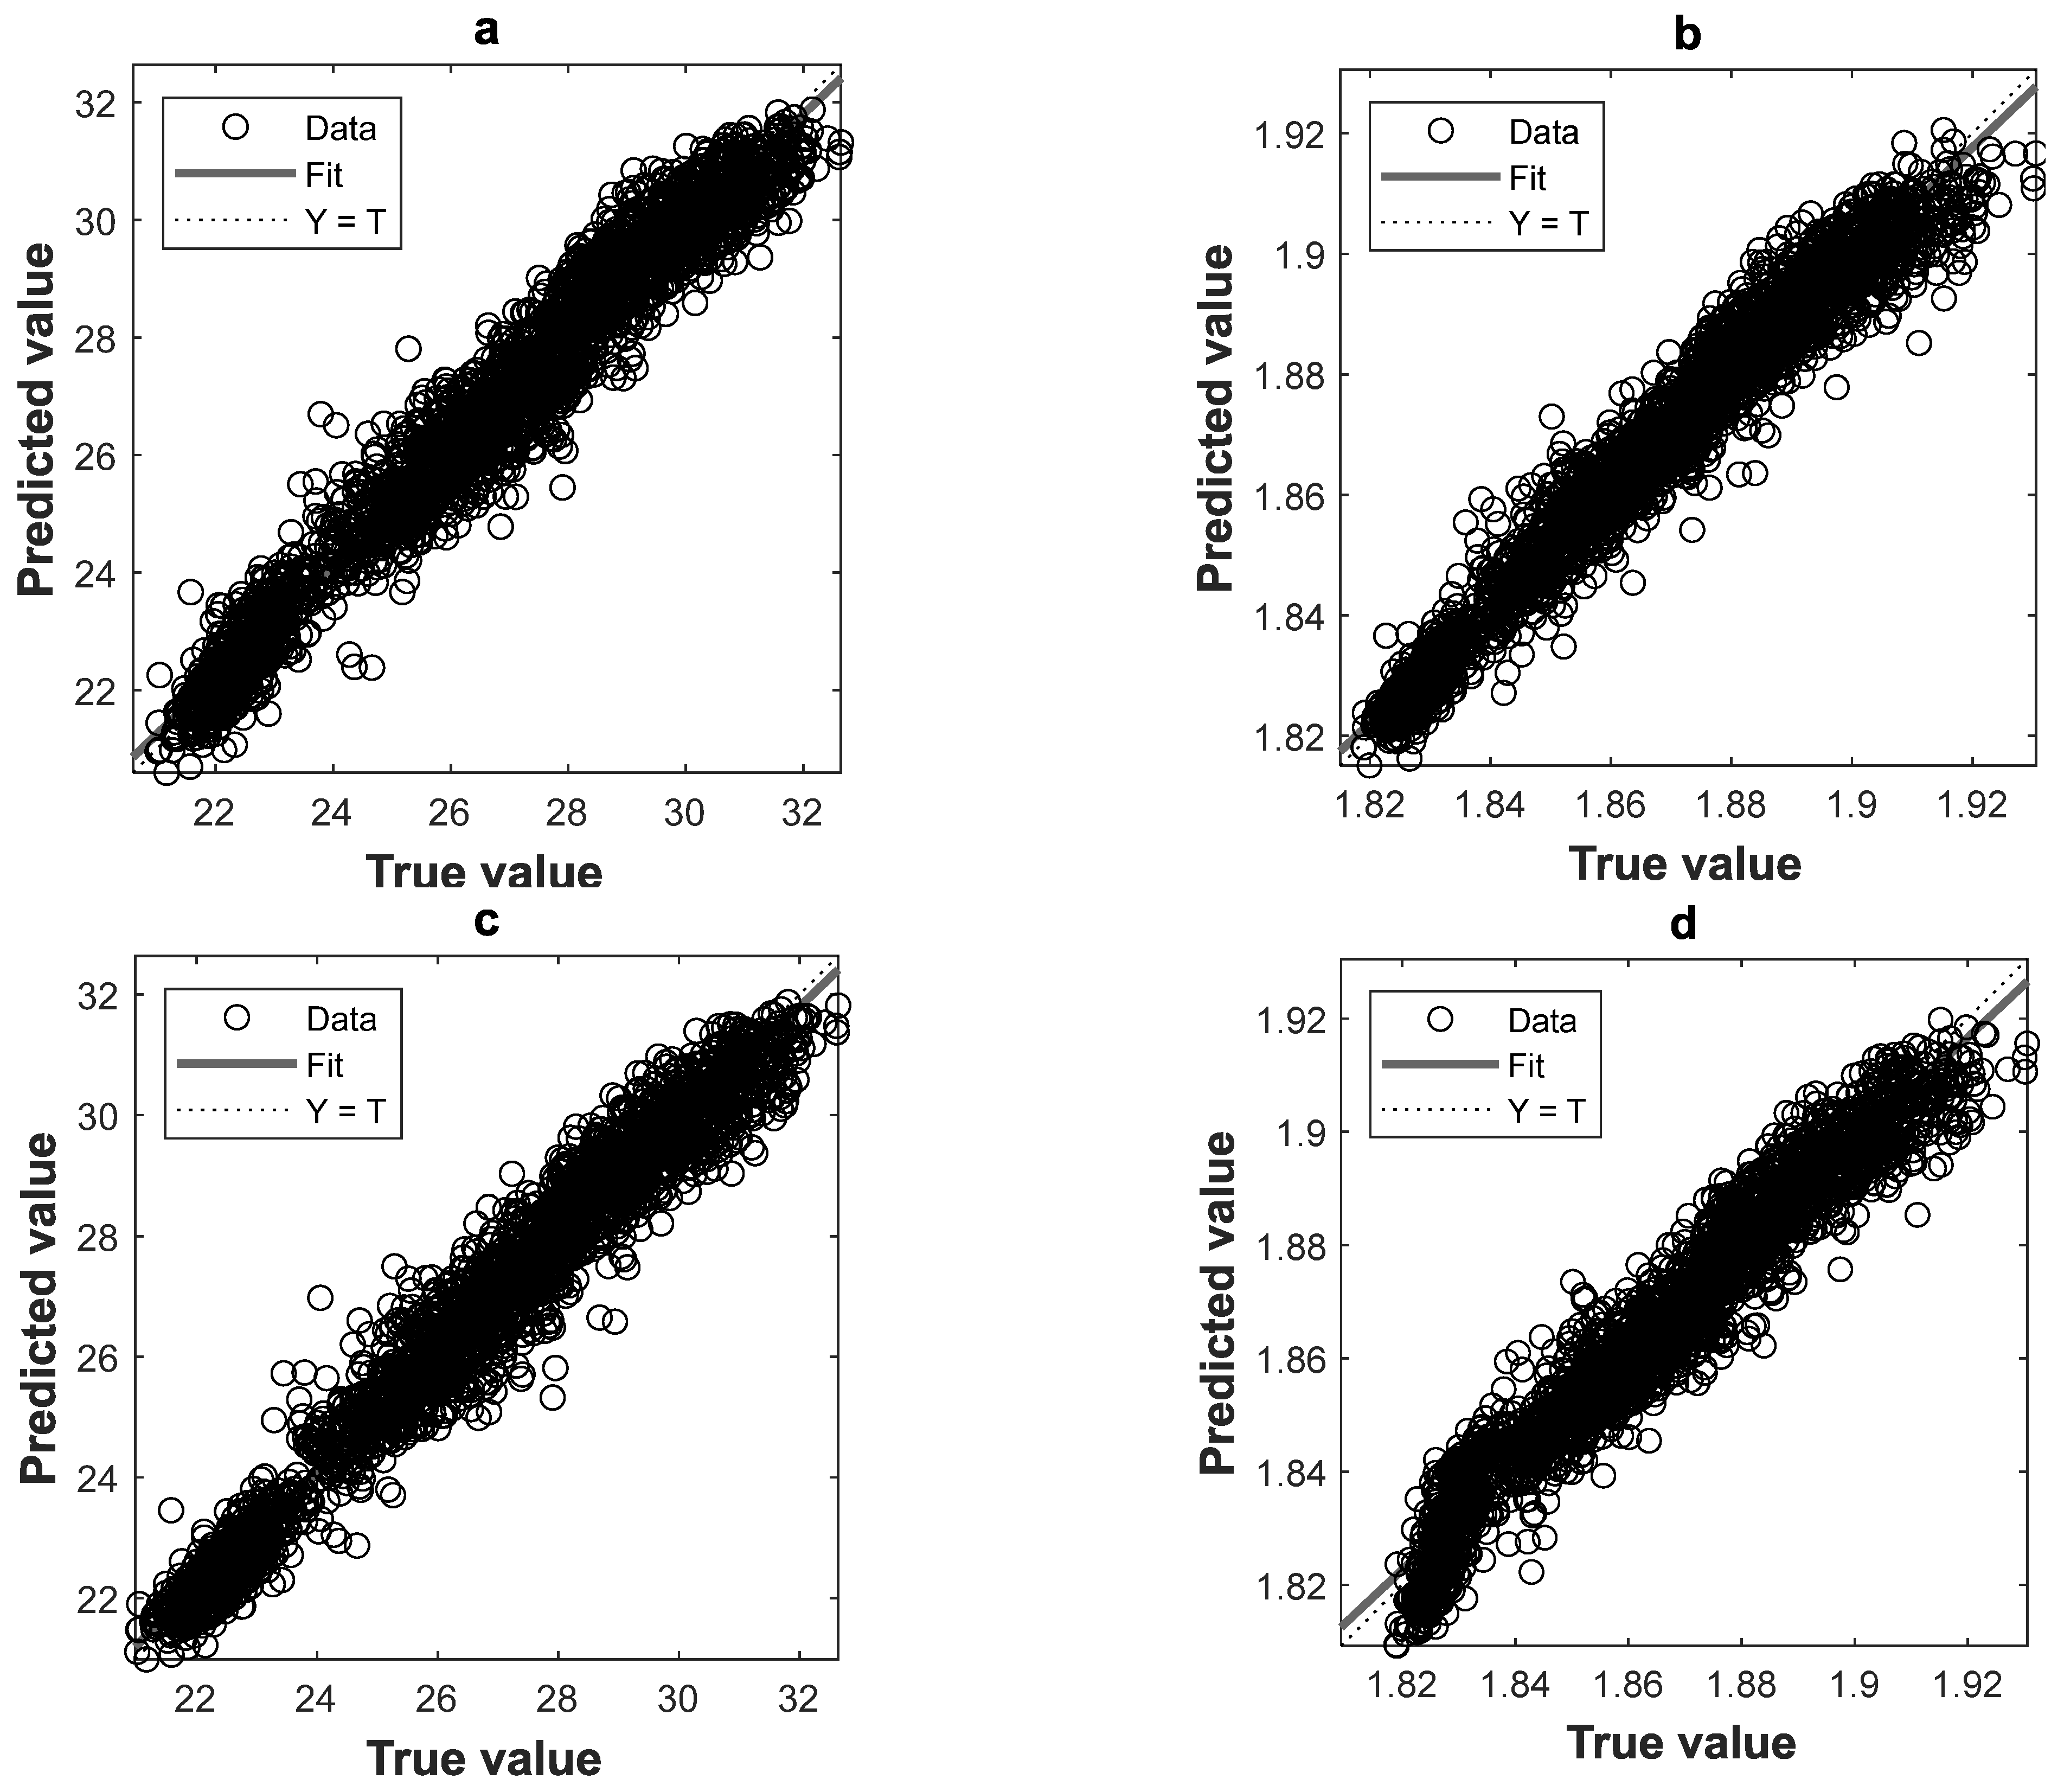
Figure 18 presents the regression plots of the predicted φ and ρ values for both the shovelling and digging tests, obtained using the LM algorithm. In the plots, the x-axis represents the true values (i.e., the φ and ρ values calculated from the penetration resistance measured in the disturbance experiments). In contrast, the y-axis represents the predicted values computed by the neural network. A closer alignment between the Fit line and the Y = T line, along with an R-value closer to 1, indicates a stronger agreement between the predicted and true values. As shown in the figure, the R-values for predicting the φ and ρ values in both the shovelling and digging tests all exceed 0.97, demonstrating an extremely high correlation between the predicted and true values. This confirms that the predictive model meets the requirements for subsequent calculations.
Consequently, the predictive model for estimating the physical and mechanical characteristics of the lunar soil simulant based on disturbance conditions, as derived from the BP neural network, is as follows:
f 1 ( x ) = x x l i s t ¯ σ x l i s t , f ( x ) = 1 1 + e x x 1 = f 1 x , x 2 = f 1 y , x 3 = f 1 z , x 4 = f 1 W , x 5 = f 1 D , x 6 = f 1 V , x 7 = f 1 β z k = f w k i x i + B k y j = f v j k z k + b j φ = f 1 1 y 1 ρ = f 1 1 y 2
where x, y, z—coordinate;
W—depth of digging or shovelling;
D—speed of digging or shovelling;
V—width of digging or shovelling;
β—entry angle of shovel.
In this analysis, the predictive outcomes of the backpropagation (BP) neural network are primarily determined by the following parameters: an N × 7 weight matrix w k i , an intercept array B k , a 2 × N weight matrix v j k and an intercept array b j . For the shovelling tests, the specific values of the weight matrices and intercept arrays in the constructed prediction model are as follows:
w k i = 0.246 0.413 6.487 0.917 0.632 10.940 1.719 0.173 0.049 2.721 6.958 0.195 0.080 0.022 1.053 0.828 1.687 0.115 0.291 7.040 0.642 0.913 0.041 0.264 0.297 0.055 0.095 0.066 0.019 0.033 10.113 9.886 0.034 0.037 0.090 3.006 0.353 0.243 5.618 0.069 0.132 0.167 2.112 0.452 0.467 2.357 0.056 0.162 0.062 0.079 3.242 1.427 0.472 0.329 0.152 0.077 0.221 0.016 0.196 6.197 0.125 4.123 0.086 0.177 0.070 20.163 0.052 0.186 0.060 0.190 B k = 0.597 0.390 1.630 0.513 4.984 1.186 1.045 3.153 4.672 13.105 v j k = 0.027 0.255 0.068 0.686 0.293 0.275 0.223 0.168 0.250 0.397 0.284 0.265 0.370 1.305 1.243 0.226 0.215 0.233 0.427 1.298 b j = 0.634 0.129
For the digging tests, the specific values of the weight matrices and intercept arrays in the constructed prediction model are as follows:
w k i = 0.032 0.017 8.786 0.029 0.215 0.183 0.692 0.829 0.782 0.748 1.336 0.498 0.684 0.460 0.630 0.358 0.232 0.365 0.009 0.004 18.417 0.129 0.201 0.342 0.653 0.803 0.278 0.604 0.363 0.314 0.228 0.317 0.524 0.550 0.863 0.443 0.404 1.086 0.912 0.397 0.823 0.258 0.000 1.183 2.157 1.286 3.293 2.415 2.206 0.386 0.123 0.555 2.402 0.169 0.173 0.022 1.032 2.961 5.425 3.552 B k = 5.099 0.231 0.181 11.456 0.101 0.091 1.798 1.370 0.918 0.215 v j k = 0.294 0.262 0.470 0.466 0.269 1.296 0.439 0.096 0.181 0.323 0.371 0.496 0.898 0.580 0.128 0.256 0.074 0.349 0.670 0.288 b j = 1.024 0.929

5. Conclusions

(1) This study introduces a method whereby the disturbance state of lunar soil is evaluated by the variation in penetration resistance of a standard probe before and after disturbance at identical locations. Theoretical analysis of the probe penetration resistance indicates that its magnitude is related to the density and internal friction angle of the regolith at the specific point.
(2) The density and internal friction angle of the lunar soil were selected as the physical and mechanical characteristic parameters related to disturbance. To quantitatively describe the relationship between the probe penetration resistance and these two parameters, a compaction experiment was conducted on the lunar soil simulant, followed by regression analysis of the experimental results. The results demonstrate a correlation between the density, internal friction angle, and the slope of the probe penetration resistance. Regression analysis was employed to derive equations for calculating the density and internal friction angle of the lunar soil simulant based on the slope of the penetration resistance. Disturbance tests were performed to obtain the probe penetration resistance under various disturbance conditions. By integrating the results from the compaction experiment and disturbance experiment, a correspondence was established between the disturbance conditions and the physical and mechanical properties (density and internal friction angle) of the lunar soil simulant.
(3) A computational model for predicting the internal friction angle and density of lunar soil simulant based on disturbance conditions was developed using a backpropagation (BP) neural network. Since both the number of neurons and the choice of algorithm affect the prediction accuracy, training performance tests were conducted for 3 to 12 neurons and three algorithms: BR, LM, and SCG. The results indicate that the BR algorithm achieves the highest fitting accuracy but requires the most iterations and the longest computational time. The LM algorithm exhibits slightly lower accuracy than BR but with significantly shorter computational time. The SCG algorithm, while also fast, yields the lowest fitting accuracy. For all three algorithms, increasing the number of neurons improves the fitting accuracy but also increases the number of iterations. Considering these factors comprehensively, the LM algorithm with 10 neurons was ultimately selected to predict the φ and ρ values for both the shovelling and digging tests. The prediction performance shows that the correlation coefficient (R-value) between the predicted and actual values exceeds 0.97 in all cases, indicating an extremely high correlation. The predictive results of the BP neural network meet the requirements for subsequent theoretical calculations.

Author Contributions

Conceptualization, Q.L.; Data curation, D.H. and J.L.; Investigation, H.Z.; Validation, L.X.; Visualization, L.X.; Writing—original draft, L.X.; Writing—review and editing, L.X. All authors have read and agreed to the published version of the manuscript.

Funding

This research was funded by National Natural Science Foundation, grant number 42302356 and 42072344. And the APC was funded by National Natural Science Foundation grant number 42302356.

Institutional Review Board Statement

Not applicable.

Informed Consent Statement

Not applicable.

Data Availability Statement

The raw data supporting the conclusions of this article will be made available by the authors on request.

Conflicts of Interest

The authors declare no conflict of interest.

References

  1. Li, Q.; Gao, H.; Xie, L.L.; Tan, S.C.; Duan, L.C. Review of research about lunar drilling technology. Explor. Eng. 2021, 48, 15–34. (In Chinese) [Google Scholar]
  2. Zheng, Y.H.; Deng, X.J.; Gu, Z.; Jin, S.Y.; Li, Q. Lunar surface sampling point selection of Chang’E 5. Opt. Precis. Eng. 2021, 29, 2935–2943. (In Chinese) [Google Scholar] [CrossRef]
  3. Yang, P.; Huang, Y.; Li, P.; Liu, S.; Shan, Q.; Zheng, W. Trajectory Determination of Chang’E-5 during Landing and Ascending. Remote Sens. 2021, 13, 4837. (In Chinese) [Google Scholar] [CrossRef]
  4. Gu, Y.; Sun, J.Y.; Xiao, Q.; Li, Y.H.; Wang, X.Y.; Cao, K.N. Morphology of Lunar Soil Returned by Chang’E-5 Mission and Implications for Space Weathering. Editor. Comm. Earth Sci. -J. China Univ. Geosci. 2022, 47, 4145–4160. (In Chinese) [Google Scholar]
  5. Zhang, T.; Ding, X. Drilling forces model for lunar regolith exploration and experimental validation. Acta Astronaut. 2017, 131, 190–203. [Google Scholar] [CrossRef]
  6. Yao, Y.; Xiao, C.; Wang, P.; Li, C.; Zhou, Q. Instrumental Neutron Activation Analysis of Chang’E-5 Lunar Regolith Samples. J. Am. Chem. Soc. 2022, 144, 5478–5484. [Google Scholar] [CrossRef]
  7. Li, C.; Li, Y.; Wei, K.; Guo, Z.; Yu, H.; Chen, X.; Li, X.; Ma, W.; Liu, J. Study on surface characteristics of Chang’E-5 fine grained lunar soil. Sci. Phys. Mech. Astron. 2023, 53, 31–39. (In Chinese) [Google Scholar]
  8. Liu, C.; Li, J.; Zhang, T. Key technologies in the teleoperation of the Chang’e-5 lunar sampling. Sci. Sin. Technol. 2022, 52, 473–488. (In Chinese) [Google Scholar]
  9. Li, C.; Hu, H.; Yang, M.F.; Liu, J.; Zhou, Q.; Ren, X.; Liu, B.; Liu, D.; Zeng, X.; Zuo, W.; et al. Nature of the lunar far-side samples returned by the Chang’E-6 mission. Natl. Sci. Rev. 2024, 11, nwae328. [Google Scholar] [CrossRef]
  10. Tsuchiyama, A.; Sakurama, T.; Nakano, T.; Kentaro, U.; Makiko, O.; Takashi, M.; Kazuo, T.; Erik, M.G. Three-dimensional shape distribution of lunar regolith particles collected by the Apollo and Luna programs. Earth Planets Space 2022, 74, 172. [Google Scholar]
  11. Xu, L.; Qiao, L.; Xie, M.; Wang, Y.; Zhu, M.H.; Yan, J. Chronology, Local Stratigraphy, and Foreign Ejecta Materials at the Chang’e-6 Landing Site: Constraints on the Provenance of Samples Returned From the Moon’s Farside. Geophys. Res. Lett. 2024, 51, 13. [Google Scholar] [CrossRef]
  12. Wu, F.Y.; Li, Q.L.; Chen, Y.; Hu, S.; Yue, Z.Y.; Zhou, Q.; Wang, H.; Yang, W.; Tian, H.C.; Zhang, C.; et al. Lunar Evolution in Light of the Chang’e-5 Returned Samples. Annu. Rev. Earth Planet. Sci. 2024, 52, 159–194. [Google Scholar] [CrossRef]
  13. Long, T.; Qian, Y.; Norman, M.D.; Miljkovic, K.; Crow, C.; Head, J.W.; Che, X.; Tartèse, R.; Zellner, N.; Yu, X.; et al. Constraining the formation and transport of lunar impact glasses using the ages and chemical compositions of Chang’e-5 glass beads. Sci. Adv. 2022, 8, eabq2542. [Google Scholar] [CrossRef] [PubMed]
  14. Agui, J.H.; Bucek, M.; DeGennaro, A.; Wilkinson, R.A.; Zeng, X. Lunar Excavation Experiments in Simulant Soil Test Beds: Revisiting the Surveyor Geotechnical Data. J. Aerosp. Eng. 2013, 26, 117–133. [Google Scholar] [CrossRef]
  15. Hvorslev, M. (Ed.) Subsurface Exploration and Sampling of Soils for Civil Engineering Purposes; Waterways Experiment Station: Vicksburg, MI, USA, 1949.
  16. Desai, C.S.; Toth, J. Disturbed state constitutive modeling based on stress-strain and nondestructive behavior. Int. J. Solids Struct. 1996, 33, 1619–1650. [Google Scholar] [CrossRef]
  17. Hu, Q.; Xu, S.F.; Chen, R.P.; Ran, L. Influence of soil disturbance on metro tunnel in soft clay due to excavation of deep foundation pit. Int. J. Solids Struct. 2013, 35 (Suppl. S2), 537–541. (In Chinese) [Google Scholar]
  18. Yongfu, X. Quantitative identification of disturbance degree of soils influenced by construction. Dam Monit. Geotech. Test. 2000, 24, 8–10. (In Chinese) [Google Scholar]
  19. Spohn, T.; Knollenberg, J.; Ball, A.J.; Banaszkiewicz, M.; Benkhoff, J.; Grott, M.; Grygorczuk, J.; Hüttig, C.; Hagermann, A.; Kargl, G.; et al. COMETARY SCIENCE. Thermal and mechanical properties of the near-surface layers of comet 67P/Churyumov-Gerasimenko. Science 2015, 349, aab0464. [Google Scholar] [CrossRef]
  20. Seweryn, K.; Skocki, K.; Banaszkiewicz, M.; Grygorczuk, J.; Kolano, M.; Kuciński, T.; Mazurek, J.; Morawski, M.; Białek, A.; Rickman, H.; et al. Determining the geotechnical properties of planetary regolith using Low Velocity Penetrometers. Planet. Space Sci. 2014, 99, 70–83. [Google Scholar] [CrossRef]
  21. Apollo 15: Preliminary Science Report; Scientific and Technical Information Office: Washington, DC, USA, 1972; Volume 289.
  22. Zheng, Y.; Zhang, G.; Deng, X.; Zhang, W.; Jin, S.; Jia, X.; Zhang, N.; Jiang, S.; Li, H.; Yao, M. Design and implementation of the Chang’e-6 sampling and encapsulation system for the far side moon mission. Sci. Sin. Technol. 2025, 55, 1182–1193. (In Chinese) [Google Scholar] [CrossRef]
  23. Nie, J.; Cui, Y.; Senetakis, K.; Guo, D.; Wang, Y.; Wang, G.; Feng, P.; He, H.; Zhang, X.; Zhang, X.; et al. Predicting residual friction angle of lunar regolith based on Chang’e-5 lunar samples. Sci. Bull. 2023, 68, 730–739. [Google Scholar] [CrossRef] [PubMed]
  24. He, X.X.; Xiao, L.; Huang, J.; Wan, C.H.; Wu, T.; Gao, R.; Yan, S.W.; He, Q. Lunar Soil Simulant Development and Lunar Soil Simulant CUG-1A. Geol. Sci. Technol. Inf. 2011, 30, 137–142. (In Chinese) [Google Scholar]
  25. Zhang, H.; Gui, L.; Wang, T.; Yang, S. Prediction of Quaternary Cover Thickness and 3D Geological Modeling Based on BP Neural Network. Editor. Comm. Earth Sci. -J. China Univ. Geosci. 2024, 49, 550–559. (In Chinese) [Google Scholar]
  26. Yang, L.; Chen, Y.; Gao, X. Spatial Spillover Effect of Digital-Finance-Driven Technology Innovation Level Based on BP Neural Network. Sustainability 2023, 15, 1052. [Google Scholar] [CrossRef]
  27. Huizhen, H.; Qing, G.; Xiumian, H. Research Advances and Prospective in Mineral Intelligent Identification Based on Machine Learning. Editor. Comm. Earth Sci. -J. China Univ. Geosci. 2021, 46, 3091–3106. (In Chinese) [Google Scholar]
  28. Zhou, Z.; Li, H.; Wen, S.; Zhang, C. Prediction Model for the DC Flashover Voltage of a Composite Insulator Based on a BP Neural Network. Energies 2023, 16, 984. [Google Scholar] [CrossRef]
  29. Li, Q.; Jia, W. Phase Selection and Location Method of Generator Stator Winding Ground Fault Based on BP Neural Network. Energies 2023, 16, 1503. [Google Scholar] [CrossRef]
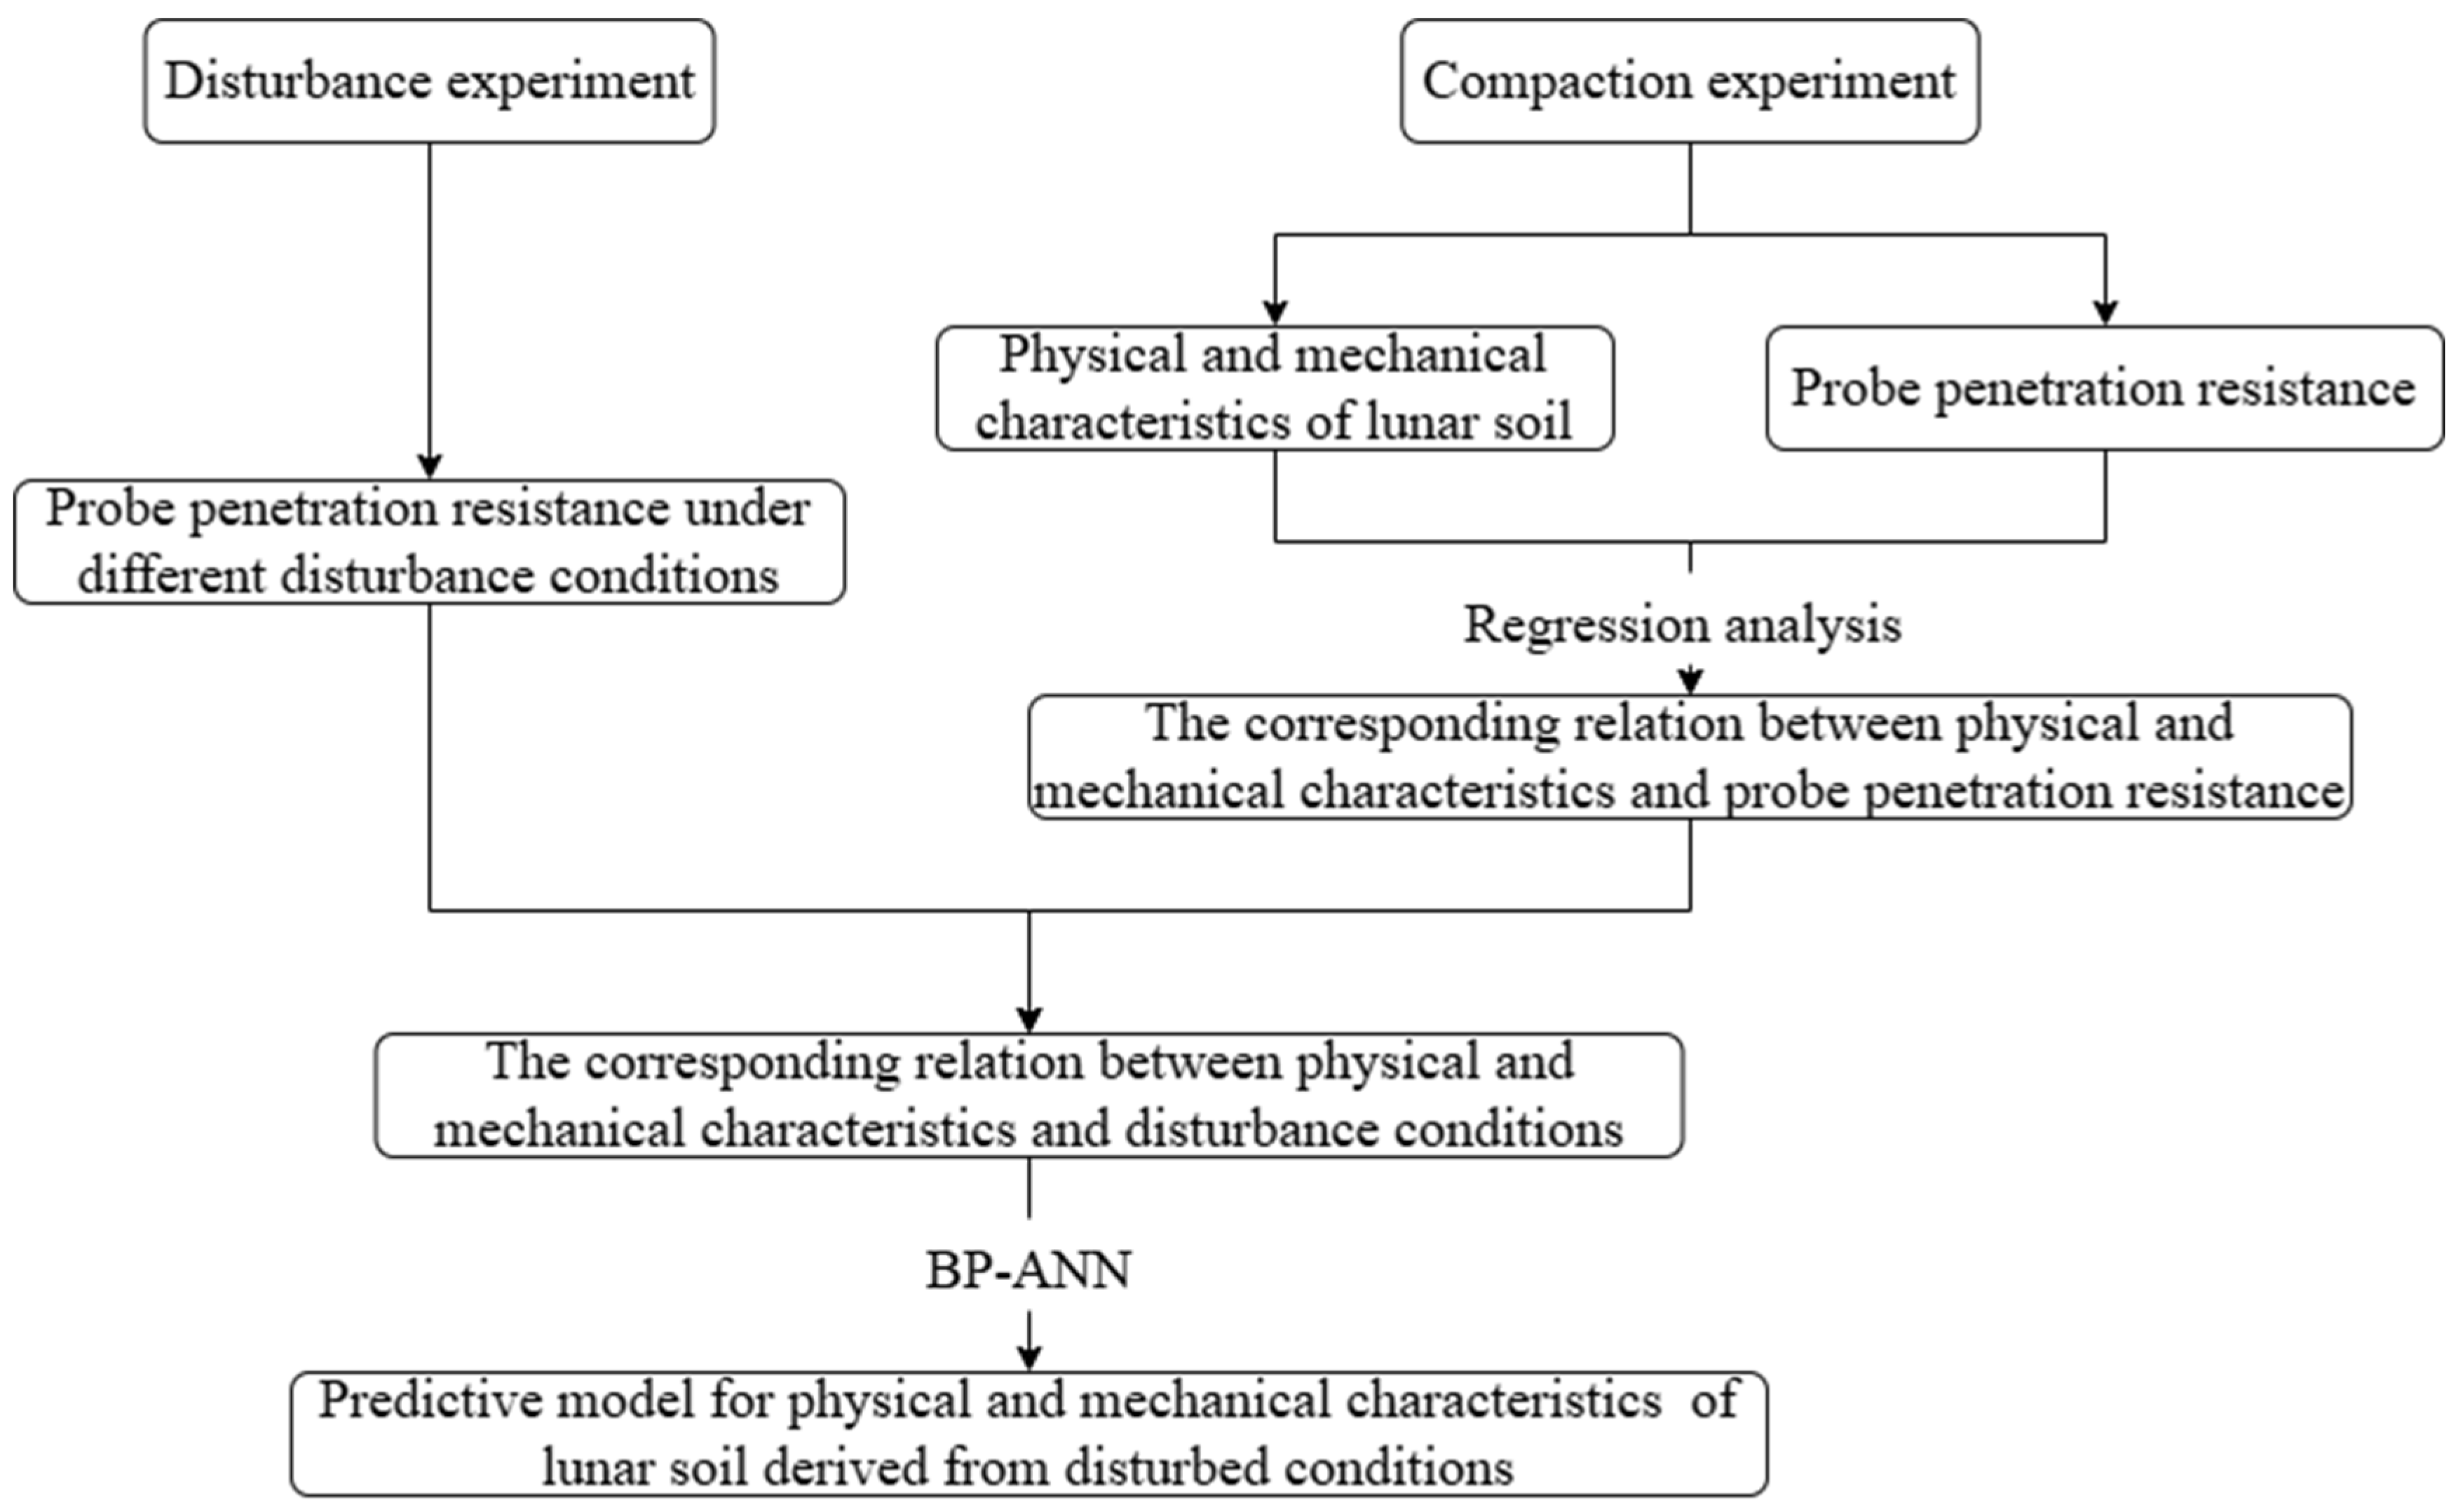
Figure 1. Flow diagram of experiment.
Aerospace 12 01011 g001
Figure 2. Force Analysis Diagram for the Probe. In the figure: α—half of the probe’s cone angle; The arrow indicates the direction of the force.
Aerospace 12 01011 g002
Figure 3. Structural diagram of the probe tip.
Aerospace 12 01011 g003
Figure 4. Compaction experiment. ((a). Simulated lunar soil before loading; (b). load compaction; (c,d). measurement of simulated lunar soil angle of repose).
Aerospace 12 01011 g004
Figure 5. Disturbance apparatus. (a,b) Sampling disturbance; (c) Measure the penetration resistance of the probe.
Aerospace 12 01011 g005
Figure 8. Compaction experiment results.
Aerospace 12 01011 g008aAerospace 12 01011 g008b
Figure 9. Penetration resistance curve.
Aerospace 12 01011 g009
Figure 10. Prediction accuracy comparison chart. In the figure: S—S-curve model.
Aerospace 12 01011 g010
Figure 11. The fitting relationship between φ, ρ of simulated lunar soil and kF. (a) The fitting relationship between φ and kF; (b) The fitting relationship between ρ and kF. The scatter points represent the experimental data, and the blue curve represents the fitted cubic regression model.
Aerospace 12 01011 g011
Figure 12. Scatter plot of internal friction angle and density. ((a). Scatter plot of internal friction angle when the width of digging is 3 cm; (b). Scatter plot of internal friction angle when the width of digging is 5 cm; (c). Scatter plot of density when the width of digging is 3 cm; (d). Scatter plot of density when the width of digging is 5 cm.).
Aerospace 12 01011 g012
Figure 13. Internal structure of prediction function.
Aerospace 12 01011 g013
Figure 14. Training performance of three algorithms in the training set.
Aerospace 12 01011 g014aAerospace 12 01011 g014b
Figure 15. The fitting accuracy of different algorithms for partially digging datasets.
Aerospace 12 01011 g015
Figure 16. The convergence curves of the training iterations for predicting the φ and ρ values. ((a). Internal friction angle of shovelling; (b). Density of shovelling; (c). Internal friction angle of digging; (d). Density of digging). The green circle indicate where the curve reaches a convergent state.
Aerospace 12 01011 g016
Figure 17. Error distribution plot of the BP neural network predicted values. ((a). Internal friction angle of shovelling; (b). Density of shovelling; (c). Internal friction angle of digging; (d). Density of digging).
Aerospace 12 01011 g017
Figure 18. BP neural network predicted value error distribution diagram. ((a). Internal friction angle of shovelling: R = 0.9785; (b). Density of shovelling: R = 0.9789; (c). Internal friction angle of digging: R = 0.9809; (d). Density of digging: R = 0.9703).
Aerospace 12 01011 g018
Table 1. CUG-1A simulated lunar soil properties [24].
ItemValueItemValue
Moisture content (%)0.240Porosity (%)36
Moisture density (g/cm3)1.700Compressibility (MPa−1)0.09
Dry density (g/cm3)1.696Compression modulus (MPa)17.43
Bulk density (g/cm3)1.400Cohesion (kPa)1.36
Relative density (%)261.1Internal friction angle (°)24.36
Void ratio0.569  
Table 2. Disturbance experimental factor level table.
FactorDepth (cm)Speed (mm/s)Width (cm)Entry Angle (°)
Level
1220330
23.535445
3550560
Disclaimer/Publisher’s Note: The statements, opinions and data contained in all publications are solely those of the individual author(s) and contributor(s) and not of MDPI and/or the editor(s). MDPI and/or the editor(s) disclaim responsibility for any injury to people or property resulting from any ideas, methods, instructions or products referred to in the content.