1. Introduction
Wind turbines very often interact with turbulent wind inflow conditions arising from various factors such as terrains roughness, weather patterns, and atmospheric stability, amongst others, due to their operation in the atmospheric boundary layer. The turbulent inflow causes fluctuations in the inflow angle, which subsequently results in the unsteady loads experienced by the wind turbine blades [
1]. These unsteady loads can result in fatigue damage [
2,
3,
4,
5], which is undesirable due to its adverse impact on the blade’s life and efficiency, possibly even resulting in its structural failure [
6].
With every passing year, wind turbines are getting bigger and bigger to have larger sweep areas and capture more energy. The up-scaling of wind turbines results in longer, flexible blades which are even more susceptible to these unsteady loads. In order to maintain the light weight of the blades and achieve the necessary stiffness, the blades are designed to have thick airfoils, especially towards the inner sections of the blade, because these airfoils are responsible for transmitting the loads to the turbine hub. Thick airfoils are aerodynamically inefficient as compared to the thinner airfoils. As they are nearer to the axis of rotation of the blade, they have lower radial velocity, thus the turbulent wind field causes larger angle of attack fluctuations and higher unsteady loads. Also, these airfoils cannot be optimally twisted due the blade’s structural limitation, resulting in them operating at much higher angles of attack. This is why the inner thick airfoils often experience aerodynamic separation and operate under stalled conditions. To extend the blade lifetime, and to improve its performance, the flow separation in the root section needs to be avoided.
In the past decade, research in the field of wind turbine blade load mitigation has gained significant traction. It is common practice in industry to employ pitch control methods, such as Individual Pitch Control (IPC), to alleviate loads on wind turbine blades [
7,
8,
9]. However, such a method is not suitable for reducing turbulence-induced unsteady loads, due to the blade’s high inertia and the fact that different regions of the blade interact with the turbulent inflow differently. There have been many studies on different passive and active flow control techniques, which influence the local aerodynamics of a specific region on a wind turbine blade [
10,
11,
12]. Some of the flow control devices that have been researched upon in recent years are vortex generators, trailing edge flaps, leading edge slats, synthetic jets, gurney flaps, adaptive camber airfoils, and microtabs, among many others [
13,
14,
15,
16,
17]. In commercial wind turbines, vortex generators have been often used for airfoil stall delays [
18,
19,
20,
21]. Although vortex generators demonstrate the ability to delay stalls to higher angles of attack, their effective angle of attack range is limited, along with increasing the drag of the airfoil [
22]. Also, they are largely ineffective in dealing with turbulence-induced fluctuating loads because they are physically fixed.
Leading edge slats, on the other hand, have been known to delay a stall for a much larger angle of attack range [
23,
24]. This property of the slat is very useful when considering the thick airfoils in the root region of the blade, which experiences high angles of attack. Using a leading edge slat can also drastically increase the maximum lift produced by an airfoil. Zahle et al. [
25] reported a maximum lift increase of around 130%, when using a fixed leading edge slat. There have been several other studies where significant stall delays and airfoil performance increases have been reported as well [
26,
27]. The fixed leading edge slat is great at stall delay, but has a drawback of having lower lift and higher drag when compared to a clean airfoil, for lower angles of attack.
The idea of using an actively controlled leading edge slat for airfoil load reduction was explored by Singh et al. [
28]. The active slat device consists of an integrated slat whose trailing edge can be moved using a stepper motor to vary the gap between the slat and the main body of the airfoil. This gap manipulation through an open loop control strategy is used to influence the aerodynamics of the airfoil. According to the experimental investigations, the active slat can reduce the standard deviation of loads by as much as 59% for low frequency wind gusts. Although this concept showed promising results, there are some disadvantages of an actively controlled slat system. The control system should be properly optimised and robust by correctly predicting the incoming flow field, otherwise the slat might end up amplifying the loads. Also, if such a device is used on a wind turbine, due to its complexity and large number of components, the maintenance expenses would be quite significant. The first step towards using a movable slat for load mitigation would be to reduce is mechanical complexity, as well as the complexity involved in employing an external control system.
To address the aforementioned issues, a passive-adaptive slat concept for a DU-91-W2-250 airfoil was recently designed by Schmidt and Wild [
29]. The concept was designed for load mitigation by preventing separation in the root region of a horizontal-axis wind turbine blade. The idea of the passive-adaptive slat device is inspired from the work of Petrikat [
30] and Braun [
31]. The designed slat concept presents a self-driven slat device, which moves due to the aerodynamic forces it experiences, without the requirement for any external mechanical or electrical actuation. According to the simulations performed in the study by Schmidt and Wild [
29], the passive-adaptive slat is able to delay stall by 20° and increase the maximum lift by approximately 130% in comparison to the clean airfoil. This is achieved by opening the slat for higher angles of attack. The study also reports that the concept is able to achieve higher lift-to-drag ratio as compared to a fixed slat for smaller angles of attack by closing the slat.
The aim of the current research article is to present experimental validation and testing of the passive-adaptive slat designed by Schmidt and Wild [
29]. The passive-adaptive slat is manufactured, and its performance is comprehensively tested in the wind tunnel under laminar, as well as various fluctuating inflow conditions. A 2D active grid is utilised to create user-defined sinusoidal inflow angle fluctuations which are correlated in the span-wise direction of the profile. Operating in various sinusoidal inflow conditions, the forces on the airfoil for a movable passive-adaptive slat are compared to the rigid slat case, as well as the case where the slat is completely closed to mimic a clean airfoil.
The article begins with the presentation of the experimental setup in
Section 2. This section provides the detailed information on the wind tunnel, 2D active grid and the measurement sensors. The kinematics of the passive-adaptive slat concept are discussed in
Section 2.1. The sinusoidal inflow conditions are described in
Section 2.2. Subsequently, the validation study with CFD for the two base case configurations is presented in
Section 3.1. A detailed aerodynamic characterisation of all the different slat configurations is discussed in
Section 3.2. The dynamic characterisation of the passive-adaptive slat is presented in
Section 3.3. Lastly,
Section 4 concludes the article.
2. Experimental Setup
The experimental investigations on the passive-adaptive slat concept were performed in the Göttingen type wind tunnel at the University of Oldenburg. The closed test section was 1 m wide, 0.8 m high, and 2.6 m long. The wind tunnel is capable of generating wind speeds up to 50 m s
−1 and, as reported by a Heisselmann et al. [
32], the turbulence intensity in laminar conditions is around 0.3%. A special design of a 2D active grid is used to generate the sinusoidal inflow angle variations [
33]. It is mounted at the nozzle of the test section. The 2D active grid has 9 flaps, which have been mounted vertically (
Figure 1). Each of the flaps can be controlled independently. The shape and orientation of the flaps ensure span-wise correlated inflow generation.
The generated inflow angle fluctuations are measured using an X-type hotwire with a sampling frequency of 10 kHz. The hotwire is placed in the empty test section, and is located 1 m downstream of the 2D active grid, which corresponds to the leading edge position of the airfoil. It must be noted that the 2D active grid is only used for the sinusoidal inflow measurements, and is removed when performing the laminar inflow measurements.
The airfoil used in this measurement campaign has an integrated passive-adaptive slat. The airfoil with the passive-adaptive slat is based on the DU-W2-250 profile, and its development and optimization were performed by Schmidt and Wild [
29]. The airfoil has a chord length
c = 300 mm and a thickness-to-chord ratio of
. For the present wind tunnel, the maximum achievable Reynolds number corresponding to the airfoil chord is around
. The presented measurements were obtained at a Reynolds number of
. The airfoil was tripped using a tripping tape to avoid any separation arising from laminar separation bubble burst.
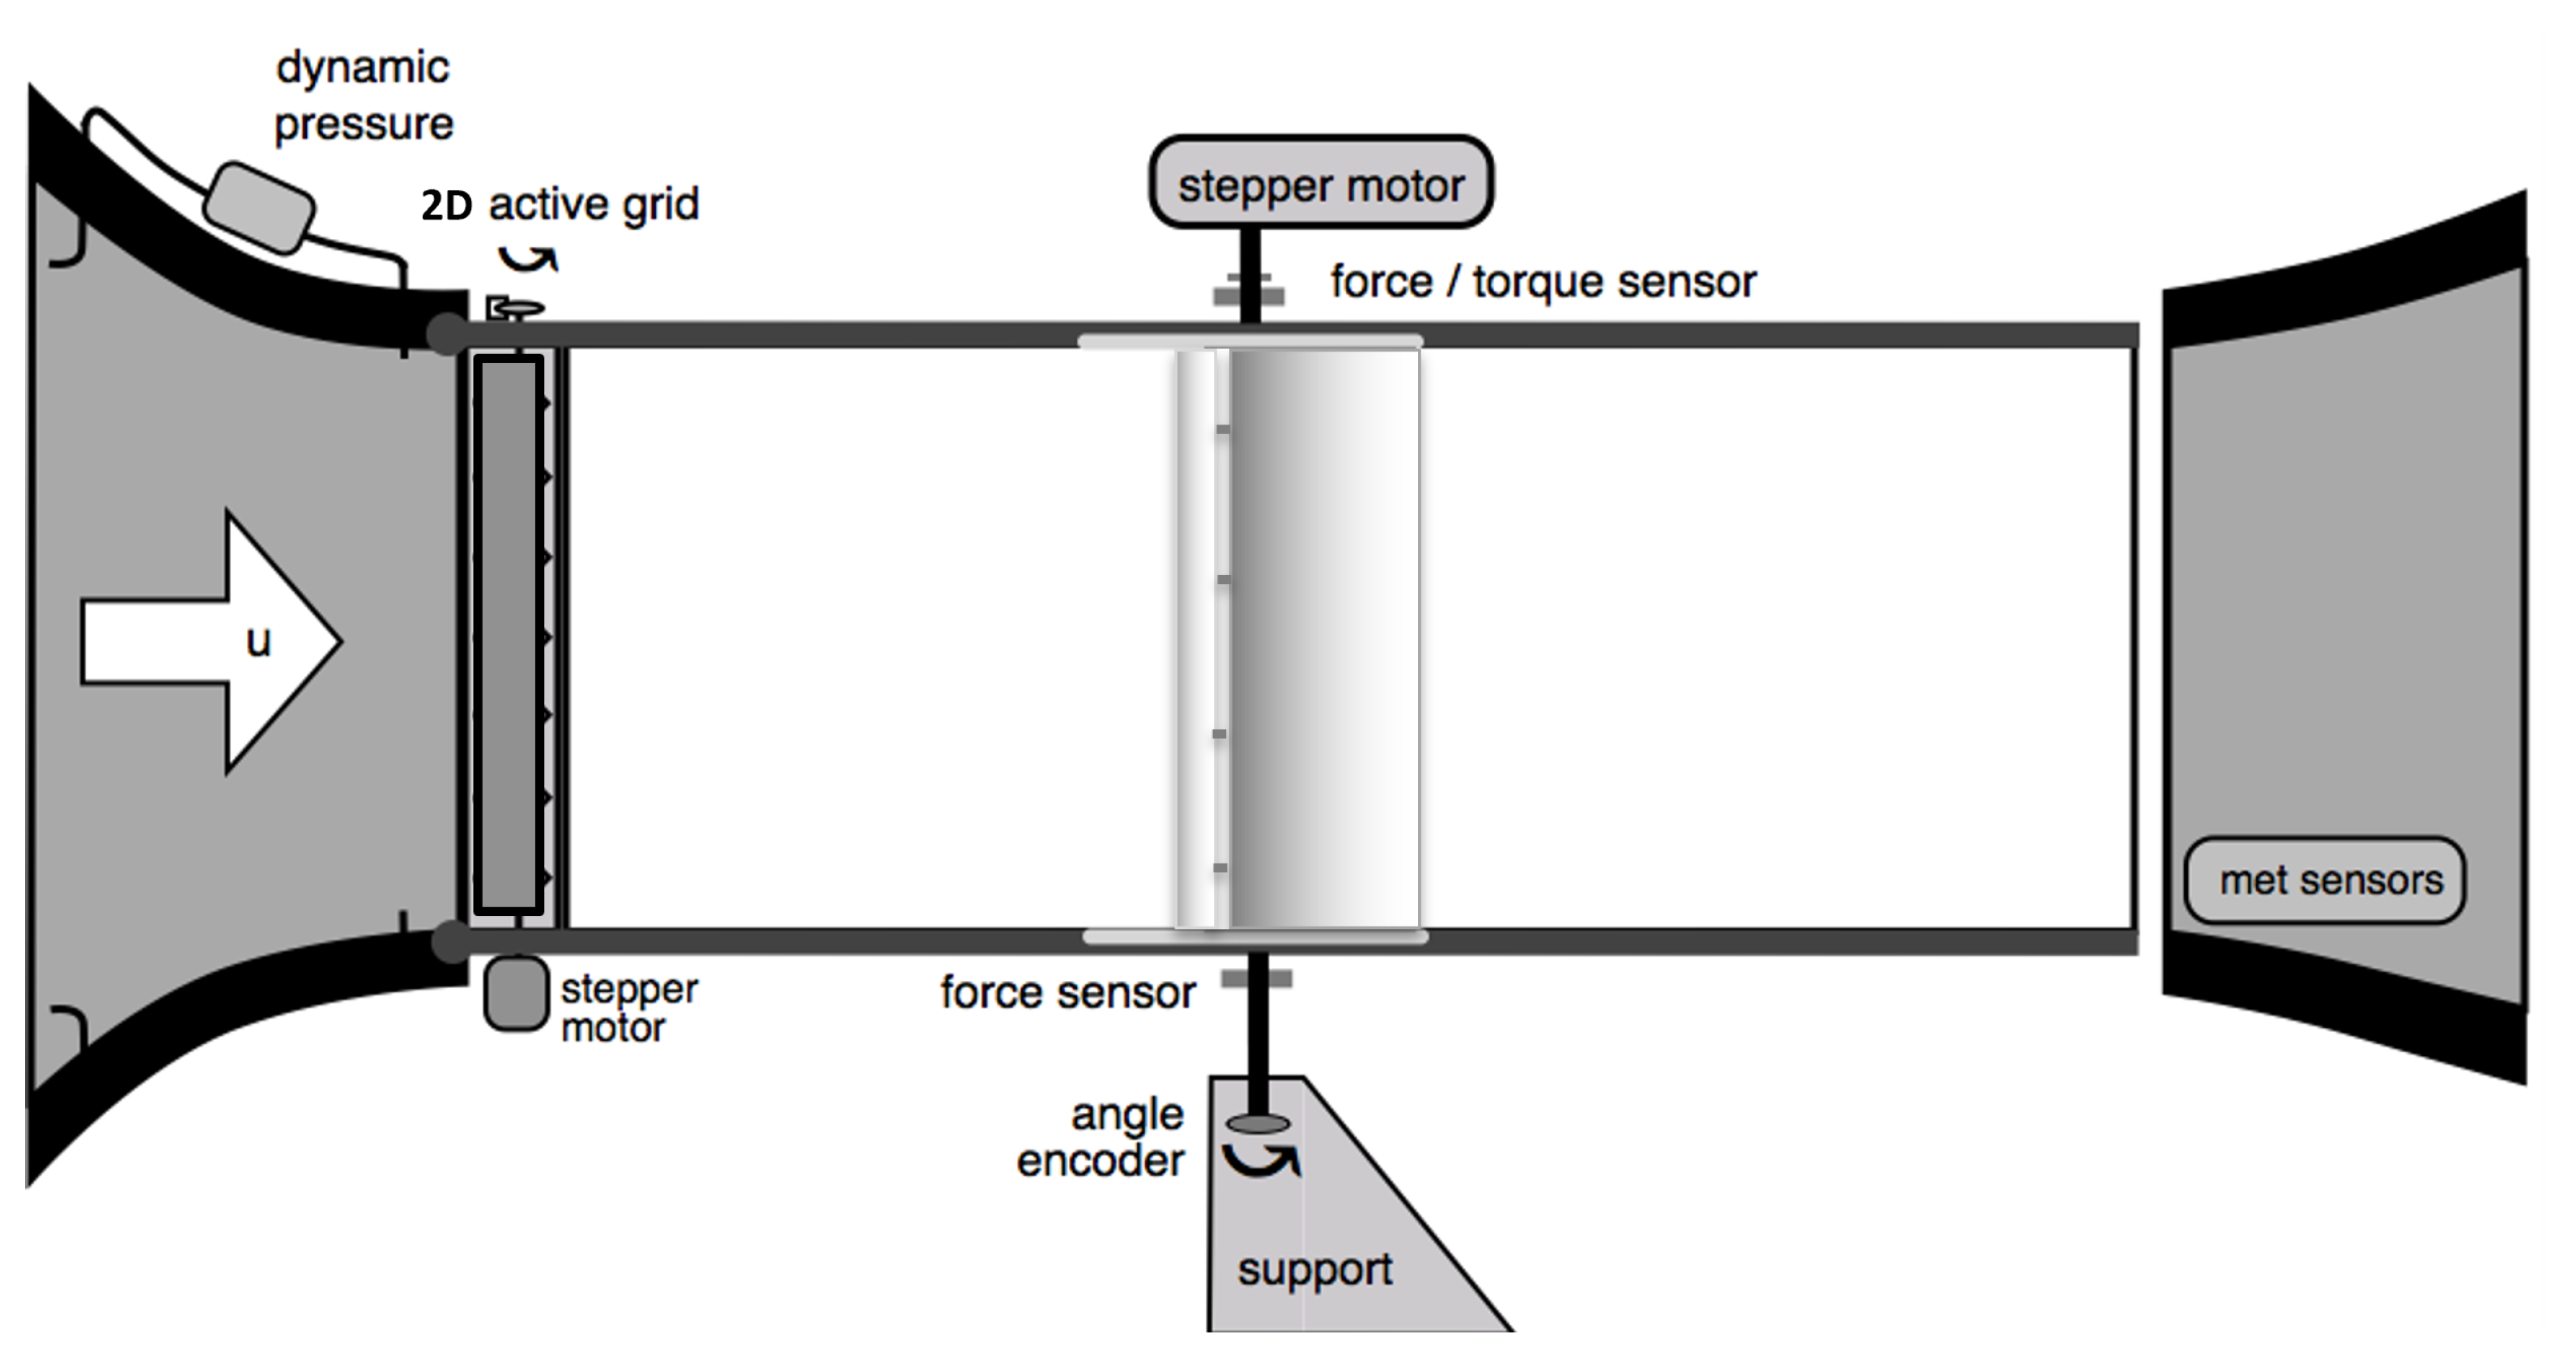
The airfoil is mounted on turntables in the top and bottom of the test section. The axis of rotation of the turntable setup passes through the quarter chord position of the airfoil, about which the airfoil is pitched using a stepper motor (
Figure 2). The forces acting on the airfoil are measured using a load cell and torque sensor mounted on the axis of the turntable. The force and torque measurements are acquired at a sampling frequency of 1000 Hz. The pitch angle of the airfoil is monitored using a directional sensor attached to the bottom turntable. A differential pressure transducer is used to measure the incoming reference wind speed. The temperature and humidity measurements were performed with a humidity–temperature sensor located in the settling chamber of the wind tunnel. All these measurements are synchronised with the force measurements, and are sampled at 1000 Hz as well.
The pressure distribution over the surface of the airfoil with the passive-adaptive slat is measured through a total of 42 pressure taps, which are located in the span-wise midsection of the profile. The main body of the airfoil has 27 of the pressure taps, while 15 pressure taps are distributed on the slat of the airfoil. The distribution of the pressure taps is shown in
Figure 3. Three synchronised pressure scanners take the pressure taps as inputs and record the pressure measurements at a sampling frequency of 100 Hz.
2.1. Passive-Adaptive Slat Kinematics
The kinematics of the passive-adaptive slat consists of a four bar linkage system (see
Figure 4). The linkage system has 3 movable levers
,
,
, which are connected by pivot joints
and
. Pivot joints
and
are fixed, and are the point of rotation for levers
and
, respectively. The imaginary point of intersection of
and
is defined as the instantaneous centre of rotation
R. Based on the position of the levers,
R changes its position as well. If the position of
R lies on the right of the resultant aerodynamic force on the slat
, a counter-clockwise moment M acts on the slat, causing it to experience an opening moment. The design of the kinematics is defined in such a way that the opening moment is applied at a certain angle of attack. At the opening angle of attack, the aerodynamic forces accordingly pull the slat away from the main-body of the airfoil. The opening of the slat is restricted by a stopper element
D, which is placed to define the opened position of the slat. On the other hand, the slat experiences a closing moment when
lies to left of the instantaneous centre of rotation
R. This causes the slat to be pushed towards the main-body of the profile, and the slat becomes closed. Based on the aerodynamic forces, the passive-adaptive slat kinematic allows the slat to freely move between the fully closed and open positions.
2.2. Sinusoidal Inflow
To perform dynamic characterisation of the model in the wind tunnel, it should be exposed to conditions which simulate fluctuations in the angle of attack. This can be achieved by either dynamically pitching the airfoil, or exposing the airfoil to fluctuating inflow conditions. For the present scenario, it was achieved by using a 2D active grid to modulate the inflow, thus avoiding the inertial forces caused by dynamically pitching the airfoil.
The 2D active grid is used to generate three distinct sinusoidal inflow cases. The three inflow cases have frequencies of 1 Hz, 3 Hz, 5 Hz, and peak-to-peak amplitudes of 2.6°, 3.6°, 5° in the inflow angle, respectively. The inflow cases were measured using a X-type hotwire in the empty test section, at the quarter chord position of the airfoil, which is later installed. The inflow angle time series for the three inflows are presented in
Figure 5. The time series follow the sinusoidal motion fairly well, with some overlapping noise due to the wake and separation of the 2D active grid flaps.
3. Results
The airfoil with the passive-adaptive slat was initially subjected to laminar flow conditions, and the lift and drag forces were measured for different angles of attack. The aerodynamic polars were measured for three different slat configurations: (1) closed slat, (2) open slat, and (3) free-to-move (passive-adaptive) slat configuration. The closed slat configuration represents the case where the slat is in a completely closed position and is fixed. This is one of the baseline configurations, and is representative of the clean profile. The open slat configuration consists of the slat being completely open and fixed. This case is also called the rigid slat case, and is the second baseline case. The free-to-move case represents the case where the slat is free to move based on the aerodynamic forces acting on it. The lift, drag, and moment coefficients were measured for the angle of attack range of −20° to 34° with a resolution of 1°.
3.1. Validation with CFD: Closed and Open Slat
The investigation commenced by first measuring the aerodynamic forces and the airfoil surface pressure distribution for the two baseline cases, i.e., the closed slat and open slat configuration. As mentioned before, the passive-adaptive slat was developed by Schmidt and Wild [
29]. In their work, Schmidt and Wild performed aerodynamic simulations for the closed as well as open configurations of the slat. The article states that the DLR FLOWer solver was used to perform aerodynamic simulations with steady RANS calculations using the Spalart–Allmaras one-equation turbulence model [
29]. The numerically obtained lift coefficient (
) and drag coefficient (
) are compared with the one measured in the wind tunnel in
Figure 6a for the closed slat configuration, and in
Figure 6b for open slat configuration, respectively. It is observed that the measured lift and drag polars match the simulations very well throughout the linear region of the polar for both configurations. The stall angle for the closed slat configuration was measured to be 11°, with a maximum
of
, which is very similar to the stall angle of 12° and maximum
of
computed by the CFD simulation. On the other hand, for the open slat configuration, the measured stall angle is observed to be around 27°, with a maximum
of
, which is much lower as compared to the simulated stall angle of 31° with a maximum
of
. According to the measurements, the open slat case is able to delay the stall by 16° and increase the maximum lift by almost 77%.
To better understand the aerodynamics of any airfoil, it is important to take a look at its surface pressure distribution. The surface pressure distributions computed through the CFD simulations are compared to those of the measurements for the closed slat case (
Figure 7) as well as the open slat case (
Figure 8). The pressure curves for both the open slat and closed slat case are divided into two sections; the smaller segment represents the pressure distribution on the slat, while the larger segment shows the pressure distribution on the main body of the airfoil. The overall force acting on the airfoil is a combination of the aerodynamic forces acting on the slat and the main body of the airfoil.
In
Figure 7a, it is observed that the simulated pressure curve shows good agreement with the measurements for angle of attack of 0°. The pressure curve for both the measured and simulated case is almost collapsed, thus indicating very little pressure difference between the suction and pressure side of the airfoil and, thus, very low lift. The pressure curves match the angles of attack of 7° and 8° very well (
Figure 7b,c). For these angles of attack, the suction pressure for both the slat and main body of the airfoil are higher, resulting in higher lift for the airfoil. When the angle of attack is 14°, it is expected that the airfoil in the closed configuration would stall (
Figure 6a). This is observed in the measurements in
Figure 7d, wherein the pressure curve is flat on the main body of the airfoil. A flat pressure curve means that the pressure is same at different points on the airfoil, thus indicating a stall. The stall effect is only observed on the main body of the airfoil, while the pressure curve on the slat still shows a suction peak. This is why the measured lift curve of the close slat case shows a gradual stall instead of sharp stall between 11° to 28°. The FLOWer CFD simulation is a steady simulations; hence, for an angle of attack of 14°, it is not able to fully capture the behaviour of the flow around a stalled airfoil.
For the open slat case in
Figure 8, it is observed that CFD simulations show excellent agreement with the measured pressure curves. For angles of attack of 0°, 7°, and 8°, the simulated pressure curves almost overlap the measurements. The stall delay property of the open slat case can be clearly seen in the surface pressure distribution with high suction peaks observed on the slat, as well as the main body of the airfoil for angles of attack of 14° and 20°. The simulated pressure curves have higher suction peak for the angles of attack of 14° and 20° in comparison to that of the measurements. This results in higher lift for simulations for these angles, as seen in
Figure 6b. For the angle of attack of 29°, it is seen that the measured pressure curve has complete flat trajectory across the airfoil, indicating its fully stalled state. The simulated pressure curve, on the other hand, still shows a large suction peak. This is in agreement with the polar comparison in
Figure 6b, wherein the airfoil goes into deep stall at angle of attack of 29° for the measurements, while the simulated
curve does not stall.
3.2. Laminar Characterisation
The measurement of aerodynamic polars for closed and open slat configuration was by the measurement of lift and drag polars for the free-to-move (passive-adaptive) slat configuration. According to the design of Schmidt and Wild [
29], the passive-adaptive slat kinematic triggers the opening behaviour when the angle of attack is larger than 7°. Thus, from the design perspective, the free-to-move slat case lift curve should follow the closed slat case up to around 7°, and then gradually shifts to the lift curve of the open slat configuration. On the contrary, when looking at the lift curve for the open, closed and free-to-move configuration shown in
Figure 9, it is observed that the free-to-move case lift curve completely overlaps that of the closed slat configuration. This indicates that the slat remains in the closed state throughout the angle of attack range. The passive-adaptive slat has been validated to have very good agreement with lift and drag forces, as simulated using CFD. The airfoil has surface pressure distribution, in accordance with the design as well. Thus, ideally, it should operate according to the design, and open when the angle of attack is larger than 7°. The main reason for this opening resistance is speculated to be the static friction of the passive-adaptive kinematics in the closed position. This might be due to mechanical imperfections or slight deviations during the manufacturing process.
In order to avoid the excessive static friction in the closed position, it was decided that the complete closure of the slat should be restricted. This was performed by introducing a limiter to restrict the complete closure of the slat. After adding the limiter, the minimum gap-size between the main body and the slat is 1.7 mm. The passive-adaptive configuration with the limiter in place is named as the passive-adaptive (lim) configuration. In this case, the slat is free to move under the influence of aerodynamic forces, but can only close as much as the limiter permits. The new closed configuration with the limiter in place is called the closed (lim) slat configuration. The lift and drag polars were measured for the passive-adaptive (lim) and closed (lim) slat configurations, and compared with the open and closed cases.
Figure 10a and
Figure 10b, respectively, show the lift coefficient
and drag coefficient
variation with the angle of attack
for the four aforementioned slat configurations. It is observed that the lift produced by the airfoil in the closed configuration is higher than that of open slat in the −6° to 4° range, but has a lower slope. Beyond the angle of attack of 8°, the
values for the open configuration dramatically increase as compared to that of the closed configuration. The closed (lim) configuration achieves higher peak
value as compared to closed configuration, but a much smaller peak
value when compared to open slat configuration. The airfoil with a closed (lim) configuration also delays stalling, with a stall angle of 26°. When looking at the passive-adaptive (lim) case, it is observed that it follows the closed (lim) curve up to the angle of attack of 8° and, beyond that, the passive-adaptive (lim) case jumps to match the open slat case configuration. This aligns with the passive-adaptive slat’s design, intended to open at angles of attack higher than 7°. Thus, incorporating the limiter facilitated the validation of the passive-adaptive slat’s design for the opening angle. In comparison with the open slat configuration, for the passive-adaptive (lim) case, a slightly higher peak
value, as well as a higher stall angle of 30°, is observed.
The drag curve sees the exact opposite behaviour as compared to the lift curve, wherein it is lower for the closed configuration in the linear range, and increases drastically beyond 11° due to the aerodynamic stall experienced by the airfoil. The open slat configuration has a higher drag in the linear region, but experiences a much lower drag for higher angles of attack due to the flow remaining attached. The passive-adaptive (lim) case, on the other hand, has a lower drag than the open configuration in the linear range and, for higher angles of attack, a much lower drag than the closed slat configuration.
The passive-adaptive slat tries to leverage the advantages of both the clean profile (represented by closed slat case) and a rigid slat (represented by open slat case). This is clearly visible in the
curve plotted in
Figure 10c. When compared to the open slat case, the passive-adaptive (lim) case has a higher lift-to-drag ratio in the region of −2° to 6°. The closed slat case has an even higher lift-to-drag ratio in the region. In an ideal scenario with no static friction issue, the passive-adaptive case would have remained completely closed and matched the
curve of the closed slat case. But even with the limitations of the setup, the passive-adaptive (lim) case has better performance than the open slat case for lower angles of attack. The
curve for the closed slat case reaches a maximum of
at 7° and, thereafter, starts decreasing, with a sharp decline after 11° when the airfoil starts stalling. Although the open slat case has lower lift-to-drag ratio in the linear region of the lift curve, it has a higher slope as compared to the closed slat in the region. The open slat case reaches maximum
value of
at 12°, which is approximately 23% higher than the closed slat case.
The passive-adaptive (lim) case leverages the benefits of both the open and closed slat. At an angle of attack of 8°, it transitions to have similar lift-to-drag ratio similar to that of the open slat case. For higher angle of attack values, the open and passive-adaptive (lim) slat case continues to have a much higher value, until they collapse when the respective cases reach a deep stall.
The discussion above is focused on the opening behaviour of the slat. For checking the closing behaviour of the passive-adaptive slat, the passive-adaptive (lim) case polars were measured in the reverse direction from 34° to −20° with decrements of 1°. The comparison of lift curves for the passive-adaptive (lim) case in the forward and reverse direction is presented in
Figure 11. According to the design of the passive-adaptive slat, it should close at angles of attack less than 5° [
29]. This means that the passive-adaptive (lim) reverse polar should follow the open slat case up to 5° and then jump to the closed (lim) case lift curve. On the contrary, it was observed that the passive-adaptive (lim) reverse lift curve continues to follow the open slat case lift curve up to −1°, and then jumps to match the closed slat case at an angle of attack of −2°. One potential explanation for this phenomenon may stem from the fact that, akin to what was noted in the scenario with closed slat case, the slat encounters some frictional resistance from the mechanism when in the fully open position. Thus, the moment applied by the aerodynamic forces might not be enough to close the slat at the designed 5° value.
3.3. Dynamic Characterisation
The capabilities of the airfoil with a passive-adaptive configuration is tested under sinusoidal inflow angle fluctuations with varying levels of frequencies and amplitudes. It is exposed to the three sinusoidal inflow cases, as described in
Section 2.2. For each of the inflow cases, the airfoil is tested for pitch angle ranging from 0° to 15° with steps of 1°. The effective angle of attack experienced by the airfoil is the pitch angle superimposed on the sinusoidal inflow angle variation. To analyse the different time series, we look at the respective mean and standard deviation of the aerodynamic forces acting on the airfoil.
Figure 12 presents the mean and standard deviation of the
time series with respect to the mean angle of attack. Each of the subplots presents the comparison for the closed, open, closed (lim) and passive-adaptive (lim) slat configurations.
Figure 12a,b present the mean lift coefficient
and lift coefficient standard deviation
for inflow case with frequency of 1 Hz. It is observed that, up to the pitch angle of 7°, the closed case has the highest mean. In this region, not only does the open slat case have a significantly lower
, it also has a
as much as 55% higher (for
= 3°) than the closed slat case. The passive-adaptive (lim) case for this angle of attack range has a
similar to the open slat case, but has much lower
values than the open slat case. For higher angles of attack, the
for closed slat case flattens as the airfoil is stalled. For
= 15°, the passive-adaptive (lim) slat is able to achieve
values, which are approximately 32% higher than closed slat case, and only 2% lower than that that of the open slat case. The passive-adaptive (lim) slat is able to achieve a
almost equivalent to that of the open slat case while an having approximately 13% lower
for
= 15°, and as much as 40% lower
for
= 10°.
The
and
comparisons for the different slat configurations for inflow case with frequency of 3 Hz are presented in
Figure 12c,d. The closed and open slat case exhibit similar behaviour as the 1 Hz inflow case. It is observed that the passive-adaptive (lim) slat has mean lift coefficient values larger than the open slat case for very small
values. The 3 Hz sinusoidal gusts cause the slat to open even at mean angles of attack as low as 5°. For mean
= 15° the passive-adaptive (lim) slat has
approximately
higher than the close slat case. For the same angle of attack, it has approximately
lower
when compared to open slat case.
For the inflow with a sinusoidal frequency of 5 Hz, the
and
comparisons are presented in
Figure 12e,f. The 5 Hz inflow case has a higher peak-to-peak amplitude of angle of attack variation than the other two inflow cases. This results in the passive-adaptive (lim) case open for mean
= 4°. Similar to the 3 Hz inflow case, the passive-adaptive slat provides an advantage of higher mean lift and lower lift fluctuations as compared to the open slat case for small angles of attack. Similarly, for mean
= 15°, it has a
approximately
higher than the close slat case, and an approximately
lower
when compared to the open slat case.
In order to clearly visualise the performance of the passive-adaptive (lim) slat relative to the closed and open slat cases, the ratio of the
for the open, closed, and closed (lim) slat cases, and the mean lift coefficient of the passive-adaptive (lim) case
are presented in
Figure 13a,c,e, respectively. Similarly, the ratio of the
for open, closed, and closed (lim) slat cases, and the standard deviation of lift coefficient of the passive-adaptive (lim) case
are presented in
Figure 13b,d,f, respectively. Apart from the observations mentioned above, it is seen that for the angle of attack range of 6° to 12°, the open slat case has standard deviation as much as
larger than the passive-adaptive (lim) slat for the 1 Hz inflow. This difference becomes lower for higher frequency inflow of 3 Hz and 5 Hz. It seems that the passive-adaptive (lim) slat is able to react better to the inflows with lower frequency fluctuations.
4. Conclusions
In this study, a passive-adaptive slat concept on a DU-91-W2-250 airfoil was aerodynamically characterised and tested under sinusoidal variation of the inflow angle. The passive-adaptive slat designed by Schmidt and Wild [
29] does not have any external electrical or mechanical actuation, and only operates using the aerodynamic forces acting on it. Based on these forces, the slat can close to represent a clean airfoil or open to mimic an airfoil with a fixed slat. In the initial laminar characterisation, it was found that the slat’s movement was inhibited due to the static friction when in the completely closed position. An additional limiter was added to restrict its complete closure and, thus, avoid the high static friction. It is observed that for lower angles of attack, the passive-adaptive slat has a higher lift than the open slat case. The modified passive-adaptive slat was able to completely open at the design angle of attack of 7°. Due to the opening behaviour, the passive-adaptive slat is able to delay stalling to 30°. The passive-adaptive slat exhibits higher lift-to-drag ratio in the −2° to 6° angle of attack range when compared to the open slat case. It achieves an approximately 23% higher lift-to-drag ratio with respect to the closed slat case for higher angles of attack.
The passive-adaptive slat was tested under three different sinusoidal inflow cases to understand its behaviour towards dynamic inflow changes. When exposed to sinusoidal inflow angle variation, for high angles of attack, the passive-adaptive slat is able to greatly reduce the standard deviation of fluctuating lift forces while generating similar mean lift values as an airfoil with a fixed slat by delaying stalling. It is also able to moderately mitigate the disadvantages of a fixed slat in the lower angle of attack range by producing higher mean lift values. The passive-adaptive slat shows the ability to harness the advantages of both an airfoil with a fixed slat and a clean profile. It is also observed that the passive-adaptive slat performs better for inflows with low frequency fluctuations as compared to the higher frequency inflows.
The passive-adaptive slat in the current setup was manufactured using high precision machined aluminium. This made the setup heavy, causing significant inertial forces as well as friction. This inhibited the free movement of the slat according to the designed kinematics. Perhaps use of a lighter material for the slat, along with improved kinematics, may result in its better performance, which might enable it to have quicker response to dynamic inflows. Also, the passive-adaptive slat’s performance under complex turbulent inflows needs to be explored in upcoming research. Incorporating this device into a real-world wind turbine poses numerous additional challenges that must be addressed. The current design of the kinematics was based on a 2D airfoil, and research is required to translate the two dimensional design to a full scale 3D rotor blade. Additionally, aeroacoustic studies need to be performed as well, so as to inspect the noise emitted by the slatted airfoil.


 ,
, 