Article

Numerical Simulation of Water Film Flow and Breakup on Anti-Icing Surface

1
Aero Engine Academy of China, Beijing 101300, China
2
Department of Aeroengine Control System, AECC Hunan Aviation Powerplant Research Institute, Zhuzhou 412002, China
3
College of Energy and Power Engineering, Nanjing University of Aeronautics and Astronautics, Nanjing 210016, China
*
Author to whom correspondence should be addressed.
Aerospace 2024, 11(5), 352; https://doi.org/10.3390/aerospace11050352
Submission received: 5 February 2024 / Revised: 14 April 2024 / Accepted: 23 April 2024 / Published: 29 April 2024
(This article belongs to the Special Issue Deicing and Anti-Icing of Aircraft (Volume III))

Abstract

:
The flow and morphological characteristics of liquid water on the icing and anti-icing surfaces of aircraft are closely related to the icing characteristics and anti-icing surface temperature distribution. To predict the flow and breakup characteristics of a water film, a 3D model of continuous water film flow and a model of water film breakup into rivulets on an anti-icing surface were constructed based on the icing model, and the corresponding methods for solving the models were developed. Using the NACA0012 airfoil as a simulation object, the changing characteristics of height and velocity for a continuous water film with time and the morphological characteristics of rivulets formed from the breakup of a continuous water film were simulated numerically. The results indicate that, with an increase in inflow velocity, the time required for the water film to completely cover the surface and reach stability decreases. Downstream in the water droplet impact zone, the calculated values of continuous water film height align well with experiments, as well as the stream height at the continuous water film rupture location with the experimental values. With the reasonable contact angle, the calculation error of the stream width is within 10%.

1. Introduction

When an aircraft passes through clouds containing supercooled water droplets (the water droplets that remain liquid at temperature below the freezing point), the water droplets impinge and freeze on the windward surfaces of the wings, windshields, engine intake lips, struts, spinners, and other components; this is known as aircraft icing. Ice accretion on the aircraft wings changes the aerodynamic shape of the wings and affects the airflow near the wings, thus reducing flight lift and increasing flight resistance. The engine icing reduces thrust and increases fuel consumption, threatening flight safety. Therefore, the icing components of aircraft and engine are usually equipped with anti-icing or de-icing systems, such as hot-air heating, electrical heating, ultrasound technology, shape memory alloys de-icing technology [1] and electric pulse de-icing, low-frequency piezoelectric de-icing, and hydrophobic material anti-icing [2]. In glaze ice and wet surface anti-ice, the unfrozen water film on the icing surface flows downstream under the air flow. This may cause overflow ice or an ice ridge in unprotected areas, harming the aircraft. The flow of a water film is also closely related to the distribution of anti-icing temperature on the wet surface. Therefore, the study of water film flow on the surface of icing components is of great significance for icing prediction and anti-icing design and optimization.
In terms of experimental research, Hansman and Turnock [3] observed a smooth wet zone in the stagnation region with a uniform water film, a rough zone with stationary beads, and a zone where surface water ran back as rivulets in glaze icing tests. Moghtadernejad et al. [4] found that the adhesion of water to the hydrophobic surfaces is low, so the rivulet height formed on the hydrophobic surfaces is high in an experimental study of rivulet flow under the effect of various air shear speeds and different surface morphologies. Zhang et al. [5,6] conducted an experimental study in which the thickness of water film/rivulet flow driven by air flow on an airfoil surface was measured using digital image projection technology. They also observed that when the wind speed increases the continuous water film breaks into multiple rivulets, and the initial ice roughness has a significant effect on the rivulet shape [7]. Lou et al. [8] conducted experiments in which the water film broke up to form rivulets on NACA0012 airfoil surfaces based on open straight-flow and low-speed wind tunnel.
In terms of numerical research, the Messinger model [9] was first applied for aircraft icing prediction. The model assumes that all unfrozen water in the current icing control volume flows into the downstream control volume. Al-Khalil et al. [10,11] first proposed an anti-icing runback model in which a continuous water layer in the direct impingement is assumed to form individual, equally spaced rivulets at breakup. Fortin et al. [12] presented an analytical model during ice accretion which is based on the water behavior at the surface, such as rivulet, bead, and water film. The water film thickness is independent of time. Based on ONERA [13], Silva et al. [14] presented a mathematical model in which the water film breakdown into rivulet flows is modeled. Dong et al. [15] developed a calculation method to analyze the water film flow which exists in the water droplet impinging area and predict its thickness. Outside the impinging area, the water film breaks into rivulets, whose mathematical model was also presented. Bu et al. [16] established a two-dimensional rivulet model by introducing the minimum energy criteria, and the critical thickness of film breakup was solved.
The above studies are based on the two-dimensional icing or water flow model. Meanwhile, the models do not contain time-dependent terms; their application is limited to steady-state problems. Bourgault et al. [17] first proposed a three-dimensional thermodynamic model for ice accretion, which is based on a system of partial differential equations with time-dependent terms. The icing model assumes that the unfrozen water flow on the icing surface is a continuous shallow water film driven by the shear force of air flow. The model is applied in FENSAP-ICE, which is the representative of the second-generation icing software. Using the surface shape and surface tension of a water film flow, Myers [18] applied a lubrication approximation theory and proposed a new three-dimensional model. Cao [19,20] simplified the Navier–Stokes equation and proposed a three-dimensional icing model coupled with water film flow and icing phase change. At present, several improved icing models [21,22] have been developed, and good results have been achieved in regard to icing prediction. Gosset [23] first applied the Minimum Total Energy criterion to a sheared film on a NACA profile and confronted the experimental data. The film model included the continuity equation and the momentum equation. Lei [24] proposed a three-dimensional icing calculation method that used water film flow, heat and mass transfer of air, and a water film and ice layer; at the same time, the method used a modified ice-type discrimination method in the Myers model and obtained better icing simulation results. Xin [25], by improving the Myers water film flow model, achieved a better prediction of the airfoil anti-icing surface temperature. Ferro [26] proposed a new model for ice accretion, which permits the simulation of the shape of the ice formed over a profile varying boundary condition. The CFD simulations show good agreement with the NASA experimental outcome. Samad [27] proposed a reduced-order modeling technique based on the Unsteady Vortex Lattice Method (UVLM) to predict rotor icing and to calculate the required anti-icing heat loads.
To sum up, numerical research on water film flow that is related to icing and anti-icing is mainly based on steady-state simulation. However, studies on the transient characteristics of water film flow and the verification of water film height calculations are few. There is also a lack of verification of the morphological parameters of a continuous water film breaking into rivulets. Therefore, this paper constructs a three-dimensional model of continuous water film flow on an anti-icing surface and a model of continuous water film breakup that forms rivulets. Through a numerical calculation, the transient characteristics of continuous water film flow, the height of a water film when reaching the steady state, and the morphological parameters of its breakup into rivulets are obtained. The calculation results are compared with the experimental results in Ref. [5] to verify the effectiveness of the model proposed in this paper and the accuracy of the algorithm.

2. Mathematical Model and Calculation Method

2.1. Physical Process and Overall Calculation Process

Under the conditions of incomplete evaporation, that is, the anti-icing heat is insufficient to completely evaporate the water, non-solidified water film flow exists on the surfaces of anti-icing components. Usually, the continuous water film is maintained in the impingement area due to a continuous supply of water droplets. Downstream of the impingement area, due to the influence of surface tension, water evaporation, and energy consumption in the flow process, the water film is hindered from maintaining its original form. The film breaks into rivulets that extend downstream in the flow [10,11]. The rivulets may further break into discrete water droplets [28].
The paper will perform numerical calculations on the physical processes of the continuous flow of the anti-icing surface water film mentioned above, as well as the rupture of the continuous water film leading to the formation of rivulets, the calculation in this paper includes five main parts, as shown in Figure 1.
Firstly, establish a computational model for the air–water droplet two-phase flow based on the anti-icing components. Then, using the Euler–Euler model of commercial software CFX 19.2, the two-phase flow field outside the anti-icing components is calculated. Then, a self-developed code is used to extract the calculation results of the two-phase flow field near the anti-icing wall, including the heat transfer coefficient, airflow shear force, impingement velocity, and volume fraction of droplets. Taking the extracted calculation results as input, the self-developed calculation code is used to solve the continuous water film flow model, and the distributions of parameters, such as water film flow velocity and water film height, are obtained. Finally, taking the calculation results of continuous water film flow as input, the morphological parameters of the rivulets after continuous water film rupture are solved using the independently developed calculation code. In Figure 1, the most crucial steps involve the calculation of the continuous water film flow and the determination of rivulet morphology parameters. The following sections present the establishment and computational methods of mathematical models for continuous water film and rivulet flow.

2.2. Continuous Water Film Flow

2.2.1. Mathematical Model

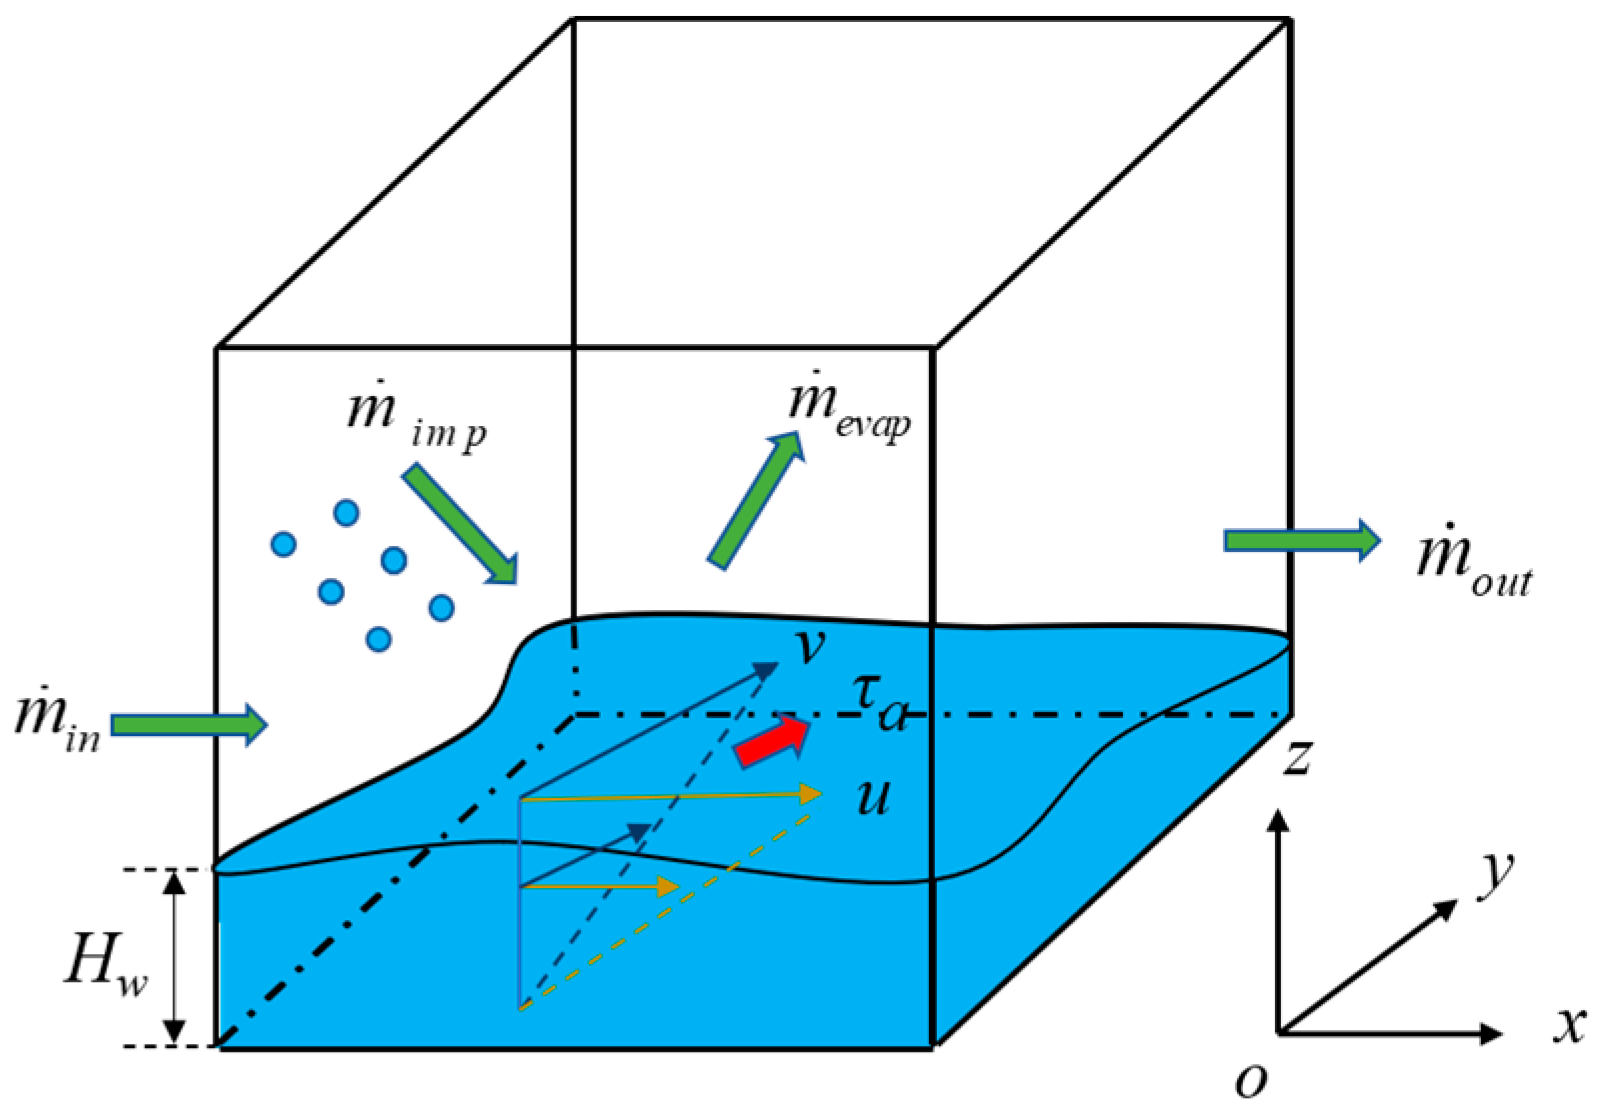
As shown in Figure 2, for an anti-icing surface without icing, a continuous water film usually forms in the impingement area, which flows along the anti-icing surface, driven by the drag force of the air flow.
The calculation grid of the two-phase flow near the wall is taken as the control body of the continuous water film flow model; the height of the control body is the same as that of the first layer grid. The control body is divided into two layers: a two-phase flow layer and a water film layer.
A body fitted rectangular coordinate system is used for numerical calculation; that is, the x-y plane is the anti-icing surface, and the positive direction of the z-axis is perpendicular to the x-y plane and points to the outside of the anti-icing surface. In Figure 2, the height of the water film is H w ; the flow velocities of the water film in the x- and y-direction are u and v, respectively; the impact flow rate and evaporation flow rate of the water droplets per unit area are m ˙ i m p and m ˙ e v a p , respectively; and the flow rates along the flow direction of the water film into and out of the control body are m ˙ i n and m ˙ o u t , respectively.
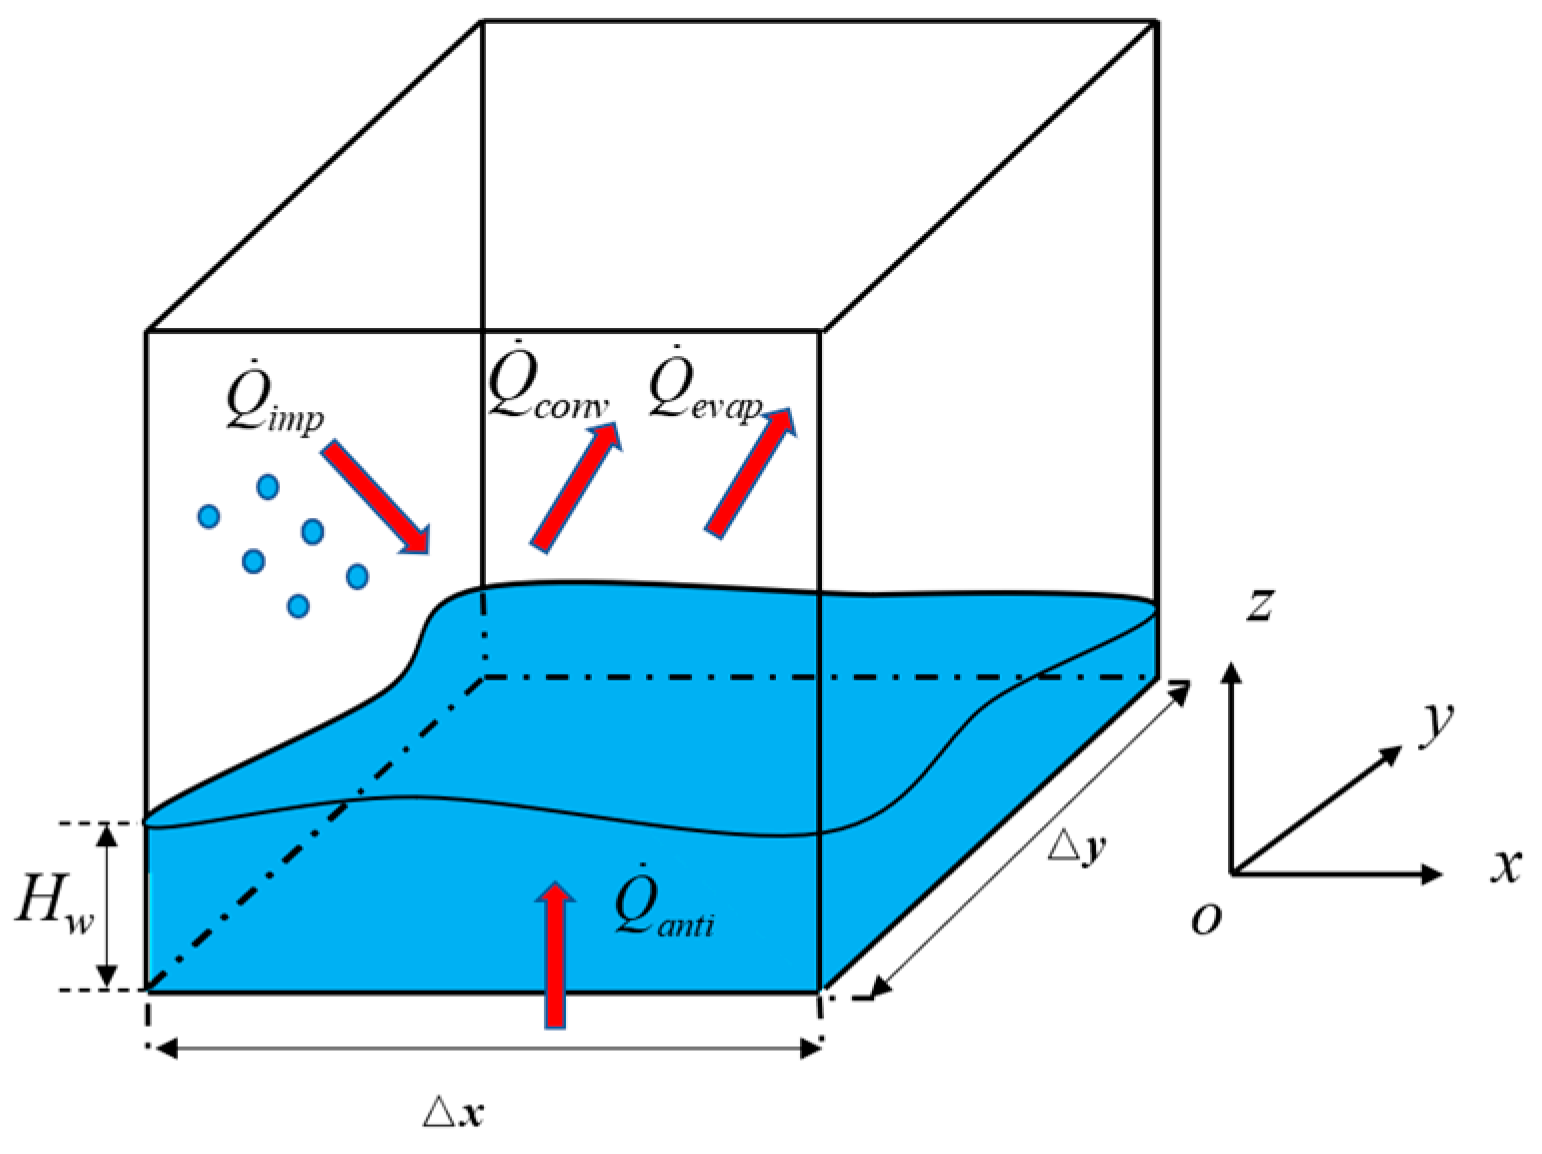
The energy conservation in the control body is shown in Figure 3. Q ˙ i m p , Q ˙ c o n v , Q ˙ e v a p , and Q ˙ a n t i are, respectively, the energy from impingement of the droplets per unit area in the control body (the sum of the kinetic energy and enthalpy change), the convective heat transfer between the water film and air, the latent heat released by water film evaporation, and the anti-icing heat flow.
The continuous water film flow model used in this paper is based on Ref. [19] and follows the evaporation module of Ref. [21]. The research in this paper focuses on the water film flow on the anti-icing surface and proposes the following hypotheses:
(1) No ice formation occurs on the anti-icing surface.
(2) The air and water film are treated with constant physical properties. The incoming flow conditions remain unchanged during the simulation.
(3) The thickness of the water film is small, usually at the scale of 10−4 m or less [29,30].
(4) The flow speed of the water film is low, usually at the scale of 10−1 m/s or less [29,30], so the water film flow is treated as laminar flow.
(5) The impingement and wave effect of impinging water droplets on the surface water film can be ignored.
(6) The drag force at the air–water film interface is equal to the shear force of the air on the anti-icing surface, which is τ a .
The control equations for the water film flow are established by relying on the conservation of mass, momentum, and energy of the continuous water film. According to the above assumptions and Ref. [19], since the shear force of the air has no obvious change the thickness of the water film is small, and the flow speed of the water film is low, the convective terms and time-derivative terms in the momentum and energy equations can be ignored. Considering the instability of water film flow, the continuity equation retains the time-derivative term, as the equation is directly related to phase transition. Based on the assumptions and dimensional analysis that were employed to simplify the control equations [19], we yielded the following equations.
Continuity equation:
H w t + x 0 H w u d z + y 0 H w v d z = m ˙ i m p m ˙ e v a p ρ w
where t is the time, and ρ w is the density of water.
Momentum equation:
1 ρ w p x + g x + ν w 2 u 2 z = 0 1 ρ w p y + g y + ν w 2 v 2 z = 0 1 ρ w p z + g z = 0
where g x , g y , and g z are the gravitational accelerations in the x-, y-, and z-direction, respectively; ν w is the kinematic viscosity of water; and p is the pressure of the water film.
The boundary conditions of the momentum equation are as follows:
u z = 0 = 0 μ w u z z = H w = τ a x v z = 0 = 0 μ w v z z = H w = τ a y p z = H w = p a
where τ a x and τ a y are the air shear force in the x- and y-direction, respectively; μ w is the dynamic viscosity of water; and p a is the air pressure acting on the upper surface of the water film.
According to the momentum Equation (2) and its boundary conditions (3), in addition to the shear force, the gravity and the pressure gradient force acting on the water film are considered in the three-dimensional flow model of water film proposed in the paper.
Energy equation:
2 T w z 2 = 0
where T w is the temperature of water film.
The boundary conditions of the energy equation are as follows:
λ w T w z z = H w = Q ˙ c o n v + Q ˙ i m p + Q ˙ e v a p λ w T w z z = 0 = Q ˙ a n t i
where λ w is the thermal conductivity of water. Solving the energy equation to obtain the water film temperature, T w , is necessary for determining the evaporation term, m ˙ e v a p , in the continuity equation.

2.2.2. Discretization of Equations

Integrating the energy Equation (4), combined with the boundary conditions (5), the water film temperature, T w , can be solved as follows:
T w = Q ˙ a n t i λ w H w z + Q ˙ a n t i + 0.5 m ˙ i m p u 2 + h T + m ˙ i m p c p w T Q ˙ e v a p λ w + m ˙ i m p c p w
where u is the incoming flow velocity, T is the incoming flow temperature, h is the convective heat transfer coefficient between the air and the water film, and c p w is the specific heat capacity of water.
Integrating the momentum Equation (2), combined with the boundary conditions (3), the velocity u and v of the water film can be solved. Then, taking the average value of u and v along the height of the water film yields the following:
u ¯ = τ a x H w 2 ρ w ν w 1 ρ w p x g x H w 2 3 ν w v ¯ = τ a y H w 2 ρ w ν w 1 ρ w p y g y H w 2 3 ν w
where u ¯ is the average velocity in the x direction of the water film along its height, and v ¯ is the average velocity in the y direction of the water film along its height.
Substituting the average velocity u ¯ and v ¯ of the water film into the continuity Equation (1) and discretizing the equation yields the following:
H w H w o l d Δ t + u ¯ H w E u ¯ H w W Δ x + v ¯ H w N v ¯ H w S Δ y = m ˙ i m p m ˙ e v a p ρ w
where Δ t is the time step size; H w o l d is the water film height solved in the last time step; Δ x is the length of control volume in the x direction; Δ y is the length of control volume in the y direction; and the subscripts E, W, N and S represent the east, the west, the north and the south boundary faces of the control volume, respectively.
The discretized continuity Equation (8) is numerically solved based on staggered grid and through the QUICK format with delayed correction [19].

2.2.3. Model Solving

The solution of continuous water film flow is a non-steady process. Referring to the calculation method in Ref. [19], the total period of the water film flow is divided into several time steps. In each time step, it is assumed that the water film flow is steady. In this paper, the step size of each time step is Δ t = 0.05 s . The model solving process is shown in Figure 4:
(1) Read and input the results of the two-phase flow field near the wall to solve the impingement characteristics of the water droplets on the wall.
(2) Solve the energy equations, Equations (4) and (5), of the water film by integration, and the water film temperature, T w , is obtained.
(3) Assign the initial water film height, H w , i n i t i a l = 0 .
(4) The momentum equations, Equations (2) and (3), of the water film are solved by integration, and the water film velocities, u and v, expressed using the water film height, are obtained.
(5) The continuity equation of the water film, Equation (1), is solved numerically to obtain a new water film height, H w , n e w .
(6) Judge whether the solution for the water film height converges. If not, repeat steps (4) and (5) until it converges.
(7) Update the water film velocity of the current time step using the converged water film height.
(8) Judge whether the total period of the water film flow has finished. If not, repeat steps (4)–(7) until the total period finishes.

2.3. Continuous Water Film Breakup and Rivulet Formation

2.3.1. Mathematical Model

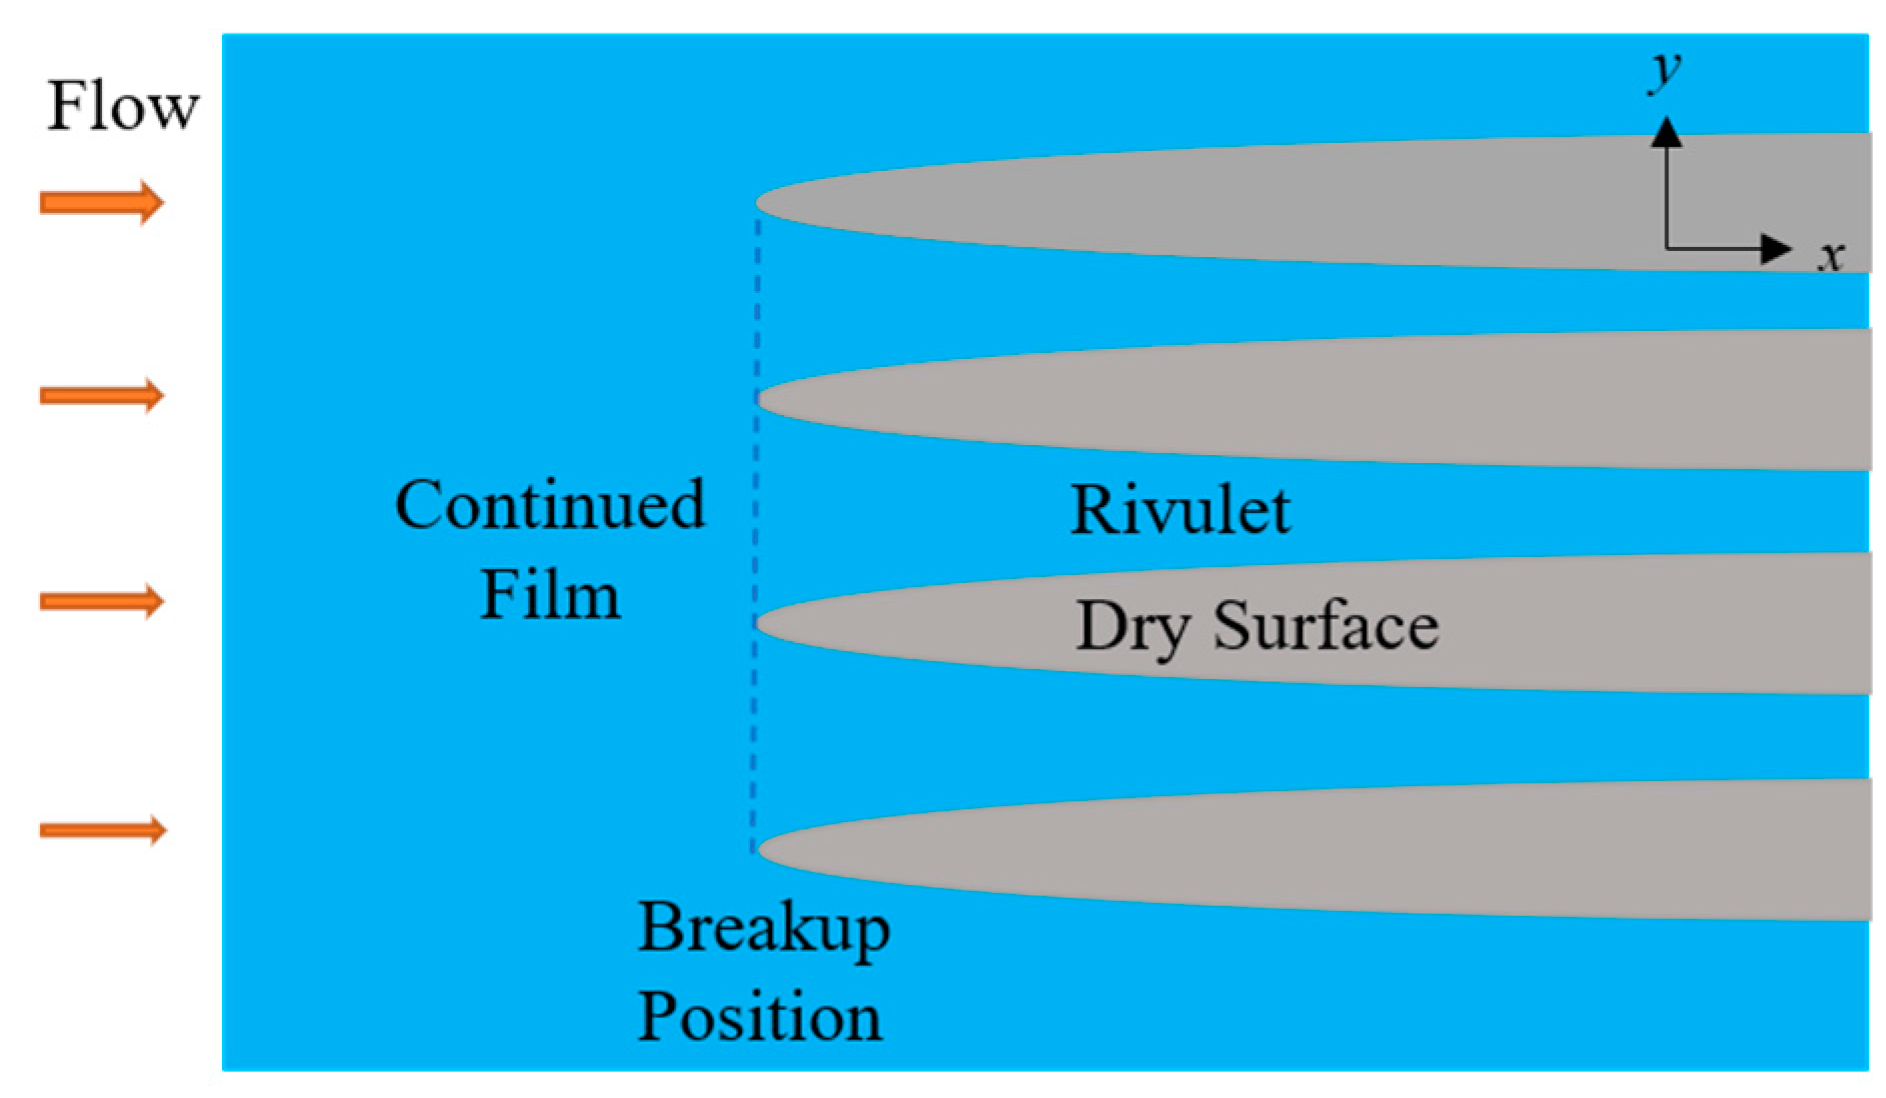
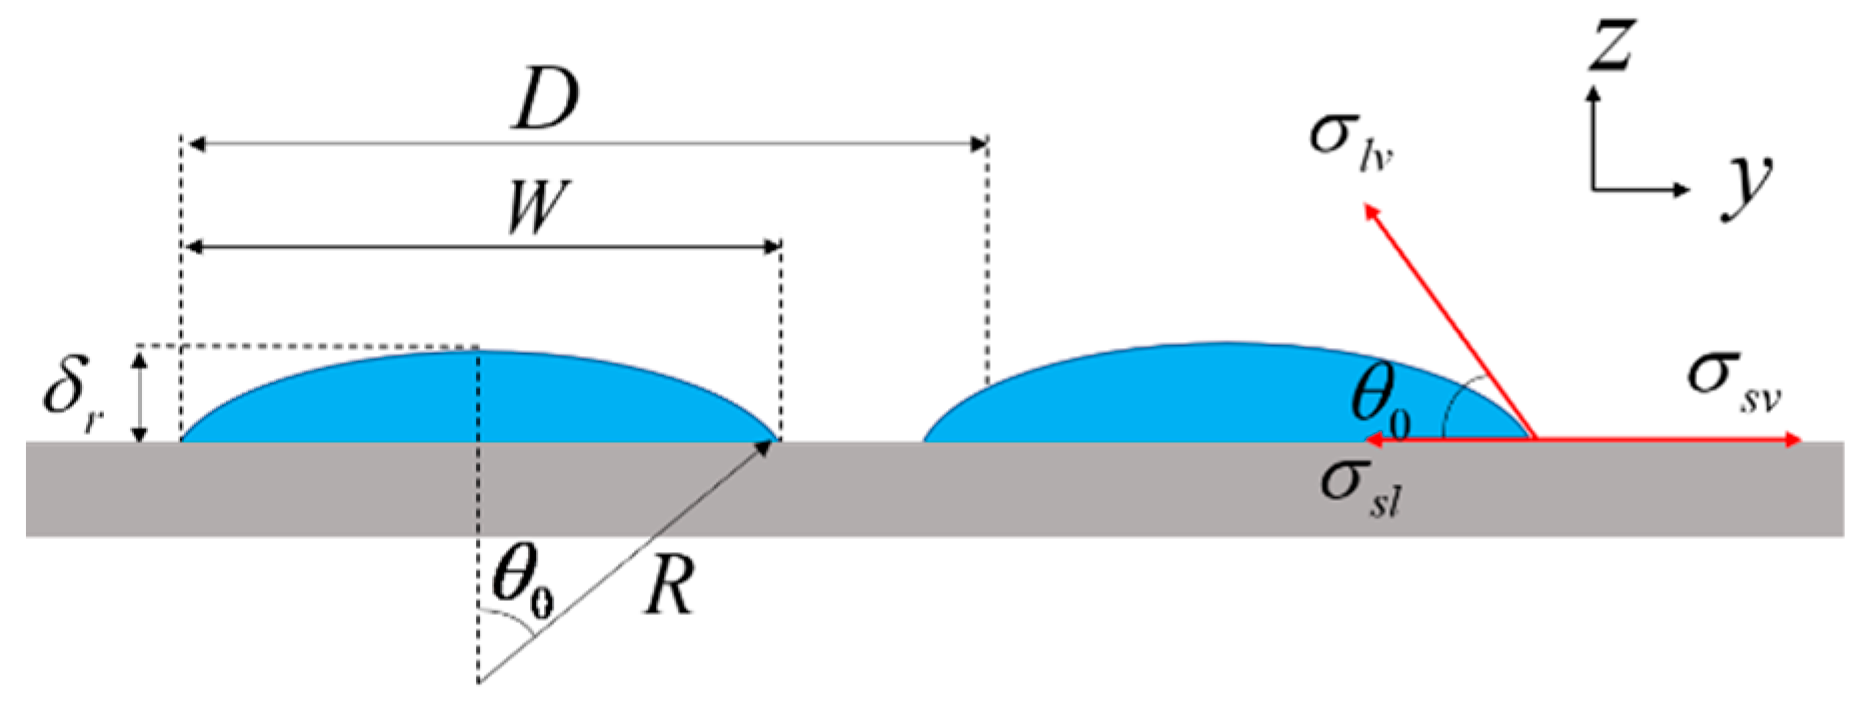
As mentioned earlier, when the continuous thin water film flows downstream, it breaks and forms several rivulets under the influence of many factors. For simplicity, this paper assumes that the continuous water film ruptures and forms rivulets at the same downstream position. As shown in Figure 5, the shape of one rivulet is exactly the same as another, and the rivulets are equally spaced along the spanwise direction, i.e., the y-z direction. The stream section is the circular part on the plane perpendicular to the flow direction, i.e., the y-z plane, as shown in Figure 6.
According to Figure 6, the outer profile of the rivulet can be expressed as follows:
z = R 2 y 2
where R is the radius of the outer profile of a rivulet. The height and width of a rivulet can be deduced according to the following geometric relationship:
δ r = R ( 1 cos θ 0 ) W = 2 R sin θ 0
where θ 0 is the solid–liquid contact angle between the solid wall and the rivulet liquid. This angle depends on the characteristics of the solid wall and the rivulet liquid surface, the temperature, humidity, and other factors. δ r and W are the height and width of each stream, respectively.
The force balance of the three-phase contact of air, rivulet, and wall can be expressed by the Laplace–Young equation [31]:
σ l v cos θ 0 + σ s l = σ s v
where σ s l , σ l v and σ s v are the surface tension coefficients of the solid–liquid interface, gas–liquid interface and gas–solid interface in the three–phase contact of air, rivulet and wall, respectively. Where the continuous water film breaks into a rivulet, the relationship between mass conservation and energy conservation is satisfied:
m f = m r
E f = E r
where m f and m r are the mass flow of the continuous water film and the rivulets, respectively; and E f and E r are the energy passing through water film and the stream per unit time, respectively.
Along the spanwise direction, the distance between each rivulet and its adjacent rivulets is D, as shown in Figure 6. By analyzing the unit spacing, D, we obtain the following:
m f = ρ w u ¯ D H w
m r = 2 0 R sin θ 0 R cos θ 0 R 2 y 2 ρ w u r d z d y
where u r is the flow velocity of the stream, which is obtained using Newton’s law of friction as follows:
u r = τ a μ w z
where τ a is the shear force of air. Substituting Equation (16) into Equation (15), we obtain the following:
m r = ρ w τ a R 3 μ w φ ( θ 0 )
where φ ( θ 0 ) is an auxiliary function:
φ ( θ 0 ) = sin θ 0 1 3 sin 3 θ 0 θ 0 cos θ 0
Substituting Equations (14) and (17) into Equation (12), the mass conservation equation is as follows:
u ¯ D H w τ a R 3 μ w φ ( θ 0 ) = 0
The energy passing through the water film and stream per unit time consists of kinetic energy and surface energy. Within the unit spacing, D, the calculation formula is as follows:
E f = D 1 2 ρ W u ¯ 2 H w + σ s l + σ l v
E r = 0 R s i n θ 0 0 R c o s θ 0 R 2 y 2 ρ w u r 2 d z d y + 2 [ R sin θ 0 σ s l + R θ 0 σ l v + D 2 R sin θ 0 σ s v ]
Substituting Equations (11) and (16) into Equation (21), we obtain the following:
E r = ρ w τ a 2 R 4 3 μ w 2 ϕ θ 0 + D σ s l + 2 R θ 0 + D cos θ 0 R sin 2 θ 0 σ l v
where ϕ ( θ 0 ) is an auxiliary function [15]:
ϕ ( θ 0 ) = 1 32 36 θ 0 28 sin 2 θ 0 sin 4 θ 0 + 24 θ 0 cos 2 θ 0
Substituting Equations (20) and (22) into Equation (13), the energy conservation equation is as follows:
D 1 2 ρ w u ¯ 2 H w + σ l v cos θ 0 σ l v ρ w τ a 2 R 4 3 μ w 2 ϕ θ 0 2 R θ 0 R sin 2 θ 0 σ l v = 0
The mathematical model of a continuous water film breaking into rivulets is composed of Equations (10), (19) and (24).

2.3.2. Model Solving

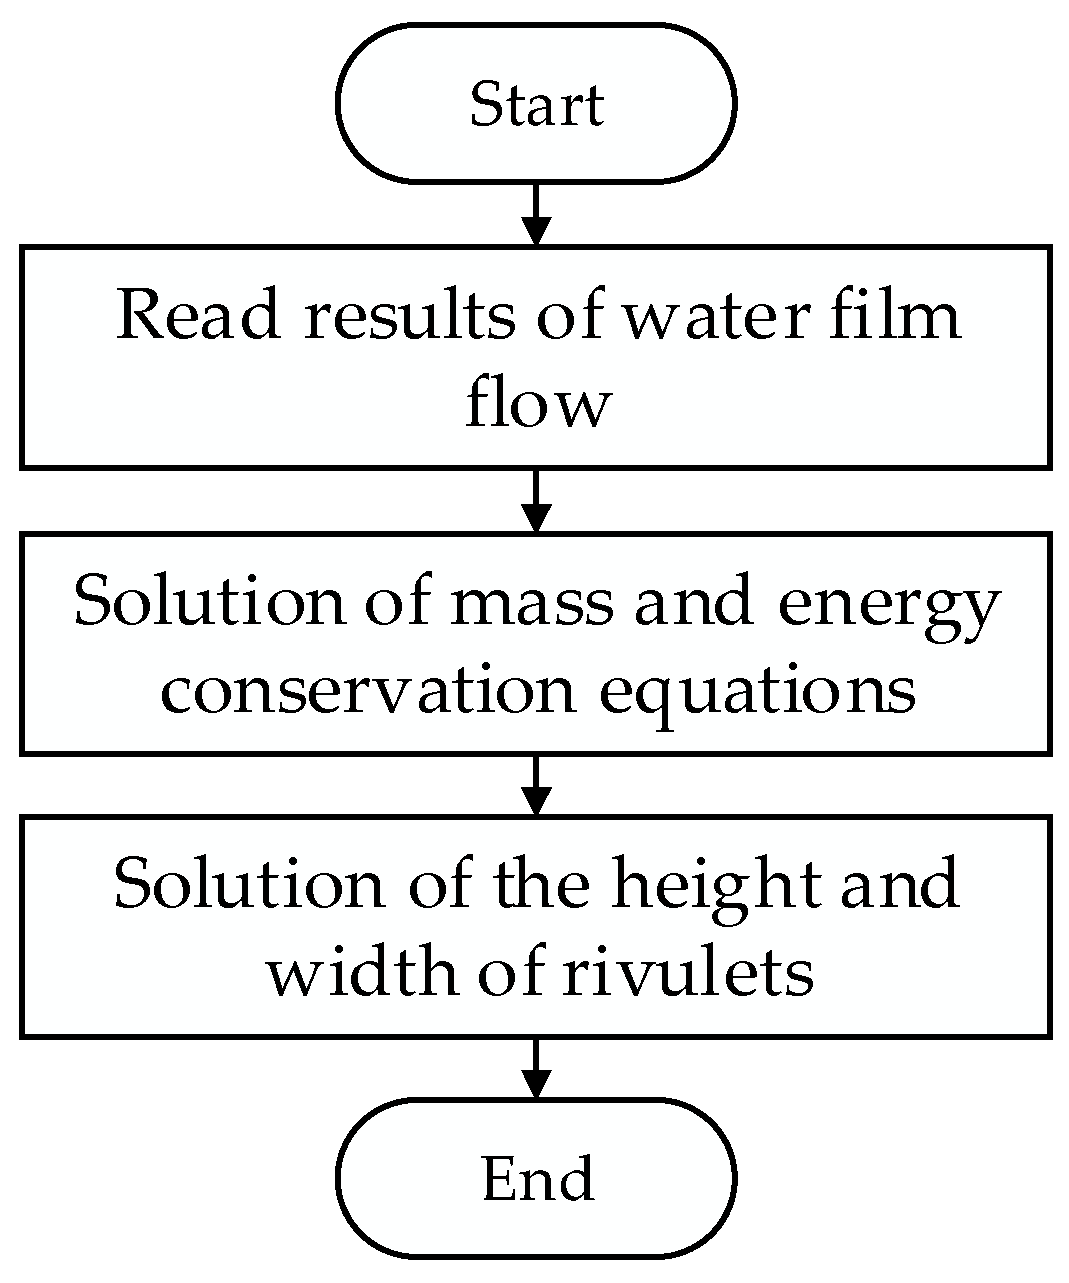
According to the mathematical model of stream morphology, the morphological parameters when the continuous water film breaks into rivulets can be obtained. The solution is shown in Figure 7:
(1) Read solution results of the continuous water film flow when the flow stabilizes, including the water film height, H w ; the average velocity of water film flow, u ¯ ; and the contact angle between solid wall and stream, θ 0 .
(2) Solve the mass and energy conservation equations, Equations (19) and (24), of a continuous water film and rivulets, and obtain the radius, R, and spacing, D, of the rivulets at the breakup position.
(3) From the radius and spacing of the rivulet, the geometric relations, Equation (10), of the rivulet contours are solved to obtain the height, δ r , and width, W , of a rivulet.

3. Example Analysis and Verification

3.1. Computational Model

In order to verify the mathematical model and calculation method of continuous water film flow and water film breaking into rivulets proposed in this paper, an NACA0012 airfoil was used as a study object. The three working conditions of the water film flow test used in Ref. [5] were numerically calculated. For the three cases, the incoming flow velocity is different, while other parameters, such as the incoming flow temperature, the Liquid Water Content (LWC) and the Mean Volume Diameter (MVD) of water droplets, are all the same. The parameters of the working conditions are shown in Table 1. Since the water film flow test in Ref. [5] was conducted at room temperature (T = 293 K), it is not required to solve the energy Equation (4), and the water film temperature is directly set as the incoming flow temperature, 293 K, in this paper.
The calculation domain of two-phase flow is established, as shown in Figure 8. The chord length of the airfoil is c = 101 mm, and the spanwise height is L = c. The fluid calculation domain surrounding the airfoil comprises an upstream half cylinder and a downstream cuboid; the radius of the half cylinder is 3c, and the dimensions of the cuboid are 4c (in the flow direction) and 6c, respectively. The inlet surface of the calculation domain is set as the velocity inlet boundary, the outlet surface is set as the pressure outlet boundary, the top and bottom surfaces are set as symmetrical boundaries, and the outer surface of the airfoil is set as a non-slip wall surface.
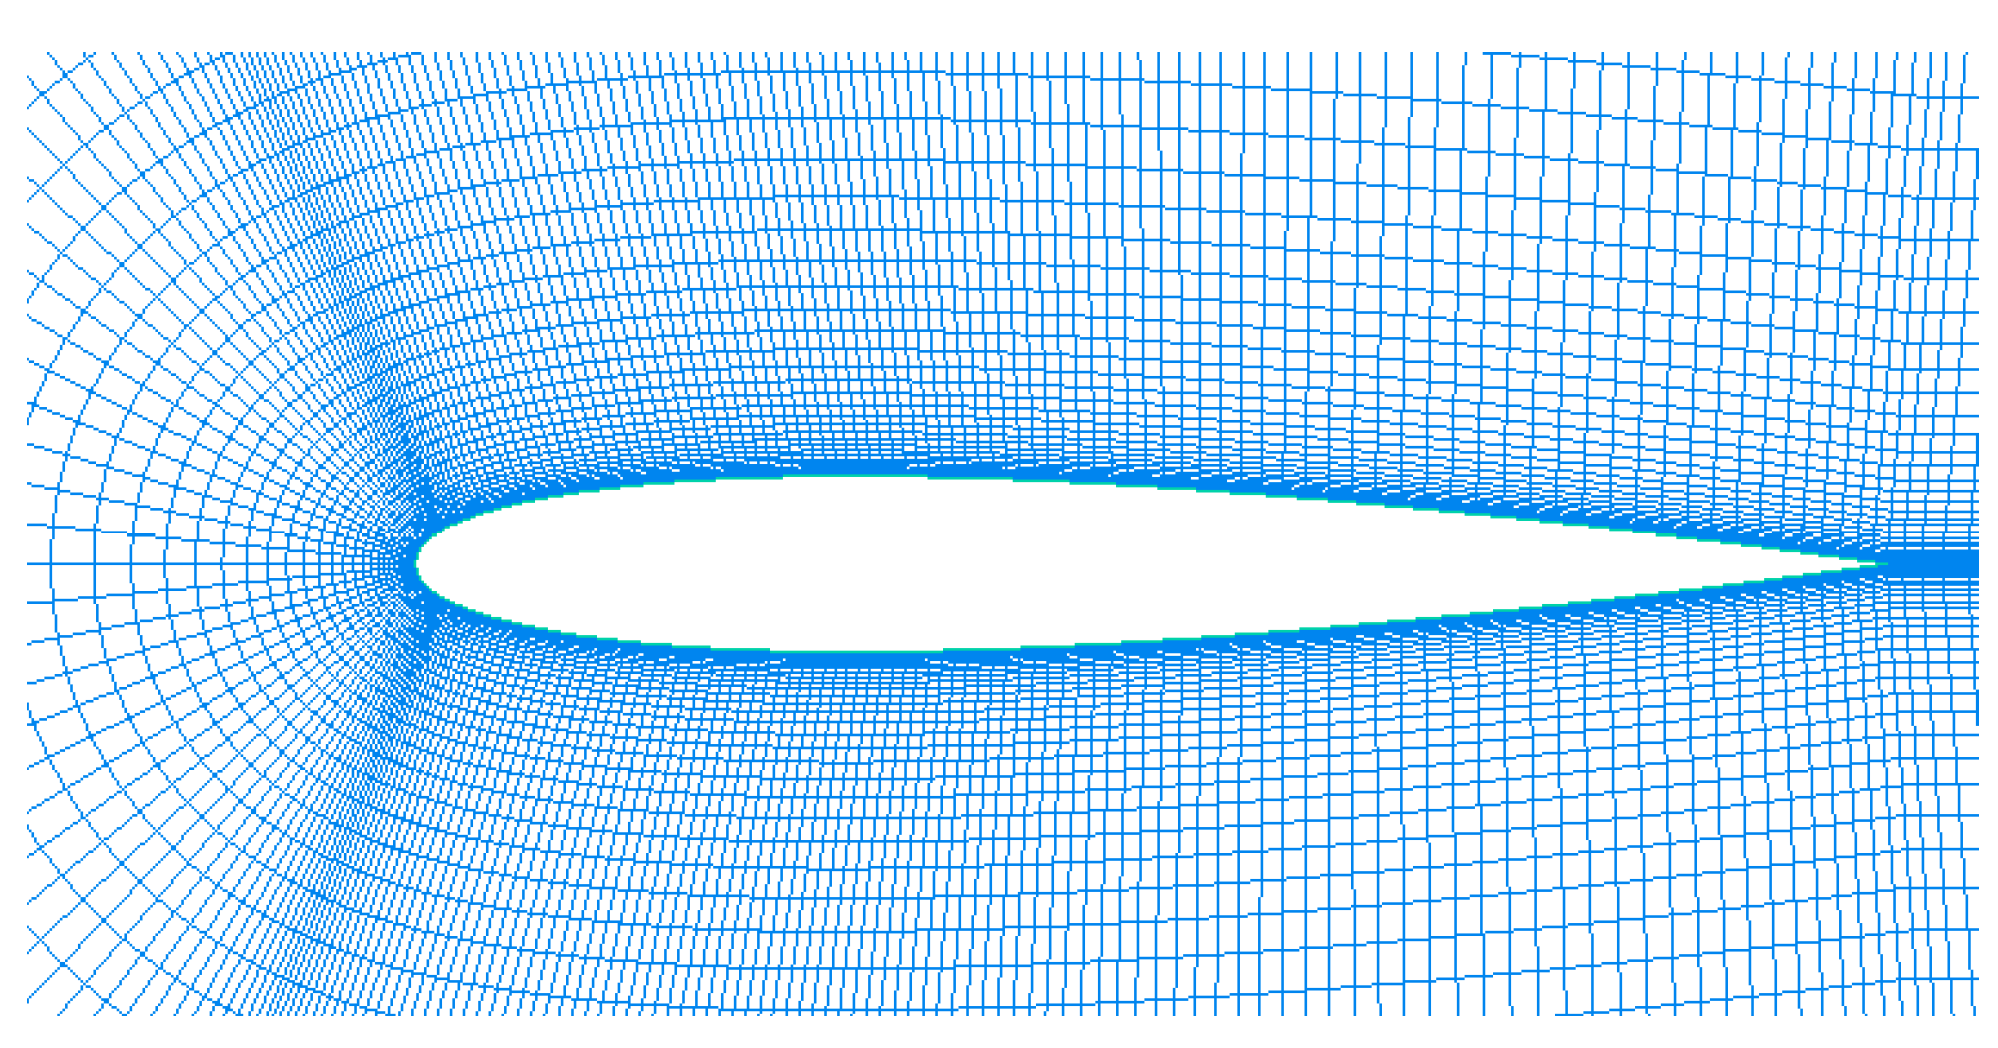
The local grid near the airfoil is shown in Figure 9, and the grid near the wall was refined. The height of the first layer of the grid near the wall of the airfoil is about 0.035 mm, and the corresponding value of y+ is about 5, which meets the requirements of the k–ω SST turbulence model used in the calculation of air-water droplet two-phase flow in this paper.
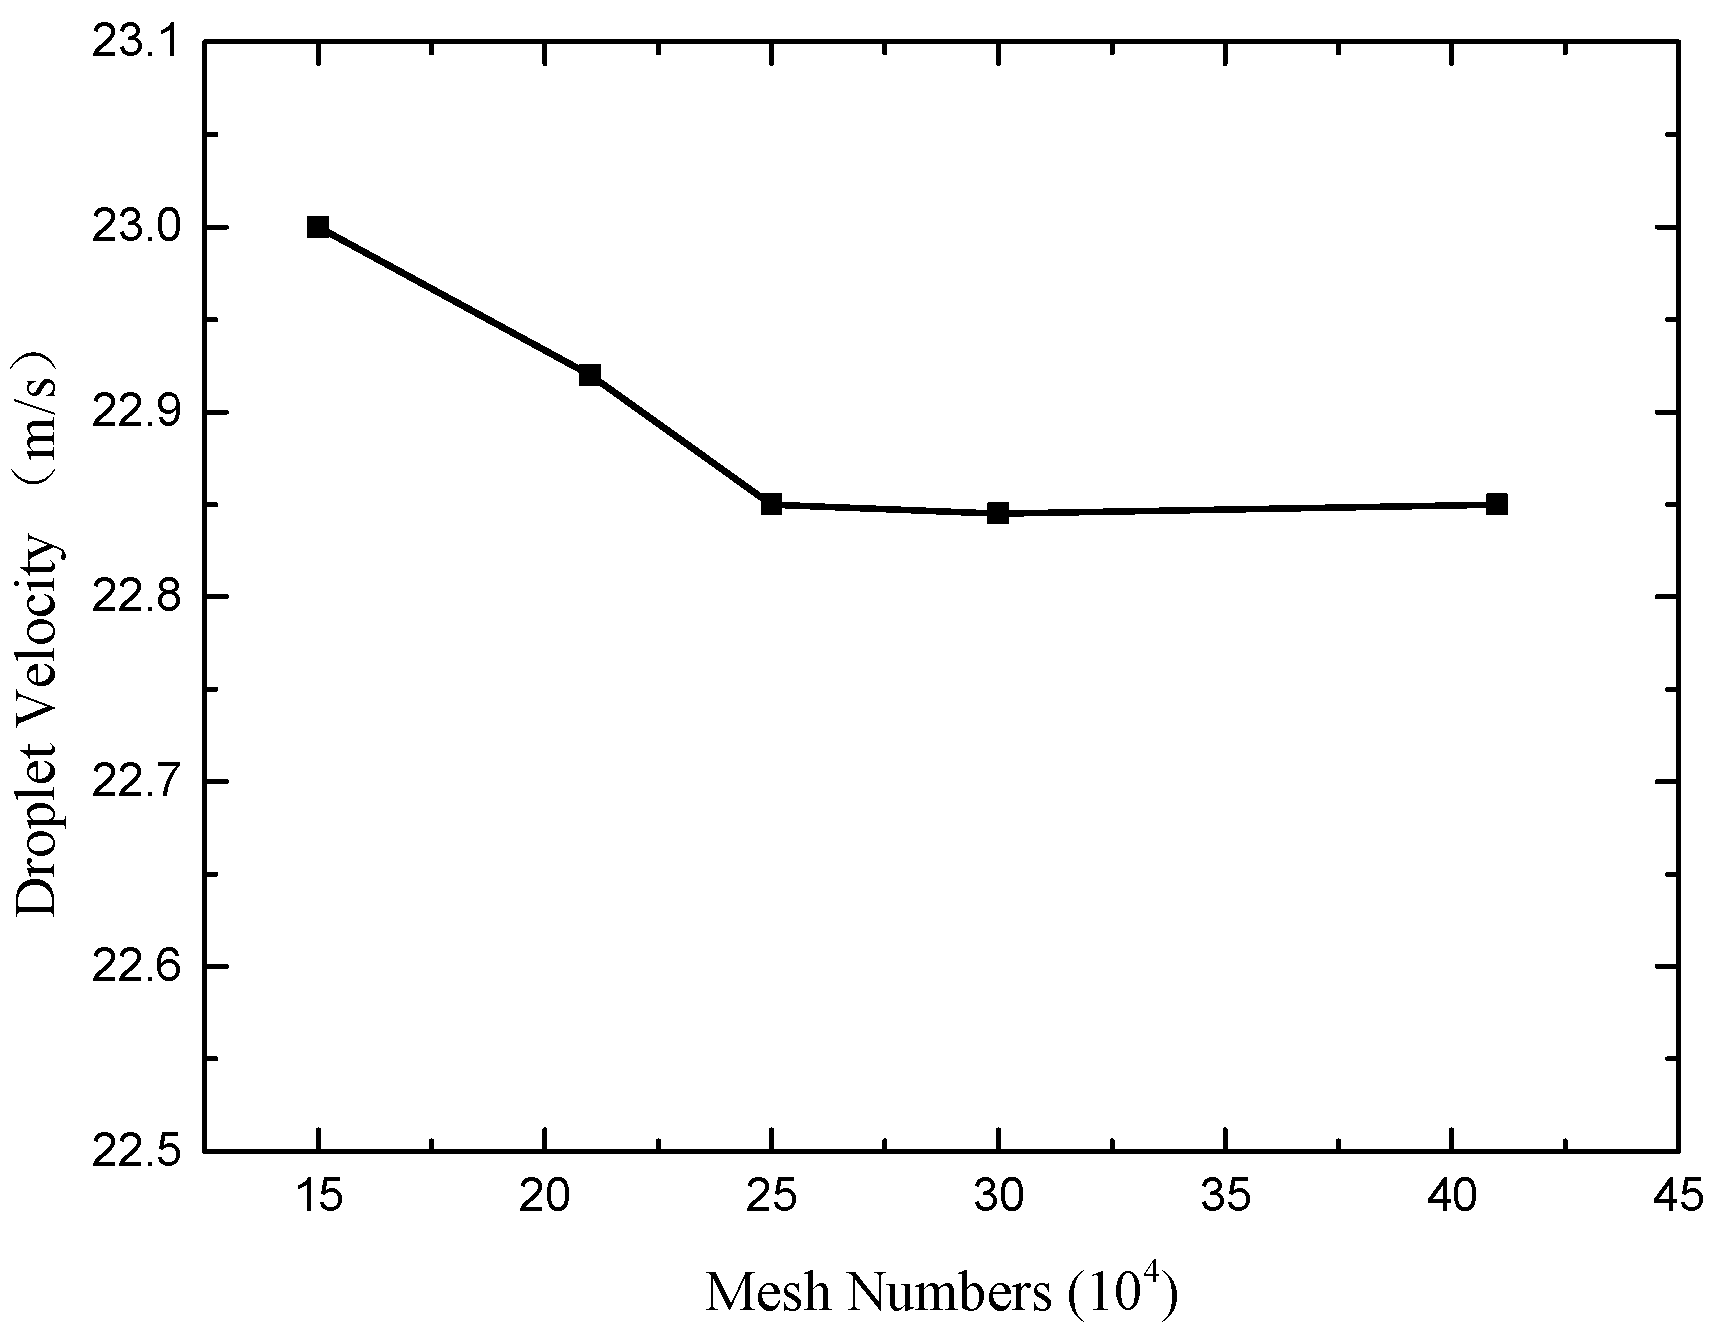
The variation in water droplet velocity at a monitoring point (as shown in Figure 9) near the leading edge of the airfoil with the number of the two-phase flow computational grid is shown in Figure 10. When the total number of grid elements is more than 250,000, the water droplet velocity is almost unchanged. So, the total number of grid elements is 250,000 in the simulation of the two-phase flow.
When the continuous water film breaks into rivulets, the solid–liquid contact angle, θ 0 , between the solid wall of the airfoil and a rivulet is very important in obtaining a solution for the rivulet morphological parameters. This contact angle is mainly determined by the surface characteristics of the solid wall and water. However, Ref. [5] does not give the material properties of the airfoil or the contact angle. In this paper, through a method of trial calculation, the morphological parameters of rivulets were simulated with contact angles of 2°, 3°, 4°, 5° and 7°. In the computational analysis of this paper, the position where the continuous water film ruptures and transforms into rivulets is directly determined based on the experimental observations published in Ref. [5]. That is, the rupture position of the water film in Case 1, Case 2 and Case 3 is x/c = 0.30, x/c = 0.24 and x/c = 0.22, respectively.

3.2. Calculation Results and Analysis

3.2.1. Impingement Characteristics

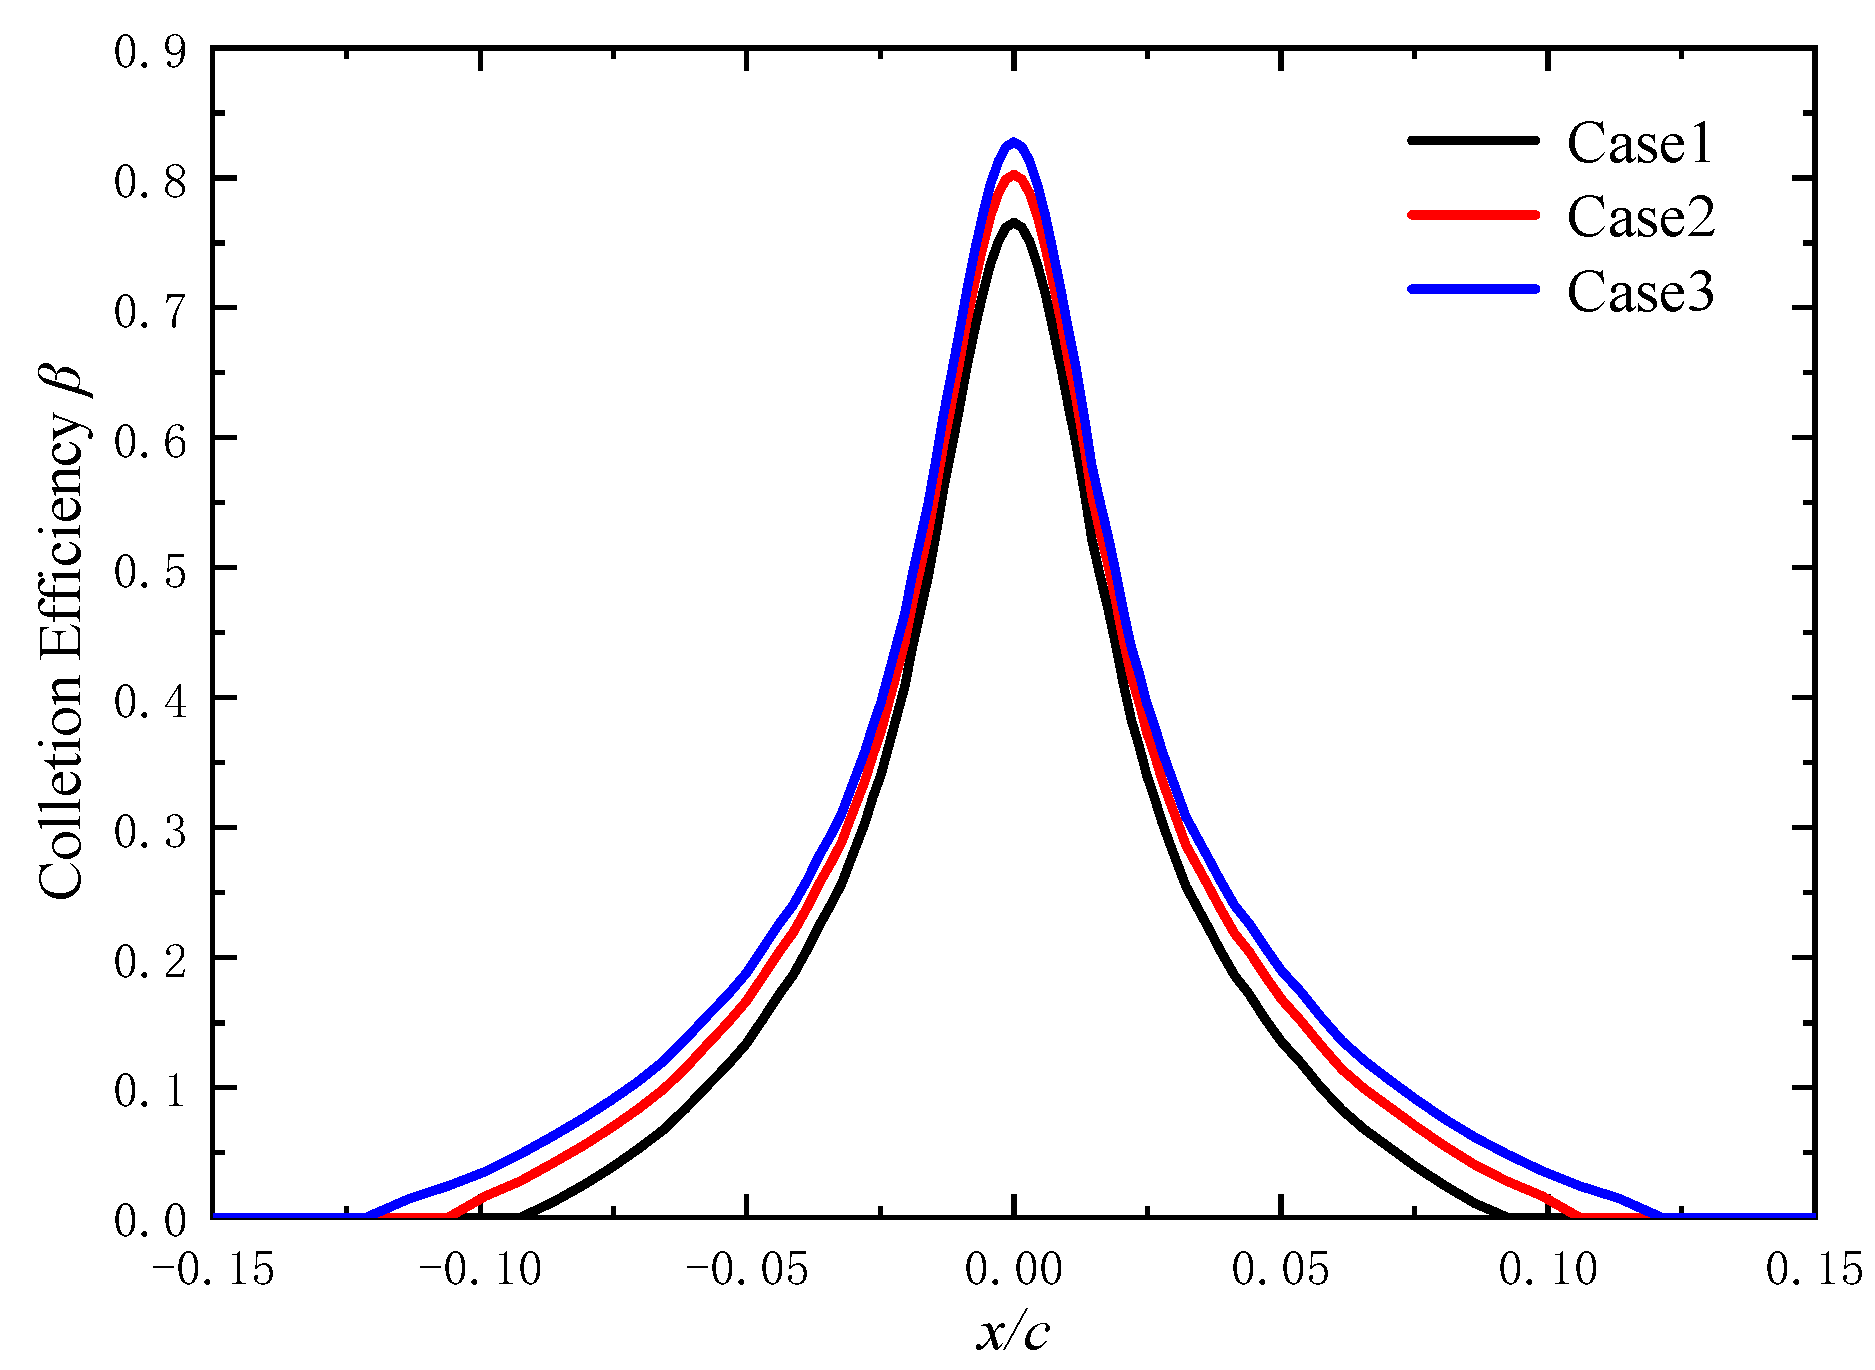
The distribution of the local water collection coefficients on the airfoil surface for three cases is shown in Figure 11. The water collection coefficient at the stagnation point (x/c = 0) is the largest and decreases sharply at first; it then gradually moves to zero, downstream. The greater the incoming velocity, the greater the peak value of the water collection coefficient at the stagnation point, the greater the water collection coefficient downstream of the stagnation point area, and the larger the impact range of the water droplets. This is because the larger the incoming flow velocity, the greater the number of water droplets that hit the leading-edge surface of the airfoil along the flow direction, and the greater the impingement velocity of the water droplets on the surface. Therefore, the water collection coefficient and the impact range of water droplets are both larger.

3.2.2. Transient Characteristics of Continuous Water Film Flow

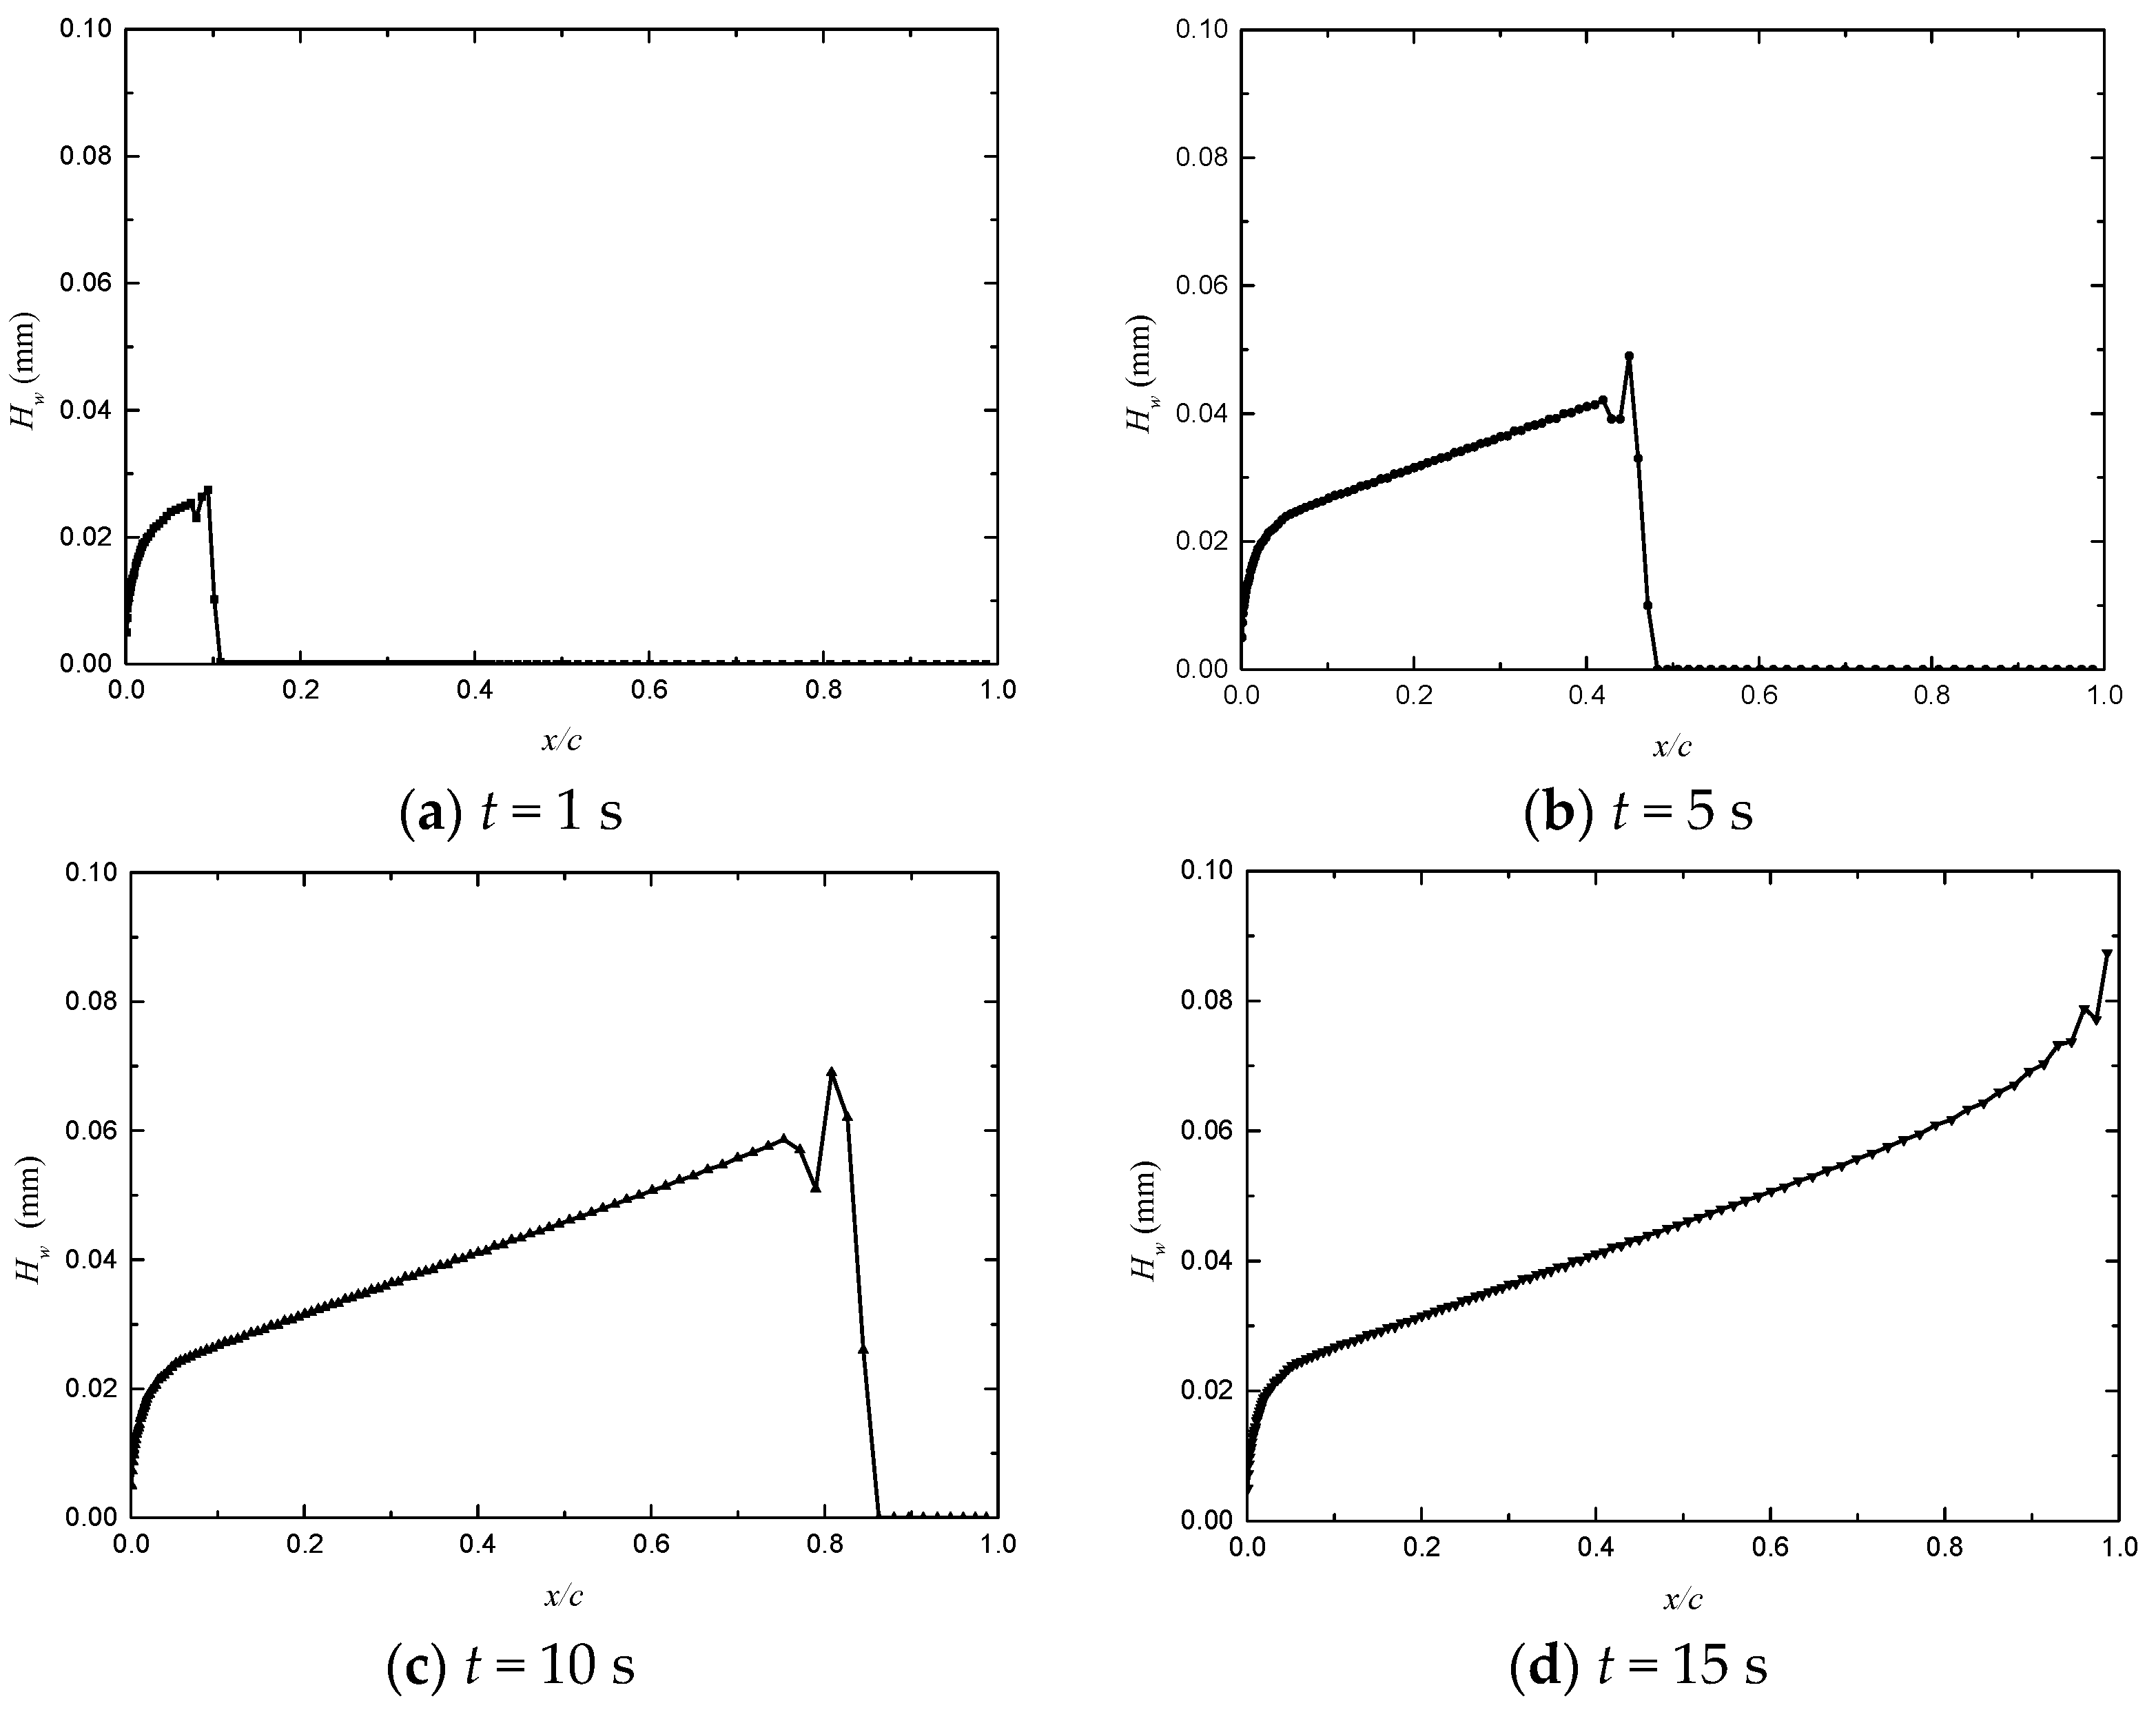
Figure 12 shows the distribution of water film height on the airfoil surface at different times for Case 1. The film height on the airfoil surface is in the order of 10−2 mm. As time goes on, the coverage range of the continuous water film on the airfoil surface gradually expands downstream. When t = 1 s, the water film only covers the range of x/c < 0.1 on the airfoil surface, and the water film height suddenly drops to zero at about x/c = 0.1, where is the front of the water film flow. Upstream of the water film front is the wetting area of a covering water film, and downstream is the dry area of an anhydrous film. When t = 5 s, the water film front moves to about x/c = 0.5. When t = 15 s, the continuous water film has completely covered the airfoil surface; that is, the airfoil surface is completely wet. From t = 15 s, the water film flow on the airfoil surface is basically stable and does not change with time.
From Figure 12, it can also be observed that, at each moment, along the flow direction from the stagnation point, the water film height first increases sharply in the range of x/c < 0.1 and then increases slowly. This is because the water film starts to form at the stagnation point, and the range of x/c < 0.1 also corresponds to the water droplet impact area at the leading edge of the airfoil (see Figure 11). In the impingement area of the leading edge, water droplets are continuously collected by the surface to form a water film; therefore, the water film height increases rapidly. Downstream, no impinging water droplets are added to the water film, so the water film height increases gradually.
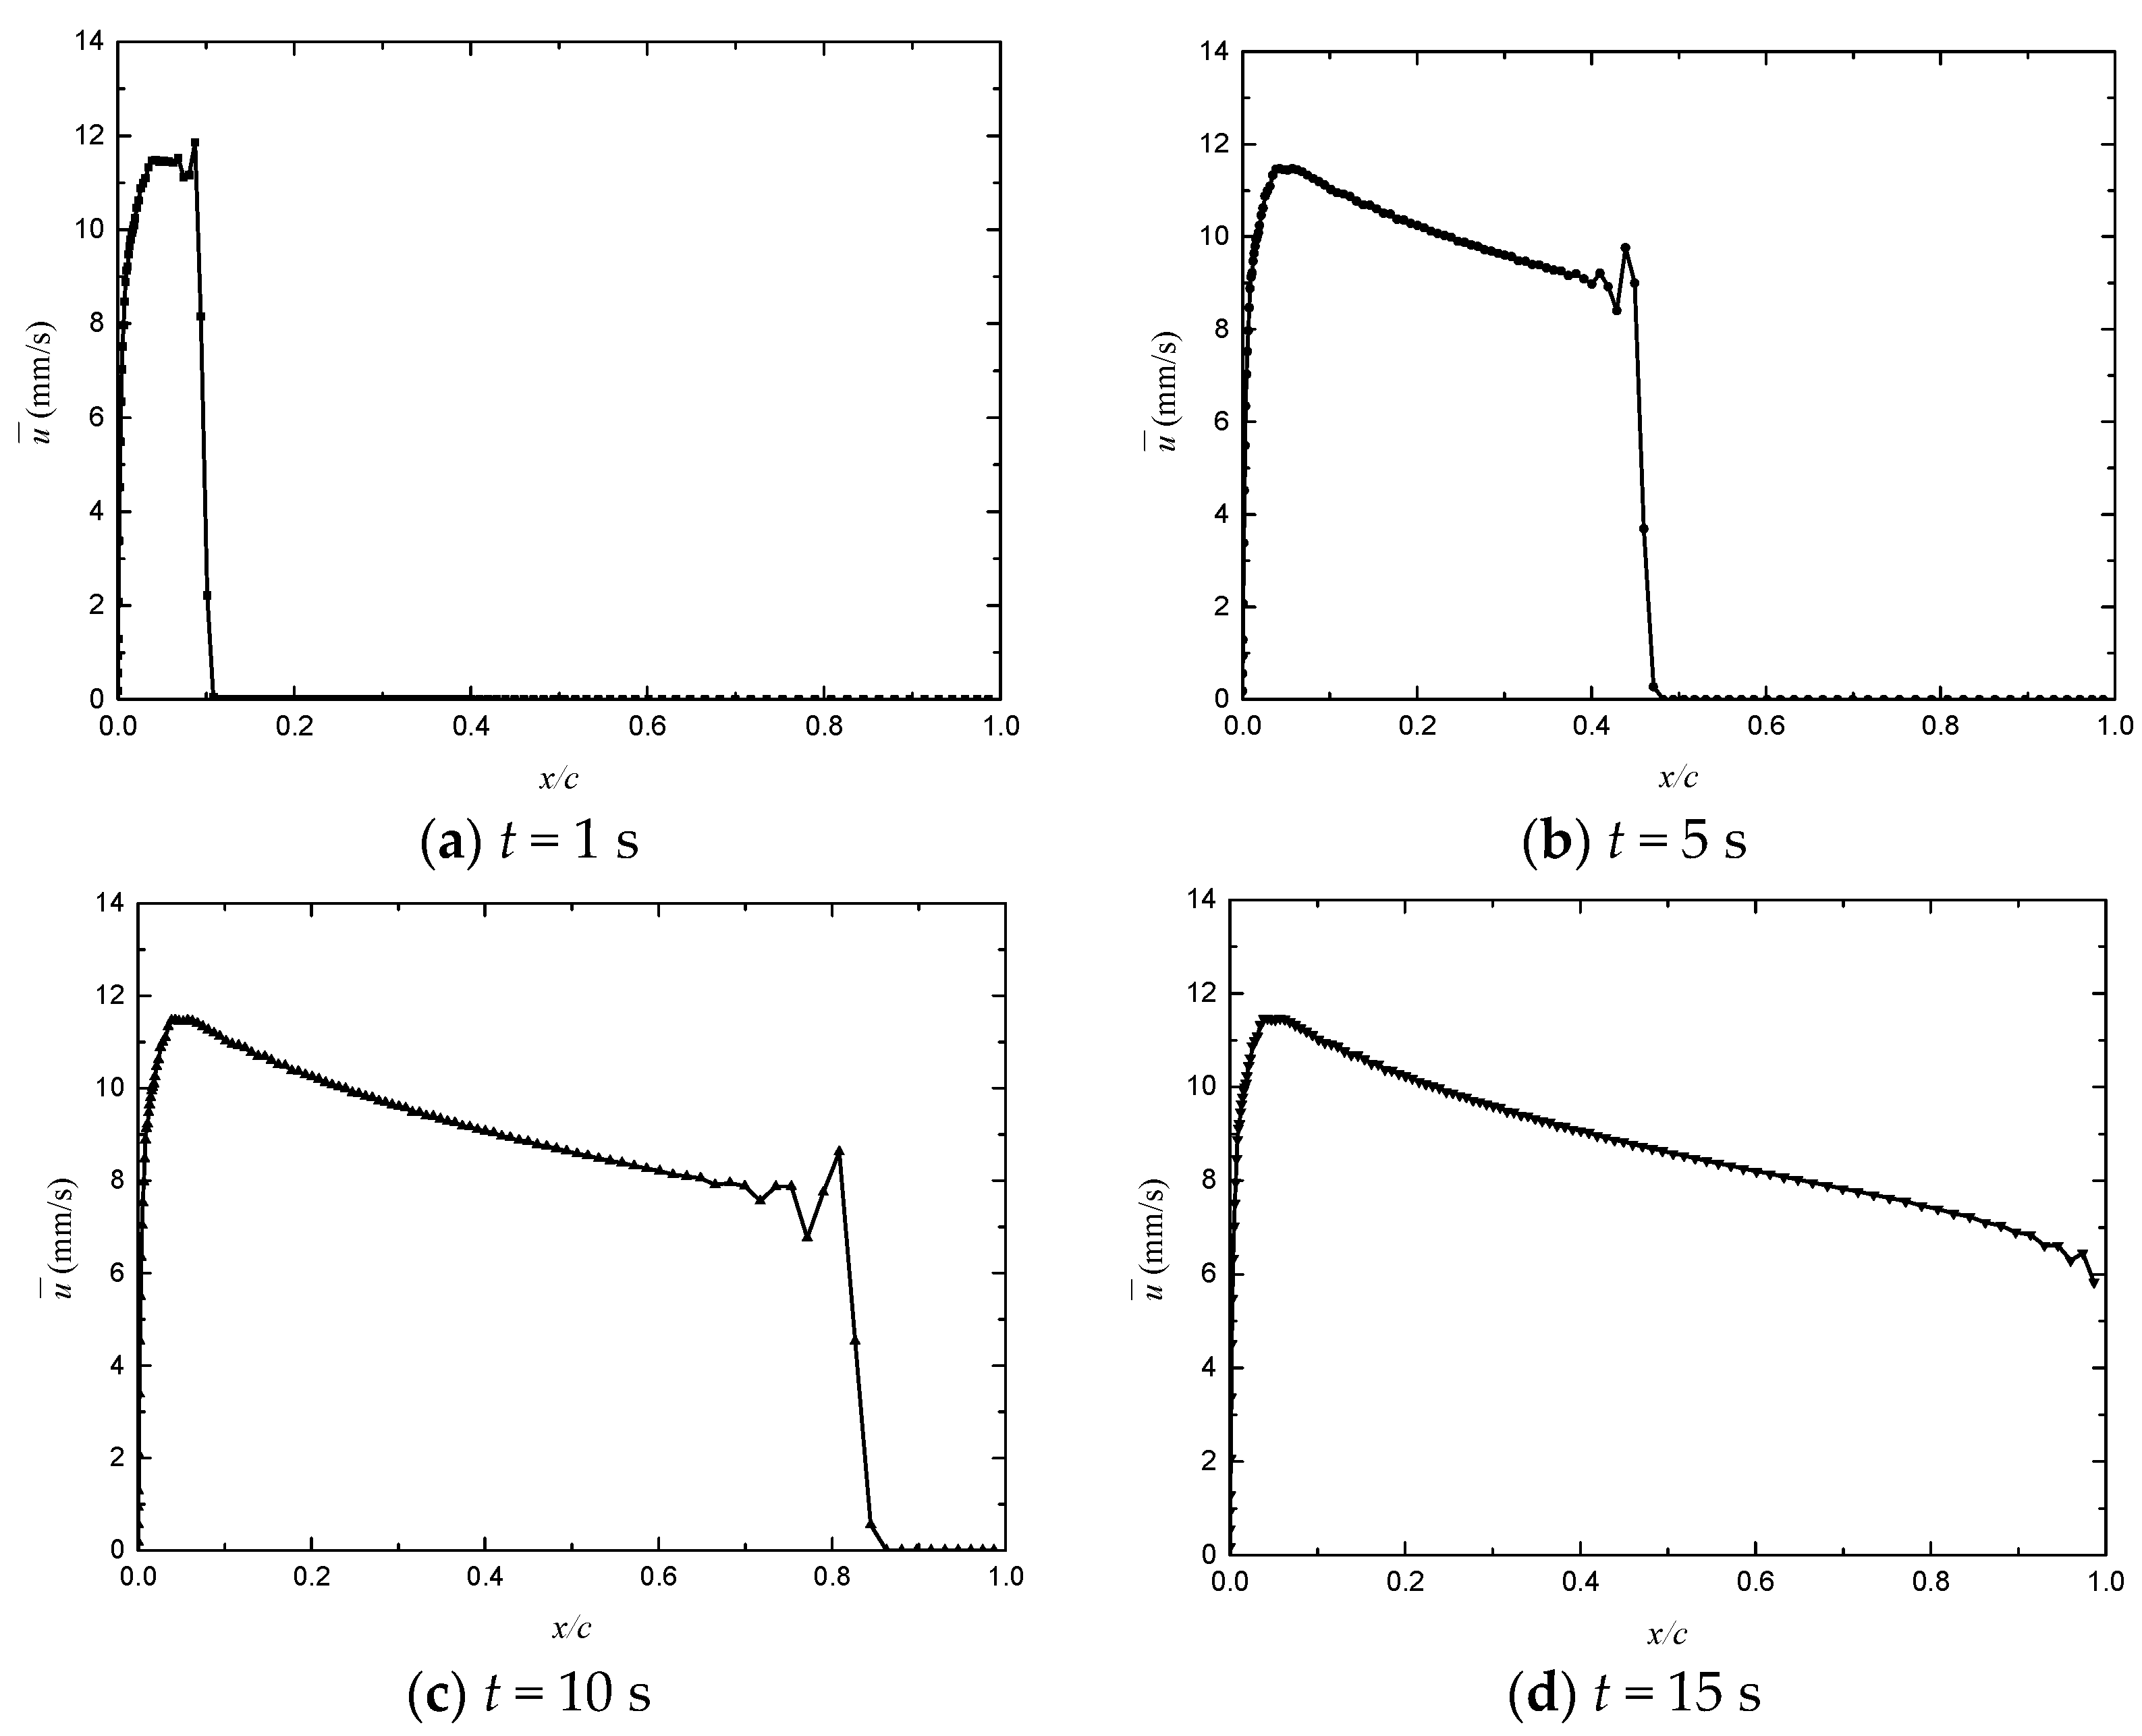
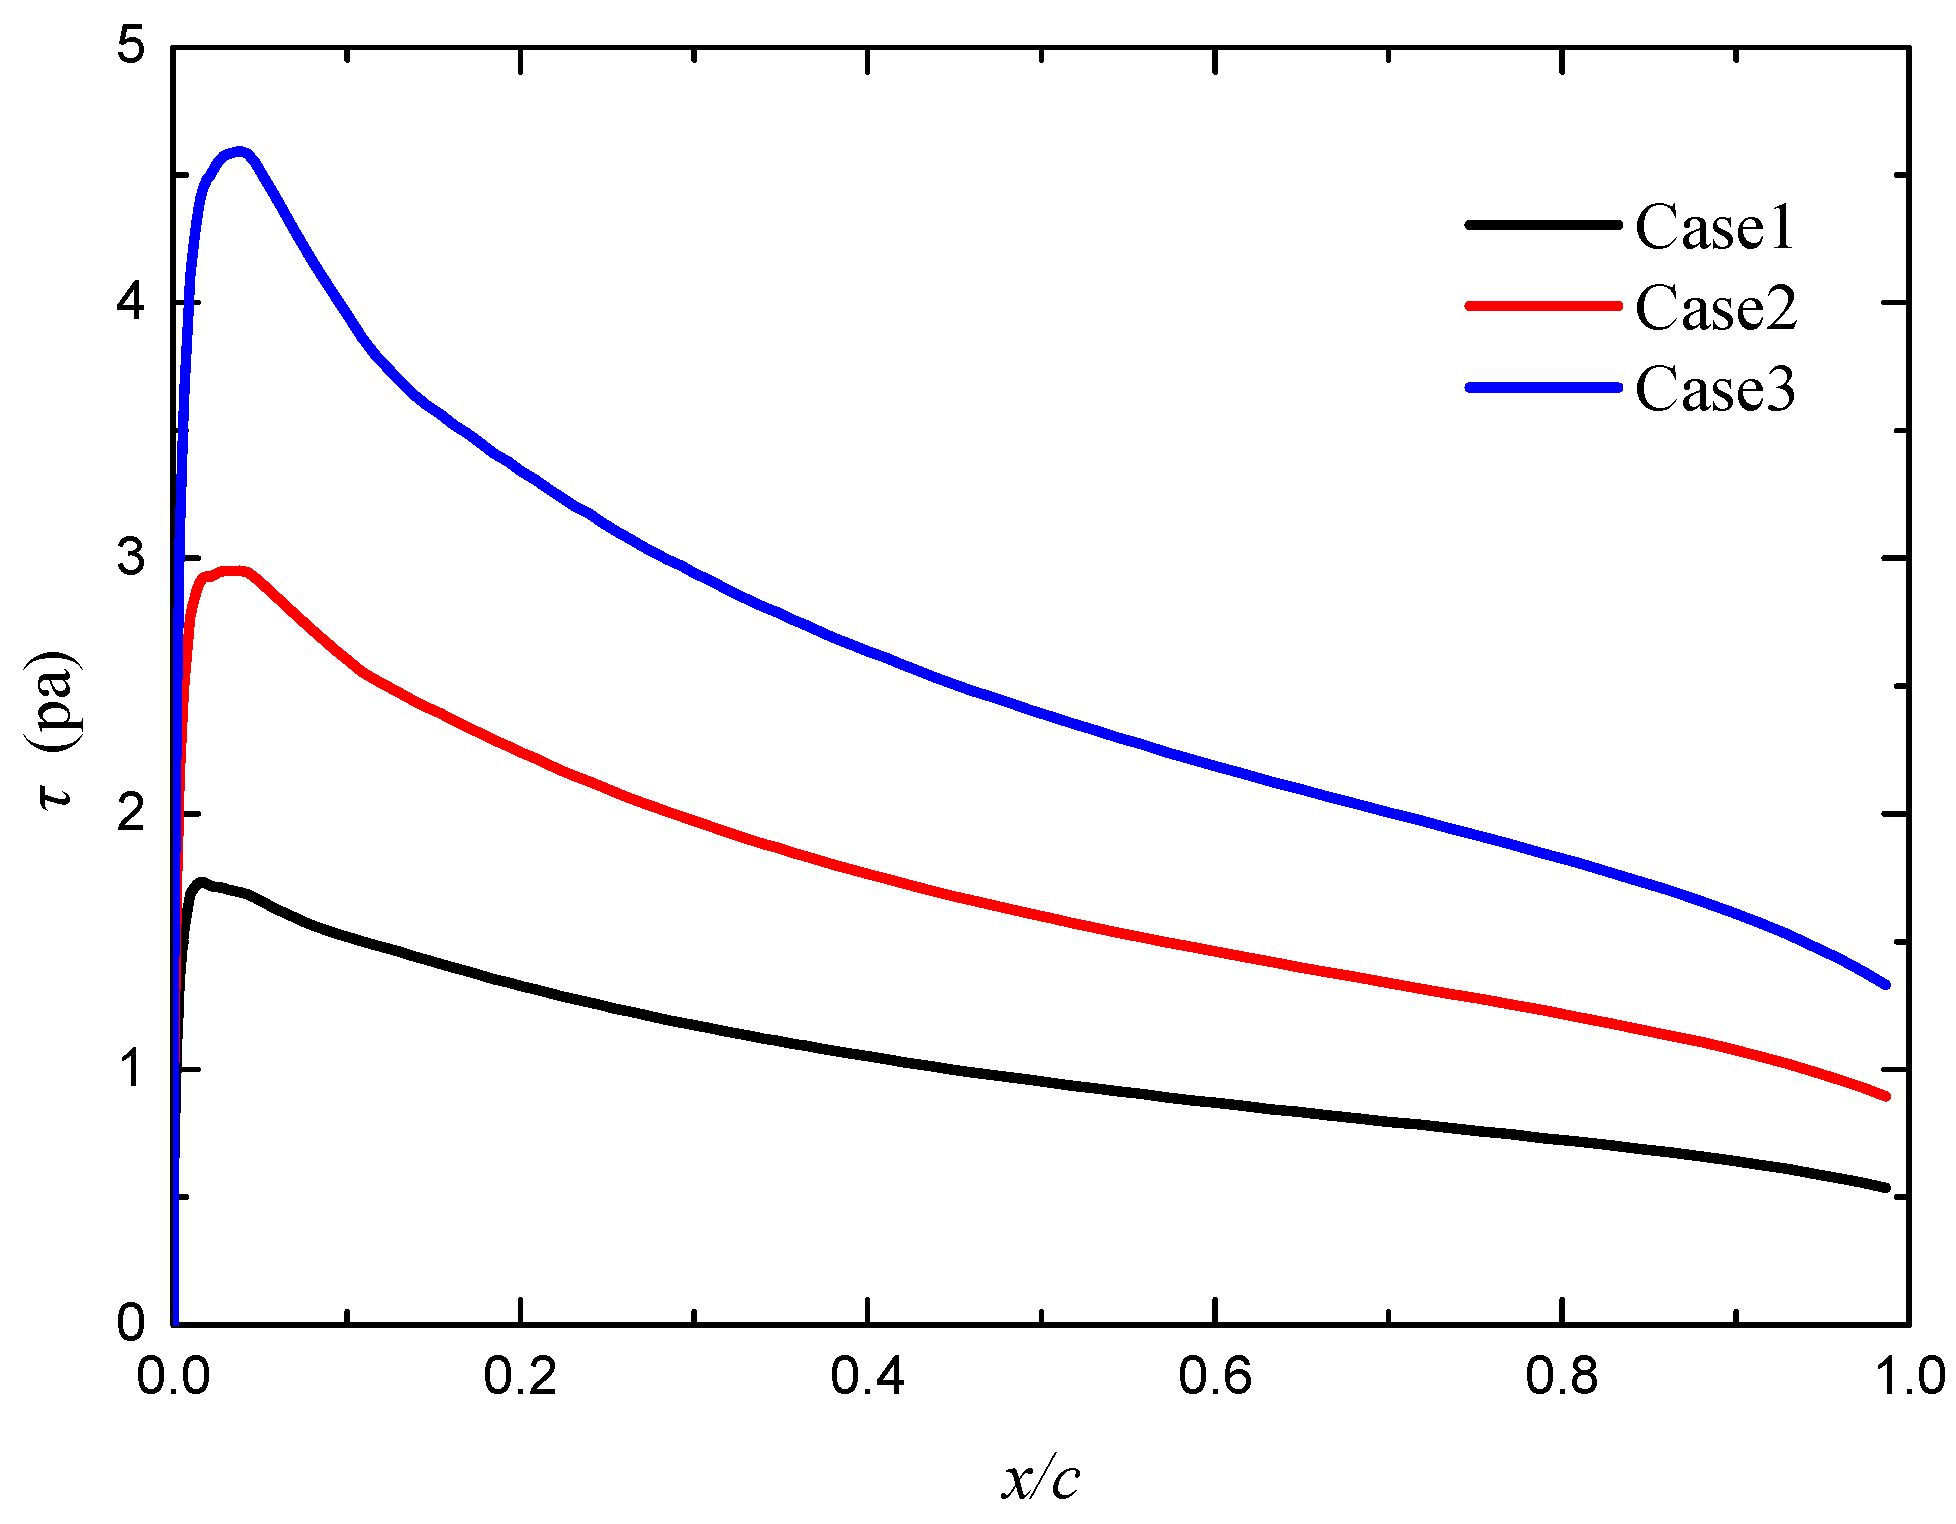
Figure 13 illustrates the water film velocity distribution on the airfoil surface at different times for Case 1. It is observed that the maximum flow velocity of the water film does not exceed 12 mm/s. Furthermore, as depicted in Figure 12 and Figure 14, at the front of the water film, the velocity abruptly drops to 0. The water film flow velocity first increases rapidly near the stagnation point to its maximum value and then decreases gradually downstream, fluctuating slightly at the front of the water film. Because the flow of a water film on an anti-icing surface is mainly driven by air flow shear force, the flow speed of the water film is mainly determined by shear force. The distribution of the air shear force on the airfoil surface is shown in Figure 14. The shear force first increases rapidly and then decreases gradually along the flow direction. The greater the shear force of the air flow acting on the water film, the greater the flow velocity of the water film.
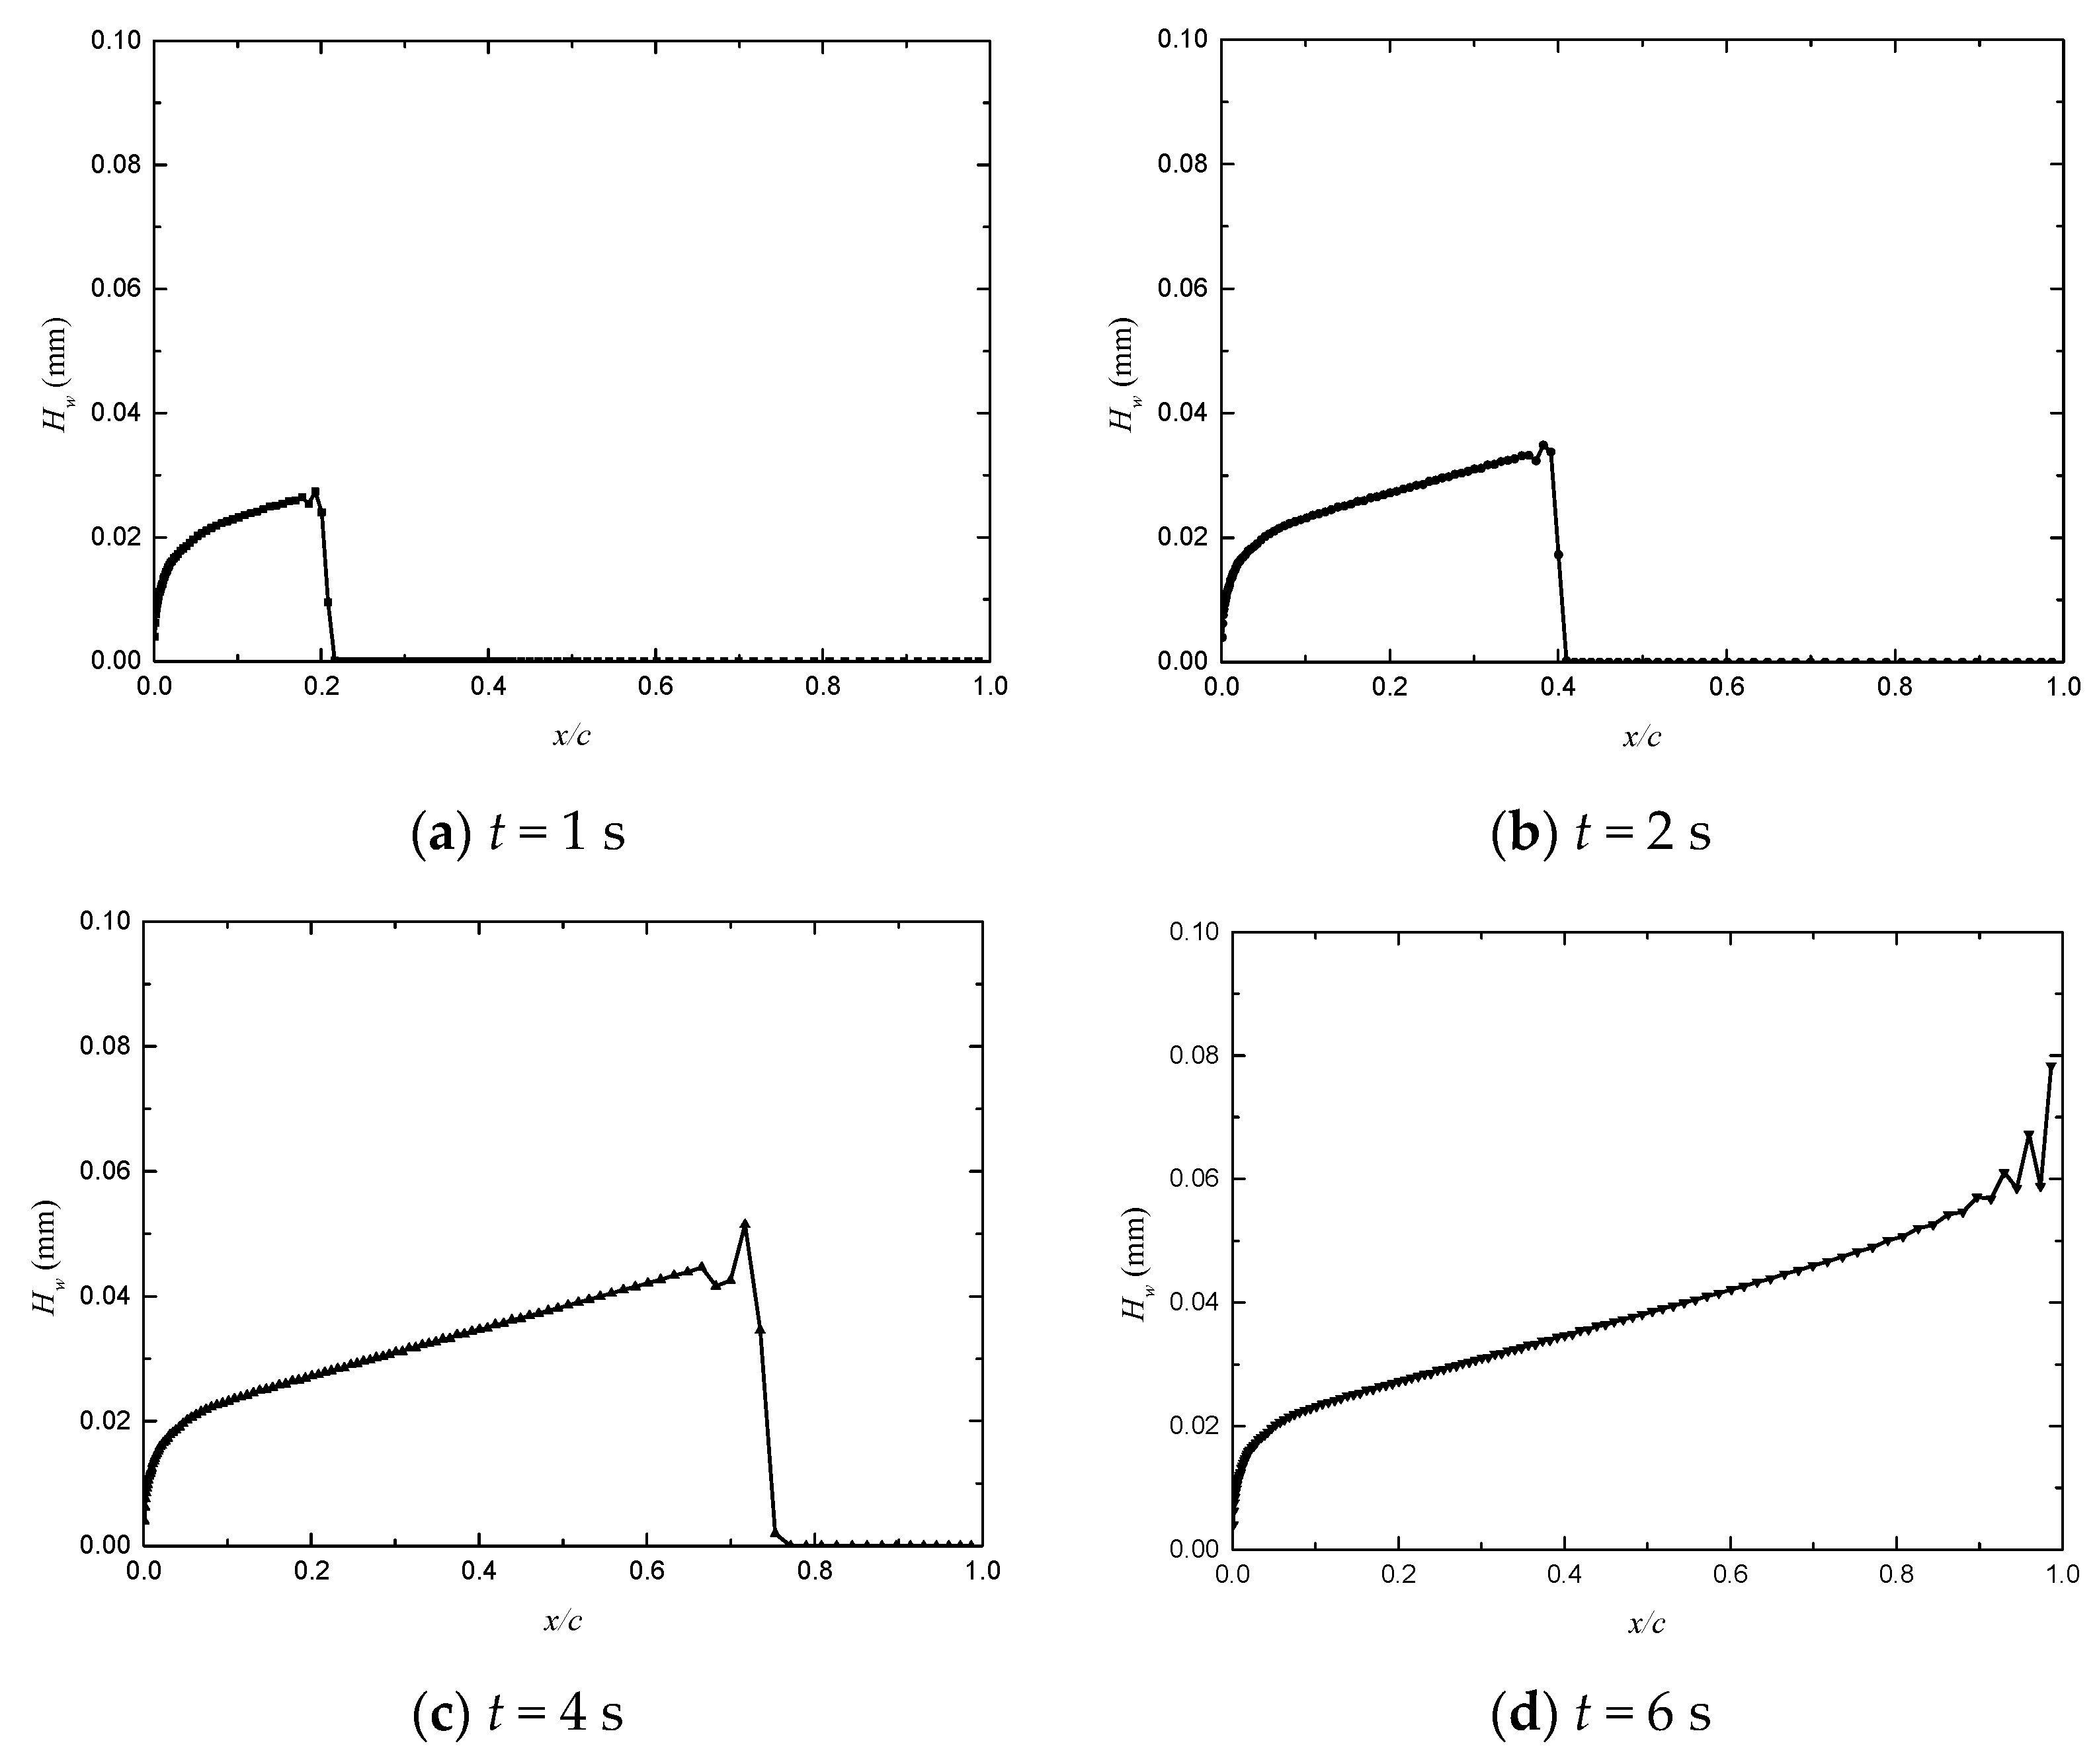
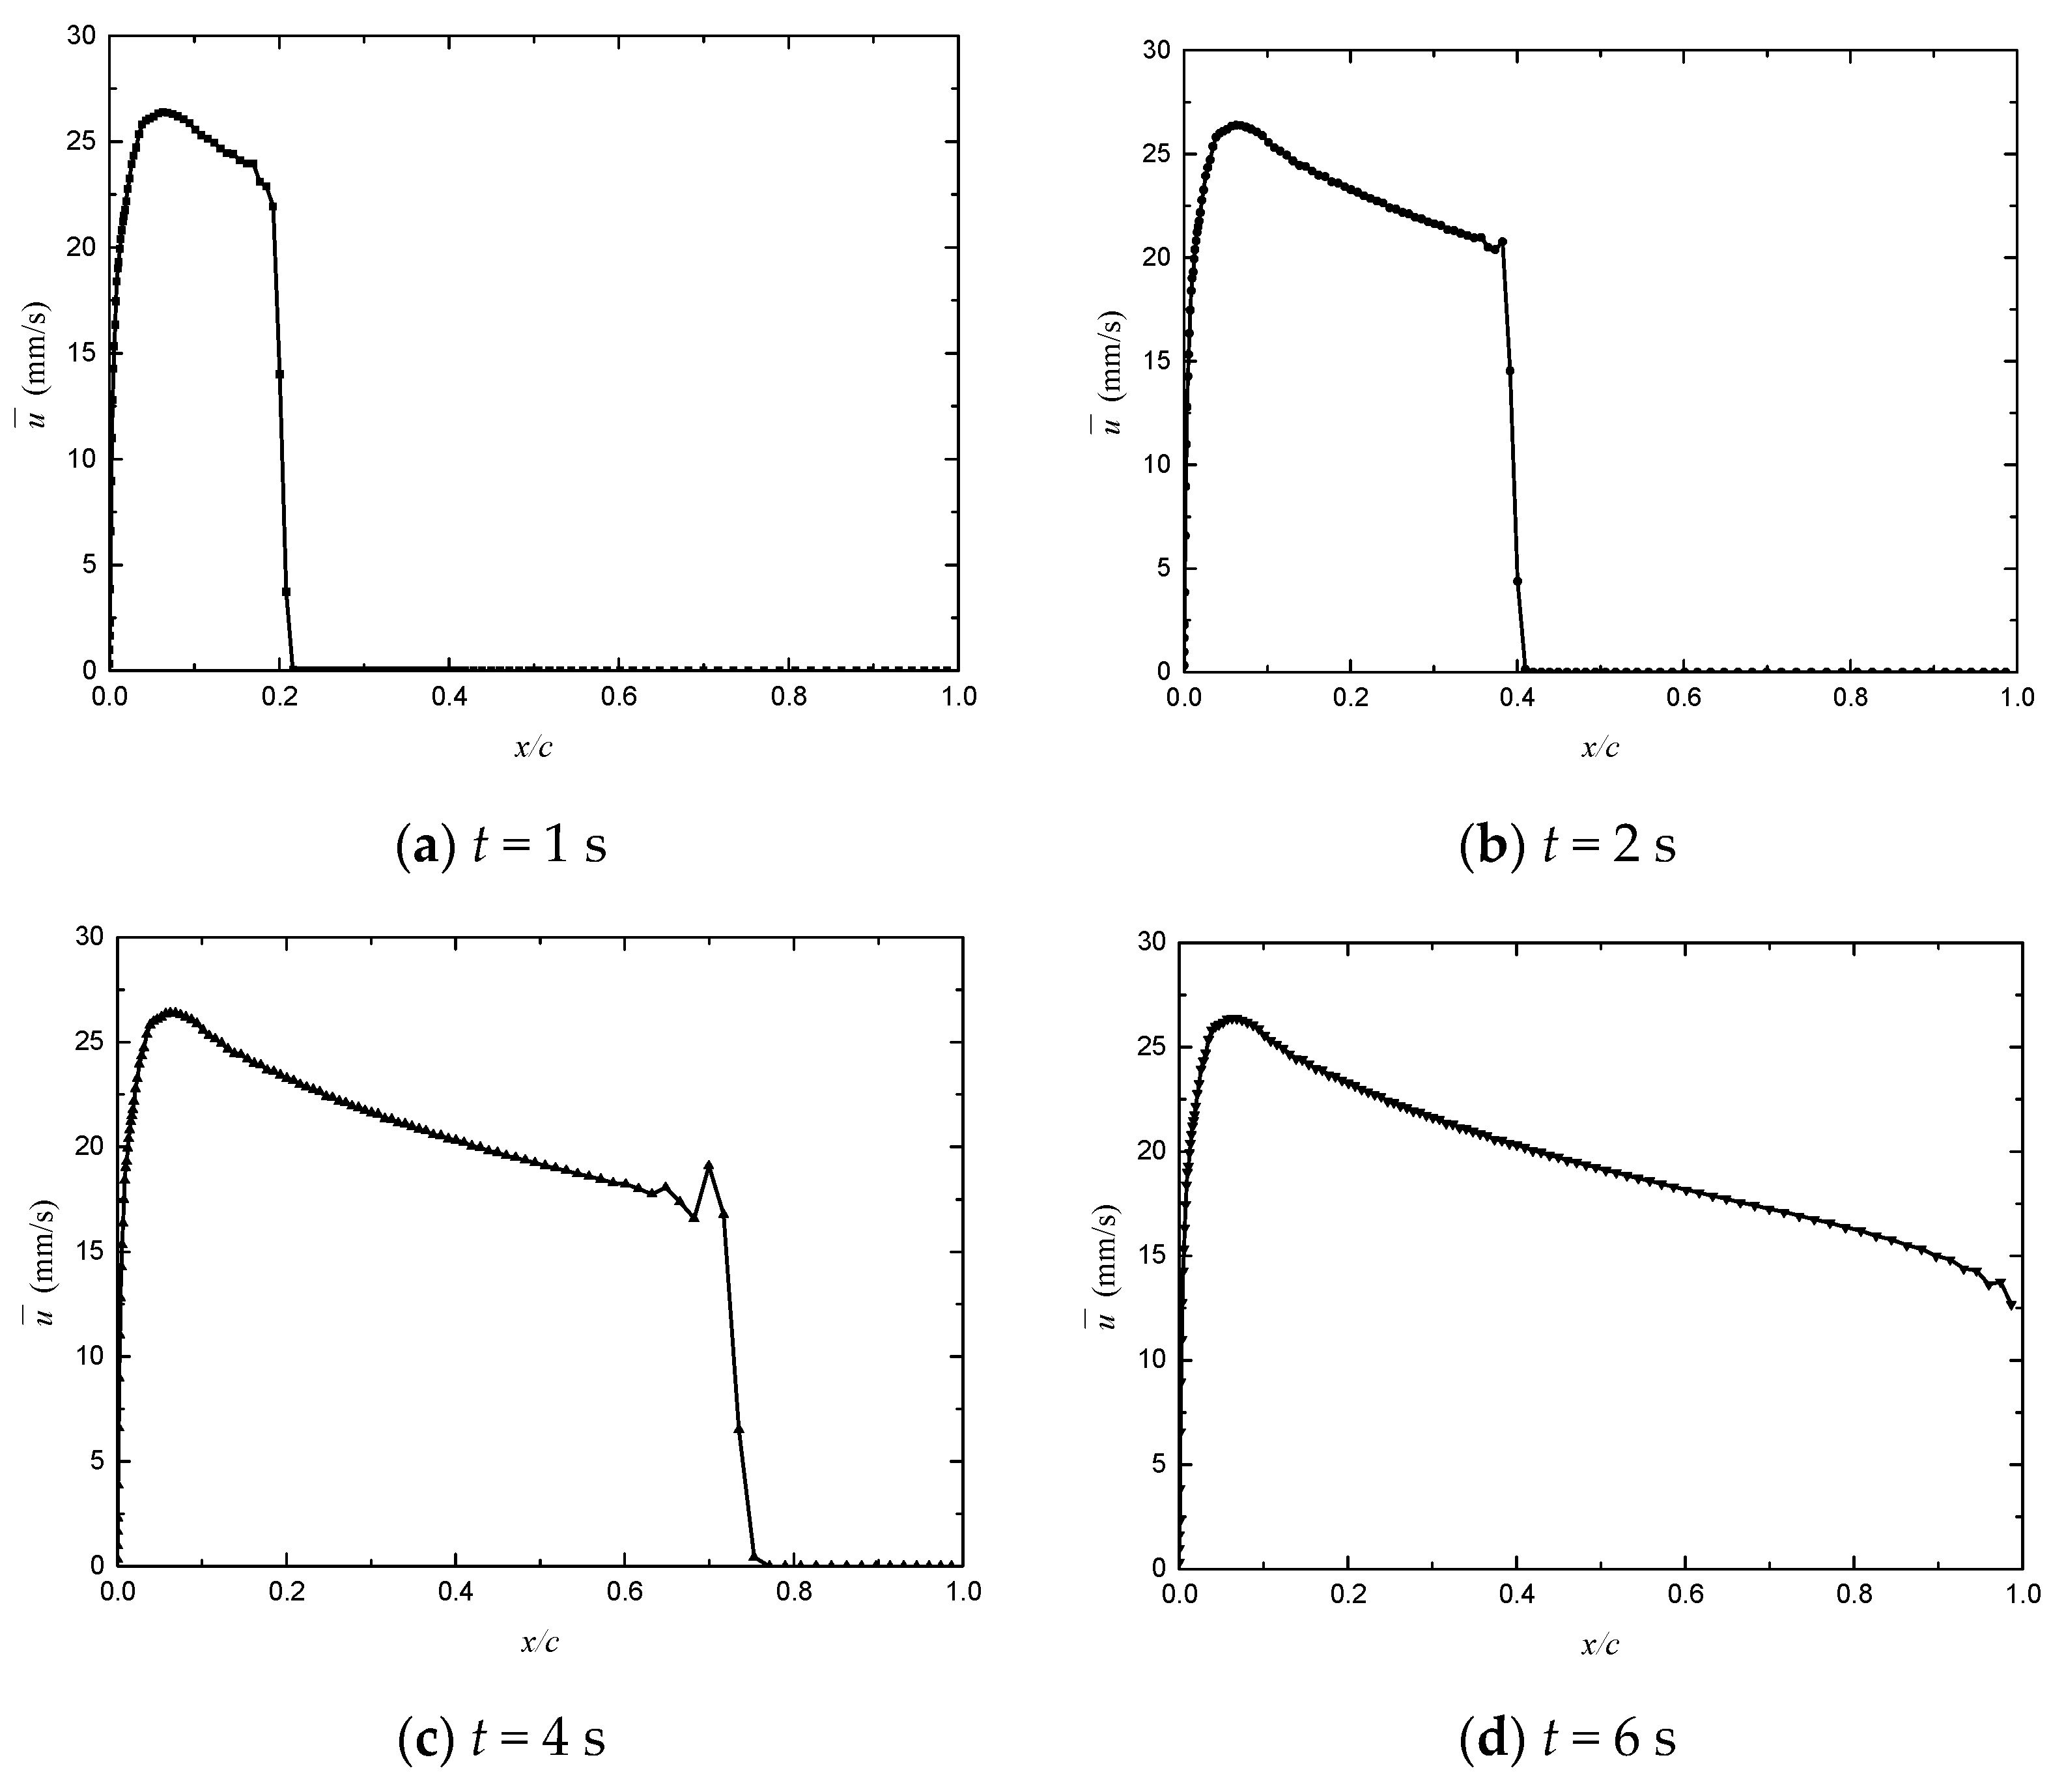
See Appendix A for the water film height and velocity distribution at different times for Cases 2 and 3 at the end of the paper. The distribution of water film flow parameters in these two cases is consistent with that in Case 1, and the water film height is in the order of 10−2 mm. Compared to Case 1, Cases 2 and 3 have higher inflow velocities, leading to an increase in aerodynamic shear forces (see Figure 14). As a result, the water film velocity is enhanced at the same positions compared to Case 1. Consequently, the time for the water film to completely cover the airfoil surface and achieve stable flow is reduced. In Cases 2 and 3, this stable state is reached approximately at t = 9 s and t = 6 s, respectively.

3.2.3. Steady State Continuous Water Film Height Verification

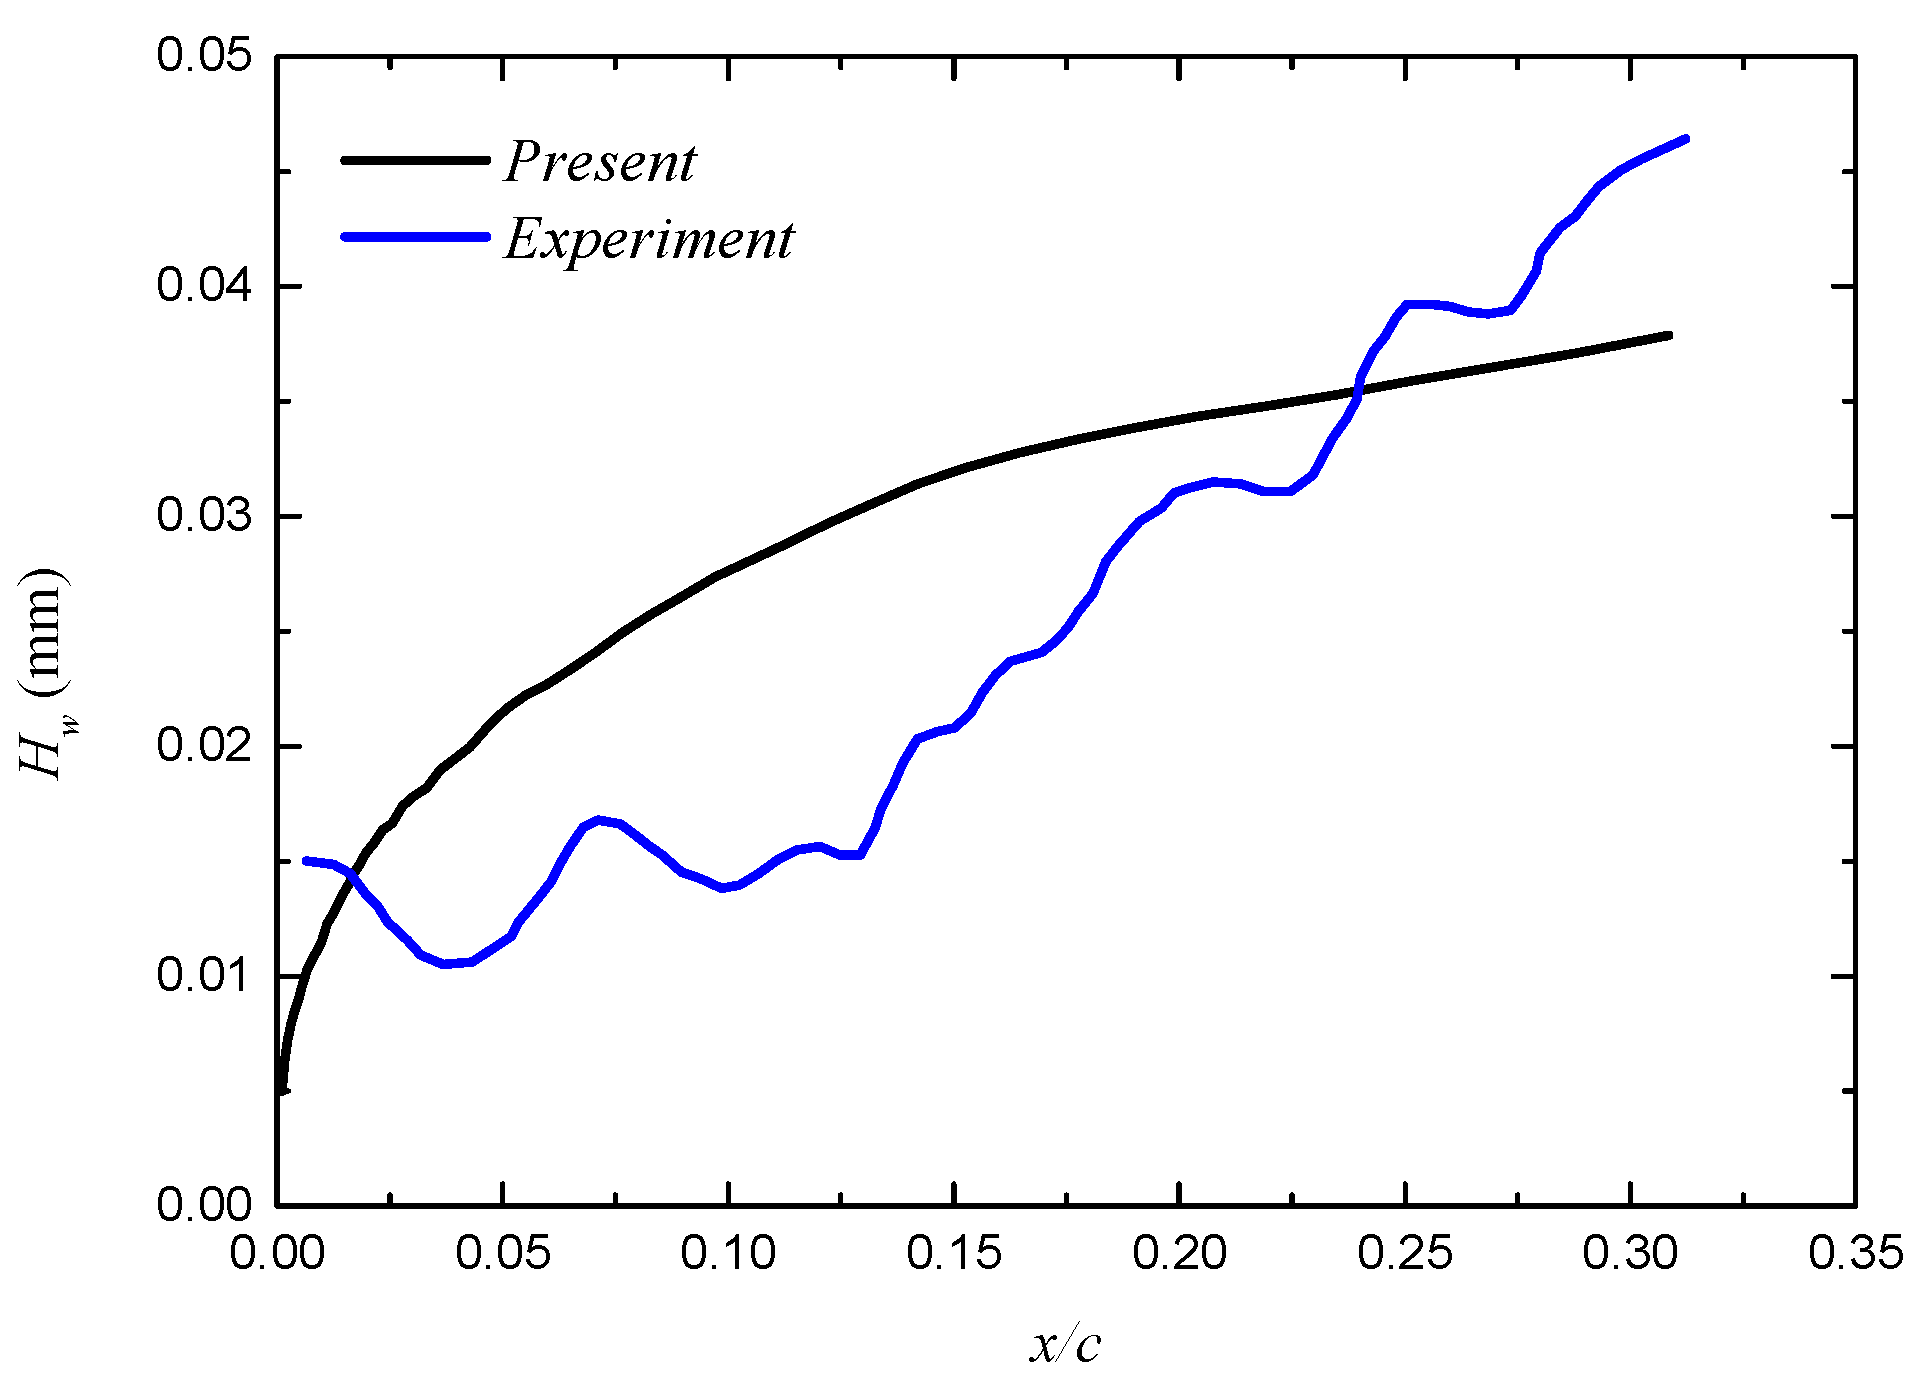
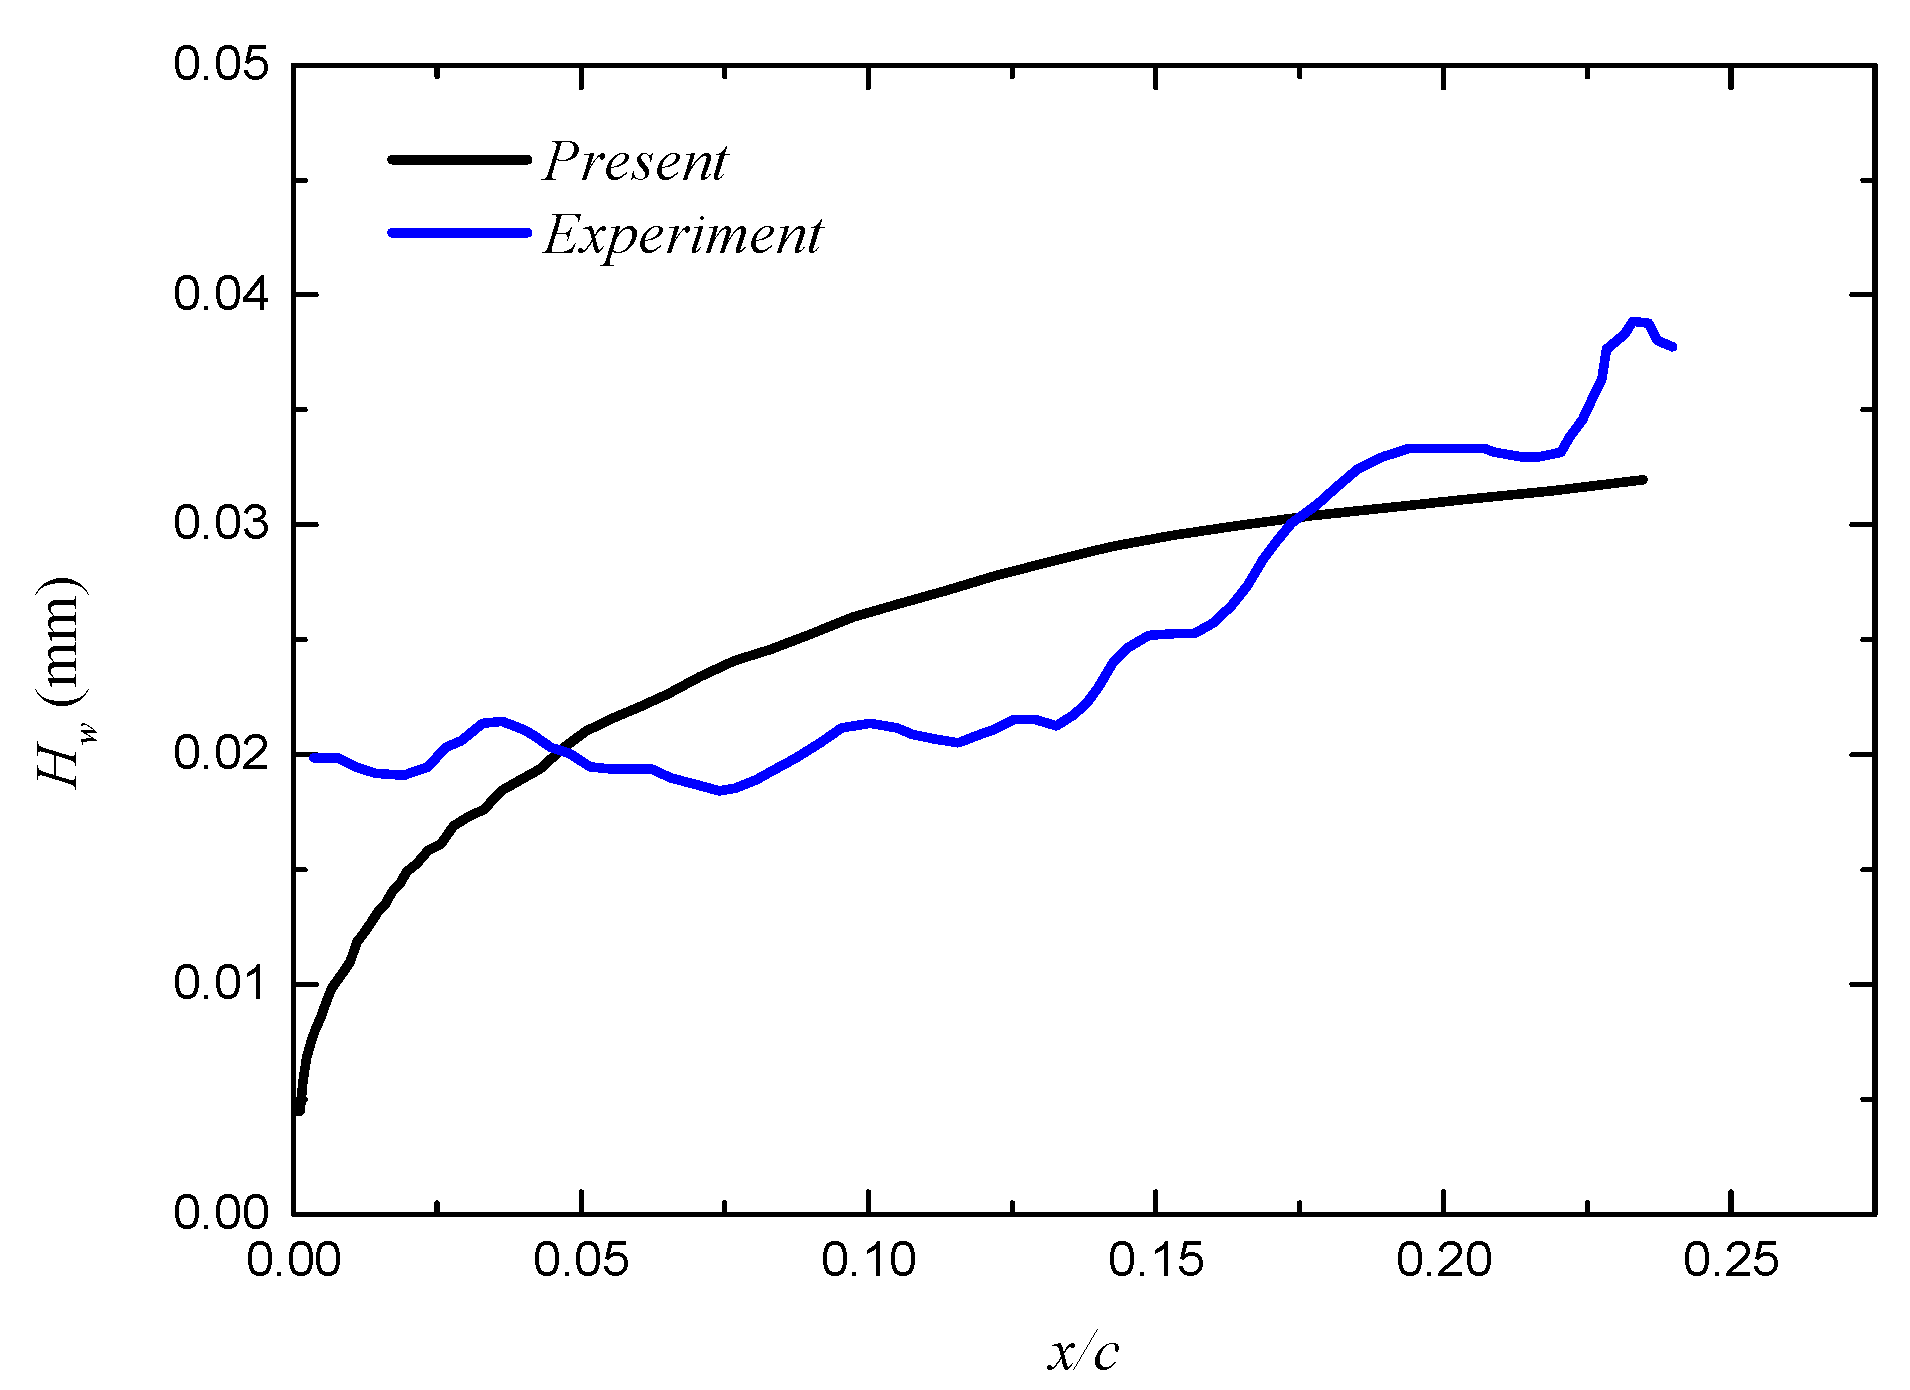
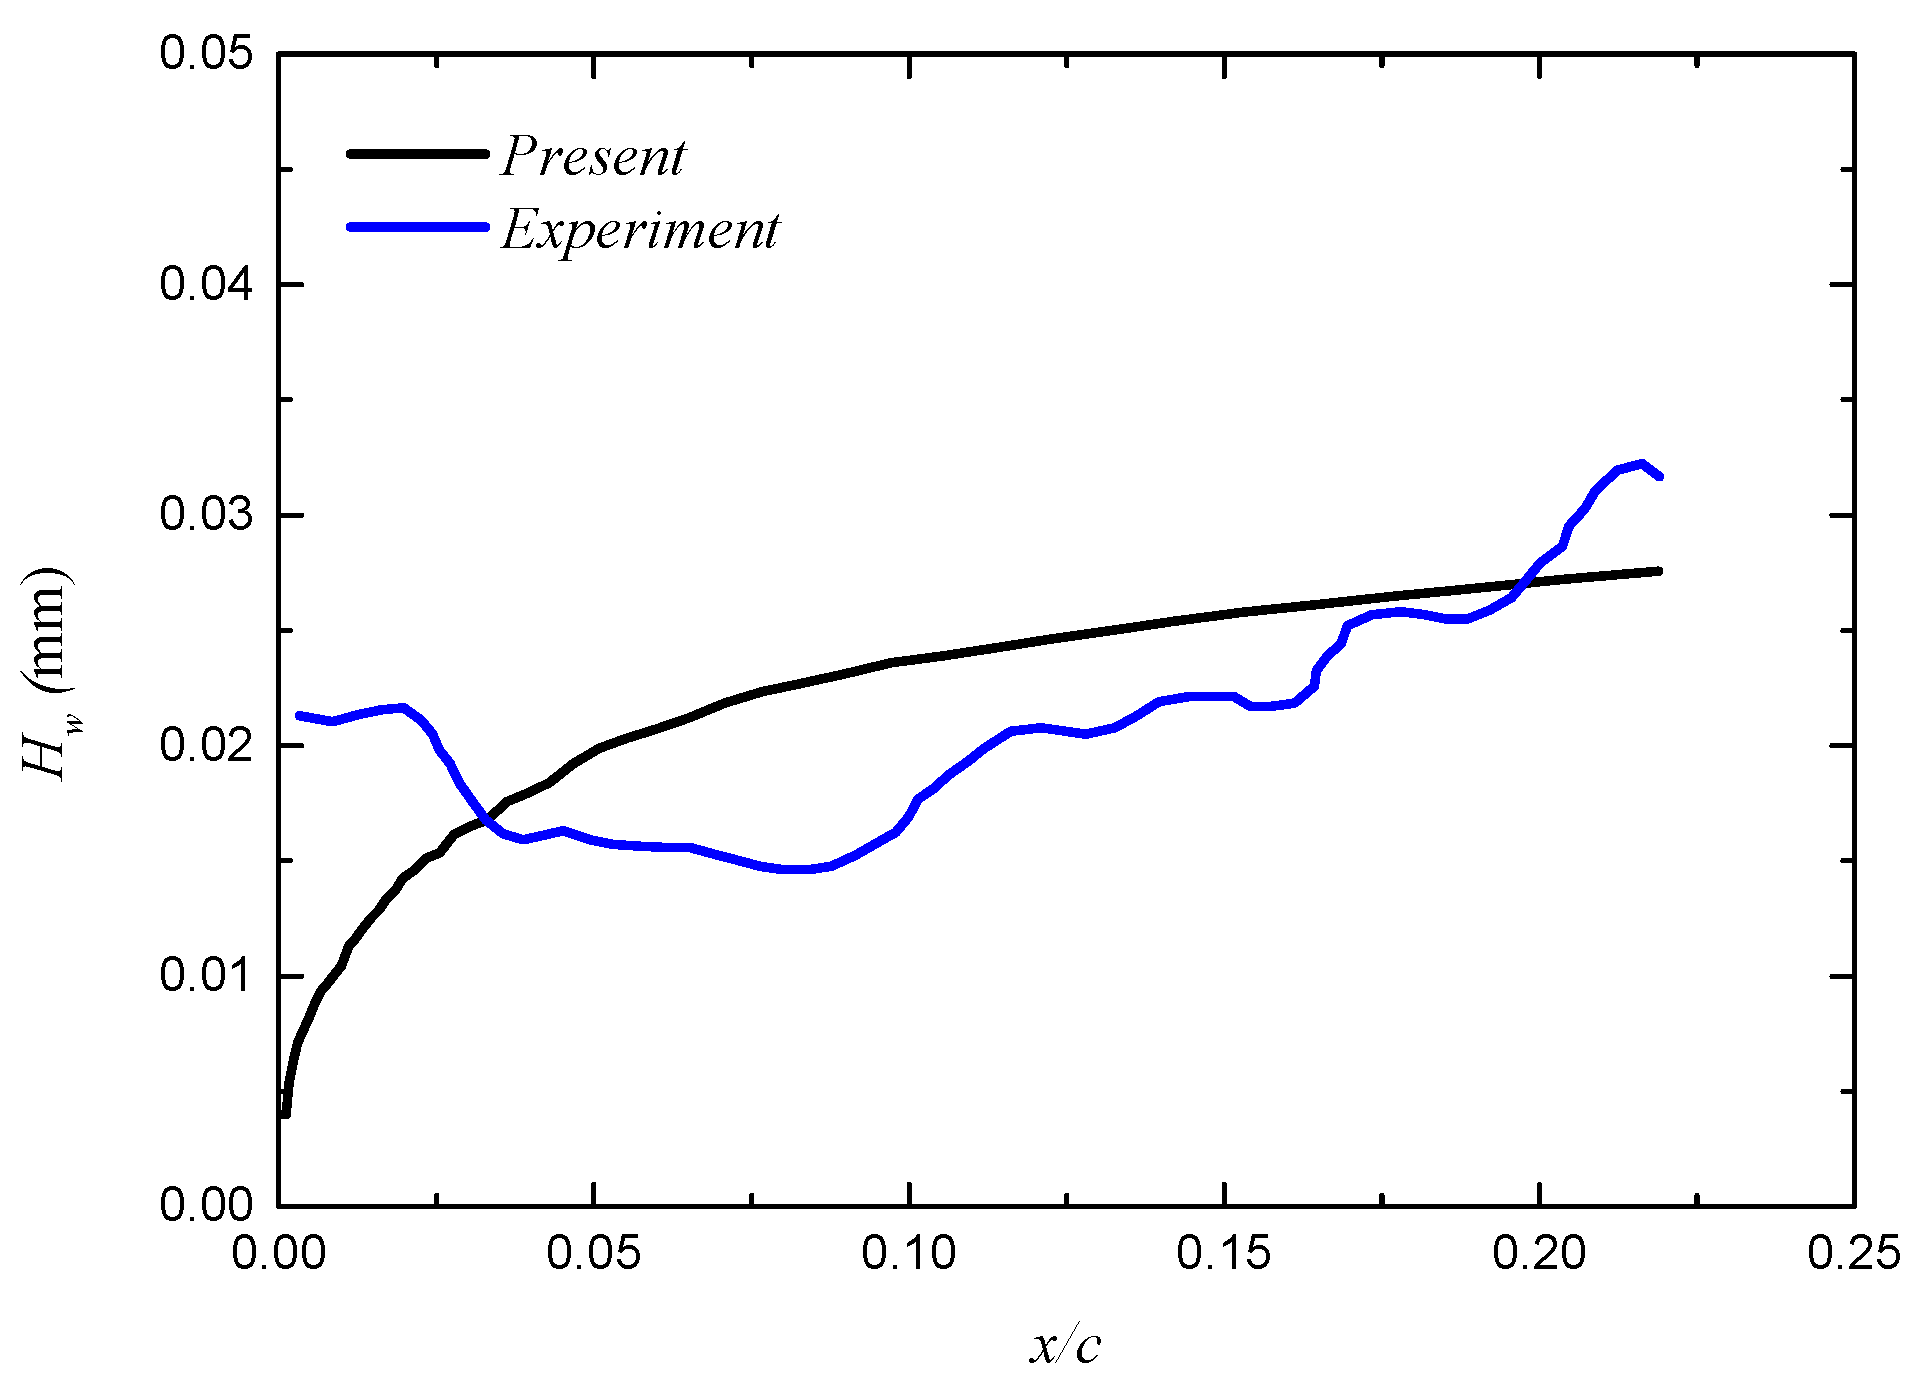
Figure 15, Figure 16 and Figure 17 illustrate the distribution of water film height on the airfoil surface during the steady state of continuous water film flow for Cases 1 to 3, and a comparison is made with experimental data in Ref [5].
The comparison between the calculation and the test results is similar among the three cases. Near the stagnation point, the water film height test value is larger than the simulated value, and the difference between them is marked. Downstream of the stagnation point, the simulated water film height is in good agreement with the experimental results, especially downstream of the water droplet impact area. Moreover, the water film height test data fluctuate along the flow direction, especially in the main impingement area of the water droplets near the stagnation point.
The differences between the calculated water film height near the stagnation point and the experimental data may arise from the intense impact of water droplets in this small region, leading to a significant collection of water droplets on the airfoil surface. In reality, a large number of water droplets may linger in this area and form a thicker water film, causing the disparity between calculated values and measured values. However, only the airflow shear force on the water film is considered in the calculation in this paper. The transport downstream of water droplets collected near the stagnation point under the action of an airflow shear force is overestimated. Therefore, the simulated value of water film height near the stagnation point is significantly lower than the test value, and the downstream water film height value is higher than the test value. The test data of water film height fluctuate markedly in the main impingement area of the water droplets near the stagnation point and downstream. This is because, near the stagnation point and downstream, continuous water film flow is most significantly affected by the impact of water droplets. This is mainly reflected in the disturbance of the surface water film caused by the impingement of water droplets with a kinetic energy on the airfoil surface. However, the mathematical model of continuous water film flow established in this paper does not consider this influence; therefore, the simulated water film height curve is smooth and monotonous in its distribution. Downstream of the water droplet impact area, the water film flow is no longer directly affected by water droplet impact; therefore, the simulated results for water film height are in good agreement with the test results.

3.2.4. Verification of Rivulet Morphological Parameters

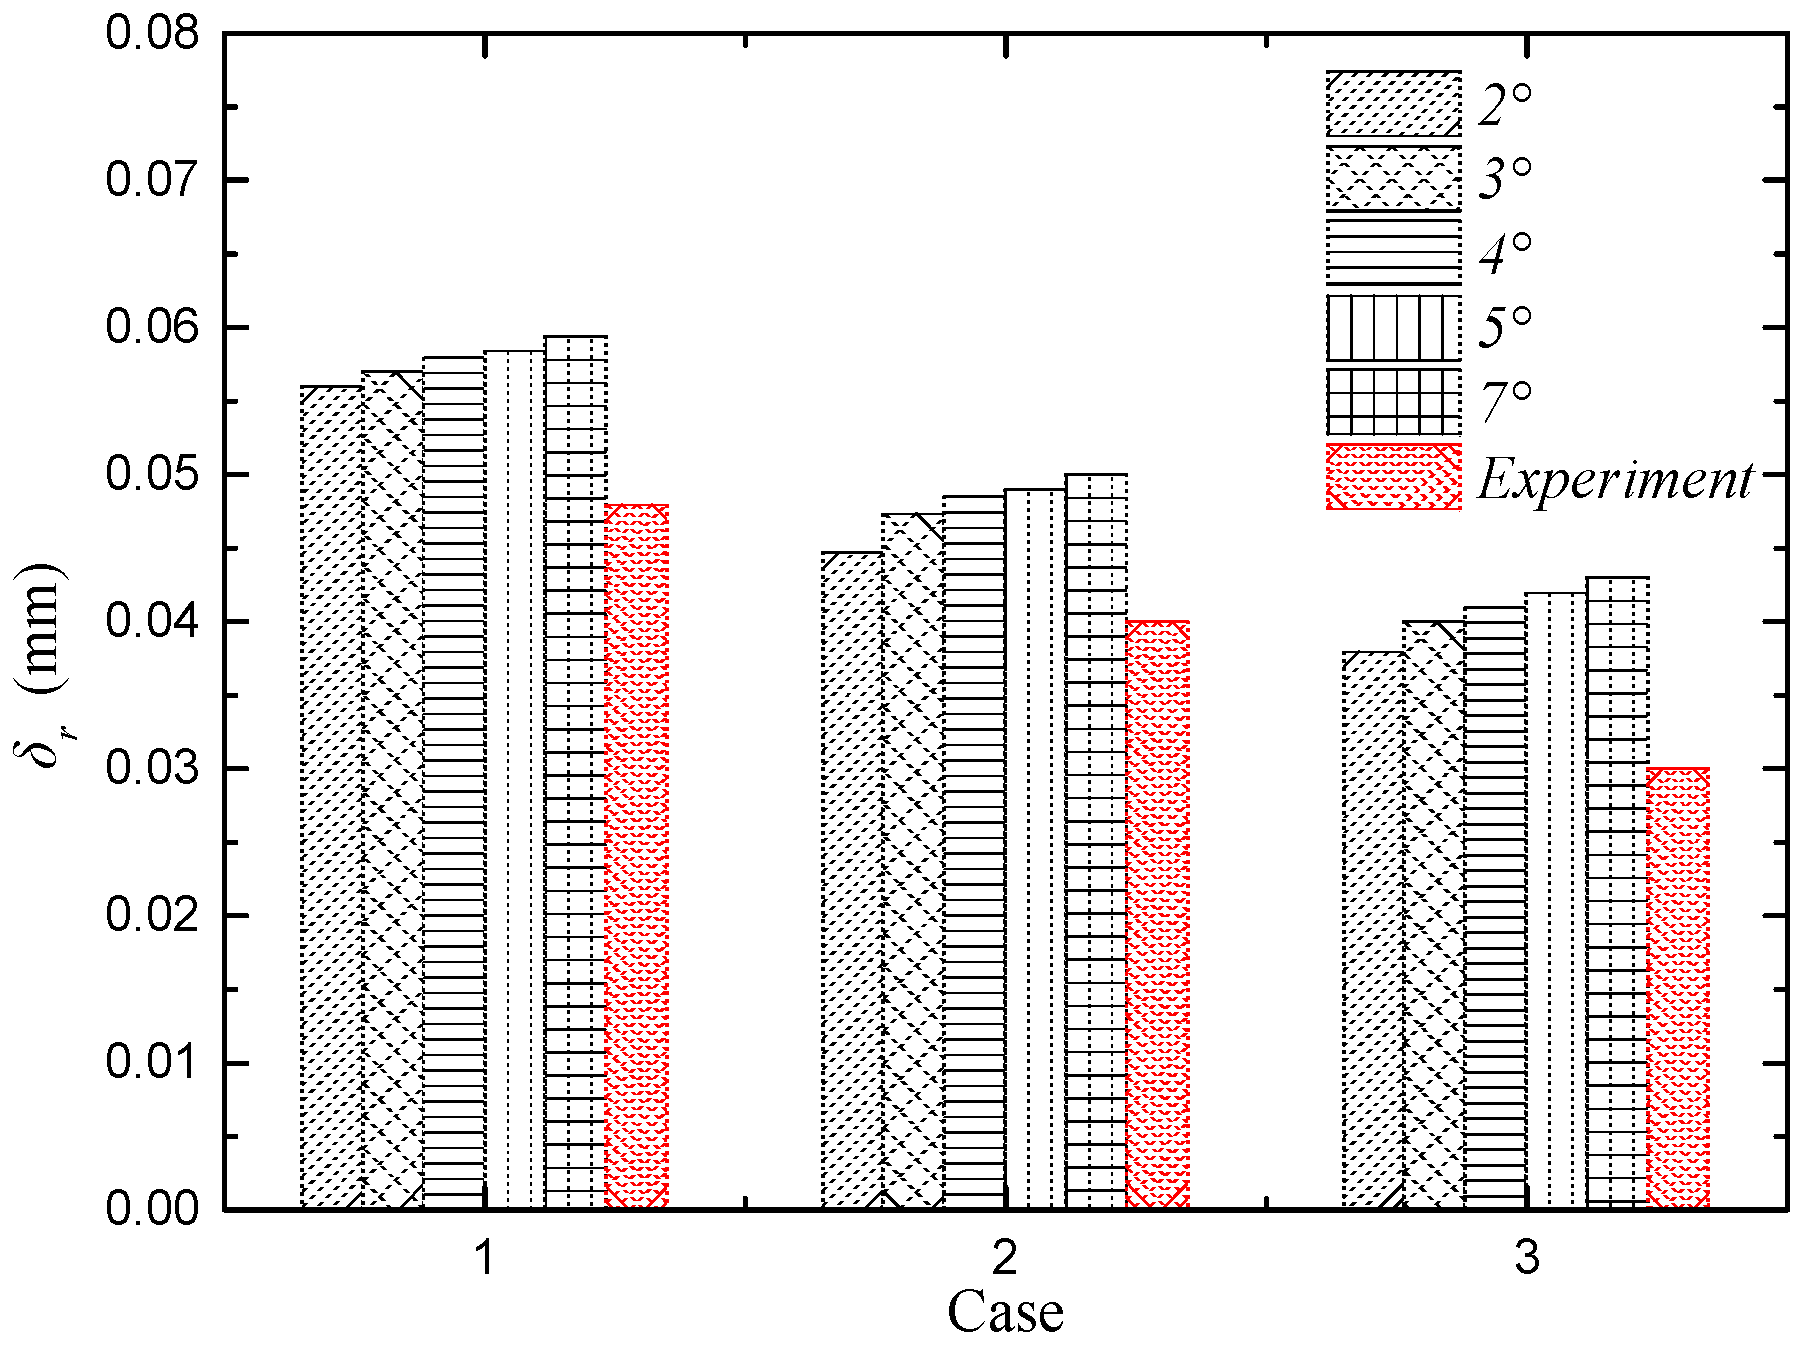
The rivulet height simulated with different solid–liquid contact angles for the three cases and its comparison with the test data are shown in Figure 18. For each case, within the selected contact angle range, the simulated value of rivulet height changes slightly. The differences between the simulated values of rivulet height and the test values for the three cases are small; the absolute error is almost within 0.01 mm.
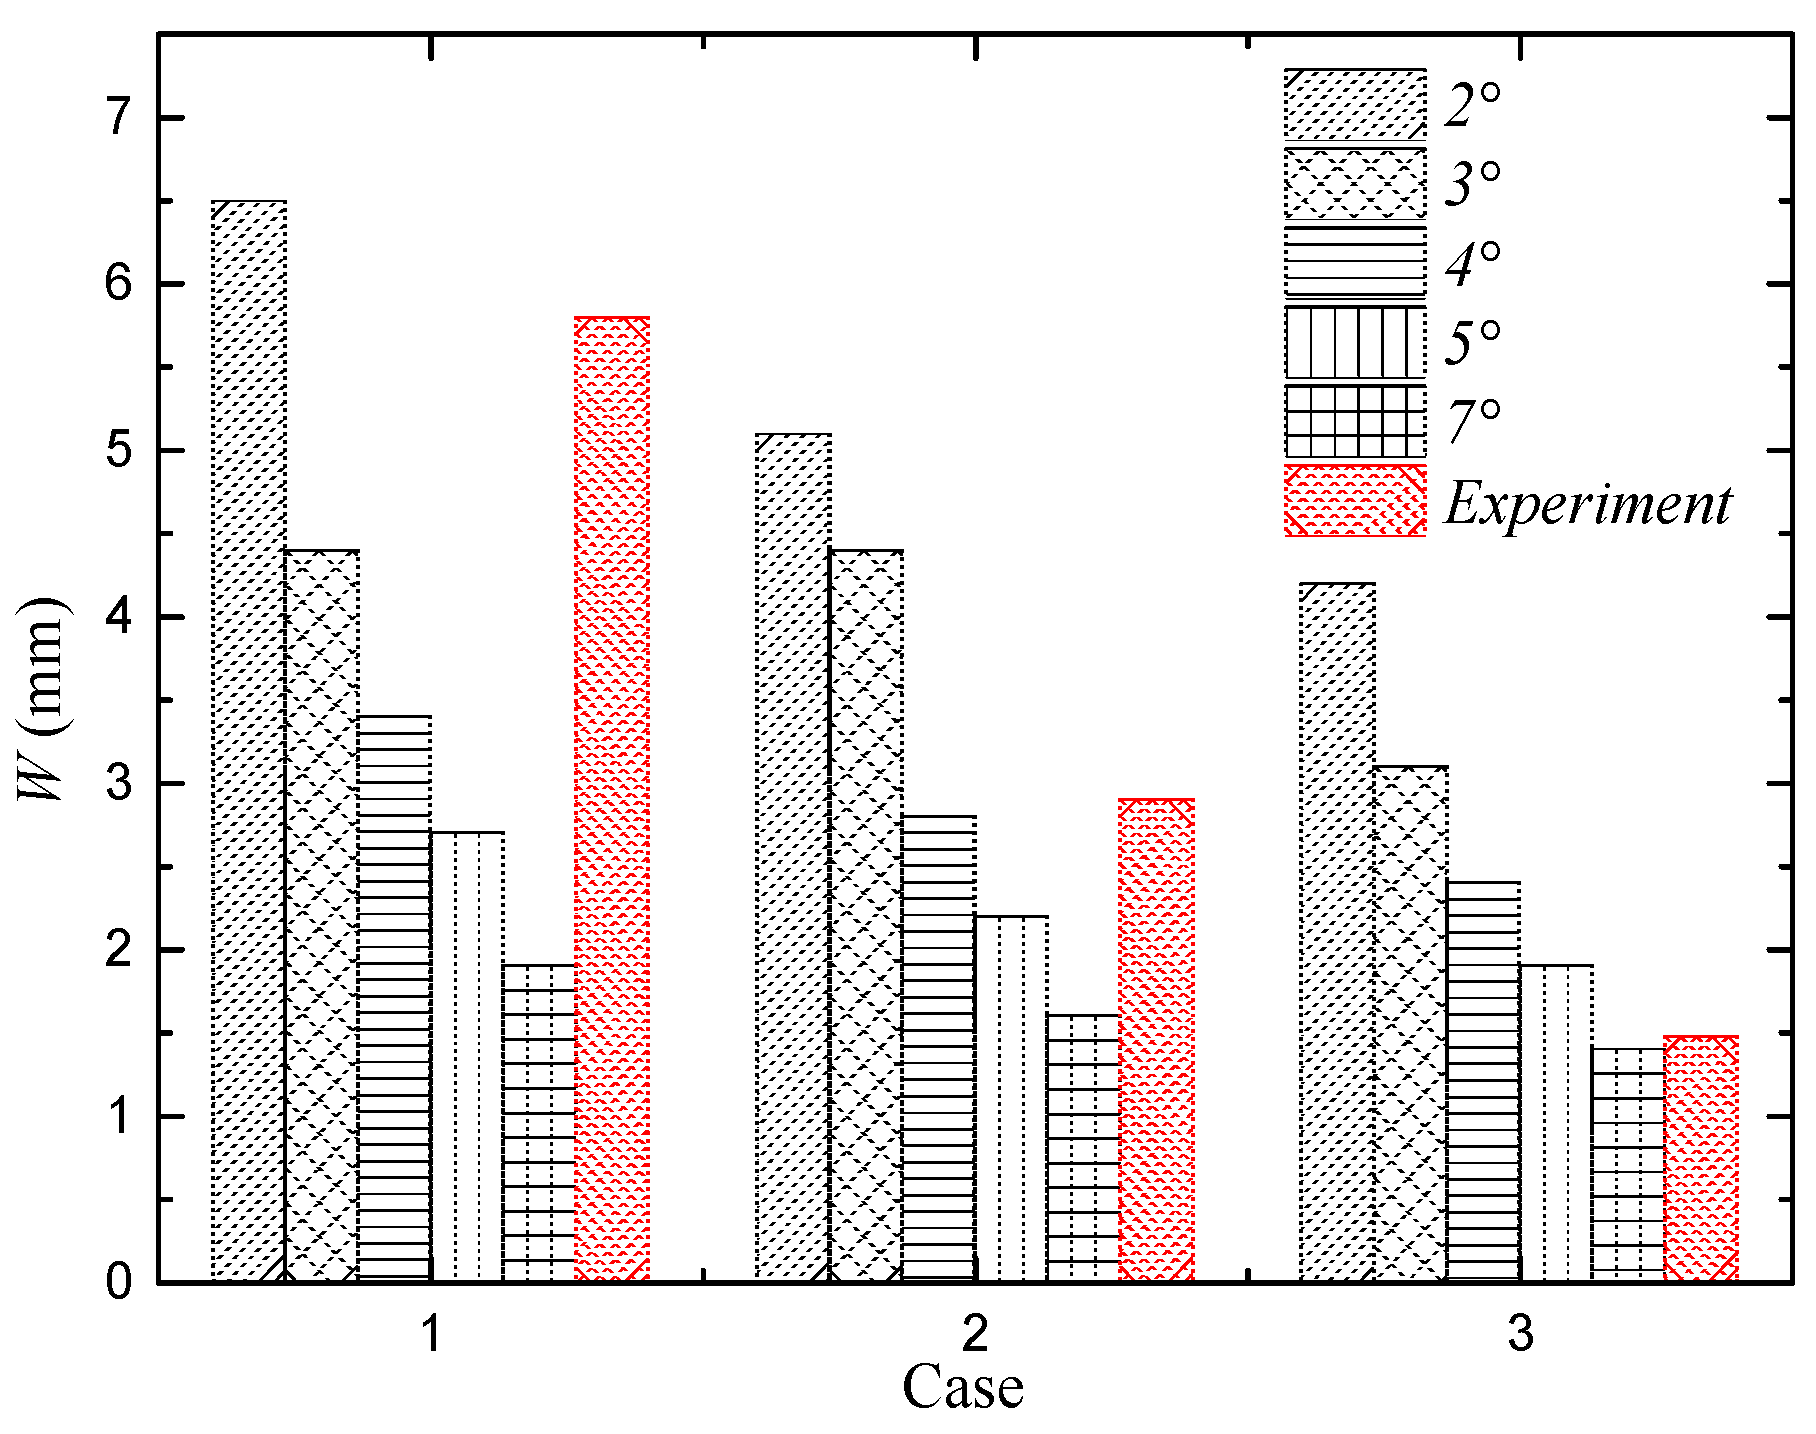
Figure 19 shows the simulation and test results of rivulet width for the three cases. Within the selected contact angle range, the simulated value changes greatly. The larger the contact angle, the smaller the calculated value of rivulet width. Comparing the computational results with experimental data, it is observed that, for Case 1, a contact angle of 2°, and for Case 2 and 3, contact angles of 5° and 7°, respectively, yield a high degree of agreement between calculated and experimental values, with errors all below 10%. This shows that, with increasing incoming flow velocity, the contact angle increases, and the error between the simulation and test results is small.

4. Conclusions

In this study, a three-dimensional model of continuous water film flow and a model of rivulet formation via continuous water film breakup on an anti-icing surface were constructed. Using the models, the characteristics of continuous water film flow and the morphological parameters of rivulets on an NACA0012 airfoil surface were numerically simulated. The main conclusions of this paper are as follows:
(1) In this paper, a three-dimensional and unsteady model of water film flow and heat transfer on the anti-icing surface was proposed, in which the shear force, gravity and pressure gradient force acting on the water film were considered. And the unsteady flow process of the water film was numerically simulated.
(2) The height of a continuous water film on the airfoil surface first increased sharply and then increased slowly along the flow direction from the stagnation point. As time went on, the distribution range of a continuous water film on the airfoil surface gradually expanded downstream.
(3) As the inflow velocity increased, the time required for the water film to completely cover the airfoil surface and achieve flow stability shortened.
(4) When the continuous water film flow on the airfoil surface stabilized, the simulated value of water film height near the stagnation point was lower than the experimental value. The simulated water film height was in good agreement with the experimental results near the stagnation point, especially downstream of the water droplet impingement area.
(5) Within the selected contact angle range, the error between the simulated value of rivulet height and the test results was small and within 0.01 mm. With increasing inflow velocity and increasing contact angle, the error between the calculation of the stream width and the test results was less than 10%.

Author Contributions

C.Z., conceptualization, investigation, methodology and writing—original draft; L.L., conceptualization, investigation and writing—original draft; Y.H., conceptualization, investigation, methodology, project administration, resources, supervision and writing—original draft; P.L., conceptualization, methodology, validation and writing—review and editing. All authors have read and agreed to the published version of the manuscript.

Funding

This work was funded by the Aeronautical Science Foundation of China, grant number No. 20200028052005.

Data Availability Statement

The data presented in this study are available on request from the corresponding author due to legal and ethical reasons.

Conflicts of Interest

The authors declare no conflict of interest.

Abbreviations

The following abbreviations are used in this manuscript:
AOAAngle of Attack
cchord length of the airfoil
Ddistance between each rivulet and its adjacent rivulets
hconvective heat transfer coefficient between the air and the water film
Lspanwise height
LWCLiquid Water Content
MVDMean Volume Diameter
NACANational Advisory Committee for Aeronautics
ppressure of the water film
Rradius of the outer profile of a rivulet
tTime
TTemperature of the incoming flow
uincoming flow velocity
uflow velocity of the water film in the x-direction
vflow velocity of the water film in the y-direction
Wwidth of each stream
c p w specific heat capacity of water
E f energy passing through the water film per unit time
E r energy passing through the stream per unit time
g x gravitational acceleration in the x-direction
g y gravitational acceleration in the y-direction
g z gravitational acceleration in the z-direction
H w height of the water film
H w o l d water film height solved in the last time step
H w , i n i t i a l initial water film height
H w , n e w new water film height
m ˙ e v a p evaporation flow rate of the water film per unit area of the control body
m ˙ i m p impact flow rate of the water film per unit area of the control body
m ˙ i n flow rate along the flow direction of the water film into of the control body
m ˙ o u t flow rate along the flow direction of the water film out of the control body
m f mass flow of the water film
m r mass flow of the rivulets
p a air pressure acting on the upper surface of the water film
Q ˙ a n t i anti-icing heat flow per unit area in the control body
Q ˙ c o n v convective heat transfer between the water film and air per unit area in the control body
Q ˙ e v a p latent heat released by water film evaporation per unit area in the control body
Q ˙ i m p energy from impingement of the droplets per unit area in the control body
T w temperature of the water film
ν w kinematic viscosity of water
Δ t time step size
Δ x length of control volume in the x-direction
Δ y length of control volume in the y-direction
u ¯ average velocity in the x-direction of the water film along its height
v ¯ average velocity in the y-direction of the water film along its height
u r flow velocity of the stream
τ a drag force at the air–water film interface
τ a x air shear force in the x-direction
τ a y air shear force in the y-direction
μ w dynamic viscosity of water
ρ w density of water
λ w thermal conductivity of water
θ 0 solid–liquid contact angle between the wall and rivulet
δ r the height of each stream
σ l v surface tension coefficients of the gas–liquid interface
σ s l surface tension coefficients of the solid–liquid interface
σ s v surface tension coefficients of the gas–solid interface
φ ( θ 0 ) an auxiliary function

Appendix A. The Water Film Height and Velocity Distribution at Different Times
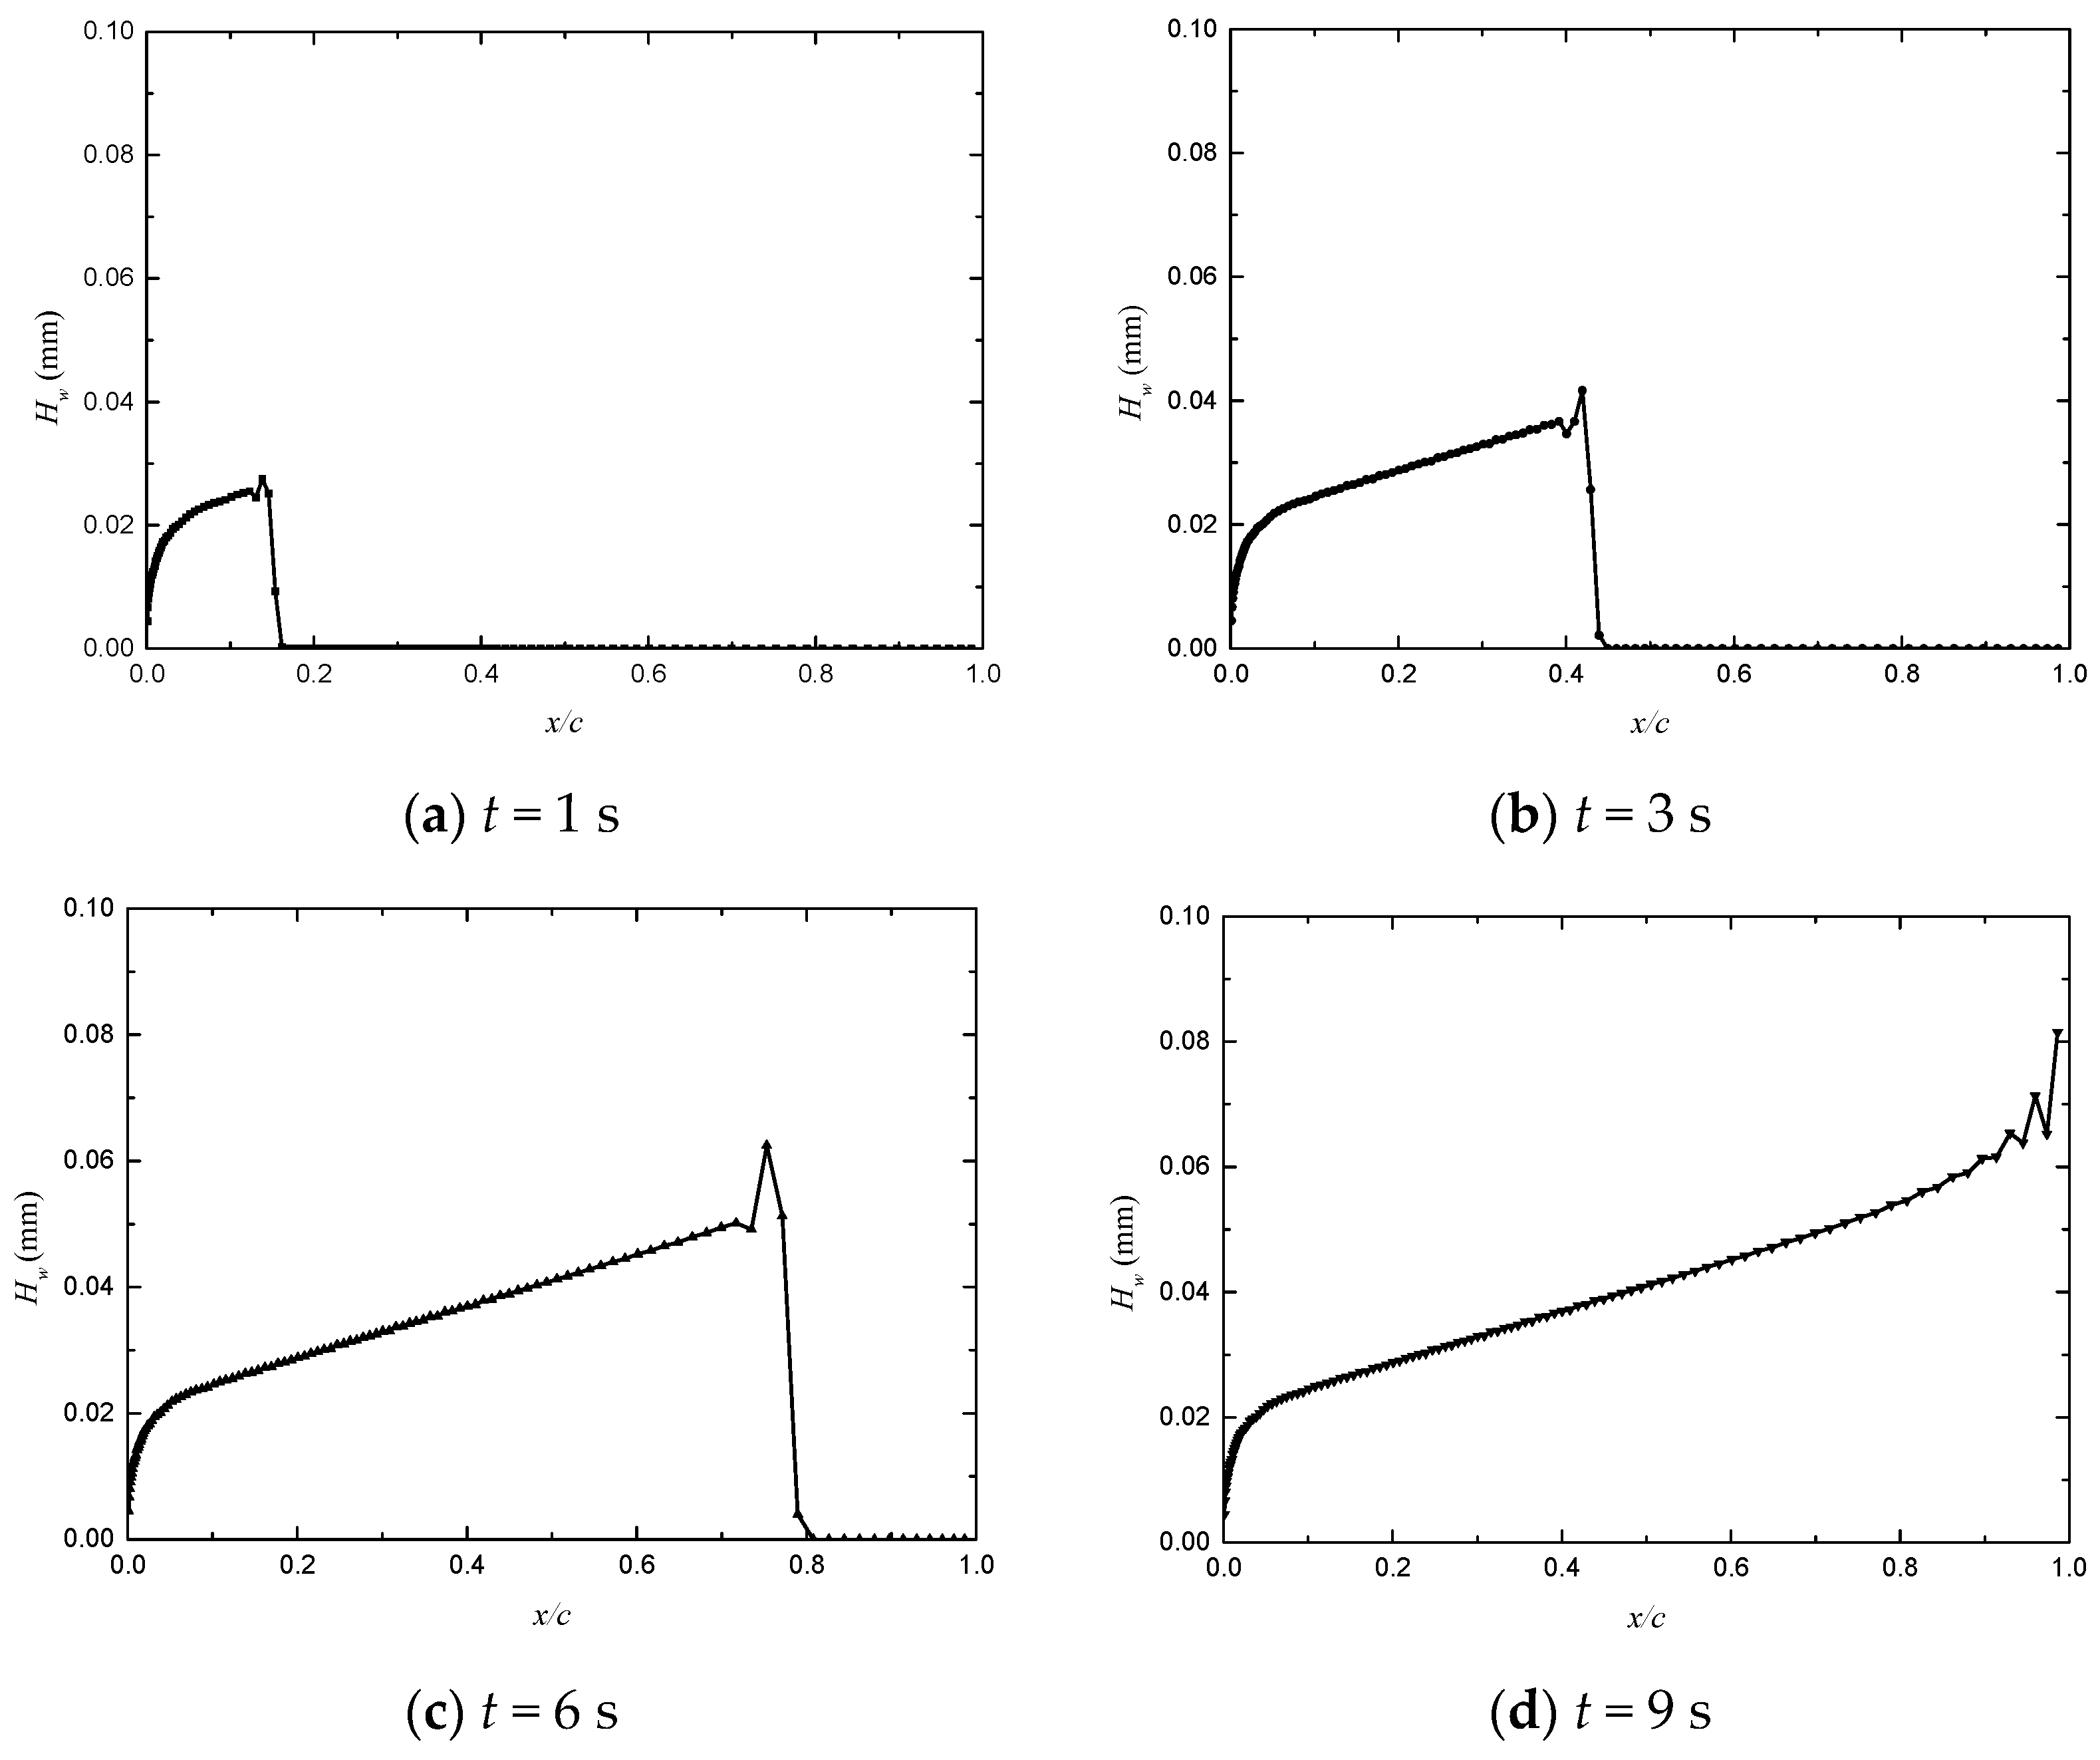
Figure A1. Distribution of water film height on airfoil surface at different times in Case 2.
Aerospace 11 00352 g0a1
Figure A2. Distribution of water film flow velocity on airfoil surface at different times in Case 2.
Aerospace 11 00352 g0a2
Figure A3. Distribution of water film height on airfoil surface at different times in Case 3.
Aerospace 11 00352 g0a3
Figure A4. Distribution of water film flow velocity on airfoil surface at different times in Case 3.
Aerospace 11 00352 g0a4

References

  1. Goraj, Z. An overview of the deicing and antiicing technologies with prospects for the future. In Proceedings of the 24th International Congress of the Aeronautical Sciences, Yokohama, Japan, 29 August–3 September 2004. [Google Scholar]
  2. He, Q.; Li, K.; Xu, Z.; Wang, J.; Wang, X.; Li, A. Research progress on construction strategy and technical evaluation of aircraft icing accretion protection system. Chin. J. Aeronaut. 2023, 36, 1–23. [Google Scholar] [CrossRef]
  3. Hansman, R.J., Jr.; Turnock, S.R. Investigation of surface water behavior during glaze ice accretion. J. Aircr. 1989, 26, 140–147. [Google Scholar] [CrossRef]
  4. Moghtadernejad, S.; Jadidi, M.; Esmail, N.; Dolatabadi, A. Shear driven rivulet dynamics on surfaces with various wettabilities. In Proceedings of the ASME 2014 International Mechanical Engineering Congress & Exposition, Montreal, QC, Canada, 14–20 November 2014. IMECE2014-38665. [Google Scholar]
  5. Zhang, K.; Johnson, B.; Rothmayer, A.P.; Hu, H. An Experimental investigation on wind-driven rivulet/film flows over a NACA0012 airfoil by using digital image projection technique. In Proceedings of the 52nd Aerospace Sciences Meeting, National Harbor, MD, USA, 13–17 January 2014. AIAA 2014-0741. [Google Scholar]
  6. Zhang, K.; Tian, W.; Hu, H. An experimental investigation on the surface water transport process over an airfoil by using a digital image projection technique. Exp. Fluids 2015, 56, 173. [Google Scholar] [CrossRef]
  7. Liu, Y.; Zhang, K.; Tian, W.; Hu, H. An experimental study to characterize the effects of initial ice roughness on the wind-driven water runback over an airfoil surface. Int. J. Multiph. Flow 2020, 126, 103254. [Google Scholar] [CrossRef]
  8. Lou, Y.; Bu, X.; Shen, X.; Lin, G.; Zhang, R.; Zeng, F.; Jin, H.; Ma, K.; Wen, D. Simulation of and Experimental Research on Rivulet Model on Airfoil Surface. Aerospace 2022, 9, 570. [Google Scholar] [CrossRef]
  9. Messinger, B.L. Equilibrium temperature of an unheated icing surface as a function of airspeed. J. Aeronaut. Sci. 1953, 20, 29–42. [Google Scholar] [CrossRef]
  10. Al-Khalil, K.M. Numerical Simulation of an Aircraft Anti-Icing System Incorporating a Rivulet Model for the Runback Water. Ph.D. Thesis, University of Toledo, Toledo, OH, USA, 1991. [Google Scholar]
  11. Al-Khalil, K.M.; Keith, J.T.G.; De Witt, K.J. Further development of an anti-icing runback model. In Proceedings of the 29th Aerospace Sciences Meeting & Exhibit, Reno, NV, USA, 7–10 January 1991. AIAA 91-0266. [Google Scholar]
  12. Fortin, G.; Perron, J.; Mingione, G.; Perron, J. CIRAAMIL Ice accretion code improvement. In Proceedings of the 1st AIAA Atmospheric and Space Environments Conference, San Antonio, TX, USA, 22–25 June 2009. AIAA-2009-3968. [Google Scholar]
  13. Hedde, T.; Guffond, D. ONERA Three-dimensional icing model. AIAA J. 1995, 33, 1038–1045. [Google Scholar] [CrossRef]
  14. Silva, G.; Silvares, O.; Zerbini, E. Water film breakdown and rivulets formation effects on thermal anti-ice operation simulation. In Proceedings of the 9th AIAA/ASME Joint Thermophysics and Heat Transfer Conference, San Francisco, CA, USA, 5–8 June 2006. AIAA-2006-3785. [Google Scholar]
  15. Dong, W.; Zheng, M.; Zhu, J.; Lei, G. Calculation and analysis of runback water flow on anti-icing airfoil surface. J. Aircr. 2016, 53, 1597–1605. [Google Scholar] [CrossRef]
  16. Bu, X.; Ma, W.; Lin, G. Numerical simulation of runback film breakup on two-dimentional anti-icing airfoil surface. J. Aerosp. Power 2015, 30, 368–375. [Google Scholar]
  17. Bourgault, Y.; Beaugendre, H.; Habashi, W.G. Development of a shallow-water icing model in FENSAP-ICE. J. Aircr. 2000, 37, 640–646. [Google Scholar] [CrossRef]
  18. Myers, T.G.; Charpin, J.P.; Thompson, C.P. Slowly accreting ice due to supercooled water impacting on a cold surface. Phys. Fluids 2002, 14, 240–256. [Google Scholar] [CrossRef]
  19. Cao, G.; Ji, H.; Hu, Y.; Pang, L.; Si, R.; Feng, X. An icing model for simulating three dimentional ice accretion on the upwind surface of a plane. J. Aerosp. Power 2011, 26, 1953–1963. [Google Scholar]
  20. Cao, G.; Ji, H.; SI, R. Computational methodology of water film flow in three dimensional ice accretion on upwind surface. J. Aerosp. Power 2015, 30, 677–685. [Google Scholar]
  21. Su, C.; Hu, Y.; Cao, G.; Ji, H. Numerical investigation on glaze ice accretion with the evaporation of the water film. Tuijin Jishu/J. Propuls. Technol. 2018, 39, 1540–1548. [Google Scholar]
  22. Jian, J.; Ji, H.; Cao, G.; Hu, Y.; Chen, N. Numerical study on water film flow and shedding in horn glaze ice accretion. J. Eng. Thermophys. 2018, 39, 2284–2293. [Google Scholar]
  23. Gosset, A. Prediction of rivulet transition in anti-icing applications. In Proceedings of the 7th European Conference for Aeronautics and Space Sciences, Milan, Italy, 3–6 July 2017. EUCASS2017-482. [Google Scholar]
  24. Lei, M.; Chang, S.; Yang, B. Three-dimensional numerical simulation of icing using Myers model. Acta Aeronaut. Astronaut. Sin. 2018, 39, 36–46. [Google Scholar]
  25. Xin, M.; Zhong, G.; Cao, Y. Caculation of airfoil anti-icing/deicing characteristics based on water film flow and coupled heat transfer. J. Aerosp. Power 2021, 36, 783–794. [Google Scholar]
  26. Ferro, C.G.; Maggiore, P.; Champvillair, D. Development of a computational fluid dynamics model for ice formation: Validation and parameter analysis. Atmosphere 2023, 14, 834. [Google Scholar] [CrossRef]
  27. Samad, A.; Villeneuve, E.; Morency, F.; Béland, M.; Lapalme, M. A preliminary approach towards rotor icing modeling using the unsteady vortex lattice method. Drones 2024, 8, 65. [Google Scholar] [CrossRef]
  28. Andros, F.E. Heat Transfer Characteristics of the Two-Phase Closed Thermosyphon (Wickless Heat Pipe) Including Direct Flow Observation; Technical Report; Arizona State University: Tempe, AZ, USA, 1980. [Google Scholar]
  29. Brumby, R.E. The effect of wing ice contamination on essential flight characteristics. In AGARD Conference Proceedings; AGARD-CP-496; University of Michigan: Ann Arbor, MI, USA, 1991. [Google Scholar]
  30. Hedde, T.; Guffond, D. Development of a three-dimensional icing code, comparison with experimental shapes. In Proceedings of the 30th Aerospace Sciences Meeting and Exhibit, Reno, NV, USA, 6–9 January 1992. AIAA-92-0041. [Google Scholar]
  31. Mirabedini, S.M.; Rahimi, H.; Hamedifar, S.; Mohseni, S.M. Microwave irradiation of polypropylene Surface: A study on wettability and adhesion. Int. J. Adhes. Adhes. 2004, 24, 163–170. [Google Scholar] [CrossRef]
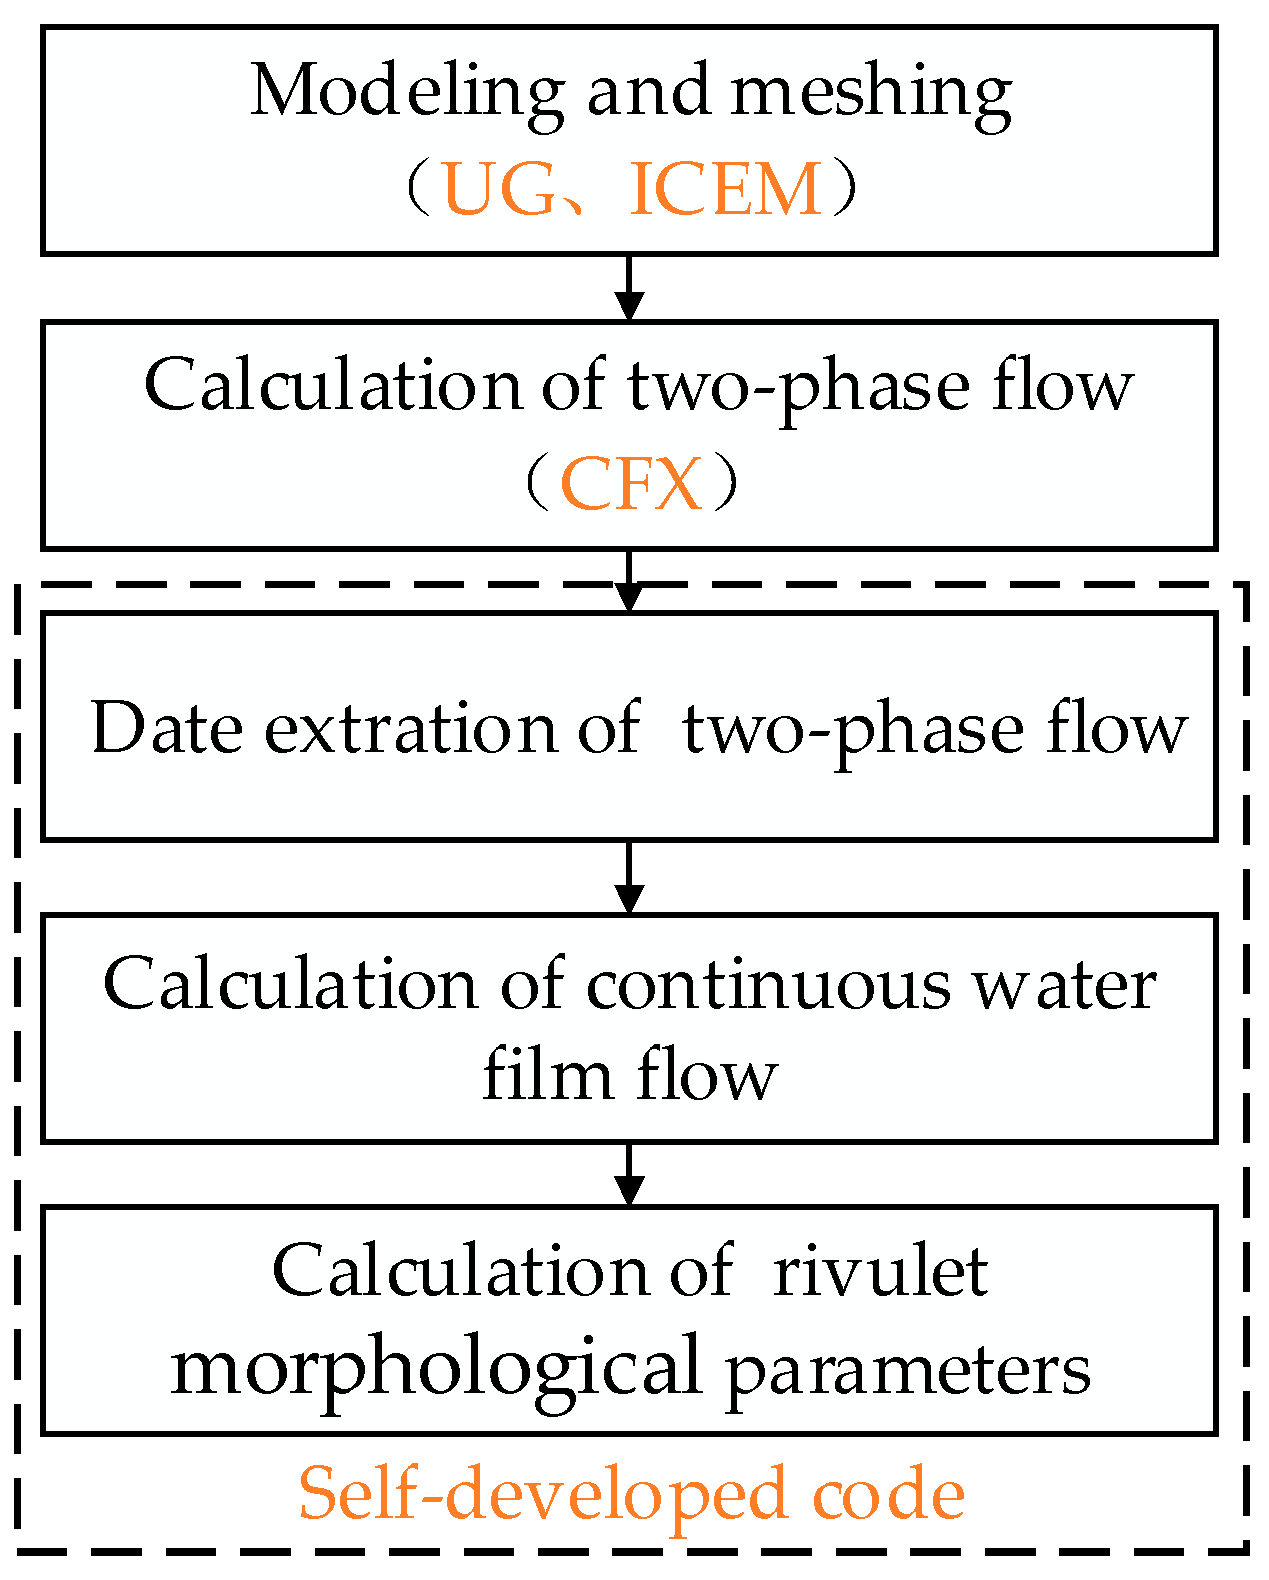
Figure 1. Numerical calculation flowchart.
Aerospace 11 00352 g001
Figure 2. Conservation of mass in the control volume.
Aerospace 11 00352 g002
Figure 3. Conservation of energy in the control volume.
Aerospace 11 00352 g003
Figure 4. Solution flowchart for the flow of continuous water film.
Aerospace 11 00352 g004
Figure 5. Breakup of continuous water film into rivulets.
Aerospace 11 00352 g005
Figure 6. Shape of rivulet flow on spanwise section.
Aerospace 11 00352 g006
Figure 7. Solution flowchart for morphological parameters of rivulet flow.
Aerospace 11 00352 g007
Figure 8. Computational model for two-phase flow.
Aerospace 11 00352 g008
Figure 9. Grids near the airfoil wall.
Aerospace 11 00352 g009
Figure 10. Variation in droplet velocity at a monitoring point in Case 3, with grid quantity.
Aerospace 11 00352 g010
Figure 11. Distribution of water collection coefficient on airfoil surface for different cases.
Aerospace 11 00352 g011
Figure 12. Distribution of water film height on the airfoil surface at different times in Case 1.
Aerospace 11 00352 g012
Figure 13. Distribution of water film flow velocity on the airfoil surface at different times in Case 1.
Aerospace 11 00352 g013
Figure 14. Distribution of air shear force on the airfoil surface for different Cases.
Aerospace 11 00352 g014
Figure 15. Comparison of simulation and experimental results for the height of the water film in Case 1.
Aerospace 11 00352 g015
Figure 16. Comparison of simulation and experimental results for the height of the water film in Case 2.
Aerospace 11 00352 g016
Figure 17. Comparison of simulation and experimental results for the height of the water film in Case 3.
Aerospace 11 00352 g017
Figure 18. Comparison of simulation and experimental results for the height of a rivulet at different contact angles.
Aerospace 11 00352 g018
Figure 19. Comparison of simulation and experimental results for the width of a rivulet at different contact angles.
Aerospace 11 00352 g019
Table 1. The incoming flow condition parameters.
CaseU (m/s)T (K)LWC (g/m3)MVD (μm)AOA (°)
115293.1510200
220
325
Disclaimer/Publisher’s Note: The statements, opinions and data contained in all publications are solely those of the individual author(s) and contributor(s) and not of MDPI and/or the editor(s). MDPI and/or the editor(s) disclaim responsibility for any injury to people or property resulting from any ideas, methods, instructions or products referred to in the content.