
Forced Vibration Induced by Dynamic Response Under Different Inlet Distortion Intensities


Abstract
:1. Introduction
2. Methodology
2.1. Research Subject
2.2. Numerical Setting
2.3. Validation
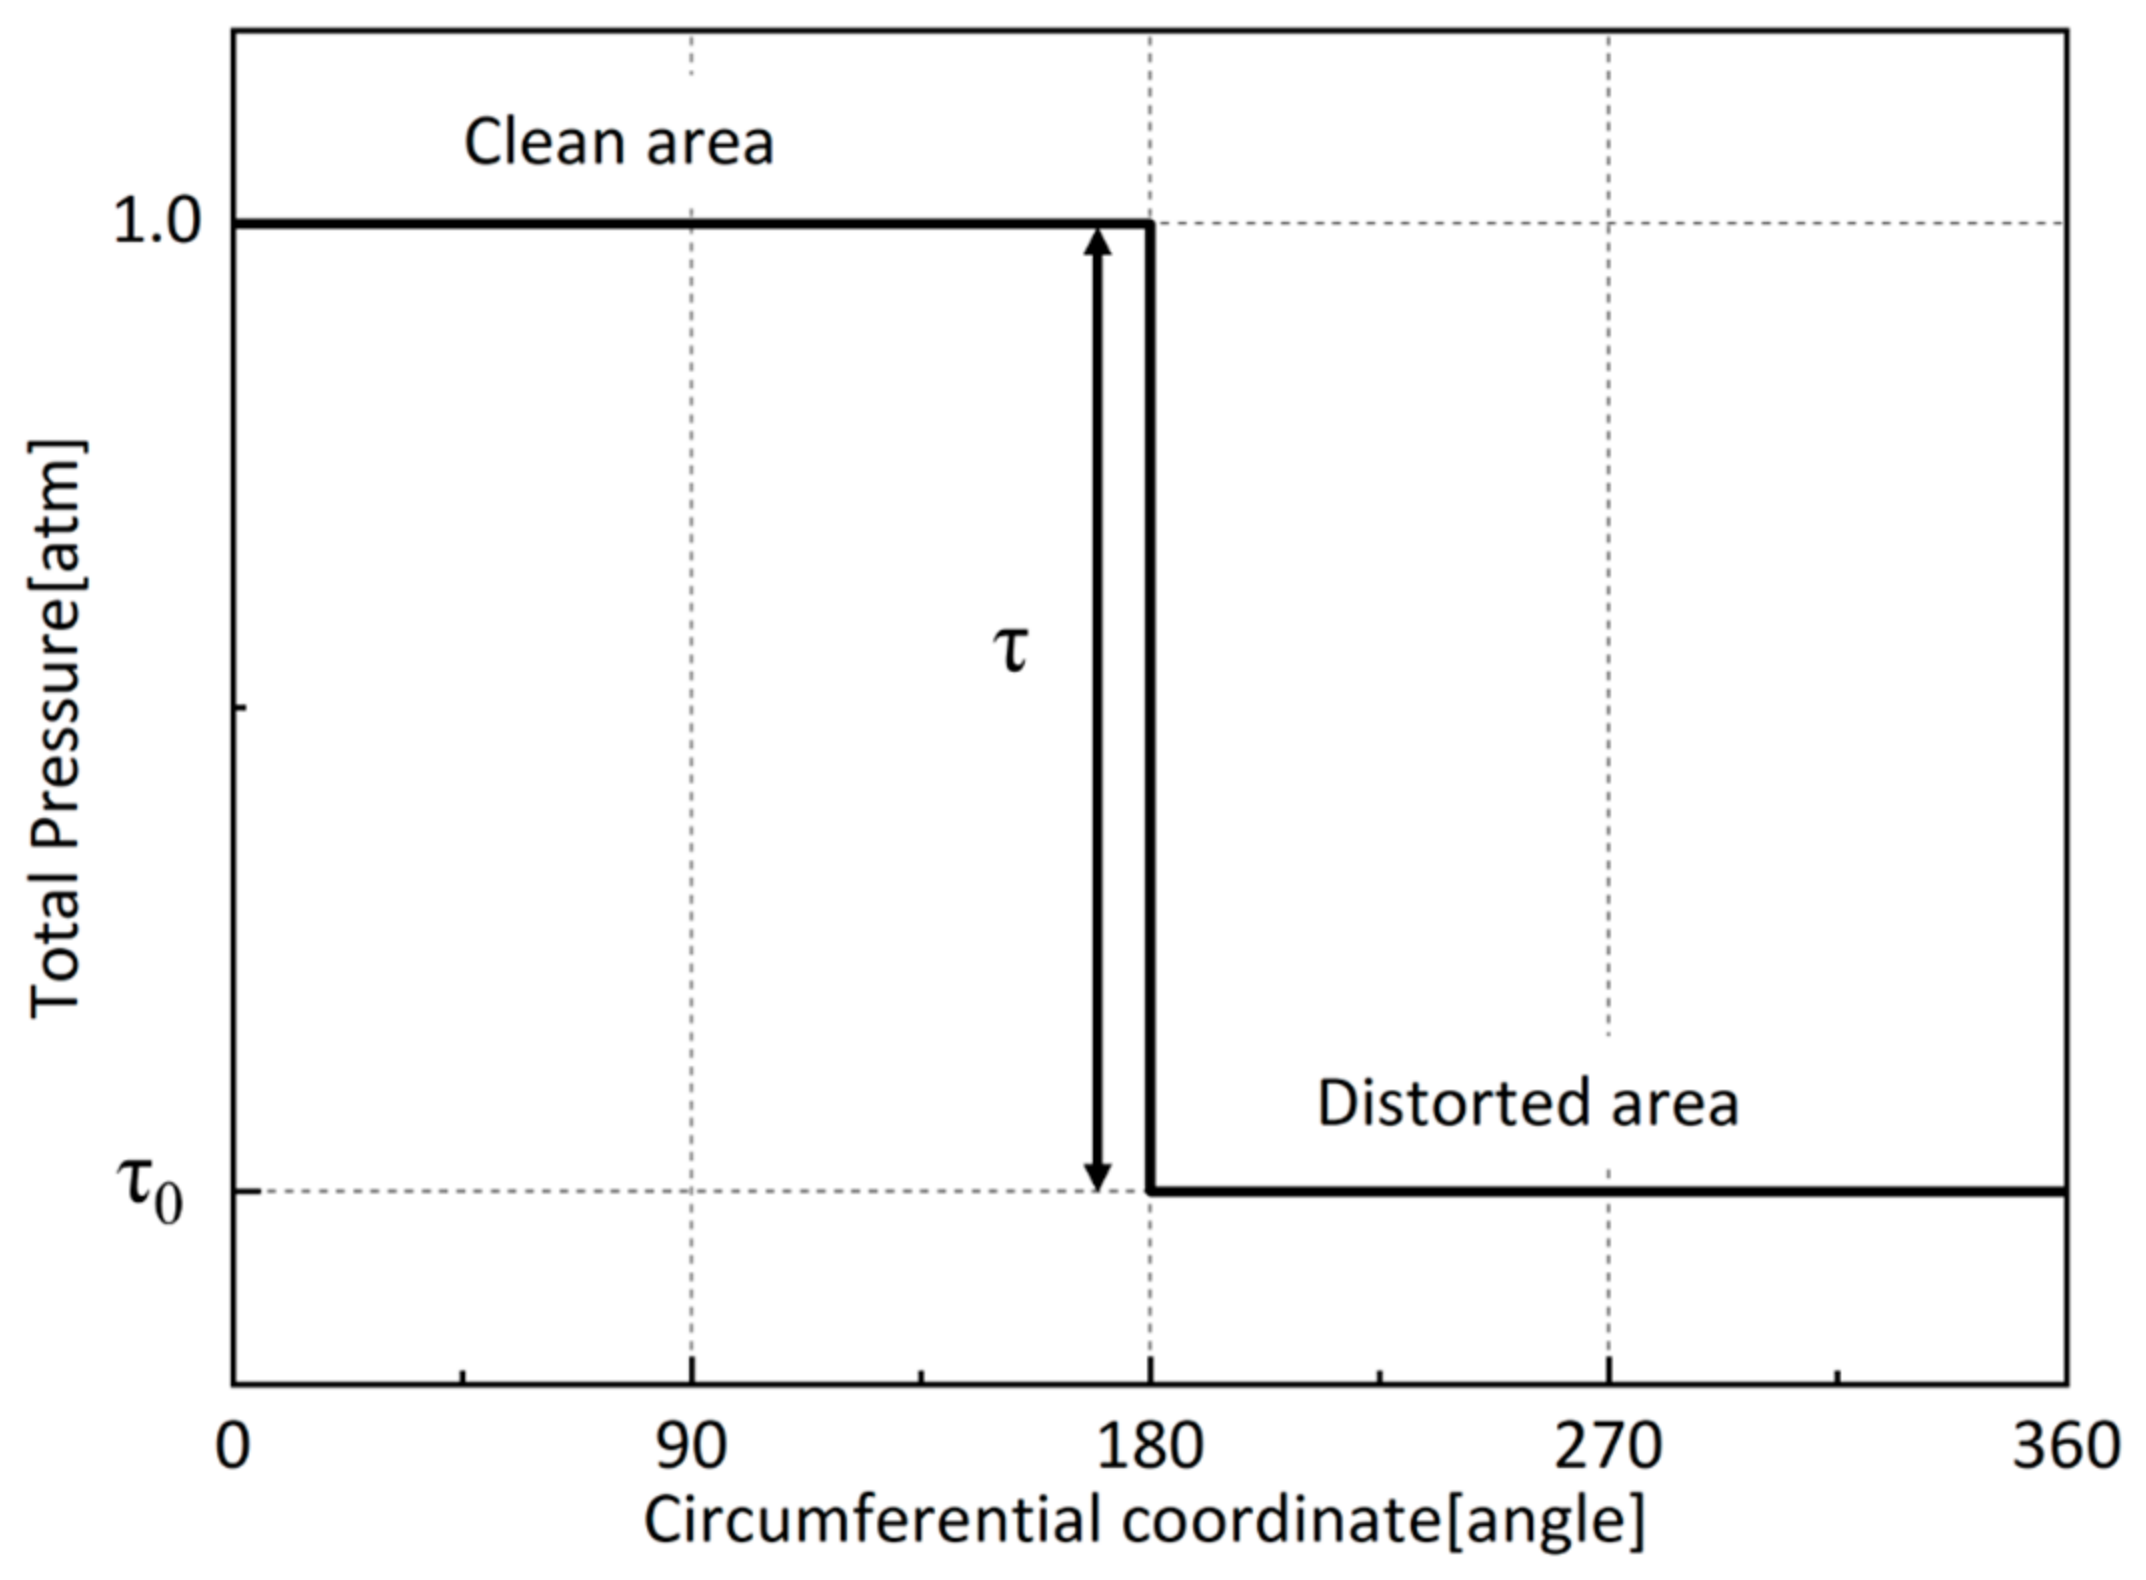
2.4. Distortion Extent and Coefficient Selection
3. Results and Discussion
3.1. Modal Force Analysis Under Different Distortion Intensities
3.2. Excitation Variation During Dynamic Response Process
3.2.1. Variation in 2EO at TE
3.2.2. Dynamic Response Analysis
3.3. Relationship Between 2EO Produced by Dynamic Response and the Distortion Intensity
4. Conclusions
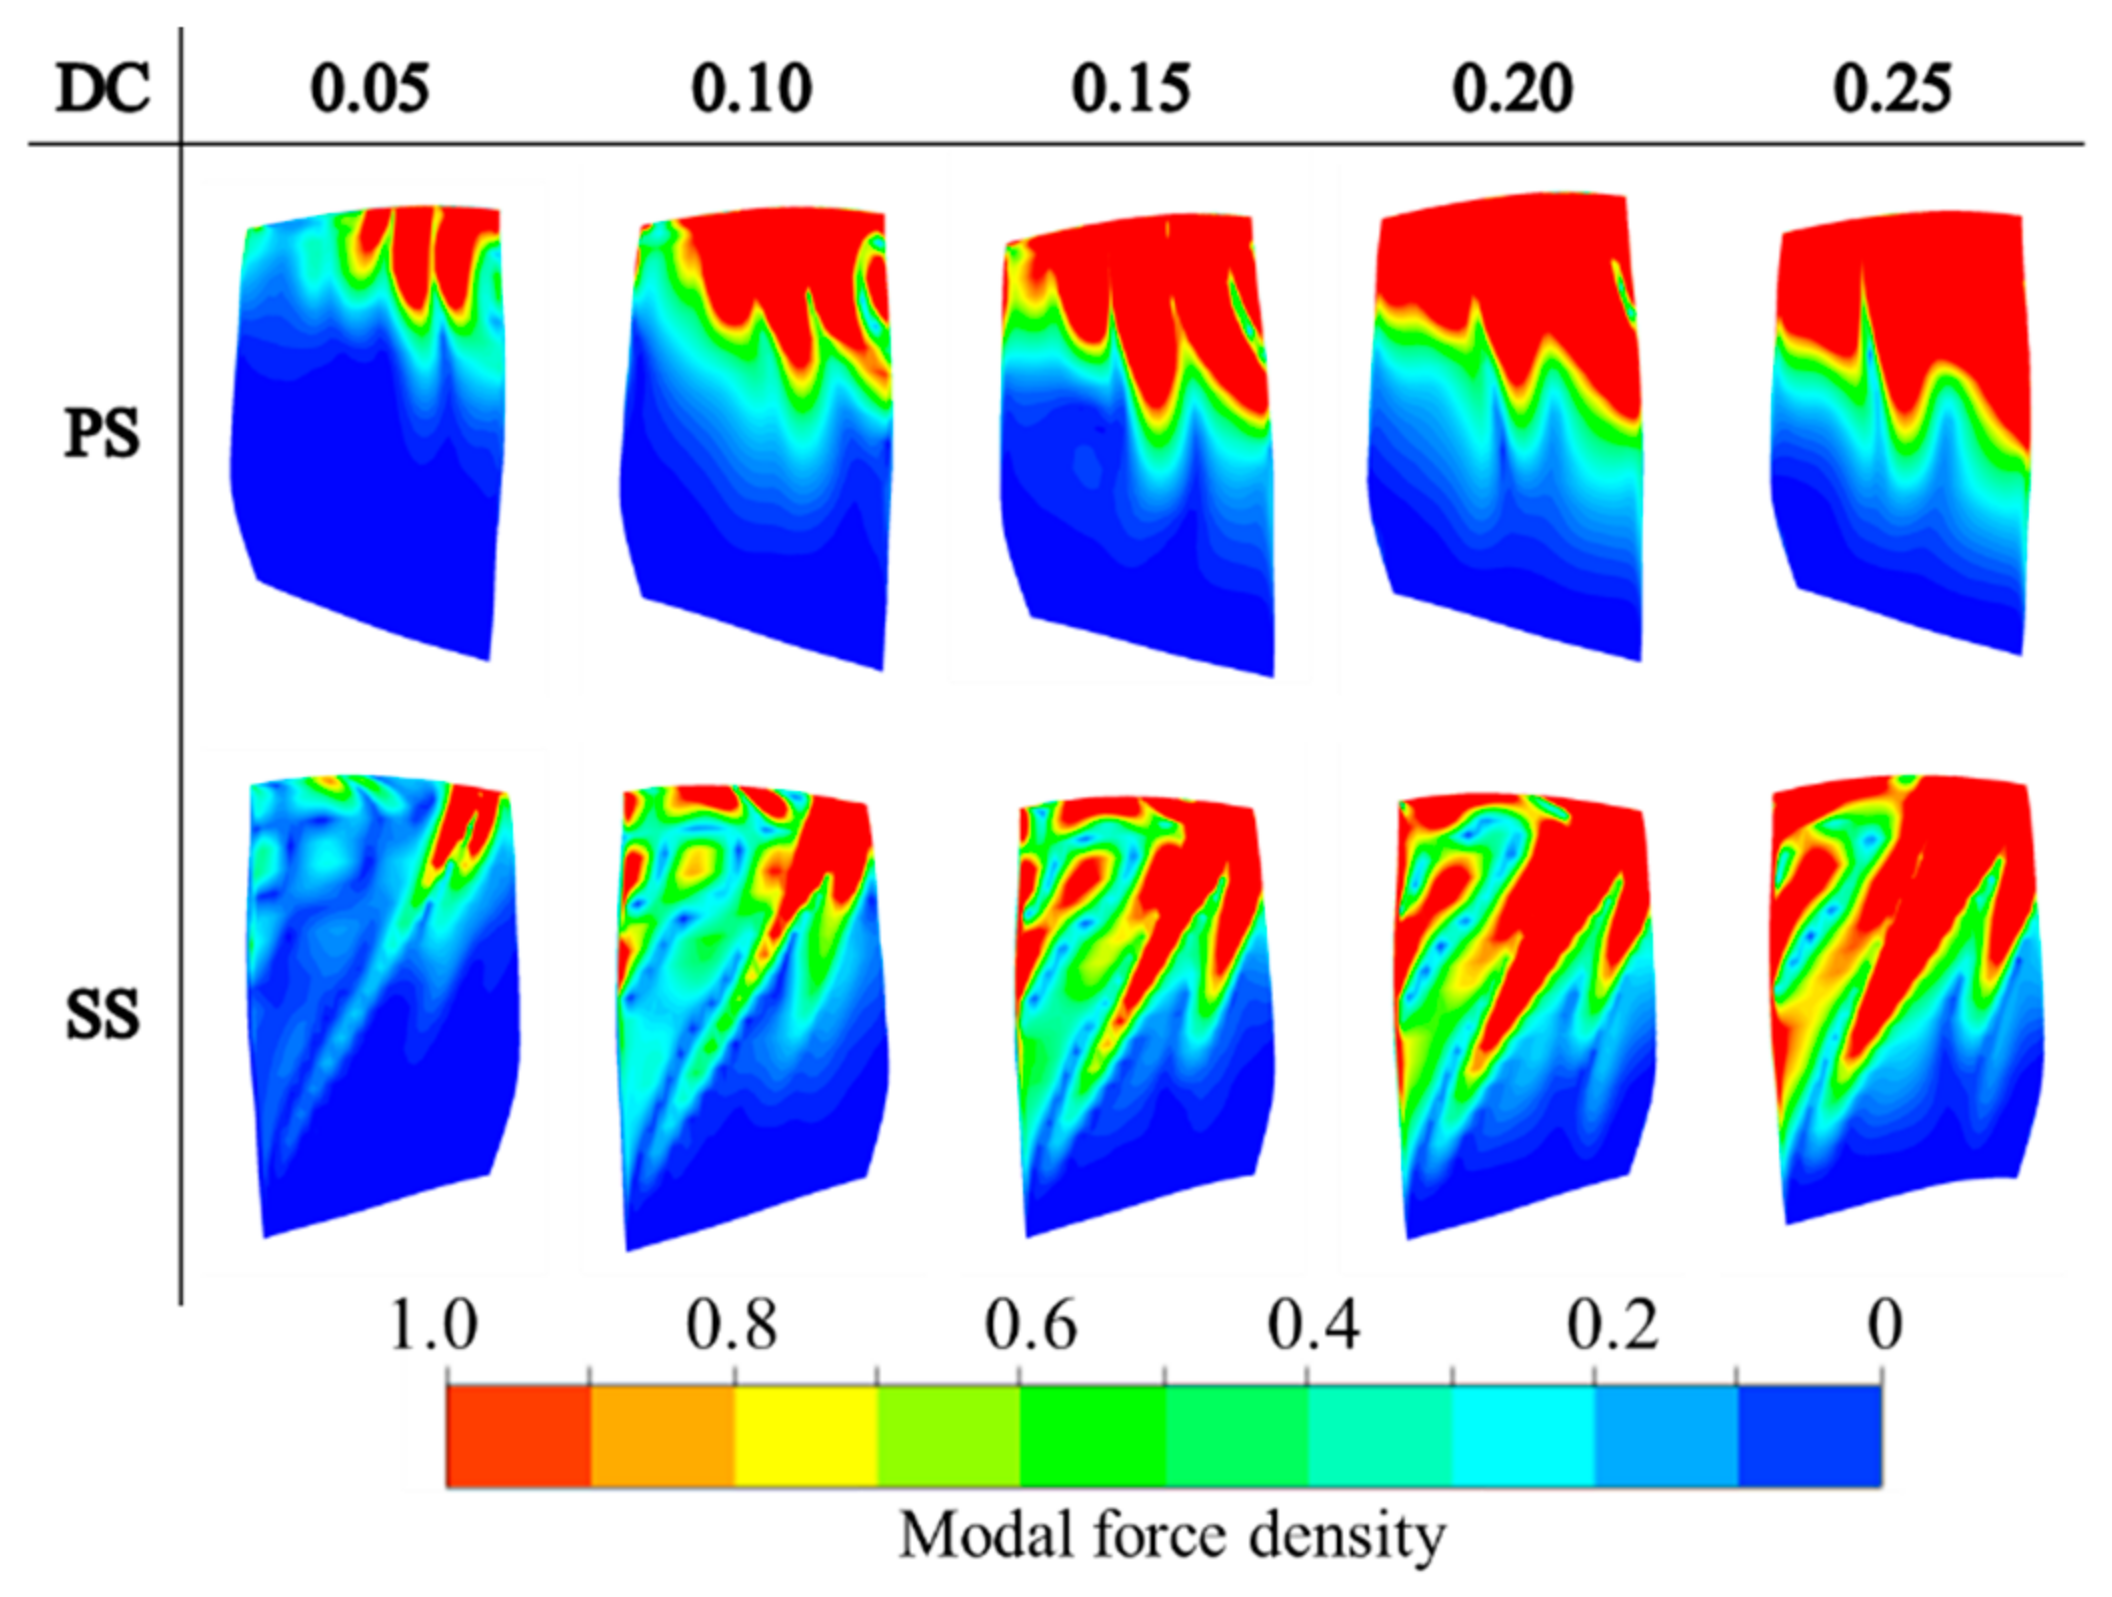
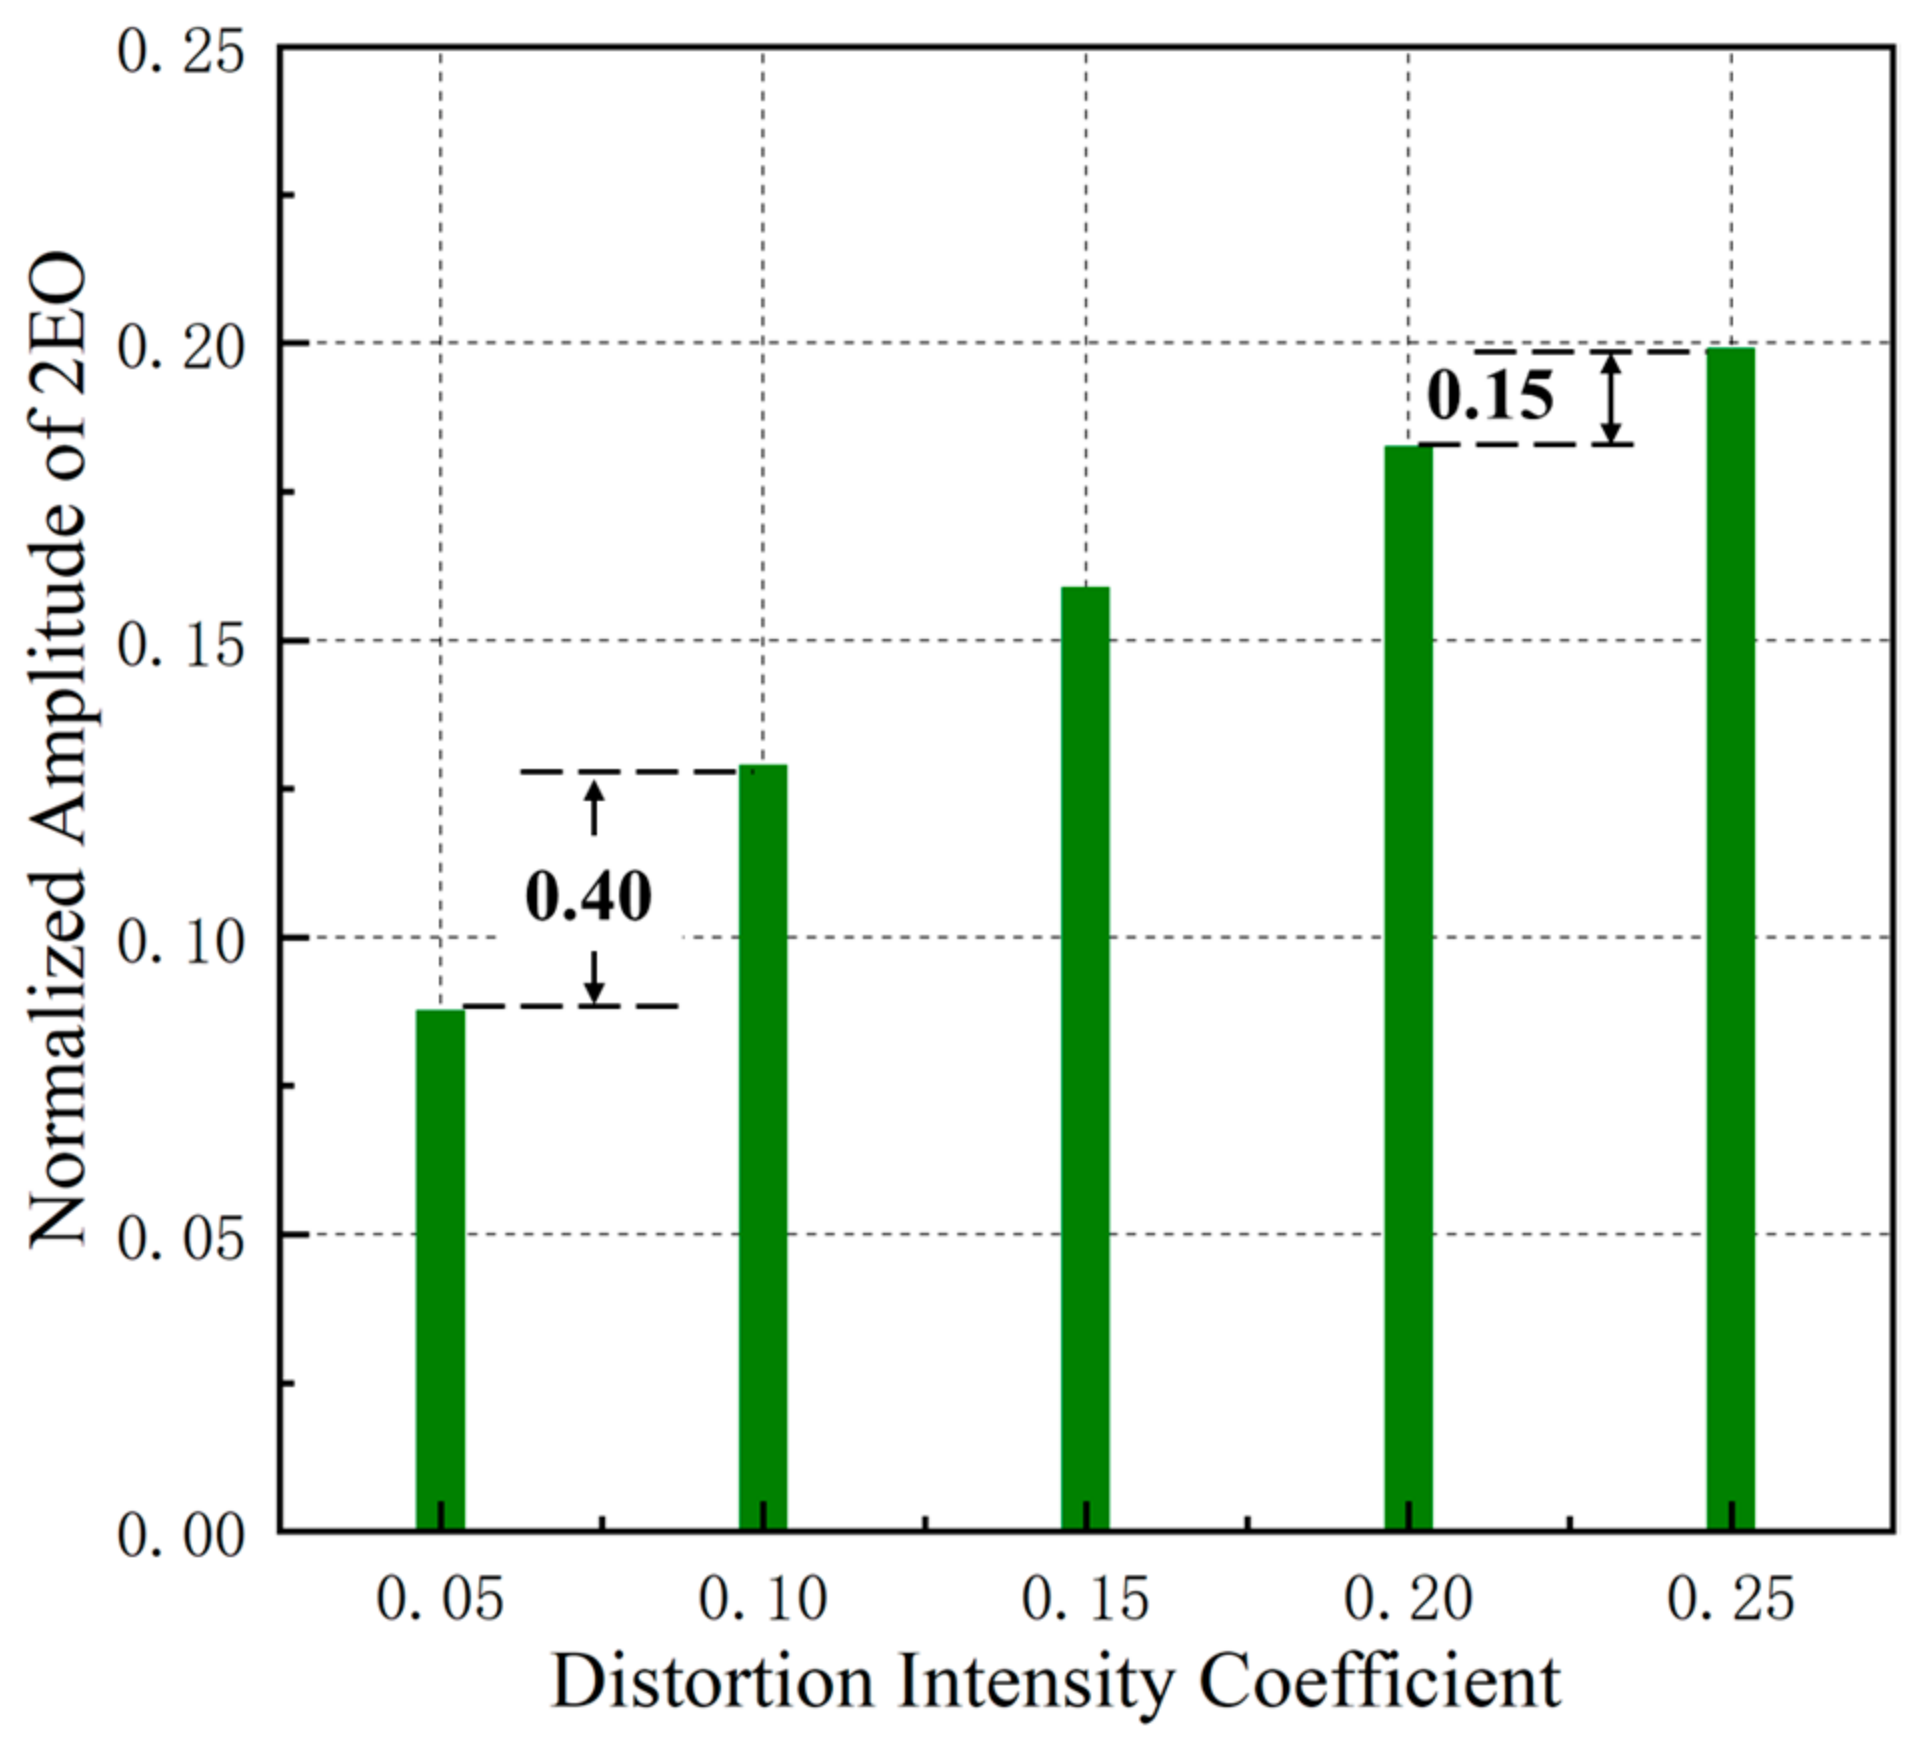
- In the context of this investigation, minimal 2EO is perceived at the LE in the distortion flow field spanning 180-degrees. However, as the fluid passes through the blade channel, the 2EO amplitude increases, especially in the blade tip area. This suggests the existence of excitation within the blade channel that contributes to the amplified 2EO amplitude. At the same time, the amplitude of the modal force increases as the distortion intensity increases. However, the rate of growth gradually decreases. For distortion intensities ranging from 0.05 to 0.10, the modal force amplitude increases by approximately 1 unit. On the other hand, the increase in modal force amplitude between 0.20 and 0.25 is only about 0.2 units.
- In the context of this investigation, minimal 2EO is perceived at the LE in the distortion flow field spanning 180 degrees. Nevertheless, as the fluid traverses the blade passage, the 2EO amplitude escalates notably, particularly in the blade tip vicinity. This indicates the presence of excitation within the blade channel that contributes to the enhanced 2EO amplitude. Simultaneously, the modal force amplitude rises with an increase in distortion intensity. However, the rate of growth progressively diminishes. For distortion intensities ranging from 0.05 to 0.10, the modal force amplitude elevates by approximately 1 unit. Conversely, distortion intensities between 0.20 and 0.25 result in a more modest rise in the modal force amplitude, approximately around 0.2 units.
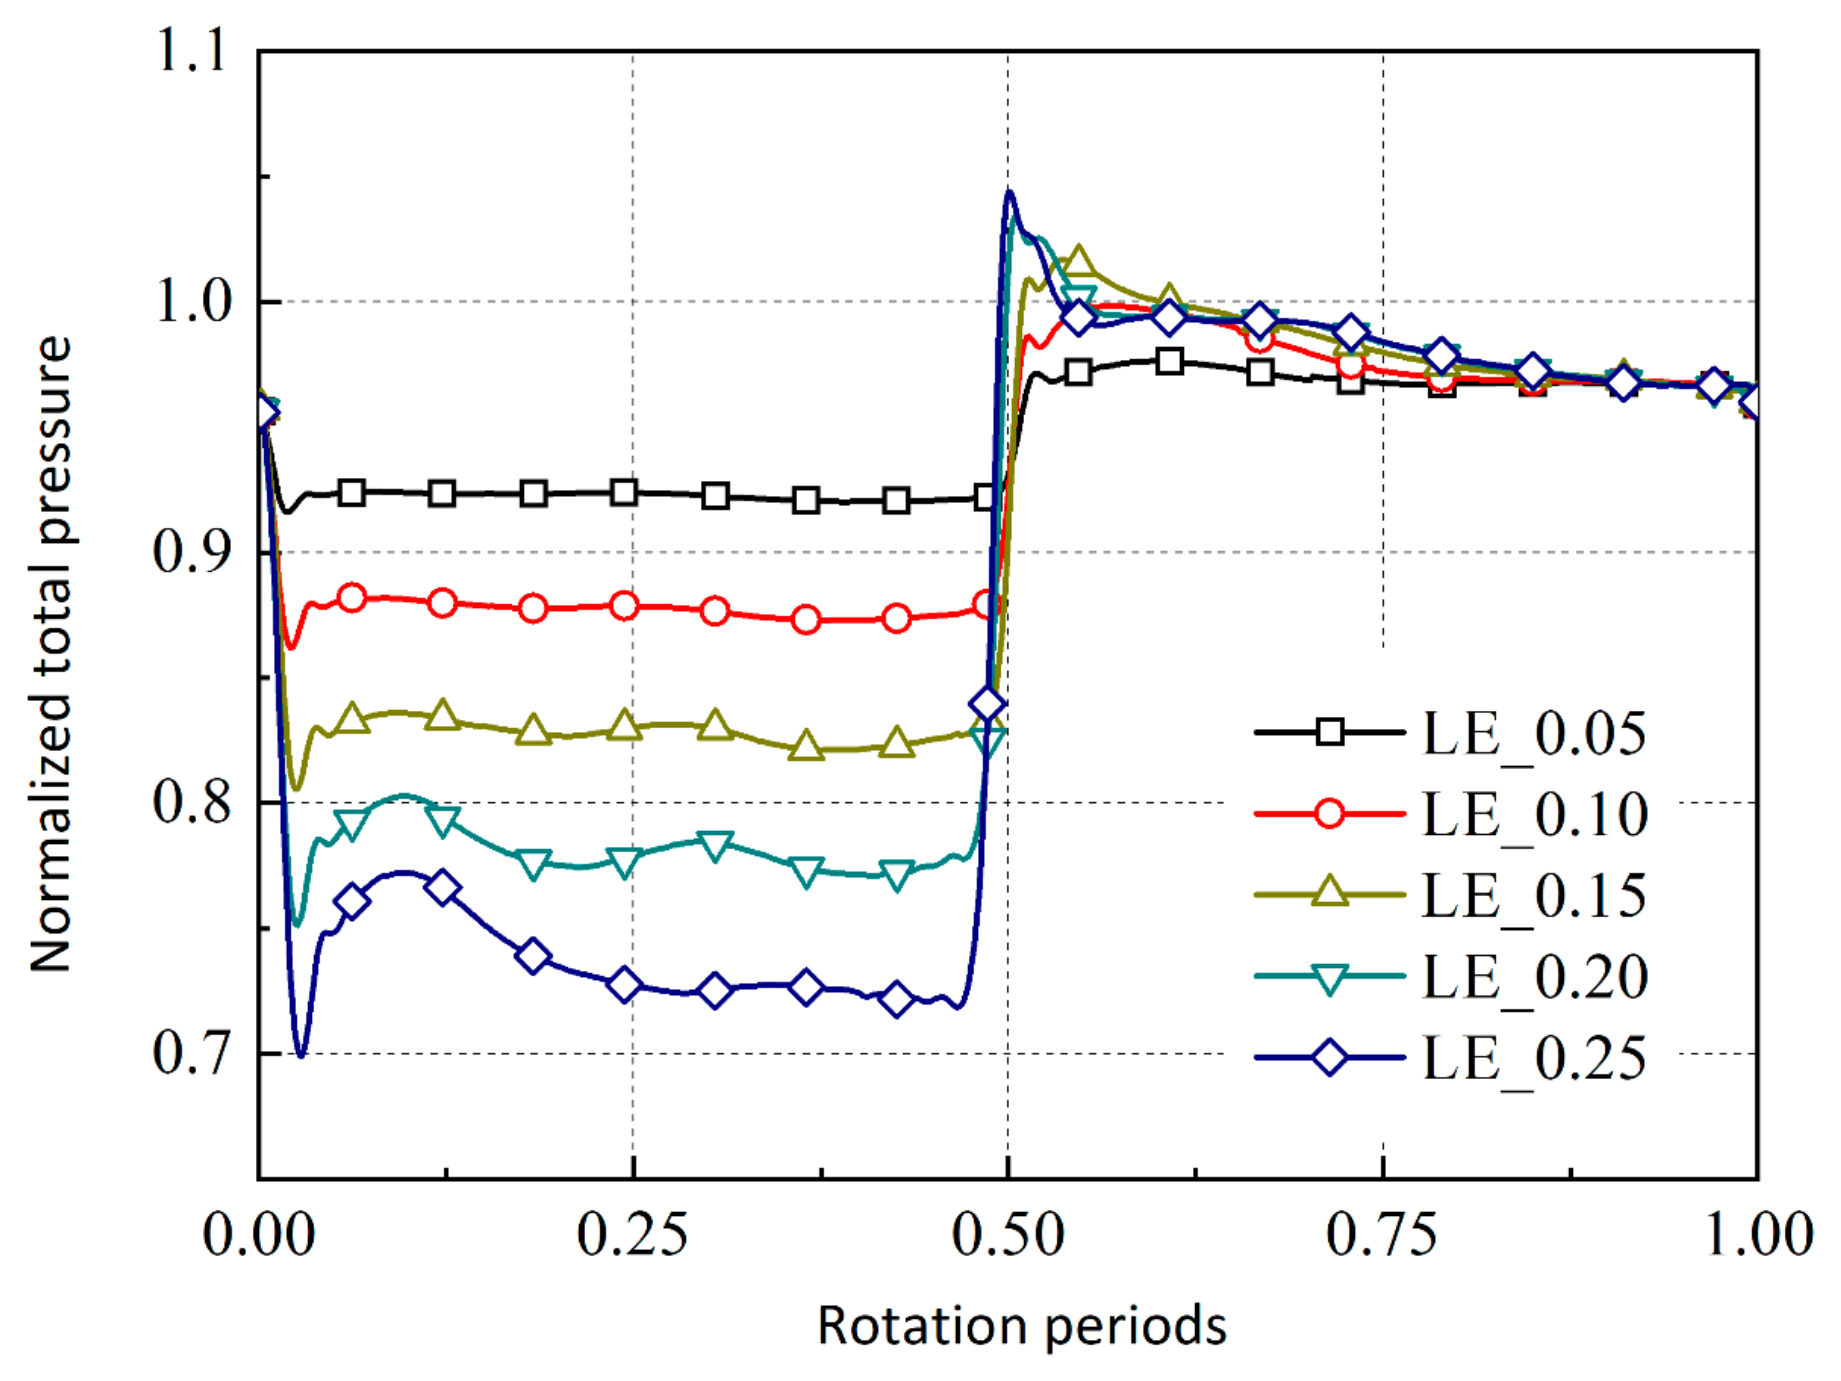
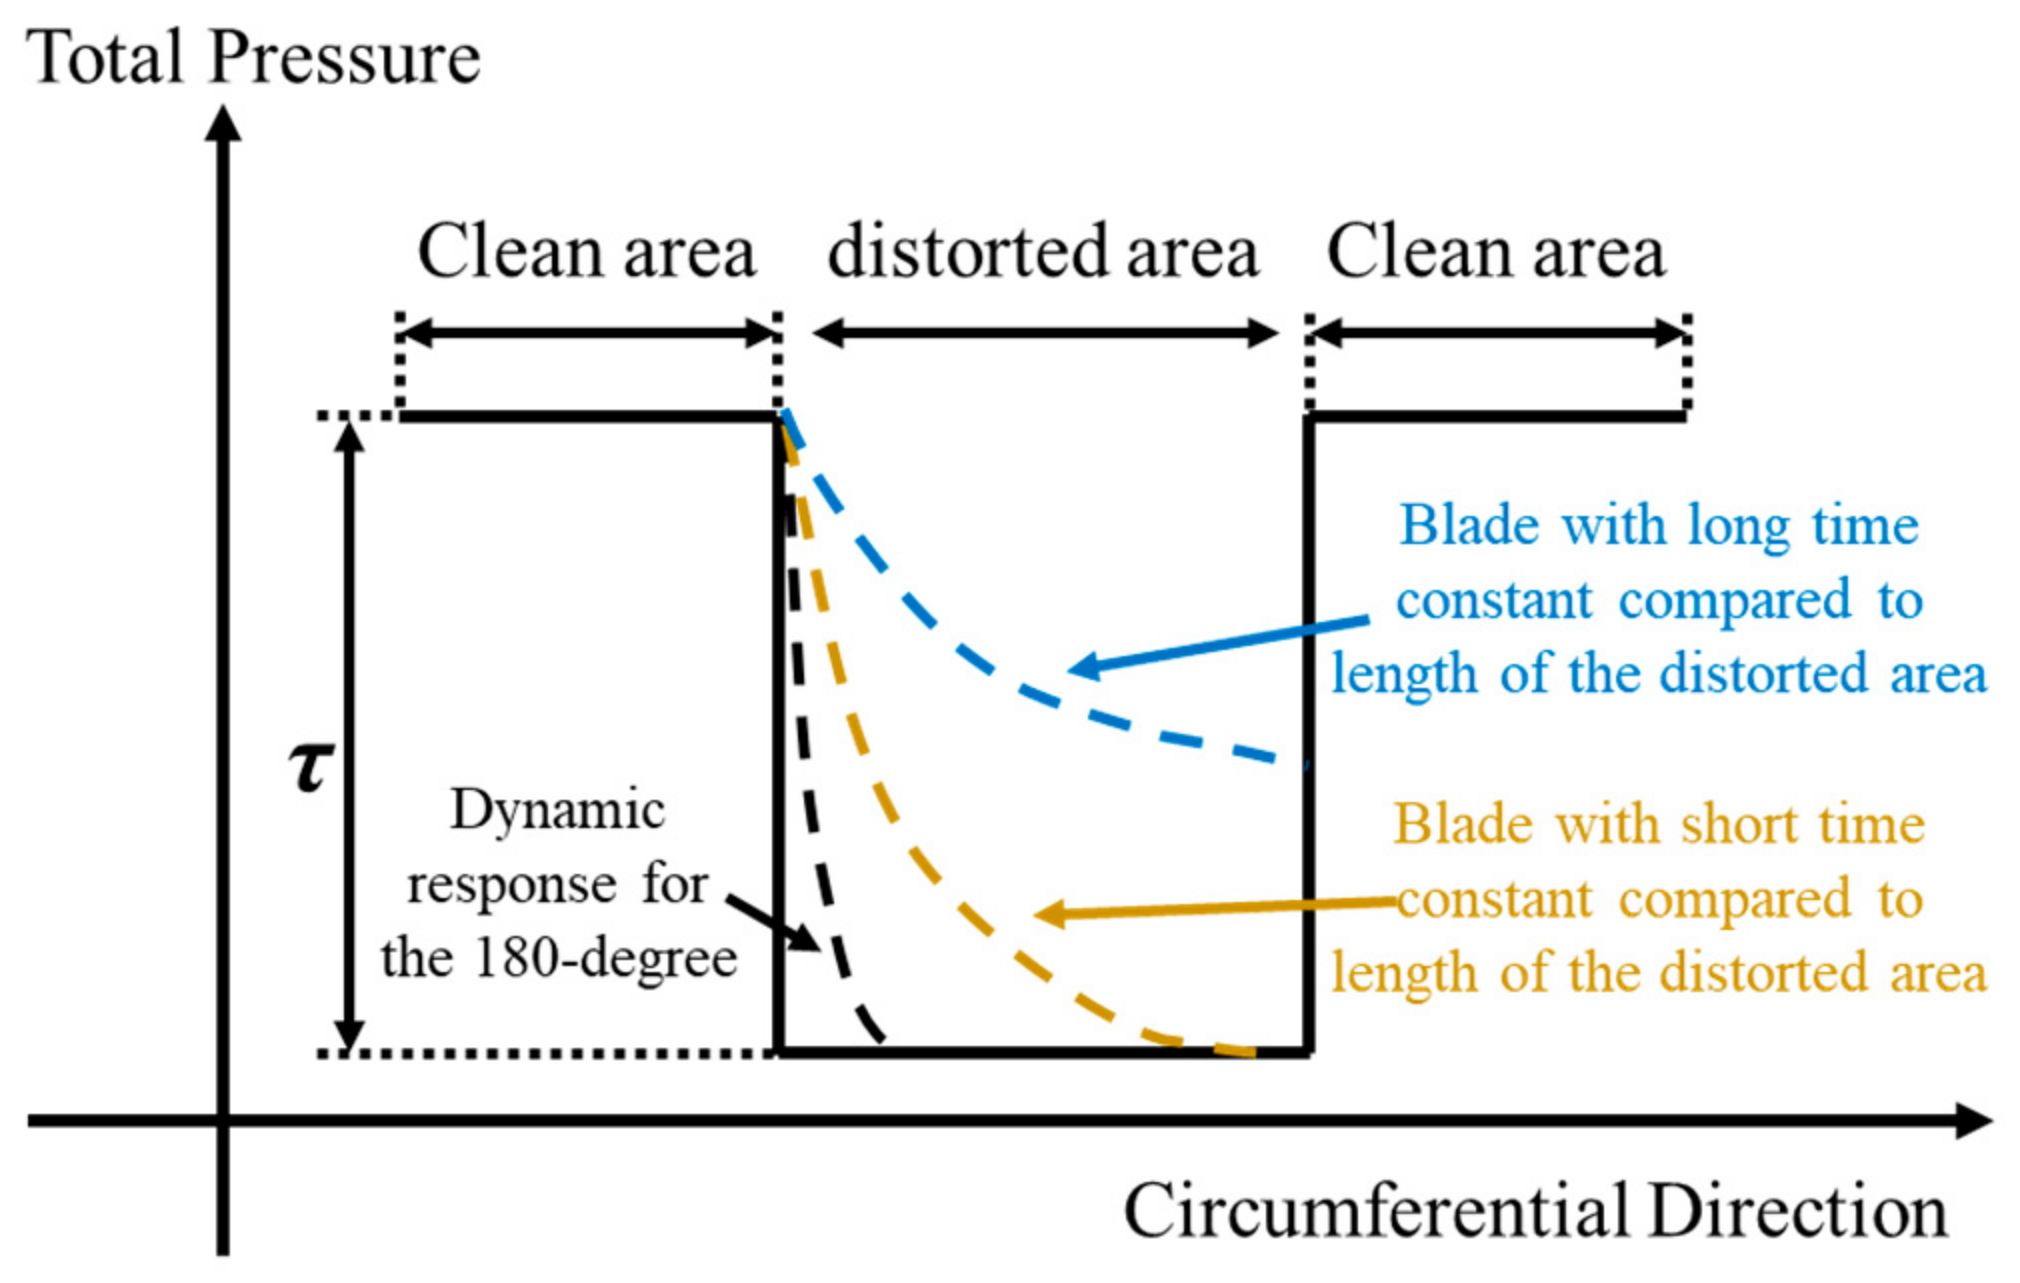
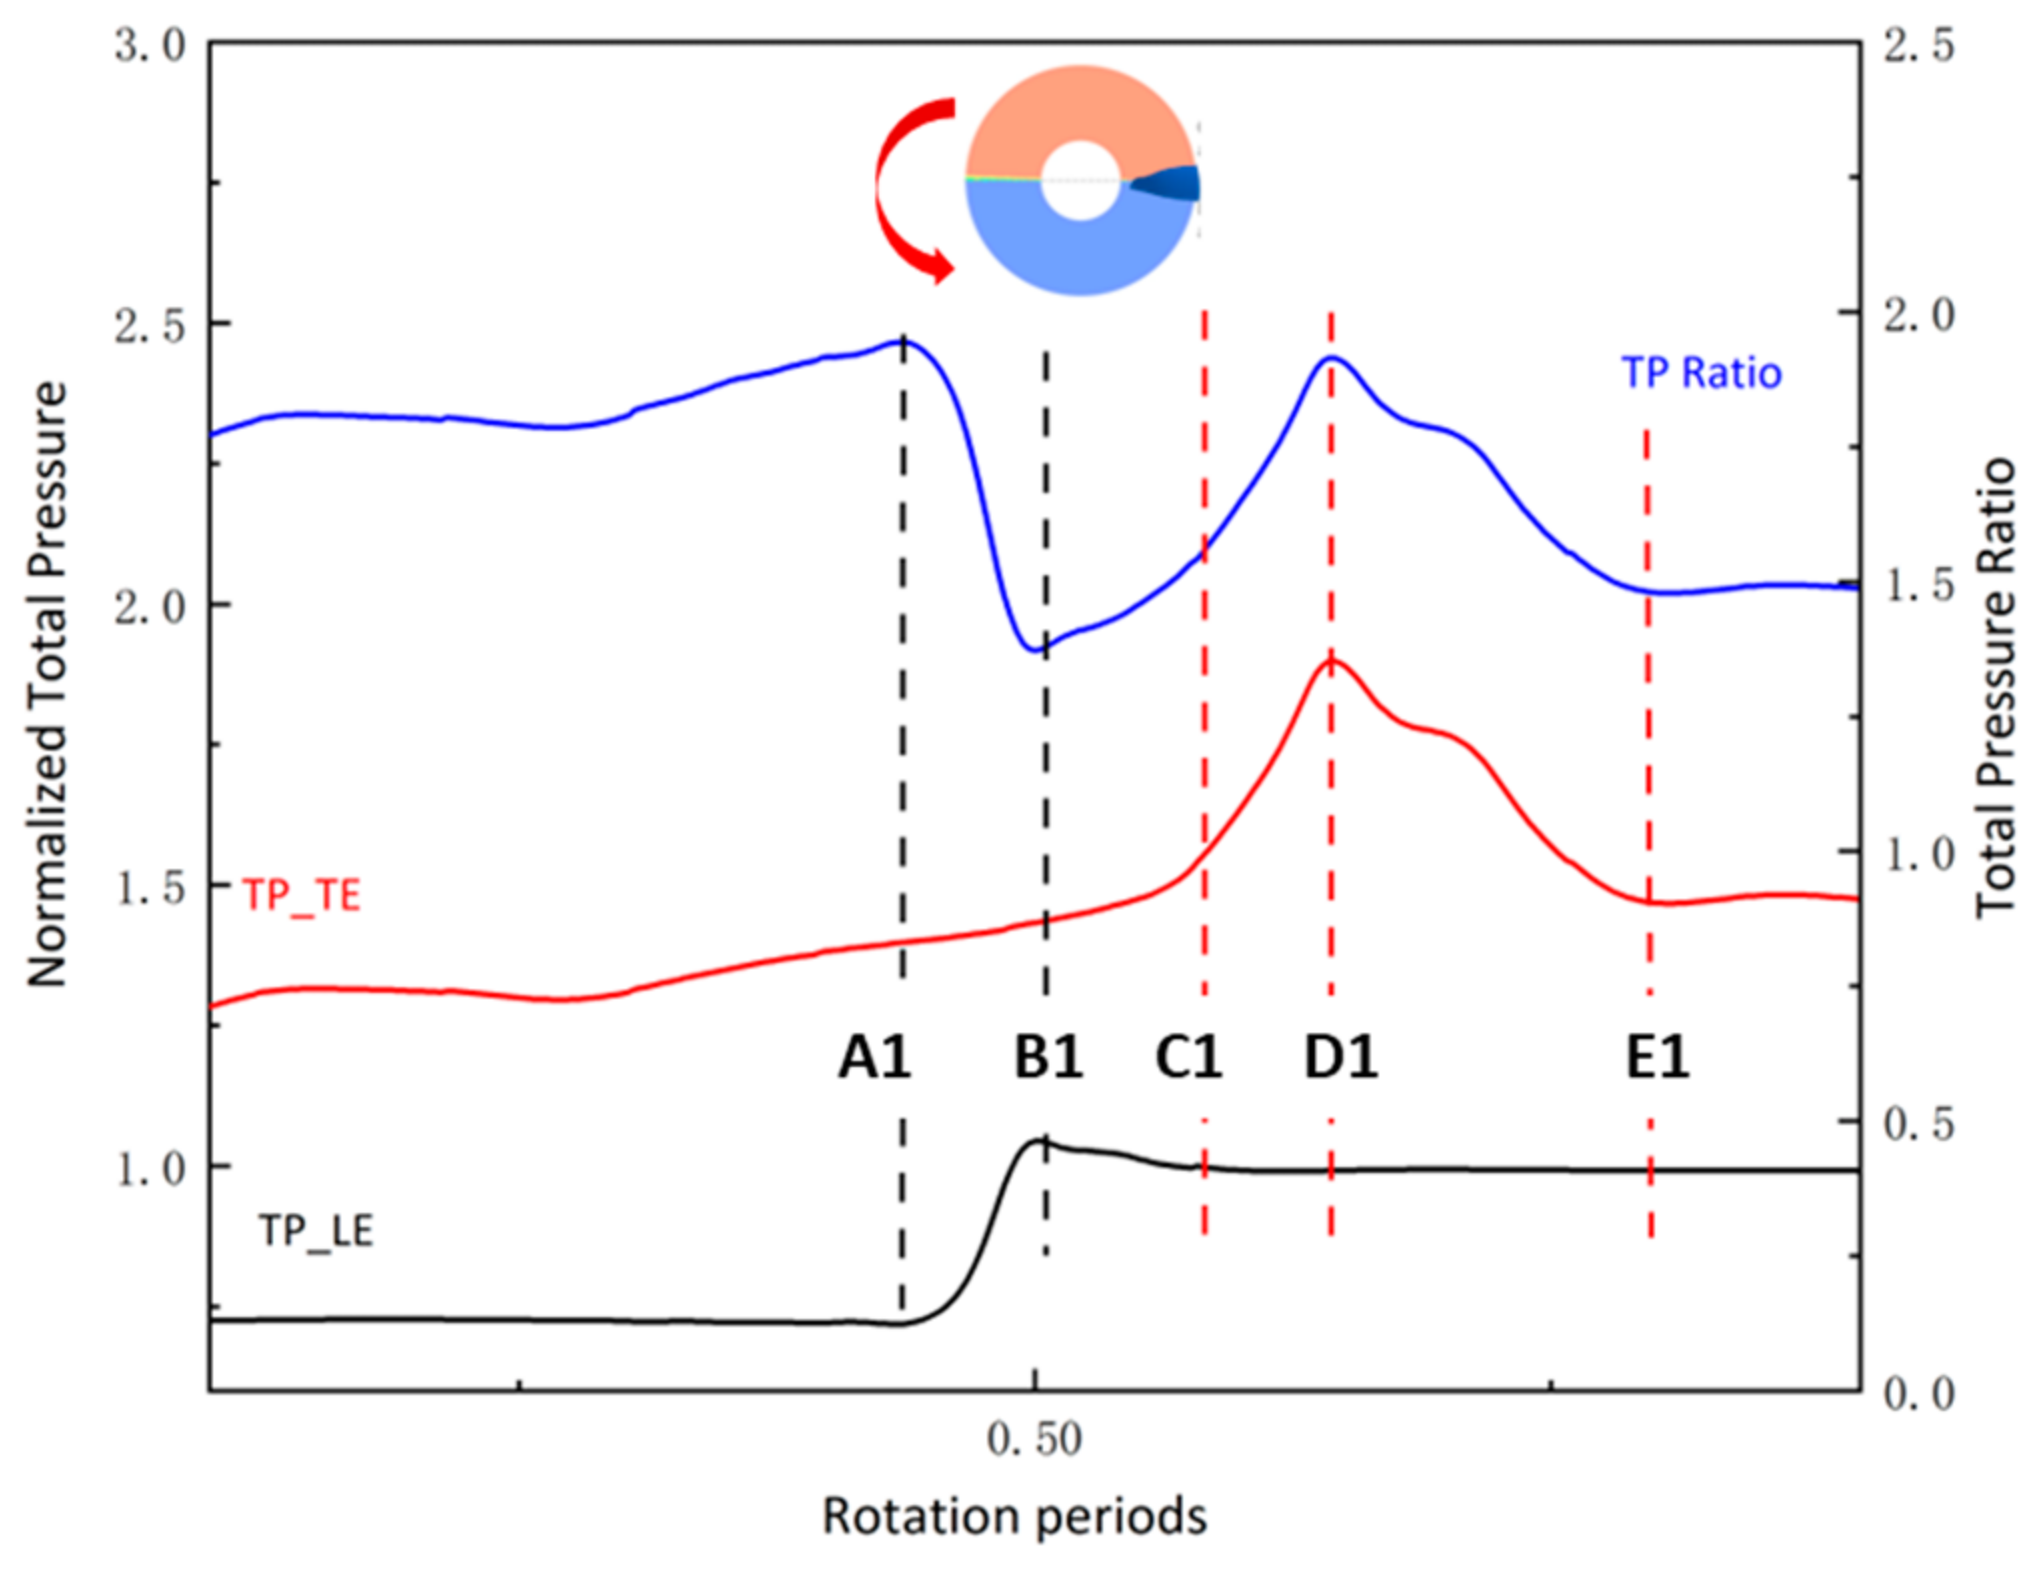
- During the dynamic response, the pressure at the LE and TE changes asynchronously, resulting in the abrupt change in the total pressure ratio, and thus the pressure difference change in the fluid in the flow channel produces 2EO. As the distortion intensity increases, the fluctuations in the total pressure ratio at the interface between the distorted area and clean area become more prominent but gradually approach a limit. Consequently, the amplification of the 2EO amplitude also progresses at a diminished rate, exhibiting consistency with the changes observed in the modal forces.
- The change in the second-order excitation amplitude of the dynamic response process is consistent with the change in the modal force, which strongly proves that the main excitation source within the 180-degree distortion extent is the 2EO generated in the blade channel. At the same time, the distortion intensity directly affects the dynamic response process and thus affects the amplitude of the blade forced vibration. Therefore, the aeroelasticity of fan blades caused by flow distortion is not only affected by the flow distortion, but also by the dynamic response in the blade channel. The low-order excitation amplitude generated by the dynamic response is related to the intensity of the flow distortion. This has important reference value for subsequent research on the suppression of the excitation source.
Author Contributions
Funding
Data Availability Statement
Conflicts of Interest
References
- Smith, L.H. Wake Ingestion Propulsion Benefit. J. Propuls. Power 1993, 9, 74–82. [Google Scholar] [CrossRef]
- Plas, A.P.; Sargeant, M.A.; Crichton, D.; Greitzer, E.M.; Hynes, T.P.; Hall, C.A. Performance of a Boundary Layer Ingesting (BLI) Propulsion System. In Proceedings of the 45th AIAA Aerospace Sciences Meeting and Exhibit, Reno, NV, USA, 8–11 January 2007. AIAA Paper No. 2007-450. [Google Scholar]
- Tse, T.S.; Hall, C.A. Aerodynamics and Power Balance of a Distributed Aft-Fuselage Boundary Layer Ingesting Aircraft. Aerospace 2023, 10, 122. [Google Scholar] [CrossRef]
- Zhao, X.; Van Hoorn, P.; Yao, H.-D.; Alderman, J. Parameter Sensitivity Study on Inflow Distortion of Boundary Layer Ingested Turbofans. Aerospace 2022, 9, 426. [Google Scholar] [CrossRef]
- Mistry, C.S.; Pradeep, A.M. Investigations on the Effect of Inflow Distortion on the Performance of a High Aspect Ratio-Low Speed Contra Rotating Fan Stage. In Proceedings of the ASME Turbo Expo 2013: Turbine Technical Conference and Exposition, San Antonio, TX, USA, 3–7 June 2013; ASME Paper, No. GT2013-94311. [Google Scholar]
- Greitzer, E.M.; Tan, C.S.; Graf, M.B. Internal Flow: Concepts and Applications; Cambridge University Press: Cambridge, UK, 2004; Volume 12, pp. 615–700. [Google Scholar]
- Zhao, H.; Du, J.; Zhang, W.; Zhang, H.; Nie, C. A Review on Theoretical and Numerical Research of Axial Compressor Surge. J. Therm. Sci. 2023, 32, 254–263. [Google Scholar] [CrossRef]
- Fidalgo, V.J.; Hall, C.A.; Colin, Y. A Study of Fan-Distortion Interaction Within the NASA Rotor 67 Transonic Stage. J. Turbomach. 2021, 134, 051011. [Google Scholar] [CrossRef]
- Mårtensson, H. Harmonic Forcing from Distortion in a Boundary Layer Ingesting Fan. Aerospace 2021, 8, 58. [Google Scholar] [CrossRef]
- Manwaring, S.R.; Fleeter, S. Inlet distortion generated periodic aerodynamic rotor response. J. Turbomach. 1990, 112, 298–307. [Google Scholar] [CrossRef]
- Bakhle, M.A.; Reddy, T.S.R.; Coroneos, R.M. Forced response analysis of a fan with boundary layer inlet distortion. In Proceedings of the 50th AIAA/ASME/SAE/ASEE Joint Propulsion Conference, Cleveland, OH, USA, 28–30 July 2014. [Google Scholar]
- Stuart, M. Forced Response Prediction for Industrial Gas Turbine Blades. Ph.D. Thesis, University of Durham, Durham, UK, 2006. [Google Scholar]
- Duan, W.; Qiao, W.; Chen, W.; Zhao, X. Effects of Freestream Turbulence, Reynolds Number and Mach Number on the Boundary Layer in a Low Pressure Turbine. J. Therm. Sci. 2023, 32, 1393–1406. [Google Scholar] [CrossRef]
- Hirai, K.; Kodama, H.; Nozaki, O.; Kikuchi, K.; Tamura, A.; Matsuo, Y. Unsteady three-dimensional analysis of inlet distortion in turbomachinery. In Proceedings of the 33rd Joint Propulsion Conference and Exhibit, Seattle, WA, USA, 6–9 July 1997; pp. 97–2735. [Google Scholar]
- Zhu, Q.; Zhou, L.; Wen, J.; Liu, T.; Zhang, J.; Tang, H.; Zhang, H. Laminar flow over a rectangular cylinder experiencing torsional flutter: Dynamic response, forces and coherence modes. Phys. Fluids 2023, 35, 093610. [Google Scholar] [CrossRef]
- Waite, J.J.; Kielb, R.E. The impact of blade loading and unsteady pressure bifurcations on low-pressure turbine flutter boundaries. J. Turbomach. 2016, 138, 041002. [Google Scholar] [CrossRef]
- Newton, P.; Copeland, C.; Martinez-Botas, R.; Seiler, M. An audit of aerodynamic loss in a double entry turbine under full and partial admission. Int. J. Heat Fluid Flow 2012, 33, 70–80. [Google Scholar] [CrossRef]
- May, D.; Chew, J.W. Response of a disk cavity flow to gas turbine engine transients. In Proceedings of the ASME Turbo Expo, Glasgow, UK, 14–18 June 2010; Volume 4, Heat Transfer, Parts A and B. pp. 1113–1122. [Google Scholar]
- Greitzer, E.M. Surge and Rotating Stall in Axial Flow Compressors-Part I: Theoretical Compression System Model. J. Eng. Power 1976, 98, 190–198. [Google Scholar] [CrossRef]
- Greitzer, E.M. Surge and Rotating Stall in Axial Flow Compressors-Part II: Experimental Results and Comparison with Theory. J. Eng. Power 1976, 98, 199–217. [Google Scholar] [CrossRef]
- Cousins, W.T. The Dynamic of Stall and Surge Behavior in Axial-Centrifugal Compressors. Ph.D. Thesis, Virginia Polytechnic Institute and State University, Blacksburg, VA, USA, 1997. [Google Scholar]
- Cousins, W.T.; Davis, M.W. The influence of the characteristics of a centrifugal compressor on system stability and distortion response. In Proceedings of the ASME Turbo Expo, Copenhagen, Denmark, 11–15 June 2012; Volume 1, pp. 37–49. [Google Scholar]
- Cheng, R.; Ekerol, H.; Pailly, J.W. Relative Flow Structure at Exit from An Axial Compressor Rotor in Rotating Stall. In Proceedings of the ASME Turbo Expo, Amsterdam, The Netherlands, 4–7 June 1984. [Google Scholar]
- Fang, Y.; Sun, D.; Xu, D.; He, C.; Sun, X. Rapid Prediction of Compressor Rotating Stall Inception Using Arnoldi Eigenvalue Algorithm. AIAA J. 2023, 61, 3566–3578. [Google Scholar] [CrossRef]
- Pan, T.; Yan, Z.; Lu, H.; Li, Q. Numerical investigation on the forced vibration induced by the low engine order under boundary layer ingestion condition. Aerosp. Sci. Technol. 2021, 115, 106802. [Google Scholar] [CrossRef]
- Pan, T.; Yan, Z.; Lu, H.; Li, Q.; Kielb, R.E. Forced Response Induced by Low Engine Order Under Circumferential Inlet Distortions with Different Extents. J. Turbomach. 2023, 145, 041012. [Google Scholar] [CrossRef]
- Gelder, T.F.; Schmidt, J.F.; Suder, K.L.; Hathaway, M.D. Design and Performance of Controlled-Diffusion Stator Compared with Original Double-Circular-Arc Stator; SAE Technical Papers; SAE International: Warrendale, PA, USA, 1987. [Google Scholar]
- Suder, K.L.; Celestina, M.L. Experimental and Computational Investigation of the Tip Clearance Flow in a Transonic Axial Compressor Rotor. ASME J. Turbomach. 1996, 118, 218–229. [Google Scholar] [CrossRef]
- Strazisar, A.J.; Wood, J.R.; Hathaway, M.D.; Suder, K.L. Laser Anemometer Measurements in a Transonic Axial-Flow Fan Rotor; NASA: Washington DC, USA, 1989; pp. 430–437. [Google Scholar]
- Sonoda, T.; Arima, T.; Oana, M. The effect of inlet boundary layer thickness on the flow within an annular S-shaped duct. J. Turbomach. 1999, 121, 626–634. [Google Scholar] [CrossRef]
- Vakili, A.D.; Wu, J.M.; Liver, P.; Bhat, M.K. Flow Control in a Diffusing S-Duct. In Proceedings of the AIAA Shear Flow Control Conference, Boulder, CO, USA, 12–14 March 1985. [Google Scholar]
- Cousins, W.T. A Theory for the Prediction of Compressor Blade Aerodynamic Response. In Proceedings of the 34th AIAA/ASME/SAE/ASEE Joint Propulsion Conference and Exhibit, Cleveland, OH, USA, 13–15 July 1998; pp. 98–3308. [Google Scholar]
- Sears, W.R. Some Aspects of Non-Stationary Airfoil Theory and Its Practical Application. J. Aeronaut. Sci. 1941, 8, 104–108. [Google Scholar] [CrossRef]


| Parameter | Numerical Value |
|---|---|
| Blade number | 22 |
| Design rotor rotate speed (rpm) | 16,043 |
| Design mass flow (kg/s) | 33.25 |
| Design total pressure ratio | 1.63 |
| Tip speed (m/s) | 427 |
| Aspect ratio | 1.56 |
| Hub/tip ratio (outlet) | 0.395 |
| Hub/tip ratio (inlet) | 0.487 |
| Young’s Modulus (E/Pa) | Density (ρ/kg·m−3) | Poisson Ratio |
|---|---|---|
| 1.2 × 10¹¹ | 4500 | 0.34 |
Disclaimer/Publisher’s Note: The statements, opinions and data contained in all publications are solely those of the individual author(s) and contributor(s) and not of MDPI and/or the editor(s). MDPI and/or the editor(s) disclaim responsibility for any injury to people or property resulting from any ideas, methods, instructions or products referred to in the content. |
© 2024 by the authors. Licensee MDPI, Basel, Switzerland. This article is an open access article distributed under the terms and conditions of the Creative Commons Attribution (CC BY) license (https://creativecommons.org/licenses/by/4.0/).
Share and Cite
Pan, T.; Mu, Z.; Yan, Z.; Li, Q. Forced Vibration Induced by Dynamic Response Under Different Inlet Distortion Intensities. Aerospace 2024, 11, 911. https://doi.org/10.3390/aerospace11110911
Pan T, Mu Z, Yan Z, Li Q. Forced Vibration Induced by Dynamic Response Under Different Inlet Distortion Intensities. Aerospace. 2024; 11(11):911. https://doi.org/10.3390/aerospace11110911
Chicago/Turabian StylePan, Tianyu, Ze Mu, Zhaoqi Yan, and Qiushi Li. 2024. "Forced Vibration Induced by Dynamic Response Under Different Inlet Distortion Intensities" Aerospace 11, no. 11: 911. https://doi.org/10.3390/aerospace11110911
APA StylePan, T., Mu, Z., Yan, Z., & Li, Q. (2024). Forced Vibration Induced by Dynamic Response Under Different Inlet Distortion Intensities. Aerospace, 11(11), 911. https://doi.org/10.3390/aerospace11110911