1. Introduction
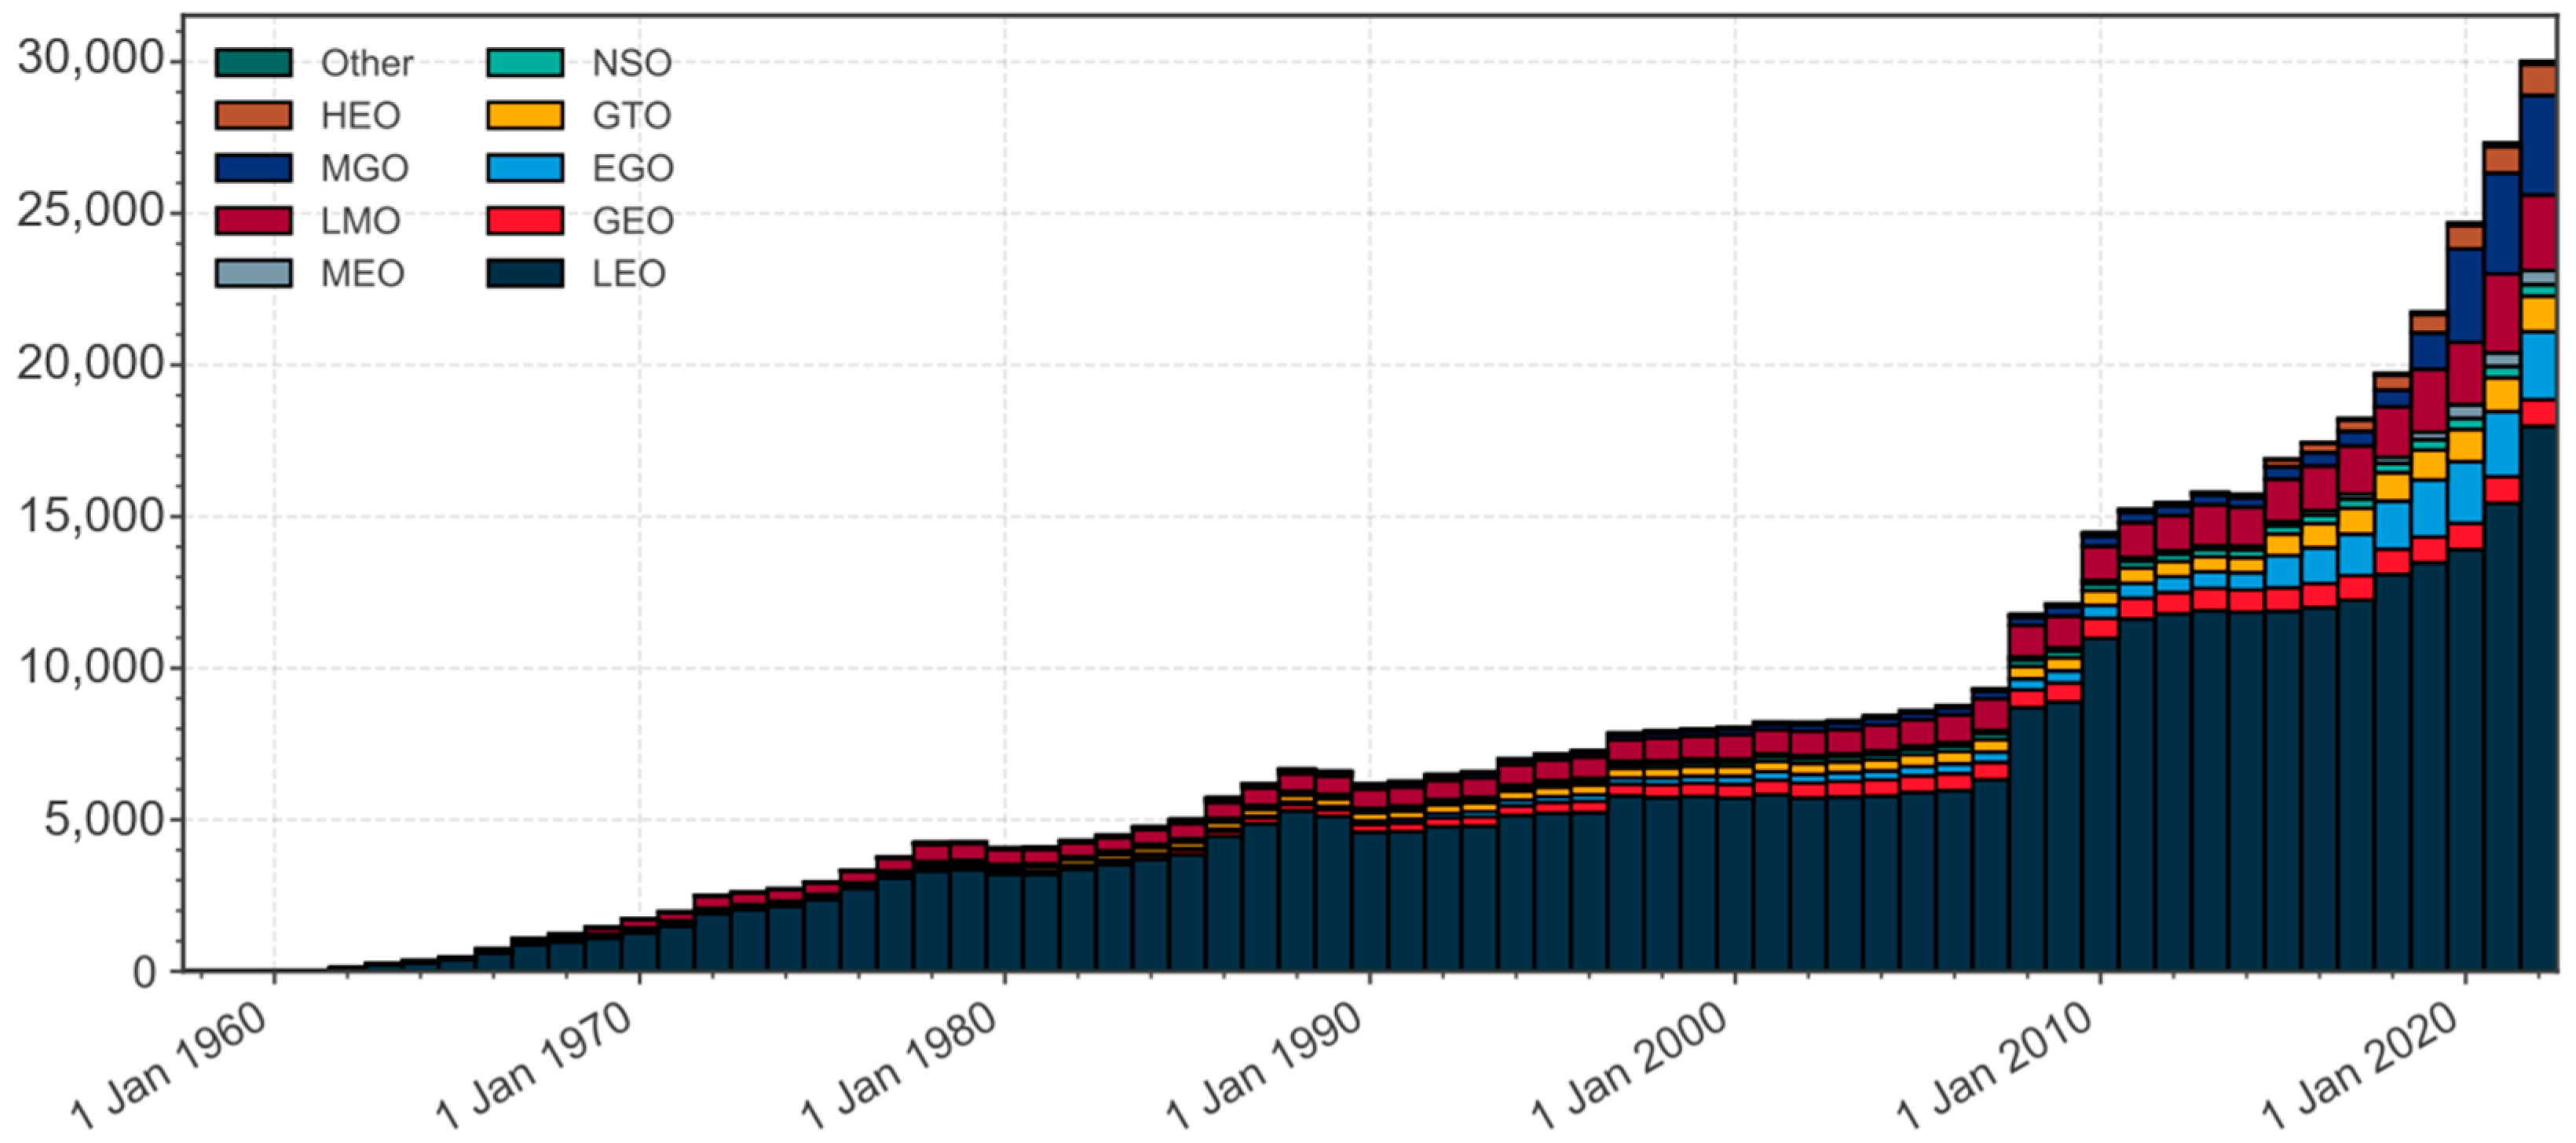
In 1957, the successful launch of the first satellite was the beginning of a new era in space exploration. Since then, the number of space debris orbiting the Earth continuously increased which has resulted in a higher potential risk to all active satellites as shown in
Figure 1 [
1]. In 2009, iridium-33 had an accident with cosmos-2251 resulting in the mission ending and generating a huge number of space objects [
2]. When the number of space objects increases, at some critical point it could cause a collision cascade; the scenario is well known as “Kessler Syndrome” [
3]. Therefore, the mitigation of the number of space objects is important for space sustainability. The conjunction assessment analysis is one of the essential tools for all operators to minimize the collision threat for their own satellites.
The conjunction assessment analysis is a technique to evaluate the risks of collision by defining the conjunctions of each space object pair that exceed a threshold of miss distance, the time of closest approach (TCA) and collision probability. The processing time for conjunction analysis is directly proportional to the number of space objects. Therefore, the efficiency of conjunction assessment analysis is essential for all operations to make critical decisions and execute necessary actions to ensure satellite safety. The conjunction analysis for all space objects (all vs. all), which analyzes all potential risks of all space objects, consumes a significant amount of computation time. To address the challenge of conjunction assessment analysis, many researchers attempt to develop conjunction filter techniques to maintain screening accuracy and enhance the computation cost of collision assessment analysis. Currently, there are three developed screening filter techniques. Firstly, the Smart Sieve method [
5] was developed by the European Space Agency (ESA) and implemented in the ESA’s conjunction prediction services. Secondly, the CSieve method [
6] was developed by the Aerospace Corporation and based on geometrical principles. Lastly, the CAOS-D [
7] is the combination of the CSieve and Smart Sieve filters. However, these screening filters require high computation and can miss some conjunction events. Therefore, the first objective of this paper aims to investigate the accuracy of each screening filter to ensure that we can detect all possible conjunction events by comparing them with the conjunction assessment analysis without the screening filters.
To enhance the computation speed of the conjunction assessment analysis with parallel computation techniques, CAOS-D successfully implemented parallel computation on the CPU [
7]. Then, ESA implements the Smart Sieve filter on a GPU by using NVIDIA’s Compute Unified Device Architecture (CUDA) [
8]. The combination can reduce the processing time by 89.3 percent compared to parallel computing on a CPU (four cores). Lin investigated the computing speed on the parallel computation between CPU and GPU, and both of them do not consider the screening filters. The investigated results demonstrate that the computing speed of the parallel algorithm on a GPU is 30 times faster than on a CPU [
9]. Furthermore, recent studies implemented deep learning approaches to reduce the computation time of conjunction screening in the case of all vs. all [
10]. The investigated results present that a deep learning technique can reduce the computation time while maintaining the accuracy of the conjunction screening. Therefore, the second purpose of this paper is to develop a combination between a screening filter and parallel computation based on the GPU of each filter to enhance computation speed.
This paper proposes to investigate the accuracy performance and computation speed of a combination between screening filter and parallel computation techniques based on a GPU for conjunction assessment analysis of a single satellite (one vs. all) and all space objects (all vs. all).
Section 2 describes the methodology of conjunction assessment analysis with a conjunction filter. The experiment methodology and the investigated results of each filter efficiency and computation speed are presented in
Section 3. Then, the discussion is described in
Section 4. Finally,
Section 5 summarizes the conclusions of this paper.
2. Conjunction Assessment Analysis
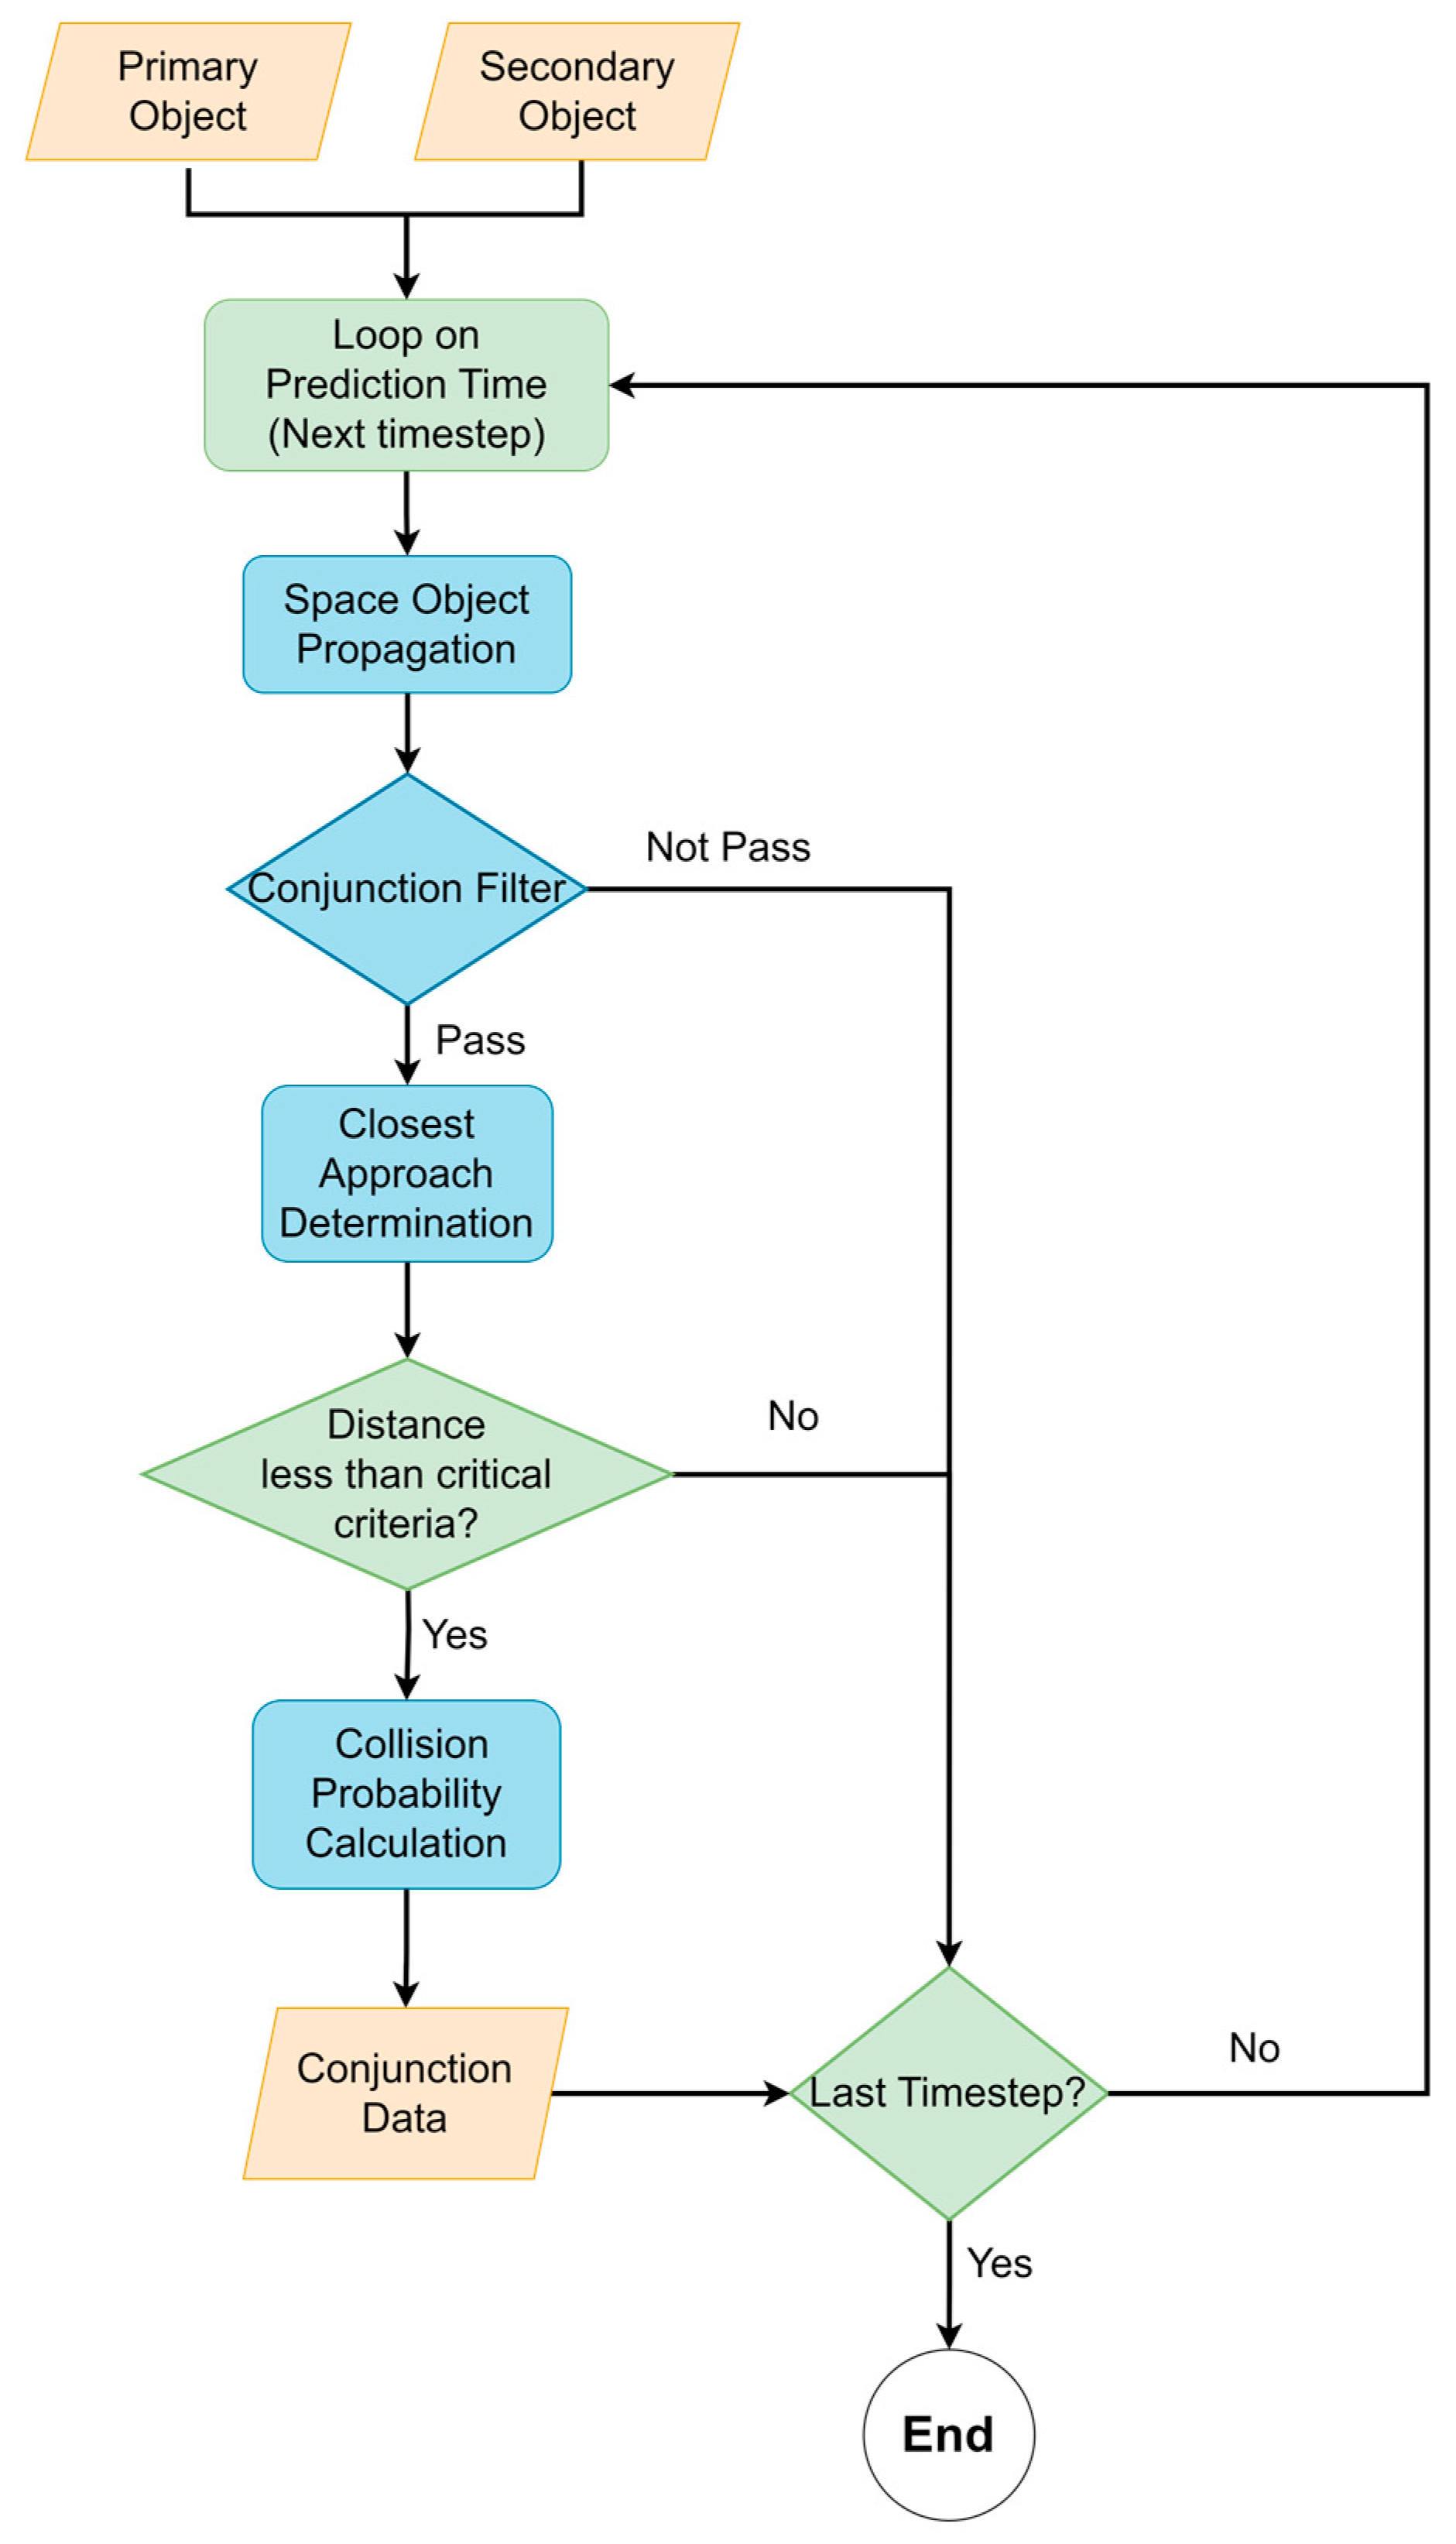
This section describes the process of conjunction assessment analysis as shown in
Figure 2. The analyzed results (TCA, miss distance, and collision probability) are necessary for evaluating collision risks. The conjunction assessment process consists of four steps: space object propagation, conjunction filter, the closest approach determination and collision probability calculation.
The process requires the initial states of space objects to propagate into forward time in the prediction period. The process of conjunction assessment analysis is shown in
Figure 2.
The initial state of both primary and secondary objects in this study is based on the Two-line element (TLE) provided by the space-track [
11]. Then, the algorithm performs a loop by timestep from the beginning to the end of the analyzed period. For example, in the case of one day (1440 min) conjunction analysis with a 2 min timestep, the process looping is 1440/2 = 720 times. The state vectors (position and velocity) of both objects are propagated into the current loop time and define the time interval that both objects possibly occur in conjunction with events. The time interval that passes the condition of the filter will determine closest approach. The algorithm is designed to calculate a collision probability when a miss distance is less than the threshold control (5 km for this study). The distance between two objects is analyzed in whole time intervals to define the closest approach and calculate collision probability.
For analyzing conjunction events of a single satellite versus all space objects (one vs. all), the total pair (
) between a satellite and all space objects (n) is calculated by:
In the case of all space objects versus all space objects (all vs. all), the total pairing (
) between all space objects can be calculated by:
2.1. Conjunction Filter
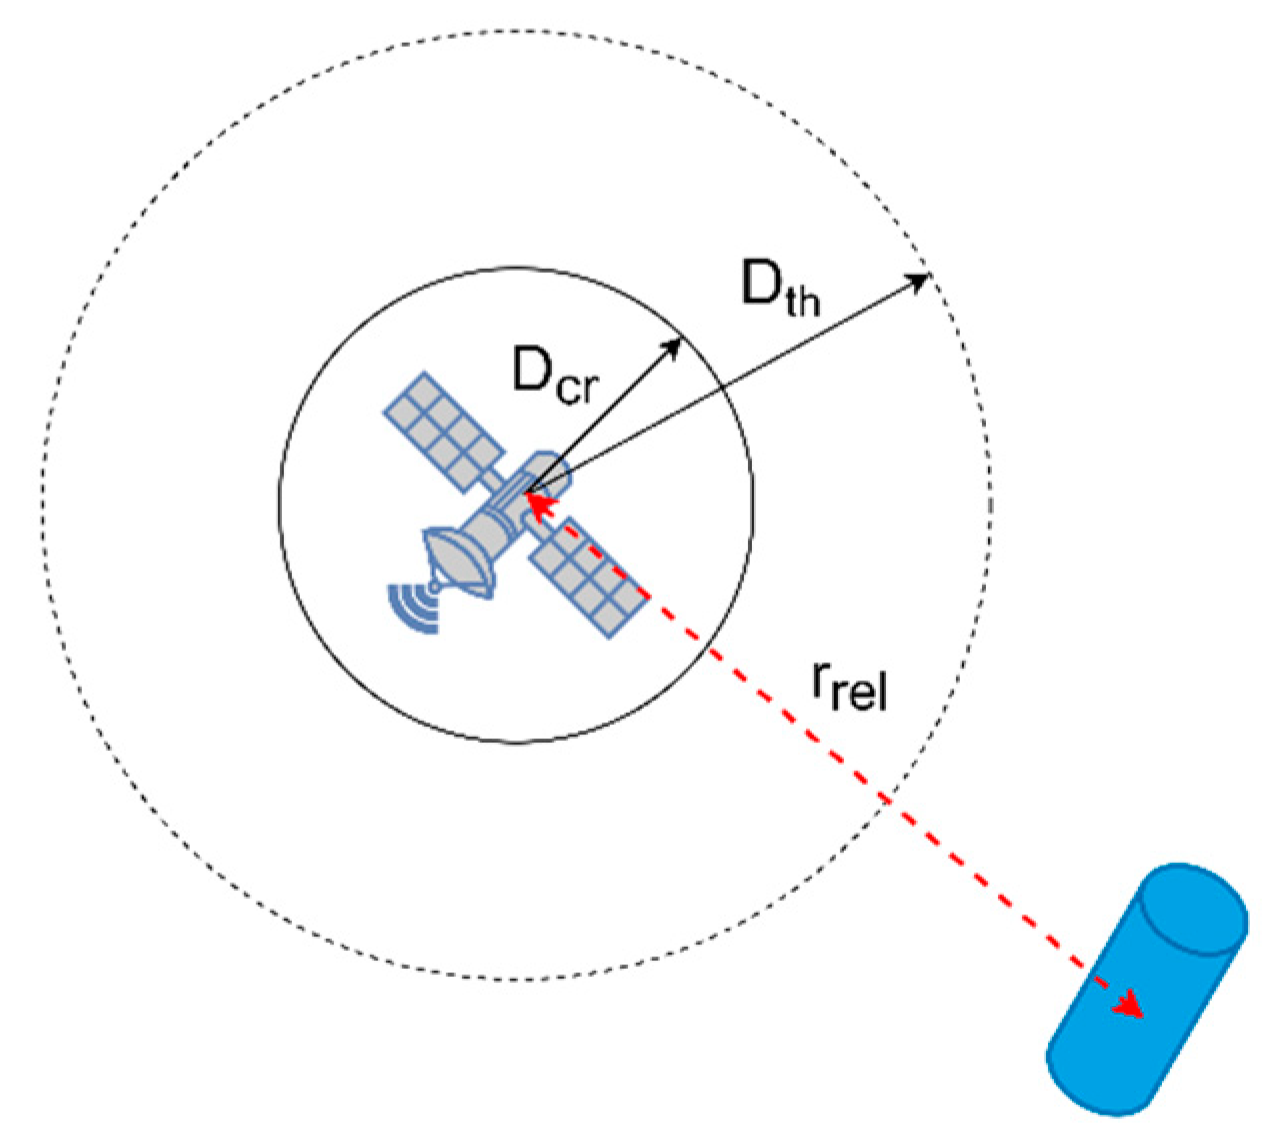
Figure 3 shows the concept of conjunction filter. The filter is useful to screen the possible time interval that both objects are not closer within a critical distance (
). This supports that the process defines TCA points in some time intervals on the prediction period, which can reduce the computation time. The filter defines the threshold distance (
) to screen relative distance (
) and considers the time interval that the relative distance is within the threshold distance. The relative distance can be calculated by
where
and
are the predicted position vectors of both in the current loop time. There are three filter methods (smart sieve, CSieve and CAOS-D) to define all possible times interval to determine conjunction events. The three filter methods are described in sub-sessions.
2.1.1. Smart Sieve
In the classical sieve [
12] method proposes to minimize distance estimation. The remaining time interval and the minimum distance between both space objects are estimated. The estimated distance will be verified with critical distance (
). The minimum distance can be calculated by:
The Smart Sieve [
5] is improved from the classical sieve by using the simplified dynamic model included in the method. The filter defines threshold and acceleration safety distance based on the flight dynamics principle. The threshold distance (
) is defined by:
where
is Earth’s escape velocity, Δt is the timestep size of loop time. The acceleration safety distance is defined by:
where
is the Earth’s gravity field. Smart Sieve consists of five screening conditions. The first condition is the single-axis screening. If the difference of any axis is more than
, the relative distance is not within
. The single-axis screening is:
Secondly, R
2 screening eliminates objects that are not within the threshold distance that is calculated by Equation (5). R
2 screening is as follows:
Thirdly, Minimum Distance screening rejects object pairs that are the estimated minimum distance by Equation (4) and not within the acceleration safety distance calculated by Equation (6). Minimum Distance screening is:
Fourthly, Fine R
2 screening is similar to R
2 screening but the algorithm requires the approach velocity (
) instead of escape velocity (
). The remaining pair may be closer than the threshold distance, but it is still too far from the critical distance. The screening condition is described as follows:
where approach velocity (
) is defined by
Lastly, Fine Detection screening uses estimates of the closest approach distance by the time approach (
). The closest approach distance that is not within the critical range is rejected. Fine Detection screening is as follows:
where time approach (
) is calculated by
2.1.2. CSieve
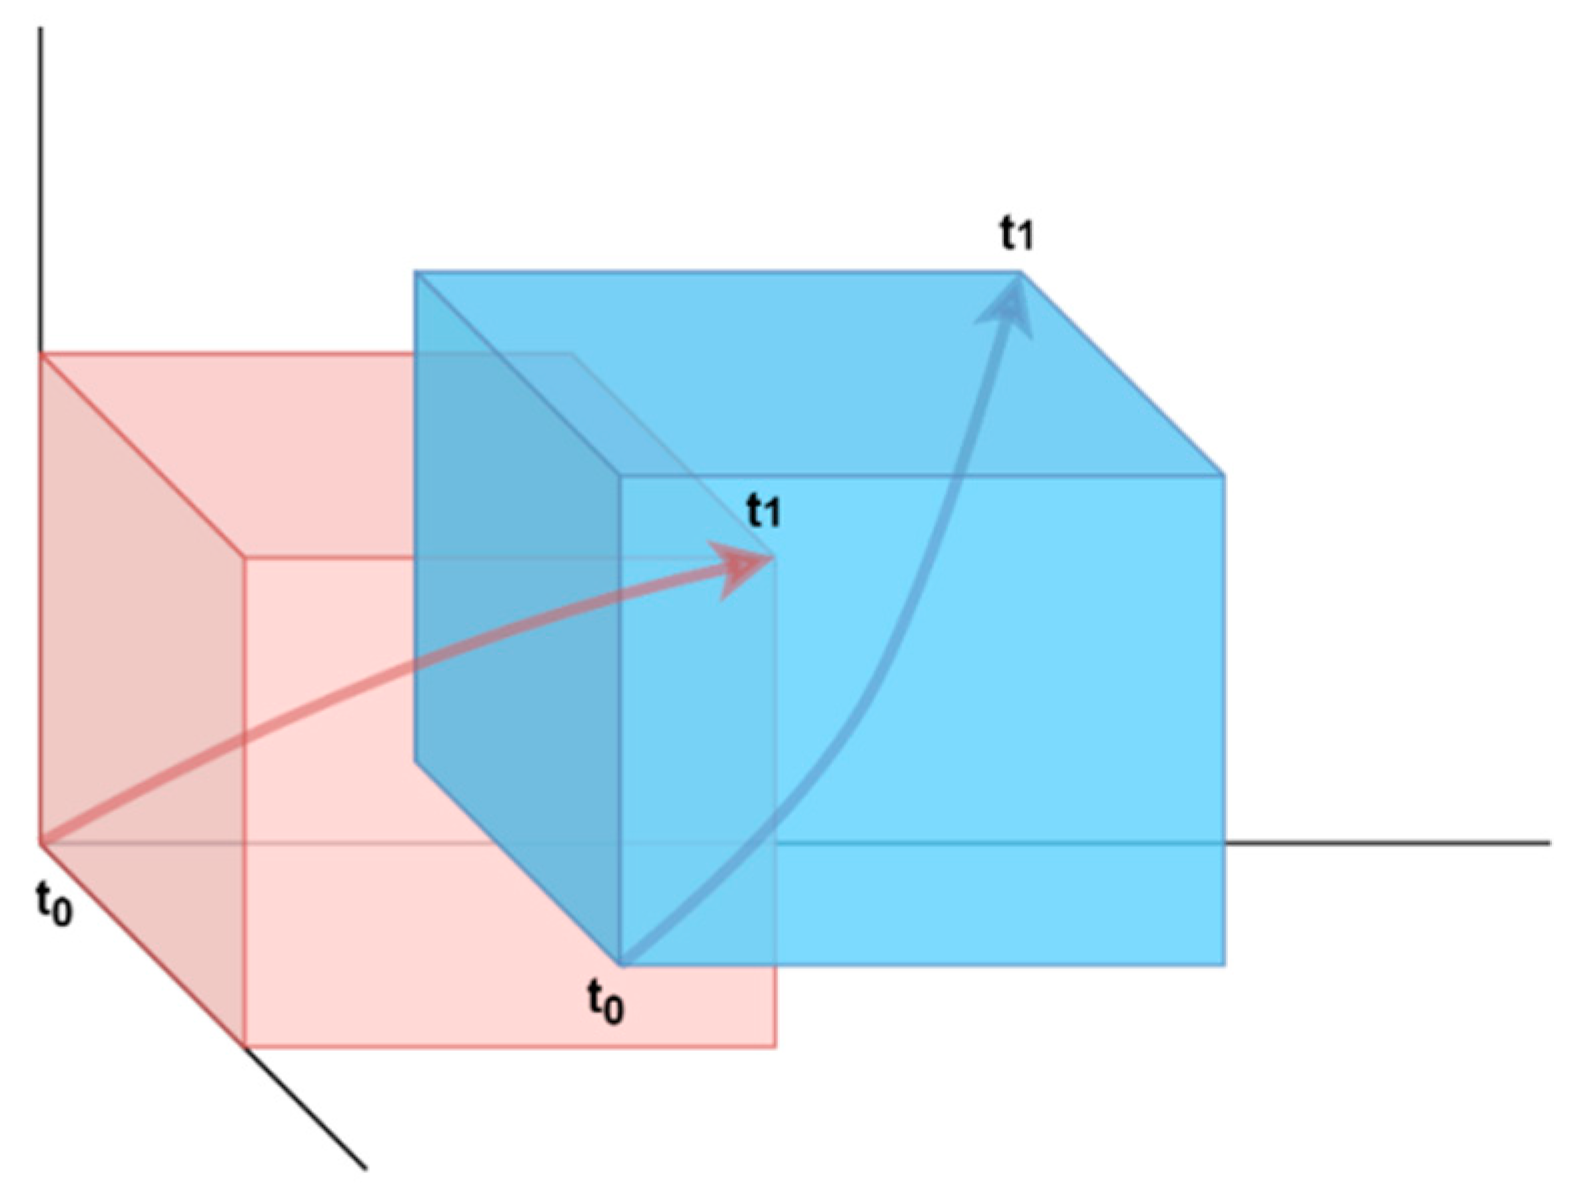
The filtering principle of CSieve [
6] implements the states of both objects at the beginning and end of a time interval to define the rectangular volume surrounding the path. The overlapping of both rectangular volumes indicates that their objects are approaching each other, as shown in
Figure 4.
The filter defines the maximum and minimum values of each axis of the space object position over a time interval. The principle is that the second object’s minimum value is not within the range limitation of the primary object’s maximum value. The condition to reject the rectangular volume is when the rectangular volume does not overlap. The
-axis screening conditions are as follows:
Then, the dot product of relative position and velocity vectors at the beginning and end of the time interval is calculated. The condition accepts the time interval that the dot product of the relative position and velocity vectors change from negative to positive during the time interval. The R dot V screening condition definition is as follows:
The point of minimum distance corresponds to the dot product equal to zero as follows:
2.1.3. CAOS-D
CAOS-D [
7] is conjunction assessment analysis software that has been designed to swap differential parts in the algorithm such as orbit propagation, conjunction filter, closest approach determination, etc. The software algorithm combines Smart Sieve and CSieve filter methods to screen for each timestep. The software tests both filters to define the best filter chain. The filter chain that had the best performance in CAOS-D testing is mapped in
Figure 5.
The X, Y and Z-axis filter of CSieve is the first stage of the screening. Next, the R dot V guarantees to define conjunction events in the current time interval, but it does not guarantee that the close approach is within critical range. The Minimum Distance and Fine Detection of the Smart Sieve can greatly screen the number of pairs that pass to the closest approach determination.
2.2. Closest Approach Determination
Figure 6 shows a concept of the closest approach determination. The time interval, which passes the filter, is determined closest approach. This process is to define a point that has a minimum distance of both objects by propagating with a timestep in the second period of the time interval. State vectors are predicted from the beginning (
) to end (
) of the time interval of interest with the timestep in seconds. The relative distance (
) is calculated to determine the time of the closest approach (
). If the minimum distance is less than the critical distance (
), a conjunction event is detected. The algorithm implements the closest approach determination by propagating with the timestep in the second, to search for a point that the dot product of the relative position and velocity closest to zero. In terms of the timestep in milliseconds, the time of the closest approach is estimated by the Healy equation [
12]. The equation is valid for small timestep sizes. The time of the closest approach can be calculated by:
2.3. Collision Probability Calculation
The collision probability (
) is calculated by state vectors at the time of the closest approach to evaluate the potential collision. We implement collision probability calculation by following maximum probability [
13]. Both objects are assumed to move along straight lines, and position uncertainty during the encounter is assumed to be constant. In this algorithm, the collision probability calculation is implemented the two-dimensional probability density function (PDF) [
14]. The collision probability (
) can be calculated by:
where
is the combined object radius,
lies along the minor axis of the error covariance ellipse,
lies along the major axis of the ellipse,
and
are the corresponding standard deviations, and
and
are the respective coordinates of the projected distance.
3. Conjunction Filter Investigations
Three conjunction filters are tested to investigate to filter all possible events. The number of conjunction events of each technique and process times are compared with the analyzed results without a conjunction filter. The experiment performs one vs. all and all vs. all conjunction assessments and initial states of all space objects provided by the space track website. The simplified General Perturbations 4 (SGP4) [
15] model provides the propagation error within 1 km on propagation for nine days [
16], which is sufficient for this study.
Before testing the filter, we validate our algorithm by comparing the results with Satellite Orbital Conjunction Reports Assessing Threatening Encounters in Space (SOCEATES) [
17], which is a service for satellite operators developed by the Center for Space and Innovation (CSSI). The SOCEATES service provides TLEs that are used to compute the conjunction data of their results. For validation, our process is run by using the same TLE data and then comparing the analyzed results (TCA and distance). The maximum difference between miss distance and TCA is 0.015 km and 0.011 s, respectively. The compared results with SOCRATES are shown in
Appendix A,
Table A1.
3.1. One vs. All Conjunction Assesments
This study selects five satellites in Low Earth Orbit (LEO), Medium Earth Orbit (MEO), and highly elliptical orbit (HEO) to test with three filters. The orbital characteristics of satellites are listed in
Table 1.
The process without conjunction filter is tested by analyzing the conjunction of satellites in advance seven days, beginning on 19 November 2021 at 00:00:00 UTC and setting critical criteria at 5 km. Space objects (22,119 objects) are loaded from the space track to be the initial states. The process runs on Intel
® CoreTM i7-8700, which is executed by a single core. The results of the non-filter process of all satellites are shown in
Table 2.
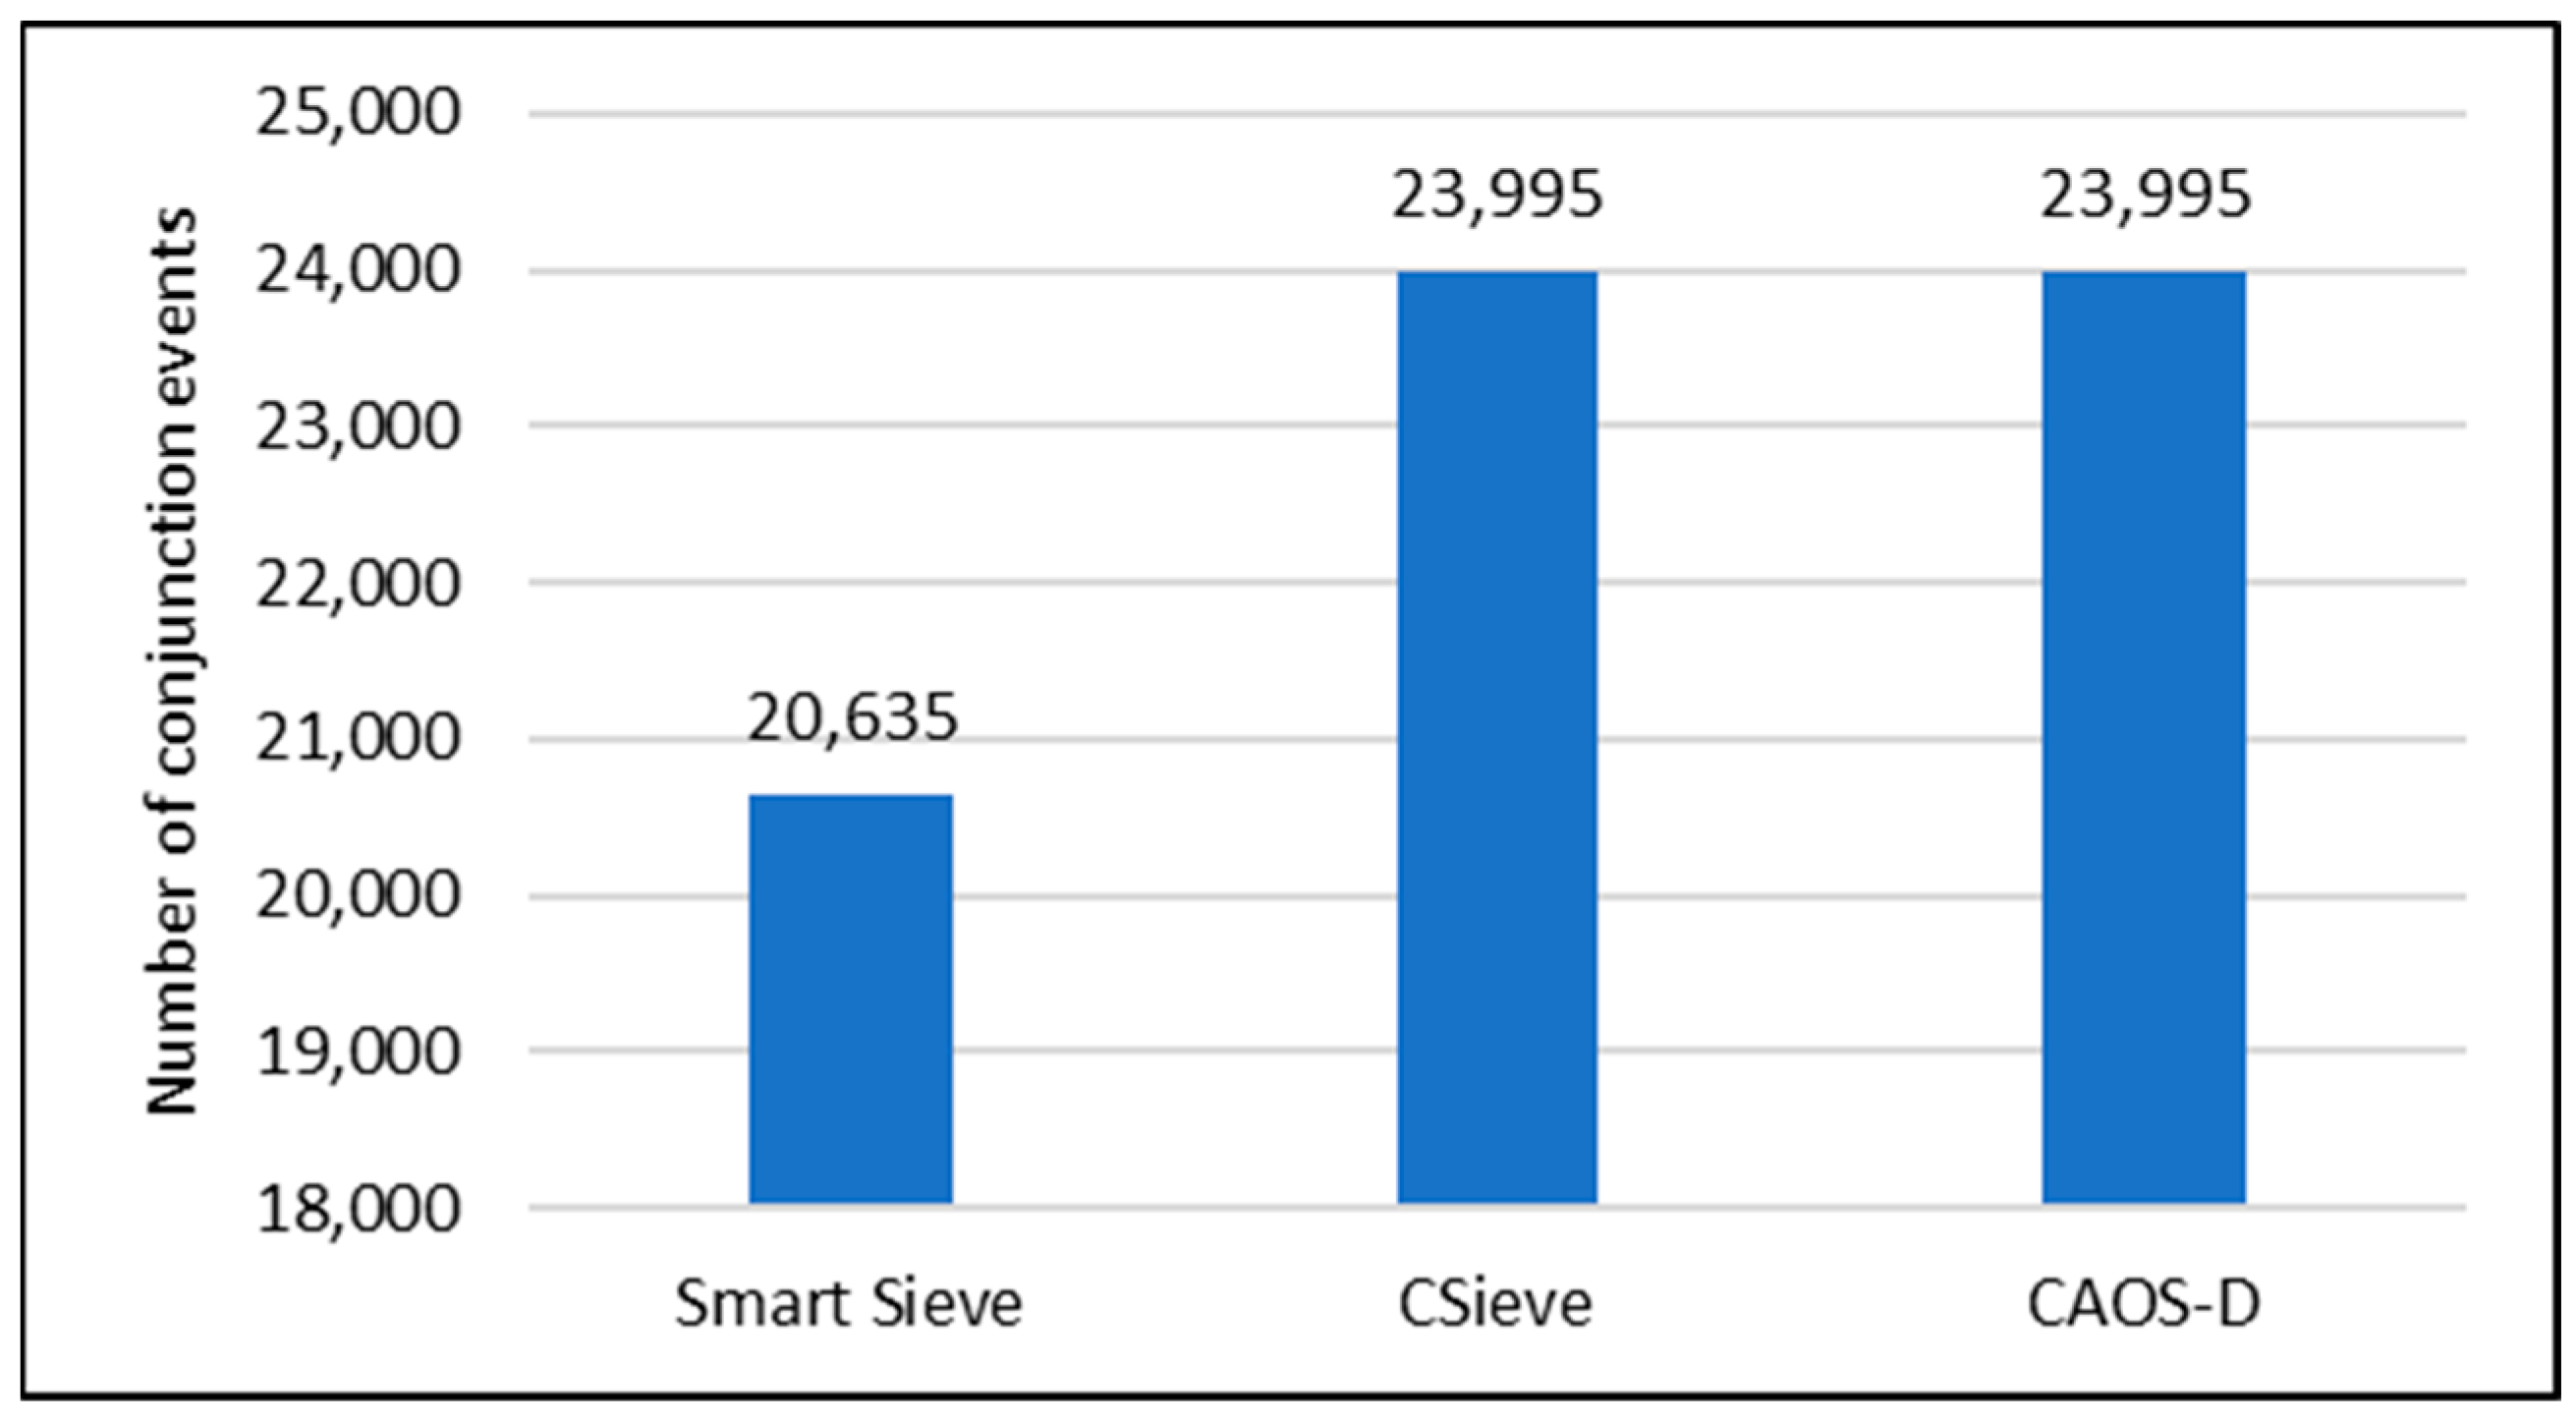
In the case of the non-filter process, all time intervals are analyzed to guarantee all conjunction events that are defined. The analyzed results of each filter are compared to the analyzed results without a non-filter process to investigate the accuracy of each filter.
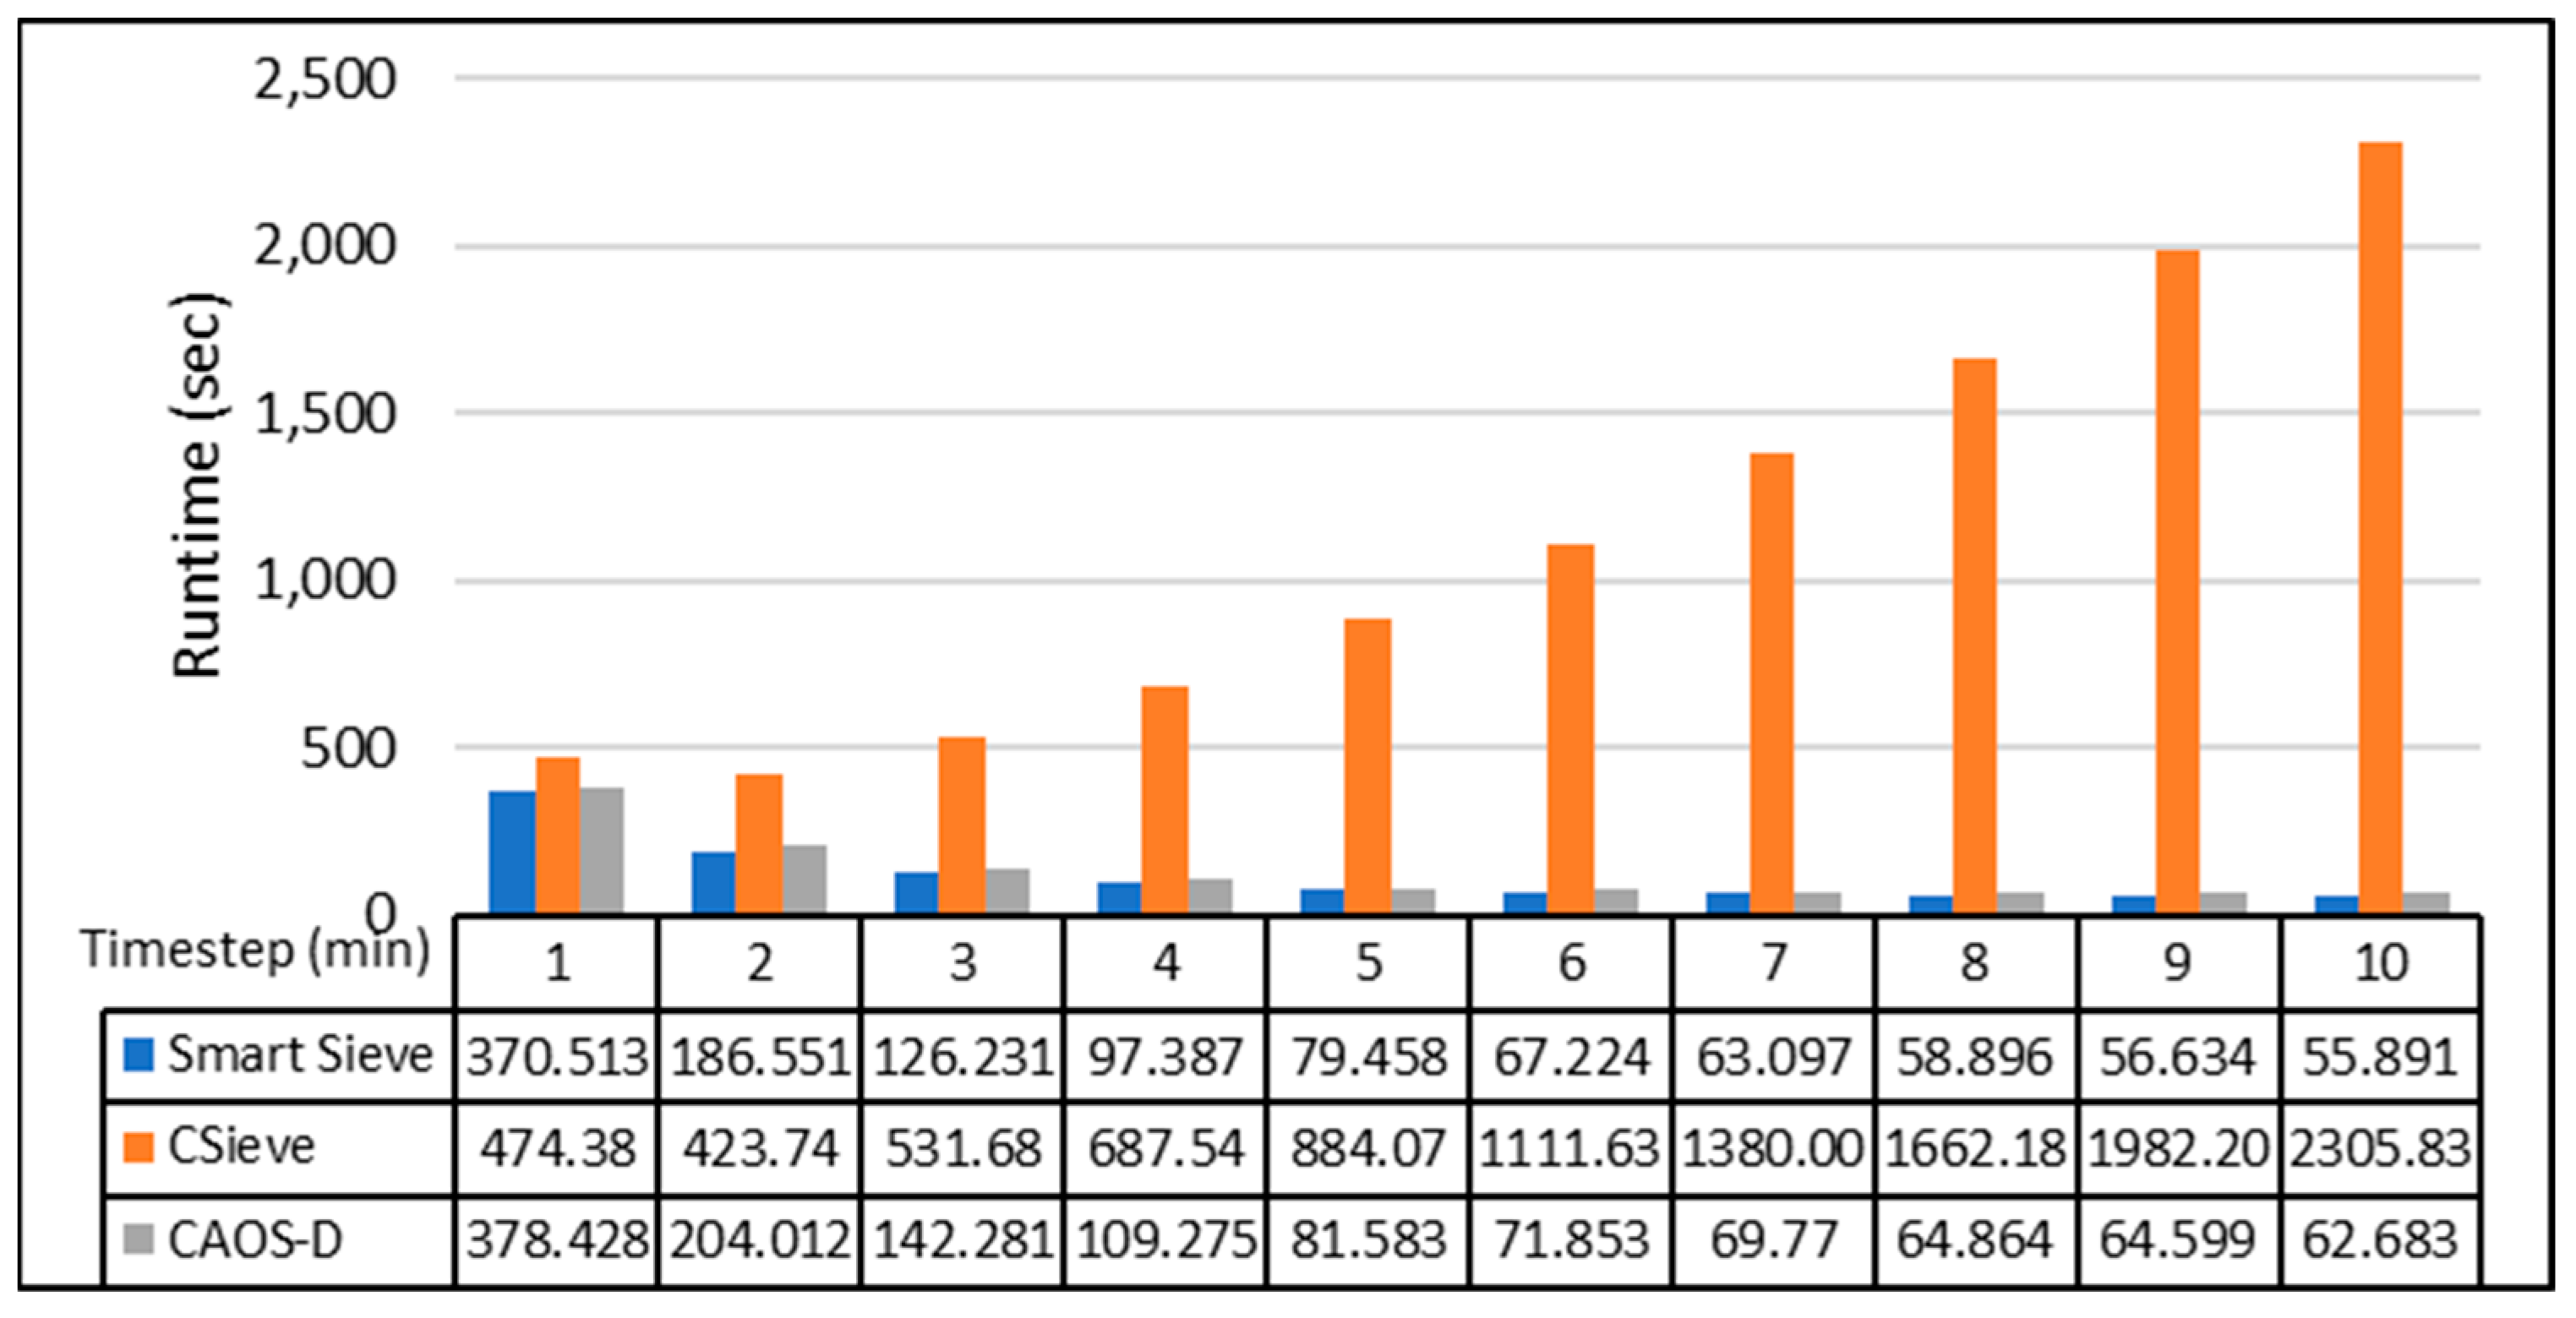
The filter process run with a timestep of one to ten minutes. Increasing the timestep lead to decrease the time interval to compute the conjunction filter. The experiment purposes to increases a timestep for observing the change in computation time and number of conjunction events. The conjunction events and computation times of five satellites on a process with three filter methods is recorded.
Several time intervals that pass the filter (
) are also recorded to verify the screening ratio. The total time interval of all pairs screened (
) is calculated by loop time size to compute single pairs depending on the prediction period and timestep (
).
Then, the loop time size multiplied by the total pair () is the total screening () of conjunction filter. When increasing the timestep () length, total screening () is reduced, which minimizes the loop time size for computing.
3.2. All vs. All Conjunction Assesment
It has a considerable object pair that requires high computation process all vs. all conjunction assessment on a single core of CPU. Therefore, we implement parallel computing with a GPU to distribute the process into smaller parts for parallel computation. The process starts by loading all space object data. GPU memory is allocated to send data to propagation. The idea to parallel propagate all space objects onto the prediction period is to compute the object’s positions on a timestep per core processing unit. The computation complexity of propagation is O(n × s) where n is the number of objects and s is the number of timesteps on the prediction period. Then, the process defines object pairs by the reference index of an object into an array list and provides the object pairs to the GPU for screening with a conjunction filter.
For the parallel conjunction filters, we cannot allocate memory for the result data because it is difficult to define the number of pairs that will pass the filter. However, the process can define the exact number of object pairs that compute on a time interval. This part should be implemented in the critical section or use atomic add but there are significant slowdowns in the runtime process. In this part, we implement a conjunction filter on loop time and parallel computation depends on a number of object pairs. The length of the data is allocated according to the number of pairs. The results of the conjunction filter indicate whether those pairs are passed or not (true or false). Then, the index of object pairs that pass in the current loop time will be recorded to the passed pair list.
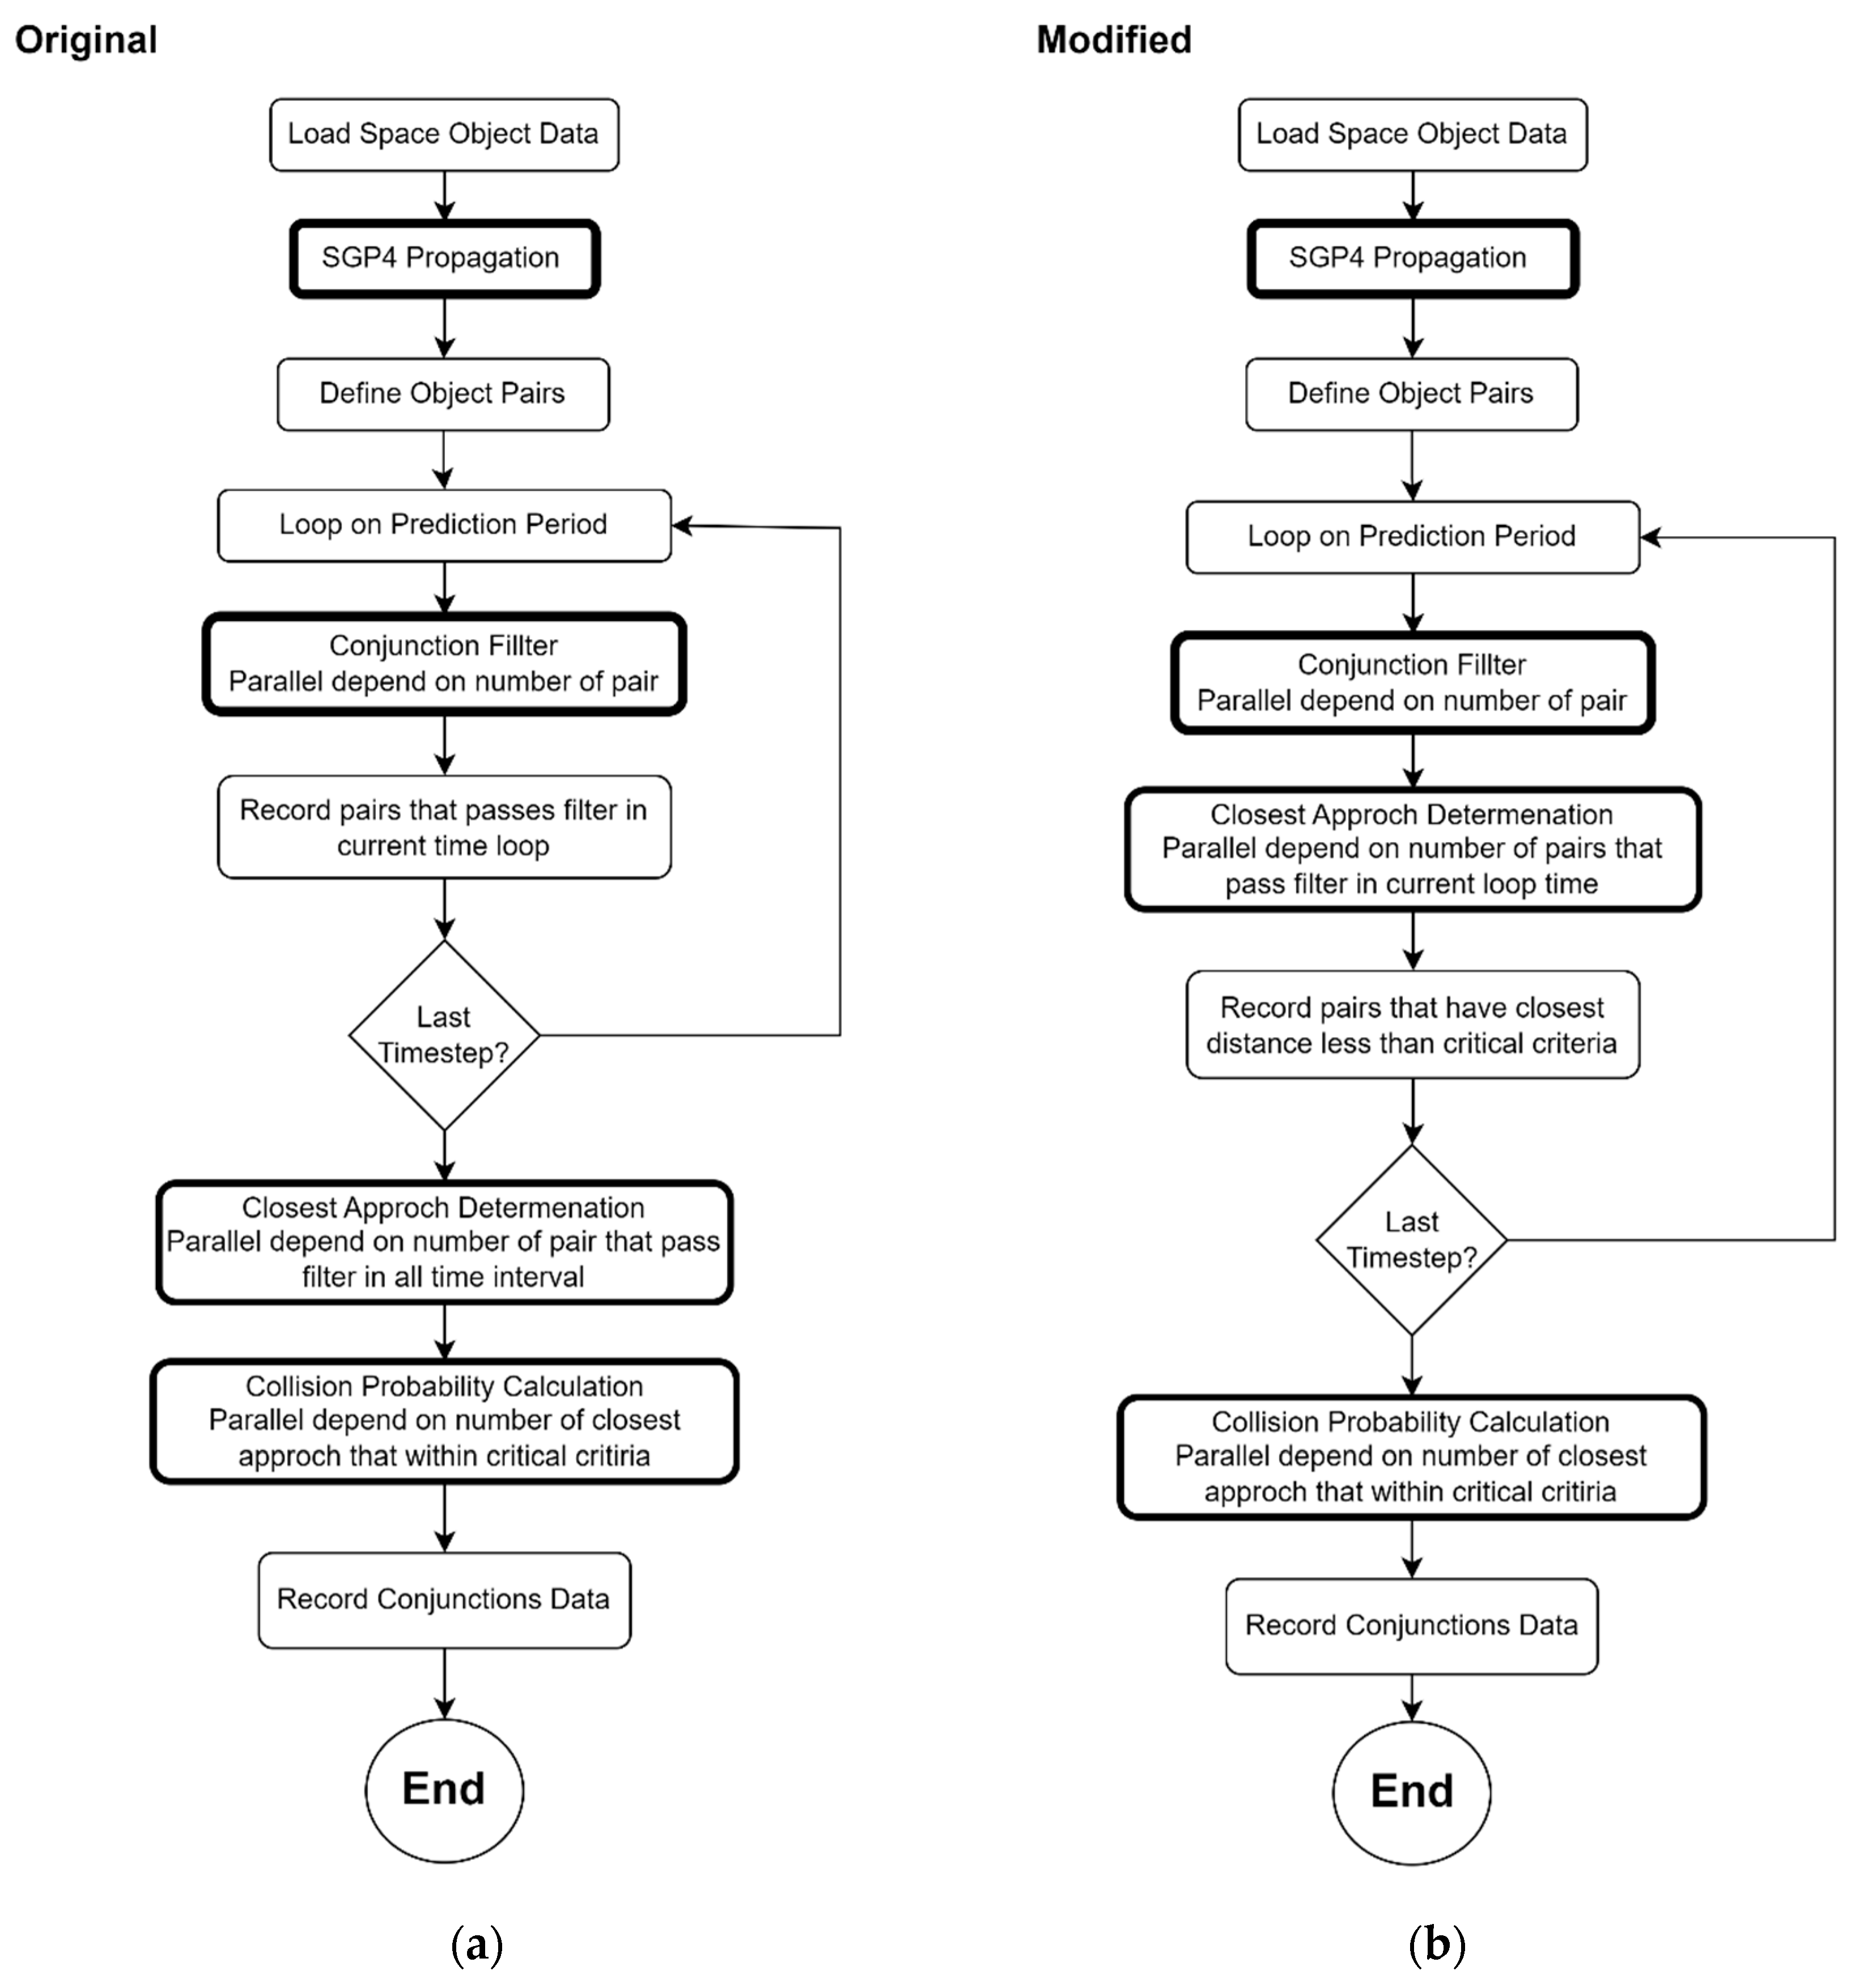
The CSieve method cannot directly run on the GPU algorithm because there is a concern of insufficient memory in part of the closest approach determination. Therefore, we develop the algorithm by moving the closest approach determination into the time loop. The CSieve method has a very high screening ratio than other methods. This process will be described in
Section 4. The closest approach determination of the modified algorithm is reduced object pairs that compute for all timesteps to compute one by timestep. The CSieve can run on the modified method. The original and modified algorithms are shown in
Figure 7.
Next, the closest approach determination computes all pairs that pass the filter in each time interval. The paralleling in this part depends on the number of pairs that pass the filter. The memory is allocated for relative distance on the closest approach of those pairs. Then, the collision probability is calculated for pairs with a relative distance that is less than the critical criteria. Lastly, the lists of conjunction data are recorded as the results.
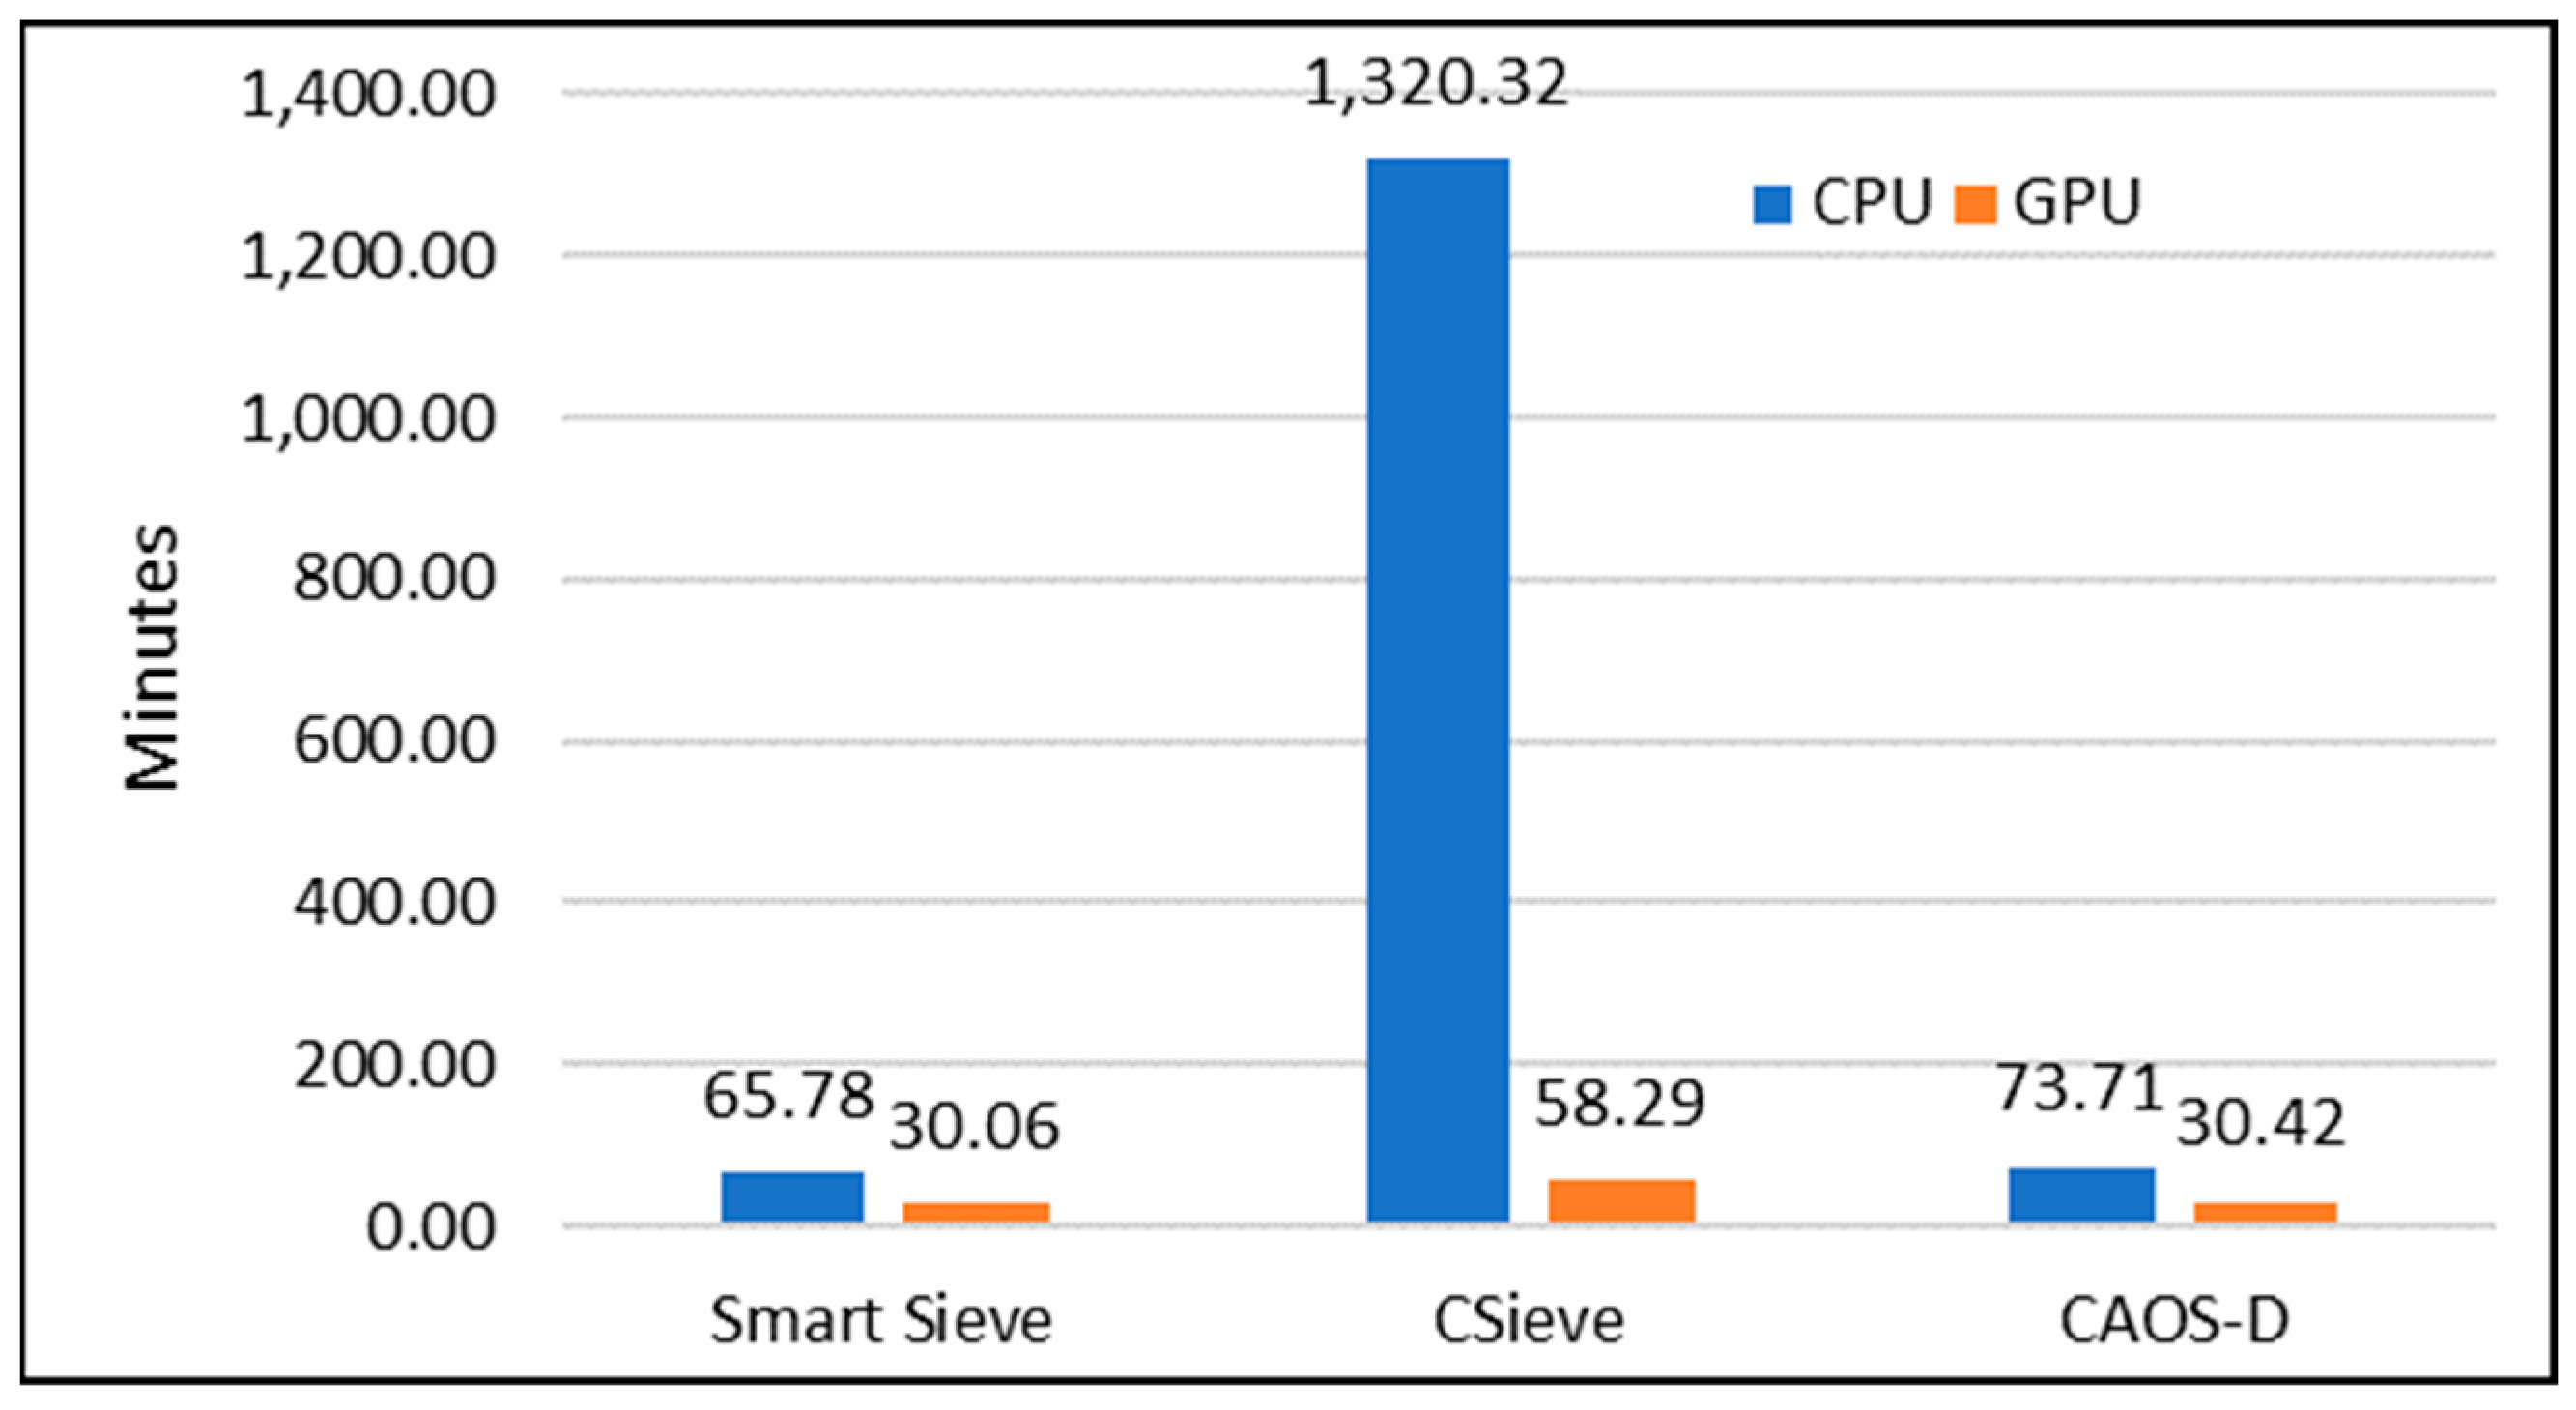
The GPU process is performed to analyze the conjunction of all space objects (24,023 objects) for one day. The prediction period begins on 3 March 2022 at 00:00:00 UTC with a timestep of one minute and sets the critical criteria of 5 km. The process runs on an Ubuntu server with Intel
® Xeon
® Gold 5218 CPU. The server is additionally equipped with an NVIDIA Tesla T4 GPU (2560 CUDA cores, 16 GB memory). The GPU process is tested and compared to the CPU single cores process on the same machine. All data in the GPU process are allocated in a type of double precision. Then, the conjunction data are not different from the CPU process. The runtime of GPU and CPU are recorded to observe the speedup of each filter when running on GPU. The percent of passed filters is calculated by the screening ratio of all vs. all processes. The investigated results of the overall screening of each filter method are summarized and discussed in
Section 4.2.


 ,
, 


