Abstract
This study investigated reconstruction techniques for building the instantaneous fuel regression rate of the hybrid rocket motor (HRM). Specifically, an experiment in a laboratory 500 N-class hybrid rocket motor with single-port wagon wheel fuel grain, operated with hydrogen peroxide (HP) and hydroxyl-terminated polybutadiene (HTPB) based fuel (including Al), was carried out. A piece of post-processing software was developed to reconstruct the instantaneous regression rate and other performance parameters of the HRM during the firing test. The results produced by the reconstruction techniques are in good agreement with experimental data obtained by traditional methods, with a maximum error of less than 5.75%. Moreover, compared with the traditional endpoint method, the reconstruction method had a significant advantage, which could ascertain the sensitivity of the regression rate to changes in the oxidizer mass flux and fit the formula of regression rate in a single firing test. Additionally, digital image processing techniques were employed to determine the axial distribution of the fuel regression rate after the test using computed tomography (CT) scanning. This served to verify the accuracy of the instantaneous reconstruction calculation. The error in the average regression rate between CT scanning and the reconstruction calculation was 1.91%, proving that the CT scanning and pixel statistic method of the calculating regression rate was practical for characterizing the axial distribution of the average regression rate during the firing test. In summary, the main objective of this study was to reconstruct the transient parameters of hybrid rocket motor with single-port wagon wheel fuel grain using reconstruction techniques, and to fit the formula of the regression rate through a single-firing test. Furthermore, this paper proposes a modified reconstruction method that is essential for investigating fuel regression rate during the firing test of HRMs.
1. Introduction
The hybrid rocket motor, which generally adopts a liquid oxidizer and solid fuel as its propellants, has a number of inherent advantages, such as high reliability, multiple restarts, simplified throttling, high safety and reduced pollution. These distinguished advantages make it attractive for both military and commercial applications [1,2]. As for performances, the specific impulse is higher than the values of the solid rocket motor and comparable to the liquid rocket motor [3]. However, the hybrid rocket motor suffers from a low regression rate of solid grain, which limits the widespread applications of the hybrid rocket motor. So far, research on the regression rates of hybrid rocket motors was conducted extensively [4,5,6,7]. A deeper investigation of the instantaneous regression rate and distribution of the regression rate along the combustion chamber is required.
The liquid oxidizer and solid fuel are separately stored in the hybrid rocket motor, and the oxidizer injected into a combustion chamber reacts with the fuel pyrolysis gas above the fuel surface. As a consequence, a diffusion flame, which, in turn, provides the convective and radiative heat flux needed to sustain the fuel pyrolysis process, is formed within the turbulent boundary layer [8]. It can be stated that the combustion process in the combustion chamber occurs predominantly in the diffusion mode [9,10]. Thus, the reaction rate is governed mostly not by the rate of chemical transformations but rather by the transport of the reagents to/from the reaction zone by diffusion [11,12,13], which leads to the low fuel regression rate of the hybrid rocket motor.
The fitting of the regression rate formula is an important step in designing the fuel grain and rocket system, and the measurement of the regression rate itself is a matter of concern that needs major attention [13,14,15]. Chiaverini and Kuo [16] indicated that the measurement of the fuel regression rate was a major challenge for hybrid rocket propulsion researchers because the instantaneous fuel regression rate is a function of the motor operating conditions, firing duration, port diameter, whether or not nozzle erosion occurs, etc. Various traditional methods were used by researchers to determine the regression rate of hybrid rocket fuels, such as through the ultrasonic technique [3,17,18,19], X-ray radiographic technique [20,21,22], and endpoint averaging method. The ultrasonic technique is the least costly but can only measure the fuel regression at a specific location, as well as in fuel grains with a simple geometry [23]. The X-ray radiographic technique can measure the instantaneous regression rate, while it is costly and requires skilled users. As for the method of endpoint averaging, the spatial and temporal average regression rates were obtained by the port diameter measurements at the initial and the final states, and the final port diameter is generally obtained by considering the weight loss during the firing test under the volume conservation assumption. According to Nagata et al. [24], the non-constant and non-linear nature of both the regression rate and fuel flow rate during firing creates a significant challenge. To mitigate this challenge, many combustion experiments were designed with short firing durations. However, in such cases, errors can arise due to ignition and shutdown transients, which can be significant. Furthermore, the fitting of a formula needs several average regression rates by several firing tests, which increases the test cost and decreases the fitting precision of the regression rate formula. Consequently, a low-cost and high accuracy reconstruction method of regression rates during the firing test is required.
To our knowledge, Osmon [25] made the earliest reconstruction technique attempt in 1966. However, the theoretic characteristic velocity he used did not include the effect of the chamber pressure. Additionally, he did not indicate how he could determine the average experimental characteristic velocity . George et al. [26] employed a similar approach but included the chamber pressure effect in the theoretic characteristic velocity . Because of the ignition produced by the igniter, the effective characteristic velocity of the total combustion products of the igniter and hybrid combustion chamber was calculated. However, the firing test was ignited by a catalytic bed in this paper. Therefore, the effective characteristic velocity was not needed. Additionally, they indicated the disadvantages of this method, assuming the constant c* efficiency throughout each test. Therefore, the key difference from the other studies of this article lies in our consideration of using the specific impulse efficiency instead of the c* efficiency.
Durand et al. [3] compared the instantaneous fuel regression rates or O/F, which were obtained by measuring the pressure drop across the fuel by the reconstruction technique. Additionally, the rebuilt profiles of the instantaneous port diameter showed the ability of the methodology to restore the space and time distribution of the fuel port diameter. Carmicino and Sorge [27] eliminated the need for the assumption of a constant c* efficiency by employing thrust history as additional input data. They showed that the c* efficiency did not change unless the flow field structure greatly changed. However, the nozzle efficiency varied with chamber pressure and nozzle expansion area ratio during the firing test. Thus, the specific impulse efficiency during the test was considered in this paper.
Saito et al. [28] investigated the accuracy of reconstruction techniques to determine the instantaneous fuel regression rate. They presented the error bias of O/F values calculated by the reconstruction techniques to be around ±10% and were mainly caused by uncertainties in the measured values of the oxidizer mass flow rate and the definition of the firing duration. Thus, this paper adopted a more accurate mass flowmeter and a differential method to ensure the firing duration. Wernimont et al. [29] developed a new integral technique for the purpose of analyzing combustion test data in hybrid rocket firings, which utilized a complete reconstruction of the regression history. In addition, they concluded that the short tests measured only the transient response of the combustion process because several seconds of burn were required to establish a steady-state thermal profile within the fuel.
Based on the research mentioned above, a conclusion can be drawn that the traditional measurement of fuel regression rate cannot represent the instantaneous regression rate entirely. In this paper, a hybrid rocket motor with single-port wagon wheel fuel grain utilized 98% hydrogen peroxide (98HP) and HTPB/Al as propellants. In order to solve the problem of the lower regression rate of HRM mentioned above, the single-port wagon wheel fuel grain, which had a higher burning area, was designed. To the best of the authors’ knowledge, most of the previous research was conducted to provide the reconstruction theory. However, the comparison between reconstruction techniques and firing tests of HRM is not sufficient, and even axial distribution of regression rate characterized by CT scanning was not carried out. As a result, this research achieved the reconstruction of an instantaneous regression rate during the firing test. After the test, the fuel grain was scanned by CT, and the axial distribution of the regression rate was characterized. The method of internal ballistic reconstruction techniques, the results of fitting a regression rate formula corresponding to this firing test, and the axial distribution of the regression rate were given.
2. Experimental Setup
2.1. Motor Configuration
The laboratory 500 N-class hybrid rocket motor with 98HP and HTPB/Al fuel in the firing test consisted of six parts, i.e., the injector, catalytic bed, pre-chamber, combustion chamber, post-chamber, and nozzle. The configuration of experimental HRM is illustrated in Figure 1. The main structure parameters of HRM are summed up in Table 1. The combustion chamber has an inner diameter of 100 mm and a length of 375 mm. The nozzle has an expansion ratio of three with a nozzle throat diameter of 15 mm. The oxidizer mass flow rate was controlled by the oxidizer venturi tube, and the cavitation venturi tube could eliminate the flow change caused by the pressure shock in the combustion chamber. Hydrogen peroxide decomposed into a high-temperature gas through the catalytic bed to achieve ignition. The catalytic bed was composed of palladium-silver mesh, and the photographs of the catalytic bed and nozzle are shown in Figure 2. The photograph of HRM is shown in Figure 3.
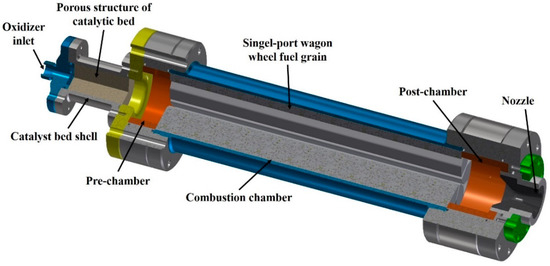
Figure 1.
Schematic of experimental HRM configuration.

Table 1.
HRM configuration parameters.
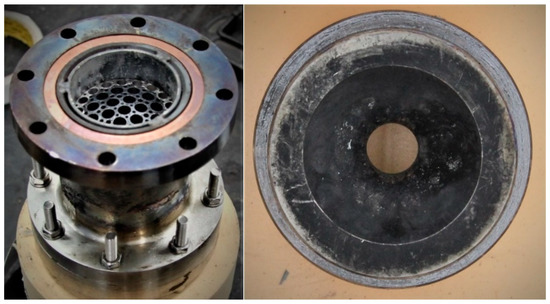
Figure 2.
Photographs of catalytic bed (left) and nozzle (right).
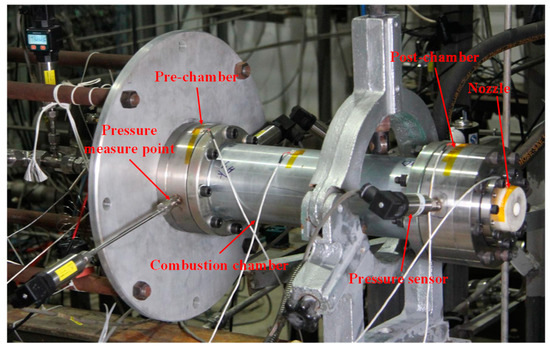
Figure 3.
Photograph of hybrid rocket motor.
2.2. Geometric Parameters of Fuel Grain
With the advantages of improving the burning area and the average specific impulse, the single-port wagon wheel fuel grain was adopted. Through the optimization of geometric parameters, the main variables were determined, as shown in Table 2. The schematic diagram is shown in Figure 4. The design in geometric parameters of the single-port wagon wheel fuel grain may refer to Ref. [30], which is the authors’ previous research work.

Table 2.
Main geometric parameters of single-port wagon wheel fuel grain.
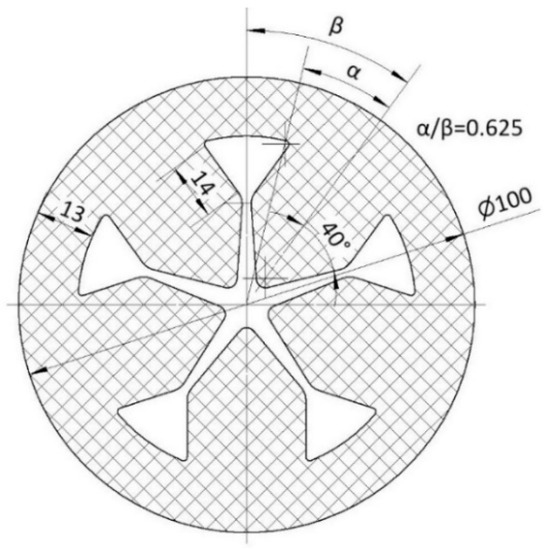
Figure 4.
Cross-sectional parameter diagram of single-port wagon wheel grain.
2.3. Energy Characteristics of Propellant
The high-concentration HP and HTPB/Al were adopted in this firing test. The detailed ratio of the fuel and mass fraction of the oxidizer are shown in Table 3. The energy characteristic of the propellant is mainly represented by the theoretic characteristic velocity and vacuum-specific impulse . Figure 5 shows the theoretic characteristic velocity and theoretic vacuum-specific impulse as the function of the O/F ratio for the propellants illustrated in Table 3 at a chamber pressure of 2 MPa and with a nozzle expansion ratio of 3. These values were obtained using the chemical equilibrium calculation tools of “NASA-CEA” [31]. It is evident that and were the strong function of the O/F ratio, and there was a peak value of close to the O/F ratio of 1.5. Obviously, the optimum O/F ratio of the propellant was 1.5, as shown in Figure 5. Meanwhile, the high level of and could be obtained during the range of optimal O/F, as shown in Figure 5. The thrust coefficient and can be expressed as:

Table 3.
Ratio of propellant.
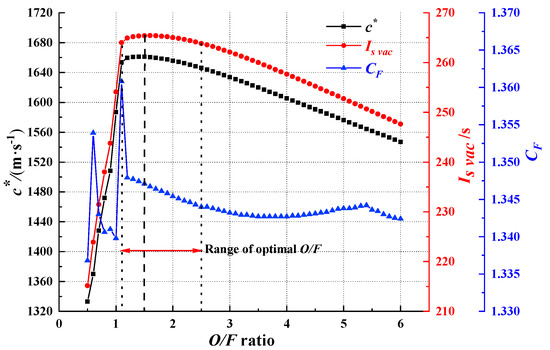
Figure 5.
The variation curve of theoretic characteristic velocity and vacuum specific impulse with O/F ratio, built using the CEA code (chamber pressure is 2 MPa, expansion ratio is 3).
The trend of and are almost the same; therefore, is vary scarcely with respect to the O/F. The nozzle efficiency can be computed according to the ratio of the specific impulse efficiency and c* efficiency :
The specific impulse efficiency was , the combustion efficiency was , and the nozzle efficiency was . Consequently, the nozzle efficiency could be expressed as:
2.4. Introduction of Measurement Equipment
In CYB-20S, the pressure measuring sensor, ion beam sputtering thin film pressure sensor was adopted as a sensitive element with an electronic circuit to set up an integrated structure and standard output signals such as the current and voltage. The measuring range was (selected), the accuracy was , and the corresponding frequency was about .
The thrust measuring sensor was CYB-602S, which is an S-type tension-pressure sensor. The measuring range was (selected), the accuracy was , and the corresponding frequency was about .
The Coriolis mass flowmeter was used to measure the oxidizer mass flow rate. The measuring range was (selected), the accuracy was , and the corresponding frequency was .
2.5. Oxidizer Delivery System
The oxidizer delivery system consisted of a gas control system, hydrogen peroxide tank, mass flowmeter, adjustable venturi, filter, solenoid valve, pressure regulator, overflow valve, and blowing pipeline, as shown in Figure 6. The method of extrusion pressurization with nitrogen was adopted, with hydrogen peroxide injected into the thrust chamber. The mass flow rate of the oxidizer was controlled by an adjustable venturi. The variable area cavitation venturi consisted of a venturi and a controllable pintle located concentrically in the venturi throat.
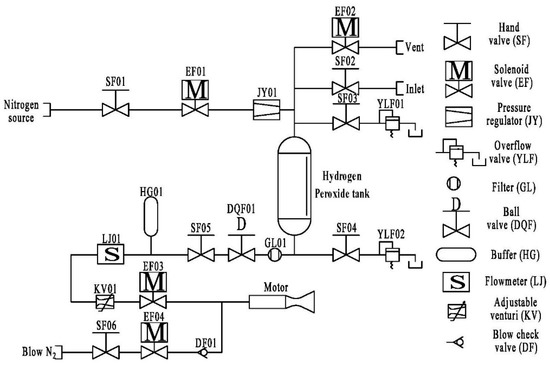
Figure 6.
Schematic diagram of oxidizer delivery system.
3. Methodology
3.1. Instantaneous Regression Rate Analysis
For the duration of a long firing test, the burning line length and the port area changed significantly, and the oxidizer mass flow flux and regression rate also changed continuously during the working process, especially for a variable thrust hybrid rocket motor. At this time, the calculation method of the average regression rate was no longer applicable. Therefore, it was critical to establish an instantaneous regression rate analysis method for HRM. In this way, the sensitivity of the regression rate to changes in oxidizer mass flux could be ascertained in a single firing test.
The following assumptions were established for the instantaneous regression rate analysis [32]:
- (1)
- The distribution of pressure in the combustion chamber was equal everywhere.
- (2)
- The zero-dimensional internal ballistic calculation was adopted.
- (3)
- The combustion gas could be considered an ideal gas, which follows the state equation of complete gas.
- (4)
- The nozzle expansion ratio was almost unchanged during the operating process.
The measured oxidizer mass flow rate was , with the average value of experiment-specific impulse efficiency, calculated by a traditional method, as . The detailed calculation process is described in Section 4.1. The average of the experiment oxidizer/fuel ratio O/F and average of experiment specific impulse efficiency were set in the first time-step. Therefore, the fuel mass flow rate could be expressed as:
The combustion chamber pressure and oxidizer/fuel ratio O/F were continuously changing during the operating process of HRM, and the nozzle expansion ratio was almost constant in the short-time firing test. The theoretic-specific impulse is a function of , O/F and , which is obtained by thermodynamic calculation from the NASA-CEA [31] in specifying the species distribution for the oxidizer and the fuel, the chamber pressure, and the oxidizer-to-fuel ratio. The theoretic-specific impulse can be expressed as follows:
Then, taking into account the effect of gravitational acceleration, the thrust generated in this time-step could be calculated as follows:
Under the condition of the measured chamber pressure , thrust , the throat area of the nozzle , oxidizer mass flow rate , the oxidizer/fuel ratio O/F and fuel mass flow rate could be iteratively calculated until accuracy was achieved:
According to the convergent fuel mass flow rate and the geometric parameters of grain, the oxidizer mass flux and regression rate could be calculated at this moment. Then, the burning grain thickness, port area and burning line length could be ensured at the next moment.
The average of the experiment specific impulse efficiency was calculated by a traditional method after the firing test. Therefore, the was set as the initial specific impulse efficiency. Then, the fuel mass flow rate could be calculated at every moment by the above-mentioned method, and integrated over the whole firing process. Additionally, the measurement of the total fuel consumption mass was . The specific impulse efficiency was also iteratively calculated until accuracy was achieved:
After the oxidizer/fuel ratio O/F in every time-step and the specific impulse efficiency were both iterated convergently, the instantaneous regression rate and instantaneous oxidizer mass flux were calculated and used in the application of the fitting regression rate formula. Additionally, the convergent-specific impulse efficiency was the average of the reconstruction specific impulse efficiency during the firing test of HRM.
3.2. Internal Ballistic Reconstruction Techniques
Several widely accepted definitions are provided before internal ballistic reconstruction:
- (1)
- The operating time of HRM : The operating time is the interval between the time when the combustion chamber pressure rises to 10% of the stable working pressure of the motor, and the time when the combustion chamber pressure drops to 10% of the stable working pressure of the motor after it is shutdown.
- (2)
- The burning time of HRM : The burning time is the interval between the two peaks of the quadratic module of the time derivative of chamber pressure, which is described in detail below. The time is the moment corresponding to the first peak, and the time is the moment corresponding to the second peak.
The traditional definition of the burning duration by the bisection method is suitable for the smooth curves of pressure time and thrust time. However, the chamber pressure and thrust oscillated in this firing test due to an instable combustion. Therefore, we adopted the method of the quadratic module at the time derivative in chamber pressure to obtain the burning duration, which is introduced in detail below.
The fuel actual consumption mass in the working process of HRM could be obtained by measuring the mass of the grain before and after the test. Due to the non-uniformity of combustion, the fuel consumption of each stage was not linear with time. The combustion chamber pressure could be positively related to the total mass flow rate during the working process. However, the chamber pressure was mainly contributed to by decomposed high-temperature gas from hydrogen peroxide and blowing nitrogen gas during the startup and shutdown periods. Therefore, the fuel consumption mass could be ignored during the startup and shutdown periods, and the consumption mass in the reconstruction calculation was approximate to during the working process of HRM, which could be expressed as:
According to the experimental data of the firing test of HRM, the internal ballistic reconstruction of the burning stage was conducted. The flow chart of internal ballistic reconstruction is shown in Figure 7. The average of the experiment oxidizer/fuel ratio O/F and the average of experiment were calculated by a traditional method. The burning stage of the measured test data of , , and were used. Additionally, the actual fuel consumption mass was integrated by chamber pressure to obtain during the burning stage. Then, the procedures of reconstruction calculation were as follows:
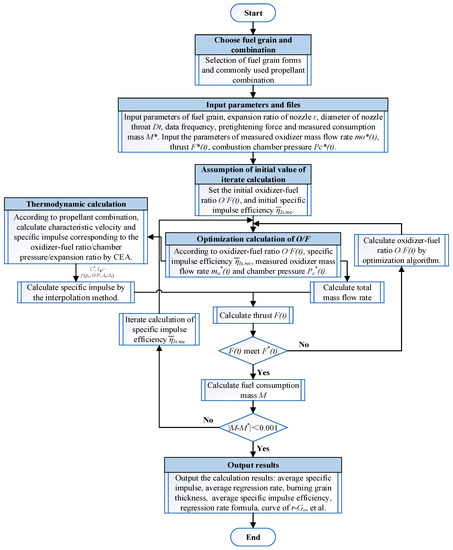
Figure 7.
The flow chart of internal ballistic reconstruction of HRM.
- (1)
- Set the average of the experiment O/F and as the initial oxidizer/fuel ratio O/F and the initial average of the reconstruction specific impulse efficiency ;
- (2)
- According to the initial O/F, initial , and measured , and , the optimized calculation of the actual oxidizer/fuel ratio can then be conducted;
- (3)
- Calculate the theoretic specific impulse under the different O/F, and by CEA, so as to form an interpolation table;
- (4)
- According to the update of O/F, and , calculate the actual specific impulse by the method of interpolation;
- (5)
- According to the update of the O/F, and in this time step, calculate the total mass flow rate of the motor;
- (6)
- According to the actual specific impulse and total mass flow rate calculated by steps (4) and (5), calculate in this time step;
- (7)
- Compare the calculated and measured firing test data of at every time-step. If the residual of is unqualified, return to step (3) and calculate the optimal oxidizer/fuel ratio O/F by the optimization algorithm until the residual of meets the requirement;
- (8)
- After meeting the requirement of the residual of inner circulation, compare the calculation results of the total fuel consumption mass and actual measured fuel consumption mass; then, judge whether or not . If positive, output the results. If negative, calculate by the interpolation method. Return to step (3), and the outer circulation is proceeded;
- (9)
- Fit the variation in the regression rate with the oxidizer mass flux by the least squares method and output the calculation results after reconstruction: average specific impulse, average regression rate, average specific impulse efficiency , the formula of the regression rate, the curve of , the accuracy of fitting and so on.
4. Results, Discussion, and Application
4.1. Firing Test Results
The laboratory 500 N-class firing test was carried out on the standard ground experiment system. Figure 8 shows snapshots from the firing process of HRM. The firing test lasted for 12.5 s and was the first time that a firing test of a single-port wagon wheel hybrid rocket motor was achieved. The photographs of the fuel grain of the single-port wagon wheel before and after the firing test are shown in Figure 9. It can be observed that unburnt propellant was produced during the short-duration firing test based on the laboratory Φ100 HRM. The average parameters of the experiment were analyzed and compared with the instantaneous parameters in the next section. The designed firing test conditions are shown in Table 4.
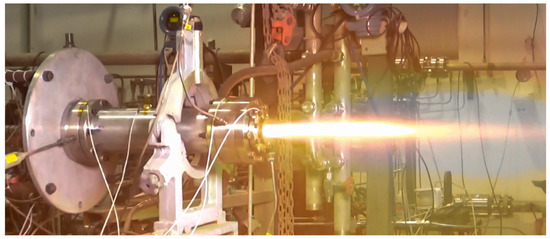
Figure 8.
Snapshots of firing test of HRM.
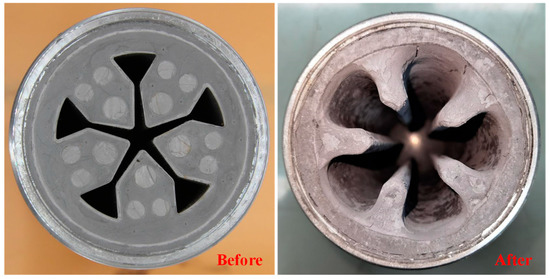
Figure 9.
Photographs of fuel grain before (left) and after (right) firing test.

Table 4.
Designed conditions of firing test.
According to Durand et al. [3], the burning time was obtained by measuring the difference of the instants materialized by two peaks of the quadratic module at the time derivative of chamber pressure, which can be expressed as . Figure 10 presents the curve of the chamber pressure with time and the quadratic module of the time derivative of the chamber pressure. Obviously, the first peak, corresponding with the ignition moment of HRM, appeared in , and the second peak, corresponding to the flameout moment, appeared in . Therefore, the burning time of the firing test was . The significant peaks in the dotted frame, which occurred due to the blowing stage, could be ignored in the calculation of the burning time.
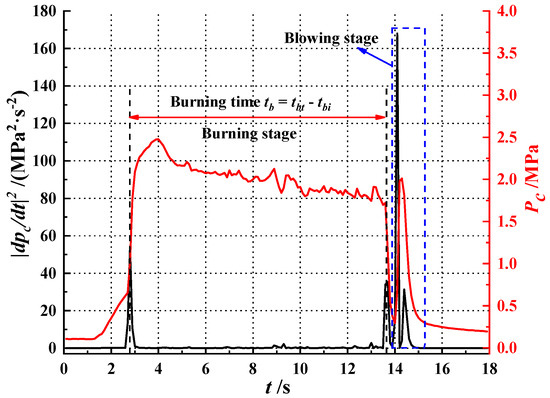
Figure 10.
Method for determining the burning time.
Figure 11 shows the measured test data of the chamber pressure and thrust during the firing test of a single-port wagon wheel hybrid rocket motor. The measured average chamber pressure was 2.03 MPa. Although the chamber pressure and thrust slightly oscillated in the middle firing stage due to unstable combustion, the reconstruction for the instantaneous regression rate was basically unaffected. The nozzle throat diameters that were measured before and after the firing test were 14.87 mm and 14.67 mm, respectively. Since the material of the nozzle was copper-infiltrated tungsten, there was little erosion on the nozzle. In addition, a little metallic oxide was sedimented in the throat of the nozzle. Additionally, the decrease in chamber pressure was due to the decrease in the total mass flow rate. The oxidizer mass flow rate was constant, but the fuel regression rate decreased with a reduction in the oxidizer flow flux in HRM. The whole process of the firing test used a closed-loop control system to achieve the target of the oxidizer mass flow rate. The oxidizer mass flow rate measured by the mass of the flowmeter is shown in Figure 12. The target of the oxidizer mass flow rate was 130 g/s, and the average measured data of the firing stage were 129.27 g/s. Therefore, the error of oxidizer mass flow rate was lower than 0.57%. As shown in Figure 12, the first and second control adjustment stages were due to abrupt changes in the chamber pressure, and the venturi did not enter the working stage in the meantime.
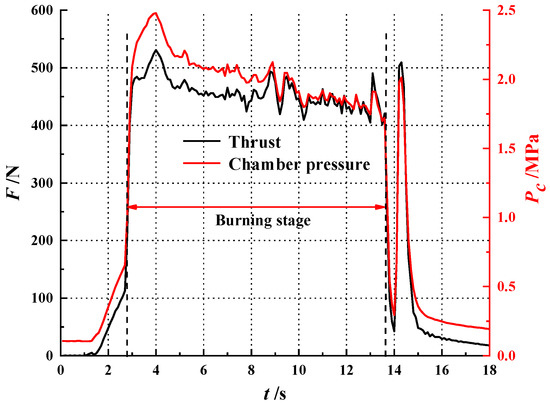
Figure 11.
Measured temporal data of chamber pressure and thrust during the firing test.
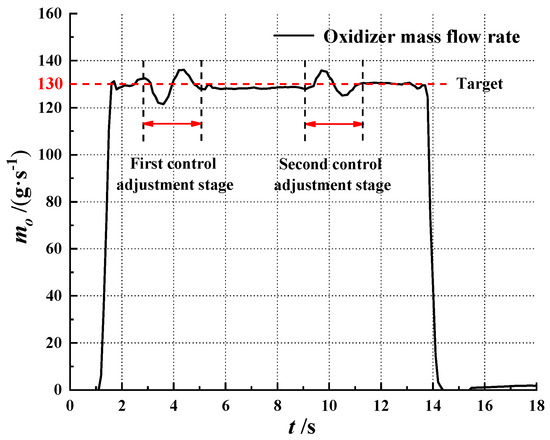
Figure 12.
Measured test data of oxidizer mass flow rate.
The measured actual consumption mass of solid fuel was . Therefore, the average fuel mass flow rate could be calculated by Equation (10):
and the average O/F ratio could be expressed by:
The theoretic characteristic velocity was computed from the thermochemical equilibrium software NASA CEA [31] with a chamber pressure of 2.03 MPa, an average O/F ratio of 0.87, and a nozzle expansion ratio of 3. As a crucial factor in evaluating how the propellants were effectively combusted, the according to the ratio of to could be defined as:
where, is the total consumption mass of oxidizer and fuel, is the nozzle throat area, and .
Additionally, the experiment-specific impulse during the firing test of HRM was calculated by:
With calculating the theoretic specific impulse by NASA CEA [31], the specific impulse efficiency could be defined as:
Detailed results of the firing test are shown in Table 5.

Table 5.
Results of firing test.
4.2. Instantaneous Reconstruction Analysis and Fitting of Regression Rate Formula
According to the internal ballistic reconstruction techniques described in Section 3.2, the instantaneous parameters for the firing test of HRM were reconstructed by the post-processing software. In this process of reconstruction, the instantaneous spatially average parameters were obtained based on measured instantaneous test data of , and . The O/F ratio of each time step was iterated until the residual of meeting this requirement, and then, could be calculated by the convergent O/F ratio and measured . Consequently, the regression rate of each step could be calculated according to the and geometric parameters of fuel grain, which was expressed by:
where is the density of fuel and is the burning area.
It was generally believed that could be related to the oxidizer flow flux but not the chamber pressure during the middle oxidizer mass flux rate, which followed the diffusion-controlled theory [33,34]. Therefore, the equation of the regression rate could be simplified to:
where is the pre-exponential factor and is the oxidizer flow flux index, which are both constant, and is the port area.
The frequency of firing test data that could be input into the computer program was 10 Hz. After the calculation of reconstruction, the instantaneous regression rate and oxidizer mass flux of each step was rebuilt, and the average regression rate during the burning stage of the firing test was 0.576 mm/s. The oxidizer mass flow rate was basically stable, as shown in Figure 12. However, as the port area of the fuel grain increased, the oxidizer mass flux decreased continuously. Figure 13 shows the variation in the instantaneous regression rate and oxidizer mass flux with time, fitting curves, and the confidence band. According to the relationship between the regression rate and oxidizer mass flux described in Equation (18), the regression rate decreased continuously during the firing test. In addition, the decrease in the regression rate was slower than that of the oxidizer mass flux, as shown in Figure 13, which accords well with the theoretical value of the oxidizer flow flux index , which was less than one [16].
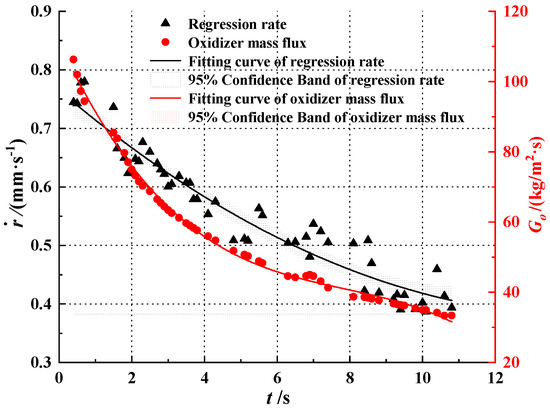
Figure 13.
Curves of instantaneous regression rate and oxidizer mass flux.
Figure 14 presents the scatter diagram of the instantaneous regression rate and oxidizer flow flux, which was used for the oxidizer flow flux model. Obviously, the regression rate had a greater fluctuation due to the oscillating thrust and chamber pressure. The coefficient of determination (R2) was 0.7614, and the accuracy of fit could not meet the requirement. In order to improve the accuracy of the fitting formula demonstrated by the regression rate, a more accurate fitting model was adopted.
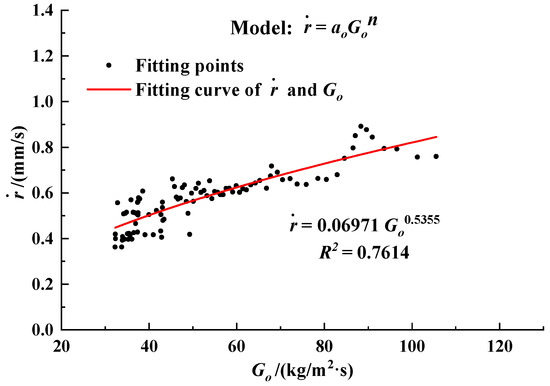
Figure 14.
The variation scatter diagram of instantaneous regression rate with oxidizer flow flux (Go), and the fitting curve of regression rate using oxidizer flow flux model.
Equation (18) was simplified. According to Ref. [34], the more accurate expression for the regression rate was that the regression rate
related to the total mass flux , which could be written as:
As shown in Figure 15, the coefficient of determination R2 of the total mass flux model was higher than that of the oxidizer mass flow rate model in the same coefficient of standard deviation. The results of fitting of the regression rate formula with different formula models are shown in Table 6. The R2 of the total mass flux model was 0.8598, which is higher than the R2 = 0.7614 of the oxidizer mass flow rate model. According to the derivation of the theoretical equation, can be expressed by as:
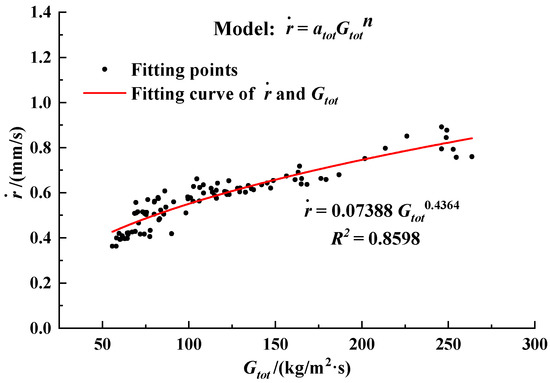
Figure 15.
The variation scatter diagram of instantaneous regression rate with total mass flux (Gtot), and the fitting curve of regression rate using total mass flux model.

Table 6.
Results of formula fitting with different formula model.
Based on Equation (20)–(22), it is evident that varied with the change in O/F, which was not constant. Therefore, if the O/F varied, the variation in the correlation obtained using Equation (19) would be less than that obtained using Equation (18). On the other hand, the formula model for the fitting of the regression rate in Equation (19) was more accurate than Equation (18) in the post-processing firing test. This was analyzed in detail by CT scanning in Section 4.3. The conclusion was drawn that Equation (18) could be applied to the design of an experiment, and the formula model Equation (19) was used for the post-processing of a test to fit the more accurate equation of the regression rate. Consequently, the formula of the regression rate fitted by experiment data from only a single firing test could be written as:
c* efficiency is an important index to measure the performance of HRM. Therefore, the influence factors of c* efficiency during the operating stage in a single firing test was researched by a reconstruction calculation. It is widely acknowledged that the possible variation in c* efficiency is a function of the characteristic length [15]. , as the motor considered here, changed with the burn time from 5.04 m at the start of the experiment to 10.74 m at the end of 10.9 s of burn time. The final value of was approximately two times that of the starting value. The variation in and was described in Figure 16 and was calculated according to:
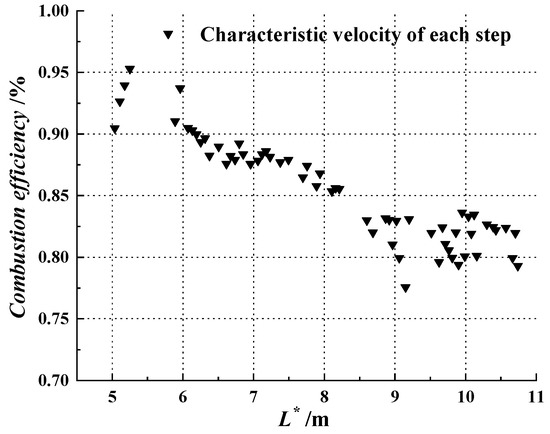
Figure 16.
Relation between the and obtained by reconstruction calculation.
As shown in Figure 16, the reconstructed instantaneous and of each step were calculated. It was obvious that as increased, showed an apparent decreasing trend. Tian et al. [35] proposed that the liquid oxidizer flow distribution had significant effects on the combustion characteristics in the whole operating process. Additionally, the reason for this might have been the diffusion combustion characteristic of HRM. With the increase in the port area, the oxidizer injected into the combustion chamber by the catalytic bed, which was closed to the axis, was far from the flame layer, and could not be mixed completely. Then, this part of the oxidizer was squirted from the nozzle without reacting completely. Meanwhile, the lower combustion chamber pressure was also not conducive compared to the efficient combustion, which then affected the improvement in c* efficiency, as shown in Figure 17.
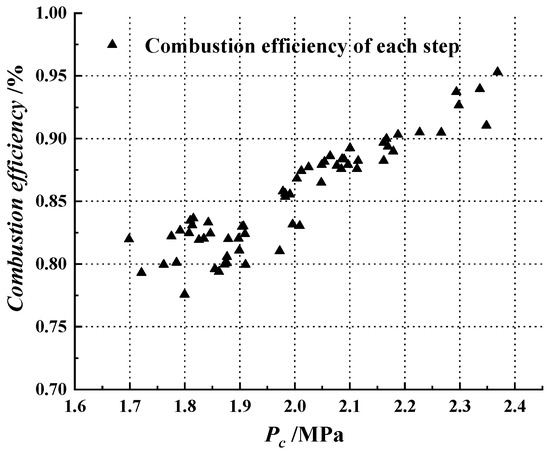
Figure 17.
Relation between the and obtained by reconstruction calculation.
Table 7 gives the comparison between the weight loss method and reconstruction calculation. The average results of the reconstruction calculation were in good agreement with the average of the test data described in Section 4.1. Additionally, the maximum error of the average O/F ratio was 5.75%, proving that the reconstruction techniques applied in this paper were practicable to rebuild the instantaneous parameters during the firing test of HRM. Furthermore, the fitting of the regression rate formula was achieved by only a single firing test.

Table 7.
Comparison between test data and reconstruction calculation.
4.3. CT Scanning Results
The combustion chamber was scanned by CT. The purpose of the CT scanning analysis was to obtain the axial variation in the regression rate and to further verify the accuracy of the instantaneous reconstruction calculation. The length of the fuel grain was 375 mm, and the axial cross sections of the front and ending parts were taken out for comparison. The photograph of the front part and corresponding cross-section images are shown in Figure 18, and the distance from the slice to the front edge was 28 mm. Similarly, the photograph of the ending part and corresponding cross-section images are shown in Figure 19, and the distance from the slice to the front edge was 348 mm. It is obvious that the erosion of the front part was more severe than that of the ending part, and the axial distribution of the regression rate is quantitatively analyzed in detail below.
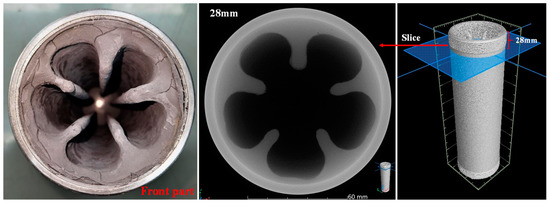
Figure 18.
Photograph of front part (28 mm) and corresponding cross-section images by CT scanning.
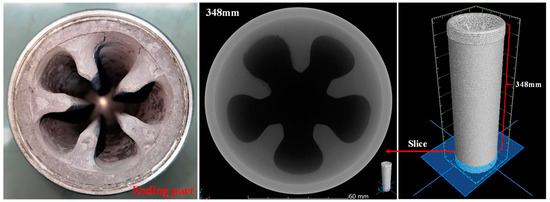
Figure 19.
Photograph of ending part (348 mm) and corresponding cross-section images by CT scanning.
The method of digital image processing proposed by Cai et al. [36], which is in the authors’ previous study, was used in this article. In a brief summary, the scanned axial cross-section image was segmented by the edge threshold and the gray image was transformed into a binary image; then, the area of the remaining fuel grain was calculated. Thereby, the regression rate of each axial cross-section could be expressed by the variation in the hydraulic radius of the port:
where is the port area of each axial cross-section after the firing test, is the initial port area, is the burning line length of each axial cross-section after the firing test and the is the initial length.
The specific operation process of the optimal threshold segmentation is shown in Figure 20 [36]. Through the calculation of the average gray level and iterative calculation of threshold value, the optimal threshold value could be determined. Additionally, the axial cross-section image was divided into two parts according to the optimal threshold value. When the binary conversion was further performed, the pixel values of the residual fuel grain were defined as one, and the other pixel values were defined as 0. Then, the stainless-steel shell could be removed through the shading method. Thereby, the area of residual fuel grain could be characterized by counting the area of points with a pixel value of one, and the burning line length could be calculated by counting the port perimeter so as to describe the characteristics of the regression rate. As shown in Figure 21, the left figure shows the axial cross-section of the combustion chamber by CT scanning, and the right one depicts an image of single-port wagon wheel fuel grain after iterative threshold segmentation and the establishment of a mask.
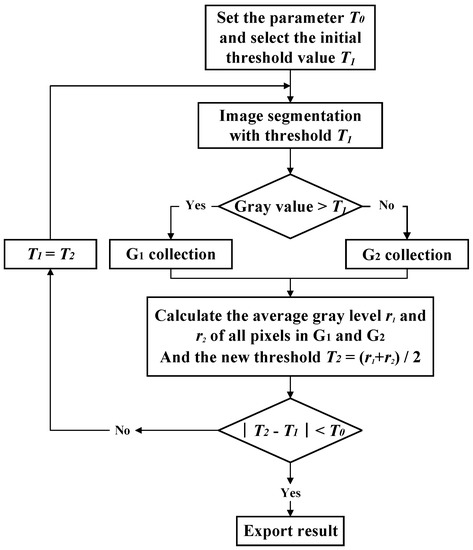
Figure 20.
The flow chart of iterative threshold segmentation [36].
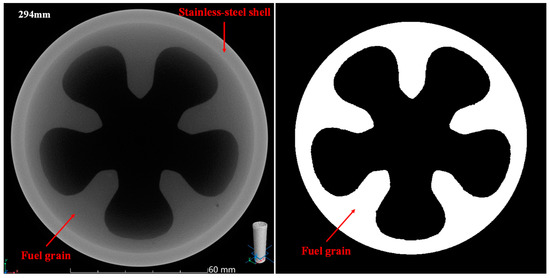
Figure 21.
Photograph of axial cross-section image of combustion chamber (left) and axial cross-section image of fuel grain (right) after threshold segmentation.
Cross-section scanning of the combustion chamber along the axial direction from the front chamber to the ending chamber was undertaken every 0.5 mm. Additionally, each cross-section image was conducted by iterative threshold segmentation and pixel statistics. Then, every average regression rate during the firing test of the cross-section was characterized by Equation (25), and the variation along the axial location is shown in Figure 22. It could be observed that the regression rate of the front and ending part of the fuel grain was significantly high and decreased distinctly until reaching a minimum. Then, the regression rate of each axial cross-section moderately increased at first and slightly decreased with the increase in the axial location. According to the Blasius effect, the boundary layer of the front part of the fuel surface was thin, and the high regression rate in the front part of the fuel grain could be attributed to the sufficient oxidizer flow and vortex in the pre-combustion chamber, which could enhance the heat transfer and the diffusion of fuel pyrolysis. The increase in the regression rate along the axis may have been due to the mass addition of the pyrolyzing fuel, which led to an increase in the total mass flux downstream [37]. This further verified the suitability of the total mass flux model to fit the regression rate, which is described in Section 4.2. Additionally, the high regression rate in the ending part of the fuel grain may have also resulted from the vortex in the post-combustion chamber. The results accord well with Ref. [38]: the regression rate was not constant in the direction along the axis of the motor but depended on the distance from the tip of the flame. The tip of the flame was normally located in the front of the fuel surface. Therefore, the regression rate was maximal near the tip of the flame and decreased with the increasing distance from the tip.
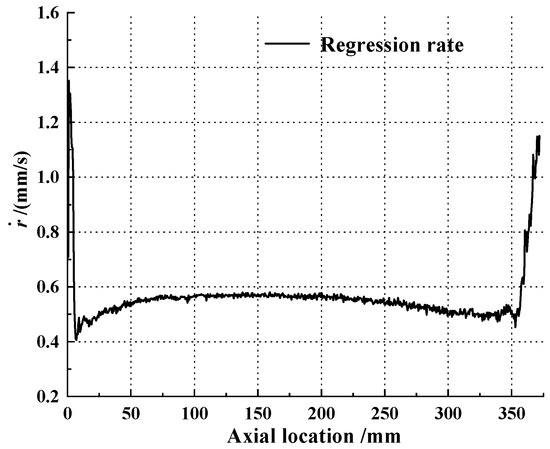
Figure 22.
Average regression rate along axial location by CT scanning and pixel statistic.
The maximum regression rate that appeared near the chamber head was about 1.35 mm/s, and the average axial regression rate was 0.565 mm/s. Additionally, the average regression rate calculated by reconstruction was 0.576 mm/s, which is described in Section 4.2. The error of the average regression rate between the CT scanning and reconstruction calculation was 1.91%, proving that the CT scanning and pixel statistic method for calculating the regression rate was practicable in order to characterize the axial distribution of the average regression rate during the firing test. Compared with the average regression rate calculated by reconstruction, the result of the reconstruction algorithm was slightly higher than that of CT scanning. This was because the consumption fuel mass used in the reconstruction algorithm was the actual consumption of the fuel mass during the whole working process of HRM, which was more than the consumption fuel mass during the burning stage.
5. Conclusions
In this study, the firing test of a hybrid rocket motor with a single-port wagon wheel was designed to investigate the instantaneous fuel regression rate during the firing test. The accuracy of the reconstruction calculation was verified by measuring the experiment data. The achievement of fitting the regression rate formula by a single firing test is a significant contribution to the future study of regression rate law. Additionally, reconstruction techniques could be used to rebuilt the instantaneous performance parameters that could not be directly measured during the firing test of HRM. Furthermore, CT scanning was used to characterize the axial distribution of the average regression rate during the test. The main conclusions of this study are as follows:
- (1)
- The firing test of HRM with a single-port wagon wheel fuel grain, using 98HP and HTPB/Al propellants, was carried out successfully. The burning time was ensured by the calculation of the quadratic module at the time derivative of the chamber pressure. The average pressure was . The c* efficiency was , and the specific impulse efficiency was .
- (2)
- Using the measured experiment data of thrust, combustion chamber pressure and oxidizer mass flow rate, the internal ballistic reconstruction was conducted to calculate the instantaneous parameters of the firing test of HRM. As the characteristic length increased and the combustion chamber pressure decreased, c* efficiency had an apparently decreasing trend. The average results of reconstruction calculation were in good agreement with the average of the test data. Additionally, the maximum error of the average O/F ratio was lower than 5.75%.
- (3)
- The regression rate formula was fitted using reconstruction techniques with only a single firing test. The coefficient of determination R2 was improved by adopting a more accurate model. The R2 = 0.8598 of the total mass flux model was higher than R2 = 0.7614 for the oxidizer flow flux. Therefore, the total mass flux model was more suitable for the fitting of the regression rate.
- (4)
- The regression rate of each axial cross-section first plummeted and then gradually decreased with the increasing axial location, as characterized by CT scanning. The maximum regression rate, which occurred near the chamber head, was about 1.35 mm/s, and the average axial regression rate was 0.565 mm/s. Furthermore, the error in the average regression rate between CT scanning and the reconstruction calculation was only 1.91%, demonstrating that the reconstruction techniques provided a reliable method for characterizing the instantaneous regression rate using only a single firing test.
In our opinion, the regression rate law of HRM should be further investigated by instantaneous regression rate measurement experiments in the future. A more precise prediction of the internal ballistic performance of the HRM can be achieved through the use of a more accurate regression rate formula, thereby enhancing the ability to control the thrust parameters more precisely.
Author Contributions
Conceptualization, T.W., G.C. and H.T.; methodology, T.W.; software, T.W.; validation, T.W.; formal analysis, T.W. and Y.Z.; investigation, T.W. and X.M.; writing—original draft preparation, T.W.; writing—review and editing, T.W. and C.L.; visualization, T.W.; supervision, G.C. and H.T.; project administration, G.C.; funding acquisition, H.T. All authors have read and agreed to the published version of the manuscript.
Funding
This research was funded by the National Natural Science Foundation of China, grant number U20B2034.
Institutional Review Board Statement
Not applicable.
Informed Consent Statement
Not applicable.
Data Availability Statement
Not applicable.
Acknowledgments
The authors would like to express their gratitude to Beihang University, who supported the hybrid technology development.
Conflicts of Interest
The authors declare no conflict of interest.
Nomenclature
| Variables | I | total impulse | |
| Is | specific impulse | ||
| c* | characteristic exhaust velocity | t | time |
| R | radius | ||
| S | burning line length | ||
| ρ | density | Subscripts | |
| A | area | ||
| a | pre-exponential factor | e | section of nozzle exit |
| n | oxidant flow flux index | c | combustion chamber |
| G | mass flow flux | f | fuel |
| D | diameter | o | oxidizer |
| L | grain length | t | section of nozzle throat |
| regression rate | p | port | |
| F | force | a | operating |
| mass flow rate | b | burning | |
| p | pressure | s | stable operating |
| L* | characteristic length | exp | experiment |
| V | volume | the | theoretical |
| O/F | oxidizer/fuel ratio | vac | vacuum |
| e | grain thickness | opt | optimal |
| θ | spokes angle | throat | nozzle throat |
| h | spokes height | tot | total |
| δ | spokes angle coefficient | hyd | hydraulic |
| M | fuel consumption mass | ||
| ε | residual error | Superscripts | |
| η | efficiency | ||
| N | spokes number | * | measured data during the firing test |
References
- Cai, G.B. Development and Application of Hybrid Rocket Motor Technology: Overview and Prospect. J. Propuls. Technol. 2012, 33, 831–839. [Google Scholar] [CrossRef]
- Okninski, A.; Kopacz, W.; Kaniewski, D.; Sobczak, K. Hybrid Rocket Propulsion Technology for Space Transportation Revisited—Propellant Solutions and Challenges. FirePhysChem 2021, 1, 260–271. [Google Scholar] [CrossRef]
- Durand, J.É.; Lestrade, J.Y.; Anthoine, J. Restitution Methodology for Space and Time Dependent Solid-Fuel Port Diameter Evolution in Hybrid Rocket Engines. Aerosp. Sci. Technol. 2021, 110, 106497. [Google Scholar] [CrossRef]
- Marquardt, T.; Majdalani, J. Review of Classical Diffusion-Limited Regression Rate Models in Hybrid Rockets. Aerospace 2019, 6, 75. [Google Scholar] [CrossRef]
- Greatrix, D.R. Regression Rate Estimation for Standard-Flow Hybrid Rocket Engines. Aerosp. Sci. Technol. 2009, 13, 358–363. [Google Scholar] [CrossRef]
- Chiaverini, M.J.; Harting, G.C.; Lu, Y.C.; Kuo, K.K.; Peretz, A.; Jones, S.; Wygle, B.; Arves, J.P. Pyrolysis Behavior of Hybrid Rocket Solid Fuels under Rapid Heating Conditions. In Proceedings of the 33rd Joint Propulsion Conference and Exhibit, Seattle, WA, USA, 6–9 July 1997. [Google Scholar]
- Sun, X.; Tian, H.; Li, Y.; Yu, N.; Cai, G. Regression Rate Behaviors of HTPB-Based Propellant Combinations for Hybrid Rocket Motor. Acta Astronaut. 2016, 119, 137–146. [Google Scholar] [CrossRef]
- Leccese, G.; Bianchi, D.; Nasuti, F.; Stober, K.J.; Narsai, P.; Cantwell, B.J. Experimental and Numerical Methods for Radiative Wall Heat Flux Predictions in Paraffin–Based Hybrid Rocket Engines. Acta Astronaut. 2019, 158, 304–312. [Google Scholar] [CrossRef]
- Tian, H.; Li, X.; Zeng, P.; Yu, N.; Cai, G. Numerical and Experimental Studies of the Hybrid Rocket Motor with Multi-Port Fuel Grain. ACTA Astronaut. 2014, 96, 261–268. [Google Scholar] [CrossRef]
- Wu, Y.; Yu, X.; Lin, X.; Li, S.; Wei, X.; Zhu, C.; Wu, L. Experimental Investigation of Fuel Composition and Mix-Enhancer Effects on the Performance of Paraffin-Based Hybrid Rocket Motors. Aerosp. Sci. Technol. 2018, 82–83, 620–627. [Google Scholar] [CrossRef]
- Smirnov, N.N.; Nikitin, V.F.; Dushin, V.R.; Filippov, Y.G.; Nerchenko, V.A.; Khadem, J. Combustion Onset in Non-Uniform Dispersed Mixtures. Acta Astronaut. 2015, 115, 94–101. [Google Scholar] [CrossRef]
- Kushnirenko, A.G.; Stamov, L.I.; Tyurenkova, V.V.; Smirnova, M.N.; Mikhalchenko, E.V. Three-Dimensional Numerical Modeling of a Rocket Engine with Solid Fuel. Acta Astronaut. 2021, 181, 544–551. [Google Scholar] [CrossRef]
- Betelin, V.B.; Kushnirenko, A.G.; Smirnov, N.N.; Nikitin, V.F.; Tyurenkova, V.V.; Stamov, L.I. Numerical Investigations of Hybrid Rocket Engines. Acta Astronaut. 2018, 144, 363–370. [Google Scholar] [CrossRef]
- Kumar, R.; Ramakrishna, P.A. Issues Related to the Measurement of Regression Rate of Fast-Burning Hybrid Fuels. J. Propuls. Power 2013, 29, 1114–1121. [Google Scholar] [CrossRef]
- Kumar, R.; Ramakrishna, P.A. Measurement of Regression Rate in Hybrid Rocket Using Combustion Chamber Pressure. Acta Astronaut. 2014, 103, 226–234. [Google Scholar] [CrossRef]
- Kuo, K.K.; Chiaverini, M.J. Fundamentals of Hybrid Rocket Combustion and Propulsion; American Institute of Aeronautics and Astronautics: Viginia, NV, USA, 2015. [Google Scholar]
- Boardman, T.A.; Porter, L.G.; Brasfield, F.W.; Abel, T.M. An Ultrasonic Fuel Regression Rate Measurement Technique for Mixture Ratio Control of a Hybrid Motor. In Proceedings of the 31st Joint Propulsion Conference and Exhibit, San Diego, CA, USA, 10–12 July 1995. [Google Scholar] [CrossRef]
- Frederick, R.A.; Traineau, J.C.; Popo, M. Review of Ultrasonic Technique for Steady State Burning Rate Measurements. In Proceedings of the 35th Intersociety Energy Conversion Engineering Conference and Exhibit, Las Vegas, NV, USA, 24–28 July 2000. [Google Scholar]
- Serin, N.; Chiaverini, M.J.; Harting, G.C.; Kuo, K.K. Pressure Correction of Ultrasonic Regression Rate Measurements of a Hybrid Slab Motor. In Proceedings of the 35th Joint Propulsion Conference and Exhibit, Los Angeles, CA, USA, 20–24 June 1999. [Google Scholar]
- Chiaverini, M.J.; Kuo, K.K.; Peretz, A.; Harting, G.C. Regression-Rate and Heat-Transfer Correlations for Hybrid Rocket Combustion. J. Propuls. Power 2001, 17, 99–110. [Google Scholar] [CrossRef]
- Evans, B.; Favorito, N.; Kuo, K. Study of Solid Fuel Burning-Rate Enhancement Behavior in an X-Ray Translucent Hybrid Rocket Motor. In Proceedings of the 41st AIAA/ASME/SAE/ASEE Joint Propulsion Conference & Exhibit, Tucson, AZ, USA, 10–13 July 2005. [Google Scholar]
- Evans, B.; Risha, G.A.; Favorito, N.; Boyer, E.; Wehrman, R.B.; Libis, N.; Kuo, K.K. Instantaneous Regression Rate Determination of a Cylindrical X-Ray Transparent Hybrid Rocket Motor. In Proceedings of the 39th AIAA/ASME/SAE/ASEE Joint Propulsion Conference and Exhibit, Huntsville, AL, USA, 20–23 July 2003; p. AIAA 2003-4592. [Google Scholar]
- De Zilwa, S.; Zilliac, G.; Reinath, M.; Karabeyoglu, A. Time-Resolved Fuel-Grain Port Diameter Measurement in Hybrid Rockets. J. Propuls. Power 2004, 20, 684–689. [Google Scholar] [CrossRef]
- Nagata, H.; Nakayama, H.; Watanabe, M.; Wakita, M.; Totani, T. Accuracy and Applicable Range of a Reconstruction Technique for Hybrid Rockets. Adv. Aircr. Spacecr. Sci. 2014, 1, 273–289. [Google Scholar] [CrossRef]
- Osmon, R.V. Experimental Investigation of a Lithium Aluminum Hydride-Hydrogen Peroxide Hybrid Rocket. J. Aerosp. Eng. 1966, 62, 92–102. [Google Scholar]
- George, P.; Krishnan, S.; Varkey, P.M.; Ravindran, M.; Ramachandran, L. Fuel Regression Rate in Hydroxyl-Terminated-Polybutadiene/Gaseous-Oxygen Hybrid Rocket Motors. J. Propuls. Power 2001, 17, 35–42. [Google Scholar] [CrossRef]
- Carmicino, C.; Sorge, A.R. Influence of a Conical Axial Injector on Hybrid Rocket Performance. J. Propuls. Power 2006, 22, 984–995. [Google Scholar] [CrossRef]
- Saito, Y.; Kamps, L.; Komizu, K.; Soeda, K.; Bianchi, D.; Nasuti, F.; Nagata, H. The Accuracy of Reconstruction Techniques for Determining Hybrid Rocket Fuel Regression Rate. In Proceedings of the 2018 Joint Propulsion Conference, Cincinnati, OH, USA, 9–11 July 2018. [Google Scholar]
- Wernimont, E.J.; Heister, S.D. Reconstruction Technique for Reducing Hybrid-Rocket Combustion Test Data. J. Propuls. Power 1999, 15, 128–136. [Google Scholar] [CrossRef]
- Wei, T.; Cai, G.; Tian, H.; Zhu, H.; Zhang, Y.; Li, X. Optimization Design in Single Wagon-Wheel Fuel Grain of Hybrid Rocket Motor. FirePhysChem 2021, 1, 212–221. [Google Scholar] [CrossRef]
- Gordon, S.; McBride, B.J.; Zeleznik, F.J. Computer Program for Calculation of Complex Chemical Equilibrium Compositions and Applications. Supplement I—Transport Properties. NASA Technol. Memo. 1984. [Google Scholar]
- Li, X. Fuel Grain Design and Numerical Investigation of Hybrid Rocket Motor. Ph.D. Thesis, Beihang University, Beijing, China, 2014. [Google Scholar]
- Marxman, G.A. Combustion in the Turbulent Boundary Layer on a Vaporizing Surface. Symp. Combust. 1965, 10, 1337–1349. [Google Scholar] [CrossRef]
- Marxman, G.A.; Wooldridge, C.E.; Muzzy, R.J. Fundamentals of Hybrid Boundary-Layer Combustion. Prog. Astronaut. Rocket. 1964, 15, 485–522. [Google Scholar]
- Tian, H.; Jiang, X.; Yu, R.; Zhu, H.; Zhang, Y.; Cai, G. Numerical Analysis of the Hybrid Rocket Motor with Axial Injection Based on Oxidizer Flow Distribution. Acta Astronaut. 2022, 192, 245–257. [Google Scholar] [CrossRef]
- Cai, G.; Wei, T.; Zhang, Y.; Wang, P.; Liu, Y.; Han, Y. Research on Copper Erosion in Hydrogen Peroxide/Kerosene Bipropellant Thrust Chamber. Acta Astronaut. 2021, 188, 252–264. [Google Scholar] [CrossRef]
- Sutton, G.P.; Biblarz, O. Rocket Propulsion Elements; John Wiley & Sons: Hoboken, NJ, USA, 2016; ISBN 9781118753651. [Google Scholar]
- Tyurenkova, V.V.; Smirnova, M.N. Material Combustion in Oxidant Flows: Self-Similar Solutions. Acta Astronaut. 2016, 120, 129–137. [Google Scholar] [CrossRef]
Disclaimer/Publisher’s Note: The statements, opinions and data contained in all publications are solely those of the individual author(s) and contributor(s) and not of MDPI and/or the editor(s). MDPI and/or the editor(s) disclaim responsibility for any injury to people or property resulting from any ideas, methods, instructions or products referred to in the content. |
© 2023 by the authors. Licensee MDPI, Basel, Switzerland. This article is an open access article distributed under the terms and conditions of the Creative Commons Attribution (CC BY) license (https://creativecommons.org/licenses/by/4.0/).