Abstract
Long landing hazardous events (long landings) are regarded as the most common unsafe events during an aircraft’s landing phase and are significantly influenced by pilots’ leveling operations. This paper proposes a pre-warning method for long aircraft landings based on operation characteristics clustering to better prevent the occurrence of long landing events and develop pre-warning technology for long aircraft landings applicable to actual civil aviation aircraft operations. Based on the quick access recorder (QAR) flight data of a Boeing B737-800 fleet, the Gaussian mixture model (GMM) clustering method was employed to cluster, group, analyze, and evaluate the pilot operation characteristics utilizing the relative indicators of aircraft speed in the takeoff and landing phases as the measurement indices. Moreover, a long landing pre-warning model was developed based on the eXtreme Gradient Boosting (XGBoost) algorithm to account for the overall characteristics of various operations. The complete accuracy, recall ratio, and precision of the long landing pre-warning method based on pilot operation characteristics clustering reached 89.66%, 89.16%, and 92.50%, respectively, in the test of the pre-warning model, demonstrating a significant improvement over those of the pre-warning model without considering the operation characteristics and presenting a more effective pre-warning effect. Optimizing the long landing pre-warning model with pilot operation characteristics can effectively improve the model’s pre-warning capabilities, assist the crew in making accurate decisions, and prevent unsafe events during aircraft landing.
1. Introduction
Long landings are unsafe events and crucial contributors to landing overrun incidents. The safety report [1] released by the International Air Transport Association (IATA) in 2021 revealed that 40% of the landing overrun accidents in 2020 were caused by long landings. Long landings are primarily characterized by the excessively long time and distance of floating and a late touchdown, which typically results in a reduction in the proportion of accessible runways. Therefore, the rapid and accurate long landing pre-warnings will contribute to the crew’s correct decisions and efficiently guarantee flight safety during landing.
The existing research on long landings primarily focuses on analyzing the influencing factors rather than the prediction of a model of long landing. For example, Wang et al. [2] conducted a correlation analysis on flight parameters from 50 ft to the touchdown section and discovered that the descent rate during this phase had the most significant impact on long landings. In actual civil aviation flight practice, long landings are also closely tied to the flight operations of pilots prior to touchdown. Sun et al. [3,4,5], based on the analysis of quick access recorder (QAR) data, concluded that the remote landing point of an aircraft might be caused by the difference in wind directions and the throttle’s control during the landing phase. They further proposed a random forest-based pre-warning method for long aircraft landings. In addition, Wang et al. [6,7] found leveling an essential operation affecting the landing distance and suggested that pilots carefully check the descent rate ratio to ground speed at an altitude of 50 ft.
In actual airline operations, the objective flight data recorded by QAR is primarily utilized to monitor the aircraft’s floating distance through the implementation of flight operation quality assurance (FOQA) [8]. Due to the great recording and monitoring effect of QAR data on aircraft operation-related parameters, a number of scholars have developed models based on QAR data for the early warning and diagnosis of unsafe events in flight. For instance, Cohen et al. [9] established models based on QAR data for the first time to predict flight accidents and unsafe events. Haverdings et al. [10] developed QAR data analysis software to analyze and study low-level wind shear, turbulence, and wake vortex events at Hong Kong International Airport (HKIA). Chinese scholars have also carried out pertinent research based on QAR data. Cao et al. [11] first introduced machine learning to a complex landing detection model based on QAR data, providing an efficient method for challenging landing diagnosis. Methods such as Monte Carlo [12], support vector machine [13], and the K-means clustering model based on the RBF neural network [14], in which prediction models were all built with flight data, were also applied to relevant research.
The existing prediction methods for long landings focus on analyzing flight state parameters, whereas pilot operations are seldom considered. Therefore, this paper comprehensively evaluates the different leveling operations’ impact and pilots’ various operation characteristics during long landings. The existing pre-warning methods were improved to present higher pre-warning accuracy. A pre-warning model based on pilot operation characteristics was built using the integrated learning eXtreme Gradient Boosting (XGBoost) algorithm. This was trained using the QAR data of actual B737-800 aircraft in a fleet, and its applicability was tested to provide a reference for pilot decision-making and operations in the landing phase and further prevent long landings.
2. Long Landing Pre-Warning Model
2.1. A Pre-Warning Model Based on the XGBoost Algorithm
XGBoost algorithm, first proposed by Chen et al. [15] in 2016, is a scalable tree ensemble learning algorithm based on the enhancement of the conventional gradient boosting algorithm. In fact, XGBoost is an improved gradient-boosting decision trees (GBDT) algorithm [16], which consists of many decision trees and is typically used in the field of classification and regression. Compared with GBDT, the XGBoost makes two key optimization improvements. First, a regularization term is added to the objective function of XGBoost in order to make the model less vulnerable to overfitting. Second, compared with the GBDT algorithm only using the first-order Taylor expansion, the second-order Taylor expansion added in the loss function of XGBoost makes the XGBoost algorithm define the loss function more accurately. Based on these improvements, the XGBoost achieves better performance than the GBDT. With the XGBoost algorithm, multiple weak classifiers are trained according to the negative gradient information of the loss function of the current model. These classifiers are then concatenated as a cumulative set to form a robust classifier with improved overall prediction accuracy [17].
The ensemble learning XGBoost algorithm not only has the advantages of fast execution, high flexibility, and built-in cross-validation but also presents explainable prediction results of the model, making it a more suitable method for high-risk event prediction, such as long landings, than traditional machine learning models [18]. Thus, with these advantages, a long landing pre-warning model based on the XGBoost algorithm was proposed in this paper. For a given long landing pre-warning indicator dataset sample B with N samples and M characteristics, the ultimate training result of the built pre-warning model was the integrated model obtained by combining K decision trees. Its pre-warning model can be indicated in Equation (1):
where R represents the set of all weak learners, refers to the ith pre-warning value of the landing sample, fk is the structure of the kth independent tree, and xi is the set of eigenvalues of the ith data point.
In the training process of the early warning model, the specific iterative process could be divided into several separate iterations. In each iteration, the original model remains unchanged, and a newly generated tree function model f is added to the original model to fit the last prediction residual value.
The objective function of XGBoost is composed of two parts: training loss and regularization, as represented in Equation (2):
where is the difference between the predicted value and the true value of the model, and Ω(fk) is a regular term in the cost function for controlling the complexity of the model. For the regular term of the objective function Ω(fk), it is expressed as Formula (3):
where γ and λ are the penalty coefficients of the model, and T and ω are the number of leaf nodes and the score of the pre-warning model, respectively.
Then a Taylor second-order expansion of the loss function is performed to estimate the Formula (4):
where gi is the first derivative of the loss function, and hi is the second derivative of the loss function, gi and hi are defined as follows:
According to the analysis above, the final objective function is further simplified to achieve Equation (7):
Finally, the objective function of the pre-warning model is optimized, and the optimal solution is:
2.2. Pre-Warning Model Optimization Based on Operation Characteristics Clustering
Existing research [6,7] has demonstrated that the pilot’s behavior during the landing phase is a critical factor in controlling the occurrence of long landings. Moreover, recent evidence [19] has shown that there are significant differences in risks of long landings under the control of different pilots with distinct operation characteristics. Therefore, by identifying and clustering the pilot’s operation characteristics, a long landing pre-warning model based on the XGBoost algorithm was constructed for different types of pilots to raise the model’s prediction accuracy.
2.3. The Model’s Pre-Warning Results Evaluation
This paper focuses on the pre-warning of long landing hazardous events, so the confusion matrix description in this paper is shown in Table 1, where true positive (TP) is the number of cases that long landing samples that are predicted to be abnormal, false negative (FN) is the number of cases that long landing samples are predicted to be normal, and true negative (TN) is the number of cases that normal landing samples are predicted to be normal. False positive (FP) refers to the number of cases predicted as abnormal events in the sample of normal landing.

Table 1.
Confusion matrix description.
In addition, a number of indicators of prediction models commonly employed in machine learning were introduced to evaluate the long landing pre-warning model. The accuracy ACC, the recall radio R, the precision P, and the comprehensive evaluation indicator F1 was utilized to verify the model’s applicability.
ACC represents the proportion of correctly predicted samples which is defined as Equation (10). A higher ACC indicates a better pre-warning effect.
R refers to the proportion of TP in the overrun data of the database, which is defined as Equation (11). The higher the R, the more comprehensive the pre-warning range of hazardous events.
P is the ratio of actual long landings to the total ones identified by the model, which is defined as Equation (12). The higher the P, the more accurate the pre-warning model will be.
F1 indicates the comprehensive evaluation indicator of the model, which is defined as Equation (13). A higher F1 stands for a more effective pre-warning method.
Furthermore, the receiver operating characteristic (ROC) curve and the area under the curve (AUC) were introduced as the evaluation indicators of the pre-warning model accuracy, with the false positive rate (FPR) serving as the horizontal axis and the true positive rate (TPR) serving as the vertical axis. Long landing pre-warning was performed at various thresholds to acquire the corresponding FPR and TPR and obtain the ROC curve and its AUC value.
AUC, defined as the enclosed area by the ROC curve, is often measured in the interval [0.5, 1] and intuitively reflects the performance difference of the ROC curve. When the AUC is closer to 1, the algorithm has better prediction performance [20].
3. Data Collection
3.1. Data Acquisition
This research was conducted based on the flight QAR data of the operating routes of a B737-800 fleet in 2020. They were all flight data of the airlines’ operating routes, totaling 877 flights, including flight environment parameters, flight status, pilot control parameters, and so on. On the basis of the raw data screening, the pre-warning on long landings was carried out by selecting pilot operation parameters to evaluate its overall characteristics, combined with pertinent flight status parameters during the landing phase.
3.2. Selection of the Pre-Warning Phase
The landing phase typically begins with the lowering and setting up of the landing gear. However, during the actual operation of civil aviation B737-800 aircraft, the pilot flying (PF) must disengage the autopilot 1–2 nautical miles prior to the runway threshold or 300–600 ft above the airport elevation to take control of the aircraft until the main wheels are approximately 20 ft above the runway. The leveling operation’s profile during landing is depicted in Figure 1. Thus, in order to better assist the pilot in decision-making and operating from 20 ft to the touchdown phase as required by the standard operating procedure (SOP), the 50 ft radio altitude of the aircraft was selected as the warning point for long landings, and the QAR data from the 200–50 ft phase was taken as the input for pre-warning.

Figure 1.
Leveling operation’s profile during landing.
3.3. Construction of Pre-Warning Datasets
According to the flight quality monitoring standard for long landings given in the Advisory Circular of the Civil Aviation Administration of China, “Implementation and Management of Flight Operation Quality Assurance (FOQA)” [21], the ground speed critical distance of the aircraft from 15 m (50 ft.) to the touchdown phase is used as the monitoring indicator to measure long landings. The ground speed integration distance exceeding 750 m is defined as a long landing, and the ground speed integration distance less than 750 m is defined as normal grounding. As a result, the samples can be classified as normal landings (floating distance from 50 ft to ground < 750 m) or long landings (floating distance from 50 ft to ground > 750 m), as given in Equation (16).
Combined with the landing standard proposed in the standard operation manual of B737-800 aircraft and relevant research results [22,23,24] on long landings, their pre-warning indicator set was constructed by selecting the key parameters of flight status at the 200–50 ft. phase, including destination (DES), aircraft flap configuration (FLAP), landing weight (GW), outer air temperature (TEM), true air speed (TAS), longitudinal wind speed (WS), localizer deviation (LOC), glide deviation (GLIDE), pitch angle (PITCH), pitch change rate (P’RATE), vertical acceleration (VRTG), longitudinal acceleration (LO’ACC), and lateral acceleration (LA’ACC). The critical parameter set B of flight status was constructed as presented in Equation (17).
3.4. Pre-Warning Indicator Extraction
In order to highlight the influence of the vital flight status parameters of set B and simplify the decision-making process of the pre-warning model, the QAR data samples of fixed aircraft types of the existing single fleet were filtered according to the following rules: fixed time of departure and arrival, GW < 65,000 kg, flap level at the position of 30 in the landing phase, landing headwind air volume < 10 m/s, and tailwind air volume < 5 m/s. Finally, 718 qualified QAR data samples were obtained, including 428 long and 290 normal landing samples.
With the long landing pre-warning method proposed in this research, crucial flight status parameters of set B were extracted from the existing QAR data. For the QAR data at a radio altitude of 200–50 ft during the landing phase, the pre-warning indicators for long landings were computed and displayed in Table 2.

Table 2.
Pre-warning indicators for long landings.
4. Evaluation of Pilot Operation Characteristics
4.1. Pilot Operation Characteristic Clustering Based on Expectation Maximization (EM)-GMM
In the GMM clustering method, the spatially distributed probabilities of each flight operation characteristic are assumed to be approximated by multiple Gaussian distribution probability functions [25], and Equations (18) and (19) are mathematical expressions for its probability density functions p(x),
where N(x|μk,σk) is the density function, εk is the scale factor, μk is the sample mean, and σk is the covariance matrix. The clustering and generalization could be accomplished by determining the scale factor εk, the mean of the spatial distribution μk, and the covariance σk of each flight operation characteristic.
4.2. Indicator Selection for Pilot Operation Characteristics
Recent evidence [26] has shown that a pilot usually shows similar characteristics in different flight phases, and the results of cluster analysis can reflect the overall characteristics of flight operations by considering the pilot’s operational behavior during different phases as a whole. Thus, this paper has selected the flight operation feature indicators during both the takeoff and landing phases as parameters to comprehensively analyze and summarize the overall operating characteristics of the pilots in the sample.
The analysis in this paper, which integrates the overall flight operation feature indicators during takeoff and landing phases, is mainly due to the fact that these two stages are the most complex stages of flight operations for pilots [27], and most accidents and unsafe events in civil aviation occur during these two phases [28,29,30]. Pilots need to make corresponding flight operations based on different external conditions. Therefore, the flight operations during the takeoff and landing phases are more representative.
During takeoff and landing, the aircraft coincides with the dynamic equilibrium formula shown in Equation (20), where L is the aircraft lift. It is related to the flight dynamic pressure 0.5 ρv2, the lift coefficient CL, and the wing area S.
In an ideal fluid state, the lift coefficient CL is primarily determined by the slope of the wing lift coefficient curve and the angle of attack α, expressed by Formula (21).
In actual civil aviation aircraft operation, the wing area S and the lift coefficient curve slope are mainly affected by the aircraft flap angle FLAP. The factors affecting the state of the aircraft include external air pressure ρ, TAS v, FLAP, and angle of attack α. Among them, v is mainly affected by the pilot’s decision. Therefore, TAS v was selected in this paper for analyzing the pilot operation characteristic indicators.
For analyzing the aircraft’s flight state at the wheel lifting point during the takeoff phase, the rotation speed VR is usually provided according to the aircraft’s actual operation state as a reference before taking off for the pilot to implement the takeoff rod operation. The pilot must steer the aircraft up and lift the front wheel off the ground after reaching VR. Therefore, the indicator ξ was proposed to represent the ratio of the actual front wheel off-ground speed VT to the theoretical rotation speed VR to reflect the pilot’s operation tendency as a pilot operation characteristic indicator shown in Formula (22). The actual physical meaning of ξ indicates that the larger ξ’s value, the less aggressive the flight handling characteristics, and vice versa.
Similarly, when examining the aircraft’s flying state at the touchdown point during the landing phase, the approach reference speed Vref is usually adopted by the pilot as the ideal state landing touchdown point speed as a reference for completing the landing leveling operation. Therefore, the indicator τ was utilized to represent the ratio of the actual main wheel touchdown speed VL to the theoretical lifting wheel speed Vref as a pilot’s operating characteristic indicator, as given in Equation (23). The actual physical meaning of τ indicates that the larger its value, the more aggressive the flight operation characteristics, and vice versa.
As a result, ξ and τ data were extracted to construct pilot operating characteristics and a dataset. The GMM clustering method was utilized to cluster the pilot operation characteristics, and the long landing pre-warning model based on the XGBoost algorithm was further constructed for the clustering results.
4.3. Pilot Operation Characteristics Clustering
In general, the overall characteristics of such pilots during flights are classified into two or three categories [31,32,33,34] in the research field of transportation. Based on the current research results and relevant requirements in civil aviation flight practice, the GMM clustering method was utilized in this paper to cluster the pilot operation characteristics according to the dataset. The pilot operation characteristics of the fleet were divided into three classes, as depicted in Figure 2.
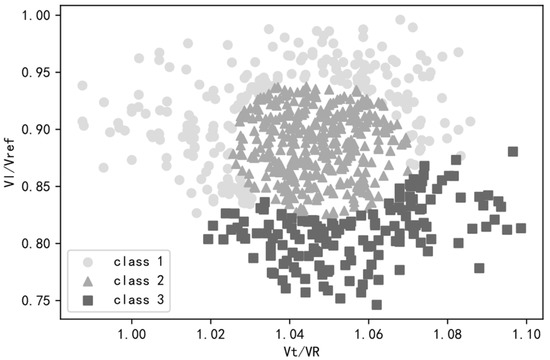
Figure 2.
Pilot operation characteristics scatter chart.
4.4. Analysis of Flight Operation Style Clustering Results
According to the clustering results described in Figure 2, the three classes of pilot operation characteristics were analyzed. The average values and distribution of their operation characteristics are depicted in Table 3 and Figure 3, respectively. The results indicate that for pilot operation characteristics from Class 1 to Class 3, the average values of indicator ξ rose while the values of τ descended. Therefore, it is concluded that Class 1 pilots have a more aggressive operation response and retain a smaller margin of operation, demonstrating an aggressive operation characteristic. Class 3 pilots usually retain a more considerable margin of operation and have a later operation response point, indicating a conservative operational characteristic. Class 2 pilots present more balanced operation characteristics than Class 1 and Class 3.

Table 3.
Comparison of the average indicator values for the three types of pilot operation characteristics.
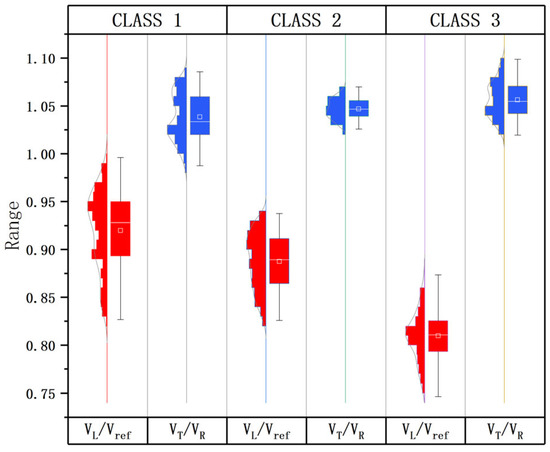
Figure 3.
Pilot operation characteristics distribution.
As a result, the pilot operation characteristics dataset C was constructed as given in Equation (24), and pre-warning models were developed to warn of long landings based on these three classes of operation characteristics.
5. Application of the Long Landing Pre-Warning Model and Discussion
5.1. The Long Landing Pre-Warning Model Construction
According to the classification results of the overall flight operation characteristics, 718 QAR data from the existing dataset were further partitioned, as reported in Table 4. The datasets of three classes were randomly divided into training datasets and test datasets with a ratio of 8:2 for training and testing of the pre-warning models, respectively.

Table 4.
Data set partitioning.
The experiment in this paper is conducted using a computer with Python 3.9.7 and a compiler as a VScode environment using the Jupyter Notebook. Xgboost model contains general parameters, booster parameters and learning target parameters [35].
In this experiment, we selected five hyperparameters that can have a significant impact on the pre-warning capability of the XGBoost model: number of sub-estimators (N_Estimators), learning rate (ETA), subsample, maximum tree depth (max_depth), gamma, alpha, and lambda. By iterative training with the corresponding training datasets, hyperparameters for XGBoost pre-warning models of different pilot operation characteristics were optimized, and eventually, three pre-warning models were constructed for pilots in different groups. The information on each hyperparameter and the optimized hyperparameter values for each group are shown in Table 5.

Table 5.
Optimal hyperparameters for three groups.
5.2. Test Result of the Long Landing Pre-Warning Model
The partitioned test datasets were fed into the trained models for testing and validation, and the confusion matrices of the test results of the long landing pre-warning models for the three classes of pilot operation characteristics were derived, respectively, as depicted in Figure 4, Figure 5 and Figure 6.
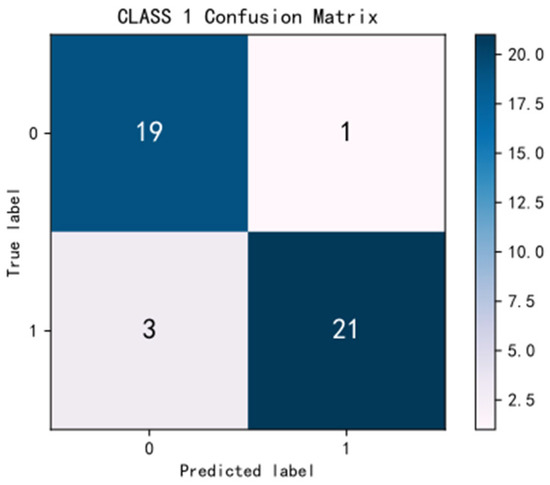
Figure 4.
Confusion matrix of model test results for Class 1 operation characteristics group.
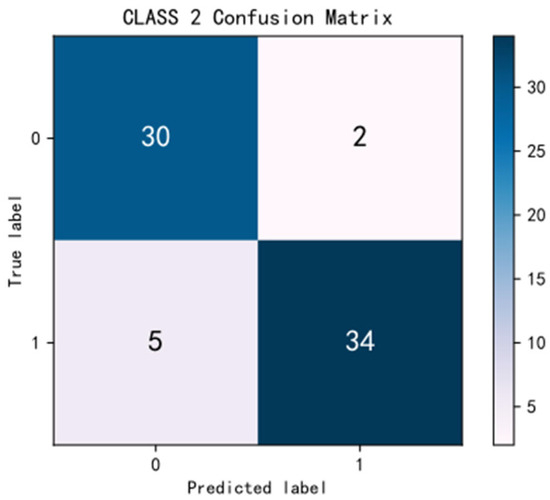
Figure 5.
Confusion matrix of model test results for Class 2 operation characteristics group.
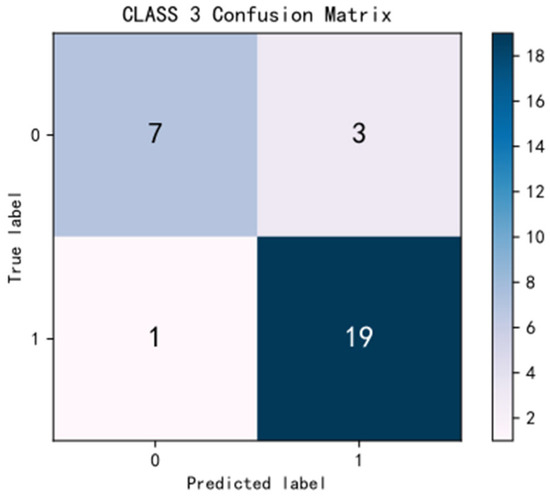
Figure 6.
Confusion matrix of model test results for Class 3 operation characteristics group.
The prediction results were further evaluated according to the evaluation indicators of prediction effectiveness selected in Section 2.3. According to the output calculation results in Table 6, the ACC, R, P and F1 of the pre-warning models constructed for the three classes of operation characteristics are above 85% and close to 90%. It proves that the aircraft long landing pre-warning method based on the XGBoost algorithm proposed in this paper all has a good effect on pilots with different operating characteristics.

Table 6.
Evaluation of test results of the long landing pre-warning model.
In addition, the ROC curves and AUC values corresponding to the test results of the three types of early warning models are shown in Figure 5, Figure 7, Figure 8 and Figure 9. The AUC values of the models are close to 1, which indicates that the pre-warning models of the three classes’ operation characteristics all have excellent pre-warning performance.
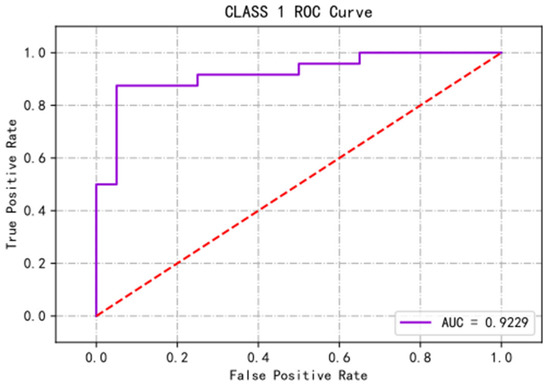
Figure 7.
ROC curve of model testing for the Class 1 operation characteristics group.
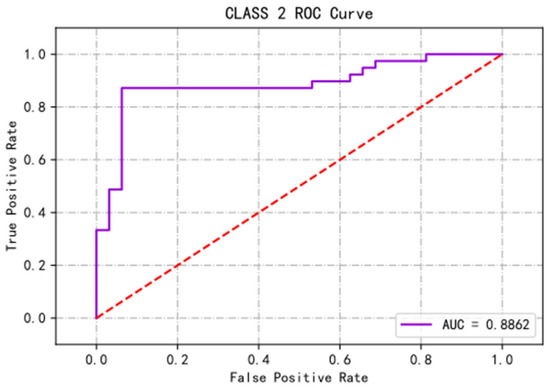
Figure 8.
ROC curve of model testing for the Class 2 operation characteristics group.
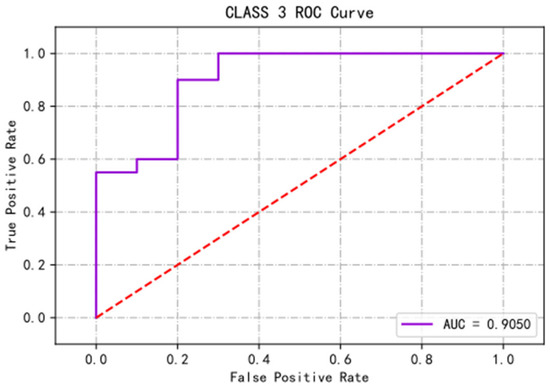
Figure 9.
ROC curve of model testing for the Class 3 operation characteristics group.
5.3. Pre-Warning Results Comparison
The importance ranking of the warning indicators for the three classes could be derived by analyzing and sorting out the model’s pre-warning process, as shown in Figure 10, Figure 11 and Figure 12. Figure 10 shows that pitch, TAS, and LO ‘ACC are the key indicators for the pre-warning model used to make decisions when pilots in the Class 1 operation characteristics group perform long landing pre-warning. For pilots in the Class 2 operation characteristics group, the key indicators for the decision-making of the warning model were the GLIDE, TAS, and TEM, which are shown in Figure 11. Figure 12 further shows that the key decision indicators for pilots in the Class 3 operation characteristics group were IVV_AVE, TAS, and PR_AVE.
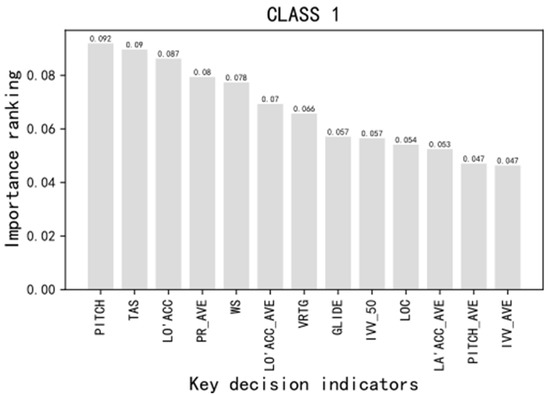
Figure 10.
Pre-warning indicator importance ranking in the Class 1 operation characteristic group.
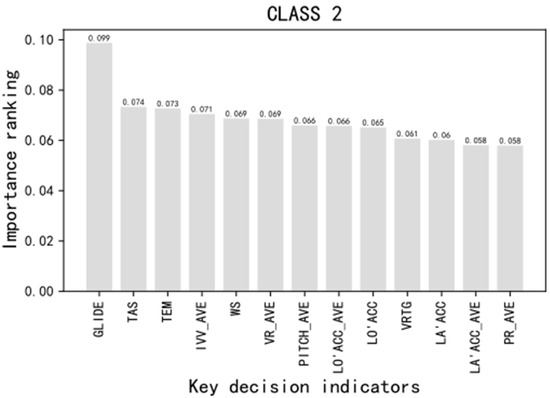
Figure 11.
Pre-warning indicator importance ranking in the Class 2 operation characteristic group.
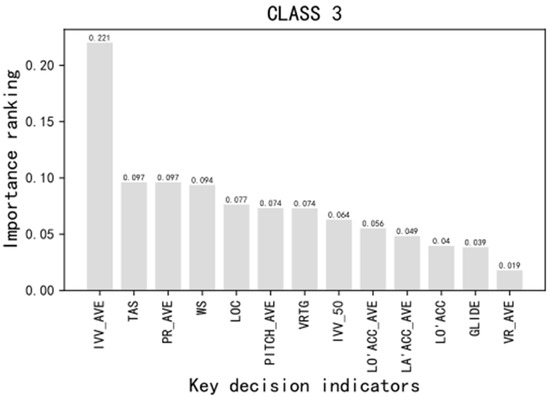
Figure 12.
Pre-warning indicator importance ranking in the Class 3 operation characteristic group.
The overall pre-warning effect of the pre-warning method, which is based on the XGboost algorithm and operation characteristics proposed in this paper, is shown in Table 7, with ACC, R, P and F1 at 89.66%, 89.16%, 92.50% and 90.80% respectively. All the indicators of this pre-warning method are close to 90%. The overall calculation results demonstrated that the aircraft long landing pre-warning method based on the XGBoost algorithm and operation characteristics proposed in this paper has an excellent effect on long landing pre-warning.

Table 7.
Evaluation results of pre-warning models.
Furthermore, a model based on the XGBoost algorithm was constructed in this paper to verify the difference in pre-warning effectiveness between the pilot operation characteristics-based and the existing pre-warning model without considering pilot operation characteristics. The dataset extracted in Section 3.4 was used to divide the training and test sets according to the same data division rules in Section 5.1, and the model was trained and tested. The overall pre-warning effect was evaluated and shown in Table 7. Compared with the model without considering operation characteristics, the ACC, R, P, and F1 values of the pilot-operation-characteristics-based long landing pre-warning model are significantly improved, increased by 25.22%, 6.6%, 11.82%, and 9.19%, respectively. Therefore, by considering the operation characteristics of pilots, the long landing pre-warning model built in this paper performs much better than those without considering operation characteristics.
In addition, in order to verify the pre-warning effect of the XGBoost algorithm compared with traditional algorithms in the pre-warning application of long landing unsafe events, a model based on the BPNN algorithm, using the same experimental settings with the pre-warning model above, was constructed. The ACC, R, P and F1 values of the pre-warning model based on the XGBoost algorithm are 0.55%, 2.77%, 11.24%, and 7.35% higher than the pre-warning model based on the BPNN algorithm. Thus, the test results show that the pre-warning effect of the long landing unsafe events pre-warning model based on the XGBoost algorithm is better than the traditional model based on the BPNN algorithm.
6. Conclusions
(1) This paper proposed a pre-warning model for long aircraft landings based on the XGBoost algorithm and pilot operation characteristics. Pilot operations were measured and generalized through relative indicators of aircraft speed during the takeoff and landing phases. The overall pilot operation tendencies were comprehensively analyzed and evaluated. Moreover, the model was optimized for varied overall operation characteristics, hence greatly enhancing its pre-warning effect in comparison to the existing models.
(2) Based on the QAR data of the phase where the aircraft approached 200–50 ft, the long landing pre-warning model dataset was constructed, demonstrating an exceptional pre-warning effect. According to various pilot operation characteristics, the key indicators of the pilots’ pre-warning model are slightly different. The TAS is the most critical decision-making indicator in the long landing pre-warning model. This indicator ranks among the top three in the pre-warning model of the Class 3 operation characteristics group.
(3) Based on the XGBoost algorithm, a pre-warning model for long aircraft landings was constructed in this paper, demonstrating a good classification warning effect. The test results suggest that the XGBoost algorithm possesses the characteristics of high accuracy, flexibility, and interpretability for flight safety incident prediction and pre-warning.
(4) In actual civil aviation flight practice, the occurrence of long landings is influenced by a number of factors, the most important of which is the leveling operation from 50 ft through touchdown. Therefore, the evaluation and prediction of the leveling operation are critical for enhancing the precision and generalizability of the pre-warning model. Furthermore, to give pilots enough time to make decisions and assist them in completing flight operations during the touchdown phase, thereby enhancing flight safety more effectively, earlier pre-warning points for long landings must be selected in the future while ensuring pre-warning effectiveness.
Author Contributions
Conceptualization, Y.L. and R.S.; Methodology, Y.L. and R.S.; Software, Y.L.; Validation, Y.L.; Formal Analysis, Y.L.; Investigation, Y.L.; Resources, R.S.; Data Curation, Y.L. and P.H.; Writing—original draft preparation, Y.L.; Writing—review and editing, R.S. and P.H.; Visualization, Y.L.; Supervision, R.S.; Project administration, R.S.; Funding acquisition, R.S. All authors have read and agreed to the published version of the manuscript.
Funding
This research was funded by the National Natural Science Foundation of China (grant no. 52272356) and the Fundamental Research Funds for the Central Universities (grant no.3122022101).
Data Availability Statement
Not applicable.
Conflicts of Interest
The authors declare no conflict of interest.
References
- International Air Transport Association. IATA Safety Report 2020; International Air Transport Association: Montreal, QC, Canada, 2021; pp. 42–46. [Google Scholar]
- Wang, R.; Zhenxing, G. Influencing Factors of Civil Aircraft Landing Safety Based on Flight Data. J. Transp. Inf. Saf. 2019, 37, 8. [Google Scholar]
- Ruishan, S.; Wenlv, H. Analysis on parameters characteristics of flight exceedance events based on distinction test. J. Saf. Sci. Technol. 2011, 7, 22–27. [Google Scholar]
- Ruishan, S.; Xiong, C.; Chongfeng, L. Prediction method of actual operating landing distance based on similarity theory. Chin. Saf. Sci. 2021, 31, 13–18. [Google Scholar]
- Sun, R.; Li, C. Analysis of flight operation patterns and risk based on k-SC clustering. J. Saf. Sci. Technol. 2021, 17, 150–155. [Google Scholar]
- Lei, W.; Changxu, W.; Ruishan, S. An analysis of flight Quick Access Recorder (QAR) data and its applications in preventing landing incidents. Reliab. Eng. Syst. Saf. 2014, 127, 86–96. [Google Scholar]
- Lei, W.; Yong, R.; Changxu, W. Effects of flare operation on landing safety: A study based on ANOVA of real flight data. Saf. Sci. 2018, 102, 14–25. [Google Scholar]
- Yu, Q.; Liang, Y. Summary of Research on Civil Commercial Transport Aircraft Hard Landing. Sci. Technol. Eng. 2021, 21, 13211–13220. [Google Scholar]
- Cohen, B.; Cassell, R.; Smith, A. Development of an aircraft performance risk assessment model. In Proceedings of the Digital Avionics Systems Conference, St. Louis, MO, USA, 24–29 October 1999. [Google Scholar]
- Haverdings, H.; Chan, P.W. Quick Access Recorder Data Analysis Software for Windshear and Turbulence Studies. J. Aircr. 2010, 47, 1443–1447. [Google Scholar] [CrossRef]
- Haipeng, C.; Ping, S.; Shengguo, H. Study of Aircraft Hard Landing Diagnosis Based on Nerual Network. Comput. Meas. Control 2008, 16, 906–908. [Google Scholar]
- Lei, W.; Xingyue, Y. Risk prediction of tail strike during landing based on Monte Carlo method. J. Saf. Sci. Technol. 2019, 15, 47–52. [Google Scholar]
- Wenbing, C.; Jianing, Z.; Shenghan, Z. A Prediction Model of Airplane Hard Landing Based on Supportupport Vector Machine. Aircr. Des. 2017, 37, 19–22. [Google Scholar]
- Qiao, X.; Chang, W.; Zhou, S.; Lu, X. A prediction model of hard landing based on RBF neural network with K-means clustering algorithm. In Proceedings of the IEEE International Conference on Industrial Engineering and Engineering Management, Bali, Indonesia, 4–7 December 2016; pp. 462–465. [Google Scholar]
- Chen, T.; Guestrin, C. Xgboost: A scalable tree boosting system. In Proceedings of the 22nd ACM SIGKDD International Conference on Knowledge Discovery and Data Mining, San Francisco, CA, USA, 13–17 August 2016; pp. 785–794. [Google Scholar]
- Xu, Y.; Zhao, X.; Chen, Y.; Yang, Z. Research on a Mixed Gas Classification Algorithm Based on Extreme Random Tree. Appl. Sci. 2019, 9, 1728. [Google Scholar] [CrossRef]
- Friedman, J.H. Greedy Function Approximation: A Gradient Boosting Machine. Ann. Stat. 2001, 29, 1189–1232. [Google Scholar] [CrossRef]
- Wan, J.; Zhang, H.; Lyu, W.; Zhou, J. A Novel Combined Model for Short-Term Emission Prediction of Airspace Flights Based on Machine Learning: A Case Study of China. Sustainability 2022, 14, 4107. [Google Scholar] [CrossRef]
- Zhang, Y.; Wang, J.; Li, H. Analysis and Comparison of Operating Characteristics of Pilots in Different Flight Modes. Aerosp. Med. Hum. Perform. 2019, 90, 962–967. [Google Scholar]
- Song, H.L. Application of parametric method and non-parametric method in estimation of area under ROC curve. Acad. J. Second. Mil. Med. Univ. 2006, 12, 726–728. [Google Scholar]
- Civil Aviation Administration of China. Implementation and Management of Flight Operations Quality Assurance (FOQA): AC-121/135-FS-2012-45R1; Civil Aviation Administration of China: Beijing, China, 2015; p. 20. [Google Scholar]
- Sun, R.; Li, C. Early-warning method of aircraft long landing based on random forest. J. Saf. Sci. Technol. 2021, 17, 182–186. [Google Scholar]
- Ruishan, S.; Shaohua, H. Ultra limit incident prediction of flight approach based on isolation forest. J. Saf. Environ. 2022, 22, 2010–2016. [Google Scholar]
- Wang, L.; Zhang, J.; Dong, C.; Sun, H.; Ren, Y. A Method of Applying Flight Data to Evaluate Landing Operation Performance. Ergonomics 2019, 62, 171–180. [Google Scholar] [CrossRef]
- Zeng, W.; Xu, Z.; Cai, Z.; Chu, X.; Lu, X. Aircraft Trajectory Clustering in Terminal Airspace Based on Deep Autoencoder and Gaussian Mixture Model. Aerospace 2021, 8, 266. [Google Scholar] [CrossRef]
- Sun, R.; Li, Y. Research on pilots’ flight operation style based on QAR data. China Saf. Sci. J. 2022, 32, 63. [Google Scholar]
- Sun, R.; Wang, L.; Ling, Z. Analysis of Human Factors Integration Aspects for Aviation Accidents and Incidents. In Proceedings of the Engineering Psychology and Cognitive Ergonomics: 7th International Conference, EPCE 2007, Held as Part of HCI International 2007, Beijing, China, 22–27 July 2007; Springer: Berlin/Heidelberg, Germany, 2007. [Google Scholar]
- Aviation Safety Office of Civil Aviation Administration of China. 2020 China Civil Aviation Safety Report; Civil Aviation Administration of China: Beijing, China, 2021. [Google Scholar]
- Qin, K.; Wang, Q.; Lu, B.; Sun, H.; Shu, P. Flight Anomaly Detection via a Deep Hybrid Model. Aerospace 2022, 9, 329. [Google Scholar] [CrossRef]
- Boeing, Commercial Airplanes. Statistical Summary of Commercial Jet Airplane Accidents Worldwide Operations 1959–2021. Available online: https://www.boeing.com/resources/boeingdotcom/company/about_bca/pdf/statsum.pdf (accessed on 7 September 2022).
- Gonzalez, A.B.R.; Wilby, M.R.; Diaz, J.J.V.; Ávila, C.S. Modeling and Detecting Aggressiveness from Driving Signals. IEEE Trans. Intell. Transp. Syst. 2014, 15, 1419–1428. [Google Scholar] [CrossRef]
- Martinez, C.M.; Heucke, M.; Wang, F.Y.; Gao, B.; Cao, D. Driving Style Recognition for Intelligent Vehicle Control and Advanced Driver Assistance: A Survey. IEEE Trans. Intell. Transp. Syst. 2018, 19, 666–676. [Google Scholar] [CrossRef]
- Jeong, E.; Oh, C.; Kim, I. Detection of lateral hazardous driving events using in-vehicle gyro sensor data. KSCE J. Civ. Eng. 2013, 17, 1471–1479. [Google Scholar] [CrossRef]
- Tong, L.; Rui, F.; Mingfang, Z.; Shun, T. Study on driving style clustering based on K-means and Gaussian mixture model. China Saf. Sci. J. 2019, 29, 40–45. [Google Scholar]
- Jiang, H.; He, Z.; Ye, G.; Zhang, H. Network Intrusion Detection Based on PSO-Xgboost Model. IEEE Access 2020, 8, 58392–58401. [Google Scholar] [CrossRef]
Disclaimer/Publisher’s Note: The statements, opinions and data contained in all publications are solely those of the individual author(s) and contributor(s) and not of MDPI and/or the editor(s). MDPI and/or the editor(s) disclaim responsibility for any injury to people or property resulting from any ideas, methods, instructions or products referred to in the content. |
© 2023 by the authors. Licensee MDPI, Basel, Switzerland. This article is an open access article distributed under the terms and conditions of the Creative Commons Attribution (CC BY) license (https://creativecommons.org/licenses/by/4.0/).