Abstract
The unsteady characteristics of the second throat of a transonic wind tunnel have an important influence on the design and test of the wind tunnel. Therefore, the forced oscillation characteristics were studied by a numerical simulation method. The governing equation was the viscous compressible unsteady Navier–Stokes equation. Under the sinusoidal pressure disturbance of the computational domain exit, the shock wave presents a clear forced oscillation state, and the shock wave periodically changes its position. Under a pressure disturbance of 1%, the shock wave displacement reaches 150 mm. Additionally, overshoot occurs when the shock moves upstream or downstream. The shock-boundary layer interference is very sensitive to the motion characteristics of the shock wave, resulting in a transformation of the flow field symmetry. The flow field downstream of the shock wave exhibits periodic structural changes. Compared with the pressure change at the outlet, the pressure change near the shock wave has a phase delay. The increasing disturbance near the shock wave shows a clear amplification effect. The pressure disturbance near the shock wave had an obvious amplification effect, and its fluctuation amount reached 16% under the pressure disturbance of 1%. The variation trend of the second throat wall force, wavefront Mach number, and Mach number in the test section with time is similar to that of the downstream disturbance, but it does not have a complete follow-up effect, which indicates that the pressure disturbance can propagate into the test section through the boundary layer or the shock gap. Nevertheless, the second throat choking can still control the Mach number stability of the test section. The dynamic characteristics of shock oscillation are related to the amplitude and frequency of the applied pressure disturbance. The shock displacement decreases with the increase in the excitation frequency. When the excitation frequency is higher than 125 Hz, the flow field basically does not change.
1. Introduction
The unsteady characteristics of the wind tunnel flow field have always been a concern of designers. Many aeronautical papers published around 1920 pointed out that flow stability problems were common to most wind tunnels [1,2]. Since then, designers have made many efforts to solve this problem, but the unsteady effects of wind tunnels could not be measured until nearly a decade ago [3].
When evaluating the disturbance of the flow field in a wind tunnel, it is first necessary to understand the source of the disturbance. The unsteady characteristics of the transonic wind tunnel can be divided into three modes: vorticity, entropy, and sound. These three modes cannot be directly measured, but the quantities associated with them can be measured: the pulsation of velocity, density, and total temperature. The pulsating pressure field is always related to the sound field, and it is also a function of the pulsating velocity and pulsating temperature field [4]. Temperature pulsation is usually ignored at transonic speed, so airflow pulsation mainly includes pulsating velocity (i.e., turbulence) and pulsating pressure (i.e., noise), which are difficult to distinguish from each other [5].
These disturbances affect the flow around the model, especially for the laminar flow control test, unsteady test, boundary layer transition test, flutter onset test, etc. For example, as the fluctuating pressure in the wind tunnel increases, the transition Reynolds number decreases significantly [6]. With the improvement in the refinement level of wind tunnel tests, the dynamic parameters of the flow field in the test section have attracted more and more attention from researchers. Guo has pointed out that noise reduction was the main challenge and problem in the current wind tunnel design [7]. Chen measured the noise at different positions in the 0.6 m wind tunnel and believed that the aerodynamic noise in the ventilation wall, near the model support and in the second throat, was large, which significantly increased the noise in the test section [8].
Brooks measurements showed that most of the disturbances in the test section were from the noise propagating upstream from the downstream of the test section [9]. The most straightforward way to isolate the test section from downstream noise and other acoustic disturbances was to use a second throat at the test section outlet [10]. Mabey conducted experimental research on vortex, shock wave, and boundary layer interference, and noise generated by the second throat. He evaluated the effect of the second throat on the pulsating pressure level in the test section [11]. It was extremely expensive to pay attention to this problem after a wind tunnel was built [12]. McKinney’s tests in an 8-foot wind tunnel showed that when a choking occurred at the end of the test section, there was no longer a pressure disturbance propagating upstream [13]. In the Stainback test, it was found that the pulsating pressure level in the test section after the second throat choking was reduced from 3.5% to 0.5% [14,15].
During the debugging of the 0.6 m wind tunnel, an excessive vibration problem occurred when the second throat was choking [16]. Vibration was a ubiquitous phenomenon in large-scale wind tunnel structural systems. Severe nonlinear and broadband structural vibration would interfere with the test environment, affect the test results, and lead to structural damage and failure of the wind tunnel [7]. During the operation of a supersonic transient wind tunnel in Japan, infrasound less than 20 Hz caused house vibrations within a radius of 200 m [17]. This phenomenon has become a key factor in restricting the improvement in wind tunnel test performance. In order to avoid vibration, the traditional control methods were mostly passive control. Energy dissipation elements were used to consume the energy of structural vibration and reduced the dynamic response of the structure [18].
Shock oscillation may occur in the second throat after choking, causing structural vibration. In the shock boundary layer interference in the second throat, the airflow is disturbed by the downstream pressure, and the shock wave position changes with time, showing a forced oscillation state. Even when the downstream pressure was kept constant, shock waves induced self-excited oscillations around the mean position [19,20,21,22]. The pulsating pressure caused by the shock oscillation was sufficient to separate the boundary layers, and the flow unsteadiness caused by the separation bubble flow had a strong influence on the pulsating pressure [5]. It is very important to understand the origin and consequences of shock oscillations [23].
Since 1974, a group of Japanese scholars has specialized in the study of shock train oscillation in straight pipes with equal cross-sections [24]. The effects of downstream periodic pressure perturbations on shock waves have been studied using a variable-shaped second throat [25,26,27,28,29,30]. Bruce [31] and Biswas [32] believed that the unsteady shock motion was related to its intensity, as well as to the degree of boundary layer thickening and boundary layer separation. Based on the one-dimensional linear stability theoretical analysis, Robinet believed that the shock oscillation frequency was strongly correlated with the length of the diffuser [25]. Bruce proposed an analytical model to predict the amplitude and frequency of the shock motion within the pipe [33]. A pressure fluctuation of about 1% to 2% would significantly change the position of the transonic shock [29].
The choking of the second throat of the wind tunnel was very important to improve the flow field quality of a wind tunnel [34]. In this paper, the shock oscillation characteristics in the second throat were analyzed by numerical simulation. It provides a reference for analyzing and solving the structural vibration problem of the second throat. By reasonably matching the design parameters of the second throat, it is possible to achieve airflow choking in a short distance, as well as high-precision flow field control within a limited distance, improving flow stability and outlet velocity uniformity in the second throat, reducing pulsating pressure levels and structural vibration, and avoiding affecting the performance of the test section through downstream circuits.
2. Numerical Methods
The 0.6 m continuous transonic wind tunnel in the China Aerodynamics Research and Development Center adopts a second throat for flow control after the test section. The length of the second throat section is 2000 mm, the center body is embedded in the middle partition, the thickness and length of the middle partition are 20 mm and 1100 mm, and the tail is a 20° wedge. After the second throat is a four-wall diffusion section with a length of 1300 mm, as shown in Figure 1.
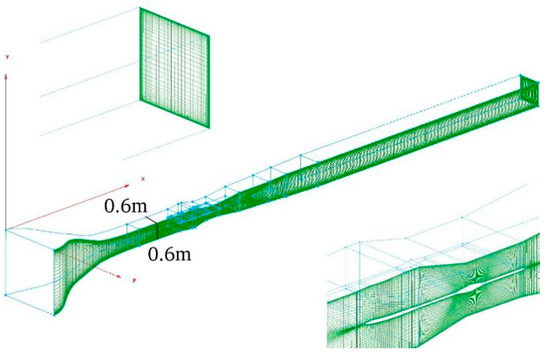
Figure 1.
Schematic for gird of the second throat section.
Structural grids are used. To simulate the boundary layer, the grid near the wall satisfies y+≈1; additionally, the spacing ratio of adjacent grid points in the boundary layer along the vertical wall direction is about 1.2. The total number of grids is about 6 million cells. When modeling, the direction of airflow flow is the x-axis, and the vertical ground direction is the y-axis, while the z-axis is set according to the right-hand coordinate system. The center of the entrance to the test section is the coordinate origin. Other dimensions are shown in Table 1.

Table 1.
Dimensions and coordinates of typical locations.
2.1. Pulsating Pressure and Shock Position
A sinusoidal pressure was applied at the outlet of the computational domain. The amplitude and frequency of the pressure change are shown in Table 2. In an unsteady calculation, the physical time step is adjusted according to the outlet pressure frequency. When the pressure disturbance frequency is 500 Hz, considering the identification of high frequency bands, the physical time step is 5 × 10⁻⁶ s and the total time is 1.0 s. Sub-iterations in each physical time step ensure that the residuals drop by four orders of magnitude so that the highly unsteady flow converges to the required accuracy.

Table 2.
The amplitude and frequency of pressure disturbance.
During the numerical simulation process, the position of the shock wave in the second throat is determined by detecting the pressure changes along the cross-sectional direction of the airflow. When pulsating pressure is not applied at the outlet, the shock wave is in an equilibrium position. As the outlet pressure changes, the shock wave oscillates near the equilibrium position. The shock wave moves upstream from its equilibrium position, reaches its maximum upstream, and returns to its equilibrium position. It then moves downstream again, reaches the farthest point downstream, and returns to the equilibrium position again. The above process is a cycle T.
2.2. Governing Equation
The governing equations are N-S equations. In the three-dimensional Cartesian coordinate system, its conserved form is:
where is time, is a conserved variable vector, , , are inviscid flux vectors, and , , are viscous flux vectors. The finite volume method is used in the solution of the flow field. In order to simulate the unsteady process, the double time step method is adopted. The space discretization adopts the second-order upwind scheme. The flux splitting adopts the Roe scheme. The time term discretization adopts the second-order implicit scheme, and the turbulence model adopts the sst turbulent model.
2.3. Boundary Conditions
The inlet pressure is given at the inlet. The total pressure of the inlet is given according to the Mach number of the wind tunnel, and the static pressure is calculated according to the one-dimensional ideal gas isentropic formula. The inlet total temperature is given. The inlet turbulence intensity is taken as 0.6%. The wall adopts a no-slip adiabatic wall. The outlet is a pressure outlet.
2.4. Algorithm Verification
In order to evaluate the numerical method, the experimental results are used for verification. By measuring the wall pressure distribution along the second throat, the pressure distribution along the pipeline was obtained. The pressure measuring hole is a circular hole with a diameter of 1 mm, and the spatial resolution of pressure measurement is about 100 mm. The pressure measurement system is the PSI 9116 electronic scanning valve system. The calculated state is Ma = 0.8. It can be seen from Figure 2 (in the figure, grid_167, indicates that the number of grid cells used in CFD is 1.67 million, and the same applies to others) that the Mach number distribution curve obtained by CFD is in good agreement with the test, and the shock wave position of the simulation results is in good agreement with the test. In the model support segment, the CFD results differ from the experimental results, possibly due to the fact that airflow re-entry was not considered in the current simulation and the model support was not simulated. The model support had a greater impact on the flow [14,15]. The difference between CFD results and experimental results in the high-speed diffuser section may be due to the different sizes of the separation zone..
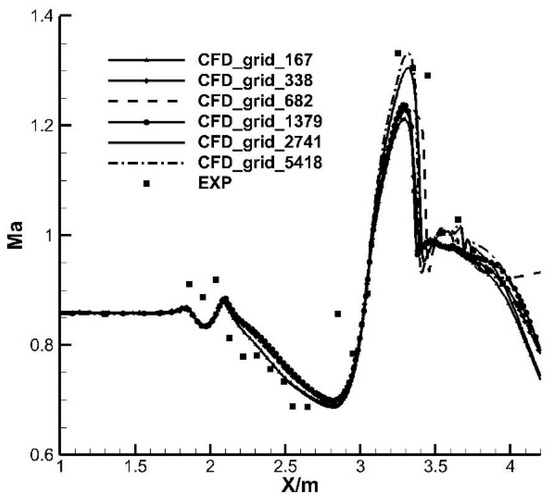
Figure 2.
Comparison of Mach number distribution along the centerline.
Overall, the numerical method in this paper can accurately simulate the key characteristics of the flow field, which verifies its reliability. From the comparison between Bruce’s experiment and CFD results, it can be seen that CFD can more accurately predict the velocity distribution in the process of shock forced oscillation [33]. As can be seen from Figure 2, when the number of grids is less than 20 million, the results do not change significantly, and when the number of grids exceeds 20 million, shock waves can be captured more accurately. As mentioned above, because unsteady calculations are extremely time-consuming, 6.82 million grids are selected. Georgiadis used about 7 million meshes in a flow similar to this paper, and was able to capture the main flow characteristics well [35].
3. Results and Discussion
3.1. The Pressure Disturbance Frequency Is 5 Hz
When the outlet pressure changes, it is equivalent to applying a pulse at the outlet. The pressure pulse propagates upstream at a certain speed. After reaching the shock wave, the flow field in the second throat is converted from symmetrical distribution to asymmetrical distribution. Figure 3 shows the Mach number contour of the symmetry plane within one cycle. Whether it is a strong shock or a weak shock, a curved shock is present. The pressure change at the outlet dominated the transition in the shock wave shape [36].
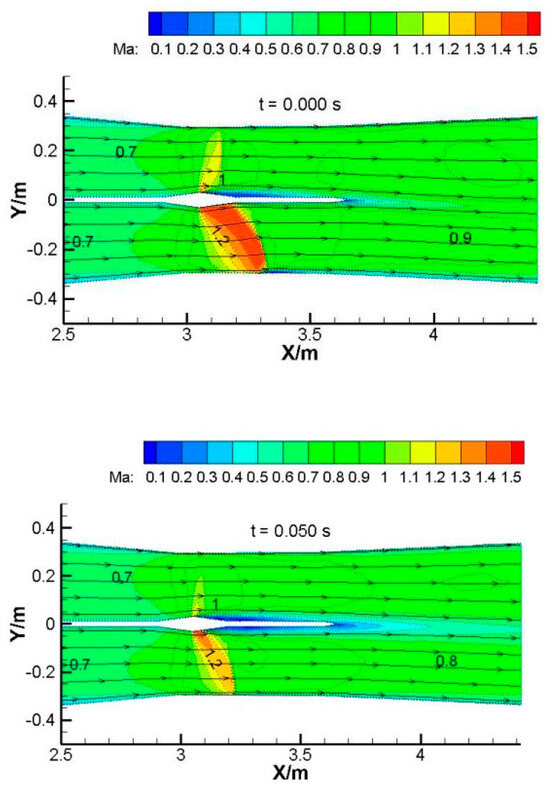
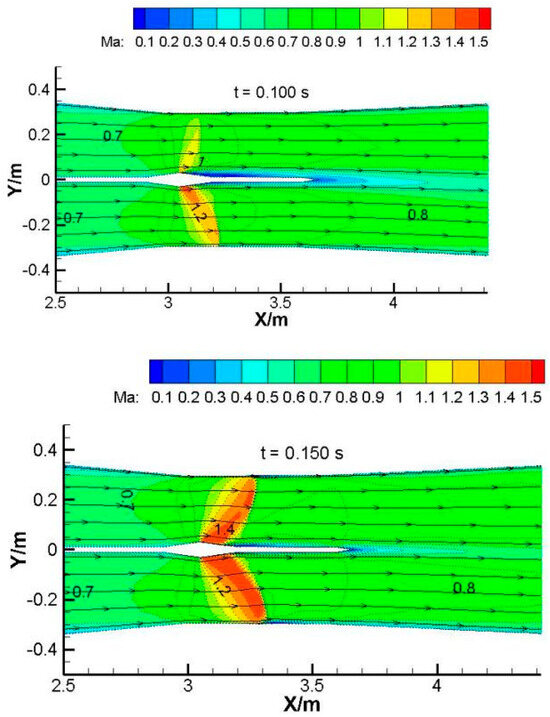
Figure 3.
Mach number contour of Z = 0 mm symmetry plane at different times.
The shock wave on one side oscillates between 3140 mm and 3190 mm along the x-direction, and the shock wave on the other side oscillates between 3200 mm and 3350 mm. The maximum displacement of the shock wave is 150 mm. Bruce’s research showed that CFD can accurately simulate the positional changes of shock waves [33]. The response of shock waves to downstream pressure disturbances is to change their position, resulting in a change in shock wave intensity. The shock wave is always located downstream of the highest point of the center body, i.e., downstream of the geometric throat. Bogar’s experimental results showed that in the transonic diffuser section, when the straight section existed, the perturbation effect of the downstream pressure fluctuation on the shock wave was weakened [22]. Therefore, the second throat should be provided with a relatively long straight section.
When the outlet pressure increases (0-T/4), a compression wave moving upstream is generated at the outlet position. After the pulsating pressure reaches the shock wave, the shock wave moves upstream. Therefore, the shock wave intensity weakens, and the wave front Mach number and pressure loss are reduced, and the flow separation is reduced, or even reattachment. On the side of the weak shock wave, the interference of the shock wave boundary layer is not dominant, the boundary layer of the wind tunnel wall is in a state of reattachment, and no separation occurs, but the separation of the center body position increases significantly, and there are clear vortices in the mixed layer at the tail of the middle partition. However, with the decrease in the outlet pressure, on the side of the strong shock wave (Ma > 1.3), the shock wave causes a wide range of separation of the boundary layer of the wind tunnel wall, and the interference of the shock wave boundary layer dominates. Separation near the center body is reduced, and the mixed shear layer at the rear of the middle baffle is weaker. When the outlet pressure decreases from the maximum value (T/4~3T/4), the shock wave moves downstream. The shock wave intensity and pressure loss increase, and the boundary layer separation zone increases, while the boundary layer and shear layer thicken, reducing the effective flow area of the pipeline. When the pressure starts to increase from the minimum value (3T/4~T), the shock wave starts to move upstream again, the separation zone decreases, the shear layer becomes thinner, and the flow area increases. Then a new cycle starts.
The degree of shock-induced separation is very sensitive to changes in shock intensity. With the alternate appearance and disappearance of separation bubbles, the separation shear layer becomes a highly unstable flow. This shape change in the separation bubble results in alternate thickening and thinning of the wall boundary layer, causing the core flow to oscillate slightly in the normal direction. Bourgoing’s experiments showed that the shock wave changed with time in both the flow direction and the normal direction [37]. Therefore, even if the flow field is symmetrical, the flow may be unsteady, especially in complex transonic flows. Hsieh compared the effect of downstream pressure changes on the flow in the diffuser section, which was significantly more complex [28].
When the shock wave is forced to oscillate, the shock wave extreme positions at the upstream or downstream is significantly different from that when there is no oscillation, as shown in Figure 4. The findings of some researchers in experiments are consistent with the conclusions of this paper [31,38]. This is because there is delay in the matching between the pressure at the shock wave position and the outlet back pressure, and overshoot occurs when the shock wave moves upstream or downstream. During forced oscillation, when the shock wave moves downstream, it will exceed the shock wave position calculated by steady-state calculation under the same back pressure and continue to move downstream. Vice versa, when the shock wave moves upstream, it will continue to move upstream.
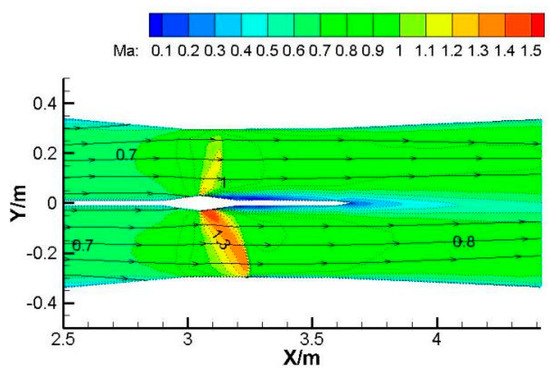
Figure 4.
Mach number contour of symmetry plane in steady state when outlet pressure increases by 1%.
Figure 5 shows the x-direction velocity power spectral density at different stations along the x-direction at a distance of 6 mm from the wind tunnel wall. It can be seen that at the station X = 3170 mm and X = 3210 mm, the velocity power spectral density changes greatly, which proves that the shock wave repeatedly passes through these two stations. Oscillation has a significant effect on the distribution of turbulent energy in the second throat. The peak at X = 3210 mm is the highest, which is just downstream of the shock boundary layer disturbance, at the edge of the separation bubble, and this peak may be formed by the vortex caused by separation. The peak at the X = 3230 mm station has become slightly smaller. At the station X = 3240 mm, the peak value continues to decrease, indicating that the influence of the airflow at this location by the disturbance of the shock wave boundary layer has weakened. After leaving the shock wave oscillation area, the pulsation velocity at the X = 3100 mm and X = 3400 mm stations along the x-direction becomes significantly smaller.
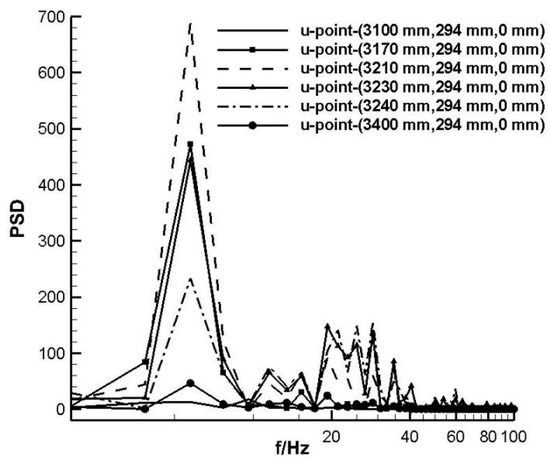
Figure 5.
Power spectral density of x-direction velocity at different positions.
The energy spectral density distribution is dominated by a single peak, with a peak frequency of f = 5.8 Hz, which is similar to the frequency of change in the downstream outlet pressure (i.e., the forced frequency). The difference may be related to the length of the high-speed diffuser section in the downstream area of the second throat. As can be seen from Figure 5, the energy of the pulsating velocity is concentrated in the low frequency range. Jones’s test results showed that the energy in the frequency band below 10 Hz accounted for about 15% of the total energy [4]. The second peak is f = 11.6 Hz, which has clear frequency doubling characteristics. In the higher frequency range, there are also multiple lower peaks, which may be related to the flow separation caused by the disturbance to the shock boundary layer. In the shock wave oscillation region, the pulsation velocity along the x-direction increases greatly in the low frequency band. It can be concluded that the interference of the center body wake and the shock boundary layer causes the low frequency and large-scale airflow movement. When these frequencies are close to the natural frequency of the wind tunnel body, variable aerodynamic loads will occur. When the pulsation is strong enough, it will cause strong vibration of the wind tunnel body and structural damage.
Figure 6 shows the pressure change at different stations with time. X = 2900 mm is located in the contraction section of the second throat and the main flow is located in the subsonic flow area. The pressure essentially does not change with the change in the outlet pressure. This is the embodiment of the choking effect of the second throat. Pressure disturbances in the downstream region do not affect the flow stability in the upstream region of the shock. X = 3100 mm is located at the entrance to the straight section. In the whole cycle, most of the airflow is in the supersonic flow range. (When the total inlet pressure remains unchanged, the static pressure is less than about 50 kPa for the supersonic flow.) The pressure fluctuation at the X = 3170 mm station is the most violent. About half of the time, the flow is a supersonic flow and half of the time it is a subsonic flow, indicating that the station is close to the average position of the shock wave oscillation. In the second half of the cycle, the pressure curve shows a peak-like pulsation, indicating that the airflow changes drastically during this time period and reflecting the change process in the flow from subsonic flow to supersonic flow, to subsonic flow, and then to supersonic flow. At the position of X = 3210 mm, the pressure change is more severe, but it is smaller than the pressure fluctuation at the initial shock wave position, indicating that the shock wave still sweeps through this point. At the station X = 3230 mm, the pressure is basically above 50 kPa. It can be considered that the flow at this station is all in the subsonic region, that is, the forced oscillation of the shock wave will not significantly affect the pressure distribution at this station. At the position X = 3240 mm, the pressure change is more moderate, indicating that the shock wave will not pass through this point when it moves toward the exit of the diffuser section.
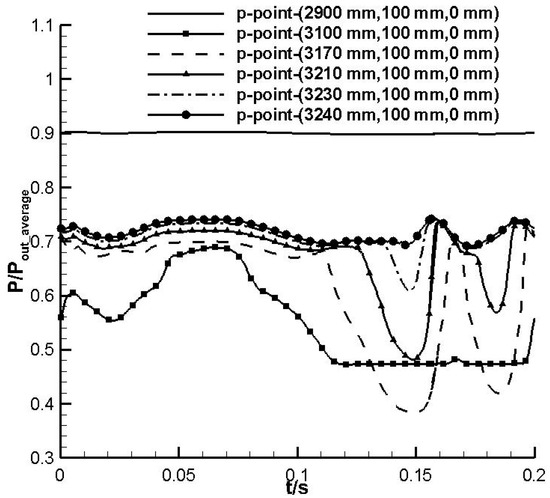
Figure 6.
Pressure changes at different positions of the core flow.
If we compare the pressure distribution at X = 3170 mm and X = 3230 mm, the phase delay can be clearly seen. From the time distribution characteristics, the sinusoidal pressure change in the outlet plane will cause the sinusoidal pressure at the same frequency in the second throat to change, but it changes significantly the phase angle and amplitude. The change in the phase angle is not affected by choking, which is in line with the acoustic theory. The pressure change at the X = 3170 mm position lags by about 0.010 s. The change in amplitude will be affected by the choking position. Upstream of the choking position, the amplitude change is significantly smaller, while downstream of the choking, the amplitude change is significantly larger, which is consistent with the propagation characteristics of small disturbances in the pipeline. Even if there is no complete choking in the second throat, the second throat still has the ability to partially resist pressure fluctuations downstream of the test section.
The pressure fluctuation amplitude at the exit is 1% of the average pressure, while in the straight section of the second throat, especially near the average position of the shock wave, the pressure fluctuation amplitude is the highest, and up to 16% of the average outlet pressure. Even at the position X = 3240 mm downstream of the shock wave, the pressure fluctuation amplitude is still 3% of the average outlet pressure. When the downstream pressure of the second throat fluctuates, the pressure fluctuation in the second throat shows a clear amplifying trend. As it moves toward the outlet, the amplification effect of this pressure disturbance presents a rapid downward trend.
It can be seen from Figure 7 that with the change in the outlet pressure, the force on the wall of the second throat also changes with time. The load on the left and right walls is significantly greater than that on the upper and lower walls. The second throat is subjected to a large asymmetric side load, which is related to the slow and random symmetry transformation of the flow field structure. When the shock wave is forced to oscillate, the effects of superimposed asymmetric separation may cause the second throat to vibrate. There are examples of pressure disturbances causing wind tunnel structures to vibrate and damage. In the first diffuser section of the 2.4 m wind tunnel, the long-term coupling vibration of the inner casing and the airflow resulted in structural fatigue and cracks [39]. In the 2.4 m wind tunnel, the left and right and upper and lower structures of the flow field were asymmetrical at the tee of the air inlet pipe, resulting in cracks on the pipe wall [40].
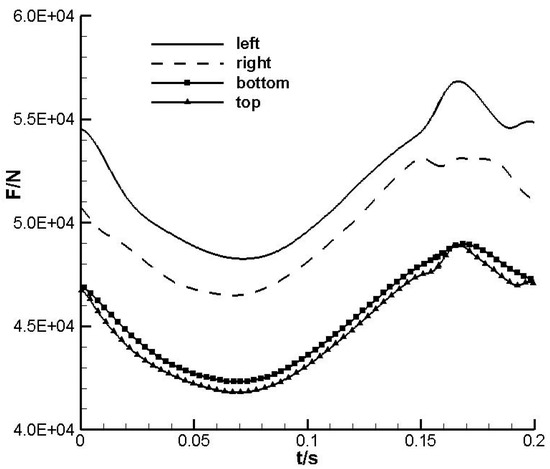
Figure 7.
Change of force on the second throat wall.
Figure 8 shows the polar coordinates of the loads in two directions in one cycle. The lateral loads in the two directions are anisotropic most of the time and can be followed regularly. When the flow field is in a symmetrical state, the lateral loads in both directions are isotropic.
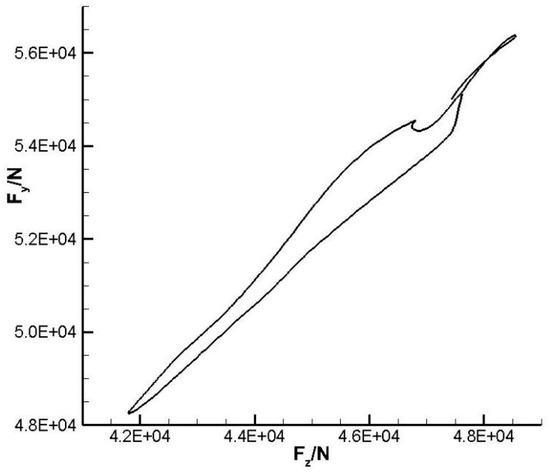
Figure 8.
Loads on the second throat in two directions.
Figure 9 shows the curve of the wavefront Mach number in the second throat and the Mach number in the test section with time. The “ideal” in Figure 9 represents the situation when fully following the distribution of sinusoidal pressure pulsation at the outlet.. The changes in the two parameters are similar to the changes in outlet pressure with time, but they are not completely sinusoidal. This may be caused by the aggregation and divergence of compression and expansion waves in the process of propagation from the exit of the computational domain to the shock wave. The shock wave intensity changes with the back pressure, and the change in the shock wave intensity reflects the change in the shock wave position. In the first 1/4 period, the back pressure gradually increases from the average value, forming a compression wave at the outlet and causing the shock wave to move towards the test section. The compression wave is in the process of chasing the shock wave, and the pressure in front of the shock wave continues to rise. Thus hindering the further forward movement of the shock wave, the airflow slows down, and the wavefront Mach number decreases. At this point, the wavefront Mach number can match the pressure discontinuity.
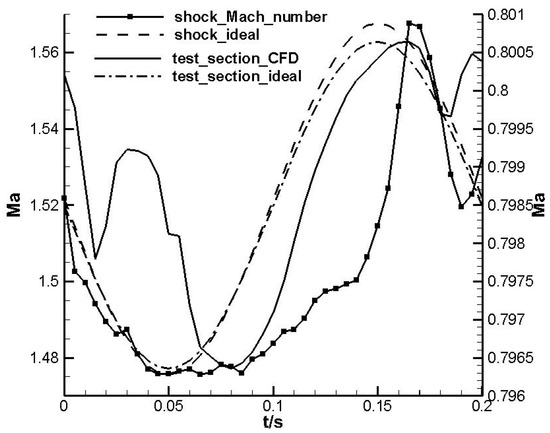
Figure 9.
Mach number variation in wavefront and test section with time.
When the pressure begins to decrease from the maximum value, that is, in the period of 1/4~3/4, the wavefront Mach number has a significant delay. The speed of the pressure drop is significantly greater than the speed of the increase in the wavefront Mach number. This is because the Mach number of the wavefront decreases after the pressure rises and the pressure loss decreases; then, the downstream pressure increases, hindering the shock wave moving downstream. It can also be considered that when the expansion wave propagates to the direction of the test section, it is in the process of encountering the shock wave moving downstream, and the airflow accelerates faster, so the Mach number curve becomes steeper. Until the pressure rises again, the wavefront Mach number largely matches the pressure change.
The change of Mach number in the test section basically matches the change in outlet pressure, and the fluctuation range of the Mach number is about 0.002. Choking cannot completely prevent the propagation of downstream pressure disturbance to the upstream. As can be seen from Figure 2 above, the weak shock wave side only reaches the speed of sound near the center body, and the flow near the wall of the wind tunnel is subsonic. There is a subsonic speed gap at the choking position, and pressure fluctuations will propagate upstream into the test section through the shock gap [12]. Rose’s experiments showed that pressure disturbances downstream of the shock could affect the pressure in the test section through the upstream propagation of the boundary layer [41]. Therefore, the fluctuation in airflow in the test section is inevitable. Nevertheless, Jones pointed out that this shallow shock was very effective in reducing the low frequency pulsation effects associated with wakes [4].
The choking reduces the Mach number instability in the test section even in the event of acoustic leakage. The noise in the test section of the Swedish T1500 was also significantly reduced when the second throat was not fully choking [42]. In Hashimoto’s numerical test, when there was no choking device, the static pressure downstream of the test section changed by 144.2 Pa, and the Mach number in the test section changed by 0.002 [43]. This is completely comparable to the situation in this paper. Under the same total pressure, the pressure fluctuation downstream of the second throat in this paper is 790 Pa. Compared with reference [43], the Mach number variation in the test section is 0.002 when the downstream pressure variation amplitude increases by five times. Therefore, it is recommended to use the second throat choking to control the Mach number stability in the test section.
The effect of the second throat choking on the Mach number stability of the test section can also be explained by the mass flow rate. Figure 10 shows the changes in the inlet and outlet flow rates with time. The maximum fluctuation of the outlet flow rate is 4.35 kg/s, while the maximum fluctuation of the inlet flow rate is only 0.20 kg/s. When the outlet flow rate changes with the back pressure, the inlet flow rate fluctuation is very small. The difference between the inlet and outlet flows rate fluctuates periodically, resulting in periodic oscillations in the flow field. When the shock wave moves downstream at the average position, the outlet velocity increases, causing the outlet flow rate to increase, which is greater than the inlet mass, so that the downstream airflow spreads, the pressure recovery ability decreases, and the local pressure drops, accelerating the speed of the shock wave moving downstream. When the shock wave moves upstream at the average position, it is just the opposite. In the downstream region of the shock, mass accumulation and diffusion occur periodically. During shock wave oscillation, in addition to the airflow along the x-direction, there are large airflow transport processes along the normal and span directions, especially near the wake mixing region after the center body, where the airflow shear is strongest.
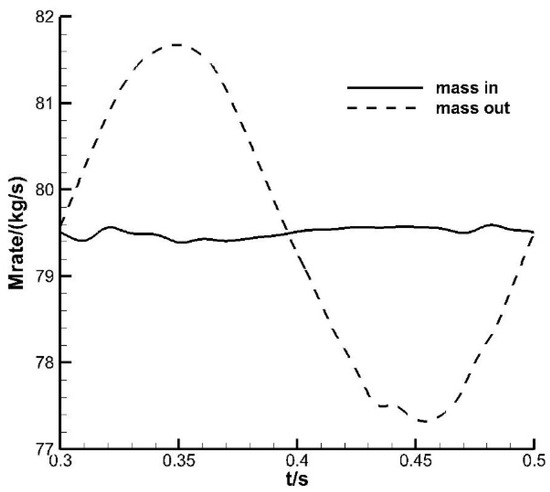
Figure 10.
Changes in mass flow rate at the entrance and exit to the computational domain.
3.2. Pressure Disturbance Frequency Is 10 Hz~2500 Hz
From Figure 11, it can be seen that different outlet pressure disturbance frequencies have different effects on the field. When the frequency is 10 Hz, the main frequency of the power spectral density of the core flow along the x-direction is 10.7 Hz, which is consistent with the downstream excitation frequency. There is a second peak at 20.0 Hz, and higher frequencies decay quickly. When the excitation frequency is 25 Hz, the main frequency is 24.4 Hz, and there is a second peak around 48.8 Hz. Compared with the pulsation peaks at 5 Hz and 10 Hz, when the downstream pressure disturbance frequency is 25 Hz, the peak value of pulsation velocity increases significantly, which may be due to acoustic resonance; that is, the inherent frequency of the airflow itself is around 25 Hz.
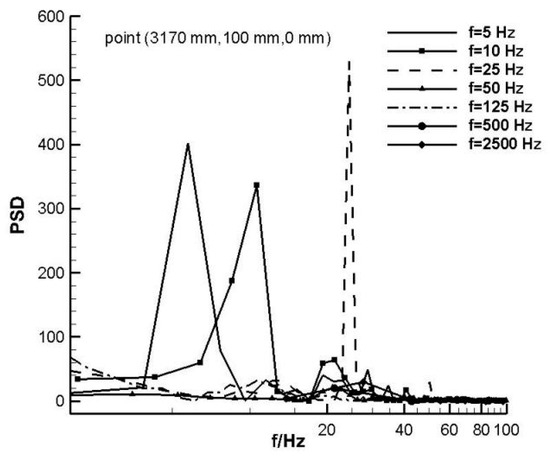
Figure 11.
The power spectral density of the core flow along the x-direction under different disturbance frequencies.
When the disturbance frequency is 50 Hz, the main frequency is 21.0 Hz; that is, the main frequency is no longer consistent with the excitation frequency, and there is a second peak near 50 Hz. The flow field still changes slightly. When the disturbance frequency increases to 125 Hz, there is no longer a clear peak value. The flow field displays almost no change.
The above conclusions are drawn when the pressure disturbance amplitude is 1%. Even if the pressure disturbance amplitude increases to 10%, the flow field does not change significantly at the excitation frequency of 500 Hz. Due to space limitations, the flow field contour is not given here. When the downstream pressure disturbance frequency is high, the shock wave is essentially unaffected. This is because when the perturbation frequency is low, the flow field downstream of the shock wave can quickly reach an equilibrium state before the outlet pressure continues to change. Because it takes time for the downstream pressure to transmit to the shock wave, when the frequency increases, the disturbance propagation time is significantly longer than the change time of the downstream pressure, the shock wave and the flow field have difficulty in keeping up with the rhythm, and the flow field basically remains unchanged.
4. Conclusions
Numerical experiments were conducted to study the shock wave dynamics when the downstream pressure disturbance frequency ranged from 5 Hz to 2500 Hz. The response of the shock wave in the second throat to the unsteady pressure perturbation at the exit of the computational domain is a very complex transient process, involving shock wave oscillation, separation, shear layer, generation and development of the boundary layer and the interaction between them. Together, they determine the unsteady properties in the second throat. The conclusions are as follows:
- (1)
- Forced shock oscillations are caused by the propagation of a wavefront originating from downstream pressure perturbations that periodically alter the shock position and the flow field structure downstream of the shock, including boundary layer thickness, the size of the separation zone, and the size of the wake mixing zone. The shock boundary layer interference is very sensitive to the shock wave position. Due to the large shock wave displacement, a relatively long straight section needs to be provided in the second throat.
- (2)
- Compared with the outlet back pressure, the pressure change near the shock wave has a phase delay. The pressure disturbance shows a significant amplification effect; in particular, the closer the shock wave is, the more obvious it is. This leads to overshoot when the shock moves upstream or downstream. Under the same back pressure, the shock wave position in the unsteady state is different from the position in the steady state.
- (3)
- The variation trend in the second throat wall force, wavefront Mach number, and Mach number in the test section with time is consistent with the downstream disturbance, but does not have a complete follow-up effect. It shows that the pressure disturbance will propagate into the test section through the boundary layer or shock gap, but it is still recommended to use the second throat choking to control the Mach number stability of the test section.
- (4)
- The dynamic characteristics of shock oscillation are related to the amplitude and frequency of the applied pressure disturbance. The shock displacement decreases with the increase in the excitation frequency. When the frequency is higher than 125 Hz, the flow field is no longer sensitive to the forced excitation.
Author Contributions
C.C. is responsible for the numerical simulation section, writing the paper, preparing the manuscript, reviewing, and editing. Z.T. is responsible for the conceptualization and methodology of the paper. H.Q. and X.Y. are project managers responsible for conducting experiments. All authors have read and agreed to the published version of the manuscript.
Funding
We would like to thank the Jiangsu Universities Advantage Discipline Construction Project Funding Project for their support.
Data Availability Statement
Where no new data were created, or where data is unavailable due to privacy or ethical restrictions.
Acknowledgments
Thank you to my family for their support in my work, especially Jian Peng. Thank you to my supervisor, Zhili Tang. Thank you to the colleagues in the research group who worked together.
Conflicts of Interest
The authors declare no conflict of interest.
References
- Robert, L.C. The New French High Speed Wind Runnel. National Advisory Committee for Aeronautics, Washington, NACA TM-205. 1923. Available online: https://digital.library.unt.edu/ark:/67531/metadc277372/ (accessed on 10 August 2023).
- Knight, W. ltalian and French Experiments on Wind Tunnels. NACA TN-17; 1920. Available online: https://ntrs.nasa.gov/api/citations/19930080818/downloads/19930080818.pdf (accessed on 10 August 2023).
- Kilgore, R.A. Evolution and Development of Cryogenic Wind Tunnels. AIAA paper 2005-457. In Proceedings of the 43rd AIAA Aerospace Sciences Meeting and Exhibit, Reno, NV, USA, 10–13 January 2005. [Google Scholar]
- Jones, G.; Balakrishna, S.; DeMoss, J.; Goodliff, S.; Bailey, M. Influences of models on the unsteady pressure characteristics of the NASA national transonic facility. AIAA paper 2015-1557. In Proceedings of the 53rd AIAA Aerospace Sciences Meeting, Kissmmee, FL, USA, 5–9 January 2015. [Google Scholar]
- Mabey, D.G. Some Remarks on the Design of Transonic Tunnels with Low Levels of Flow Unsteadiness; NASA-CR-2722; Royal Aircraft Establishment: Bedford, UK, 1976. [Google Scholar]
- Long, D.F. Acoustic testing in transonic wind tunnels. AIAA paper 2006–0921. In Proceedings of the 44th AIAA Aerospace Sciences Meeting and Exhibit, Reno, NV, USA, 9–12 January 2006. [Google Scholar]
- Guo, D.M.; Luo, J.B.; Fang, D.N. Key scientific issues on the design and construction of large wind tunnels. Bull. Natl. Nat. Sci. Found. China 2017, 5, 420–427. (In Chinese) [Google Scholar]
- Chen, J.M.; Wu, S.H.; Chen, Z.H.; Lyu, J.L.; Pei, H.T. Experimental research on noise reduction for continuous transonic wind tunnel loop. J. Northwest. Polytech. Univ. 2020, 38, 855–861. (In Chinese) [Google Scholar] [CrossRef]
- Brooks, J.D.; Stainback, P.C.; Brooks, C.W., Jr. Additional flow quality measurements in the Langley Research Center 8-Foot Transonic Pressure Tunnel. AIAA paper 80-0434. In Proceedings of the 11th Aerodynamic Testing Conference, Colorado Springs, CO, USA, 18–20 March 1980. [Google Scholar]
- Barnwell, R.W.; Edwards, C.L.W.; Kilgore, R.A.; Dresstt, D.A. Optimum transonic wind tunnel. AIAA paper 1986-0755. In Proceedings of the 14th Aerodynamic Testing Conference, West Palm Beach, FL, USA, 5–7 March 1986. [Google Scholar]
- Mabey, D.G. Further Noise Measurements in a Slotted Cryogenic Wind Tunnel; RAE-TM-AERO-2201; Royal Aircraft Establishment: Bedford, UK, 1990. [Google Scholar]
- Sawyer, R.S.; Krynytzky, A.J. Overview of the NWTC studies and experiments. AIAA paper 97-0092. In Proceedings of the 35th Aerospace Sciences Meeting and Exhibit, Reno, NV, USA, 6–9 January 1997. [Google Scholar]
- Mckinney, M.O.; Scheiman, J. Evaluation of Turbulence Reduction Devices for the Langley 8-Foot Transonic Pressure Tunnel; NASA TM-81792; NASA Langley Research Center: Hampton, VA, USA, 1981.
- Stainback, P.C.; Harvey, W.D.; Owen, F.K. Evaluation of flow quality in two NASA transonic wind tunnels. NASA-TP-1737. In Proceedings of the AIAA 12th Fluid and Plasma Dynamics Conference, Williamsburg, VA, USA, 23–25 July 1981. [Google Scholar]
- Owen, F.K.; Stainback, P.C.; Harvey, W.D. Evaluation of flow quality in two NASA transonic wind tunnels. J. Aircr. 1981, 18, 451–457. [Google Scholar] [CrossRef]
- Bo, X.; Enmin, Z.; Song, C.; Wen, Z.; Kai, L.; Xinfu, L. Research on key technologies of debugging and operating in 0.6 m × 0.6 m continuous transonic wind tunnel. J. Exp. Fluid Mech. 2016, 30, 81–86. (In Chinese) [Google Scholar]
- Yoshinaga, T.; Fujii, K.; Nagai, S.; Yamaguchi, T. Suppression of infrasonic noise emanating from the NAL 1 m × 1 m supersonic wind tunnel. AIAA paper 97-0664. In Proceedings of the 35th Aerospace Sciences Meeting and Exhibit, Reno, NV, USA, 6–9 January 1997. [Google Scholar]
- Liao, D.X.; Chen, W.H.; Peng, L. Research on the intellectualization of large-scale wind tunnel equipment. Control. Inf. Technol. 2019, 1, 18–22. (In Chinese) [Google Scholar]
- Sajben, M.; Kroutil, J.C. Effects of initial boundary-layer thickness on transonic diffuser flows. AIAA J. 1981, 19, 1386–1393. [Google Scholar] [CrossRef]
- Grzona, A.; Olivier, H. Shock train generated turbulence inside a nozzle with a small opening angle. Exp. Fluids 2011, 51, 621–639. [Google Scholar] [CrossRef]
- Bogar, T.J. Structure of self-excited oscillations in transonic diffuser flows. AIAA J. 1986, 24, 54–61. [Google Scholar] [CrossRef]
- Bogar, T.J.; Sajben, M. Response of transonic diffuser flows to abrupt increases of back pressure wall pressure measurements. AIAA paper 87-1356. In Proceedings of the 19th AIAA, Fluid Dynamics, Plasma Dynamics, and Lasers Conference, Honolulu, HI, USA, 8–10 June 1987. [Google Scholar]
- Robinet, J.C.; Casalis, G. Shock oscillations in diffuser modeled by a selective noise amplification. AIAA J. 1999, 37, 453–459. [Google Scholar] [CrossRef]
- Matsuo, K.; Miyazato, Y.; Kim, H.D. Shock train and pseudo-shock phenomena in internal gas flows. Prog. Aerosp. Sci. 1999, 35, 33–100. [Google Scholar] [CrossRef]
- Bogar, T.J.; Sajben, M.; Kroutil, J.C. Characteristic frequencies of transonic diffuser flow oscillations. AIAA J. 1983, 21, 1232–1240. [Google Scholar] [CrossRef]
- Handa, T.; Masuda, M.; Matsuo, K. Mechanism of shock wave oscillation in transonic diffusers. AIAA J. 2003, 41, 64–70. [Google Scholar] [CrossRef]
- Bur, R.; Benay, R.; Galli, A.; Berthouze, P. Experimental and numerical study of forced shock-wave oscillations in a transonic channel. Aerosp. Sci. Technol. 2006, 10, 265–278. [Google Scholar] [CrossRef]
- Hsieh, T.; Wardlaw, A.B., Jr.; Collins, P. Numerical investigation of unsteady inlet flowfields. AIAA J. 1987, 25, 75–81. [Google Scholar] [CrossRef]
- Rodi, P.E.; Emami, S. Unsteady pressure behavior in a ramjet scramjet inlet. J. Propuls. Power 1996, 12, 486–493. [Google Scholar] [CrossRef]
- Olson, B.J.; Lele, S.K. Low-frequency unsteadiness in nozzle flow separation. AIAA paper 2012-2974. In Proceedings of the 42nd AIAA Fluid Dynamics Conference and Exhibit, New Orleans, LA, USA, 25–28 June 2012. [Google Scholar]
- Bruce, P.J.K.; Babinsky, H. An experimental study of transonic shock-boundary layer interactions subject to downstream pressure perturbations. Aerosp. Sci. Technol. 2010, 14, 134–142. [Google Scholar] [CrossRef]
- Biswas, D. Unsteady 3D Navier-Stokes simulations on characteristic frequency and length scales in transonic diffuser. AIAA paper 2004-2715. In Proceedings of the 34th AIAA Fluid Dynamics Conference and Exhibit, Portland, OR, USA, 28 June–1 July 2004. [Google Scholar]
- Bruce, P.J.K.; Babinsky, H.; Tartinville, B.; Hirsch, C. Experimental and numerical study of oscillating transonic shock waves in ducts. AIAA J. 2011, 49, 1710–1720. [Google Scholar] [CrossRef]
- Cong, C.H.; Liao, D.X.; Chen, J.M. Numerical investigation on performance of second throat in transonic wind tunnel. J. Aerosp. Power 2010, 25, 2050–2056. (In Chinese) [Google Scholar]
- Georgiadis, N.J.; Vyas, M.A.; Yoder, D.A. Wind-US Code Contributions to the First AIAA Shock Boundary Layer Interaction Prediction Workshop; NASA-TM-217837; NASA Glenn Research Center: Cleveland, OH, USA, 2013.
- Verma, S.B.; Manisankar, C. Origin of flow asymmetry in planar nozzles with separation. Shock Waves 2014, 24, 191–209. [Google Scholar] [CrossRef]
- Bourgoing, A.; Reijasse, P. Experimental analysis of unsteady separated flows in a supersonic planar nozzle. Shock Waves 2005, 14, 251–258. [Google Scholar] [CrossRef]
- Doerffer, P.; Szulc, O.; Magagnato, F. Shock wave-boundary layer interaction in forced shock oscillations. J. Therm. Sci. 2003, 12, 10–15. [Google Scholar] [CrossRef]
- Chen, W.H.; Wang, Y.X.; Wang, C.Q.; Wu, J.Q. Fault diagnosis of the wind tunnel structure based on finite element method. J. Exp. Fluid Mech. 2011, 25, 63–67. (In Chinese) [Google Scholar]
- Cong, C.H.; Qin, H.G.; Ren, Z.B.; Chen, J.M. Numerical simulation of flow field characterisctics of impacting T-junction duct in wind tunnel. J. Aerosp. Power 2020, 35, 235–243. (In Chinese) [Google Scholar]
- Rose, J.B.R.; Jinu, G.R.; Brindha, C.J. A numerical optimization of high altitude testing facility for wind tunnel experiments. Chin. J. Aeronaut. 2015, 28, 636–648. [Google Scholar] [CrossRef]
- Long, D.F. An experimental evaluation of test section noise in transonic wind tunnels. AIAA paper 90-1419. In Proceedings of the 16th Aerodynamic Ground Testing Conference, Seattle, WA, USA, 18–20 June 1990. [Google Scholar]
- Hashimoto, A.; Kohzai, M.; Aoyama, T.; Murayama, M. Wall interference analysis of transonic wind tunnel with porous wall model. AIAA paper 2011-3017. In Proceedings of the 29th AIAA Applied Aerodynamics Conference, Honolulu, HI, USA, 27–30 June 2011. [Google Scholar]
Disclaimer/Publisher’s Note: The statements, opinions and data contained in all publications are solely those of the individual author(s) and contributor(s) and not of MDPI and/or the editor(s). MDPI and/or the editor(s) disclaim responsibility for any injury to people or property resulting from any ideas, methods, instructions or products referred to in the content. |
© 2023 by the authors. Licensee MDPI, Basel, Switzerland. This article is an open access article distributed under the terms and conditions of the Creative Commons Attribution (CC BY) license (https://creativecommons.org/licenses/by/4.0/).