Review

Temperature and Precipitation Extremes over the Iberian Peninsula under Climate Change Scenarios: A Review

CESAM-Physic’s Department, University of Aveiro, Campus Universitario de Santiago, 3810-193 Aveiro, Portugal
*
Author to whom correspondence should be addressed.
Climate 2021, 9(9), 139; https://doi.org/10.3390/cli9090139
Submission received: 27 July 2021 / Revised: 3 September 2021 / Accepted: 8 September 2021 / Published: 14 September 2021
(This article belongs to the Special Issue Extreme Weather Events)

Abstract

:
This paper presents the results of a systematic review of temperature and precipitation extremes over the Iberian Peninsula, focusing on observed changes in temperature and precipitation during the past years and what are the projected changes by the end of the 21st century. The purpose of this review is to assess the current literature about extreme events and their change under global warming. Observational and climate modeling studies from the past decade were considered in this review. Based on observational evidence and in climate modeling experiments, mean and maximum temperatures are projected to increase about 2 °C around the mid-century and up to 4 °C by the end of the century. The more pronounced warming is expected in summer for the central-south region of IP, with temperatures reaching 6 °C to 8 °C around 2100. Days with maximum temperature exceeding 30 °C and 40 °C will become more common (20 to 50 days/year), and the heatwaves will be 7 to 10 times more frequent. Significative reduction in events related to cold extremes. The climate change signal for precipitation in IP shows a considerable decline in precipitation (10–15%) for all seasons except winter. It is predicted that heavy precipitation will increase by 7% to 15%. Extreme precipitation will increase slightly (5%) by mid-century, then decline to 0% by 2100. Significant reduction in wet days (40% to 60%) followed by a dryness trend more pronounced by the end of the century.

1. Introduction

There are indications that climate change is responsible for most of the change in risk associated with weather-related disasters over Europe [1]. Simultaneously, the increase in the frequency and intensity of Europe’s extreme events has been well documented in several studies (e.g., [2,3]). The Paris Agreement is the global answer to minimize the risk from climate change by setting up a long-term common threshold of warming of the planet below 2 °C, preferably to 1.5 °C, compared to pre-industrial levels. To achieve this limiting temperature, serious economic and social transformations must occur to achieve climate neutrality by mid-century. However, according to the latest climate update issued by the World Meteorological Organization (WMO), there is a likelihood that the 1.5 °C warming will be temporarily reached in the next 5 years.
Extreme weather events, such as heatwaves, droughts, floods, and wildfires, are expected to increase in frequency, severity, and intensity because of rising temperatures, while cold spells and snow are expected to decrease [4]. The climate response to global warming varies from region to region. What might be extreme for one region can be a normal event for another. Southern and south-eastern Europe are identified as regions of interest for being areas most affected by extreme weather [5,6]. Hence, the Iberian Peninsula (IP) climate is susceptible to changes in precipitation and temperature because the reduction in precipitation in the preceding winter and spring months may affect the soil moisture content favoring the occurrence and persistence of extreme temperatures and summer heatwaves [7]. In agriculture or water resource management, for example, fewer precipitation events with higher intensity can lead to profound consequences, such as ruined crops and flash floods.
Although extreme events are part of the natural climate variability, the observed changes in extreme events are linked with the intensification of the event, such as an increase in extreme temperature (cold or hot) or an increase in the number of precipitation events in some regions [8]. Temperature and precipitation are expected to be affected by changes in their variability as they are two of the elements of the climatic system. Hence, most of those studies focus on temperature and precipitation.
These facts prompt several studies about climate change and climate variability on the IP and/or Europe yielding a significative high number of studies. The IP is particularly vulnerable to climate change due to its geographic location and climatic characteristics, and it is one of the areas where extreme temperature episodes, such as heat waves and cold spells, are expected to increase in frequency in the future [9,10,11,12].
The motivation underlying this review lies in the necessity of presenting a comprehensive examination of climate change and climate variability in high vulnerability region as the Iberian Peninsula with respect to extreme events and explores the methods and climate change indicators used in this type of studies. Additionally, results from studies using observational evidence and modeling experiments were also considered. Further, a synthesis like this could help create a broader picture of what type of changes are expected to happen. This study examines the current state of research in temperature and precipitation extreme events (heat/cold spells, hot days, cold days, and days/events with precipitation in the top 5% of the events) and their change under global warming. After the introduction, this review is structured as follows: Section 2 presents the method for search and selected the eligible studies. Section 3 presents the outcomes associated with climate simulations. Finally, the review ends with a summary and conclusions.

2. Methodology

The systematic review was performed following the Preferred Reporting Items for Systematic Reviews and Meta-Analyses, PRISMA, guidelines [13]. PRISMA was designed to synthesize, assess, and track scholarly literature on a certain topic of interest. The method was developed in such a way that the authors, following a sequence of steps, were able to identify a number of evidence-based items for reporting systematic reviews. The methodology consisted of four major steps: identification, screening, eligibility, and included studies (Figure 1). The process entailed choosing and categorizing papers according to certain eligibility criteria in order to minimize the potential biases that can occur in a research study. The adopted methodology was intended to comprehensively synthesize and evaluate the scientific literature on the topic of interest.

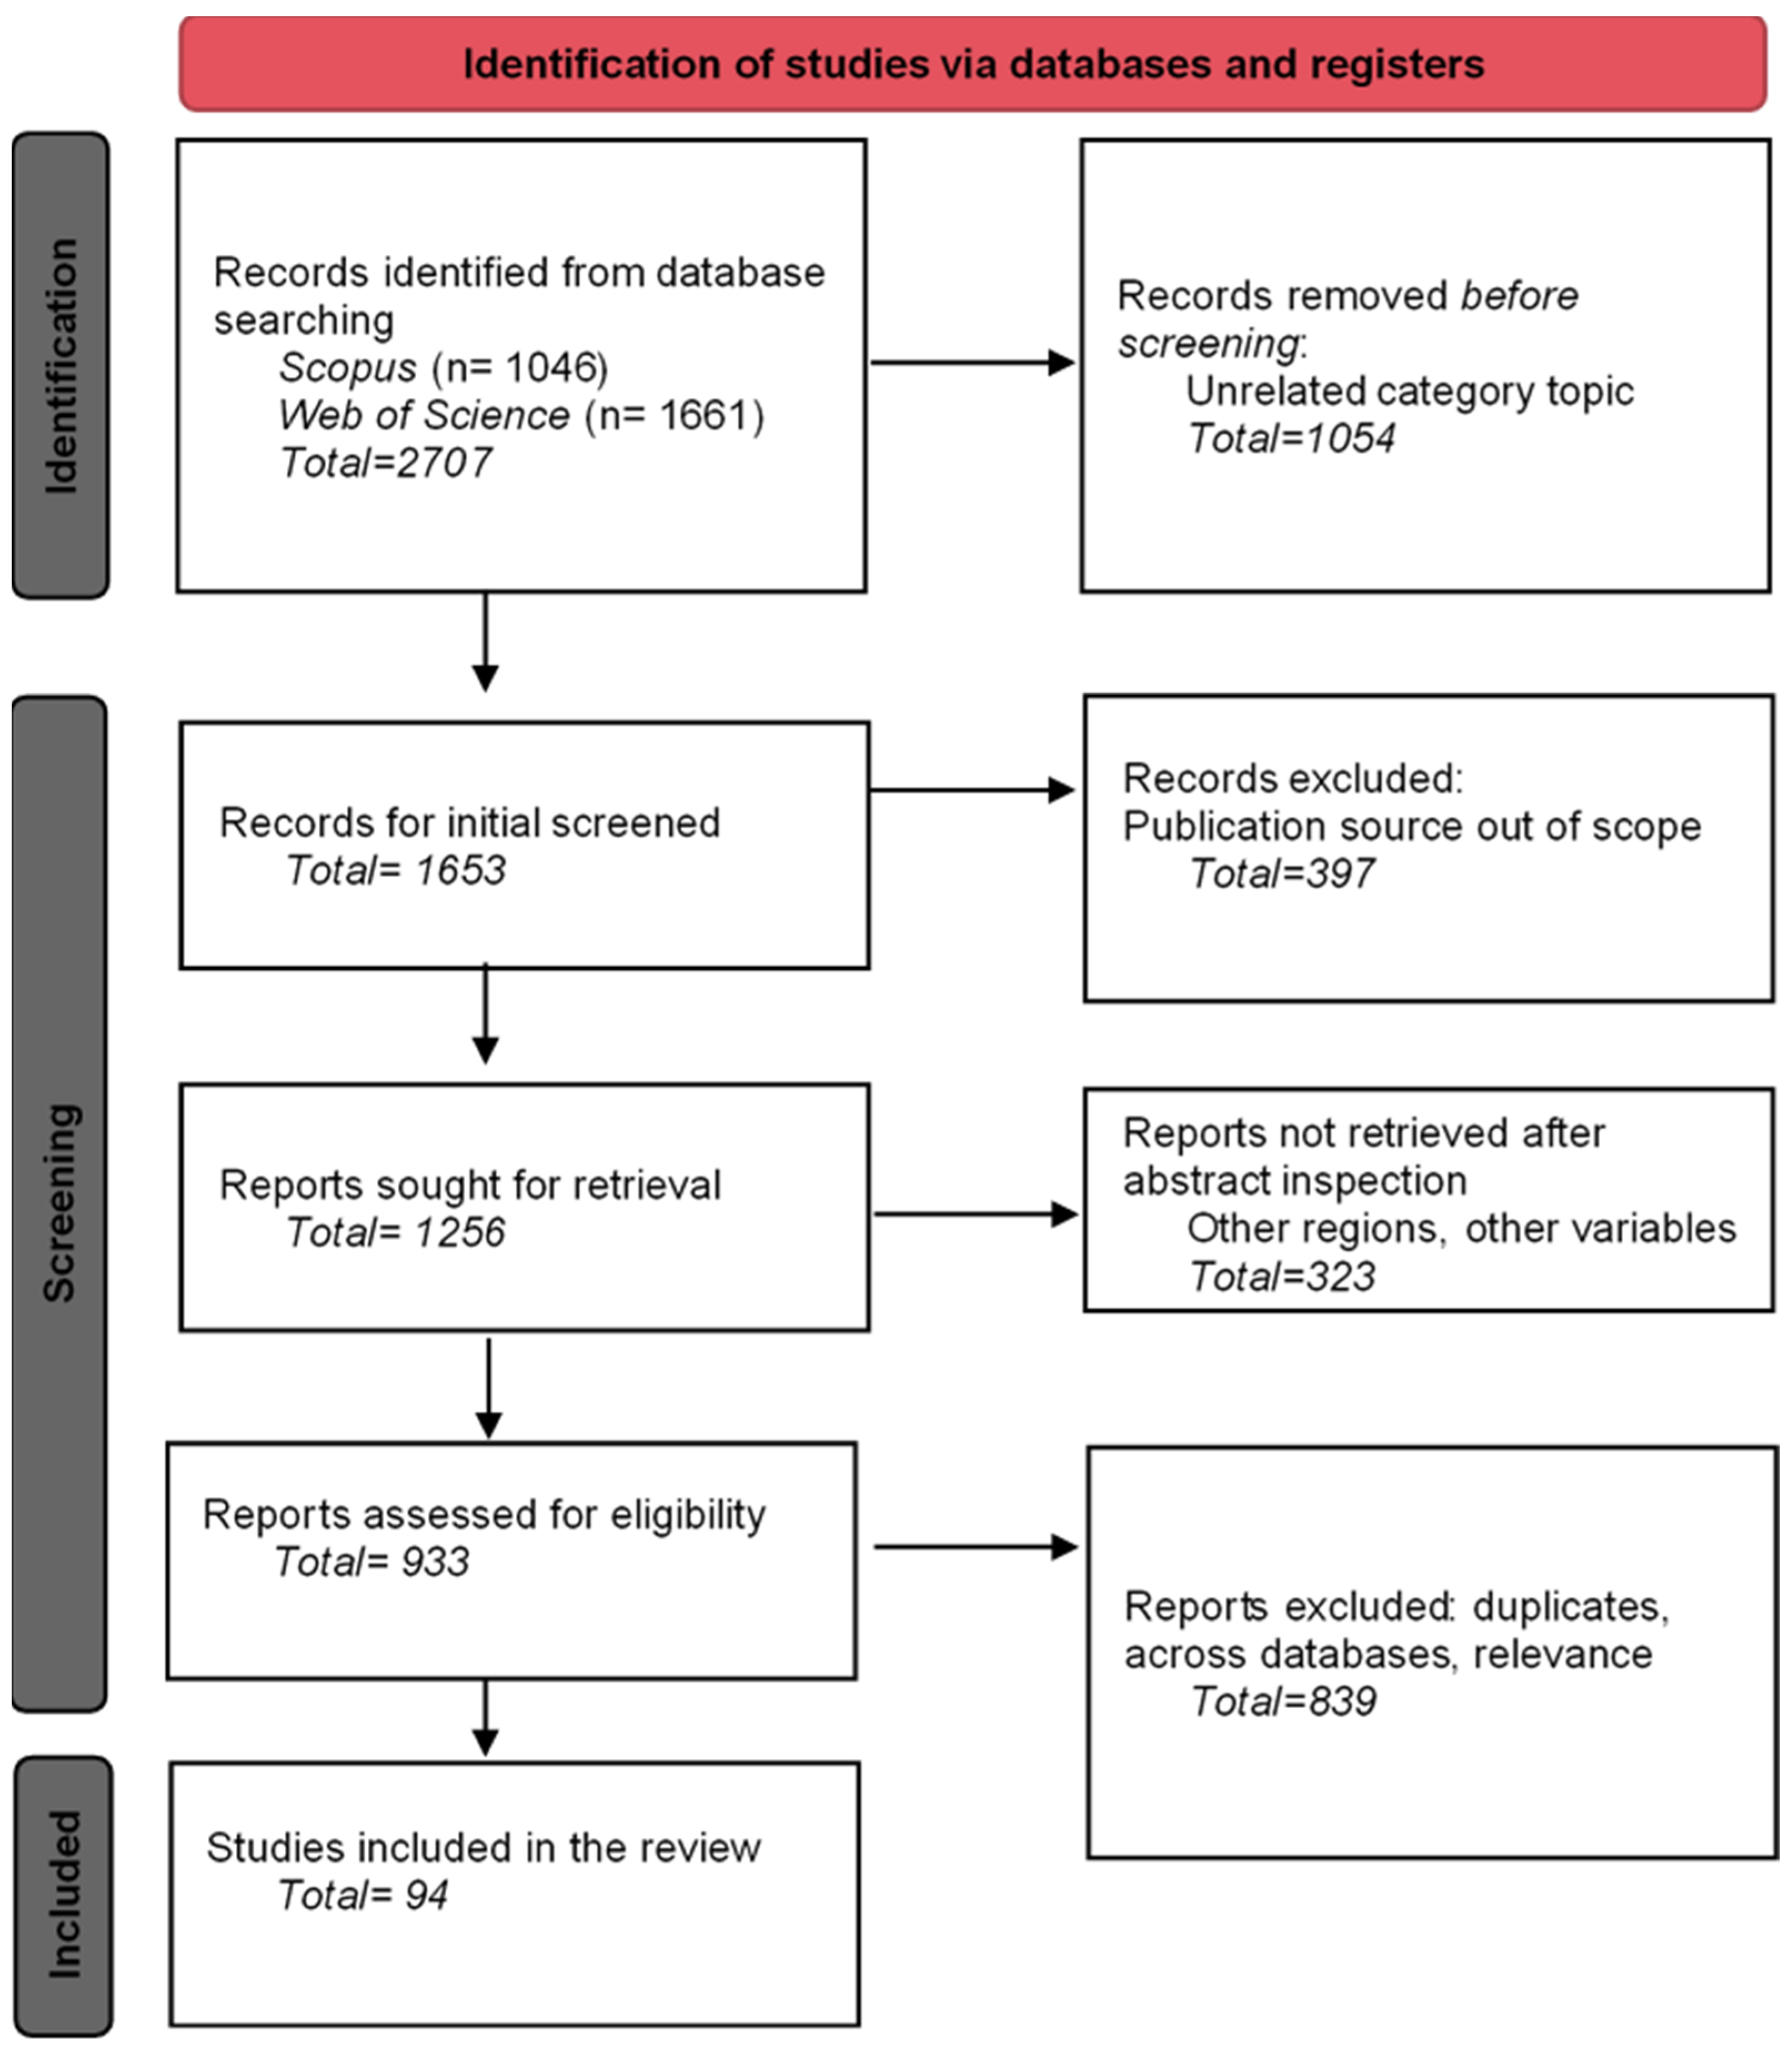
2.1. Search Strategy and Strategy of Exclusion

The systematic literature search was carried out for studies published between January 2010 to present day in two scientific relevant databases: Scopus and Web of Science, using the following keywords:
(“extreme events” OR “climate change” OR “global warming” OR “extreme heat” OR “extreme cold” OR “warm spells” OR “cold spells” OR “heatwaves” OR “precipitation episodes” OR “heavy precipitation” OR “rainfall” OR “extreme rainfall” OR “floods” OR “rainfall events” OR “heavy rain” OR “droughts”).
Studies outside Europe and/or not covering the Iberian Peninsula were discarded using the following operators: (AND (“Iberian Peninsula” OR “Iberia” OR “Portugal” OR “Spain” OR “Europe”) AND NOT (“Asia” OR “Eurasia”) but studies conducted for the globe were included as they cover the region of interest.
Since the amount of information is significantly high, the number of articles was narrowed down by specifying other search parameters. Since the majority of indexed scientific articles are written in English, only studies written in this language were considered.
In addition, the publications were restricted to journal publications limited to the subject area ”Earth and Planetary Sciences” and “Meteorology & Atmospheric Sciences”, whether the search was carried out in Scopus or the in Web of Science, respectively. Nevertheless, the search yielded a total of 2707 scientific publications.
After identification and before screening, a first round of exclusion was performed without subjects related to ocean, marine and costal, geophysical, geography, chemistry sciences, and past climates. Next, records for the initial screen were limited to publications titles (Journals) in the subject area of interest, yielding 1256 scientific publications sought for retrieval.

2.2. Selection Criteria

A total of 1256 scientific publications was sought for retrieval. After identification, these papers were screened for eligibly and inclusion. The first step was to evaluate the significance of each article to the aims and objectives of this review. Hence, scientific publications had to meet the following criteria:
  • Types of studies: Observational and/or numerical modeling studies;
  • Topic: extreme events related to temperature and precipitation (see Section 2.3);
  • Methods: statistical methods and/or climate change indices;
  • Region: Preferably the Iberian Peninsula but Global or Europa as long as they cover the IP;
  • Author: Relevant author with reference study;
  • Period: historical and climate projections.
After the relevance of each scientific publication was assessed, we identified the 94 final articles included in this review.

2.3. Concept of Weather Extreme Events and Climate Extremes

Tornadoes, hurricanes, blizzards, dust storms, floods, ice storms, heatwaves, droughts, extreme heat/cold, and other extreme weather phenomena fall under the category of extreme weather events, more commonly extreme events. The underlying climatic variable present in each weather event over a longer period forms the link between weather and climate. For example, in heatwaves, the underlying elementary climate variable is the temperature (daily maximum temperature). If we consider floods, the climate variable is daily precipitation. In a probability distribution, this daily precipitation value will appear above a certain value in the upper tail of the variable’s density distribution function. The concept of an extreme in climate variables refers to the values in the tails of the probability distribution function, i.e., values exceeding a certain threshold, usually the 90th percentile [14].

3. Results

3.1. Observed Changes and Future Projections in Temperature

Recently, the Intergovernmental Panel on Climate Change (IPCC) released a special report on the impacts of global warming of 1.5 °C above the pre-industrial levels (1850–1900) [4]. The threshold of 1.5 °C was established because it is thought that global warming is likely to reach this value around mid-century (2030–2052) [4]. The major key findings point to a past global warming trend that will continue during the ongoing years. There is evidence, for the period of 2006–2015, that global mean surface temperature anomalies were 0.87 °C higher than the average over the pre-industrial period, with some regions experiencing a faster warming rate (Artic) than others (over the oceans) [4]. The observed global warming for the period mentioned is consistent among different datasets [15].
Regional studies for Europe show evidence of an increasing trend in the average temperature, with the minimum temperature increasing at a higher rate than maximum temperature (e.g., [16]). Globally averaged over the past 60 years, the temperature related to the coldest night of the year has increased by about 2 °C, and the daily amplitude range has decreased [16].
According to recent literature, the IP is also warming. The historical warming trend and the high increase in the minimum temperature have been extensively documented (e.g., [6,11,12,17,18,19,20]). Some studies highlighted particular characteristics, such as (1) the central Peninsula temperature hiatus (e.g., [19,20]); (2) trend dependency on the chosen period [20]; (3) multi-physics ensembles [12,17], finally, (4) climate and climate variability in present-day simulations [9].
There is a multitude of studies in recent literature related to projections of climate at 1.5 °C and 2 °C of warming above the pre-industrial period. All of them point to future changes, in relation to present conditions, and with differences among global warming of 2 °C and 1.5 °C [1,14,21,22,23,24,25,26,27,28,29,30,31,32,33,34].
Recent literature suggests that projections of extreme temperature events increase at a faster rate than global mean surface temperature increases (e.g., [35]), while others point to a linear relationship between the mean response of the intensity of temperature extremes in climate models to changes in the global mean temperature (e.g., [24,36], regardless of the considered emissions scenario [21,24].
When considering the number of days exceeding a particular threshold, the changes are approximately exponential, with higher increases for rare events [1,30].
Furthermore, there are significant differences among a 1.5 °C versus a 2 °C global warming (e.g., [37]) with southern Europe expecting greater changes in severe hot days [6,11,36,38] and an increase in minimum temperature [5,6,11,37,38] and a notable reduction in cold extremes (e.g., [5,6,11,36,38]).
Over mainland Portugal, there is a detectable overall warming trend that is consistent with the dominant global warming and reflects an increase in both maximum and minimum temperature for the second half of the 20th century (e.g., [39]).
The projected changes agree with the ones mentioned above: increase in the maximum and minimum temperatures in all seasons and scenarios (e.g., [9,11] with a maximum variation of +8 °C for summer and autumn, and a maximum of 4 °C for winter and spring, when compared with the 1971–2000 period [9], for the RCP8.5 scenario. Over Portugal, the generalized warming concurs with the projected shift to the right of the Probability Distribution Function (PDF), and the frequency of extreme events, such as heatwaves and very hot days, increases [5,6,11,36,38]. In some cases, the heatwaves can last longer than a month [11] and may impact the whole country [9]. For Portugal, the analysis of temperature extremes has been performed by either an analysis of one model and one scenario’s results [10] for the mid-twenty-first century or with a multi-mode ensemble from the ENSEMBLES A1B SRES scenario [40] or using the RCP scenarios [9].
In a warming scenario, it is almost certain that increases in the frequency and magnitude of daily warm temperature extremes and decreases in the frequency and magnitude of daily minimum temperature extremes might occur this century [34]. So, it is expectable that extreme weather phenomena related to air temperatures, such as heatwaves and cold spells, are likely to change towards higher maximum temperatures and more hot days [5,6,11,38,41].
The changes in temperature are projected to impact regions with high exposure to people or crops. An early study from [42] found that 20% of the global land area, centered in low-latitude regions, is projected to experience highly unusual monthly temperatures during Northern Hemisphere summers at 1.5 °C global warming, with this number nearly doubling at 2 °C global warming. Although large increases in hot extremes occur in many densely inhabited regions, the studies of [36] and [37] concluded, based on a modeling study, that 13.8% of the world population would be exposed to severe heatwaves at least once every 5 years under 1.5 °C global warming, with a threefold increase (36.9%) under 2 °C warming. Recently, [43] showed that is virtually certain that the heatwave of 2018 is human-induced and that the exposure area projected to experience hot extremes in the northern hemisphere increases by 16% per additional +1 °C.

3.2. Observed Changes and Future Projections in Precipitation

Long-term trends in extreme precipitation have been observed and reported in early studies [44]. However, the results are heterogeneous, with a well-defined increase in mean precipitation at high latitudes of the northern hemisphere and more ambiguous results for other regions [4,16]. Globally, the frequency, intensity and/or amount of heavy precipitation is likely to increase, but not for all regions.
The authors of [1] showed that, at the present-day warming of 0.85 °C, about 18% of the moderate daily precipitation extremes over land are attributable to the observed temperature increase since pre-industrial times, which in turn primarily results from human influence.
Precipitation is a variable with little spatial coherence and high interannual variability. A number of studies have already documented changes in the amount and regimes of precipitation. In general, these studies show a decrease in total precipitation (e.g., [44,45,46,47,48]) and increases either in the contribution of the extreme precipitation and the frequency and intensity of precipitation extremes [49,50] in winter precipitation for specific regions (e.g., [51]).
Changes in the climatology of precipitation and its variability and extreme events have been investigated extensively for Portugal and Spain, using observational and modeling evidence, considering the historical period corresponding to the last 50 years of the 20th century and for the first decades of the 21st century (e.g., [18,44,52,53,54,55,56,57,58,59,60]).
Overall, the key findings are that trends over the 20th century showed a weak signal in annual and heavy precipitation but pointed to a reduction in precipitation amount, while extreme heavy precipitation events, in terms of both magnitude and frequency, have become more pronounced in autumn [55]. The spring and March precipitation, in particular, have features highlighted by the research. The most spatially coherent signals were observed over Spain catchments, where a negative trend was observed in March and June (e.g., [44] also documented a reduction in March precipitation for the period between 1960–2000 over mainland Portugal but note that this tendency was only found for this period and month.
According to [4], projections for precipitation are more uncertain and dependent on the region, yet results suggest an increase in the mean precipitation for the northern hemisphere at high latitudes and a decrease for the Mediterranean region.
Heavy precipitation is projected to increase [1,30,33] globally. This behavior is also found for the Mediterranean region for all seasons [27,32], except for summer at 2 °C global warming, when compared to the 1971–2000 period. This response is independent of the warming scenario and appears to be specific to heavy precipitation with small differences among the 1.5 °C–2 °C projections [36]. This change is not significant, and it is contrary to the projected changes for light and total precipitation [36] and to observational and modeling evidences that show a significant drying trend [36,61,62].
For the IP, recent studies from [27,32] and [31] showed that a 1.5 °C–2 °C global warming is associated with a reduction in mean summer precipitation but less evident for the 1.5 °C scenario. Past studies using an ensemble of models under the A1B warming scenario, showed a reduction in the mean seasonal precipitation, which is expected to decrease substantially in all seasons, excluding winter [57].
Droughts are an important extreme event in the IP; a region with high vulnerability to droughts and dryness due to climate variability, amplified by increasing temperature and precipitation deficiency. There is observational and modeling evidence of a drying trend [36]. Recent studies projected regional changes in drought and dryness under increased temperatures [14,24,36,59,61,62] when compared with the pre-industrial period and between the 1.5 °C and 2 °C global warming.
Over the IP, the findings related to drought projections indicated a strong trend towards dryness and reduced water availability [63], and that this tendency will continue to worsen under the 2 °C global warming [36]. Although these model projections are consistent, the IPCC AR5 report [64] has shown medium confidence in associating the increasing drought projections with human emissions, i.e., the climate change signal is weak, even though other studies point differently [61,62]. This is in part due to several considerations: to start with, some authors have highlighted uncertainties in the projections of dryness due to variations on the definition of drought and dryness indices [36]; second, the concentration of CO2 effects on plant water-use efficiency [65], and, finally, ref. [63] assessed that soil moisture drying was concordant with projected changes in the Hadley circulation and increased surface temperature. These results are in line with the study from [59], which considered projections for the RCP8.5 scenario over 2071–2100, concluding that the frequencies of the three driest weather types are projected to increase to the detriment of the rainiest types.
Large-scale circulation and its synoptic patterns may put forward another explanation, i.e., the drying pattern may be a natural climatic variability of the region exacerbated by global warming. Other studies, just for mainland Portugal, showed that there are atmospheric conditions clearly unfavorable to the establishment of rain-generating mechanisms, leading to a lack of precipitation and to extremely dry conditions with high potential for trigger drought episodes (e.g., [7,59]). Analyzing the climate change signal for drought and drying, and following [36], a word of caution must be mentioned here: uncertainty is expected with a small signal-to-noise ratio even for high emission scenarios, such as the RCP8.5 scenario. In addition, ref. [24] suggested that uncertainty from climate model choice accounts for about half of the total uncertainty in most regions, in particular, for mid-latitude regions [36].

3.3. Simulations of Temperature and Precipitation Using Climate Models

Modeling studies of temperature and precipitation are fundamental to investigations of the nature and future changes of these variables. For example, knowing how the intensity and frequency of some extreme events will change is the foundation of any adaptation and mitigation study. For that, we need numerical simulations of temperature and precipitation, as well as a good quality dataset to assess the model performance. This section highlights the recent state of knowledge about the most relevant aspects of numerical simulations of temperature and precipitation.
The numerical models used in weather and climate applications are Global Circulation Models (GCM) or Regional Circulation Models (RCM). They are both based on the fundamental laws of physics, fluid motion, and chemistry. However, they differ in some aspects. Weather models provide forecasts and depend strongly on the weather of today (initial value problem). On the other hand, climate models give projections based on assumptions about future emissions (scenarios) and aim for long-term statistics or probabilities. Climate models depend strongly on the parameters of the model and the GCMs driving fields (boundary value problem).
Apart from these differences, GCMs are powerful tools to assess global-scale climate variability and change. However, GCMs have coarse spatial resolution and, therefore, regional to local scale climate features may be misrepresented [66]. Hence, they are not appropriate for investigating regional events, such as hydrological changes, extreme temperature events, and individual thunderstorms or mesoscale precipitation phenomena (e.g., [50]).
To minimize this drawback, RCMs are applied over a limited spatial domain at a higher resolution than GCMs and subject to initial and boundary conditions taken from reanalysis or a GCM. The availability and reliability of RCM simulations for Europe have increased rapidly in recent years. A succession of projects involving different GCMs and RCMs have been developed, e.g., PRUDENCE [67], ENSEMBLES [67], and EURO-CORDEX [68], that dynamically downscale information from GCMs to RCMs. There are other methods to downscale information among models with different resolutions. Statistical downscaling uses observed relationships between large-scale climate variables, such as temperature or precipitation, to adjust the output of global climate models to match historical observations at a specific location better. An early review of those empirical–statistical downscaling methods is given in [69], but there is more recent literature about the subject by, e.g., [70].
RCMs are able to capture physically consistent regional and local circulations describing well the climatologies (e.g., [71,72]), in particular, the European climate, including its variability in space and time and the recent trends in the frequency and intensity of extreme events [43]. Although powerful tools, models still present some discrepancies with observations. Recent comprehensive evaluations of RCMs over Europe have been undertaken (e.g., [48,51,73,74,75,76,77]), which came to enlarge the already extensive research on the subject, e.g., [12,17,66,78,79,80,81,82,83,84,85], just to mention a few.
The evaluation results vary according to the region but all point for distinct features between northern Europe and the Mediterranean-southern Europe region. Early EURO-CORDEX hindcast simulations, forced by ERA-Interim, display cold, wet biases in most seasons over large areas of Europe, but some models exhibit warm, dry biases over southern and south-western Europe [68], leading to systematic errors in related climate indices [66,86]. Recent climate studies showed that RCMs driven by reanalysis show positive and negative bias for minimum wintertime temperature. By contrast, all reanalysis-driven RCMs have negative maximum temperature biases [87]. This cold bias was also found by [12] in their analysis of six hindcast WRF simulations for the EURO-CORDEX domain with different physical configurations. For Portugal, in a recent multi-model experience using the EURO-CORDEX models, the RCMs were able to reproduce the overall representation of temperature and the major topography/coast-related temperature gradients [9]. Similar experiences using the WRF model were done to evaluate the sensitivity of temperature to PBL schemes using the entire year of 2001 [88]. The results showed that the model mean bias significantly depends on the season, being warm in winter and cold in summer. The winter warm bias is related to misrepresented cold extremes, while a systematic cold bias dominates the whole temperature range in summer. Other studies for other regions (North America) using the WRF model driven by a GCM model showed more promising results: small bias when compared with observations and with the GCM model and a more detailed representation of precipitation [89].
A novel analysis from [76], using a multi-model ensemble of 196 RCMs and their GCMs, studied the changes and their dependence on several uncertainty sources: sample RCMs/GCMs, future scenarios, and internal variability and spatial resolution. The authors’ first conclusions suggested that the potential GCM–RCM combinations have been explored very unevenly and that there are several conflicting responses between the RCM and its driving GCM and among different RCMs. They also concluded that the lead source of uncertainty found was the driving GCM in the grand ensemble opposing the emissions scenarios and increased resolution. The weight of GCMs as the primordial source of uncertainty has been analyzed in another study by [75].
Nevertheless, RCMs are still a trustworthy tool to provide more detailed representations of past and present-day climate and climate variability, in particular, for events located in the tails of the distribution. For example, a RCM study from [71] covering a number of geographical domains (Africa, Central America, South America, India, and the Mediterranean) concluded that the added value of using RCMs is the improved representation of high precipitation events. The ability of models to represent extreme events has been the object of investigation for some time. The authors of [90] carried out simulations within the EURO-CORDEX project, using a multi-model ensemble with different resolutions (12 km and 50 km), driven by ERA-Interim for a 20-year period. The authors showed that simulation of extreme temperature is sensitive to the convection and microphysics schemes. Most models exhibit an overestimation of summertime temperature extremes in Mediterranean regions and an underestimation over Scandinavia.
The added value of high-resolution simulations of extremes has been discussed by some authors (e.g., [78,81,91]) who state that runs with a 0.11 resolution described in a better way mean and extreme precipitation for almost all regions and seasons, while [90] showed that simulated heatwave events were found to be too persistent, but a finer resolution reduced this discrepancy, although it is not clear how beneficial increasing the resolution is. The authors of [66,92] showed that, for extremes, the dry spells were better represented when the simulated precipitation frequency was adjusted to the observed one (i.e., after bias correction) but associated high-resolution simulations better reproduced the climate change indices’ spatial patterns, especially in terms of spatial correlation. On the other hand, according to [91], high-resolution RCMs generally improved daily precipitation extremes relative to GCMs, which comes in line with a recent study for Norway that showed high spatial resolution improved the simulations of extreme precipitation, especially in areas of orographic enhancement [73].

3.4. Uncertainties in Regional Climate Modelling

Model skill is the ability of a model to simulate the observed climate correctly. Interest in better representing present-day climate variability and change at local scales has driven the development of regional climate models (RCMs), which are currently able to perform dynamical downscaling of Global Circulation Models (GCMs) at very high horizontal resolutions (∼11 km). However, due to imperfections in physical processes formulation and parameterizations, coupled with the unpredictability of future natural variability, RCMs are still affected by systematic errors that can result in unrealistic results.

Multi-Model or Multi-Physics Ensembles

The motivation for using ensembles is to characterize and quantify various uncertainties present in the RCMs. RCMs uncertainties are dealt with by using different ensemble simulation strategies, meaning that there are a variety of possible combinations to produce model simulations. Different models may apply different physical parameterizations and also different initial conditions leading to a multi-model ensemble. Using the same model with different physical parameterizations, a multi-physical ensemble is obtained. These are just a few combinations, but others are possible. Those differences lead to a range of simulated climate responses to external forcing. To this context, one ensemble of models currently widely used is the RCMs within the EURO-CORDEX initiative. Within the EURO-CORDEX, a coordinated multi-model, multi-method, multi-scenario, multi-initial-condition ensemble of downscaled experiments for Europe on ∼11 km horizontal resolution has been established [81].
The authors of [12] used a multi-physics ensemble of the WRF model in the context of the Euro-CORDEX project and showed that the WRF ensemble indicates systematic temperature and precipitation biases. Studies for the IP, using a multi-physics ensemble of present-day climate simulations, highlight the great dependence of the spread on the synoptic conditions driving the regional model [17].
In multi-physics ensembles models, the same model is used for climate simulations using a variety of microphysics schemes or a combination of schemes. Generally, the resulting dispersion amplifies under the future scenario leading to a large drift accompanying the mean change signals, as large as the magnitude of the mean projected changes and analogous to the spread obtained in multi-model ensembles. Moreover, the sign of the projected change varies depending on the choice of the model physics in many cases [17].
In this context, but for present-day simulations, [93] compared eight parameterization combinations with observations over southern Spain. They found precipitation to be more sensitive to the choice of parametrizations (especially to the cumulus and the planetary boundary layer—PBL) than temperature. Although they provided some recommendations, they concluded that there is no combination clearly better than the others. This conclusion is also shared by [17,82], who analyze the sensitivity of the WRF model to physical parameterizations schemes. They concluded that the differences between the microphysics schemes WSM-3, WSM-5, and WSM-6 are generally small, but there is a large sensitivity to summer convection and found a significant cold bias over snow-covered regions.
In multi-model ensembles, different models are used for climate simulations. The perspective here is to consider that an ensemble of models allows a better characterization of the uncertainties in the representation of the climate system than a single model. Recently, [94] adopted some strategies for addressing model dependence in an ensemble and, at the same time, presented a discussion about the characteristics of multi-model uncertainty.
Although each RCM model is thought to be different from the others, their numerical schemes, parameterizations, and physical processes are similar because the developers share literature. Moreover, different RCMs can be driven by the same GCM. A recent study from [76] addressed the uncertainties in a very large multi-model ensemble comprising RCM and GCM near-future projections of temperature and precipitation. In essence, the models agreed with the projections, but larger differences were found for summer, and there was a tendency for RCMs to project smaller changes than the GCMs.

4. Summary

The present study was a comprehensive review of the latest decade of published research about extreme weather and climate extremes over the Iberian Peninsula (IP) and explored the methods and climate change indicators used in observational and modeling studies for the historical climate and 21st-century projections. Considering the amount of information presented in the Results section, Table 1 and Table 2 highlighted the major findings.
Globally, major significant findings point to a global past warming trend that most likely will continue the ongoing years. This consistent warming trend can also be found in hot extremes. Warming greater than the global average (between 0.8 °C and 1.2 °C) has already been experienced in some regions and seasons. The IP is also experiencing warming consistent with other regions and magnitude. Information on present warming relative to different past periods allows us to say that in the last decades, the IP warmed by 0.75 °C to 1.5 °C relative to pre-industrial (1850–1900) and at a faster pace than the global mean surface temperature of 0.87 °C [4].
Projections point for increases of 1.5 °C for mid-century [4], with regions such as the IP expecting greater changes of up to 8 °C [6], with severe hot days and a notable reduction in cold extremes [5,6,20,36,37,38,52].
Recent studies have highlighted that projections for extreme temperature events increase at a faster rate than mean temperature [35], while others referred to a linear relationship between the intensity of the mean response of extreme temperature and changes in the global mean temperature [33,37].
The effects of global warming on precipitation are not so clear as for temperature and depend on the region. Globally, heavy precipitation is increasing, confirming theory and early model results [1]. In some regions, heavy precipitation events are related to large-scale dynamic features, such as frontal systems, which implies dynamic changes, such as the expansion of the Hadley cells or shifts in the storm tracks, may substantially alter the heavy precipitation response [1].
Overall, a reduction in mean precipitation for southern Europe [4] is expected, although [1] showed changes in the frequency of extreme events (increases) along with increases in the contribution of extreme precipitation to total precipitation. The number of days with very heavy precipitation over Europe has increased [1]. This behavior is also shown for the Mediterranean region [26,27], independently of the warming scenario, and appears to be specific to heavy precipitation [36]. One major concern for the IP is related to droughts. The region is highly vulnerable to dryness, and in recent years, there has been evidence of a drying trend [36].

5. Conclusions

The present review analyzed the 21st-century projections of temperature and precipitation extreme events in the Iberian Peninsula relative to the present-day climatic conditions as shown in articles of observational and numerical modeling studies.
Some studies showed evidence of increasing historical trends in temperature and increases in extreme precipitation. If current trends continue globally, the most extreme precipitation events will virtually double in frequency for each degree of additional global warming.
Most studies suggested important changes for the 21st-century climate due to global warming. The climate change signal for temperature is more robust than that of precipitation. The effects of this change are unfolding and are locally dependent, which highlights the importance of climate adaptation in sensitive areas as health, water, and agriculture, especially in regions vulnerable to such changes.

Author Contributions

This research and the resulting paper was a collaborative effort between the authors. The literature search, screening, peer review management, and related revisions were conducted by all authors. All authors have read and agreed to the published version of the manuscript.

Funding

This research was funded by the Portuguese Foundation for Science and Technology (FCT), grant number SFRH/BD/65982/2009. The authors acknowledge the support given by the Portuguese Foundation for Science and Technology (FCT) within the project PTDC/ASPSIL/28771/2017, research grant Refª BI/UI88/1760/2019 and the FCT/MCTES for the financial support to CESAM (UIDP/50017/2020+UIDB/50017/2020), through national funds. David Carvalho acknowledges the Portuguese Foundation for Science and Technology (FCT) for his researcher contract (CEECIND/01726/2017).

Data Availability Statement

This study did not report any data.

Conflicts of Interest

The authors declare no conflict of interest. The funders had no role in the design of the study; in the collection, analyses, or interpretation of data; in the writing of the manuscript, or in the decision to publish the results.

References

  1. Fischer, E.; Knutti, R. Observed heavy precipitation increase confirms theory and early models. Nat. Clim. Chang. 2016, 6, 986–991. [Google Scholar] [CrossRef]
  2. Myhre, G.; Alterskjær, K.; Stjern, C.W.; Hodnebrog, Ø.; Marelle, L.; Samset, B.H.; Sillmann, J.; Schaller, N.; Fischer, E.; Schulz, M.; et al. Frequency of extreme precipitation increases extensively with event rareness under global warming. Sci. Rep. 2019, 9, 16063. [Google Scholar] [CrossRef] [Green Version]
  3. Di Sante, F.; Coppola, E.; Giorgi, F. Projections of river floods in Europe using EURO-CORDEX, CMIP5 and CMIP6 simulations. Int. J. Clim. 2021, 41, 3203–3221. [Google Scholar] [CrossRef]
  4. IPCC. Summary for Policymakers, World Meteorological Organization, Geneva, Switzerland. 2018. Available online: https://www.ipcc.ch/sr15/chapter/spm/ (accessed on 27 July 2021).
  5. Pereira, S.C.; Marta-Almeida, M.; Carvalho, A.C.; Rocha, A. Heat wave and cold spell changes in Iberia for a future climate scenario. Int. J. Clim. 2017, 37, 5192–5205. [Google Scholar] [CrossRef] [Green Version]
  6. Carvalho, D.; Pereira, S.C.; Rocha, A. Future surface temperature changes for the Iberian Peninsula according to EURO-CORDEX climate projections. Clim. Dyn. 2021, 56, 123–138. [Google Scholar] [CrossRef]
  7. Quesada, B.; Vautard, R.; Yiou, P.; Hirschi, M.; Seneviratne, S. Asymmetric European summer heat predictability from wet and dry southern winters and springs. Nat. Clim. Chang. 2012, 2, 736–741. [Google Scholar] [CrossRef]
  8. Donat, M.G.; Alexander, L.V.; Herold, N.; Dittus, A. Temperature and precipitation extremes in century-long gridded observations, reanalyses, and atmospheric model simulations. J. Geophys. Res. Atmos. 2016, 121, 11174–11189. [Google Scholar] [CrossRef] [Green Version]
  9. Cardoso, R.M.; Soares, P.M.M.; Lima, D.C.A.; Miranda, P.M.A. Mean and extreme temperatures in a warming climate: EURO CORDEX and WRF regional climate high-resolution projections for Portugal. Clim. Dyn. 2019, 52, 129–157. [Google Scholar] [CrossRef]
  10. Ramos, A.M.; Trigo, R.; Santo, F.E. Evolution of extreme temperatures over Portugal: Recent changes and future scenarios. Clim. Res. 2011, 48, 177–192. [Google Scholar] [CrossRef]
  11. Viceto, C.; Pereira, S.C.; Rocha, A. Climate Change Projections of Extreme Temperatures for the Iberian Peninsula. Atmosphere 2019, 10, 229. [Google Scholar] [CrossRef] [Green Version]
  12. Katragkou, E.; García-Díez, M.; Vautard, R.; Sobolowski, S.; Zanis, P.; Alexandri, G.; Cardoso, R.M.; Colette, A.; Fernandez, J.; Gobiet, A.; et al. Regional climate hindcast simulations within EURO-CORDEX: Evaluation of a WRF multi-physics ensemble. Geosci. Model. Dev. 2015, 8, 603–618. [Google Scholar] [CrossRef] [Green Version]
  13. Hutton, B.; Salanti, G.; Caldwell, D.M.; Chaimani, A.; Schmid, C.H.; Cameron, C.; Ioannidis, J.P.A.; Straus, S.; Thorlund, K.; Jansen, J.P.; et al. The PRISMA Extension Statement for Reporting of Systematic Reviews Incorporating Network Meta-analyses of Health Care Interventions: Checklist and Explanations. Ann. Intern. Med. 2015, 162, 777–784. [Google Scholar] [CrossRef] [Green Version]
  14. Seneviratne, S.I.; Wartenburger, R.; Guillod, B.P.; Hirsch, A.; Vogel, M.M.; Brovkin, V.; Van Vuuren, D.P.; Schaller, N.; Boysen, L.; Calvin, K.V.; et al. Climate extremes, land-climate feedbacks and land-use forcing at 1.5 °C. Philos. Trans. R. Soc. A Math. Phys. Eng. Sci. 2018, 376, 20160450. [Google Scholar] [CrossRef]
  15. Understanding the Impacts of 1.5 °C Global Warming above Pre-Industrial Levels and Related Global Emission Pathways in the Context of Strengthening the Response to the Threat of Climate Change, Sustainable Development and Efforts to Eradicate Poverty. Available online: https://www.ipcc.ch/sr15/ (accessed on 27 July 2021).
  16. Donat, M.G.; Alexander, L.; Yang, H.; Durre, I.; Vose, R.; Dunn, R.; Willett, K.M.; Aguilar, E.; Brunet, M.; Caesar, J.; et al. Updated analyses of temperature and precipitation extreme indices since the beginning of the twentieth century: The HadEX2 dataset. J. Geophys. Res. Atmos. 2013, 118, 2098–2118. [Google Scholar] [CrossRef]
  17. Jerez, S.; Montavez, J.P.; Jimenez-Guerrero, P.; Gomez-Navarro, J.J.; Lorente-Plazas, R.; Zorita, E. A multi-physics ensemble of present-day climate regional simulations over the Iberian Peninsula. Clim. Dyn. 2013, 40, 3023–3046. [Google Scholar] [CrossRef]
  18. Carvalho, M.; Melo-Gonçalves, P.; Teixeira, J.C.; Rocha, A. Regionalization of Europe based on a K-Means Cluster Analysis of the climate change of temperatures and precipitation. Phys. Chem. Earth Parts A/B/C 2016, 94, 22–28. [Google Scholar] [CrossRef] [Green Version]
  19. Fonseca, D.; Carvalho, M.; Marta-Almeida, M.; Melo-Gonçalves, P.; Rocha, A. Recent trends of extreme temperature indices for the Iberian Peninsula. Phys. Chem. Earth Parts A/B/C 2016, 94, 66–76. [Google Scholar] [CrossRef]
  20. Hidalgo, J.C.G.; Peña-Angulo, D.; Brunetti, M.; Cortesi, N. Recent trend in temperature evolution in Spanish mainland (1951–2010): From warming to hiatus. Int. J. Clim. 2015, 36, 2405–2416. [Google Scholar] [CrossRef]
  21. Seneviratne, S.; Donat, M.; Pitman, A.J.; Knutti, R.; Wilby, R.L. Allowable CO2 emissions based on regional and impact-related climate targets. Nat. Cell Biol. 2016, 529, 477–483. [Google Scholar] [CrossRef] [Green Version]
  22. Schleussner, C.-F.; Pfleiderer, P.; Fischer, E. In the observational record half a degree matters. Nat. Clim. Chang. 2017, 7, 460–462. [Google Scholar] [CrossRef]
  23. Schleussner, C.-F.; Lissner, T.K.; Fischer, E.M.; Wohland, J.; Perrette, M.; Golly, A.; Rogelj, J.; Childers, K.; Schewe, J.; Frieler, K.; et al. Differential climate impacts for policy-relevant limits to global warming: The case of 1.5 °C and 2 °C. Earth Syst. Dyn. 2016, 7, 327–351. [Google Scholar] [CrossRef] [Green Version]
  24. Wartenburger, R.; Hirschi, M.; Donat, M.G.; Greve, P.; Pitman, A.J.; Seneviratne, S.I. Changes in regional climate extremes as a function of global mean temperature: An interactive plotting framework. Geosci. Model. Dev. 2017, 10, 3609–3634. [Google Scholar] [CrossRef] [Green Version]
  25. Mitchell, D.; AchutaRao, K.; Allen, M.; Bethke, I.; Beyerle, U.; Ciavarella, A.; Forster, P.M.; Fuglestvedt, J.; Gillett, N.; Haustein, K.; et al. Half a degree additional warming, prognosis and projected impacts (HAPPI): Background and experimental design. Geosci. Model. Dev. 2017, 10, 571–583. [Google Scholar] [CrossRef] [Green Version]
  26. Mitchell, D.; Allen, M.R.; Hall, J.W.; Muller, B.; Rajamani, L.; Le Quéré, C. The myriad challenges of the Paris Agreement. Philos. Trans. R. Soc. A Math. Phys. Eng. Sci. 2018, 376, 20180066. [Google Scholar] [CrossRef] [PubMed]
  27. Vautard, R.; Gobiet, A.; Sobolowski, S.; Kjellström, E.; Stegehuis, A.I.; Watkiss, P.; Mendlik, T.; Landgren, O.; Nikulin, G.; Teichmann, C.; et al. The European climate under a 2 °C global warming. Environ. Res. Lett. 2014, 9, 034006. [Google Scholar] [CrossRef]
  28. Maule, C.F.; Mendlik, T.; Christensen, O.B. The effect of the pathway to a two degrees warmer world on the regional temperature change of Europe. Clim. Serv. 2017, 7, 3–11. [Google Scholar] [CrossRef] [Green Version]
  29. Wehner, M.; Stone, D.; Mitchell, D.; Shiogama, H.; Fischer, E.; Graff, L.S.; Kharin, V.V.; Lierhammer, L.; Sanderson, B.; Krishnan, H. Changes in extremely hot days under stabilized 1.5 and 2.0 °C global warming scenarios as simulated by the HAPPI multi-model ensemble. Earth Syst. Dyn. 2018, 9, 299–311. [Google Scholar] [CrossRef] [Green Version]
  30. Kharin, V.V.; Flato, G.M.; Zhang, X.; Gillett, N.P.; Zwiers, F.; Anderson, K.J. Risks from Climate Extremes Change Differently from 1.5 °C to 2.0 °C Depending on Rarity. Earth’s Futur. 2018, 6, 704–715. [Google Scholar] [CrossRef]
  31. Kjellström, E.; Nikulin, G.; Strandberg, G.; Christensen, O.B.; Jacob, D.; Keuler, K.; Lenderink, G.; van Meijgaard, E.; Schär, C.; Somot, S.; et al. European climate change at global mean temperature increases of 1.5 and 2 °C above pre-industrial conditions as simulated by the EURO-CORDEX regional climate models. Earth Syst. Dyn. 2018, 9, 459–478. [Google Scholar] [CrossRef] [Green Version]
  32. Jacob, D.; Kotova, L.; Teichmann, C.; Sobolowski, S.P.; Vautard, R.; Donnelly, C.; Koutroulis, A.; Grillakis, M.; Tsanis, I.K.; Damm, A.; et al. Climate Impacts in Europe Under +1.5 °C Global Warming. Earth’s Futur. 2018, 6, 264–285. [Google Scholar] [CrossRef] [Green Version]
  33. Betts, R.A.; Alfieri, L.; Bradshaw, C.; Caesar, J.; Feyen, L.; Friedlingstein, P.; Gohar, L.; Koutroulis, A.; Lewis, K.; Morfopoulos, C.; et al. Changes in climate extremes, fresh water availability and vulnerability to food insecurity projected at 1.5 °C and 2 °C global warming with a higher-resolution global climate model. Philos. Trans. R. Soc. A Math. Phys. Eng. Sci. 2018, 376, 20160452. [Google Scholar] [CrossRef]
  34. Cutter, S.; Osman-Elasha, B.; Campbell, J.; Cheong, S.-M.; McCormick, S.; Pulwarty, R.; Supratid, S.; Ziervogel, G. Managing the Risks from Climate Extremes at the at the Local Level. In Managing the Risks of Extreme Events and Disasters to Advance Climate Change Adaptation; Field, C.B., Barros, V., Thomas, F., Qin, D., Eds.; Cambridge University Press: Cambridge, UK; New York, NY, USA, 2012; pp. 291–338. [Google Scholar]
  35. Aerenson, T.; Tebaldi, C.; Sanderson, B.; Lamarque, J.-F. Changes in a suite of indicators of extreme temperature and precipitation under 1.5 and 2 degrees warming. Environ. Res. Lett. 2018, 13, 035009. [Google Scholar] [CrossRef]
  36. Hoegh-Guldberg, O.; Jacob, D.; Taylor, M.; Bindi, M.; Brown, S.; Camilloni, I.; Diedhiou, A.; Djalante, R.; Ebi, K.L.; Engelbrecht, F.; et al. Impacts of 1.5 °C Global Warming on Natural and Human Systems. Available online: https://www.ipcc.ch/sr15/chapter/chapter-3/ (accessed on 27 July 2021).
  37. Dosio, A.; Mentaschi, L.; Fischer, E.M.; Wyser, K. Extreme heat waves under 1.5 °C and 2 °C global warming. Environ. Res. Lett. 2018, 13, 054006. [Google Scholar] [CrossRef] [Green Version]
  38. Rocha, A.; Pereira, S.C.; Viceto, C.; Silva, R.; Neto, J.; Marta-Almeida, M. A Consistent Methodology to Evaluate Temperature and Heat Wave Future Projections for Cities: A Case Study for Lisbon. Appl. Sci. 2020, 10, 1149. [Google Scholar] [CrossRef] [Green Version]
  39. Santo, F.E.; De Lima, M.I.P.; Ramos, A.M.; Trigo, R.M.; Coelho, M.F.E.S. Trends in seasonal surface air temperature in mainland Portugal, since 1941. Int. J. Clim. 2014, 34, 1814–1837. [Google Scholar] [CrossRef]
  40. Andrade, C.; Fraga, H.; dos Santos, J.C.A. Climate change multi-model projections for temperature extremes in Portugal. Atmospheric Sci. Lett. 2013, 15, 149–156. [Google Scholar] [CrossRef]
  41. WMO. Weather extremes in a Changing Climate: Hindsight on Foresight. World Meteorol. Organ. 2011, 1075, 17. [Google Scholar]
  42. Coumou, D.; Robinson, A. Historic and future increase in the global land area affected by monthly heat extremes. Environ. Res. Lett. 2013, 8, 034018. [Google Scholar] [CrossRef]
  43. Vogel, M.M.; Zscheischler, J.; Wartenburger, R.; Dee, D.; Seneviratne, S.I. Concurrent 2018 Hot Extremes Across Northern Hemisphere Due to Human-Induced Climate Change. Earth’s Futur. 2019, 7, 692–703. [Google Scholar] [CrossRef] [PubMed]
  44. Gonzalez-Hidalgo, J.; Brunetti, M.; De Luis, M. Precipitation trends in Spanish hydrological divisions, 1946–2005. Clim. Res. 2010, 43, 215–228. [Google Scholar] [CrossRef]
  45. Karagiannidis, A.F.; Karacostas, T.; Maheras, P.; Makrogiannis, T. Climatological aspects of extreme precipitation in Europe, related to mid-latitude cyclonic systems. Theor. Appl. Clim. 2011, 107, 165–174. [Google Scholar] [CrossRef]
  46. Costa, A.C.; dos Santos, J.C.A.; Pinto, J.G. Climate change scenarios for precipitation extremes in Portugal. Theor. Appl. Clim. 2011, 108, 217–234. [Google Scholar] [CrossRef]
  47. De Lima, M.I.P.; Santo, F.E.; Ramos, A.; Trigo, R. Trends and correlations in annual extreme precipitation indices for mainland Portugal, 1941–2007. Theor. Appl. Clim. 2015, 119, 55–75. [Google Scholar] [CrossRef]
  48. Rajczak, J.; Schär, C. Projections of Future Precipitation Extremes over Europe: A Multimodel Assessment of Climate Simulations. J. Geophys. Res. Atmos. 2017, 122, 10773–10800. [Google Scholar] [CrossRef]
  49. IPCC. Global Warming of 1.5 °C. An IPCC Special Report on the Impacts of Global Warming of 1.5 °C above Pre-Industrial Levels and Related Global Greenhouse Gas Emission Pathways, in the Context of Strengthening the Global Response to the Threat of Climate Change, Sustainable Development, and Efforts to Eradicate Poverty; Masson-Delmotte, V., Zhai, H.-O., Pörtner, D., Roberts, J., Skea, P.R., Shukla, A., Pirani, W., Moufouma-Okia, C., Péan, R., Pidcock, S., et al., Eds.; World Meteorological Organization: Geneva, Switzerland, 2018. [Google Scholar]
  50. O’Gorman, P.A. Precipitation Extremes under Climate Change. Curr. Clim. Chang. Rep. 2015, 1, 49–59. [Google Scholar] [CrossRef] [PubMed] [Green Version]
  51. Soares, P.M.M.; Cardoso, R.M.; Lima, D.C.A.; Miranda, P. Future precipitation in Portugal: High-resolution projections using WRF model and EURO-CORDEX multi-model ensembles. Clim. Dyn. 2017, 49, 2503–2530. [Google Scholar] [CrossRef]
  52. Cardoso, R.M.; Soares, P.M.M.; Miranda, P.M.A.; Belo-Pereira, M. WRF high resolution simulation of Iberian mean and extreme precipitation climate. Int. J. Climatol. 2012, 33, 2591–2608. [Google Scholar] [CrossRef]
  53. Vicente-Serrano, S.M.; Trigo, R.; Lopez-Moreno, I.; Liberato, M.; Lorenzo-Lacruz, J.; Beguería, S.; Morán-Tejeda, E.; Kenawy, A. Extreme winter precipitation in the Iberian Peninsula in 2010: Anomalies, driving mechanisms and future projections. Clim. Res. 2011, 46, 51–65. [Google Scholar] [CrossRef] [Green Version]
  54. Andrade, C.; dos Santos, J.C.A.; Pinto, J.G.; Corte-Real, J.A.M. Large-scale atmospheric dynamics of the wet winter 2009–2010 and its impact on hydrology in Portugal. Clim. Res. 2011, 46, 29–41. [Google Scholar] [CrossRef] [Green Version]
  55. de Lima, M.I.P.; Santo, F.E.; Ramos, A.M.; de Lima, J.L. Recent changes in daily precipitation and surface air temperature extremes in mainland Portugal, in the period 1941–2007. Atmospheric Res. 2013, 127, 195–209. [Google Scholar] [CrossRef]
  56. Ramos, A.; Trigo, R.; Liberato, M.L.R.; Tomé, R. Daily Precipitation Extreme Events in the Iberian Peninsula and Its Association with Atmospheric Rivers. J. Hydrometeorol. 2015, 16, 579–597. [Google Scholar] [CrossRef]
  57. Soares, P.M.M.; Cardoso, R.M.; Ferreira, J.J.; Miranda, P. Climate change and the Portuguese precipitation: ENSEMBLES regional climate models results. Clim. Dyn. 2015, 45, 1771–1787. [Google Scholar] [CrossRef]
  58. Merino, A.; Fernández-Vaquero, M.; Lopez, L.; González, L.H.; Hermida, L.; Sanchez, J.L.; García-Ortega, E.; Gascón, E. Large-scale patterns of daily precipitation extremes on the Iberian Peninsula. Int. J. Clim. 2015, 36, 3873–3891. [Google Scholar] [CrossRef]
  59. Santos, J.A.; Belo-Pereira, M.; Fraga, H.; Pinto, J.G. Understanding climate change projections for precipitation over western Europe with a weather typing approach. J. Geophys. Res. Atmos. 2016, 121, 1170–1189. [Google Scholar] [CrossRef] [Green Version]
  60. Sousa, P.M.; Trigo, R.; Barriopedro, D.; Soares, P.; Ramos, A.; Liberato, M.L.R. Responses of European precipitation distributions and regimes to different blocking locations. Clim. Dyn. 2016, 48, 1141–1160. [Google Scholar] [CrossRef] [Green Version]
  61. Gudmundsson, L.; Seneviratne, S. Anthropogenic climate change affects meteorological drought risk in Europe. Environ. Res. Lett. 2016, 11, 044005. [Google Scholar] [CrossRef]
  62. Gudmundsson, L.; Seneviratne, S.I.; Zhang, X. Anthropogenic climate change detected in European renewable freshwater resources. Nat. Clim. Chang. 2017, 7, 813–816. [Google Scholar] [CrossRef]
  63. Stocker, T.F.; Qin, D.; Plattner, G.-K.; Alexander, L.V.; Allen, S.K.; Bindoff, N.L.; Bréon, F.-M.; Church, J.A.; Cubasch, U.; Emori, S.; et al. (Eds.) 2013 Technical Summary. In Climate Change 2013—The Physical Science Basis; Contribution of Working Group I to the Fifth Assessment Report of the Intergovernmental Panel on Climate Change; Cambridge University Press: Cambridge, UK; New York, NY, USA, 2013; pp. 33–118. [Google Scholar]
  64. IPCC. Climate Change 2013—The Physical Science Basis; Contribution of Working Group I to the Fifth Assessment Report of the Intergovernmental Panel on Climate Change; Cambridge University Press: Cambridge, Uk; New York, NY, USA, 2014; 1535p. [Google Scholar]
  65. Roderick, M.L.; Greve, P.; Farquhar, G.D. On the assessment of aridity with changes in atmospheric CO2. Water Resour. Res. 2015, 51, 5450–5463. [Google Scholar] [CrossRef] [Green Version]
  66. Casanueva, A.; Herrera, S.; Fernández, J.; Gutiérrez, J. Towards a fair comparison of statistical and dynamical downscaling in the framework of the EURO-CORDEX initiative. Clim. Chang. 2016, 137, 411–426. [Google Scholar] [CrossRef] [Green Version]
  67. Pereira, S.C.; Marta-Almeida, M.; Carvalho, A.C.; Rocha, A. Extreme precipitation events under climate change in the Iberian Peninsula. Int. J. Climatol. 2020, 40, 1255–1278. [Google Scholar] [CrossRef]
  68. Kotlarski, S.; Keuler, K.; Christensen, O.B.; Colette, A.; Déqué, M.; Gobiet, A.; Goergen, K.; Jacob, D.; Lüthi, D.; van Meijgaard, E.; et al. Regional climate modeling on European scales: A joint standard evaluation of the EURO-CORDEX RCM ensemble. Geosci. Model. Dev. 2014, 7, 1297–1333. [Google Scholar] [CrossRef] [Green Version]
  69. Themeßl, M.J.; Gobiet, A.; Heinrich, G. Empirical-statistical downscaling and error correction of regional climate models and its impact on the climate change signal. Clim. Chang. 2011, 112, 449–468. [Google Scholar] [CrossRef]
  70. Hertig, E.; Maraun, D.; Bartholy, J.; Pongracz, R.; Vrac, M.; Mares, I.; Gutiérrez, J.M.; Wibig, J.; Casanueva, A.; Soares, P.M.M. Comparison of statistical downscaling methods with respect to extreme events over Europe: Validation results from the perfect predictor experiment of the COST Action VALUE. Int. J. Clim. 2018, 39, 3846–3867. [Google Scholar] [CrossRef]
  71. Giorgi, F.; Gutowski, W.J. Regional Dynamical Downscaling and the CORDEX Initiative. Annu. Rev. Environ. Resour. 2015, 40, 467–490. [Google Scholar] [CrossRef]
  72. Giorgi, F.; Gao, X.-J. Regional earth system modeling: Review and future directions. Atmospheric Ocean. Sci. Lett. 2018, 11, 189–197. [Google Scholar] [CrossRef] [Green Version]
  73. Dyrrdal, A.V.; Stordal, F.; Lussana, C. Evaluation of summer precipitation from EURO-CORDEX fine-scale RCM simulations over Norway. Int. J. Clim. 2018, 38, 1661–1677. [Google Scholar] [CrossRef]
  74. Fantini, A.; Raffaele, F.; Torma, C.; Bacer, S.; Coppola, E.; Giorgi, F.; Ahrens, B.; Dubois, C.; Sanchez, E.; Verdecchia, M. Assessment of multiple daily precipitation statistics in ERA-Interim driven Med-CORDEX and EURO-CORDEX experiments against high resolution observations. Clim. Dyn. 2018, 51, 877–900. [Google Scholar] [CrossRef]
  75. Berg, P.; Christensen, O.B.; Klehmet, K.; Lenderink, G.; Olsson, J.; Teichmann, C.; Yang, W. Summertime precipitation extremes in a EURO-CORDEX 0.11° ensemble at an hourly resolution. Nat. Hazards Earth Syst. Sci. 2019, 19, 957–971. [Google Scholar] [CrossRef] [Green Version]
  76. Fernández, J.; Frías, M.D.; Cabos, W.D.; Cofiño, A.S.; Domínguez, M.; Fita, L.; Gaertner, M.A.; García-Díez, M.; Gutiérrez, J.M.; Jiménez-Guerrero, P.; et al. Consistency of climate change projections from multiple global and regional model intercomparison projects. Clim. Dyn. 2019, 52, 1139–1156. [Google Scholar] [CrossRef]
  77. Gutiérrez, J.M.; Maraun, D.; Widmann, M.; Huth, R.; Hertig, E.; Benestad, R.; Roessler, O.; Wibig, J.; Wilcke, R.; Kotlarski, S.; et al. An intercomparison of a large ensemble of statistical downscaling methods over Europe: Results from the VALUE perfect predictor cross-validation experiment. Int. J. Clim. 2019, 39, 3750–3785. [Google Scholar] [CrossRef]
  78. Prein, A.F.; Gobiet, A.; Truhetz, H.; Keuler, K.; Goergen, K.; Teichmann, C.; Maule, C.F.; Van Meijgaard, E.; Déqué, M.; Nikulin, G.; et al. Precipitation in the EURO-CORDEX 0.11° and 0.44° simulations: High resolution, high benefits? Clim. Dyn. 2016, 46, 383–412. [Google Scholar] [CrossRef] [Green Version]
  79. Cattiaux, J.; Douville, H.; Peings, Y. European temperatures in CMIP5: Origins of present-day biases and future uncertainties. Clim. Dyn. 2013, 41, 2889–2907. [Google Scholar] [CrossRef]
  80. Kawazoe, S.; Gutowski, W.J. Regional, Very Heavy Daily Precipitation in NARCCAP Simulations. J. Hydrometeorol. 2013, 14, 1212–1227. [Google Scholar] [CrossRef] [Green Version]
  81. Jacob, D.; Petersen, J.; Eggert, B.; Alias, A.; Christensen, O.B.; Bouwer, L.M.; Braun, A.; Colette, A.; Déqué, M.; Georgievski, G.; et al. EURO-CORDEX: New high-resolution climate change projections for European impact research. Reg. Environ. Chang. 2014, 14, 563–578. [Google Scholar] [CrossRef]
  82. García-Díez, M.; Fernández, J.; Vautard, R. An RCM multi-physics ensemble over Europe: Multi-variable evaluation to avoid error compensation. Clim. Dyn. 2015, 45, 3141–3156. [Google Scholar] [CrossRef] [Green Version]
  83. Casanueva, A.; Kotlarski, S.; Herrera, S.; Fernández, J.; Gutiérrez, J.M.; Boberg, F.; Colette, A.; Christensen, O.B.; Goergen, K.; Jacob, D.; et al. Daily precipitation statistics in a EURO-CORDEX RCM ensemble: Added value of raw and bias-corrected high-resolution simulations. Clim. Dyn. 2016, 47, 719–737. [Google Scholar] [CrossRef] [Green Version]
  84. Dosio, A. Projections of climate change indices of temperature and precipitation from an ensemble of bias-adjusted high-resolution EURO-CORDEX regional climate models. J. Geophys. Res. Atmos. 2016, 121, 5488–5511. [Google Scholar] [CrossRef]
  85. LeDuc, M.; Matthews, M.L.H.D.; De Elía, M.L.R. Regional estimates of the transient climate response to cumulative CO2 emissions. Nat. Clim. Chang. 2016, 6, 474–478. [Google Scholar] [CrossRef]
  86. Casanueva, A.; Bedia, J.; Herrera, S.; Fernández, J.; Gutierrez, J.M. Direct and component-wise bias correction of multi-variate climate indices: The percentile adjustment function diagnostic tool. Clim. Chang. 2018, 147, 411–425. [Google Scholar] [CrossRef] [Green Version]
  87. Lhotka, O.; Kyselý, J.; Farda, A. Climate change scenarios of heat waves in Central Europe and their uncertainties. Theor. Appl. Clim. 2018, 131, 1043–1054. [Google Scholar] [CrossRef]
  88. García-Díez, M.; Fernández, J.; Fita, L.; Yagüe, C. Seasonal dependence of WRF model biases and sensitivity to PBL schemes over Europe. Q. J. R. Meteorol. Soc. 2012, 139, 501–514. [Google Scholar] [CrossRef] [Green Version]
  89. Wang, J.; Kotamarthi, V.R. High-resolution dynamically downscaled projections of precipitation in the mid and late 21st century over North America. Earth’s Futur. 2015, 3, 268–288. [Google Scholar] [CrossRef]
  90. Vautard, R.; Gobiet, A.; Jacob, D.; Belda, M.; Colette, A.; Déqué, M.; Fernández, J.; García-Díez, M.; Goergen, K.; Güttler, I.; et al. The simulation of European heat waves from an ensemble of regional climate models within the EURO-CORDEX project. Clim. Dyn. 2013, 41, 2555–2575. [Google Scholar] [CrossRef]
  91. Maraun, D.; Huth, R.; Gutiérrez, J.M.; Martín, D.S.; Dubrovsky, M.; Fischer, A.; Hertig, E.; Soares, P.M.M.; Bartholy, J.; Pongrácz, R.; et al. The VALUE perfect predictor experiment: Evaluation of temporal variability. Int. J. Clim. 2017, 39, 3786–3818. [Google Scholar] [CrossRef]
  92. Casanueva, A.; Rodríguez-Puebla, C.; Frías, M.D.; González-Reviriego, N. Variability of extreme precipitation over Europe and its relationships with teleconnection patterns. Hydrol. Earth Syst. Sci. 2014, 18, 709–725. [Google Scholar] [CrossRef] [Green Version]
  93. Argüeso, D.; Hidalgo-Muñoz, J.M.; Gámiz-Fortis, S.R.; Esteban-Parra, M.J.; Dudhia, J.; Castro-Díez, Y. Evaluation of WRF Parameterizations for Climate Studies over Southern Spain Using a Multistep Regionalization. J. Clim. 2011, 24, 5633–5651. [Google Scholar] [CrossRef]
  94. Abramowitz, G.; Herger, N.; Gutmann, E.; Hammerling, D.; Knutti, R.; Leduc, M.; Lorenz, R.; Pincus, R.; Schmidt, G.A. ESD Reviews: Model dependence in multi-model climate ensembles: Weighting, sub-selection and out-of-sample testing. Earth Syst. Dyn. 2019, 10, 91–105. [Google Scholar] [CrossRef] [Green Version]
Figure 1. PRISMA 2020 flow diagram used in this review.
Climate 09 00139 g001
Table 1. Summary of changes observed in the Iberian Peninsula over the last 50 years for temperature and precipitation.
Type of Change Already ObservedDocumented FindingsReferences
How much has mean surface air
temperature in the IP increase in the last decades?
0.75 °C to 1.5 °C relative to 1850–1900 [5,6,7,9,10,19,20,28,29,37,38,40,42,43,79,89]
Extremes based on daily temperatureHigher maximum temperatures+0.15 °C to +0.54 °C per decade
Hot to extreme hot days+0.8 days to +6 days per decade
Tropical nights+0.24 days +6 days per decade
Warm spells+0.25 days to +10 days per decade
Higher minimum temperatures+0.27 °C to + 0.49 °C per decada
Cold to extreme cold days–0.91 days to –1 day per decade
Cold nights–1 day per decade
Extremes based on daily precipitationMean total precipitation–44.60 mm per decade [1,2,44,45,46,47,48,50,51,53,54,55,56,57,58,59,60,62,65,67,73,74,75,78,85]
Precipiation intensity–0.19 mm per decade
Above 99th percentile+1.17 mm per decade
Fraction above 95th percentile+0.30% per decade
RX1D+0.25 mm per decade
RX5D–2.29 mm per decade
Very to extremely wet days–0.43 to –1.69 days per decade
Table 2. Summary of projected changes for temperature and precipitation over the Iberian Peninsula for the 21st century.
What Are the Climate Models Projections for the IP for the 21st Century?FindingsReferences
Based on daily temperatureMean surface air temperatureMean and maximum temperatures are projected to increase around 2 °C (4 °C) for the 2046–2065 (2081–2100) period in all seasons and scenarios. Summer temperature can increase up to 6 °C to 8 °C by the end of the century.[4,5,6,7,8,9,10,12,14,15,16,18,19,20,21,22,23,24,26,27,28,29,31,32,33,35,37,38,39,40,41,42,43,49,63,64,71,76,79,84,85,89,92]
Minimum temperatureIncreased minimum temperatures in all seasons and scenario with mean annual temperature increases up to 2 °C.
Maximum temperature Annual maxima temperature increases up to 4 °C annual maxima reaching more than 8 °C at a 2 °C warming level
Hot to extreme extreme hot days (tmax >40 °C)10 to 60 days/year for mid century
Summer days (Tmax> 25 °C)Up to 30 to 60 more days for mid-century and the end of century, respectively
Tropical nightsOn average 60 to 100 more tropical nights days by the end of the century
Heatwaves Yearly average number of heat waves increases by seven to ninefold by 2100. Up to a mean of six more heatwaves (three to 10-fold more heatwaves). In cities the number of heatwaves per year will increase on average from 10 (present) to 38 in mid-century and 63 by the end of the century.
Heatwaves frequency100 events in the 2071–2100 period (more than 3 per year) will cover the whole country
Heatwaves duration Most frequent length rises from 5 to 22 days throughout the 21st century with 5% of the longest events will last for more than one month. Mean duration up to 10 days (triple in relation to historical period). Possibility of mega/extreme heatwaves (temperatures exceeding the 40 °C most days and some consecutive days of more than 45 °C, in particular for the central-south IP.
Heatwaves intensityHalf of the heat waves will be stronger than the extreme heat wave of 2003; increases up to 4 °C (triple duration in historical period) reaching the end-of-century with mean intensity up to 6 °C (5 times than the hsitorical period)
Cold days/cold spells/frost days/cold nightsAlmost disappears due to strong reductions in minimum temperature
Frost daysReduction up to 80 days during the 21st century
Exposure area to hot extremesProjected to increase
Based on daily precipitationAnnual precipitationReductions up to10% to 15% for mid-century and 20% to 40% at a 2 °C warming level more prominent in southern areas [1,2,4,8,14,15,18,21,22,23,24,25,27,31,32,33,34,35,41,44,45,46,47,48,49,50,51,52,53,54,55,56,57,58,59,60,63,64,70,76,84,85,92]
Summer precipitationReduction of up to 80% by end-of-century with median decreases of 11% for Spain
Winter precipitationIncrease
Spring precipitationDecrease
Autumn precipitationSlighty decreases
Precipitation events (duration)/wet daysRedution across all seasons
Extreme precipitation indicators *Daily precipitationreduction
RX5daySlight increase up to 5% towards 0% at a 2 °C warming level
Winter heavy precipitationIncreases shown in different MIPs projects change from 7% to 14%. Signal also present for spring but less evident in summer and autumn
Extreme precipitationIncrease
Exposure area to mean and heavy precipitationAnnual reductions up to 20% to 40%
Wet daysDecreases up to 60% fewer days
Dry daysDryness trend more pronunced by the end of century
* Climate change indices are recommended by the Expert Team on Climate Change Detection and Indices (ETCCDI) (see http://cccma.seos.uvic.ca/ETCCDI/list_27_indices.html, accessed on 3 September 2021) defined by the World Climate Research Program’s Expert Team on Climate Change Detection and Indices.
Publisher’s Note: MDPI stays neutral with regard to jurisdictional claims in published maps and institutional affiliations.

