Article

Climate Services for Renewable Energy in the Nordic Electricity Market

by
Kirsten Halsnæs
1,
Lisa Bay
1,
Per Skougaard Kaspersen
1,2,
Martin Drews
1 and
Morten Andreas Dahl Larsen
1,*
1
Department of Management Engineering, Technical University of Denmark, Produktionstorvet, Building 424, 2800 Kgs Lyngby, Denmark
2
LNH Water, Kathøjvej 3, 3080 Tikøb, Denmark
*
Author to whom correspondence should be addressed.
Climate 2021, 9(3), 46; https://doi.org/10.3390/cli9030046
Submission received: 15 February 2021 / Revised: 4 March 2021 / Accepted: 9 March 2021 / Published: 12 March 2021

Abstract

:
To limit global warming to less than 2 °C requires a low-carbon transition with very large shares of renewables. Options such as wind, solar and hydro are influenced by both short and longer-term weather and climate variability. While still subject to natural and anthropogenic climate forcing and fluctuating energy prices, water reservoirs can dually operate as storage and production facilities and serve to balance the more volatile production capacity from solar and wind. This paper assesses the dynamics and demands of the hydro-dominated Nordic electricity system and market and identifies untapped potential for climate services based on a combination of literature-based research, documented stakeholder needs and data sources on historical and future conditions. A critical need for both improving the appropriateness and reliability of existing climate services and for developing new tailored solutions for a broader group of stakeholders from the renewable energy sector in the Nordics is observed. The quantification of uncertainties related to short-term weather forecasts and longer-term climate predictions is also found to be important for minimizing the financial risk in relation to systems management and to overall investments in renewable energy.

1. Introduction

The large-scale penetration of renewable energy sources for electricity production is essential if the goals of the Paris Agreement [1] are to be met. As a result, the Nordic countries, including Denmark, Norway, Sweden, and Finland, have very ambitious goals for accelerating the renewable energy share in power production [2,3,4,5]. Accommodating high shares of renewables, including wind and solar, whose potentials can fluctuate greatly over very short time scales, incurs special challenges. Hence, the systemic efficiency of wind and solar power critically depends on the installed capacity for electricity storage, interactions between the different sources of power on the electricity market, and the flexibility of other sources, including both conventional energy conversion technologies and other renewables. To ensure the robust and sustainable supply and demand while facing an uncertain climatic future, requires efficient cross-technology integration and, in turn, close collaboration and communication between end-users and climate service/data providers [6,7,8] in order to mediate imminent challenges such as data accessibility, formats and commercial interests [9]. Non-technological barriers include political, social and legal challenges [10,11], but are all outside the scope of this study. That said, the Nordic electricity market offers special opportunities for the efficient and joint management of wind, solar, and hydropower, since hydropower reservoirs, which dominate the Nordic electricity market [12], can act as electricity storage, and at the same time constitute a very flexible production facility. Hydropower is, however, also dependent on weather conditions, though its dependence on weather is seasonal and with temporal dependencies up to six months or more.
Climate change is expected to have significant and increasing impacts on renewable energy sources in the Nordics with respect to both their production potential and the climate-related risks [13,14,15]. Renewable power production is likely to be affected concurrently by gradual changes in climate over decadal to multi-decadal time scales, by increasing variability as well as by extreme weather events, which might be intensified and more frequent with time [16], and which could for example affect hydropower supply safety [13]. Not all impacts of climate change are likely to be negative. For example, for hydropower, a generally increasing trend is expected in the Nordics [13].
Accurate and tailored information on the impacts of climate change on short and long-term variability and the scale of the renewable energy potentials is essential and will be the key to the effective transformation of the energy sector under a changing climate [17]. Thus, dedicated “climate services” (CSs) are likely to become increasingly important for future investments in the electricity sector and for markets and will play an important role in promoting the efficient large-scale penetration of renewables [6]. To exemplify, when trading spot and futures contracts on electricity markets, traders rely on estimates of future supply and demand. In view of the dominant role of hydropower in the Nordic market, climate information in terms of short-term predictions of the potential for hydropower production within a 3-to-6-month timeframe (e.g., seasonal forecasts of inflow) could inform sellers and buyers of electricity produced by wind and solar about future market price fluctuations. This would help them to cope with critical uncertainties that, in the context of the liberalization of the electricity markets, has introduced new financial risks, compounding especially the risk for sellers of electricity futures contracts [18].
Currently, the use of CSs (i.e., the delivery of tailored climate information and decision-support based on historical data or model simulations ranging from two weeks into the future, to decadal predictions to multi-decadal climate projections) is very limited and constitutes a great and untapped potential in terms of added efficiency, trade and surplus production regulation and management [8,19,20]. Existing services are mainly focused on the Nordic hydropower sector, whereas the wind power sector relies on weather forecasting. In this light, the objective of the following study is to investigate the present and future potential for climate services in the Nordics, including:
(I).
The framing of the current use of CS information on the Nordic power market, including the way that historical data and forecasts are used by different stakeholders, including hydropower producers, transmission system operators and traders;
(II).
Identify short- and long-term potential benefits of CSs and assess these in relation to the CS needs of key stakeholders and decision makers in the renewable energy sector and in electricity markets, and with the information provided today by key CS providers, and finally;
(III).
Discuss how CSs could support the introduction of higher shares of wind, solar and hydropower in the Nordic electricity market and in turn facilitate that electricity markets are managed more efficiently in the short term, and that future investments, in particular into renewables, take climate change and variability into consideration. The integration of large shares of fluctuating renewable energy in the power systems could be supported by increasing the scale of electricity trade, and this again implies that CSs have the potential to become a key information source for power utilities and market traders. The assessment of the increased share of renewables employs recent and relevant per-country projections from the European Commission of future energy system compositions.
In the following, we consider three types of end users: energy producers, transmission system operators and traders, with an emphasis on the latter two. Thus, the role of CS, as operational tools for, e.g., renewable energy production has already received a lot of attention. To investigate the potential of CSs for renewable energy, we reflect upon the dynamics of the Nordic electricity market, including the observed (monthly) variations in supply and demand, the long-term variations in hydropower, which dominates the Nordic market, and the role of the highly volatile wind and solar energy resources, which depend on integrated management with hydropower. We find a great potential but also a critical need for improving the reliability of existing CSs as well as for developing new tailored solutions for a broader group of stakeholders in the renewable energy sector, in particular those related closely to the consumption of electricity. In this context, the quantification of the uncertainty related to long-term climate projections and shorter-term climate predictions is found to be one of the most important aspects for minimizing financial risk and to be crucial for a successful development of CSs related to renewable energy systems.

2. Materials and Methods

Two general approaches to assess the role of CSs in the advancement of renewable energy shares in the Nordic energy market were employed in the present study, as outlined below.

2.1. Stakeholder Mapping and User Needs

To assess the current use and future needs for CSs in the renewable energy sector, we reviewed a number of existing studies. Common for these studies is a more general approach to CS demands and projections, therefore we condensed and analyzed the information relevant to the present scope. Existing material includes, among others, results from the EUPORIAS (European Provision of Regional Impacts Assessments on Seasonal and Decadal Timescales) project [21,22], the MARCO project [7,23] and a separate survey on CS demands from, e.g., the energy sector. The combined results of this literature-based research is presented in Section 3.1, Section 3.2 and Section 3.3 (see below).

2.2. Current and Projected Trends in Renewables and the Potential of Climate Services

Alongside the abovementioned literature studies, CS opportunities were assessed based on a set of empirical and quantitative studies, which highlight the current and projected development trends in the renewable energy sector and the dynamics of the Nordic electricity market, including its dependency on information for select climate parameters. For this aim, we consider:
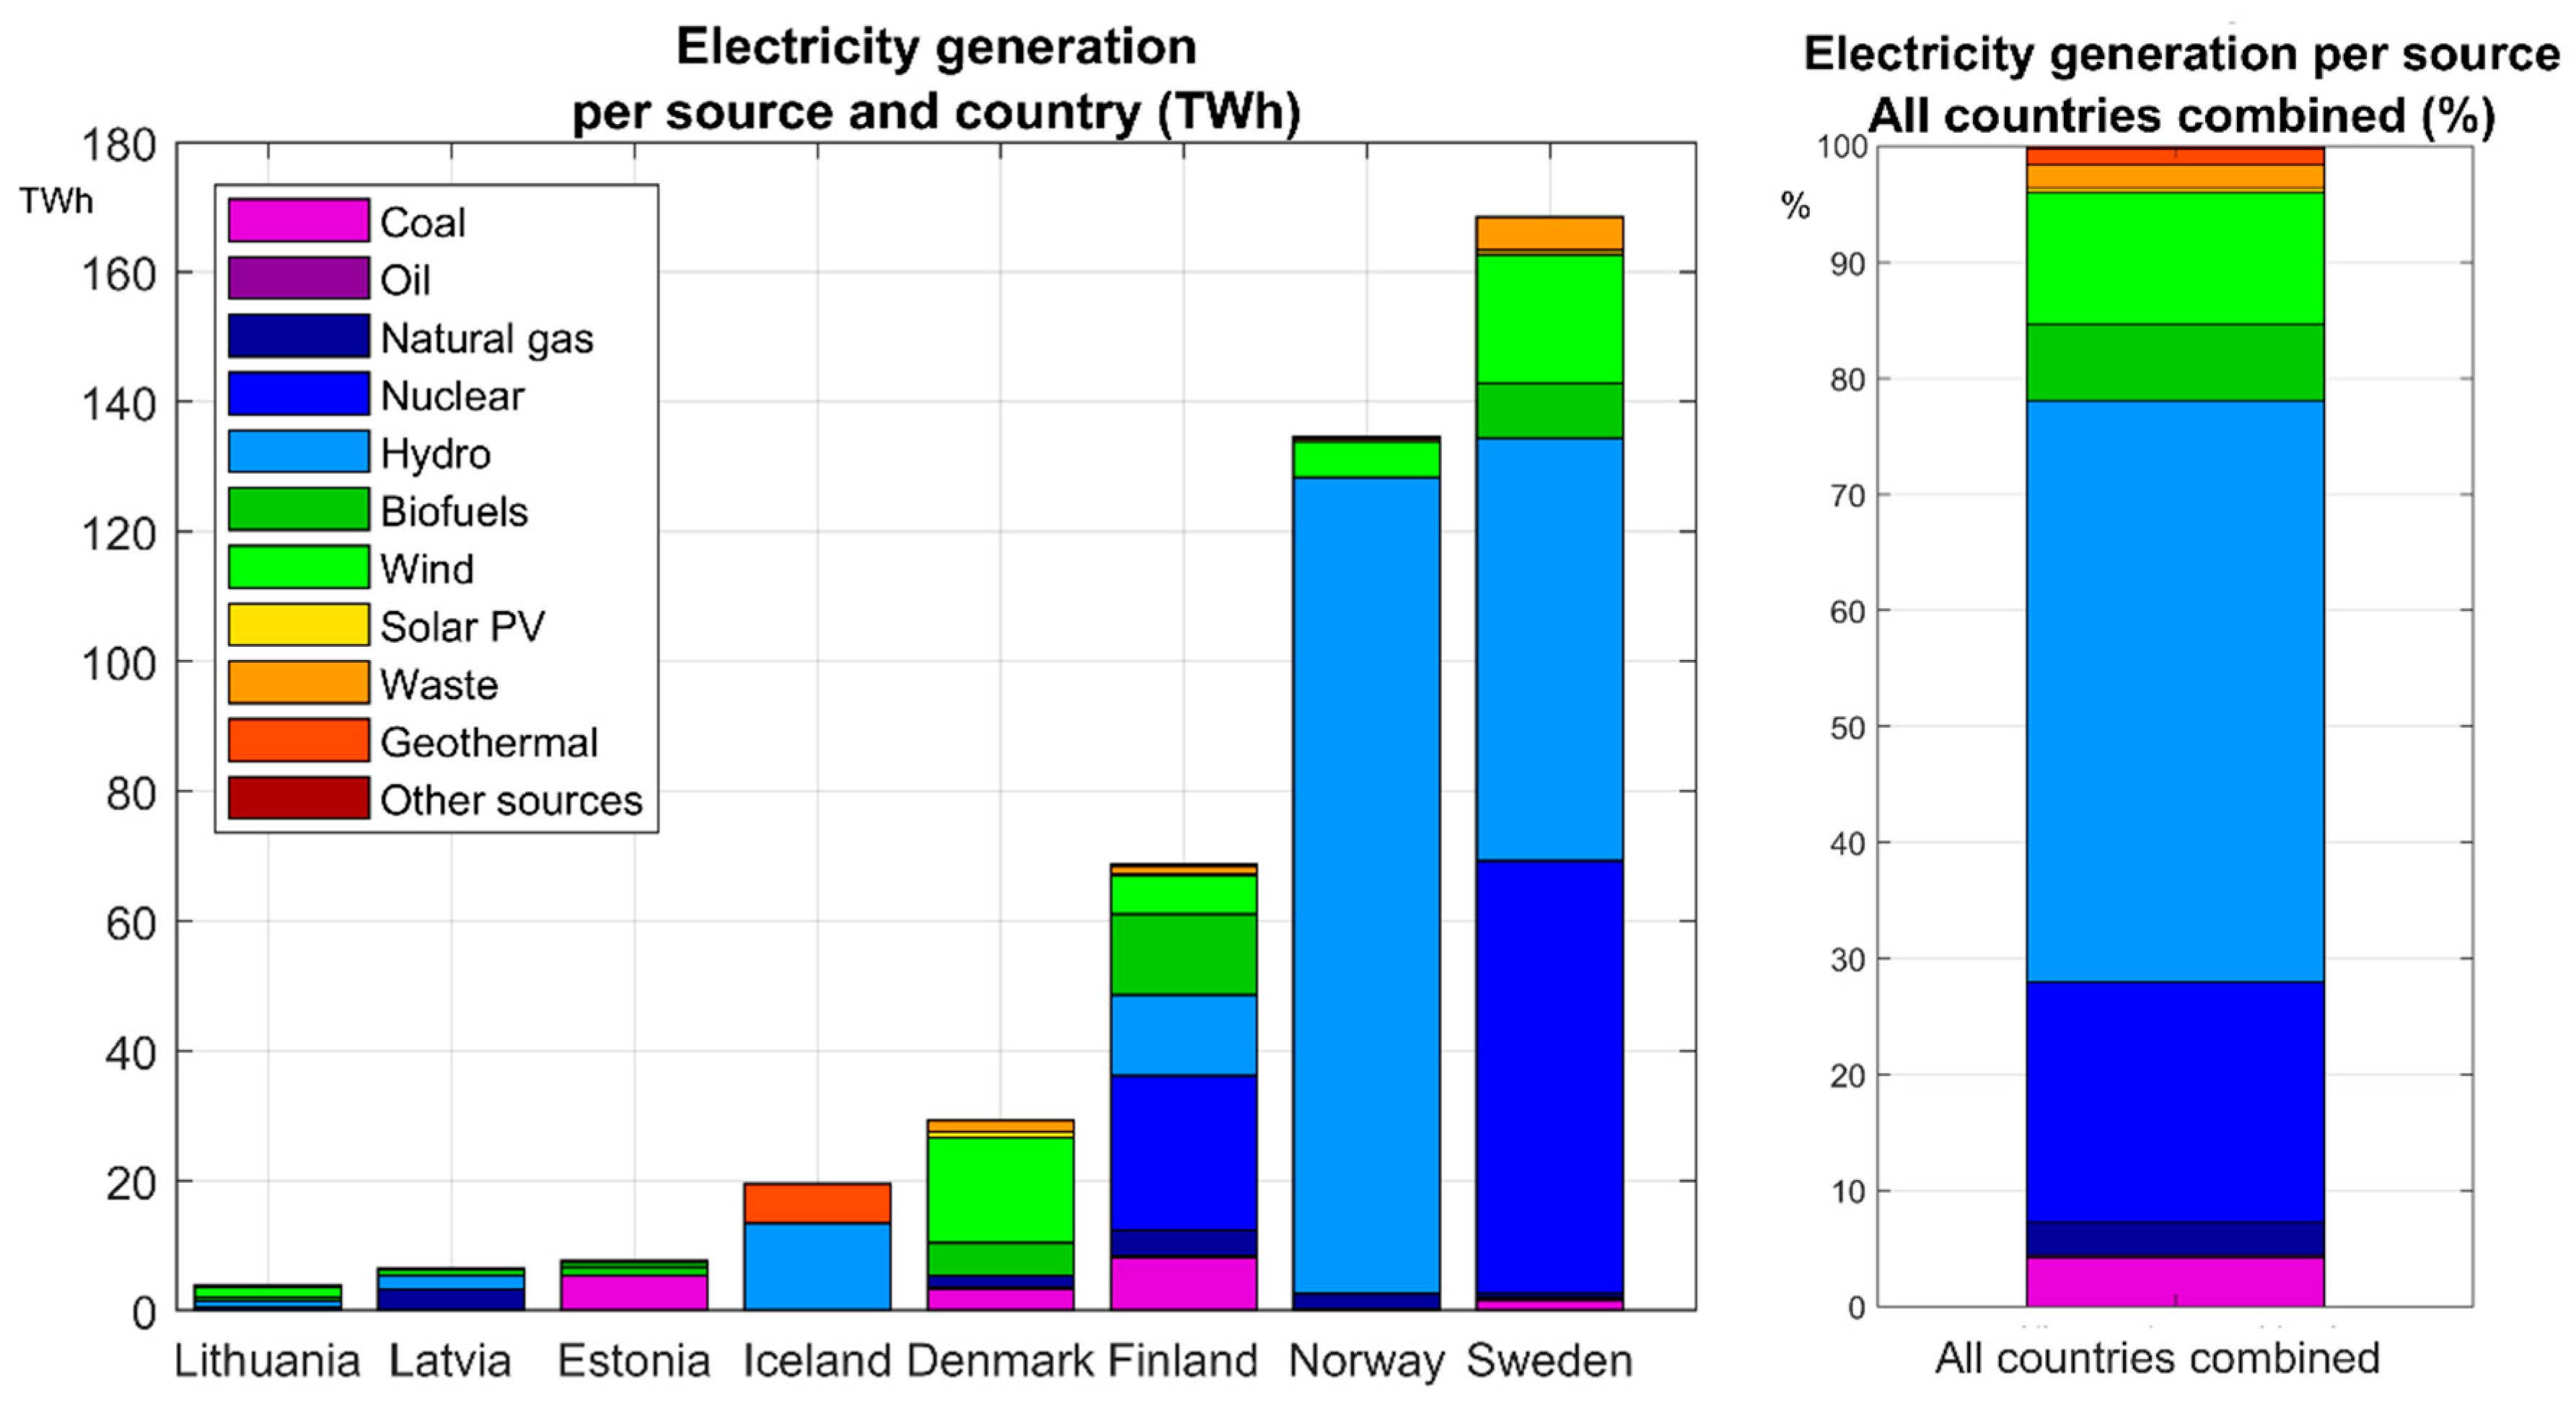
  • The current (2019) composition of energy sources in the Nordic and Baltic countries [24].
  • Historical market data (2013–2020) on the hydro reservoir and wind energy production capacities on the Nordic power market. These data were extracted from [25,26].
  • Historical weekly electricity generation and consumption levels, also per energy source, and its relation to pricing levels (2013–2020). These data were also extracted from [26,27].
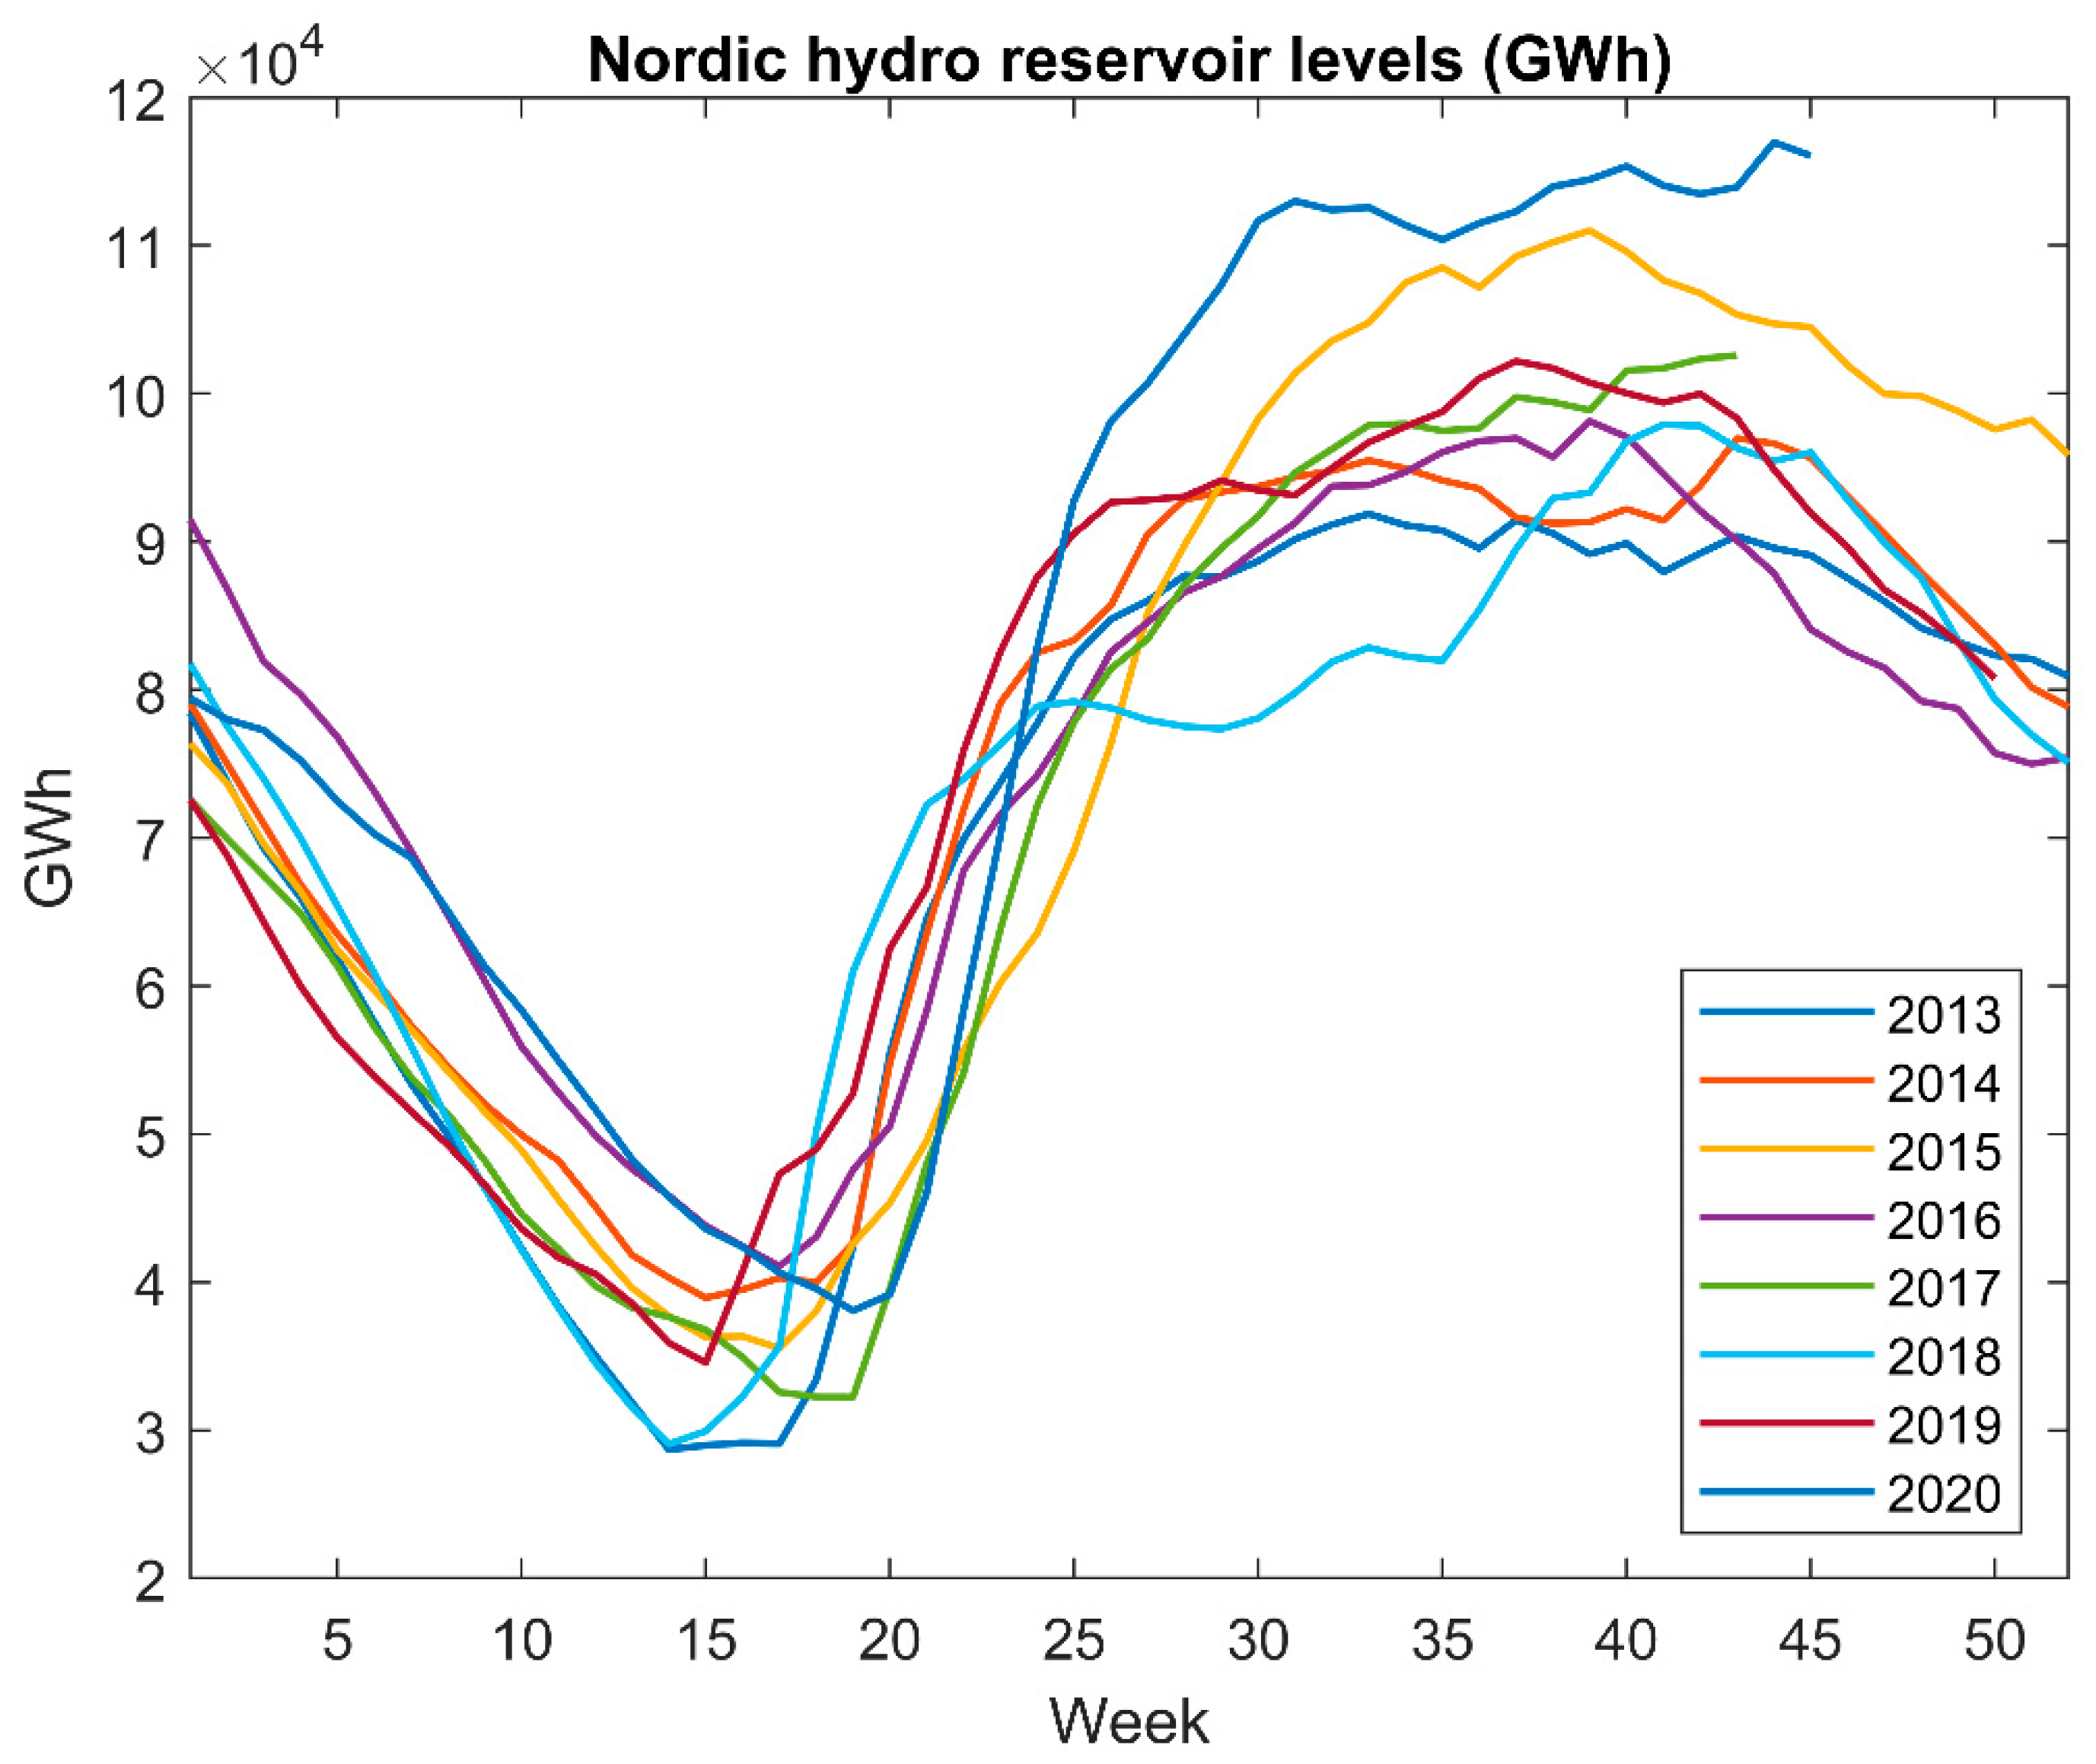
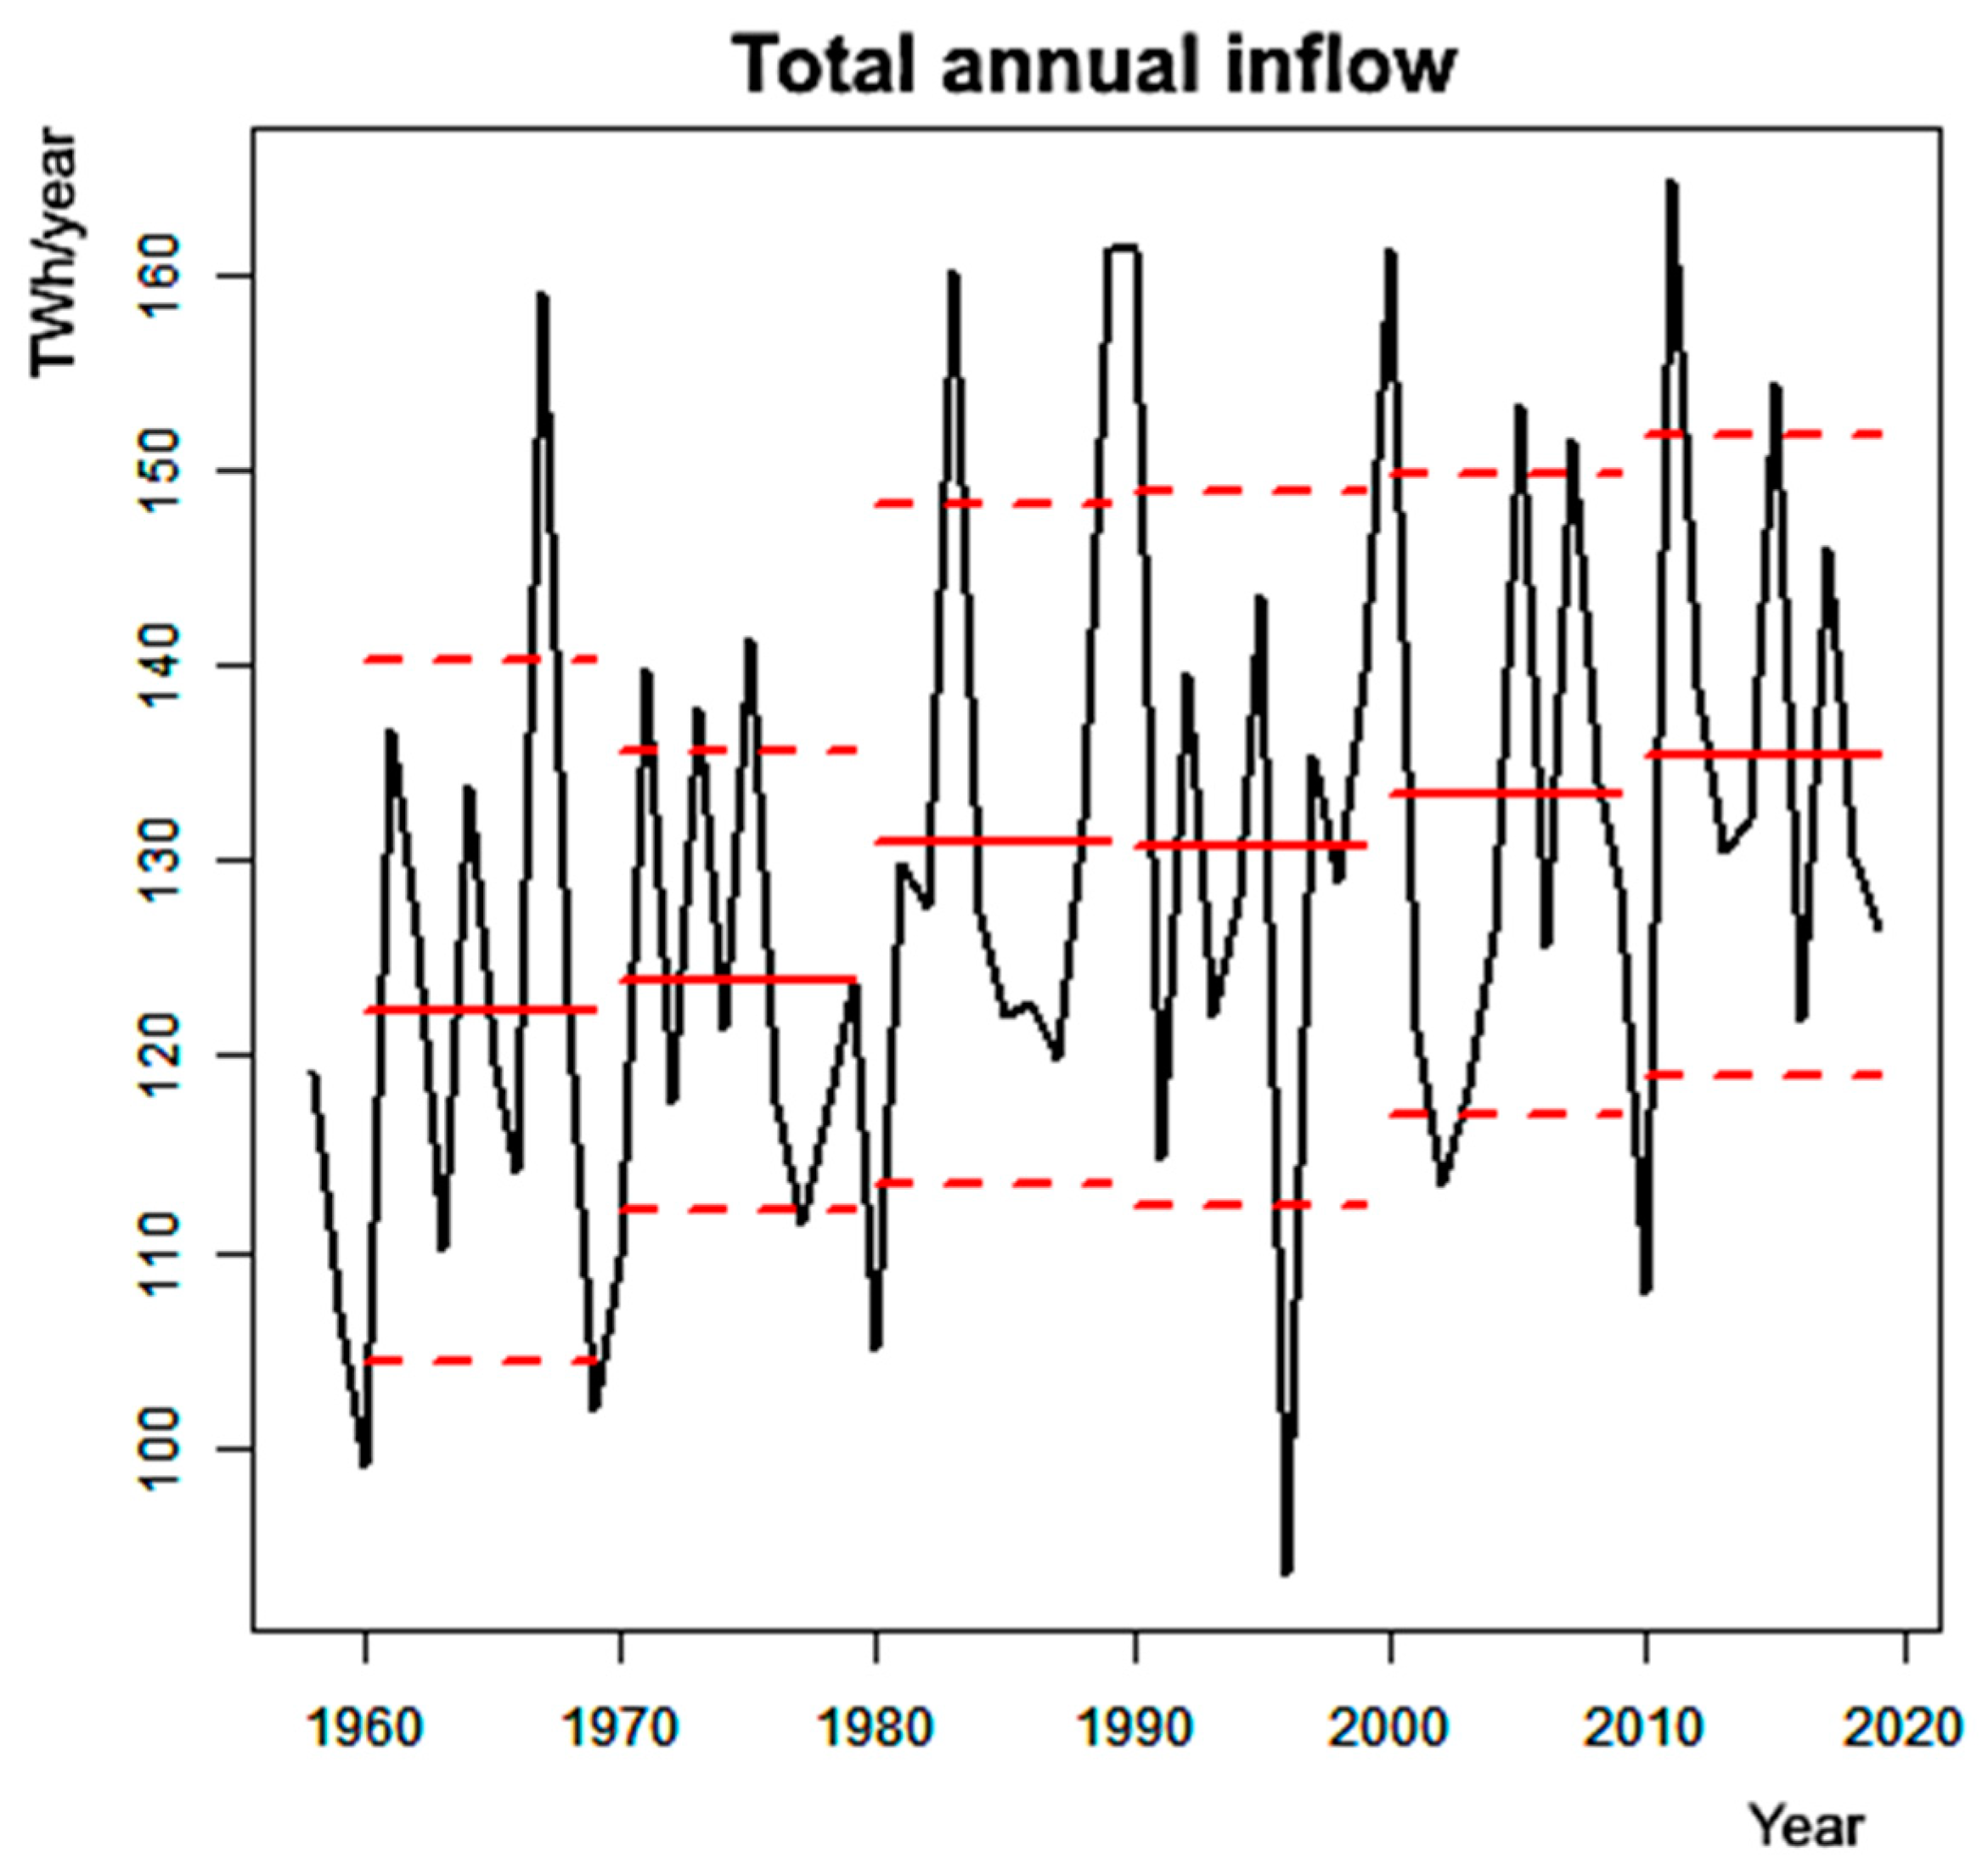
  • Historical trends in the observed long-term monthly and yearly inflow to the Norwegian hydro-reservoir system (in TWh, 1958–2019). Norway, by far, constitutes the largest producer of hydropower in the Nordics. Historical data for production planning are provided by the Norwegian Water Resources and Energy Directorate (NVE). Daily data on the inflow to the Norwegian hydropower system from 82 representative measurement stations were extracted from [28] and subsequently processed, converted into energy units and aggregated.
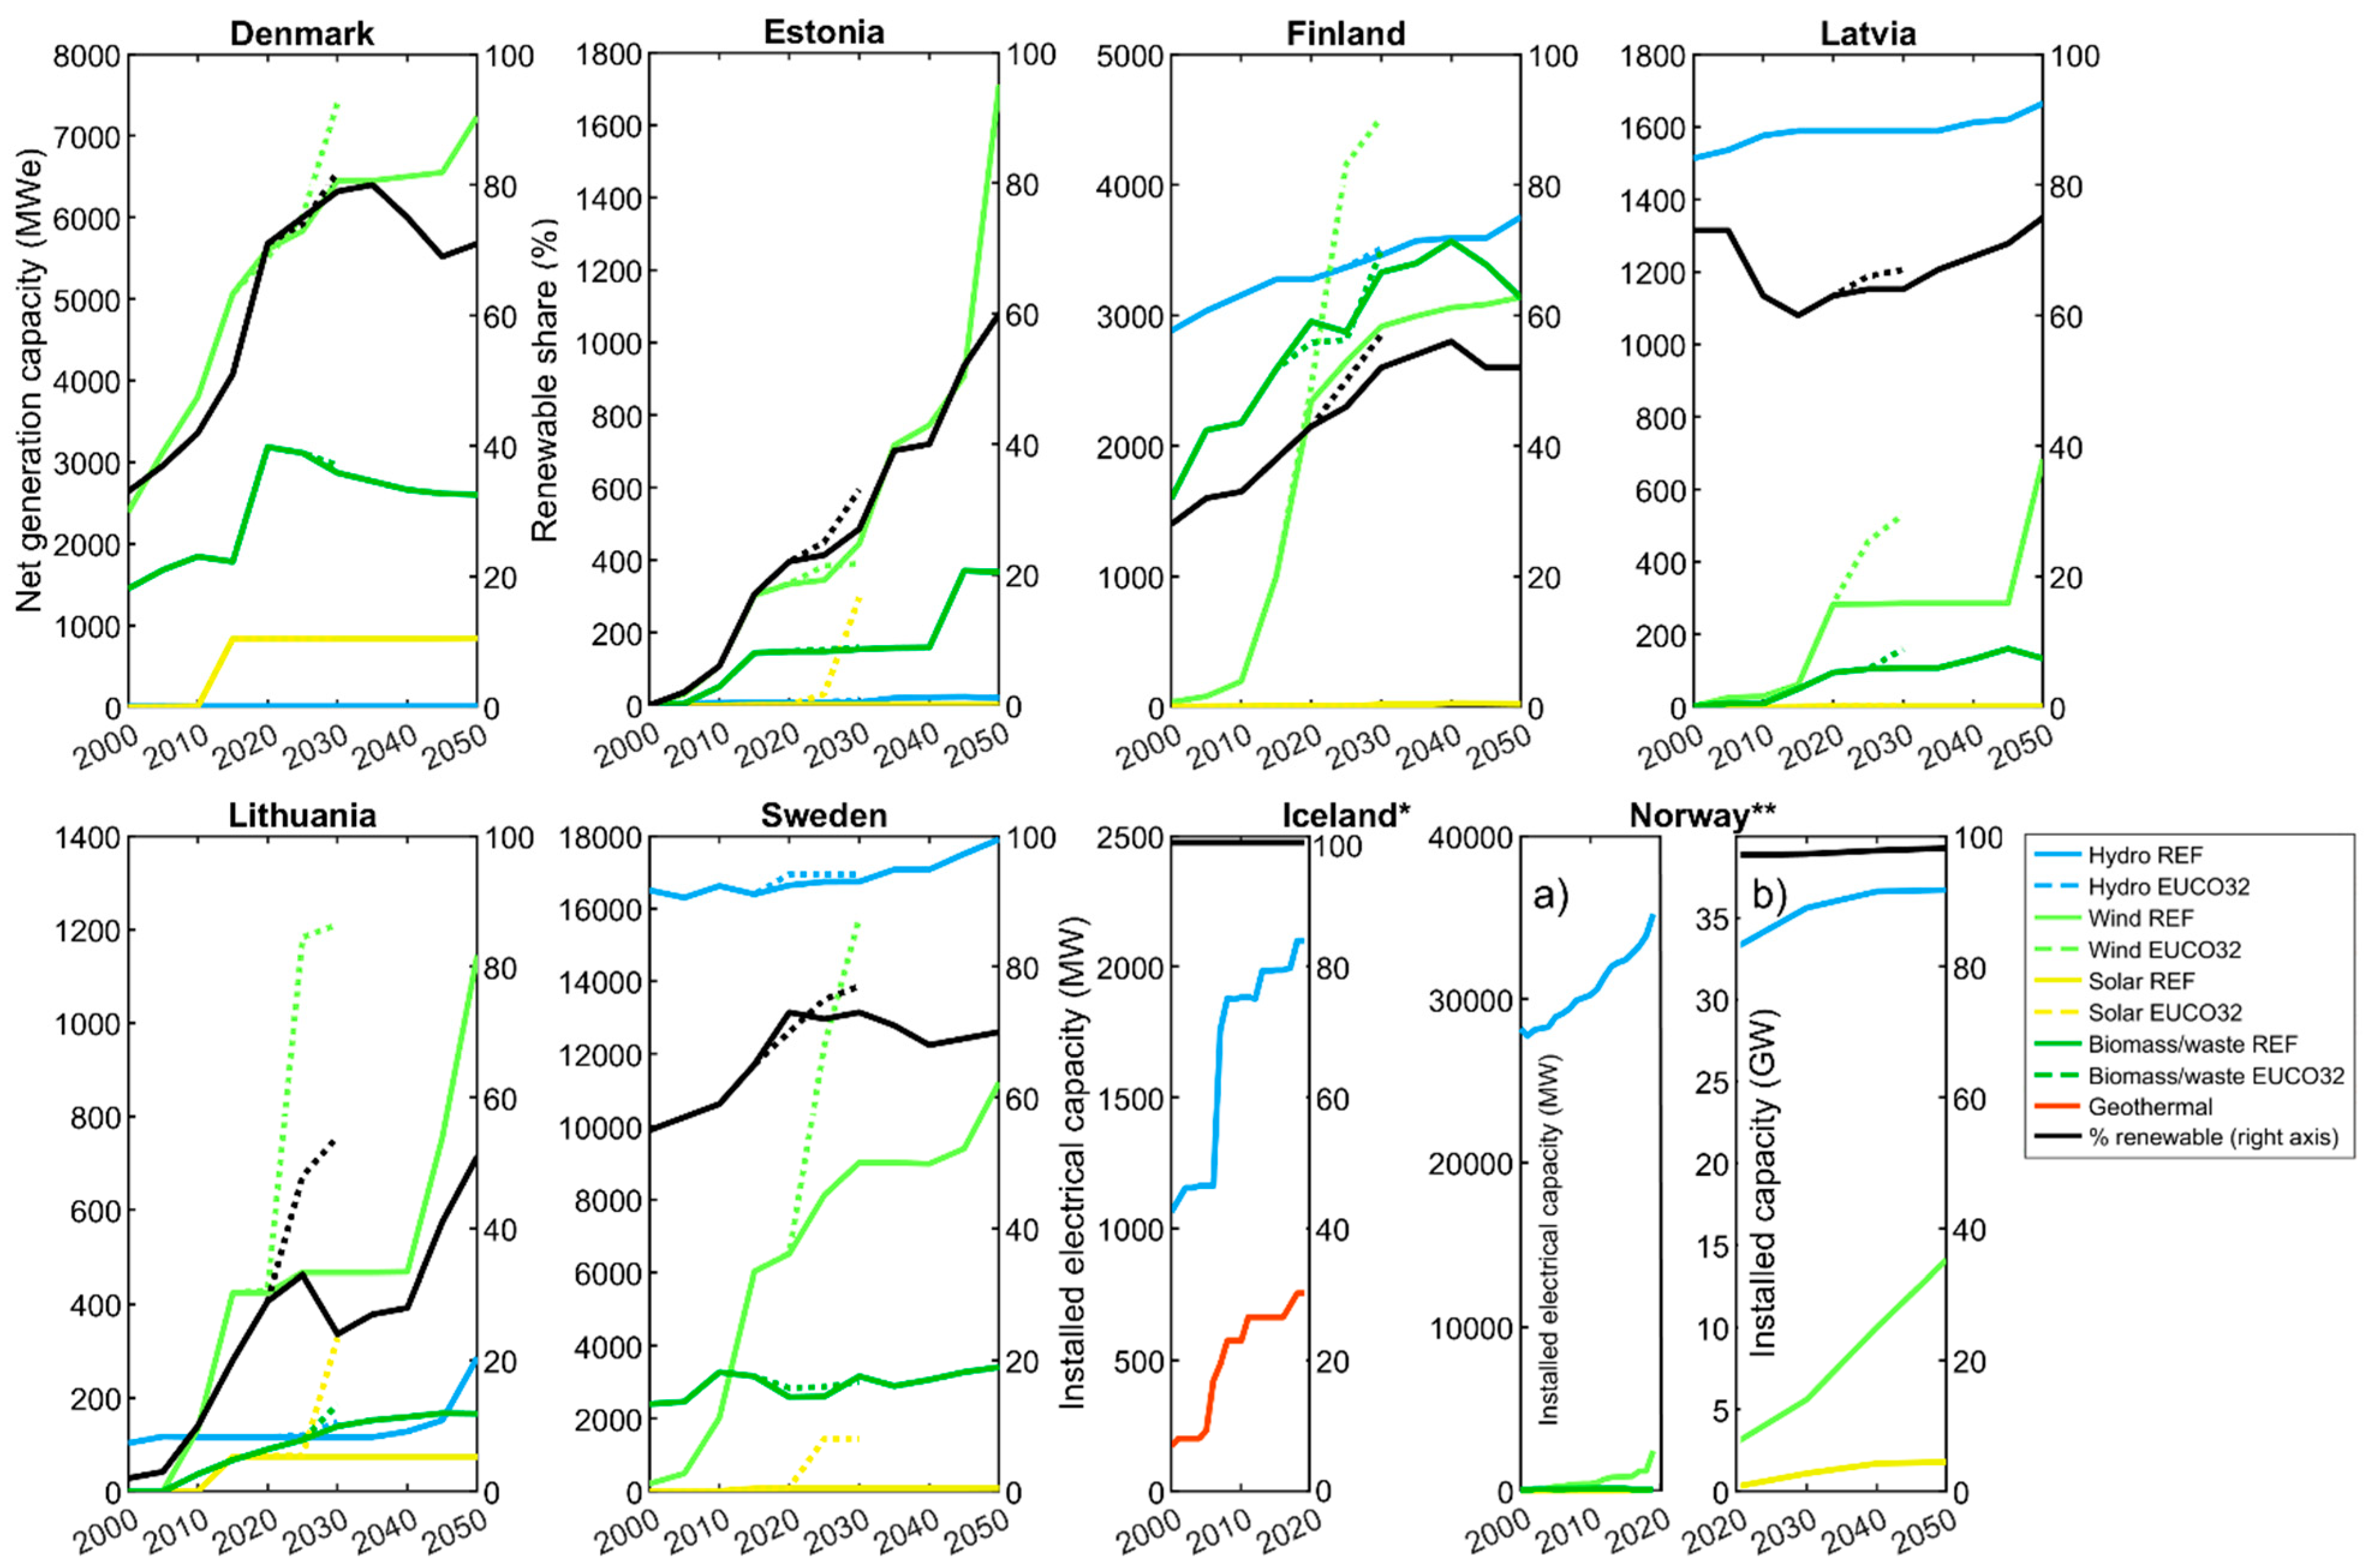
  • The projected future composition of renewables, and their share of the total electricity generation level, in the Nordic and Baltic countries until 2050. These projections were based on the scenarios developed by the European Commission to assess energy, transport and climate mitigation targets. Specifically, the “Reference” [29] and “EUCO3232.5” [30] scenarios were employed representing, respectively, a reference/benchmark scenario to test the effect of new policies against and a scenario with greenhouse gas emission reductions amounting to a 32.5% energy efficiency target and 32% renewables by 2030.
To convert the measured inflows into the Norwegian hydropower system from water units (cubic meters per year) to energy units (TWh), we calculated the ratio between the estimated annual mean power production at station level reported by NVE [28] and the observed inflow series (water units) from 1958–1990.
In the following, we utilize the abovementioned data as a basis for evaluating current and future potentials for CSs related to renewables (i.e., for optimizing production and reducing climate risks), including in the context of the expected future development (projections) of the energy mixes used in the different Nordic and Baltic countries.
As a side note, how “renewable” (or sustainable) an energy technology is evidently depends on the assumptions and methodologies used for the assessment, along with whether one considers the production phase only or the entire life-cycle, including establishment and decommissioning or environmental trade-offs such as with water [31]. On this background, bioenergy is here depicted in the analysis and figures, alongside hydro, wind, solar photovoltaic (PV), waste and geothermal, although under which circumstances bioenergy can be considered renewable is currently highly debated in the scientific literature [32,33]. Coal, oil, natural gas and nuclear are considered non-renewable.

3. Results

In this section, we initially frame the Nordic energy market (Section 3.1) and the use and integration of renewables herein (Section 3.2). Hereafter, the results from the stakeholder mapping are laid out (Section 3.3) including subsections on electricity producers (Section 3.3.1), transmission system operators (Section 3.3.2) and market traders (Section 3.3.3). Finally, CS potentials for the renewable electricity market (Section 3.4) are investigated within the subsections of observed variations in supply and demand (Section 3.4.1), current CS suppliers (Section 3.4.2) and longer-term perspectives for renewables and CS integration (Section 3.4.3).

3.1. The Nordic Energy Market

Norway, Sweden, Finland and Denmark have since the early 1990s co-operated by bringing the individual markets together into a common Nordic market, the Nord Pool Spot market [34]. Between 2010–2013, Estonia, Latvia and Lithuania joined the Nord Pool market. The Nord Pool is owned by the seven national transmission system operators [34,35], who are responsible for the security of supply, balancing supply and demand, and for operating the larger national grid infrastructure and cross-border grid connections.
Short-term electricity contracts for physical delivery are traded at the Nord Pool Spot, primarily servicing the players at the wholesale market for electricity [34]. The customers on the Nord Pool Spot are both producers, retailers, and traders. Furthermore, large end-users of electricity trade on the Nord Pool Spot market to buy their electricity directly from the wholesale market instead of the retail market [34]. On the Nord Pool Spot, trading with contracts happens both at a day-ahead market (in 2015 89.7% of total electricity consumption were traded this way) and an intra-day market (in 2015 this corresponded to 1–3% of the total electricity consumption), which means that electricity is bought and sold hourly [34,36]. The remaining part of the electricity is traded bilaterally outside the Nord Pool. The wholesale markets provide key price signals, which affect the choices of producers and consumers, as well as investment decision in production facilities and infrastructure [37].
The long-term trade of electricity in the Nordic market is a financial product on Nasdaq OMX stock market [37]. The financial products are futures, forwards and options, with contracts having a time horizon up to ten years, covering daily, weekly, monthly, quarterly and annual contracts [34]. Electricity forward and futures contracts represent supply contracts between buyers and sellers, where the supplier is obliged to supply a certain amount of power at a pre-determined price to buyers, who are obliged to buy this amount of power at the pre-determined price [38]. There is no physical delivery for financial electricity contracts. However, in the financial market, participants can secure prices for future purchases or sales of electricity [37]. Financial contracts are in this way used for price hedging and risk management.

3.2. Renewable Energy in the Market

Renewable energy is a major electricity source in all Nordic countries, with a 2019 share of about 82% in Denmark (mainly wind), about 59% in Sweden (wind and hydro), almost 98% in Norway (hydro), and about 47% in Finland (wind and hydro). In the Baltic countries, the share of renewables is in the range of 29–80%. In 2019, hydropower production in the Nordic and Baltic countries amounted to 439.8 TWh, accounting for 50% of the total power generation [12]. Hydropower production by far is the dominant power source but interacts highly with the other sources of power production on the market (see Figure 1).
In total, electricity from renewable sources account for about 72% of the total electricity generation in the Nordic and Baltic countries (Figure 1), resulting in a fluctuating supply of electricity as a result of the hydro-meteorology conditions. The characteristic time horizon of these fluctuations for each of the renewable energy source, however, are very different. While wind and solar power potentials can vary substantially within hours, hydropower production is characterized by more long-term variations. As indicated above, the storage capacity in water reservoirs allows hydropower to balance more a rapidly fluctuating supply from renewables, e.g., wind power. Hence, the inflow of water to the reservoirs during summer and in periods with low demands can be stored and used in the wintertime with less inflow and higher demands. In addition, to help balance the daily demand and supply of electricity, the ability to store energy in hydro reservoirs also has a mitigating effect on prices on the Nordic and Baltic power market. That said, hydropower potentials can vary substantially from season to season and year-to-year [40] (see also additional plots below). Since hydropower production dominates the market, variations in production capacity is one of the main causes of seasonal variations in prices on the Nord Pool Spot market. This means that all other renewable electricity suppliers to a large extent have to take prices as given, as the inter-annual variations in other renewable energy sources are relatively small compared to variations in hydropower.

3.3. Stakeholders

In the renewable energy supply chain of the Nordic countries, the electricity produced is sold on the wholesale market. Here, both producers, retailers, traders, brokers and large consumers trade electricity contracts. The national transmission system operators are responsible for balancing the supply and demand and ensuring the security of supply. They are responsible for the large grid infrastructure supplying power to society. Retail companies sell power to smaller consumers, and the distribution system operators are responsible for the local power grid (e.g., for households). Hence, many stakeholders are involved in the energy supply chain, and they vary from large entities operating on the national or international level to smaller private companies, electricity suppliers and market stakeholders within the Nordic region. Accordingly, their demand for weather and CSs are also varied. The potential role of such services in the three first links in the supply chain (producers, market traders and transmission system operators) are outlined in Table 1 below. As indicated, operational time scales range from hourly through seasonal to annual and multi-annual scales and service needs therefore cover both the weather and climate domains.

3.3.1. Electricity Producers

Hydropower producers’ daily management, but also long-term investment decisions are affected by weather and climate variables. They depend highly on weather and historical data in their daily and weekly planning. For planning purposes, information on potential shifts towards earlier flow peaks from snowmelt and lower peak volumes in the future are important for different seasonal regulation, e.g., for reducing the need to store large volumes of meltwater for the winter months [14]. In general, producers only use dynamic CSs such as seasonal forecasts as indicators (e.g., more/less precipitation) and not as quantitative information to feed into operational models, though various studies [22,46] suggest that they would benefit from using accurate quantitative information for longer-term planning. Thus, a main barrier is that the available seasonal forecasts are currently quite coarse or lack sufficient reliability or skill [22,46]. Conversely, both large state-owned and private energy companies make intensive use of historical data, observations and climate statistics (averages and tendencies of particular months) in many aspects of their planning and operations [22,46]. Such data are used for forecasting future demand, understanding the potential value of generation mix, improving optimization, developing new facilities, and understanding potential risks to assets from extreme events [22,46]. In addition to historical data, companies use weather forecasts (up to two weeks) to feed their operational models, e.g., to understand electricity demand. Demand for electricity-based heating and cooling is especially affected by temperature changes, where warmer summer temperatures increase the demand for cooling, while warmer winter temperatures decrease the demand for heating [47,48]. On the demand side, the main parameters of interest are therefore temperature and cloud cover. On the production side, the main parameters include precipitation, wind and solar radiation [22].
In Section 3.4.2, we outline the current suppliers of these climate and weather services.

3.3.2. Transmission System Operators

Transmission system operators also use CSs for several purposes. Based on [20], forecasts of sun and wind (based on historical data) are used for the operation of the energy grid as opposed to precipitation and the expected electricity generation hereof by means of hydropower (including neighboring countries). In general, the Nordic transmission system operators apply (i) historical data to forecast the peak load of a particular day, as well as general monthly patterns; (ii) short-term weather forecasts for operational models. To understand demand, temperature is again the most important parameter. Temperature is also important for determining the capacity of high voltage lines. Other used parameters are wind, solar radiation and cloud cover. For hydraulic forecasts, precipitation is used. Forecasts of extreme events (such as strong winds, icing, etc.) are important for maintenance teams [49].

3.3.3. Market Traders

The limited skill of the forecasts used by producers and transmission system operators is reflected in how traders increase their gains on the energy trading market. Investors trading electricity futures, a financial instrument to hedge prices and risk, use weather and climate forecasts to make gains on the financial market. In recent years, a significant number of Nordic energy-trading companies, including the Danish investment company, Nordic Power Trading, have thus demonstrated a large return on investments, indicating an improved use of climate and weather data. The exact form of the CS used is generally not disclosed due to business confidentiality, however, a combination of external and in house models have been reported [50].

3.4. Climate Services for the Electricity Market

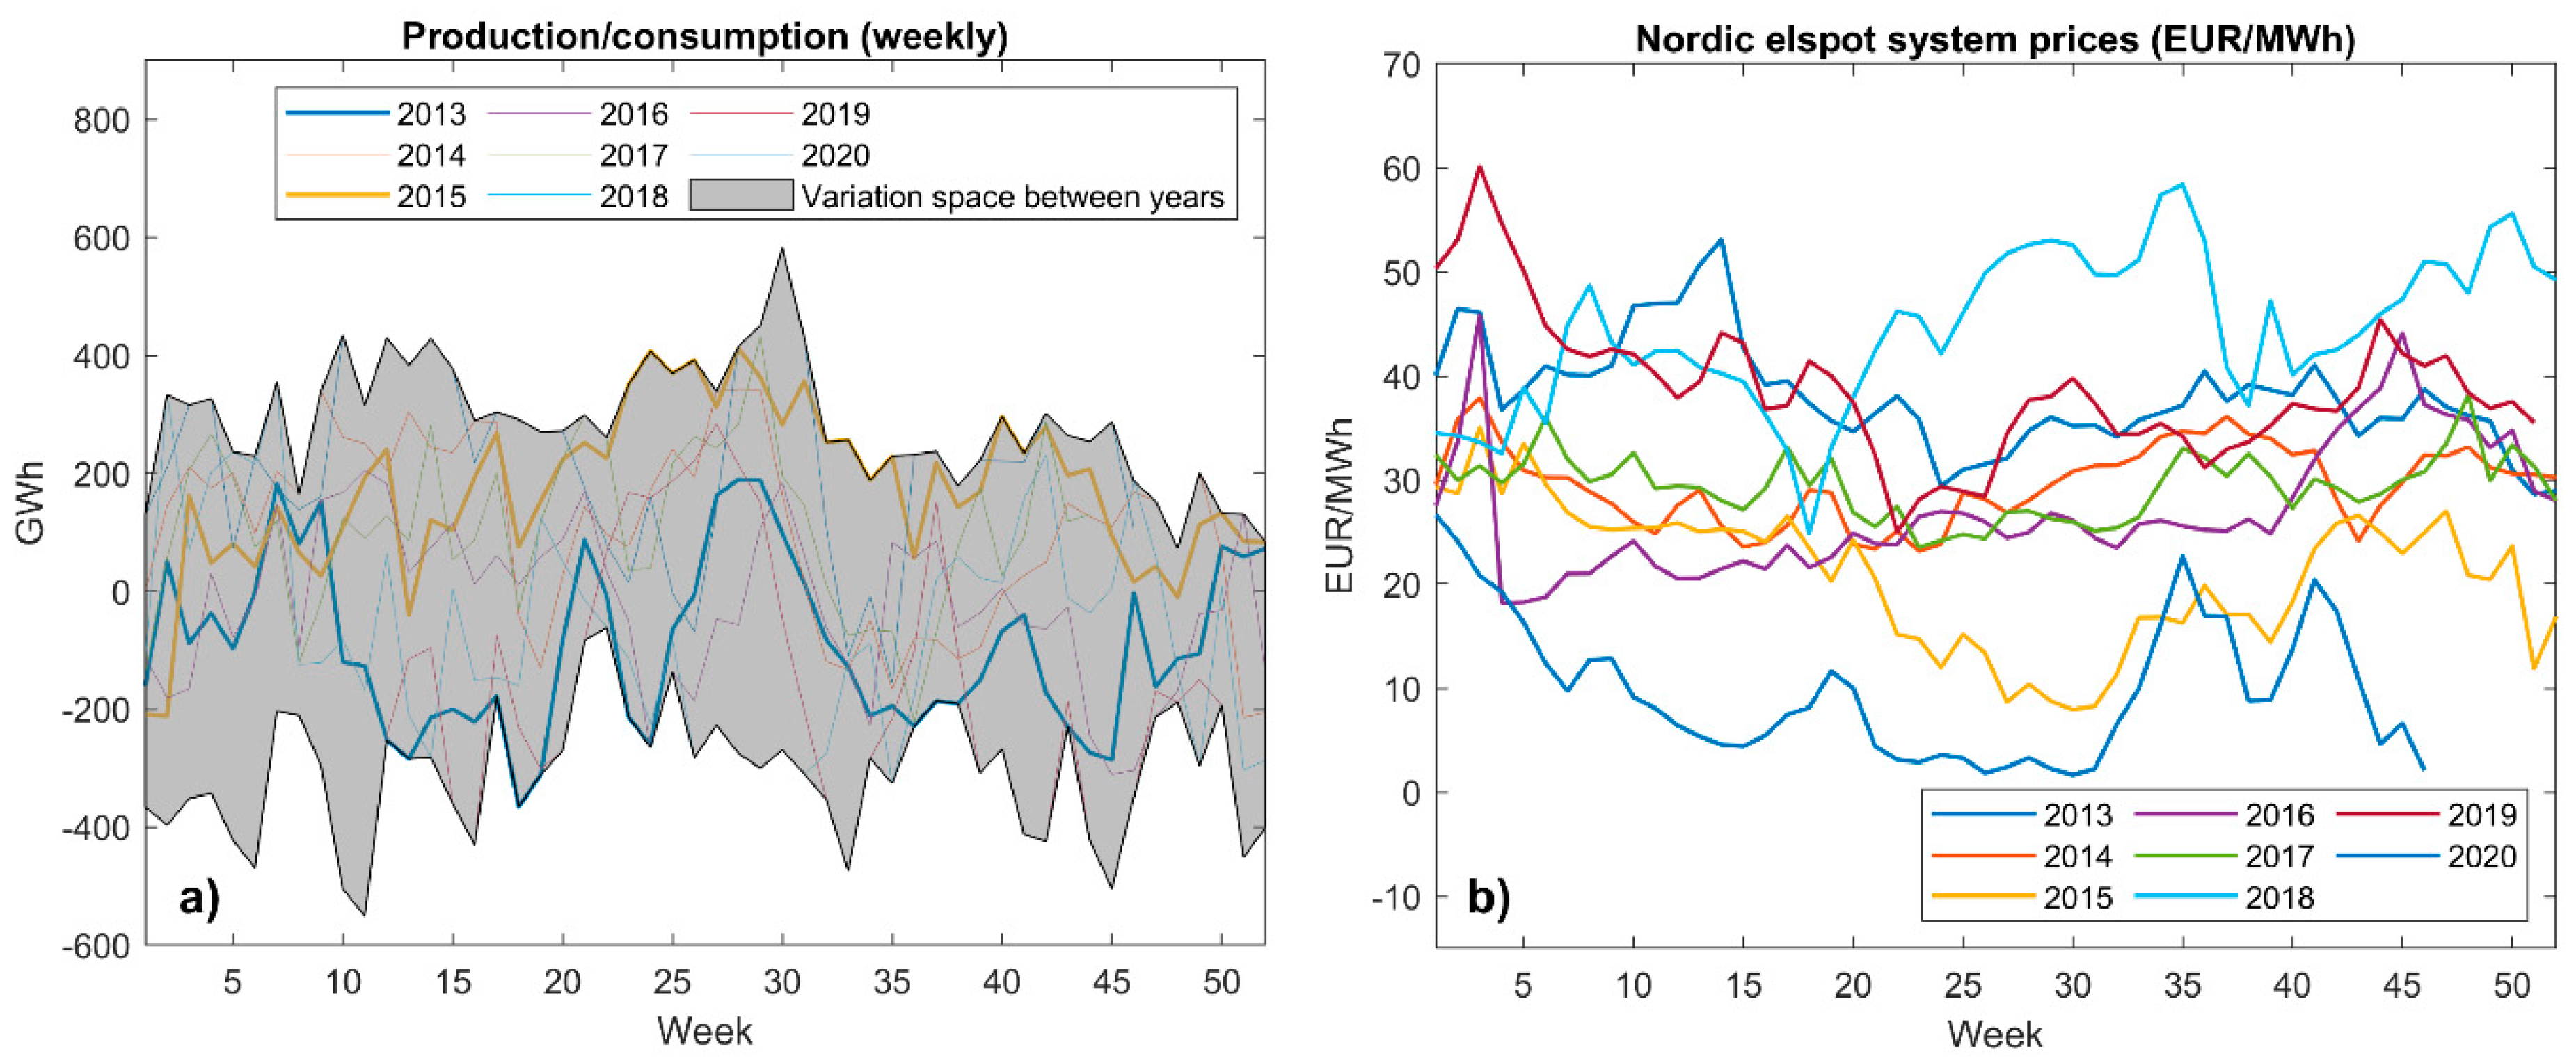
3.4.1. Observed Variations in Supply and Demand

We initially consider the observed variations in supply and demand and their relation to short- and longer-term climate variability. Reservoir levels and hence the production capacity for hydropower is primarily affected by variations in inflow and by evaporation from reservoirs. The hydro-reservoir levels can vary significantly from year-to-year and also exhibit a seasonal variation as illustrated in Figure 2 (2013–2020). As shown, Nordic water reservoirs are generally depleted from around September to May and get refilled during the late spring and summer (by spring melting and precipitation). In the period 2013–2020, weekly hydropower reservoir levels, however, varied by as much as 35–40 TWh with the years 2013 (low reservoir levels during both spring and summer time), 2015 (high reservoir levels during late summer and autumn) and 2018 (summer and autumn drought) demonstrating the most significant changes from the “mean” reservoir level during those years.
For comparison, Figure 3 depicts the observed weekly variations in the wind power-based electricity production in the Nordic countries from 2013 to 2020. Except in Denmark (Figure 1), wind only accounts for a smaller part of the electricity production, and though capacity is growing fast in most countries, wind remains a minor part of the total Nordic energy system. As a result, the total annual production of wind power in the Nordics can be expected to increase. To account for the significant differences in wind capacities throughout the period, Figure 3 shows the ratio (percent) between the weekly production of wind power and the total annual amount of wind power produced in individual years. The total annual wind energy produced is indicated in the legend for each year and varies according to the installed capacities underlying the analysis (including the gradual inclusion of countries into the statistics such as Sweden in 2015 and Finland in 2018). Figure 3 clearly indicates the roles of intra-annual and inter-annual variabilities related to wind. Intra-annually, there is generally higher mean levels of wind power production from approximately week 35 until week 10, and inter-week variations. Inter-annually, we also see major fluctuations (c.f., Figure 3, legend). Given the lower installed capacity at the time, 2015 was evidently a great year for wind production, whereas 2019 conversely was a very poor year. Again, it is important to note the order-of-magnitude difference between hydro reservoirs (Figure 2) and over wind power production.
Comparing between energy conversion sources, Figure 4 shows the generation of electricity for the period of 2013–2015. What stands out is that variations in electricity generation by hydropower due to its dominating role in the Nordics are evidently much more significant than variations in other sources and generally peaks during winter, as also suggested by Figure 2. The black line here shows the market price, exhibiting a generally falling trend, although with a few significant peaks in 2013 and in the summer of 2014 as well as a sharp drop in 2015 (see also Figure 5a,b).
To understand this behavior of seasonal variabilities, Figure 5a shows how the Nordic and Baltic energy mix (2013–2020) results in fluctuations between production and consumption (resulting in potential deficits/surpluses of electricity) throughout the year as well as inter-annually, providing an important basis for traders. The gap between supply and demand is seen to vary weekly with up to ±500 GWh, which is a relatively low number compared to the total amount of produced electricity (in 2015 a total of 425 TWh was produced)—in part due to the storage capacity of hydropower, as explained above. An example of a year with a large supply deficit was 2013, and oppositely 2015 was characterized by a large trading surplus.
Figure 5b similarly illustrates how prices varied inter-annually and year-to-year in the period 2013–2020, e.g., as a response to the surplus/deficit of resources indicated in Figure 5a. While the outdoor temperature generally affects the heating and cooling demand, the amount and timing of precipitation and wind affect whether power plants are producing to full capacity. As a result, supply and demand balancing is largely affected by weather conditions: when renewable energy production exceeds what is expected, this will in general influence prices down, and vice versa. As an example, the summer of 2013 was characterized by lower than average precipitation. Furthermore, the energy stored as snow was also lower than normal, which both contributed to a lower maximum reservoir level than normal (see Figure 2). At least partly due to this hydrological situation, prices increased by 22% from 2012 to 2013. High prices occurred in e.g., April 2013 (see Figure 5b), when temperatures were low. This happened because low temperatures led to a higher consumption, but also to a delayed melting of snow to the reservoirs. When the temperature increased and the spring thaw arrived, prices dropped again [37] (Figure 5b). The same increase in prices was seen in 2018, related to the immense summer drought throughout Europe, which also affected the following winter season.

3.4.2. Current Climate Service Suppliers

The main climate service suppliers to the renewable energy sector are the meteorological institutes in Norway, Sweden, Finland as well as the Norwegian Water Resources and Energy Directorate. They all license forecast products with hourly to seasonal temporal extents for hydropower producers operationally, whereas national climate service centers provide climate projections and other relevant information of use within the hydropower sector. In general, these forecasts are based on the operational seasonal forecasts product provided by the European Center for Medium-Range Weather Forecasts (ECMWF), which are then bias-corrected before serving as input into a spatially distributed hydrological models used to generate an ensemble of realizations (e.g., [52,53,54]). Concerted efforts at the European level grown from a similar kind of methodology is currently being explored and was recently prototyped in no less than four projects under the Copernicus Climate Change Services [55]: SWICCA—Service for Water Indicators in Climate Change Adaptation; eDGe—end-to-end demonstrator for improved decision-making in the water sector in Europe; Clim4Energy—providing climate service products tailored for the energy sector and ECEM—European Climatic Energy Mixes. Notably, eDGe introduces a multi-model hydrological ensemble using many climate models and many hydrological models to address the issue of uncertainty and provide improved seasonal and longer-term forecasts. Based on the prototyping, the C3S Energy operational service for Europe is currently being developed, which include key elements of historical, seasonal forecast and projection periods for climate, electricity demand and the production of power, from wind, solar and hydro.
A limited range of additional services aimed at the hydropower sector are offered by different semi-commercial vendors. For example, SINTEF Energy Research have developed a market simulation model, to support hydro scheduling in competitive electricity markets [56], where information/forecasts/projections of, e.g., wind and hydropower, are drawn from time series data. A similar tool and associated services are offered by vendor Thomson Reuters Point Carbon, who have developed a system based on 23 regional hydrological models [57]. In their implementation, the market model is fed by input from the network of hydrological models, which are again forced by a combination of historical observations and actual forecasts of snowmelt. Thomson Reuters provide information for up for 52 weeks ahead using this approach. Finally, Energy and Environment Data is a renewable energy service company, which delivers comprehensive wind data and software to the industry and to wind turbine developers based on historical wind data.

3.4.3. Longer-Term Perspectives for Renewables and Climate Service Integration

According to the Nordic National Renewable Energy Action Plans, renewable energy will comprise an even larger part of the power supply in the coming years [2,3,4,5]. As a result, the electricity trade is expected to increase in the Nordic area, with the fast penetration of renewable energy being a key component [58]. Since arguably the Nordic countries have already utilized almost all the available hydropower potential along with its associated storage possibilities, the expansion of renewable electricity sources is to a large extent expected to be covered by fast fluctuating energy conversion sources such as wind and solar [58]. To depict potential future pathways for the Nordic and Baltic energy systems, Figure 6 outlines net generation capacity results from the EU reference [29] and EUCO3232.5 [30] scenarios, representing a conservative and a more ambitious reduction scenario, respectively (differs for Iceland and Norway, see figure caption), as well as the share of renewables. By these scenarios, greenhouse gas emissions across all of the EU, not just the Nordic countries alone (non-distinguishable in the literature), are expected to be reduced by 35–48% from 2030–2050 and at least 40% in 2030 for the two scenarios respectively (compared to 1990 levels). From the figure, it is clear that all countries progress towards an unchanged or increasing share of renewables and especially the Baltic countries, coming from low initial shares, are expected to experience large increases in renewables. It is also clear that wind will be the key energy conversion source representing the increasing share of renewables, across almost all countries, supplemented by biomass/waste and solar. Noteworthy exceptions include biomass/waste for Finland and geothermal energy for Iceland.
For hydropower, and despite an advanced utilization stage, climate projections generally suggest an overall increase in the future hydropower potential [15], with increased river flow during winter, and smaller inflow from melting snow in the summer. This leads to a future shift towards earlier peak flows from snowmelt and lower peak volumes [14]. To exemplify this, Figure 7 depicts the total annual inflow to the Norwegian hydropower system from 1958–2019, based on measurements from 82 representative stations [28]. As indicated, the average annual production from hydropower in this period was around 130 TWh, with huge inter-annual variations in the power production ranging from less than 100 TWh/year to 170 TWh/year as also indicated on Figure 4. From these measurements, it is evident that the inflow to the Norwegian hydropower system (accounting for 99% of the electricity generation in Norway, see Figure 1) has increased significantly over the last 60 years. This is due in particular to increases in water originating from increased spring melting and increased precipitation, causing an increase in the hydropower production and modifications to existing management practices. On this background, it is not surprising that current CSs focus on the hydropower sector, including both seasonal forecasting and decadal-to-multi-decadal climate projections, though it is equally evident that improvements are urgently needed [46,52].
Like hydropower, wind power production is also very sensitive to climate change effects. In the Nordic region, the annual wind electricity generation is projected to increase gradually from the near-term to the end of 21st century [61]. In particular, electricity generation is projected to increase in summer months [61]. However, increasing average wind speeds might also imply an increase in strong/extreme winds. Such winds can lead to periods where the wind turbines are stopped, or even lead to a higher risk of damages to the turbines [49], and hence to periods with lower wind power generation. Currently, the wind energy sector makes extensive use of weather forecasting products, whereas the use of operational CSs for wind is low—in part due to the missing skill of longer-term forecasts and climate models with respect to the wind regime [62,63,64].
Other types of climate-sensitive renewables such as solar and emerging technologies such as tidal and wave power currently play a negligible role in the Nordic electricity market (see e.g., Figure 1 and Figure 4). While this might evidently change in the future, it seems evident that an increasing share of fluctuating renewable electricity generation, which is highly susceptible to both climate and weather variations, extensive trade and exchange of resources will be urgently required in order to balance the power system.

4. Discussion

As demonstrated by the narratives above, climate services are very relevant to the implementation of an increased share of renewables into the Nordic renewable energy sector, and not so only in the “traditional way”, i.e., to producers, as reflected by existing climate service offers (see Section 3.4.3), but also to a broader group of users, including traders, who ideally need reliable information on when and how much electricity to buy and sell and to which price; assuming this information was available, this could in principle lead to more stable prices on the market as a whole. Conversely, the same evidence suggests that, in general, current service offerings can be greatly improved. This is particularly true with regards to the short- and medium-term, e.g., weekly to seasonal to decadal predictions, where the forecast skill is currently still low and with a high degree of uncertainty [52]. That said, there is to our knowledge no benchmark to measure the quality of renewable energy services, such as those provided by public or private climate service providers or Copernicus services, against user requirements, not even when it comes to the hydropower sector. This is arguably a serious hindrance against the further uptake and a broadening of the market for renewable energy and CSs in the Nordic countries.

4.1. Implications of Inaccurate Production Forecasts

With the present liberalization of the electricity markets, new financial risks have been introduced that increase the risk of substantial losses, especially for the sellers of forward contracts [18]. As a result, market participants are increasingly becoming aware of the importance of “risk hedging” in the electricity market to compensate for the substantial uncertainties in forecasting through long-term futures and forward contracts [38]. One example of this is the Swedish energy company, Vattenfall, who report that they continuously hedge future electricity generation through sales in the forward and futures markets. Subsequently, spot prices only have a limited effect on Vattenfall’s earnings in the short-term [65]. Moreover, through forward and futures contracts, the financial market sends an important price signal to, e.g., hydropower producers on how to dispose of the energy stored in their reservoirs.
In order for the financial market to also send the correct price signals to stakeholders, the forward prices should reflect the future spot prices and be based on correct forecasting of the electricity supply and demand at that point in time. This, however, is beyond current tools and calls for new and better methods for predicting spot market prices. Hence, price forecasts based on precise climate information have been shown to lead to gains in the market (as illustrated by the Nordic Power Trading company), whereas those based on historical data, not considering important forward-looking information, may lead to substantial pricing errors and to financial losses [18].
The present limited precision of forecasts [22,46] can also to some extent be said to be reflected in how traders or speculators increase their gains on the energy trading market. Financial trading with electricity is risky but may incur substantial rewards. Thus, in Denmark currently only three companies specialized in trading electricity contracts exist. The high returns in the market has increased the interest in these financial products. In 2013, the volume traded on the financial market was 4.7 times the volume of the physical market [37].

4.2. What Is Needed for a Greater Use of Climate Services?

The skills of the current generation of climate services for renewable energy production is in general not very high. Especially seasonal forecasts suffer from large systematic errors, and so they have only very limited value to the end-user [46]. The scientific community is aware of this problem and see this as a main challenge for enabling a better use of climate predictions [66].
As evidenced by existing and emerging climate service suppliers, hydropower has so far been the primary focus for service development. For hydropower producers, the future conditions in the next one to three, or even to +12 months in terms of precipitation (type and distribution) and temperature is highly valued. For seasonal forecasts to be beneficial for the end-user, they have to be sufficiently accurate and be tailored to a decision-making context [22,66]. For the planning of hydropower production, information on potential shifts towards earlier flow peak from snowmelt and lower peak volumes in the future are important to plan for different seasonal regulation, e.g., to reduce the need to store large volumes of meltwater for the winter months [14].
Organizations in the energy sector find information on uncertainty important for understanding the provided climate data and are aware that uncertainty is unavoidable [9,22]. Some energy organizations e.g., state that they compare forecasts from different suppliers to reduce uncertainty and that a certain level of trust is essential in a data provider [20]. Furthermore, many organizations (n=31) prefer receiving information on the uncertainty of the data as numerical estimates to be able to quantify uncertainty and integrate it in existing models or produce graphics on their own [22]. Reliable probabilities on the uncertainty are expected to be part of the decision-making processes. A prediction has little value without an estimate on its quality, and quantification of the uncertainty is considered one of the most important aspects for minimizing financial risk. From a user perspective, improving reliability across weather-to-climate time scales is fundamental, since this says something about the trustworthiness of the predictions [20,66].
In summary, this study found the following factors as essential for an improved and expanded use of CSs in the integration of renewables within the energy sector:
  • Documentation and knowledge transfer of the potential economic benefits and losses by utilities and traders when considering climate predictions. Similarly, investment decisions on climate risks of renewable electricity production should be able to benefit from research and other knowledge generation.
  • Development of tailor-made products, which can help stakeholders to integrate CSs in their decisions—also beyond the ranks of energy producers.
  • Trust and quality assurance procedures need to be established in relation to CSs for the sector. CSs are, e.g., in relation to investment projects typically integrated into feasibility studies as part of larger consultancy services, which do not include specific expertise on climate change issues.
  • Climate service data should be available for a short- to medium time frame, and at a very detailed geographical level reflecting the location of power production plants. As a side note, today’s data on offshore sites for wind parks are very uncertain.
  • Creation of operational online interfaces, where users of wind, hydropower, and other stakeholders, can explore probabilistic predictions and experts provide training.
  • Interactions between the renewable energy community and the climate science community to enhance the outcome and evaluate the performance of past predictions.
Evidently, this list is not exhaustive, as individual services might span different time and spatial scales, different renewable energy technologies and user communities.

5. Conclusions

In this paper, we analyze the current framing and use of climate information on the Nordic power market as well as the potential for the increased use and development of CSs and data as a part of a green energy transition. Based on reflections upon exemplified dynamics of the Nordic electricity market and the potentially associated demand from select stakeholders, we investigate amongst other aspects the role of skillful forecasts for predicting, e.g., the amount of potential power production at different time scales.
The Nordic energy system is already dominated by renewables, in particular, hydropower, with the remaining shares (about one-third) coming from nuclear and fossil fuels (Figure 1). As argued by our (and other) studies, there is still a potential for improving the management of existing resources. For example, in terms of better ensuring that short-term demands are met (Figure 5a) despite the high volatility of, e.g., wind (Figure 3) and solar power, which also affects energy prices (Figure 5b). Further, planned increases in the share of renewables in line with the Paris Agreement will particularly concern wind and to a smaller extent biomass (Figure 6), which is likely to highly increase the volatility of the Nordic energy supply, in particular in Sweden, as nuclear is replaced.
On this background, our paper indicates an under-utilized potential for CSs in the Nordic energy sector concerning especially longer-term planning. Hence, weather forecasting services are already integrated in wind power production and its market presence, whereas seasonal predictions, typically based on recent or historical observations, are to some extent considered by hydropower producers and traders. That said, we here suggest a critical need for both improving the reliability of existing CSs and for developing new tailored solutions for a broader group of stakeholders in the renewable energy sector. In this context, the quantification of the uncertainty related to long-term climate projections and shorter-term climate predictions was easily found to be one of the most important aspects for minimizing, e.g., financial risk and to be crucial for a successful development of CS related to renewable energy systems.
As new options for existing (highly fluctuating) renewable energy technologies will emerge in the decades to come, alongside the introduction of whole new technologies such as hydrogen, wave/tidal power etc., energy-related climate services are assured to become increasingly relevant and the currently limited portfolio of actionable CSs to evolve. In this regard, new or improved CSs will have to account for different user framings, spatio-temporal scales and uncertainties than the present, and new user groups will have to adopt such services. For this aim, an improved generation of seasonal-to-decadal predictions and multi-decadal climate projections based on improved bio-geophysical modelling, and integrated into different decision-making contexts, will be needed, and require interdisciplinary collaboration involving engineers, economists, social scientists and climate/weather modelers.

Author Contributions

Conceptualization, K.H. and M.D.; formal analysis, K.H., L.B., P.S.K., M.D. and M.A.D.L.; funding acquisition, K.H., P.S.K. and M.A.D.L.; Methodology, K.H., M.D. and M.A.D.L.; project administration, K.H.; Visualization, M.D. and M.A.D.L.; writing—original draft, K.H., L.B., P.S.K., M.D. and M.A.D.L.; writing—review and editing, K.H., M.D. and M.A.D.L. All authors have read and agreed to the published version of the manuscript.

Funding

The research for this paper was supported by the MARCO project (grant agreement no. 730272) funded by the Horizon 2020 EU research program.

Data Availability Statement

Quantitative data used in this study have been obtained from the sources of [25,26,27,28,29,30,39,59,60] and qualitative data on the CS supply chain are from the sources of [6,7,18,19,21,41,42,43,44,45].

Conflicts of Interest

The authors declare no conflict of interest.

References

  1. United Nations. Paris Agreement; United Nations: New York, NY, USA, 2016; Volume 55. [Google Scholar]
  2. Klima og Energiministeriet. National Action Plan for Renewable Energy in Denmark; Klima og Energiministeriet: Copenhagen, Denmark, 2010.
  3. Regeringskansliet. The Swedish National Action Plan for the Promotion of the Use of Renewable Energy; Regeringskansliet: Stockholm, Sweden, 2010.
  4. Ministry of Employment and the Economy Energy Department. Finland’s National Action Plan for Promoting Energy from Renewable Sources Pursuant to Directive 2009/28/EC; Ministry of Employment and the Economy Energy Department: Helsinki, Finland, 2010; Volume 9.
  5. Ministry of Petroleum and Energy. National Renewable Energy Action Plan under Directive 2009/28/EC Norway; Ministry of Petroleum and Energy: Oslo, Norway, 2013.
  6. Halsnæs, K.; Bay, L.; Dømgaard, M.L.; Kaspersen, P.S.; Larsen, M.A.D. Accelerating Climate Service Development for Renewable Energy, Finance and Cities. Sustainability 2020, 12, 7540. [Google Scholar] [CrossRef]
  7. Perrels, A.; Le, T.T.; Cortekar, J.; Hoa, E.; Stegmaier, P. How much unnoticed merit is there in climate services? Clim. Serv. 2020, 17, 100153. [Google Scholar] [CrossRef]
  8. Goodess, C.M.; Troccoli, A.; Acton, C.; Añel, J.A.; Bett, P.E.; Brayshaw, D.J.; De Felice, M.; Dorling, S.R.; Dubus, L.; Penny, L.; et al. Advancing climate services for the European renewable energy sector through capacity building and user engagement. Clim. Serv. 2019, 16, 100139. [Google Scholar] [CrossRef]
  9. Larsen, M.A.D.; Petrovic, S.; Engström, R.E.; Drews, M.; Liersch, S.; Karlsson, K.B.; Howells, M. Challenges of data availability: Analysing the water-energy nexus in electricity generation. Energy Strategy Rev. 2019, 26, 100426. [Google Scholar] [CrossRef]
  10. Kilpeläinen, S. Developing nordic cooperation in renewable electricity policy: Exploring views from Finland and Sweden. Soc. Incl. 2020, 8, 44–52. [Google Scholar] [CrossRef]
  11. Sovacool, B.K. Contestation, contingency, and justice in the Nordic low-carbon energy transition. Energy Policy 2017, 102, 569–582. [Google Scholar] [CrossRef]
  12. OECD. Energy Statistics of OECD Countries 2015; Energy Statistics of OECD Countries; OECD: Paris, France, 2015. [Google Scholar]
  13. Chernet, H.H.; Alfredsen, K.; Killingtveit, Å. The impacts of climate change on a Norwegian high-head hydropower system. J. Water Clim. Chang. 2013, 4, 17–37. [Google Scholar] [CrossRef]
  14. Gimbergson, L. Hydropower in a Future Climate; Copernicus Symposium on Climate Services for the Energy Sector: Barcelona, Spain, 2017. [Google Scholar]
  15. Thorsteinsson, T.; Björnsson, H. Climate Change and Energy Systems—Impacts, Risks and Adaptation in the Nordic and Baltic Countries; Nordic Council of Ministers: Copenhagen, Denmark, 2012. [Google Scholar]
  16. Orlowsky, B.; Seneviratne, S.I.; Orlowsky, B.; Seneviratne, S.I. Global changes in extreme events: Regional and seasonal dimension. Clim. Chang. 2012, 110, 669–696. [Google Scholar] [CrossRef] [Green Version]
  17. IPCC. Climate Change 2014: Mitigation of Climate Change; Cambridge University Press: Cambridge, UK; New York, NY, USA, 2014; ISBN 9781107654815. [Google Scholar]
  18. Füss, R.; Mahringer, S.; Prokopczuk, M. Electricity derivatives pricing with forward-looking information. J. Econ. Dyn. Control 2015, 58, 34–57. [Google Scholar] [CrossRef] [Green Version]
  19. Troccoli, A. Weather and Climate Services for the Energy Industry; Springer International Publishing: Berlin/Heidelberg, Germany, 2018; ISBN 9783319684185. [Google Scholar]
  20. Larsen, M.A.D.; Karamitilios, G.; Halsnæs, K.; She, J.; Madsen, K.S. Advancing future multi-sectorial climate services by mapping current usage and demand. Clim. Risk Manag. in review.
  21. Buontempo, C.; Hanlon, H.M.; Bruno Soares, M.; Christel, I.; Soubeyroux, J.M.; Viel, C.; Calmanti, S.; Bosi, L.; Falloon, P.; Palin, E.J.; et al. What have we learnt from EUPORIAS climate service prototypes? Clim. Serv. 2018, 9, 21–32. [Google Scholar] [CrossRef]
  22. Dessai, S.; Bruno Soares, M. Report Summarising Users’ Needs for S2D Predictions. EUPORIAS (European Provision of Regional Impact Assessment Ona Seasonal-To-Decadal Timescale) Deliverable D12.3. EUPORIAS Project Report. 2015. Available online: https://www.researchgate.net/profile/Marta-Bruno-Soares/publication/281776420_Final_report_summarising_the_users%27_needs_for_seasonal_to_decadal_climate_predictions_in_Europe/links/55f7f53608aeba1d9f008090/Final-report-summarising-the-users-needs-for-seasonal-to-decadal-climate-predictions-in-Europe.pdf (accessed on 22 September 2020).
  23. MARCO. MARCO—MArket Research for a Climate Services Observatory. Available online: http://marco-h2020.eu/ (accessed on 25 January 2021).
  24. IEA Statistics. Available online: https://www.iea.org/statistics/ (accessed on 15 October 2019).
  25. Nord Pool Hydro Reservoir Data|Nord Pool. Available online: https://www.nordpoolgroup.com/Market-data1/Power-system-data/hydro-reservoir1/ALL/Hourly/?view=table (accessed on 27 November 2020).
  26. Nord Pool Production Data|Nord Pool. Available online: https://www.nordpoolgroup.com/Market-data1/Power-system-data/Production1/Production1/ALL1/Hourly1/?view=table (accessed on 27 November 2020).
  27. Nord Pool Consumption Data|Nord Pool. Available online: https://www.nordpoolgroup.com/Market-data1/Power-system-data/Consumption1/Consumption/ALL/Hourly1/?view=table (accessed on 27 November 2020).
  28. Norges Vassdrags- og Energidirektorat. Utvalg av Tilsigsserier til Samkjøringsmodellen; Erik Holmqvist og Inger Karin Engen: Oslo, Norway, 2008. [Google Scholar]
  29. European Commission. EU Reference Scenario 2016; European Commission: Brussels, Belgium, 2016; ISBN 978-92-79-52373-1. [Google Scholar]
  30. European Commission. Technical Note Results of the EUCO3232.5 Scenario; Commission: Brussels, Belgium, 2018. [Google Scholar]
  31. Larsen, M.A.D.; Drews, M. Water use in electricity generation for water-energy nexus analyses: The European case. Sci. Total Environ. 2019, 651, 2044–2058. [Google Scholar] [CrossRef]
  32. Hadian, S.; Madani, K. A system of systems approach to energy sustainability assessment: Are all renewables really green? Ecol. Indic. 2015, 52, 194–206. [Google Scholar] [CrossRef]
  33. Drews, M.; Larsen, M.A.D.; Peña Balderrama, J.G. Projected water usage and land-use-change emissions from biomass production (2015–2050). Energy Strategy Rev. 2020, 29, 100487. [Google Scholar] [CrossRef]
  34. Nord Pool Organisation|Nord Pool. Available online: https://www.nordpoolgroup.com/About-us/organisation/ (accessed on 27 November 2020).
  35. Stattnet Elering, Litgrid Become Nord Pool Spot Shareholders|News|ERR. Available online: https://news.err.ee/110434/elering-litgrid-become-nord-pool-spot-shareholders (accessed on 27 November 2020).
  36. Energitilsynet. Overvågning Af Det Danske Engrosmarked for Elektricitet; Energitilsynet: Frederiksværk, Denmark, 2017. [Google Scholar]
  37. NordREG. Nordic Market Report 2014—Development in the Nordic Electricity Market Nordic Market Report; NordREG: Eskilstuna, Sweden, 2014. [Google Scholar]
  38. Deng, S.J.; Oren, S.S. Electricity derivatives and risk management. Energy 2006, 31, 940–953. [Google Scholar] [CrossRef]
  39. IEA Data & Statistics—IEA. Available online: https://www.iea.org/data-and-statistics (accessed on 11 December 2019).
  40. Webber, M.E. Water for Electricity Generation in the United States. In Competition for Water Resources: Experiences and Management Approaches in the US and Europe; Elsevier Inc.: Amsterdam, The Netherlands, 2017; pp. 212–232. ISBN 9780128032381. [Google Scholar]
  41. Bruno Soares, M.; Daly, M.; Dessai, S. Assessing the value of seasonal climate forecasts for decision-making. Wiley Interdiscip. Rev. Clim. Chang. 2018, 9, e523. [Google Scholar] [CrossRef] [Green Version]
  42. EUPORIAS Project. Report Summarising Users’ Needs for S2D Predictions. EUPORIAS Project Report. 2015. Available online: https://www.researchgate.net/profile/Marta-Bruno-Soares/publication/281776420_Final_report_summarising_the_users%27_needs_for_seasonal_to_decadal_climate_predictions_in_Europe/links/55f7f53608aeba1d9f008090/Final-report-summarising-the-users-needs-for-seasonal-to-decadal-climate-predictions-in-Europe.pdf (accessed on 22 September 2020).
  43. Bay, L.; Halsnæs, K. Report on Forecast Approaches, Robustness and Uncertainties Associated with Short and Long Term Forecast. H2020 MARCO Project D6.3; MARCO Project Report. 2018. Available online: http://marco-h2020.eu/wp-content/uploads/2020/01/MARCO_D6_3_Report_on_Forecast_Approaches_Robustness_and_Uncertainties_Associated_With_Short_and_Long_Term_Forecast.pdf (accessed on 22 September 2020).
  44. Lamich, K. MARCO—Demand-Supply Gap Analysis Report. MARCO Project Report. 2018. Available online: http://marco-h2020.eu/wp-content/uploads/2020/01/MARCO_D2_5_Demand_Supply_Gap_Analysis_Report.pdf (accessed on 22 September 2020).
  45. Danish Commodities. Challenge Compete Repeat; Danish Commodities: Aarhus, Denmark, 2016. [Google Scholar]
  46. Orlov, A.; Sillmann, J.; Vigo, I. Better seasonal forecasts for the renewable energy industry. Nat. Energy 2020, 5, 108–110. [Google Scholar] [CrossRef]
  47. Golombek, R.; Kittelsen, S.A.C.; Haddeland, I. Climate change: Impacts on electricity markets in Western Europe. Clim. Chang. 2012, 113, 357–370. [Google Scholar] [CrossRef] [Green Version]
  48. Larsen, M.A.D.; Petrovic, S.; Radoszynski, A.M.; McKenna, R.; Balyk, O. Climate change impacts on trends and extremes in future heating and cooling demands over Europe. Energy Build. 2020. [Google Scholar] [CrossRef]
  49. Lemaître, O. Meteorology, Climate and Energy. In Management of Weather and Climate Risk in the Energy Industry; Springer: Berlin/Heidelberg, Germany, 2010; pp. 51–65. [Google Scholar]
  50. Tart, S.; Bay, L.; Kristensen, F.B.; Nielsen, L.L.; Rycerz, A.L.; Seipold, P. Segmented Qualitative Analysis of Market Demand & Users Needs. MARCO Project Report. 2018. Available online: http://marco-h2020.eu/wp-content/uploads/2020/01/MARCO_D4_6__Segmented_qualitative_analysis_of_market_demand_users_needs.pdf (accessed on 22 September 2020).
  51. ENTSO-E Statistical Database. Available online: https://www.entsoe.eu/data/data-portal/Pages/default.aspx (accessed on 17 May 2018).
  52. Olsson, J.; Uvo, C.B.; Foster, K.; Yang, W. Technical Note: Initial assessment of a multi-method approach to spring-flood forecasting in Sweden. Hydrol. Earth Syst. Sci. 2016, 20, 659–667. [Google Scholar] [CrossRef] [Green Version]
  53. Matte, D.; Larsen, M.A.D.; Christensen, O.B.; Christensen, J.H. Robustness and scalability of regional climate projections over Europe. Front. Environ. Sci. 2019, 6, 163. [Google Scholar] [CrossRef]
  54. Christensen, J.H.; Larsen, M.A.D.; Christensen, O.B.; Drews, M.; Stendel, M. Robustness of European climate projections from dynamical downscaling. Clim. Dyn. 2019. [Google Scholar] [CrossRef] [Green Version]
  55. Copernicus Homepage|Copernicus. Available online: https://climate.copernicus.eu/ (accessed on 22 September 2020).
  56. Larsen, C.T.; Doorman, G.; Mo, B. Joint Modelling of Wind Power and Hydro Inflow for Power System Scheduling. In Energy Procedia; Elsevier Ltd.: Amsterdam, The Netherlands, 2016; Volume 87, pp. 189–196. [Google Scholar]
  57. Jensen, J.D.; Bolkesjø, T.F.; Sønju-Moltzau, B. Joint Use of Hydrological Modeling and Large-scale Stochastic Optimization Techniques Applied to the Nordic Power System. In Energy Procedia; Elsevier Ltd.: Amsterdam, The Netherlands, 2016; Volume 87, pp. 19–27. [Google Scholar]
  58. Nordic Energy Research. Summaries of Nordic Energy Commission Reports; Nordic Energy Research: Oslo, Norway, 2017; Volume 2014. [Google Scholar]
  59. IRENA IRENA—The International Renewable Energy Agency. Available online: http://www.irena.org/home/index.aspx?PriMenuID=12&mnu=Pri (accessed on 17 May 2018).
  60. Norsk Industri. Energy Transition—Norway 2050; Norsk Industri: Oslo, Norway, 2020. [Google Scholar]
  61. Bonjean Stanton, M.C.; Dessai, S.; Paavola, J. A systematic review of the impacts of climate variability and change on electricity systems in Europe. Energy 2016, 109, 1148–1159. [Google Scholar] [CrossRef] [Green Version]
  62. Pinson, P. Wind energy: Forecasting challenges for its operational management. Stat. Sci. 2013, 28, 564–585. [Google Scholar] [CrossRef] [Green Version]
  63. Liu, H.; Chen, C. Data processing strategies in wind energy forecasting models and applications: A comprehensive review. Appl. Energy 2019, 249, 392–408. [Google Scholar] [CrossRef]
  64. Okumus, I.; Dinler, A. Current status of wind energy forecasting and a hybrid method for hourly predictions. Energy Convers. Manag. 2016, 123, 362–371. [Google Scholar] [CrossRef]
  65. Hall, M.; Dohler, S. Vattenfall Full Year Results 2016. In Vattenfall Press Conference 7 February 2017; Vattenfall: Solna Municipality, Sweden, 2017. [Google Scholar]
  66. Torralba, V.; Doblas-Reyes, F.J.; MacLeod, D.; Christel, I.; Davis, M. Seasonal climate prediction: A new source of information for the management of wind energy resources. J. Appl. Meteorol. Climatol. 2017, 56, 1231–1247. [Google Scholar] [CrossRef]
Figure 1. 2019 electricity generation by source in the Nord Pool market (Nordic and Baltic countries). Based on data from [39].
Climate 09 00046 g001
Figure 2. Hydro reservoir production levels (GWh) in the Nordic countries (2013–2020). Source: based on data from [25].
Climate 09 00046 g002
Figure 3. Variation in weekly wind power electricity production (% of annual mean) on the Nord Pool market [26] from 2013–2020 between years, with years mentioned in text highlighted (a), for every single year (b) and yearly totals.
Climate 09 00046 g003
Figure 4. The Nordic electricity generation mix in GWh, from 2013–2015. The superimposed black line represents Nord Pool Spot market prices (EUR per MWh). Source: based on data from ENTSO-E [51] and [26].
Climate 09 00046 g004
Figure 5. Surplus/deficit of electricity production showing the entire variation between the years 2013–2020, but with 2013 and 2015 highlighted (a) (source: data from [26,27]) and Nord Pool Spot Market system prices for 2013–2020 (b) (source: data from [26]).
Climate 09 00046 g005
Figure 6. Projected electricity net generation capacities for renewable energy technologies for the Nordic and Baltic countries for the EU reference [29] and EUCO3232.5 [30] scenarios as well as the share of renewables (including biomass and waste). Note: Iceland* and Norway** were unavailable in the EU energy scenarios and therefore depicts installed electrical capacities from [59] for 2000–2019 and (for Norway**, plot b, 2020–2050) projected installed electrical capacities from [60].
Climate 09 00046 g006
Figure 7. Total yearly annual inflow (in TWh) to the Norwegian hydropower system, 1958–2019. The red full lines indicate decadal averages (e.g., 1960–1969) whereas the red dashed lines indicate the standard deviations. Source: [28].
Climate 09 00046 g007
Table 1. Parts of the supply chain with potential climate services (CS) use and needs, obtained from [6,7,18,19,21,41,42,43,44,45].
Decision-Making/
Management/Operations
Input to Forecasting ModelsCS Components
Producers of electricityProduction planning (hourly/daily/seasonal)Production capacity (time scales and geographically specific)Temperatures
Management of storage/reservoir capacity
Trade electricity short term
Trade/hedge long term (inter-annual)Reservoir capacity
Daily/hourly production from hydro/wind/solar/etc. both local/national and cross-border
Precipitation (what type (snow/rain))
Investment decisions on new production capacity
Assessment of risk from extreme events (destruction of production equipment
Adaptation to climate changeDaily/hourly consumptionPrecipitation (quantity)
Transmission System OperatorsBalancing daily/hourly demand and supply
Grid investmentsSeasonal variations in consumption (daily/hourly and geographically specific)
Climate projections
Snow melt (timing)
Risk assessment of grid operation
Adaptation to climate changeGrid capacities national and cross-borderWind
Financial market tradersBuy/sell decisions
(futures contracts/forward
contracts/other financial products)
Electricity spot pricesSolar radiation
Extreme weather events
Publisher’s Note: MDPI stays neutral with regard to jurisdictional claims in published maps and institutional affiliations.

