Abstract
Residential and commercial buildings are responsible for almost 50% of the total electricity consumption in Egypt. This percentage is expected to increase due to the global warming effect. This work deals with the cooling energy use reduction strategies for residential buildings compatible with the Egyptian market accounting for the global warming effects. A study in the Egyptian market was done to explore the best available technologies in the Egyptian market. A series of dynamic simulations were executed in each city to optimize the building envelope using the best available technologies to reduce the cooling needs. Financial, energetic and environmental factors were taken into consideration, and comparative analysis was done to assess the best alternatives. The double wall with air gap and insulation on the outside was found to be the best alternative in all the cities. Moreover, simple measures to further reduce the cooling energy need were explored, such as the usage of more efficient lighting and night ventilation. This work led to an average reduction of 40% in the cooling energy needs and CO2 emissions across the three cities, with a maximum discounted payback period down to 6.3 years. Future weather files adapted to climate change were generated, and the selected passive strategies were tested to assess the validity of such strategies in the future. The cooling energy needs are expected to increase by 39%, while the peak cooling loads are also expected to increase by 23% by 2080, rendering the current installed HVAC systems undersized.
1. Introduction
Egypt has been known to mainly depend, in all its energy-related activities, on three major sources: oil, natural gas and the hydroelectric power generated from the large dam project over the Nile: The High Dam [1]. Despite being a major producer and net exporter of oil, especially in the 1990s, when its oil production peaked, reaching approximately over 900,000 barrels per day, Egypt became a net oil importer around 2009/2010. This can be traced back to both economic and population accelerated growth, which accompanied the beginning of the new millennium, leading to an increase in consumption by about 3% per year, resulting in growing of demand and falling in production that could roughly meet consumption requirements [2].
According to the New and Renewable Energy Authority’s (NREA) 2019 annual report, Egypt has set a goal to generate 42% of electricity generation through renewable sources [3], and the building sector will have an essential rule, since residential and commercial buildings are responsible for almost 50% of the total electricity consumption in Egypt [4]. The building consumption is expected to increase, as it has been increasing in the last decade from 150 GWh in 2009 up to 217 GWh in 2017, due to the population growth and, consequently, the increase in the number of buildings [5], and as the external temperatures rise due to global warming effect, while maintaining the same occupants thermal comfort level [6]. Optimally the building’s energy needs would be minimized before introducing renewables sources of energy through passive strategies, as they are one of the most effective ways to reduce cooling energy needs in buildings, especially in Egypt, where the renewable energy market is not mature enough [7]. Moreover, since a sizeable portion of the building stock in Egypt is considered heritage, the passive cooling strategies are important to be considered [8].
The Mediterranean Investment facility (MIF) is a joint initiative under UN environment and the Italian Ministry for Environment Land and Sea (IMELS) with the overall objective of scaling up clean energy technologies in Egypt. One of the main goals of the project is to produce an ordinance that identifies strategies to passively reduce the cooling energy needs, according to the best available technologies (BAT) in the Egyptian market, through the analysis of the existing building stock and a best available technologies market study. The ordinance will then be tested through one demonstration project on a public building. The work presented in this paper is part of the ordinance development process dealing with envelope optimization and the effect of the global warming on the envelope choices and the HVAC sizing in the social housing in Cairo, Hurghada and Aswan.
The aim of this study was to identify the BAT in the Egyptian market for the opaque and transparent parts of the envelope for social housing and the optimal configuration of those technologies and to test the performance of those configurations against predicted weather files adapted to the global warming. Firstly, the analysis of the weather in the three cities was conducted. Afterward, the predicted weather files adapted to the global warming were generated and compared to the present. Then the case study used in the study was presented, followed by a study in the Egyptian construction market to identify the BAT that can be used in the project. A dynamic energy simulation campaign was performed with the objective of optimizing the envelope with the use of Multicriteria Decision Analysis (MCDA). The simulation campaign was then repeated with the use of the previously generated predicted future weather files for the three cities to test any possible changes in the alternatives ranking.
2. Materials and Methods
2.1. Present and Future Weather of Egypt
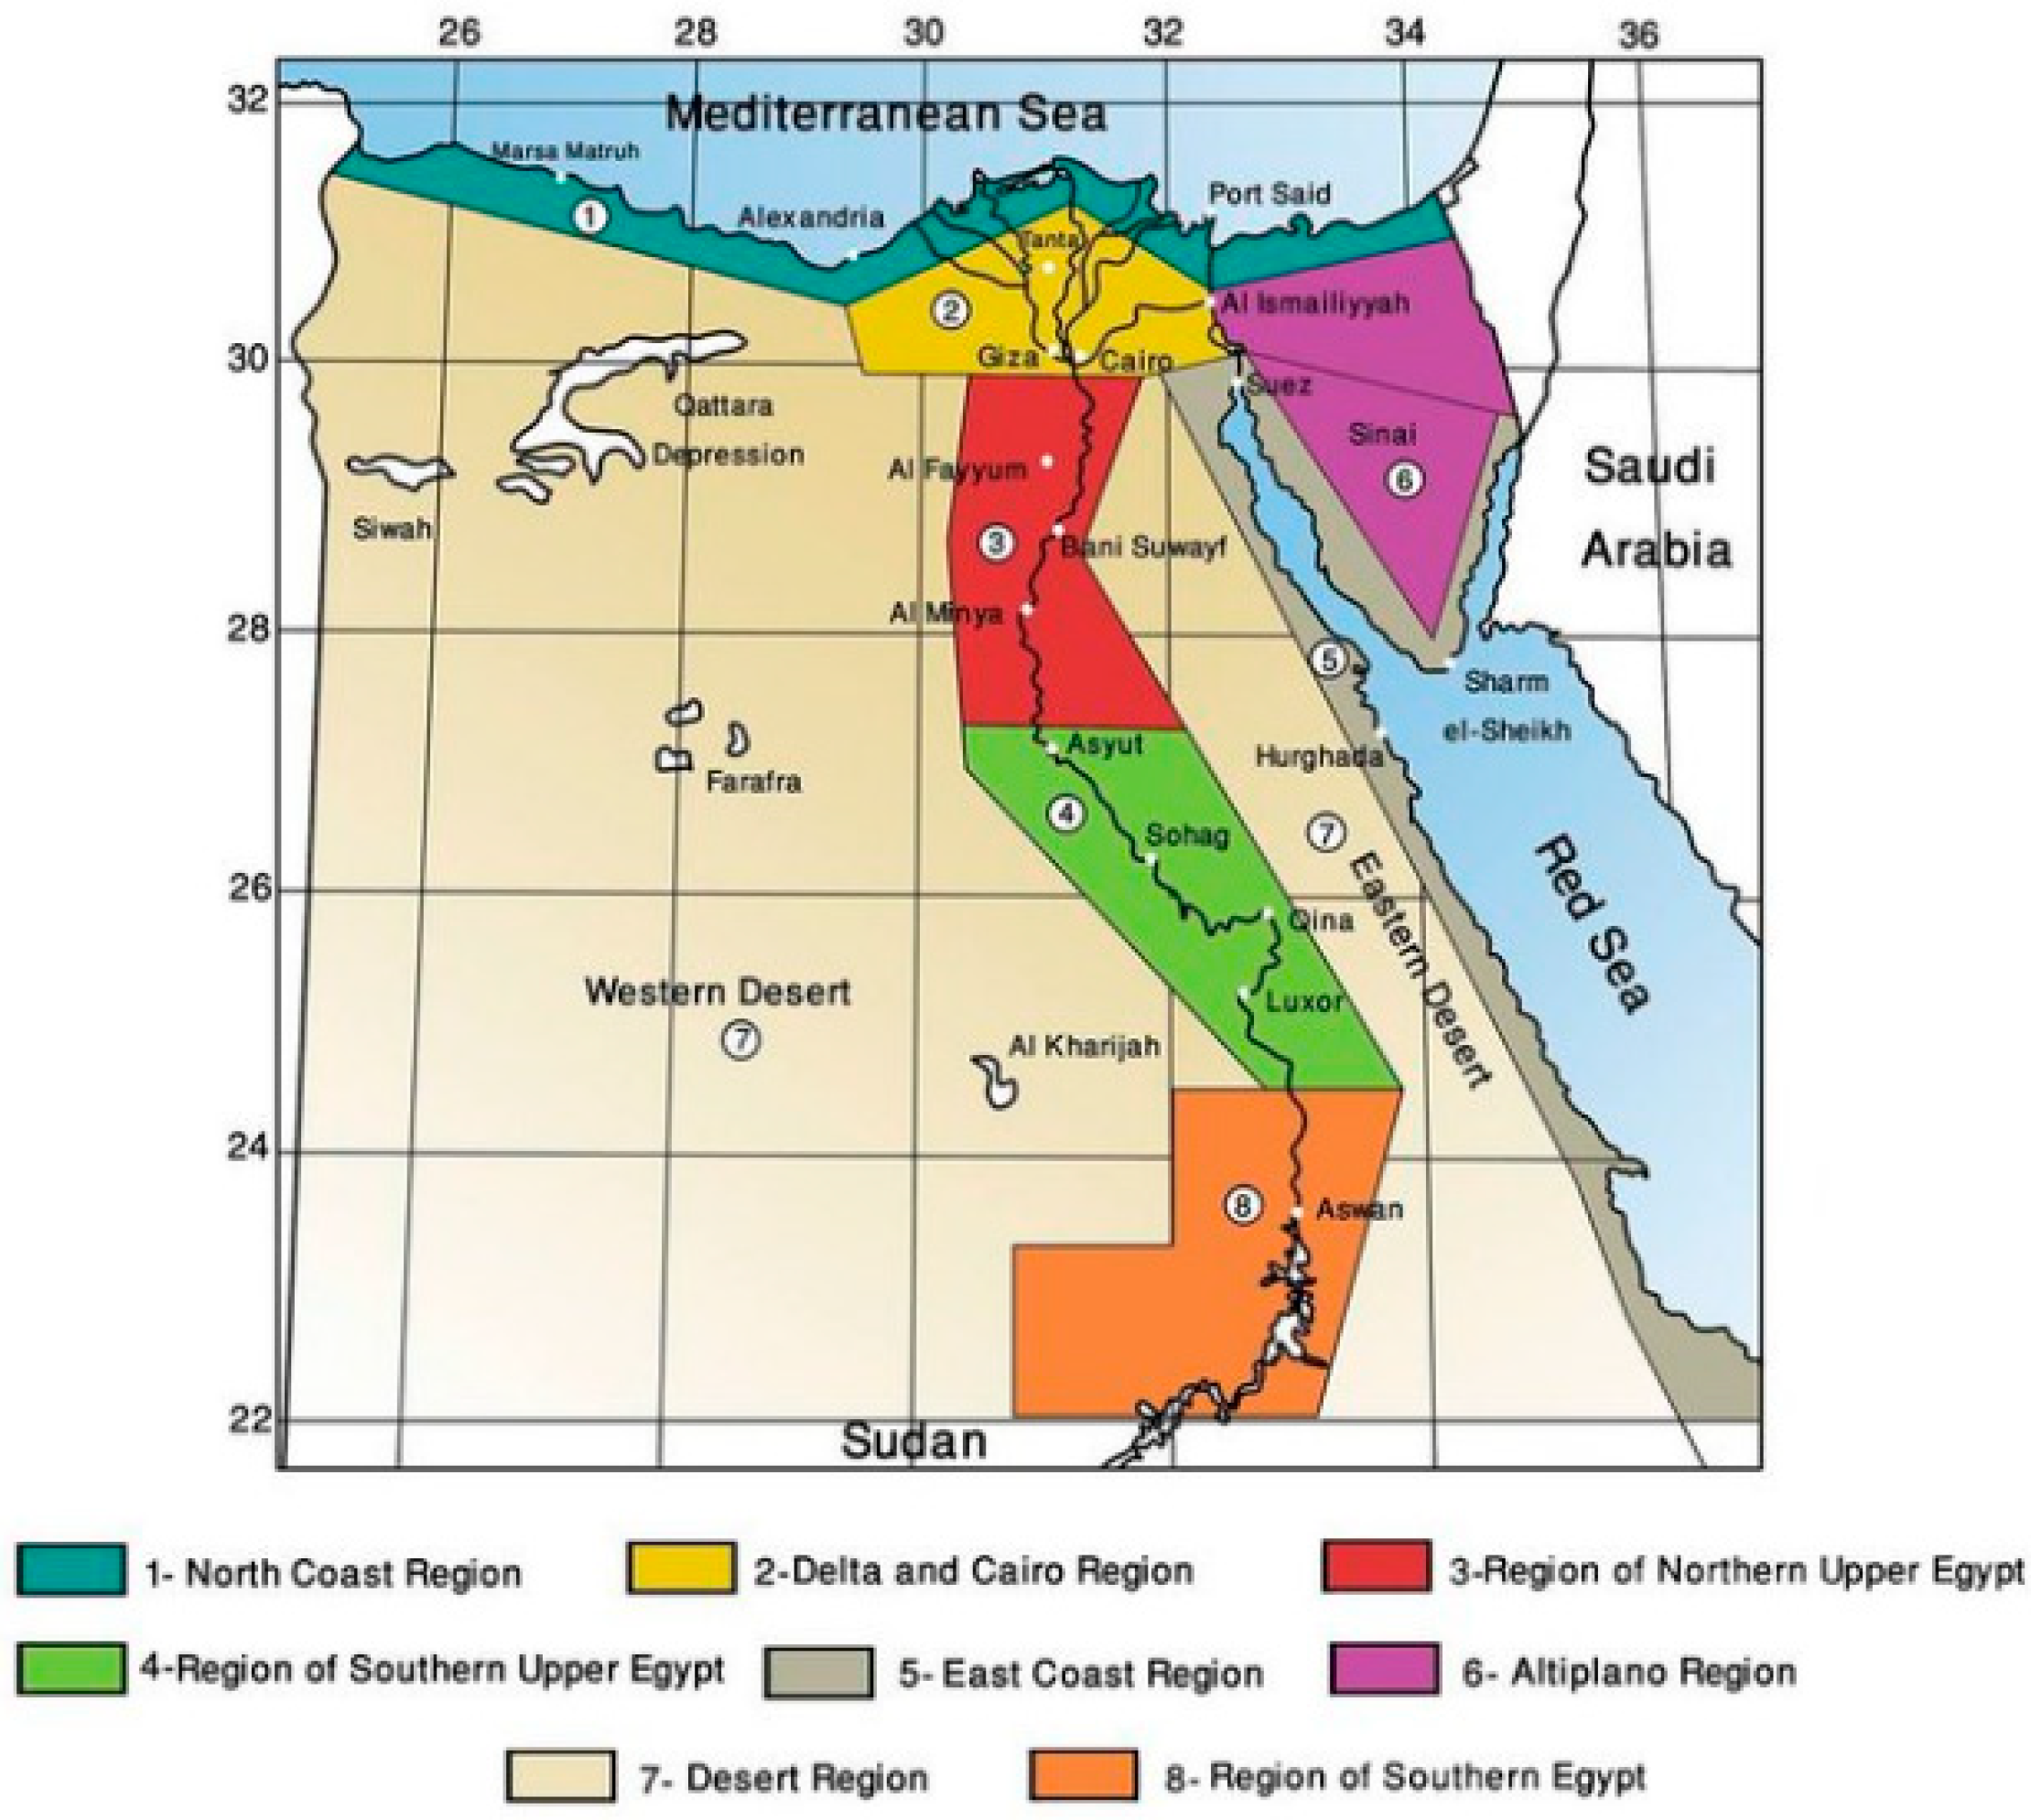
Egypt is located between 22° N to 31°37′ N latitude and 24°57′ E to 35°45′ E longitude, spreading over one million km2, leading Egypt to have a significant variation in climatic conditions. The Housing and Building Research Center (HBRC) divides the country into eight different climatic design regions, as shown in Figure 1 [9]. According to Koeppen’s climate classification [10], Egypt is classified as hot desert climate type (BWh) in the southern and central parts of Egypt and as hot steppe climate type (BSh) along the coast.
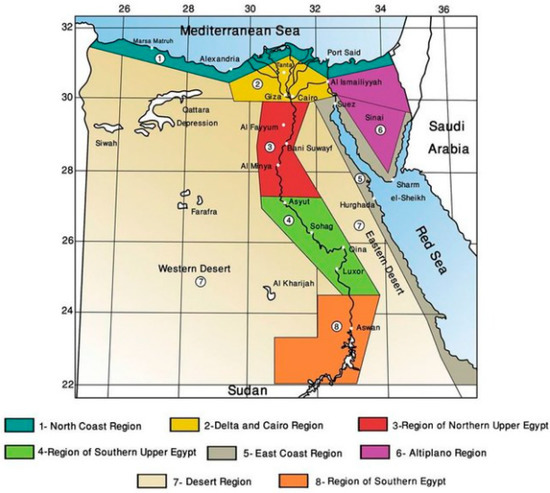
Figure 1.
Egypt weather regions according to the Housing and Building Research Center (HBRC) [9].
In this paper, analysis is performed in regions 2, 5 and 8 represented by the cities of Cairo, Hurghada and Aswan, respectively. The cites were chosen according to two factors, the location of the projects being executed by the Egyptian Ministry of Housing (MOH) and the building stock analysis, which was done to assess the built environment development in different cities, with the addition of representing three different zones according to the HBRC division. Cairo is the capital and largest city of Egypt, along the Nile River Valley, and the climate is a hot desert climate. Hurghada is a city in the Red Sea Governorate. It is one of the country’s main tourist centers located on the Red Sea coast, and Hurghada has a subtropical-desert climate—BWh—with mild to warm winters and hot to very hot summers. Aswan is a city in the south of the country and is the capital of the Aswan Governorate. It is a busy market and tourist center located just north of the Aswan Dam. Aswan has a hot desert climate—BWh—like the rest of Egypt. Aswan and Luxor have the hottest summer days of any city in Egypt. The weather analysis for the selected cities will be conducted to assess the building’s external conditions and predict the potential strategies to reduce the cooling needs.
According to the world bank report [11], the mean annual temperatures in Egypt are expected to increase by 2 to 3 °C by 2050, with warming increasing more rapidly in the interior regions. Projections of future rainfall indicate a 7% reduction in rainfall near the coast by 2050. The Special Report on Emission Scenarios (SRES), developed by the International Panel on Climate Change (IPCC), defines a family of possible emission scenarios for the next 100 years, based on economic, social, technological and environmental assumptions [12]. According to the IPCC, all SRES scenarios are considered “neutral.” None of the SRES scenarios project future disasters or catastrophes, e.g., wars and conflicts and/or environmental collapse. Scenario families contain individual scenarios with common themes. There are four main scenarios, A1, A2, B1 and B2, and then there are six subfamilies of scenarios discussed in the IPCC’s third assessment report (TAR) and fourth assessment report (AR4): A1FI, A1B, A1T, A2, B1 and B2. In this study, the A2 family will be used, which is characterized as a “high” cumulative emissions category but not the highest. In accordance with each, general circulation models (GCMs) were developed, representing physical processes in the atmosphere, ocean, cryosphere and land surface, simulating the response of the global climate system to increasing greenhouse gas concentrations [13].
Since the global warming was established as a palpable fact, and the scientific consensus is that the Earth’s climate is warming, estimating the future energy demands of buildings becomes increasingly important as a basis of energy management, investment planning and determining the feasibility of technologies and designs. To estimate those future needs for the buildings, the weather files must be adapted the climate change’s estimated effects on the climate. GCMs forecast the climate data in accordance with each emission scenario produced by the IPCC, but the data produced are at a coarse resolution (typical horizontal resolution is 300*300 km and 24 h in temporal resolution), but to assess the impact of climate change on the building performance, local weather data at a higher temporal resolution are required. Therefore, the data from the GCMs need to be “downscaled.” There are several methods for achieving the downscaling; in this study, the method called “morphing,” which was developed in [14], was used. This method is based on adjusting the present weather data by the changes to climate forecast by global circulation models. The method has several advantages, like having reliable baseline, as it is the present weather data, so the result weather sequence is likely to be metrologically consistent. The one disadvantage of this method is that the resulting weather data will have the character and variability of the present day weather data [14]. All the forecasting used was taken from the GCM developed by Hadley center (HadCM3), according to the third assessment report. The model produces a surface spatial resolution of about 417 km × 278 km, reducing to 295 × 278 km at 45 degrees north and south [15]. The morphing procedure used in this paper is explained in detail in Appendix B.
2.2. Assessing the BAT for Envelope Optimization in the Egyptian Market
A study of the construction market in Egypt was conducted to define the BAT for the opaque and the transparent part of the envelope to reduce space cooling energy consumption that can be applied in the medium standard, distinctive and social houses. With the help of the Regional Center for Renewable Energy and Energy Efficiency (RCREEE), different stakeholders and manufacturers were contacted to check the availability and get price quotes. For the external walls, the clay bricks were the dominantly used and are the only structural material that can be feasible in a large-scale project. Other types of bricks, like sand and cement bricks, are only produced in limited factories and are relatively more expensive with no noticeable advantages in the thermal properties. Thermal insulation is not typically used in the external walls; instead, it is only used in the roofs. Expanded polystyrene (EPS) is the most used, due to its adequate performance and relatively cheap price. Mineral wool insulation is starting to gain momentum in the market, but as of now, it has few distributors in the market. For the transparent part of the envelope, only single clear glazing is used in the residential buildings in Egypt. Consequently, the demand on any other type is quite low, causing a noticeable increase in the prices. All the prices shown in Appendix A.
2.3. Case Study Definition and Modelling
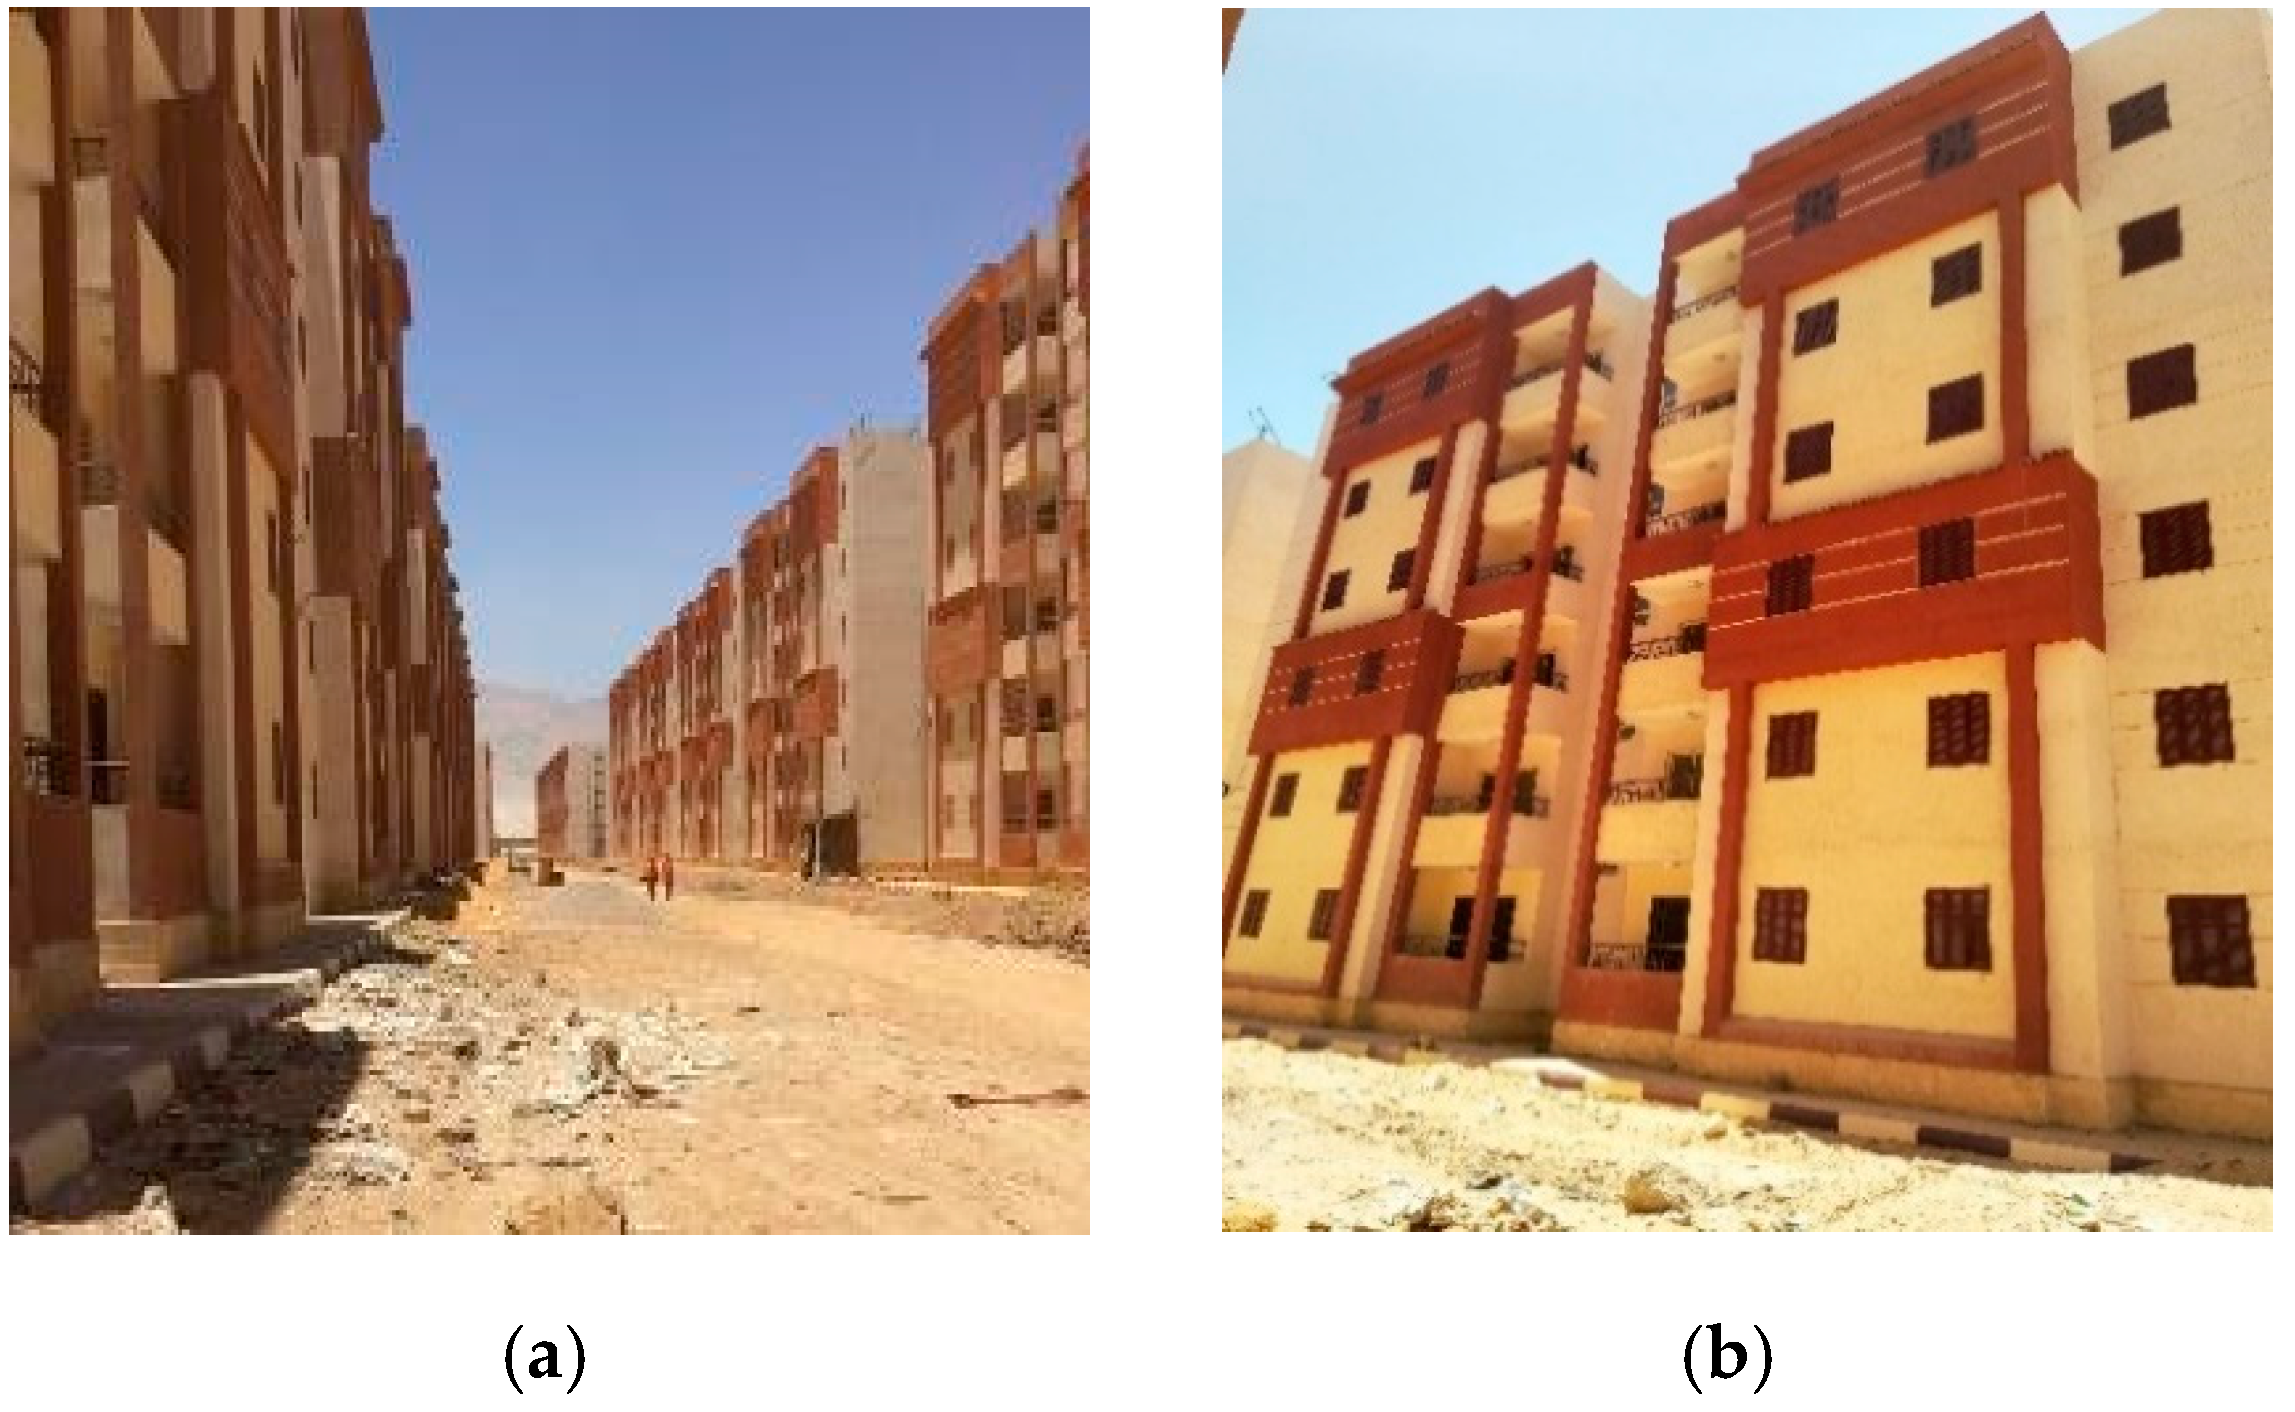
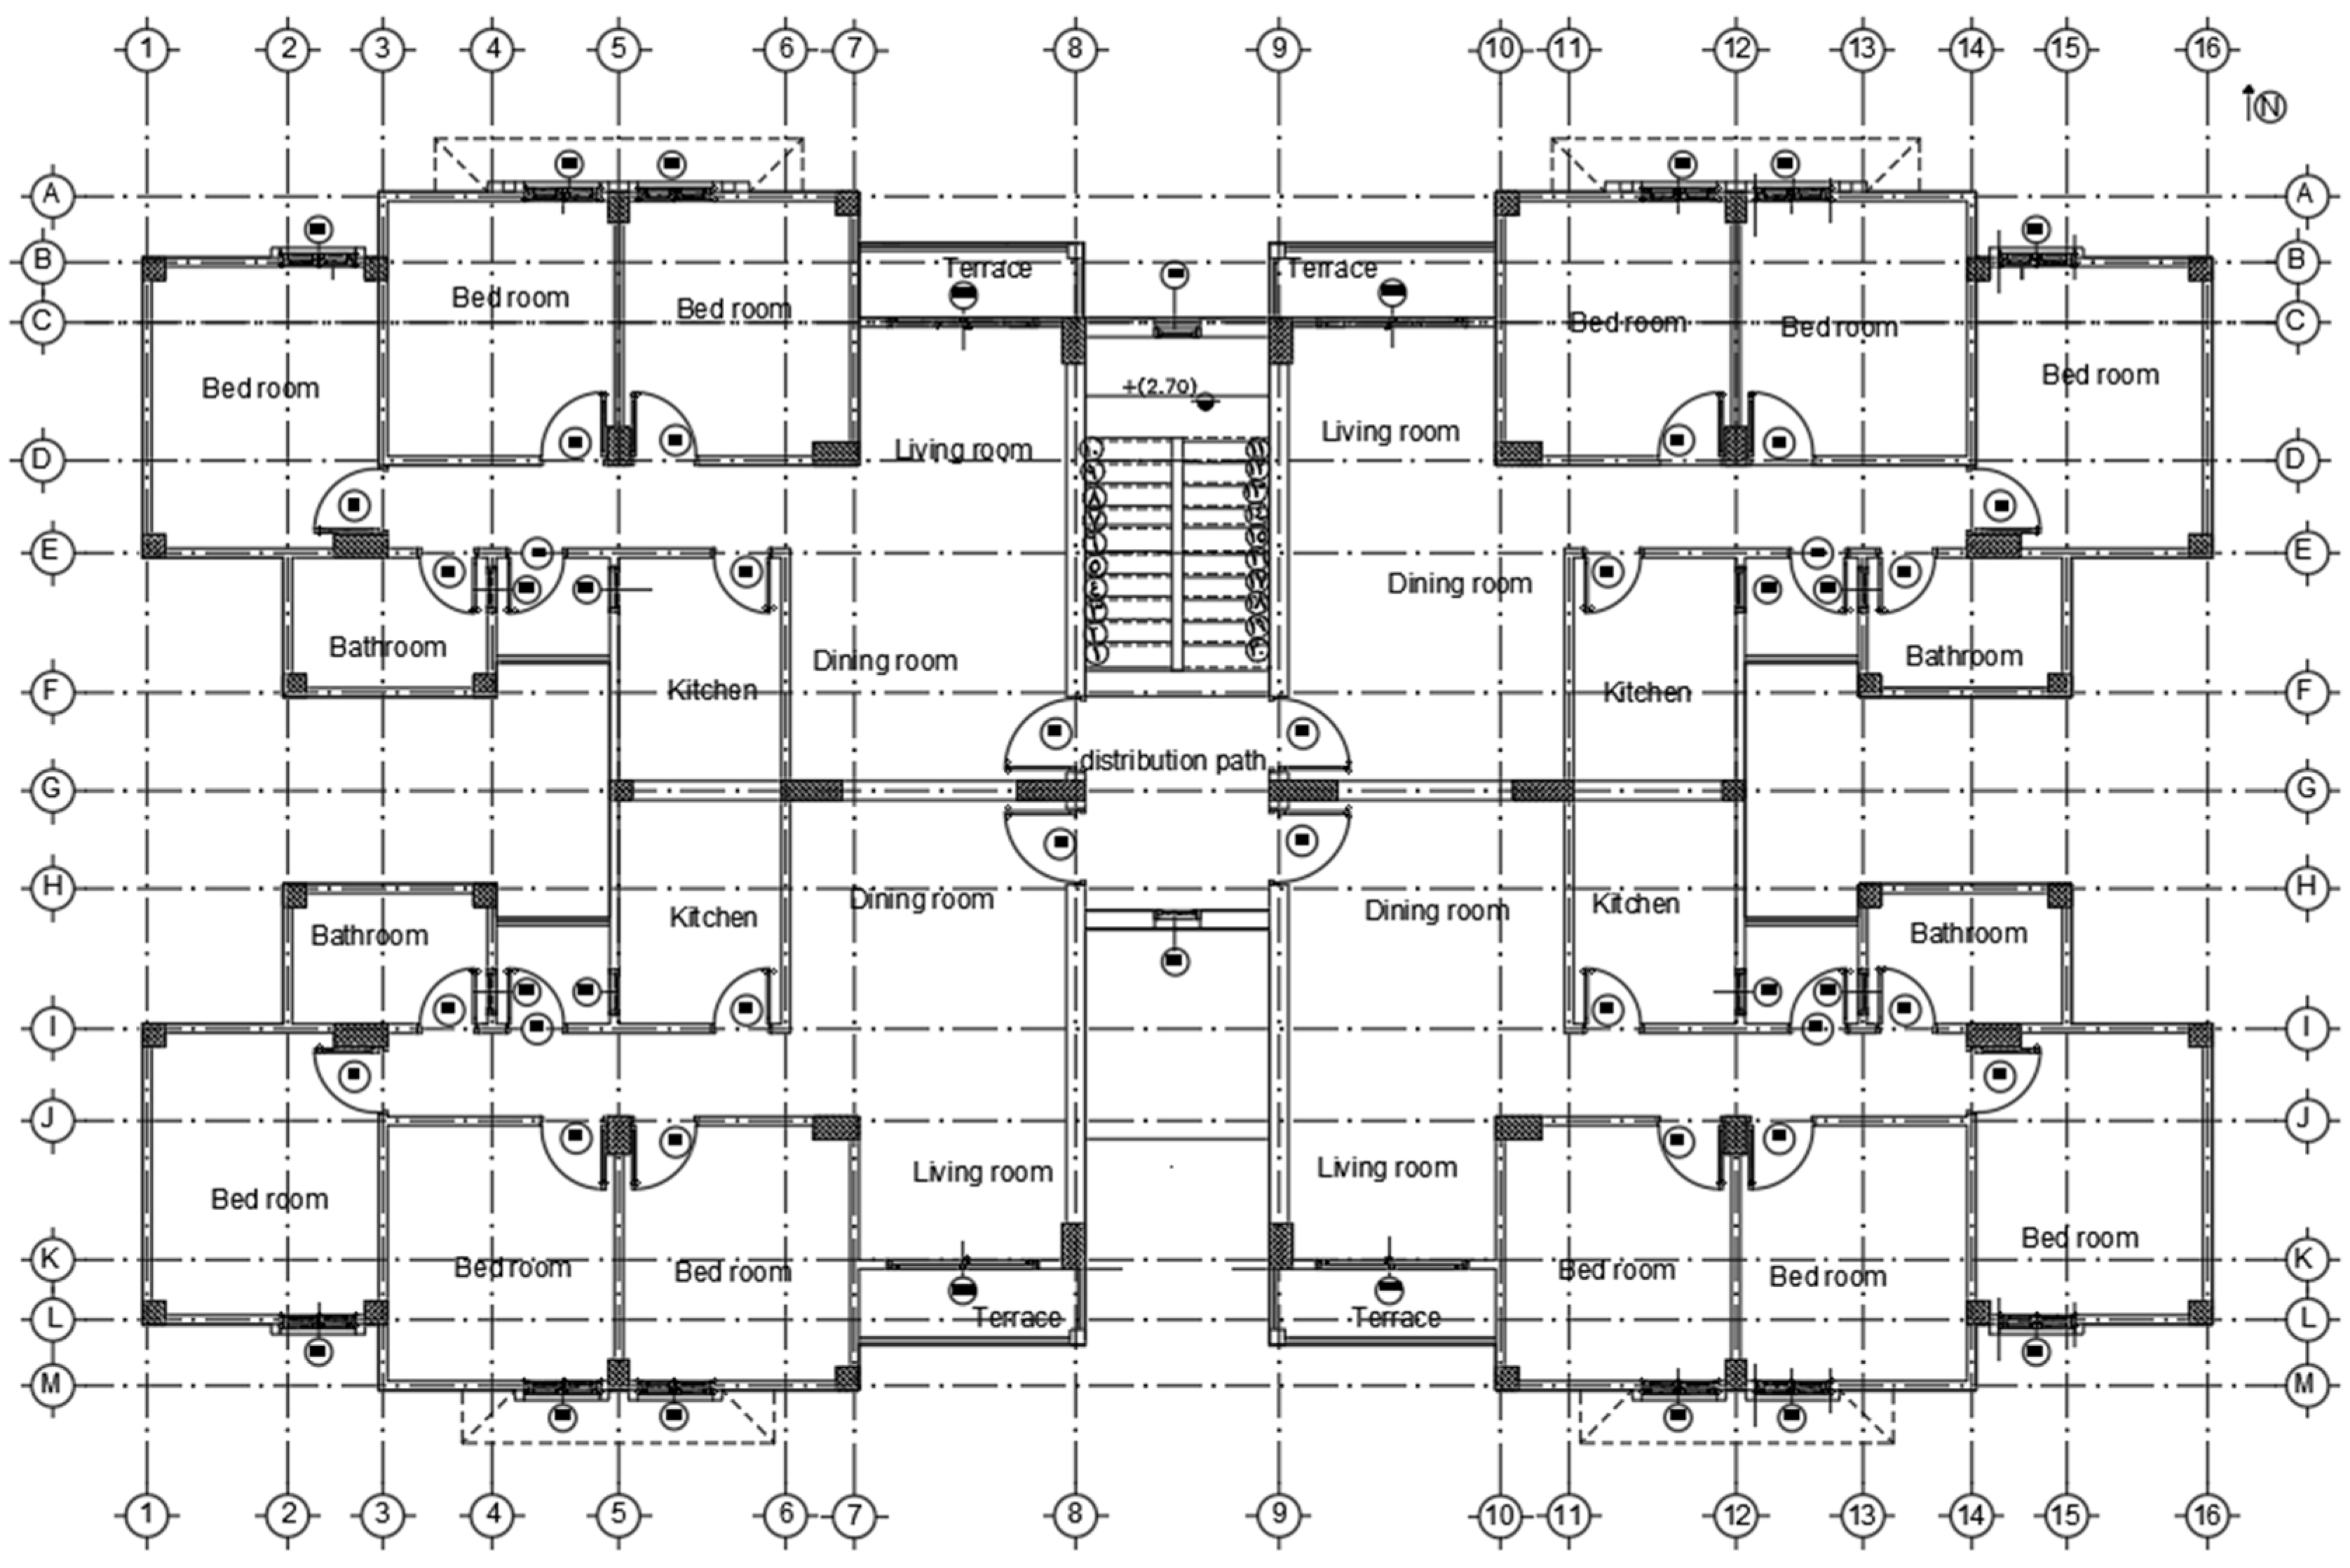
The case study is a social housing building as a part of the national social housing project “Betna,” executed by the Egyptian Ministry of Housing in several governates in Egypt. The case study baseline was modelled in IES-VE software [16], according to the information gathered in a visit to the project site The buildings consist of six floors with four apartments in each one as shown in Figure 2. Each apartment was modelled separately as an individual thermal zone. The building is almost symmetric around the horizontal and vertical axes, so only the southeast and the northwest apartments are modelled, as shown in Figure 3.
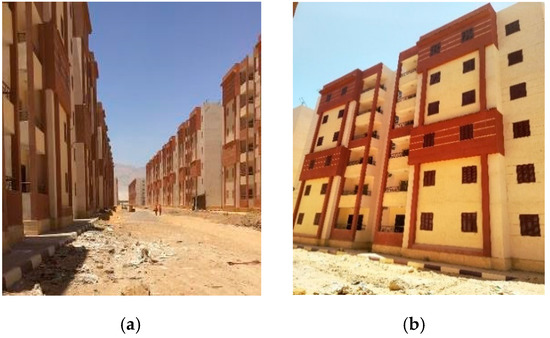
Figure 2.
Pictures from the project site; (a) A picture showing the scale of the project; (b) A picture showing the East façade of a typical building.
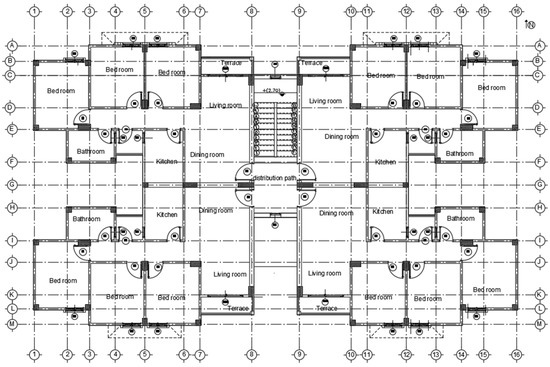
Figure 3.
Typical floor plan of the building.
The external walls of the original project (from now on, “baseline”) are single-brick walls with two layers of mortar and plaster on both sides for a thermal transmittance (U value) of 1.5 W/m2/K. All the layers of the opaque part of the envelope are shown in Table 1.

Table 1.
Thermal properties of the opaque part of the envelope.
Single glazed windows 3.2 mm thick are used with wooden frames, with a total U value of 5.013 W/m2/K The windows of the bedrooms have shutters on the outside for shading, while, in the living room, there is a balcony that acts as a horizontal overhang as shown in Table 2. The shutters are considered closed when the incident solar radiation exceeds 300 W/m2 and in the morning where there are the minimum number of occupants.

Table 2.
Thermal properties of the transparent part of the envelope.
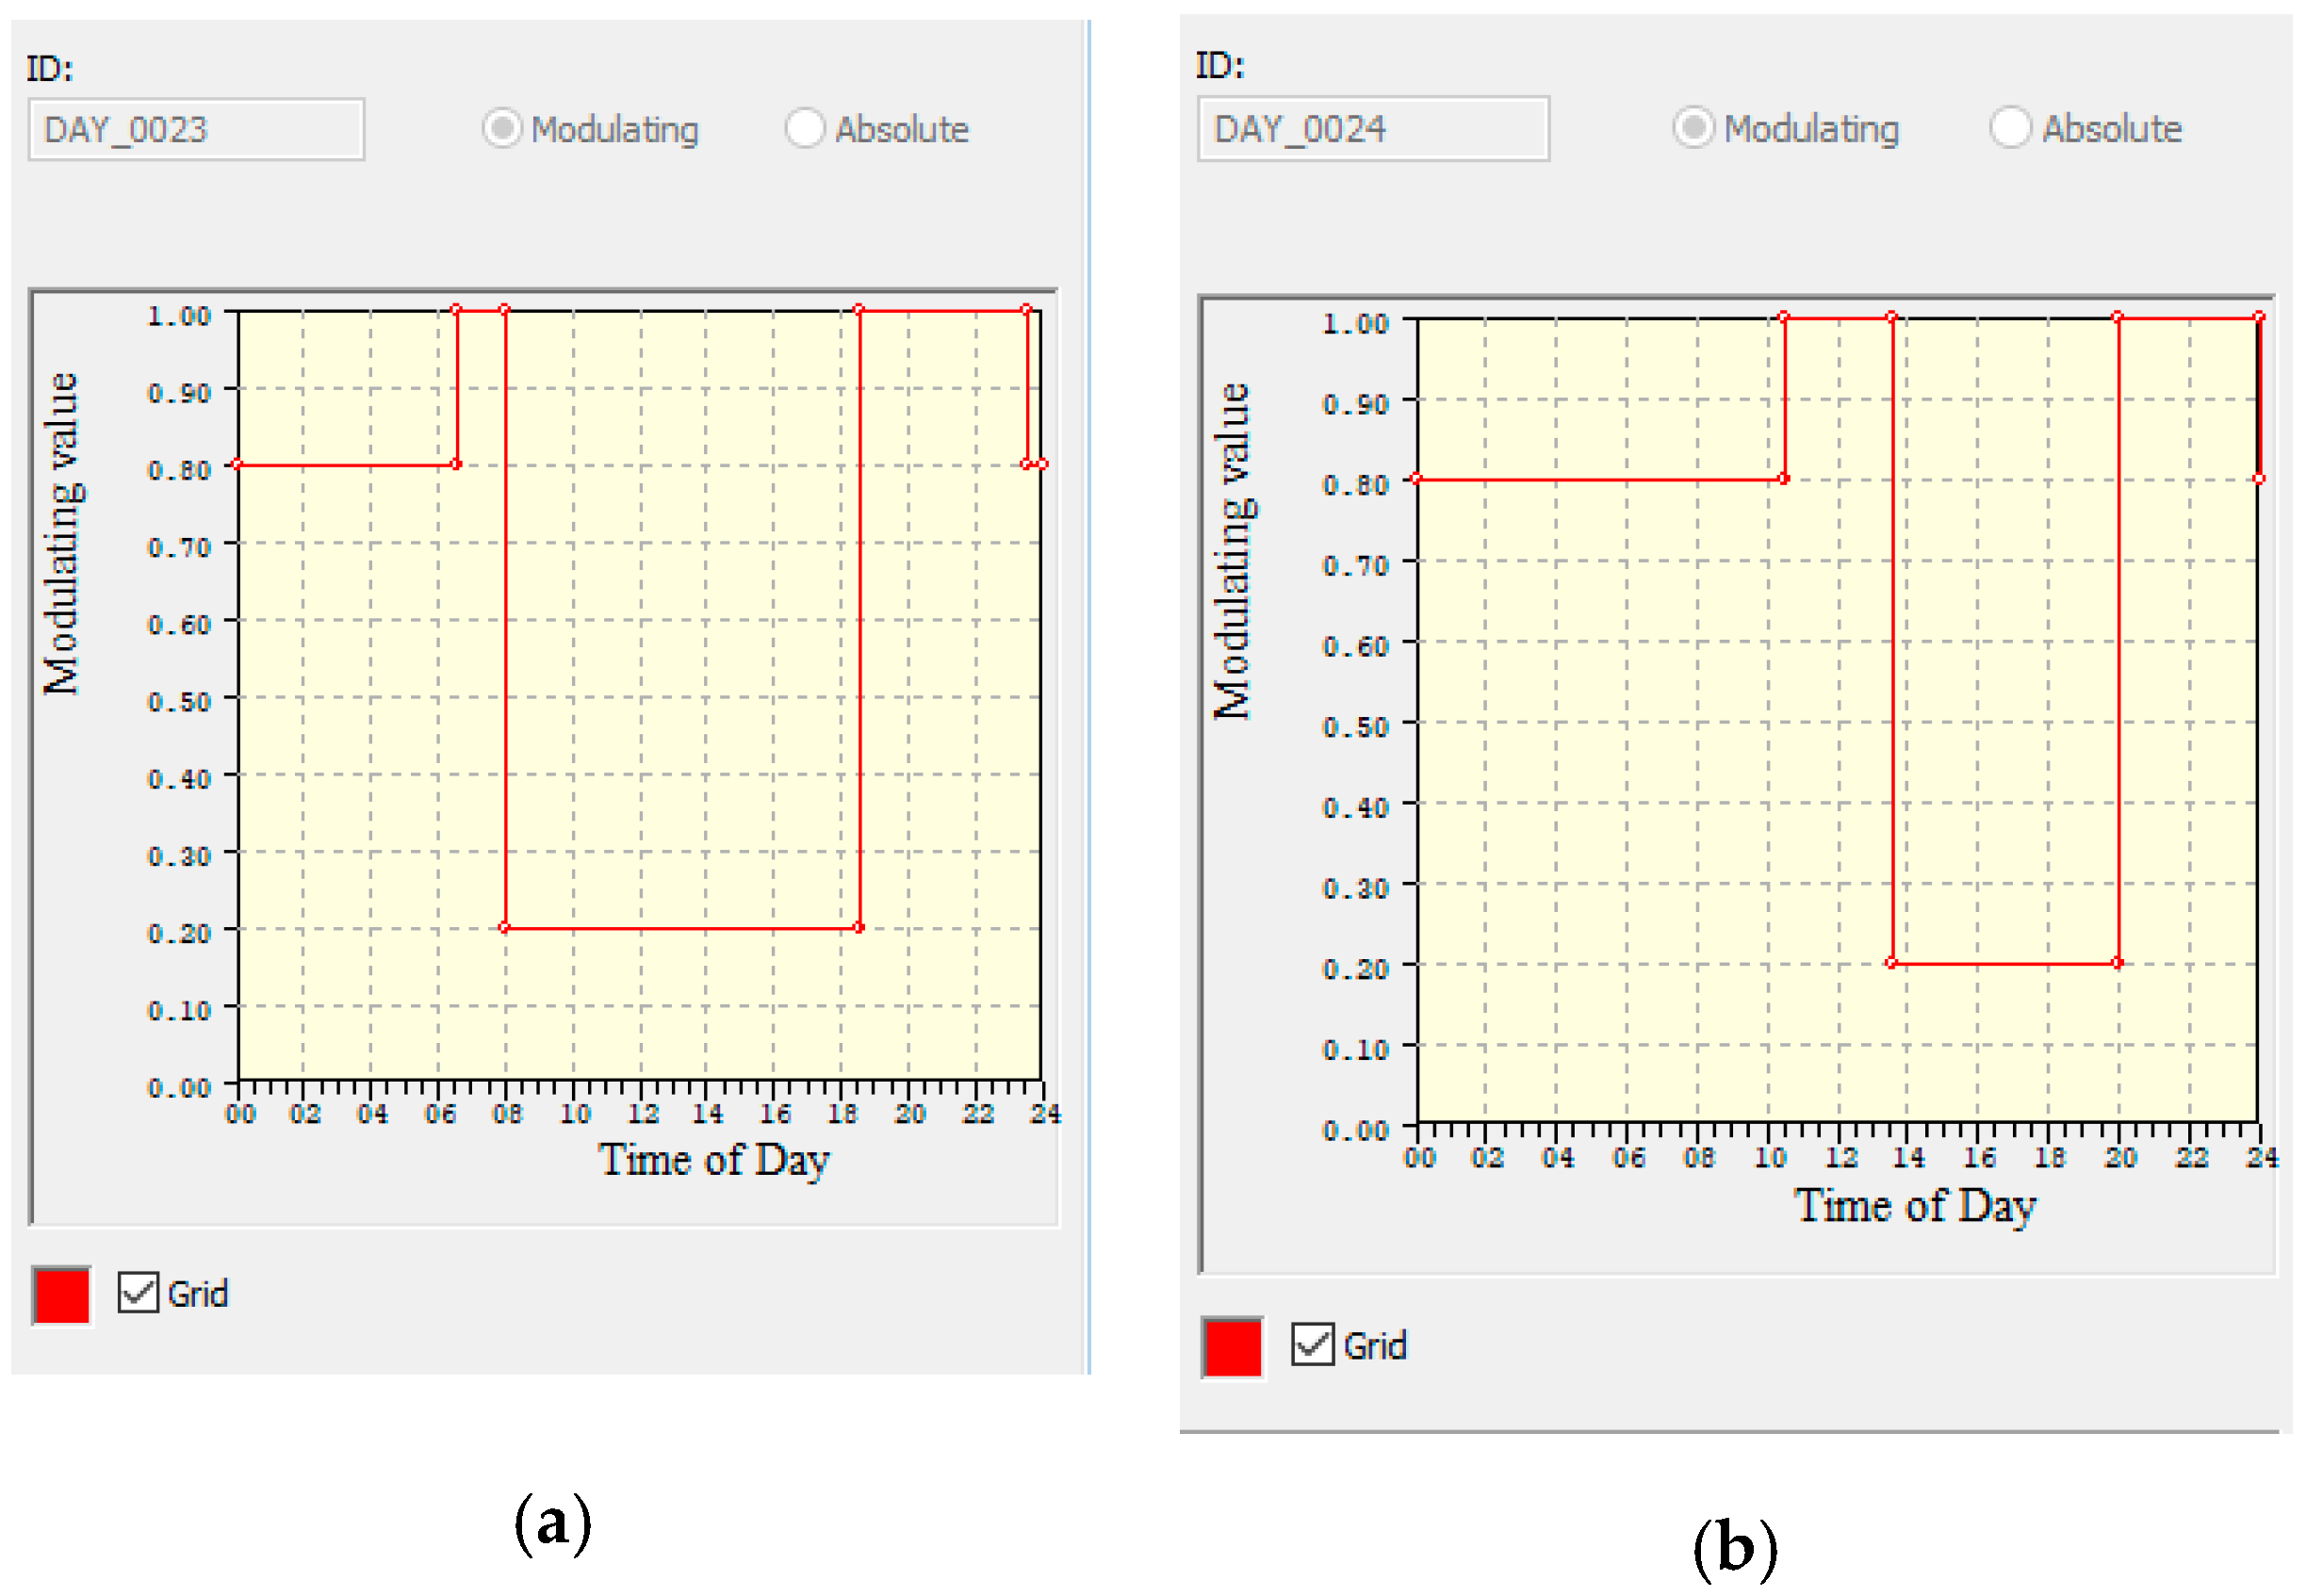
For the internal gains, five occupants are considered to live inside each apartment, each assumed to be emitting 70 W of sensible load and 45 W as latent load, according to [17]. In total, 80% of those values are assumed to be emitted while the occupants are sleeping. The occupancy schedule is taken from BS ISO 18523-2 [18]. For the weekdays, occupants are assumed to wake up at 6:30 a.m. and leave the house at 8 a.m., except for one person. The occupants get back at 6:30 p.m. and stay up until 11:30 p.m. For the weekends, the schedule is slightly changed, as shown in Figure 4.
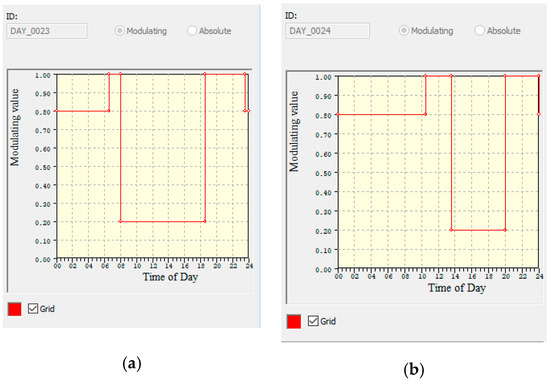
Figure 4.
The occupants schedule as inputted in IES-ve for; (a) Weekdays; (b) Weekends.
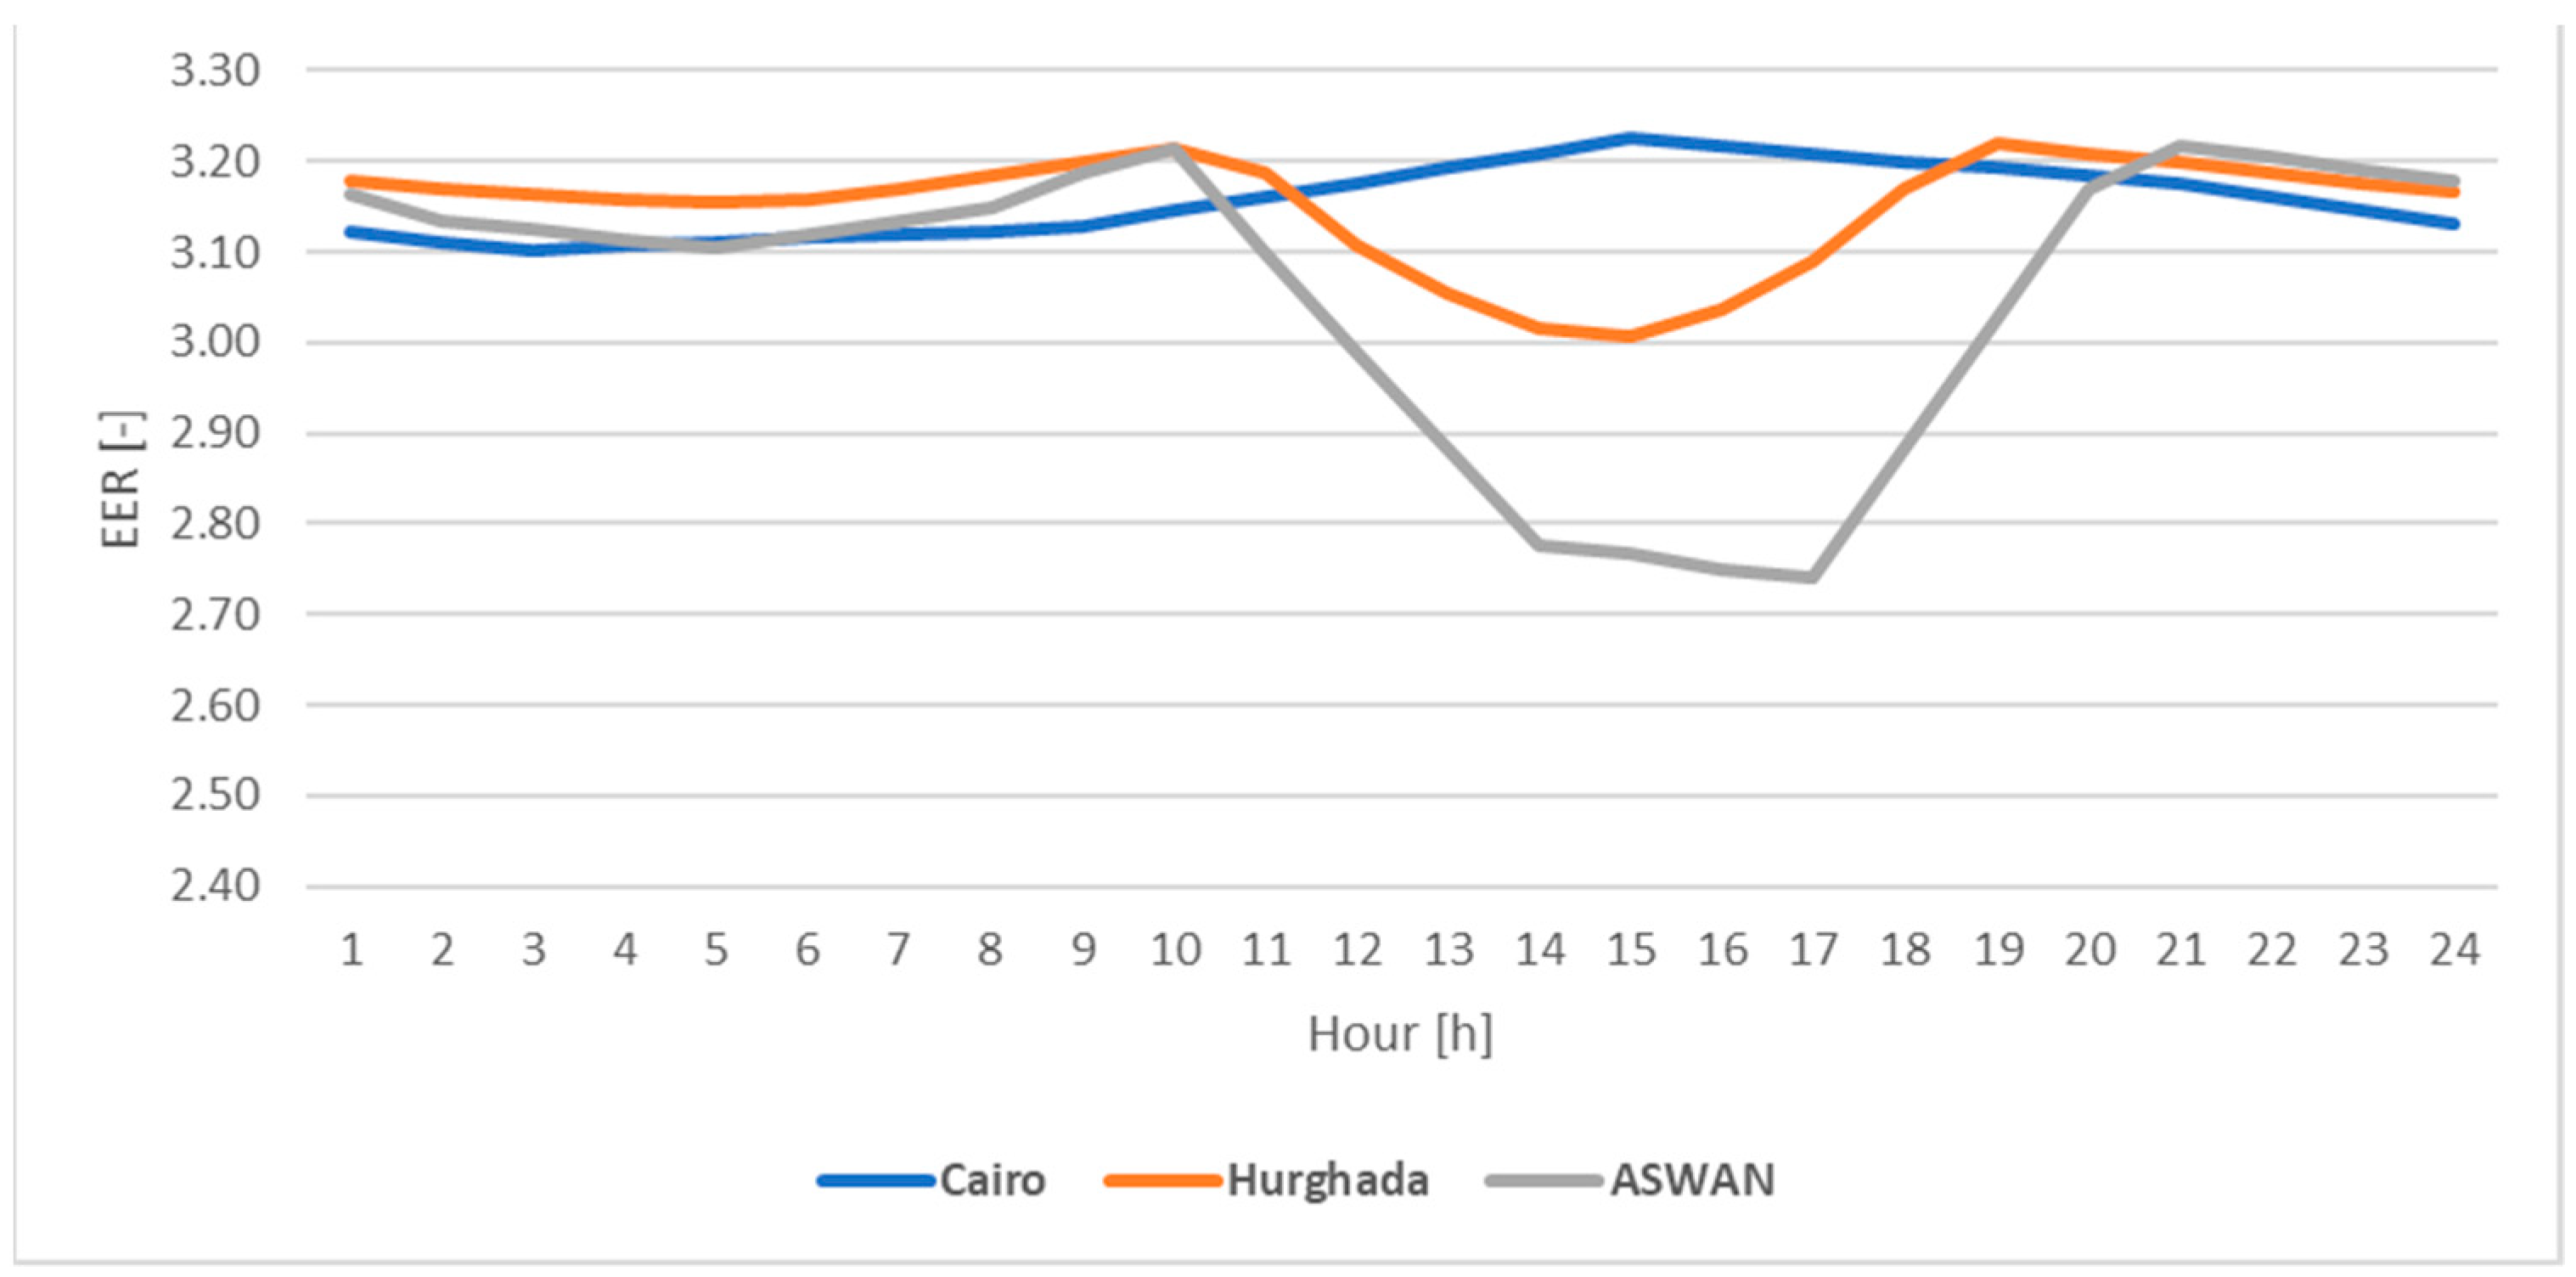
From the information collected from the construction site, each apartment has 11,100 W incandescent light bulbs, each emitting 15 W/m2, with a radiant fraction of 0.45, and 45% of the emitted gains are assumed to be radiated as long waves absorbed by the internal surfaces. The lighting schedule is assumed to be correspondent to the occupants’ schedule. The other appliances are assumed to be emitting 5 W/m2 as sensible load and 0.75 W/m2 as latent load, according to [17], and have the same lighting schedule. The infiltration rate is assumed to be 0.8 air change hour (ACH). For the HVAC system, the apartments have a set point of 25 °C for cooling and 18.3 °C, according to the Egyptian code of energy efficiency in residential buildings. The air-conditioning (AC) system is modelled as an ideal split system, considering that the energy efficiency ratio (EER) varies with the external temperatures, as shown in Figure 5 [19].
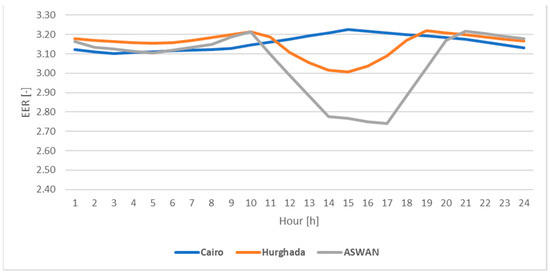
Figure 5.
Energy efficiency ratio (EER) variation throughout the 21st of August in the three cities.
2.4. Envelope Alternatives Explored and MCDA
Based on the drawings provided by the Egyptian Ministry of Housing, the building has a relatively small window-to-wall ratio (WWR) of about 10%; hence, the opaque part is the dominant component of the envelope. Unfortunately, the baseline in this building and the common practice in Egypt is to have external walls be single 25-cm clay brick walls with thermal transmittance of 1.5 W/m2/K. For the opaque part, a combination of trials consists of implementing different thicknesses of insulation and increasing the thermal mass was simulated. The materials used were in accordance with the findings of the market study. The insulation position will be only on the outside, as suggested in [7,20]. In addition, the inclusion of an air gap as a second layer of insulation was tested. All the external wall alternatives are reported in Table 3.

Table 3.
List of all the external wall alternatives.
For the transparent part, four types of glazing were considered for this study: two single-pane and two-double glazing. All the transparent part alternatives are listed in Table 4.

Table 4.
List of all the external glazing alternatives.
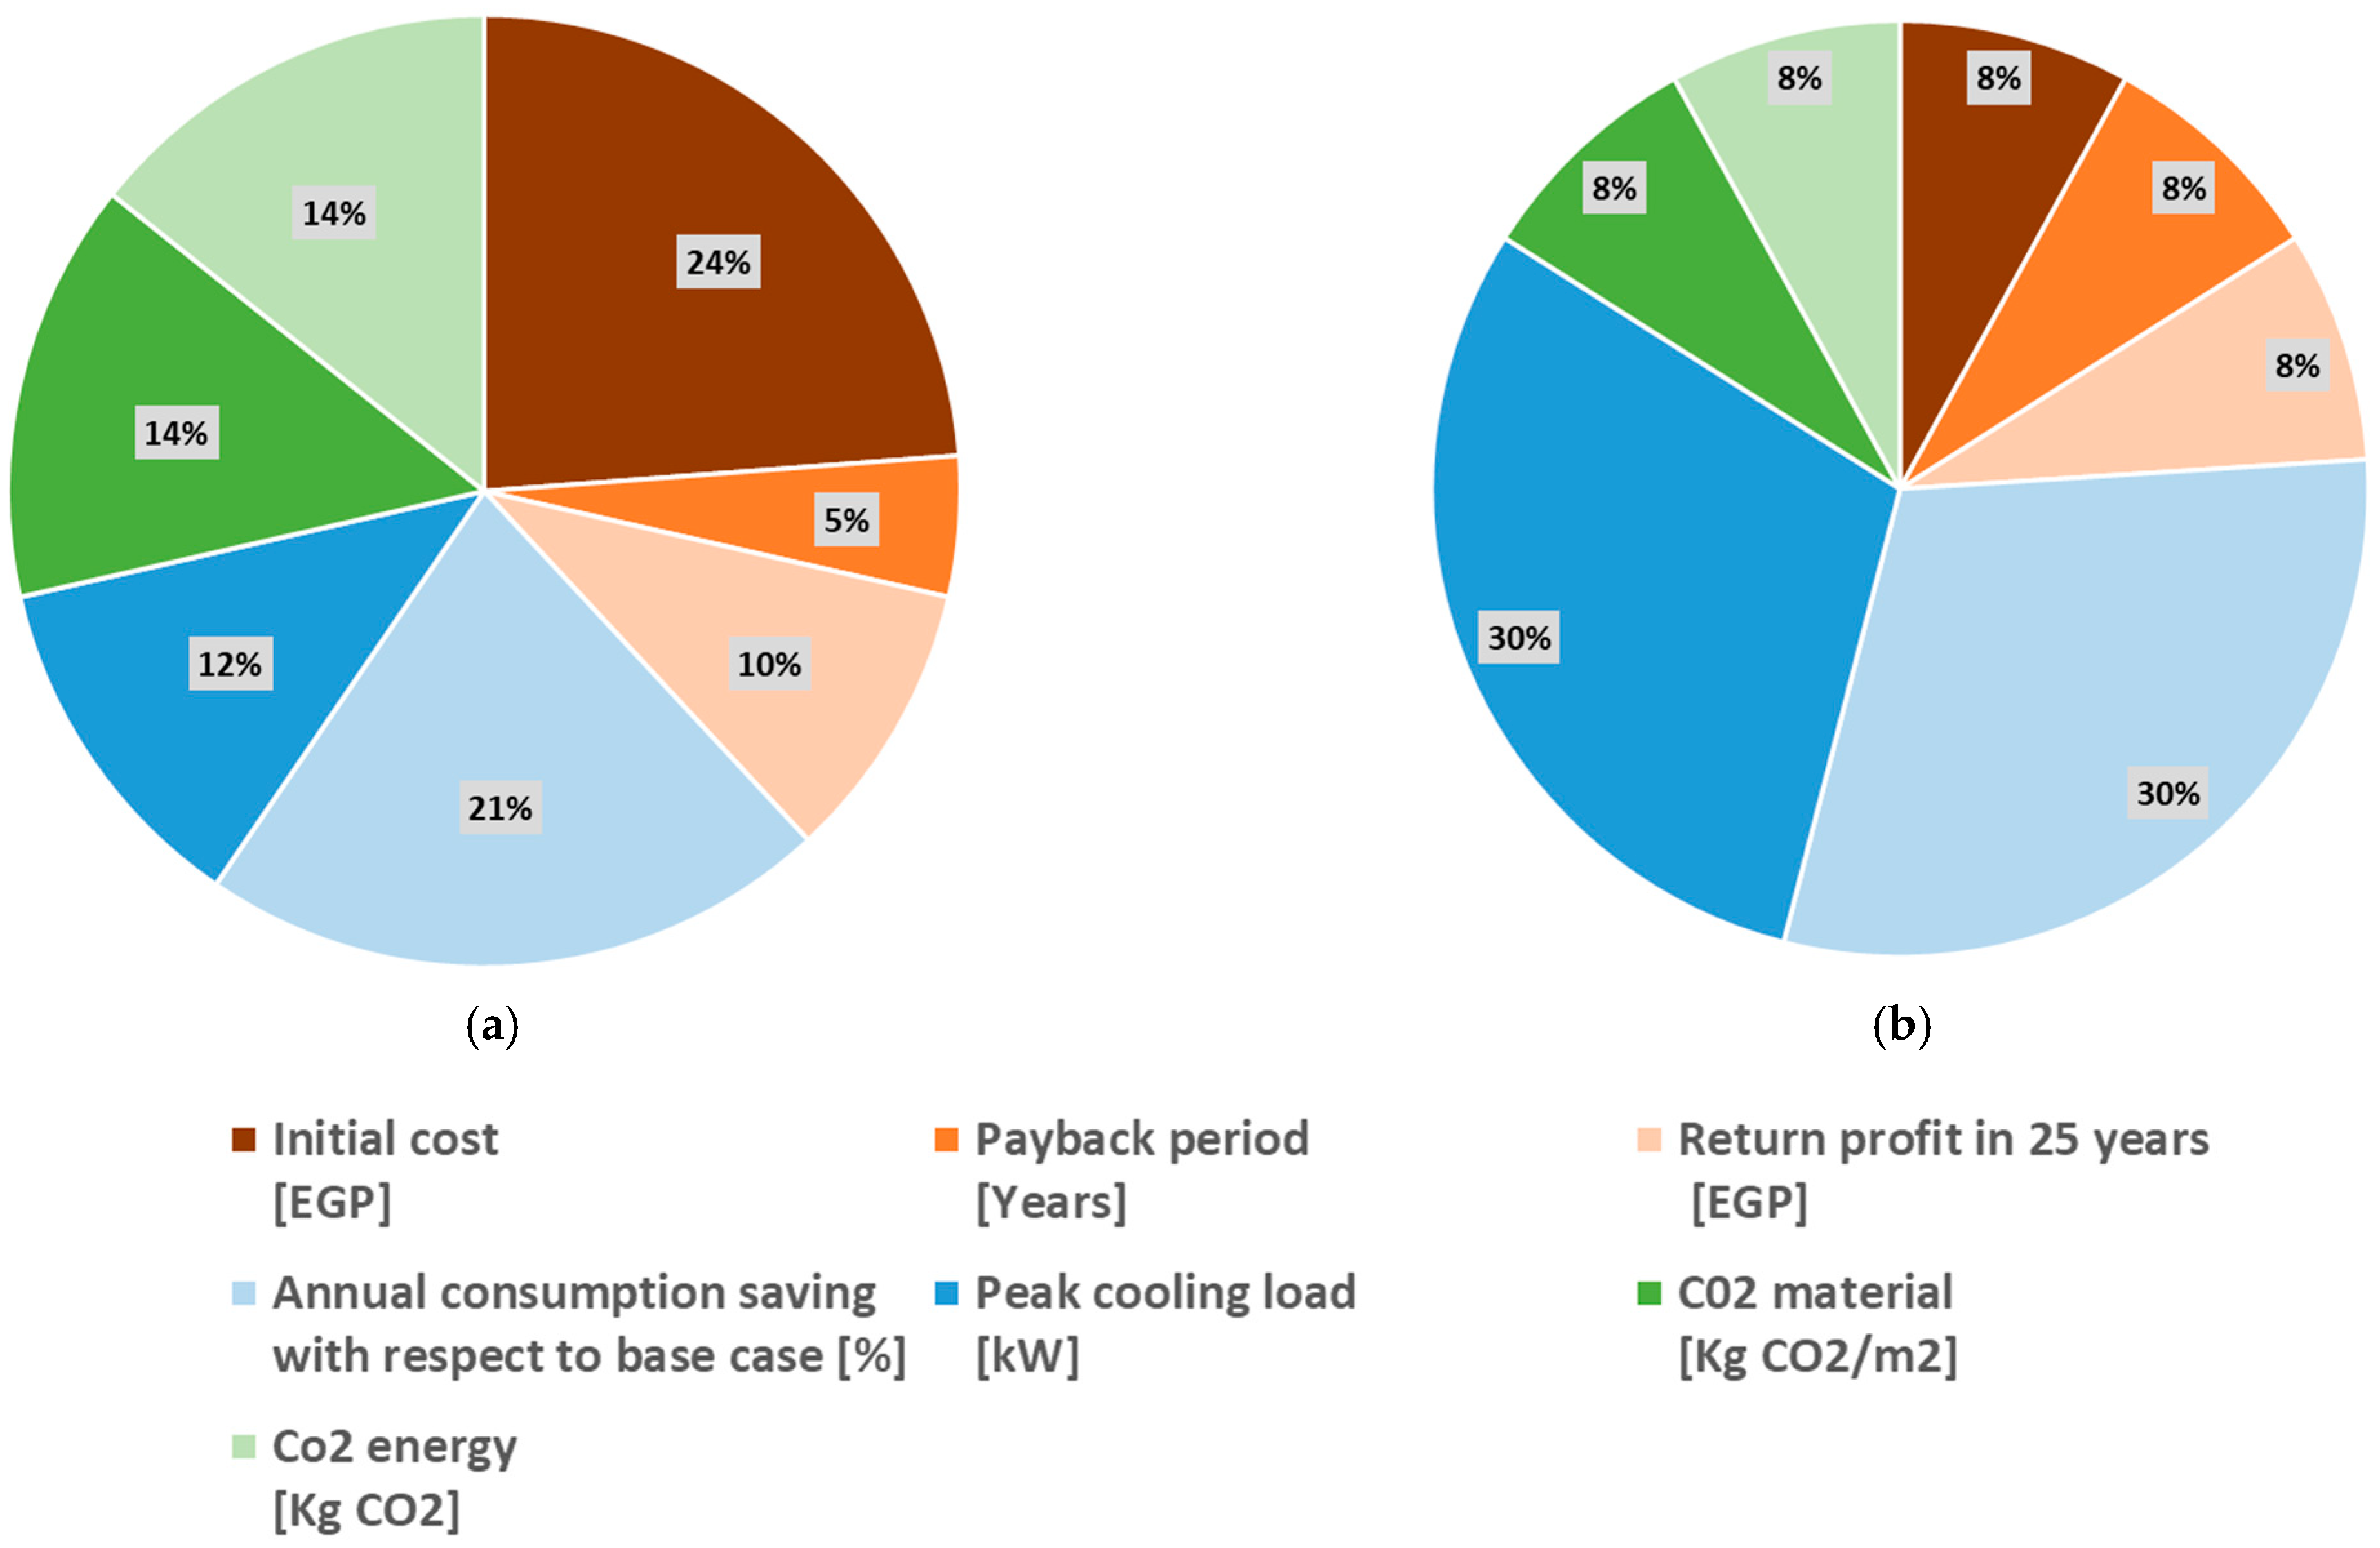
A parametric simulation campaign was done to assess the optimal solution among all the alternatives. The Multicriteria Decision Analysis (MCDA) method called TOPSIS [21,22] was used to determine the optimum solution by calculating the distance with the ideal alternatives and picking the alternative with the shortest distance. Financial, energetic and environmental parameters were taken into consideration in the decision with two scenarios. The financial parameters are the initial cost, the payback period and the saving profit in 25 years. The environmental parameters are the CO2 emission savings from energy production and material manufacturing. The energetic parameters are the annual electricity consumption savings and the peak cooling load. The key performance indicators (KPIs) for each scenario are shown in Figure 6. All the parameters were calculated for the north and south apartments in each city, and then the ranking of each alternative was calculated.
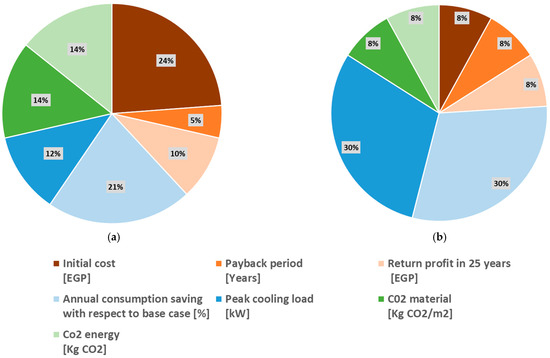
Figure 6.
The key performance indicators (KPIs) for each parameter in each scenario; (a) overall normalized scenario; (b) energetic scenario.
2.4.1. Financial Parameters
The initial costs of the alternatives are based on the market study, as previously mentioned. The payback period and the return profit are the result of the electricity savings, assuming that the electricity cost growth rate is 13.5% until the 2022 and 5% afterwards, as suggested by the MOH.
2.4.2. Environmental Parameters
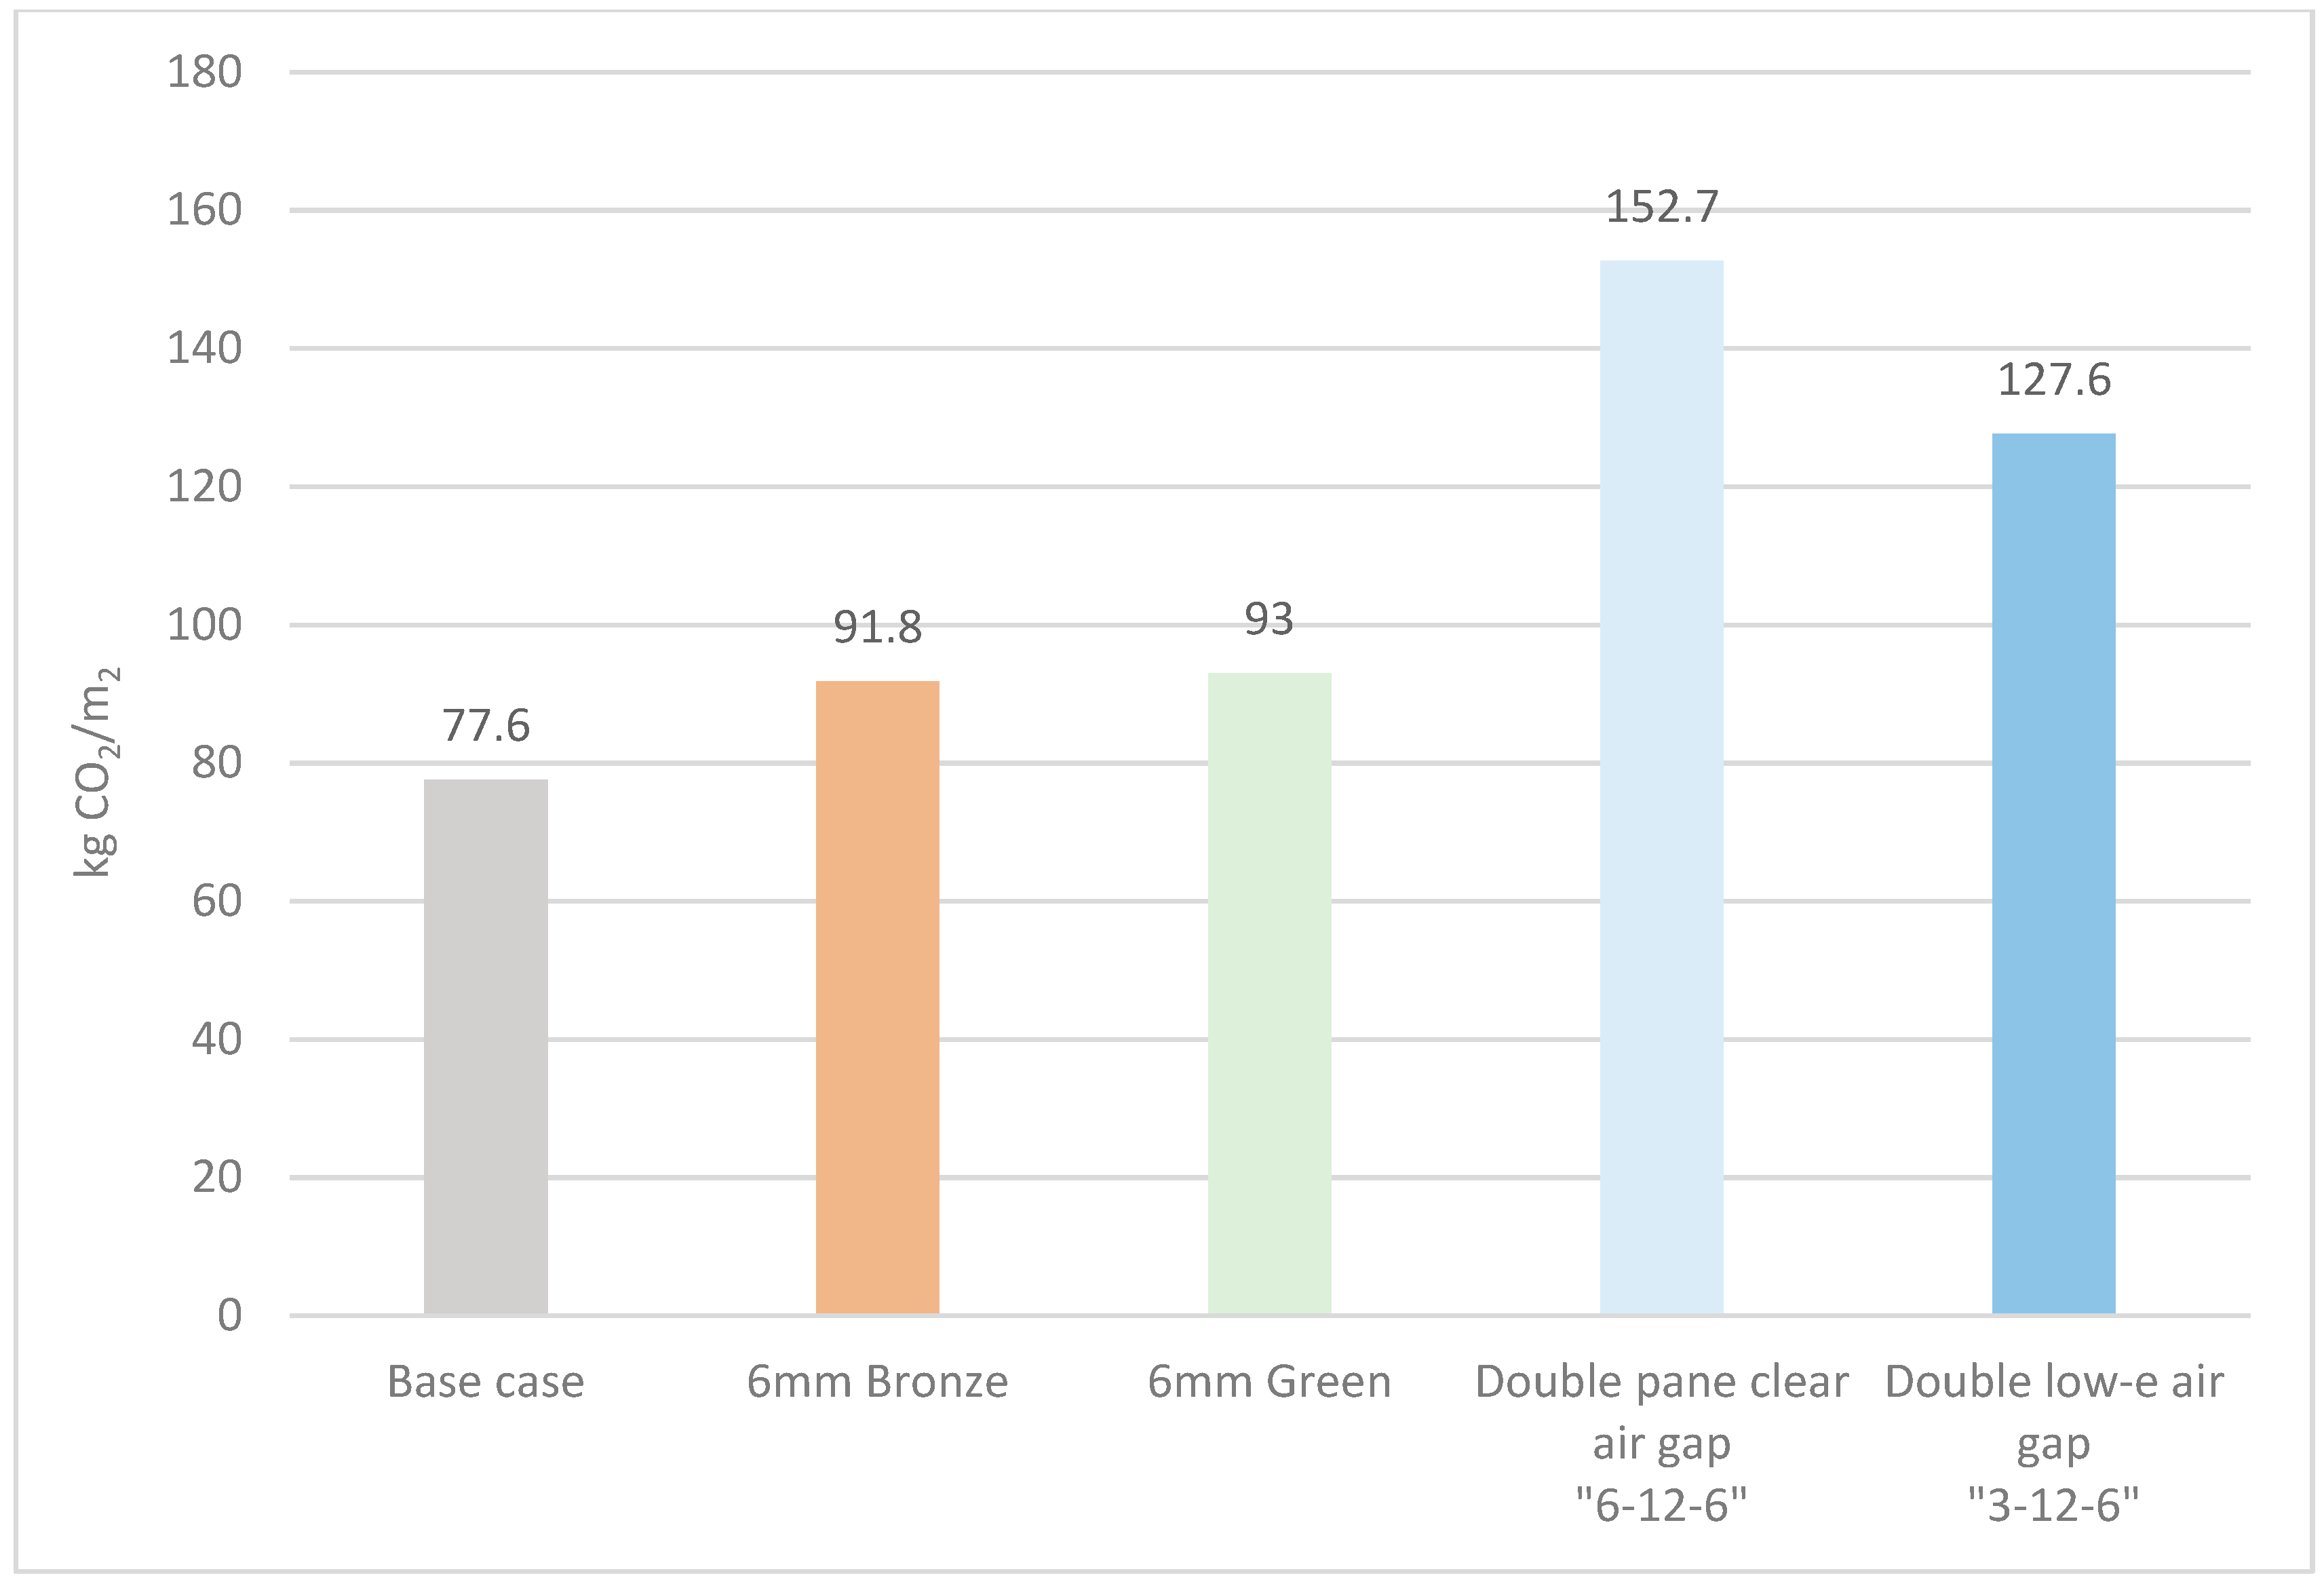
The CO2 emissions from the material manufacturing were taken directly from the Environmental Product Declaration (EPD) of those products. The values used in this study are for A1–A3 manufacturing stages taken from manufacturers operating in Northern Africa like Industrieverband Hartschaum e.V and by The Brick Development Association. The values used for all the alternatives are reported in Appendix A. The CO2 emissions from the energy consumption are considering the conversion from [23], where the factors are reported in function of the primary energy generation type. In this study, the natural gas power plant has been considered as the main electricity source, as it is the most common electricity generation method in Egypt. The conversion rate in this case is 0.55 kg CO2/kWh of electricity.
2.4.3. Energy Parameters
The annual cooling consumption savings and the peak cooling loads are taken directly from the simulation results.
2.5. Final Configuration and Future Performance
After choosing the optimal configuration for the opaque and transparent parts of the envelope, the effect of installing efficient lighting in the apartments was tested. We simulated 12 W LED lamps to substitute the incandescent ones to reduce the internal gains. The lighting internal gains dropped from 15 W/m2 to 2.16 W/m2. The 12 W LED lamp cost 20 EGP (1.12€), while the normal incandescent lamp cost 9 EGP (0.5€).
Finally, all simulations were repeated only in Hurghada using the predicted future weather files to assess any difference in the performance of the alternatives.
3. Results
3.1. Present and Predicted Future Weather Analysis
Region 8, represented in Aswan, has, relatively, the highest temperatures and the lowest humidity, with respect to Region 5, represented by Hurghada, and Region 2, represented by Cairo. In July, the average monthly dry bulb temperatures are 28.4, 32.9 and 33.8 °C for Cairo and Hurghada and Aswan, respectively. Setting 25 °C as a reference value to calculate the cooling degree days, Aswan has the highest yearly value of 1413 °C, while Hurghada and Cairo have 1005 and 418 °C, respectively.
Humidity-wise, Cairo has the highest humidity, while Aswan has the driest weather of all three. The representation of the moist air conditions during July on a psychrometric chart (Figure 3) shows that the summer in Aswan is characterized by the highest dry bulb temperatures and the lowest humidity out of the three cities, with temperature up to 42 °C and humidity ratio from 5–10 gv/kgda. Cairo, on the other hand, has moderate temperatures and humidity ratio, with temperatures ranging from 20 °C to 35 °C and humidity ratios from 10–15 gv/kgda.
3.2. Comparing Present and Predicted Climate Change Adapted Weather Files
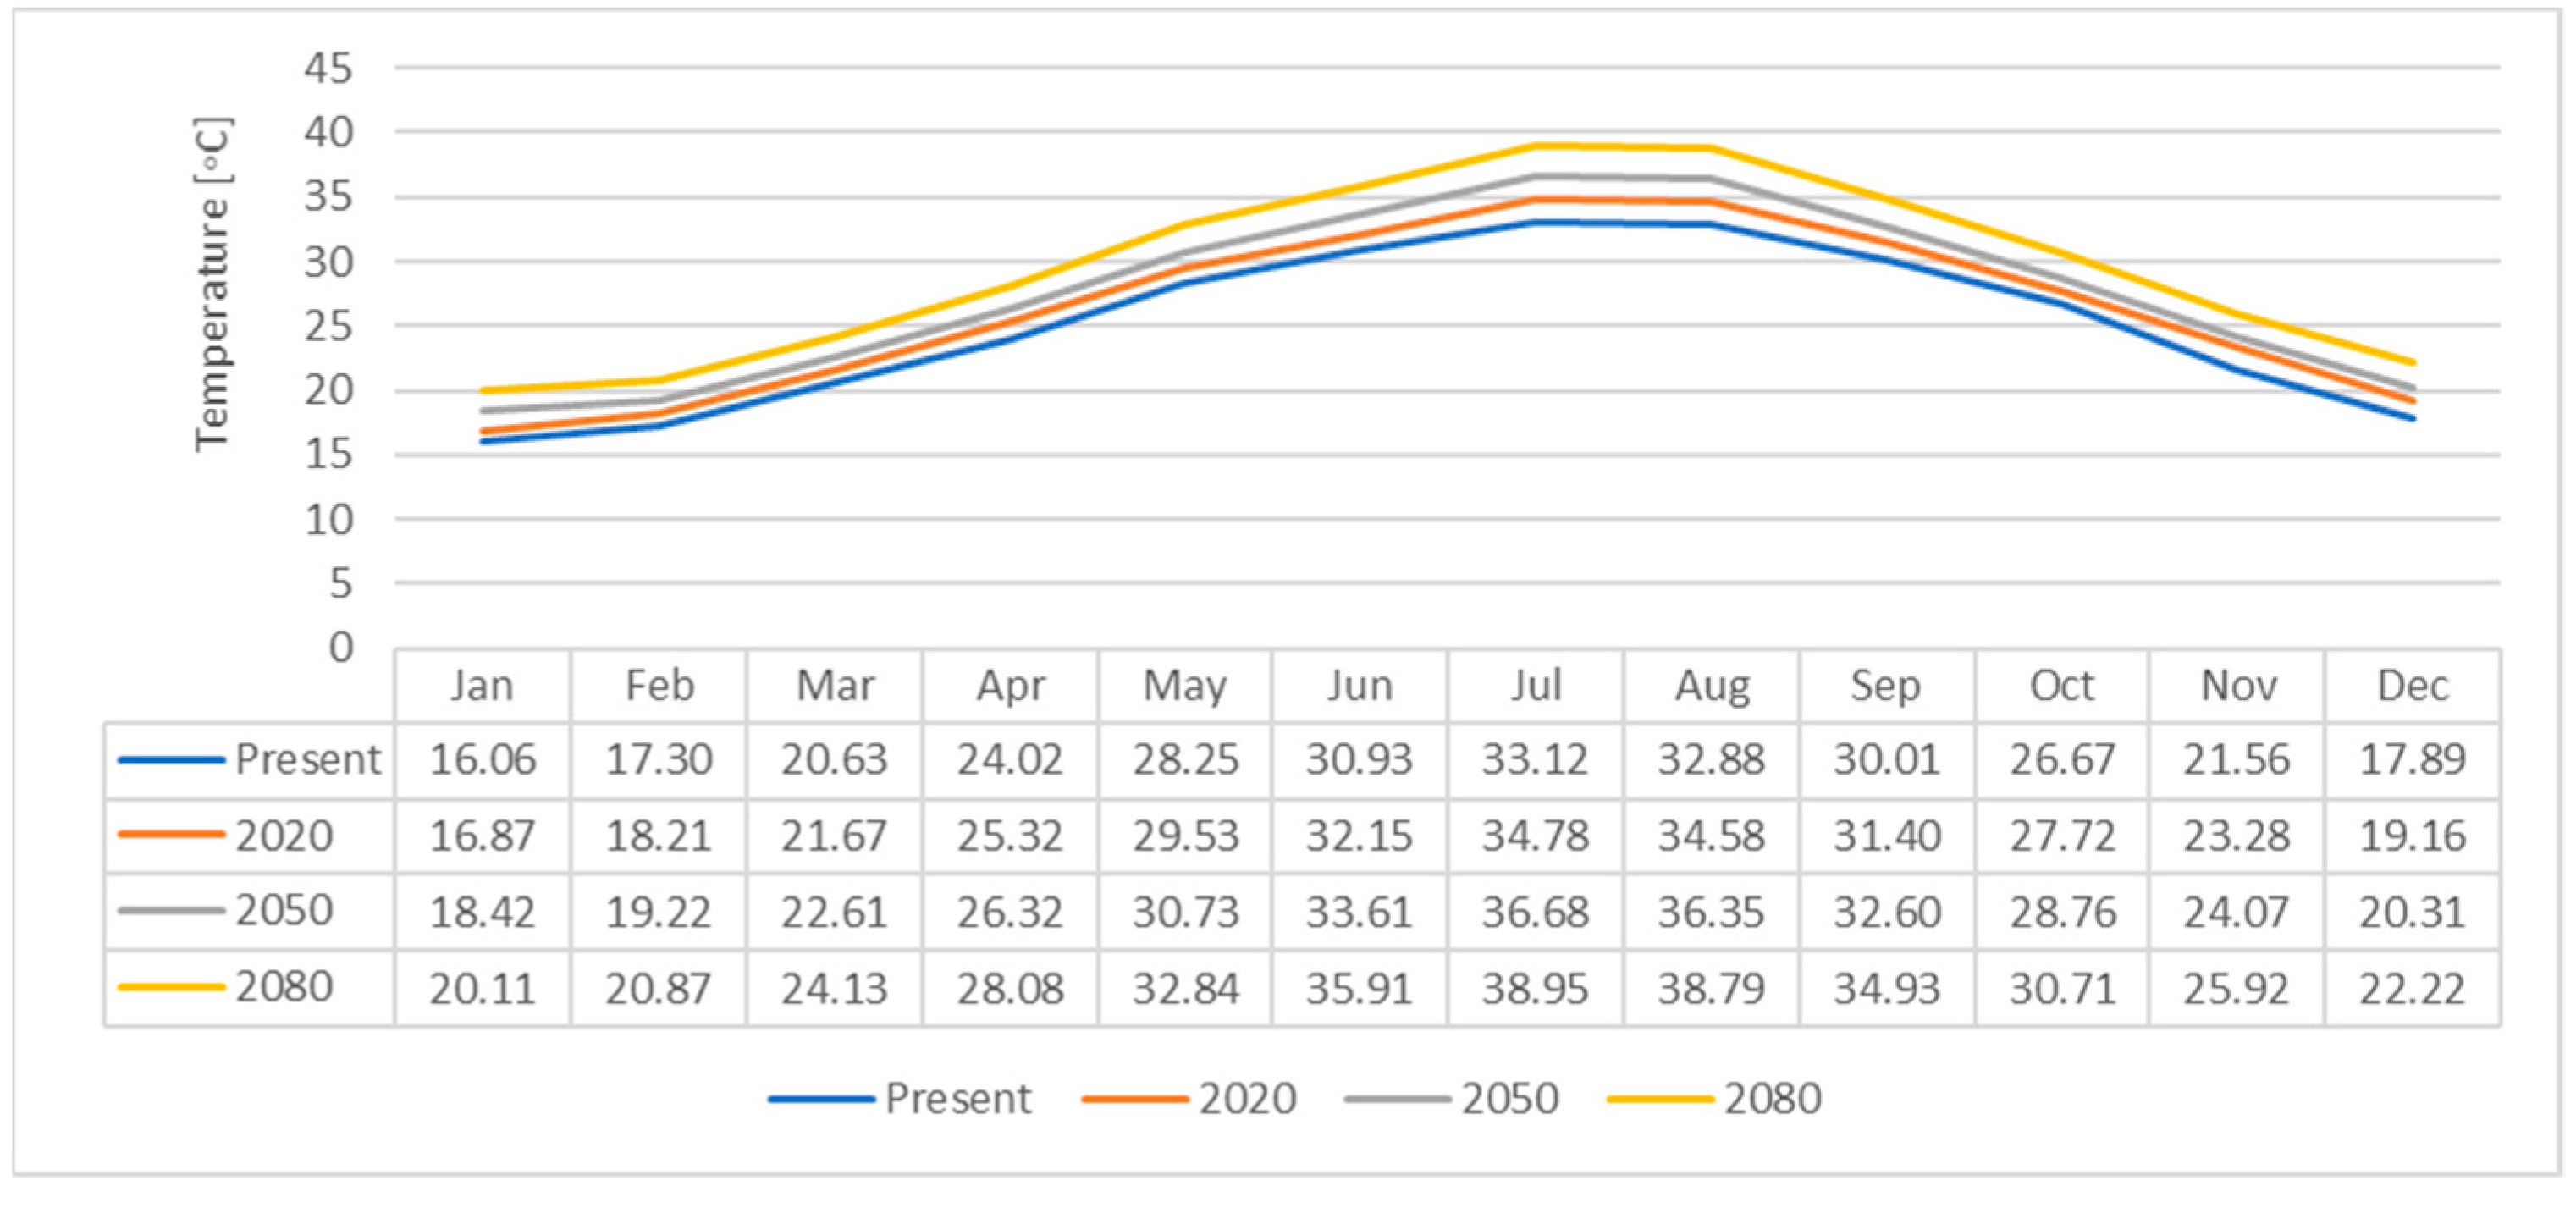
In Hurghada, the monthly average dry bulb temperature in April is expected to increase from 27.53 °C in the present to 28.93 °C in 2020 and 30.12 °C in 2050 and, finally, to 31.75 °C in 2080. In July, the temperature is expected to increase at a higher rate: in the present, the monthly average temperature is 33.91 °C, and it increases to 35.46 °C, 37.34 °C and 39.6 °C in 2020, 2050 and 2080, respectively, as shown in Figure 7.
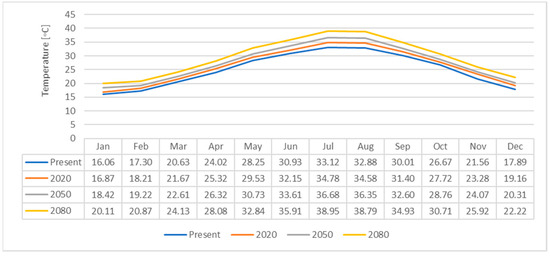
Figure 7.
Monthly average temperatures for present and predicted weather in Hurghada.
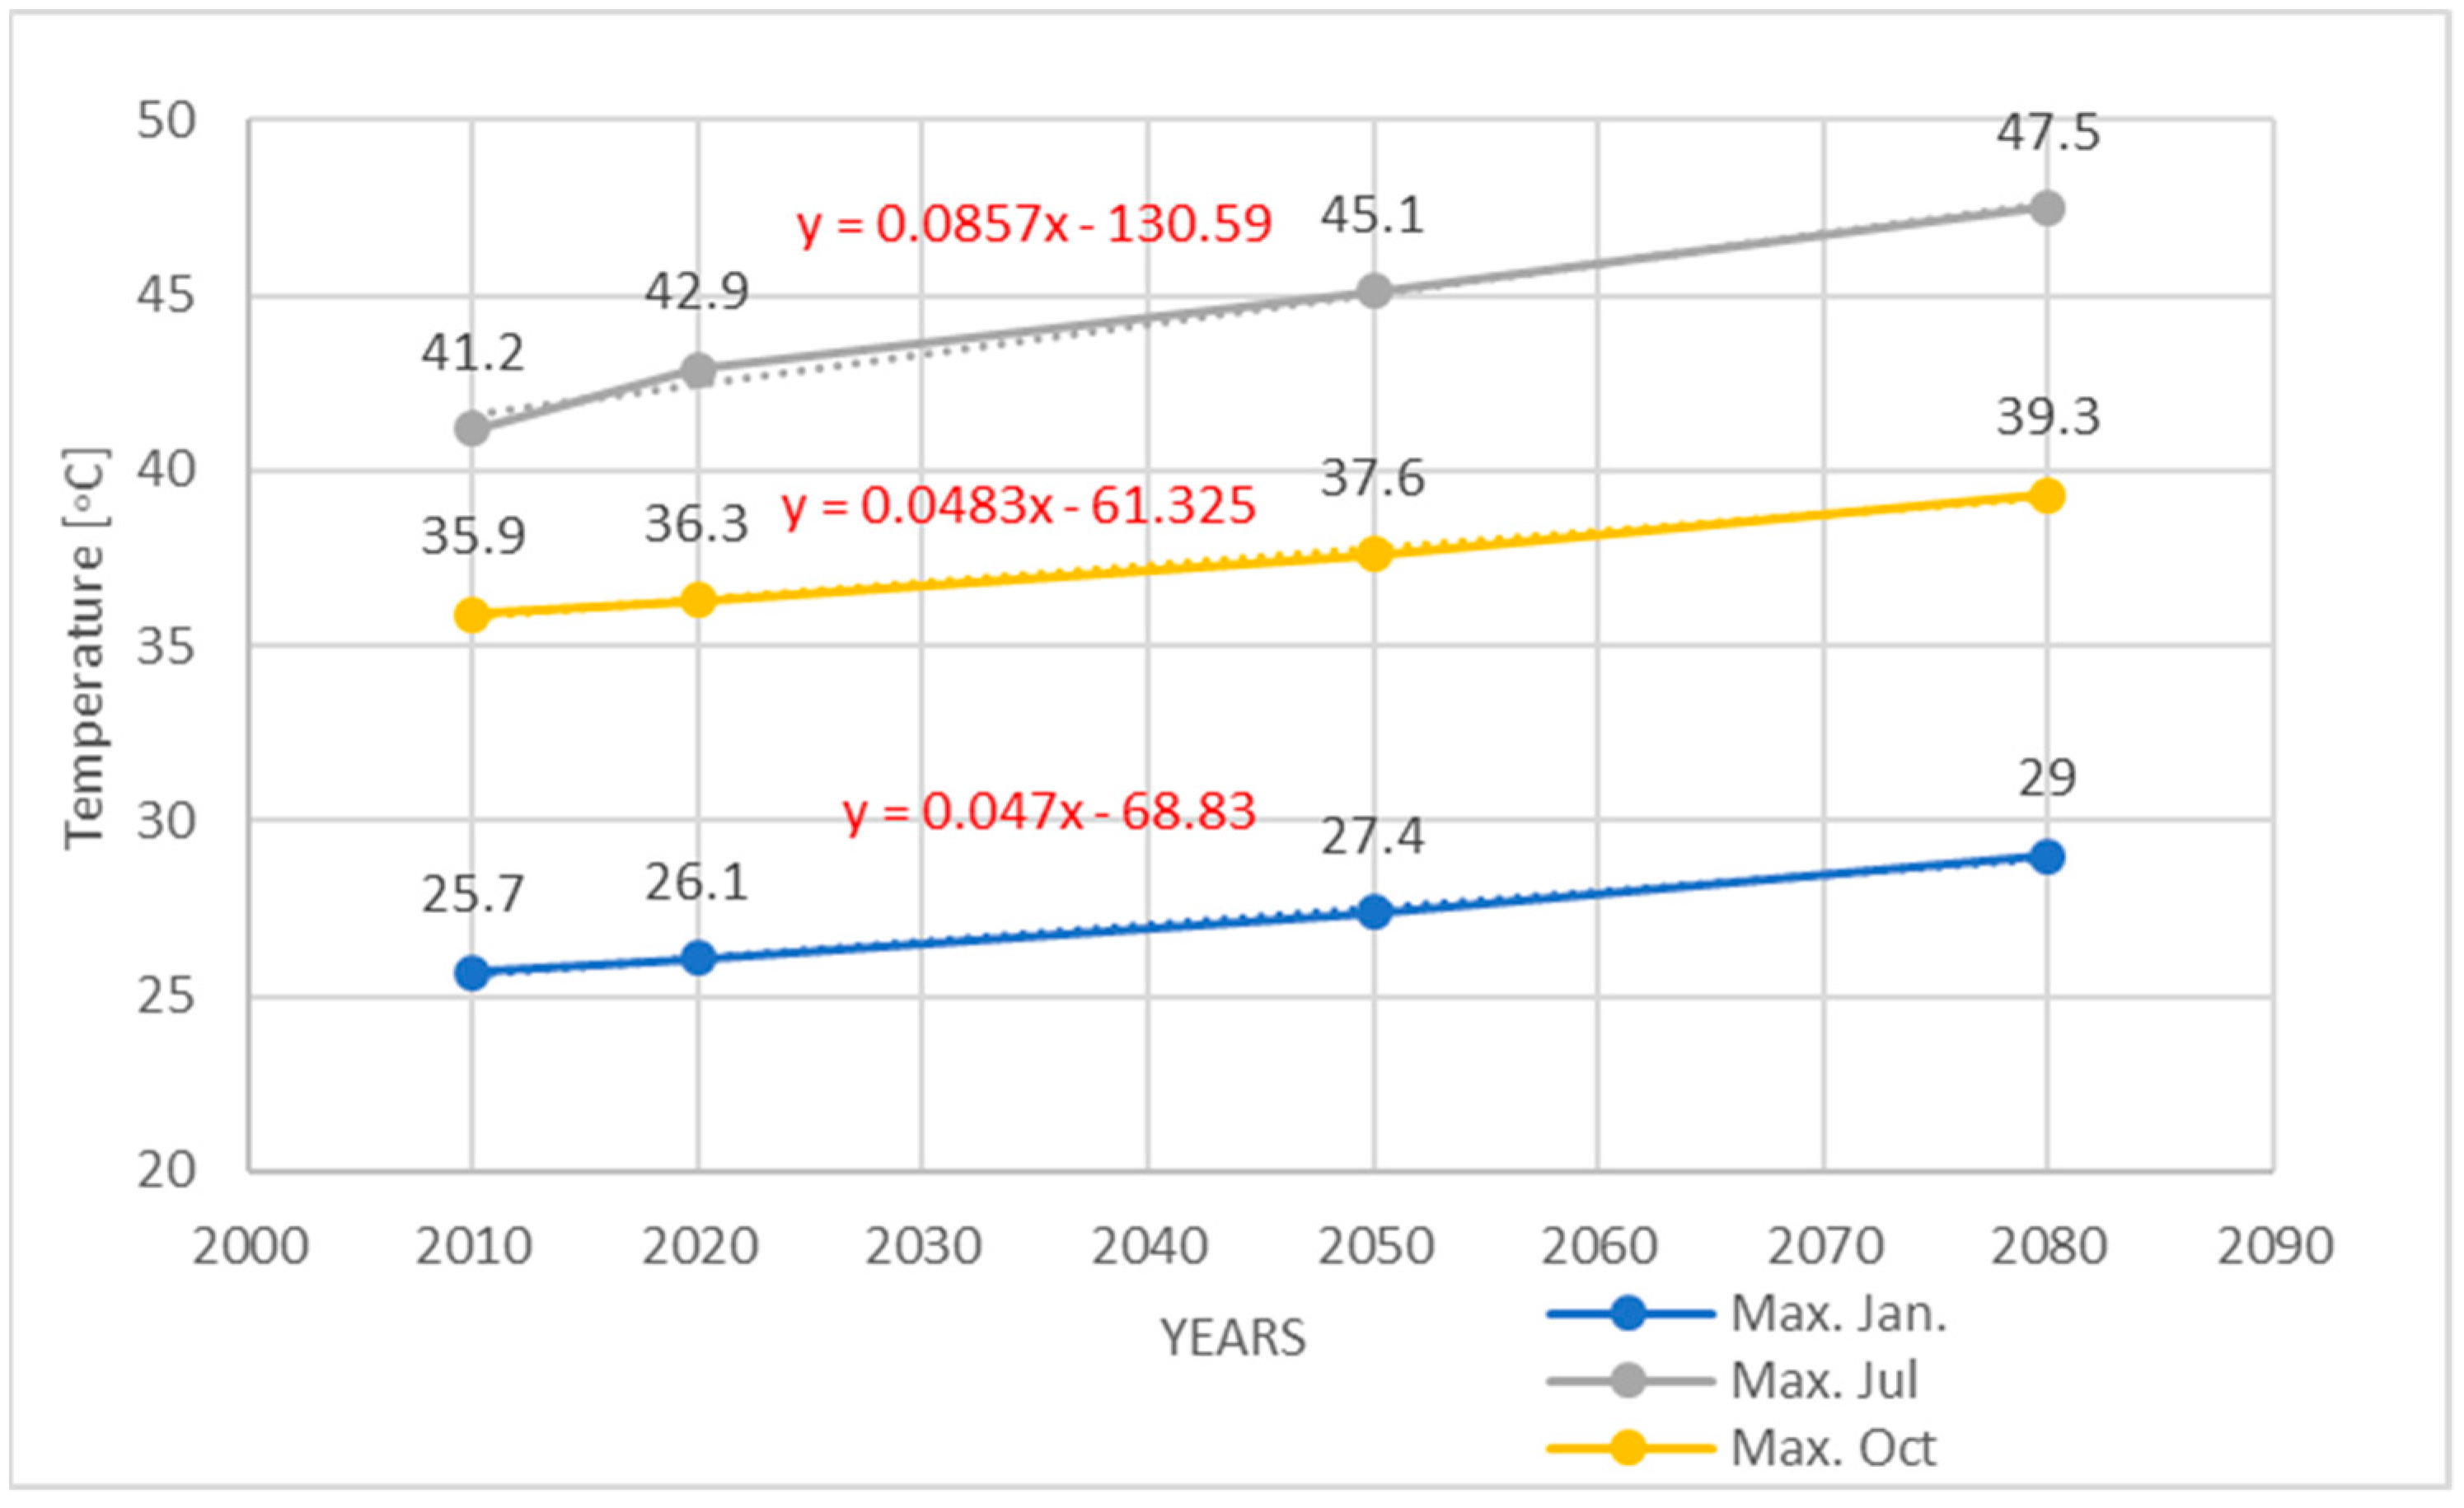
Comparing the maximum average daily temperature also in Hurghada, it was found to be 25.7 °C in the present, and it increases to 26.1 °C in 2020 and keeps increasing until 29 °C in 2080. The line connecting those temperatures has an inclination of 0.047, meaning that the predicted rate of temperature increase in January is 4.7%. In July, the maximum daily average temperature is predicted to increase from 41.2 °C in the present weather data up to 45.1 °C in 2050 and to 47.5 °C in 2080, with a rate of 8.5% predicted increase. The rate of predicted increase in October, however, is 4.8%; that means that the rate of increase in the temperature through the years due to climate change is predicted to be higher in summer than winter, as shown in Figure 8.
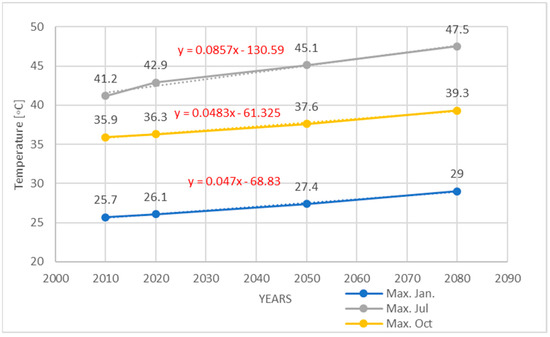
Figure 8.
Maximum average daily temperatures for present and predicted weather in Hurghada.
3.3. Energy Needs
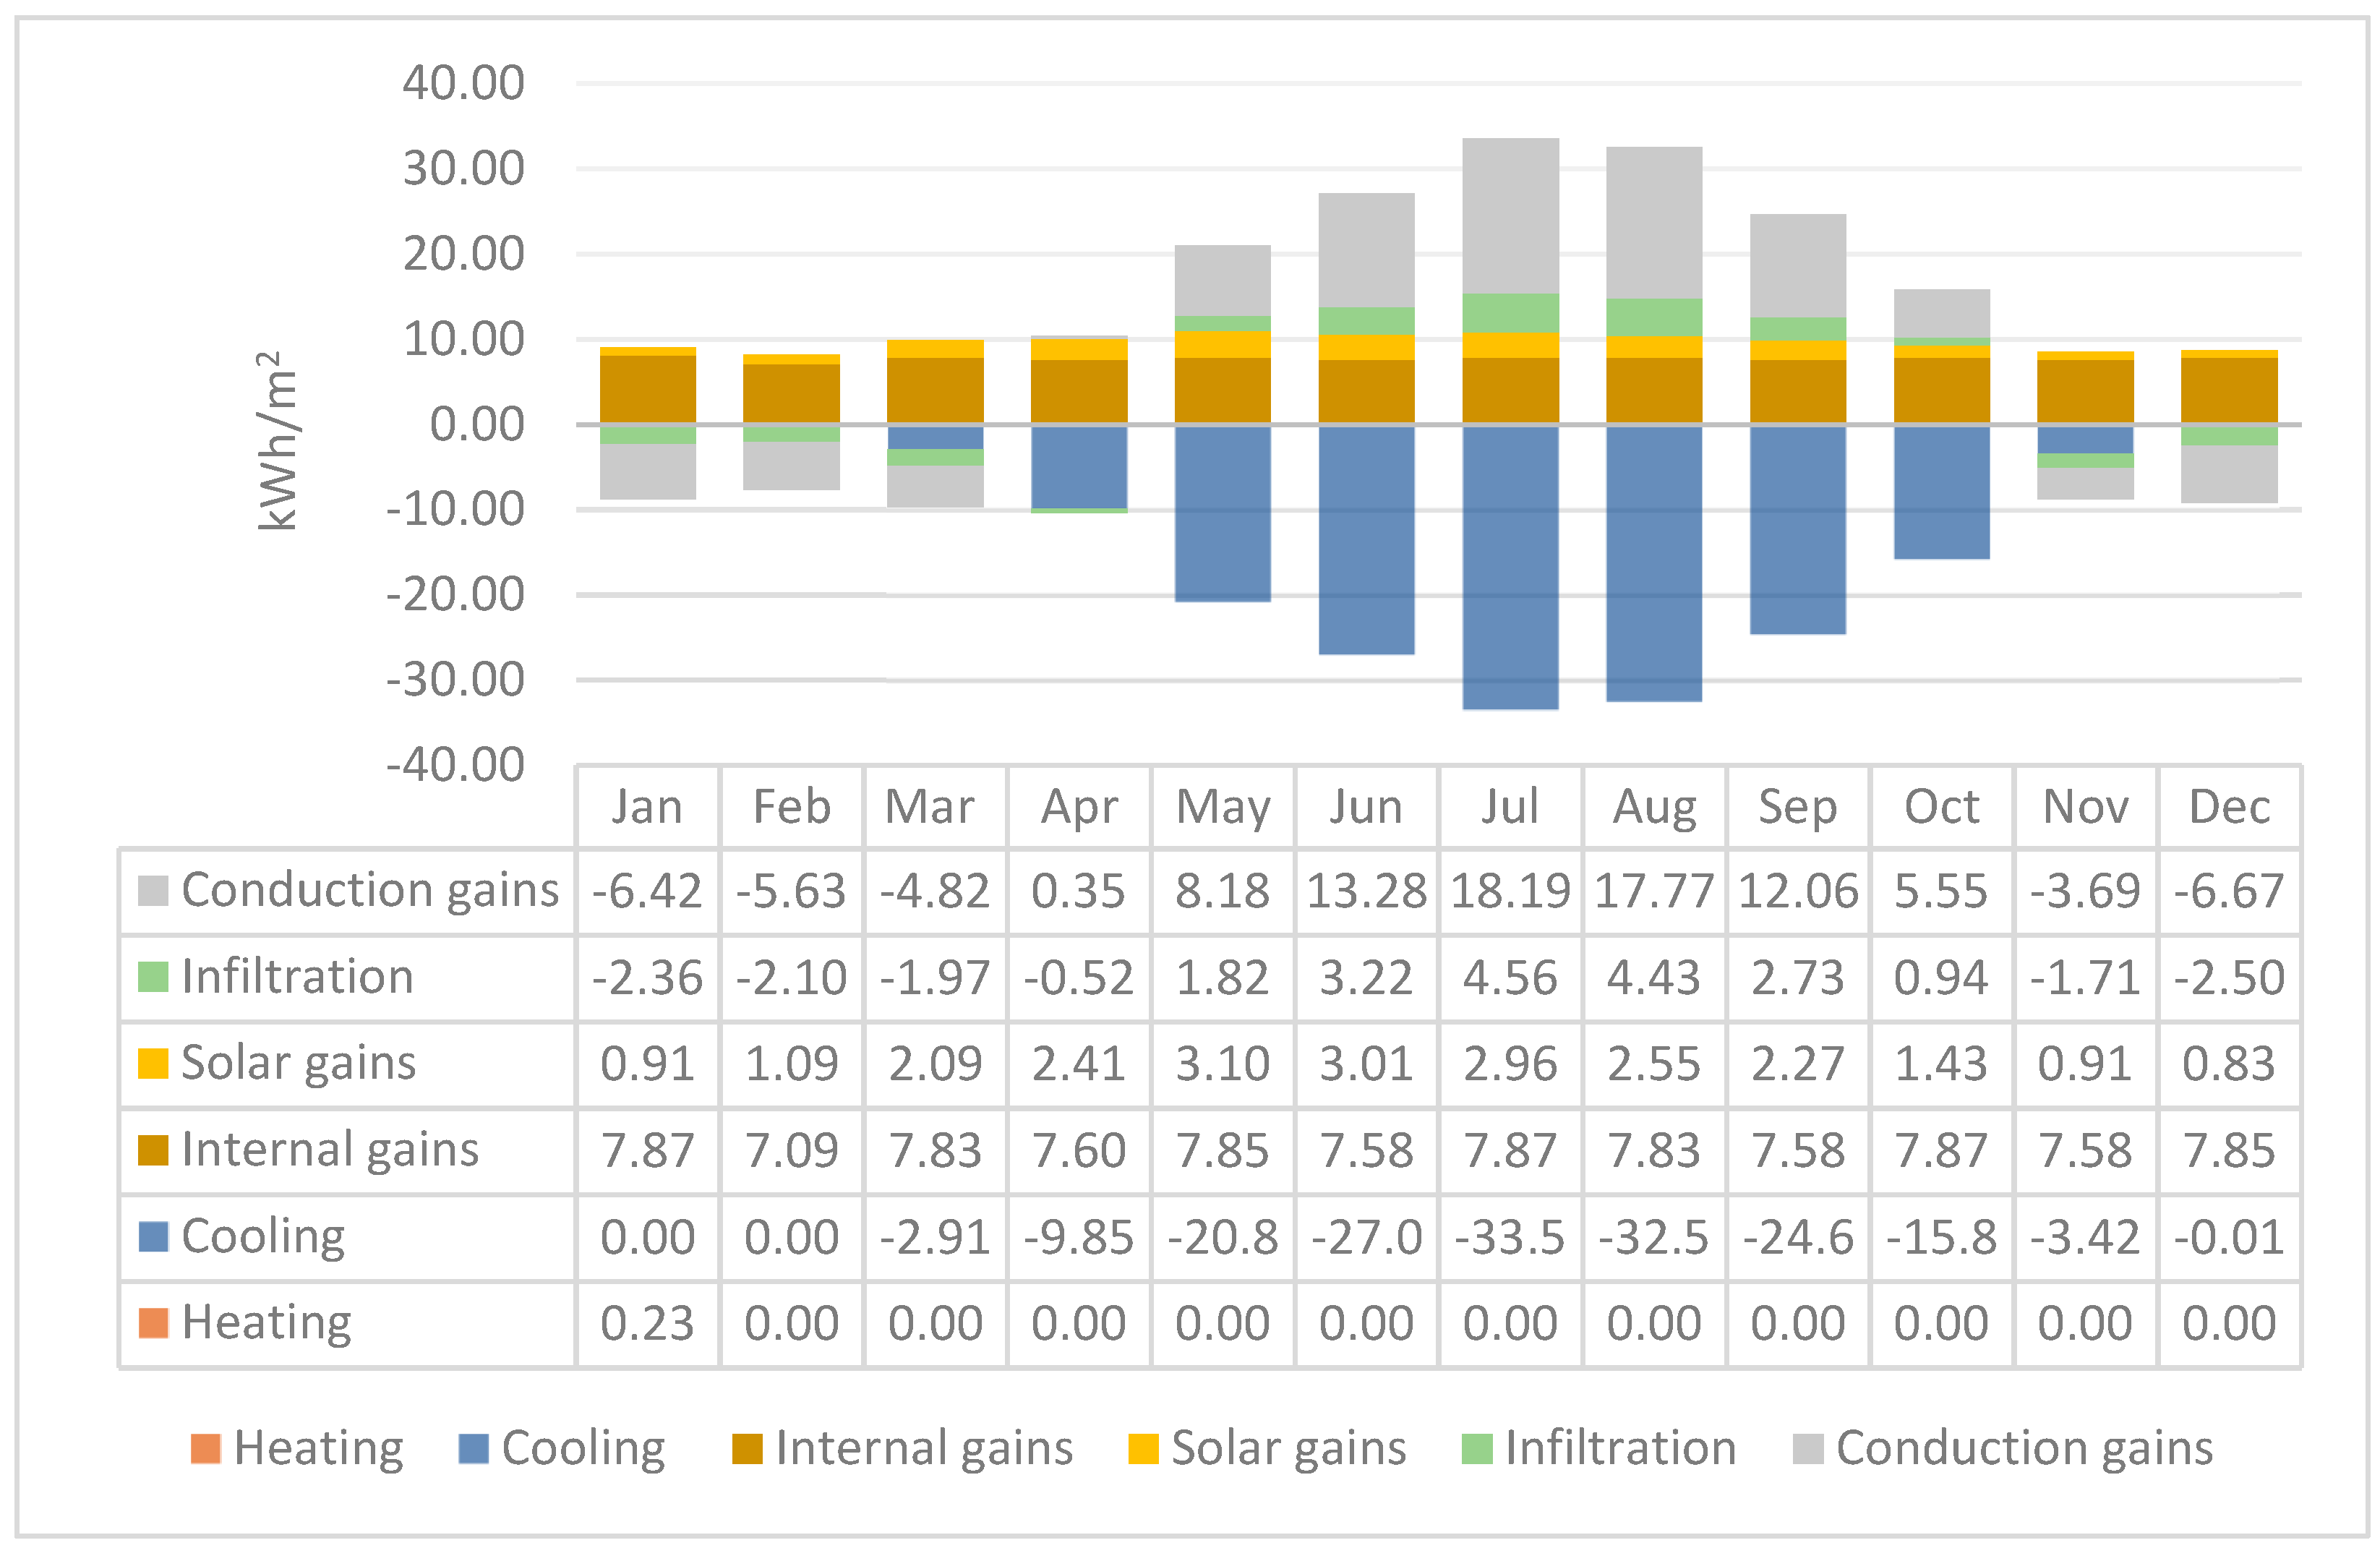
Running the simulations, the cooling energy needs and peak cooling load for the south and north apartments were observed. For the south apartments, the cooling energy needs were 119, 170.7 and 208 kWh/m2 for Cairo, Hurghada and Aswan, respectively, while the peak cooling loads were 3.64, 4.25 and 4.67 kW. For the north apartments, the cooling energy needs were 110.16, 165.8 and 203 kWh/m2 for Cairo, Hurghada and Aswan, respectively, and the peak cooling loads were 3.59, 4.18 and 4.49 kW. Figure 9 shows a typical energy break down for the south apartments in Hurghada.
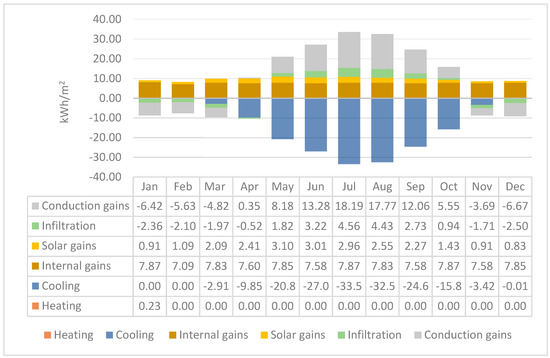
Figure 9.
Monthly energy balance for the third-floor south apartment base case in Hurghada.
3.4. MCDA and Optimal Configuration
The scores of all the alternatives were calculated, and the rankings were established. The scores for both scenarios are reported in Table 5, Table 6, Table 7 and Table 8.

Table 5.
The scores for all opaque alternatives in the overall normalized scenario.

Table 6.
The scores for all opaque alternatives in the energetic scenario.

Table 7.
The scores for all transparent alternatives in the overall normalized scenario.

Table 8.
The scores for all transparent alternatives in the energetic scenario.
The final configuration, according to these results, was the cavity wall, with 4cm of EPS and the 6 mm single green pane for all the cities and orientations, according to the overall normalized scenario. For the energetic scenario, the cavity wall with 8 cm of EPS and the 6mm single green pane were considered the optimum alternatives.
Applying these configurations and the reduced lighting for the whole building, the annual electricity consumption and the peak cooling loads were reduced. The values for the three cities are reported in Table 9.

Table 9.
The reduction in annual electricity consumption and peak cooling loads applying the best alternatives and reduced lighting.
3.5. Projecting the Future Demand
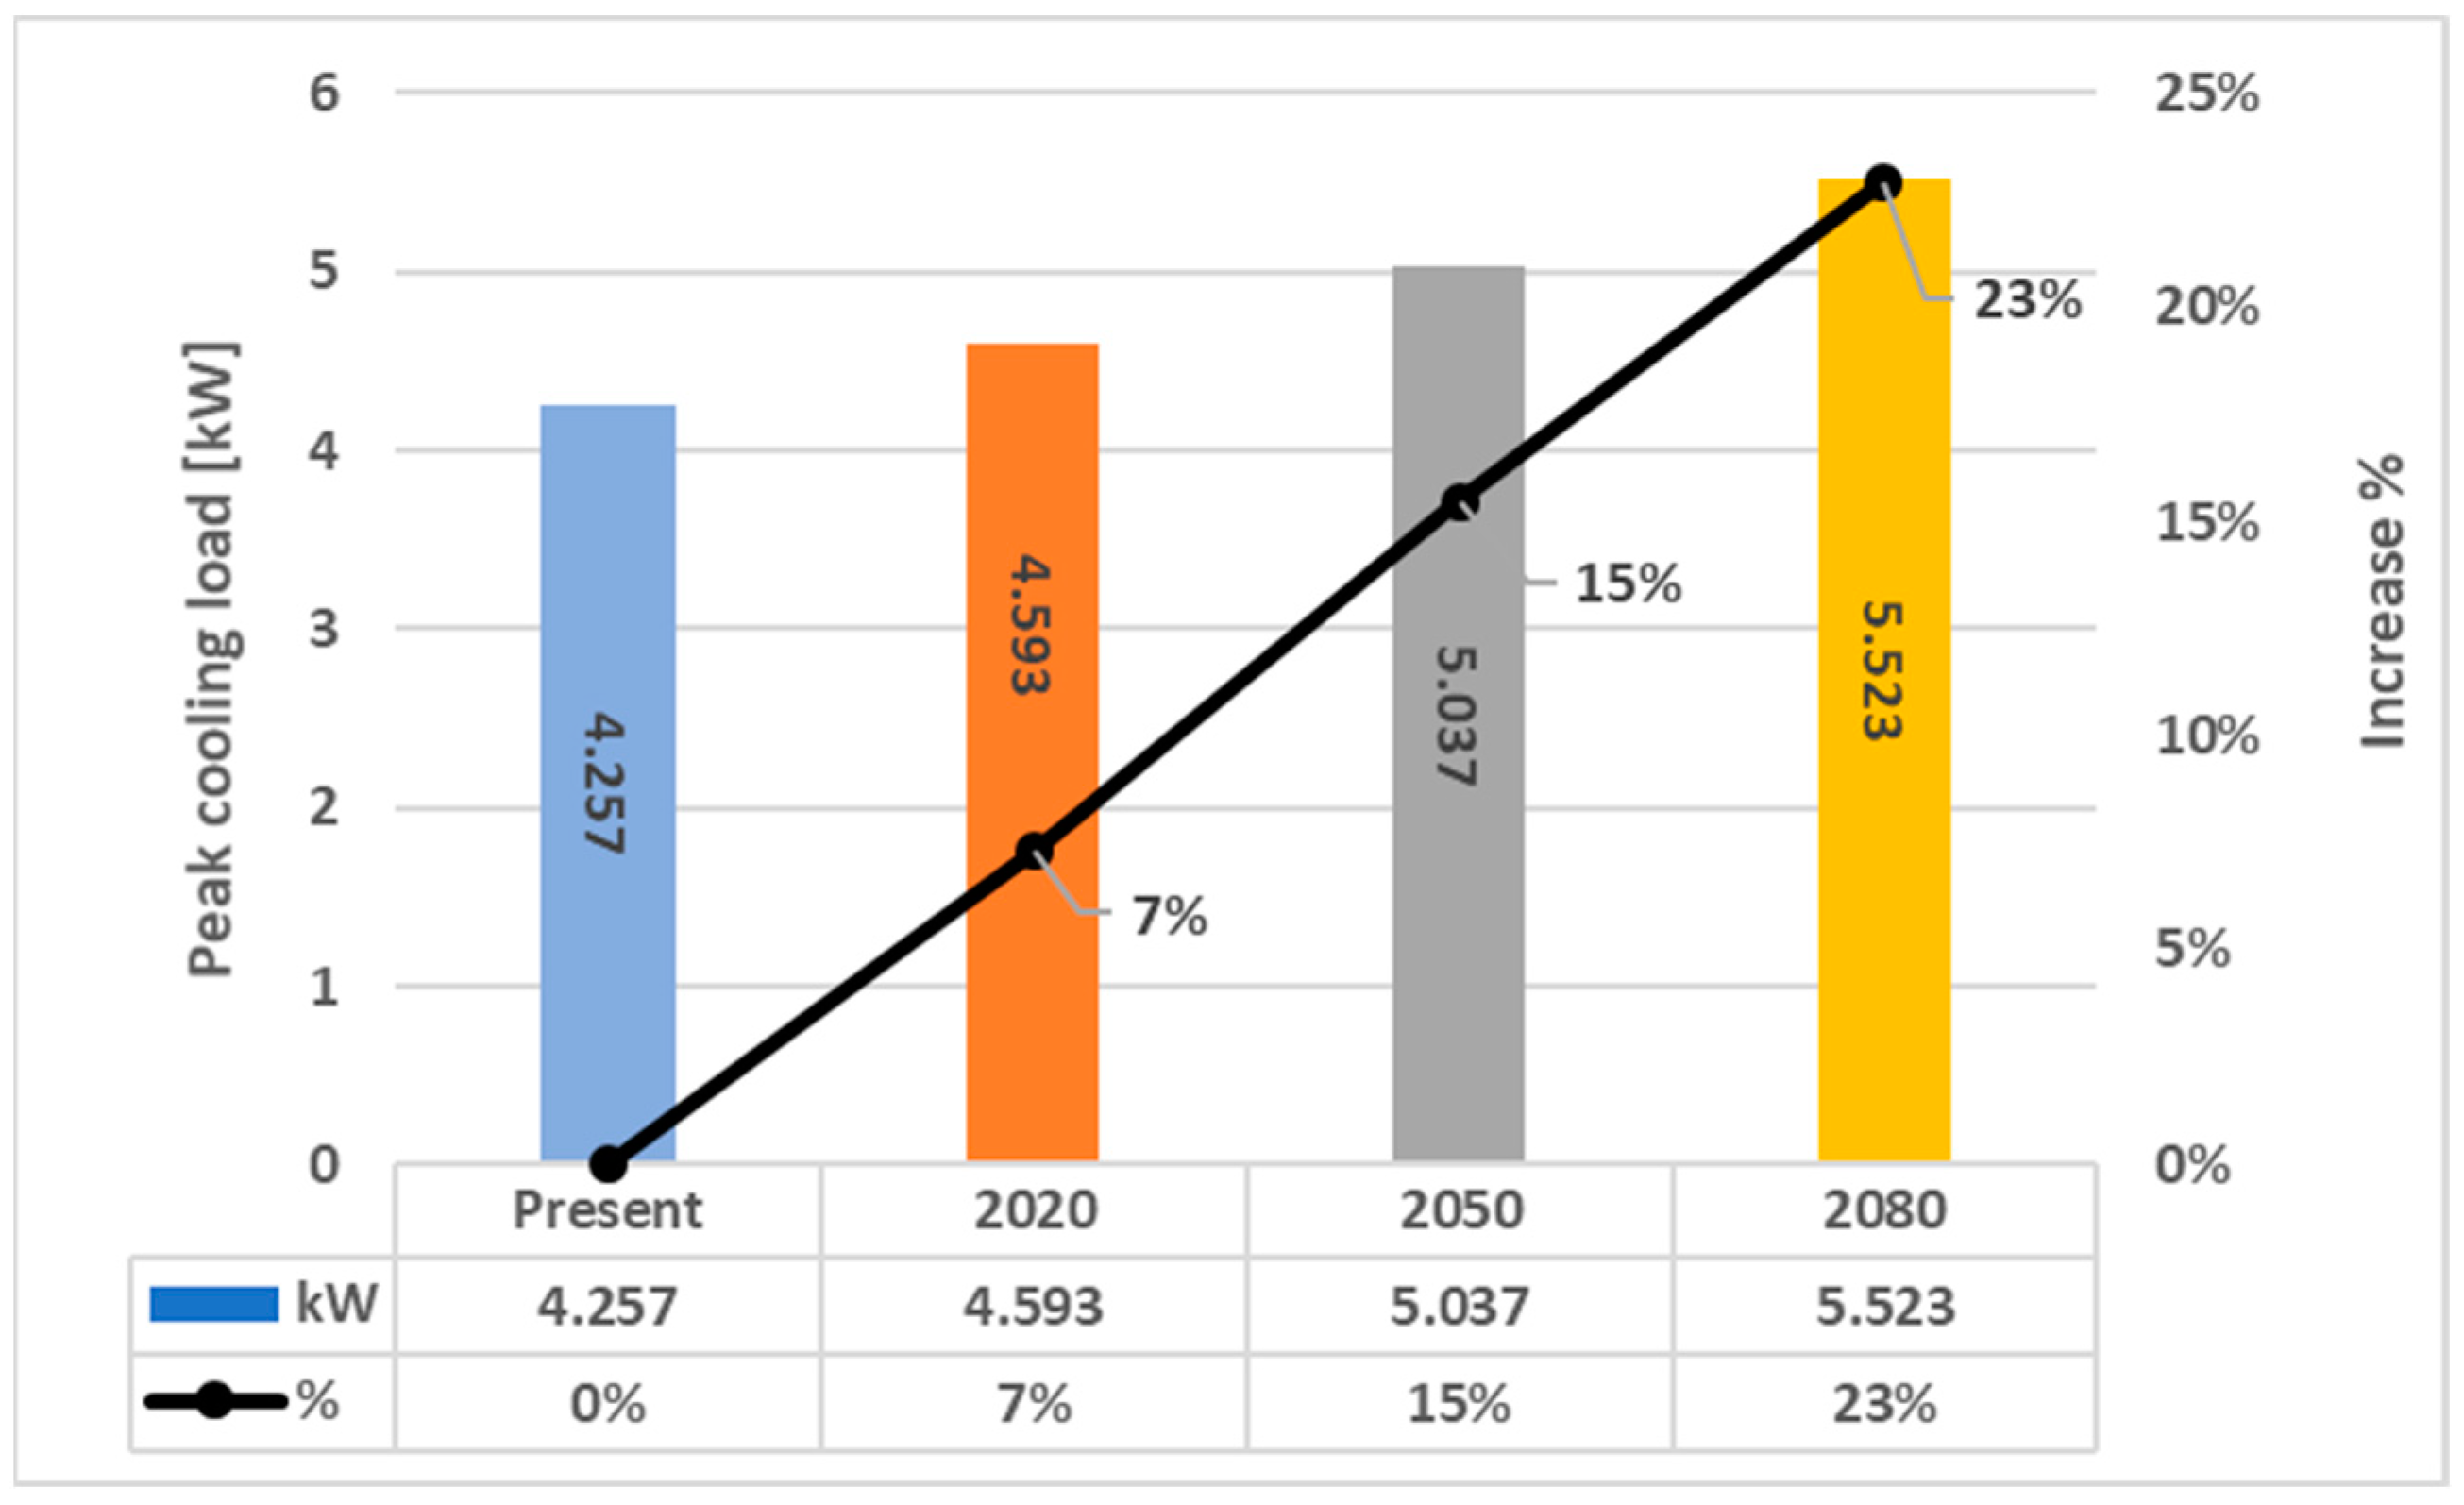
Applying the predicted future weather files for Hurghada into energy simulation, the annual cooling energy needs are expected to increase from 170.71 kWh/m2 to 280.47 kWh/m2 by 2080, which constitutes as 39% increase. Additionally, the peak cooling load is predicted to increase from 4.25 kW in the present to 4.6 kW in 2020 (7% increase) and to 5 kW in 2050 (15% increase) and, finally, to 5.5 kW in 2080 (23% increase) as shown in Figure 10. This increase might lead to changing in the size of the HVAC system installed in the future. In the case of Hurghada, the HVAC used has a peak cooling load of 4.8 kW, meaning that a replacement will be needed before 2050.
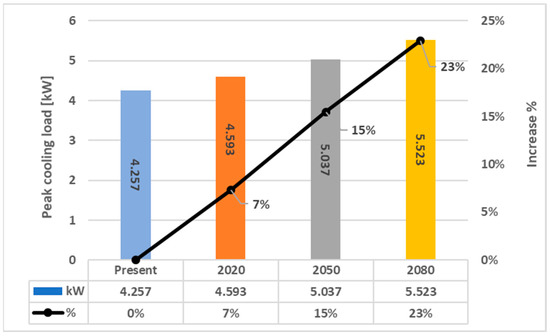
Figure 10.
Peak cooling load for the present and the predicted future in Hurghada.
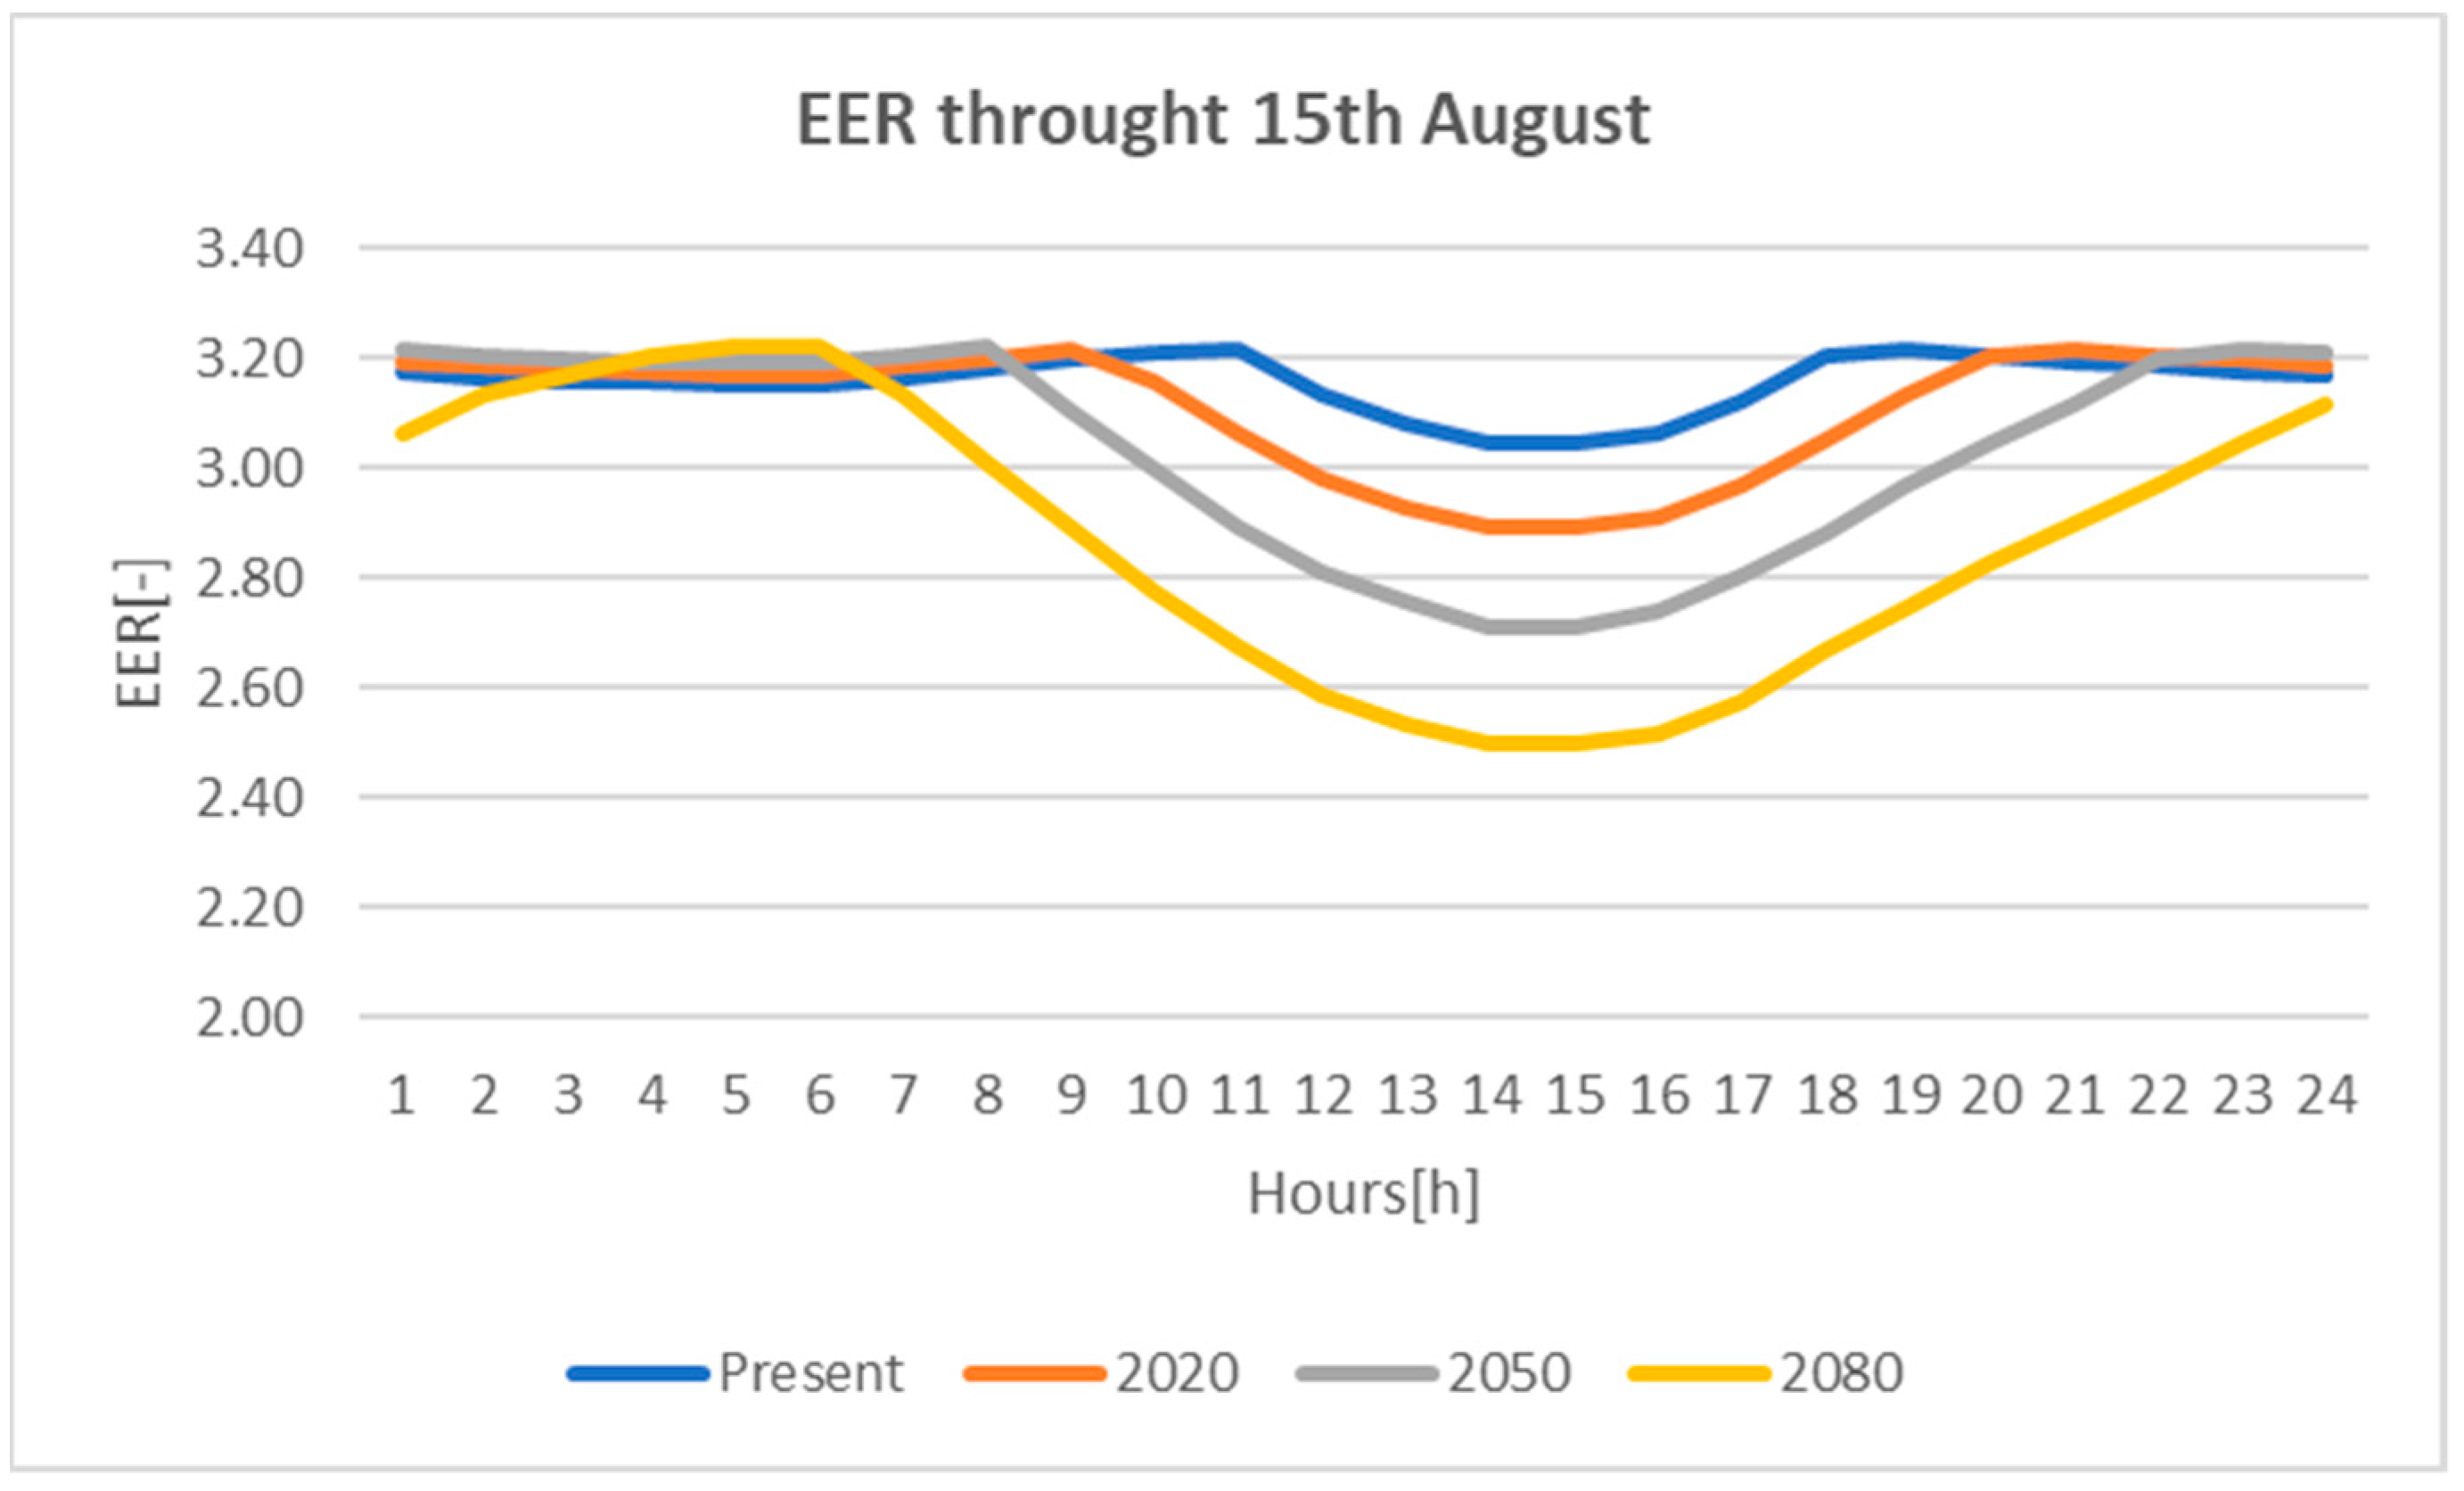
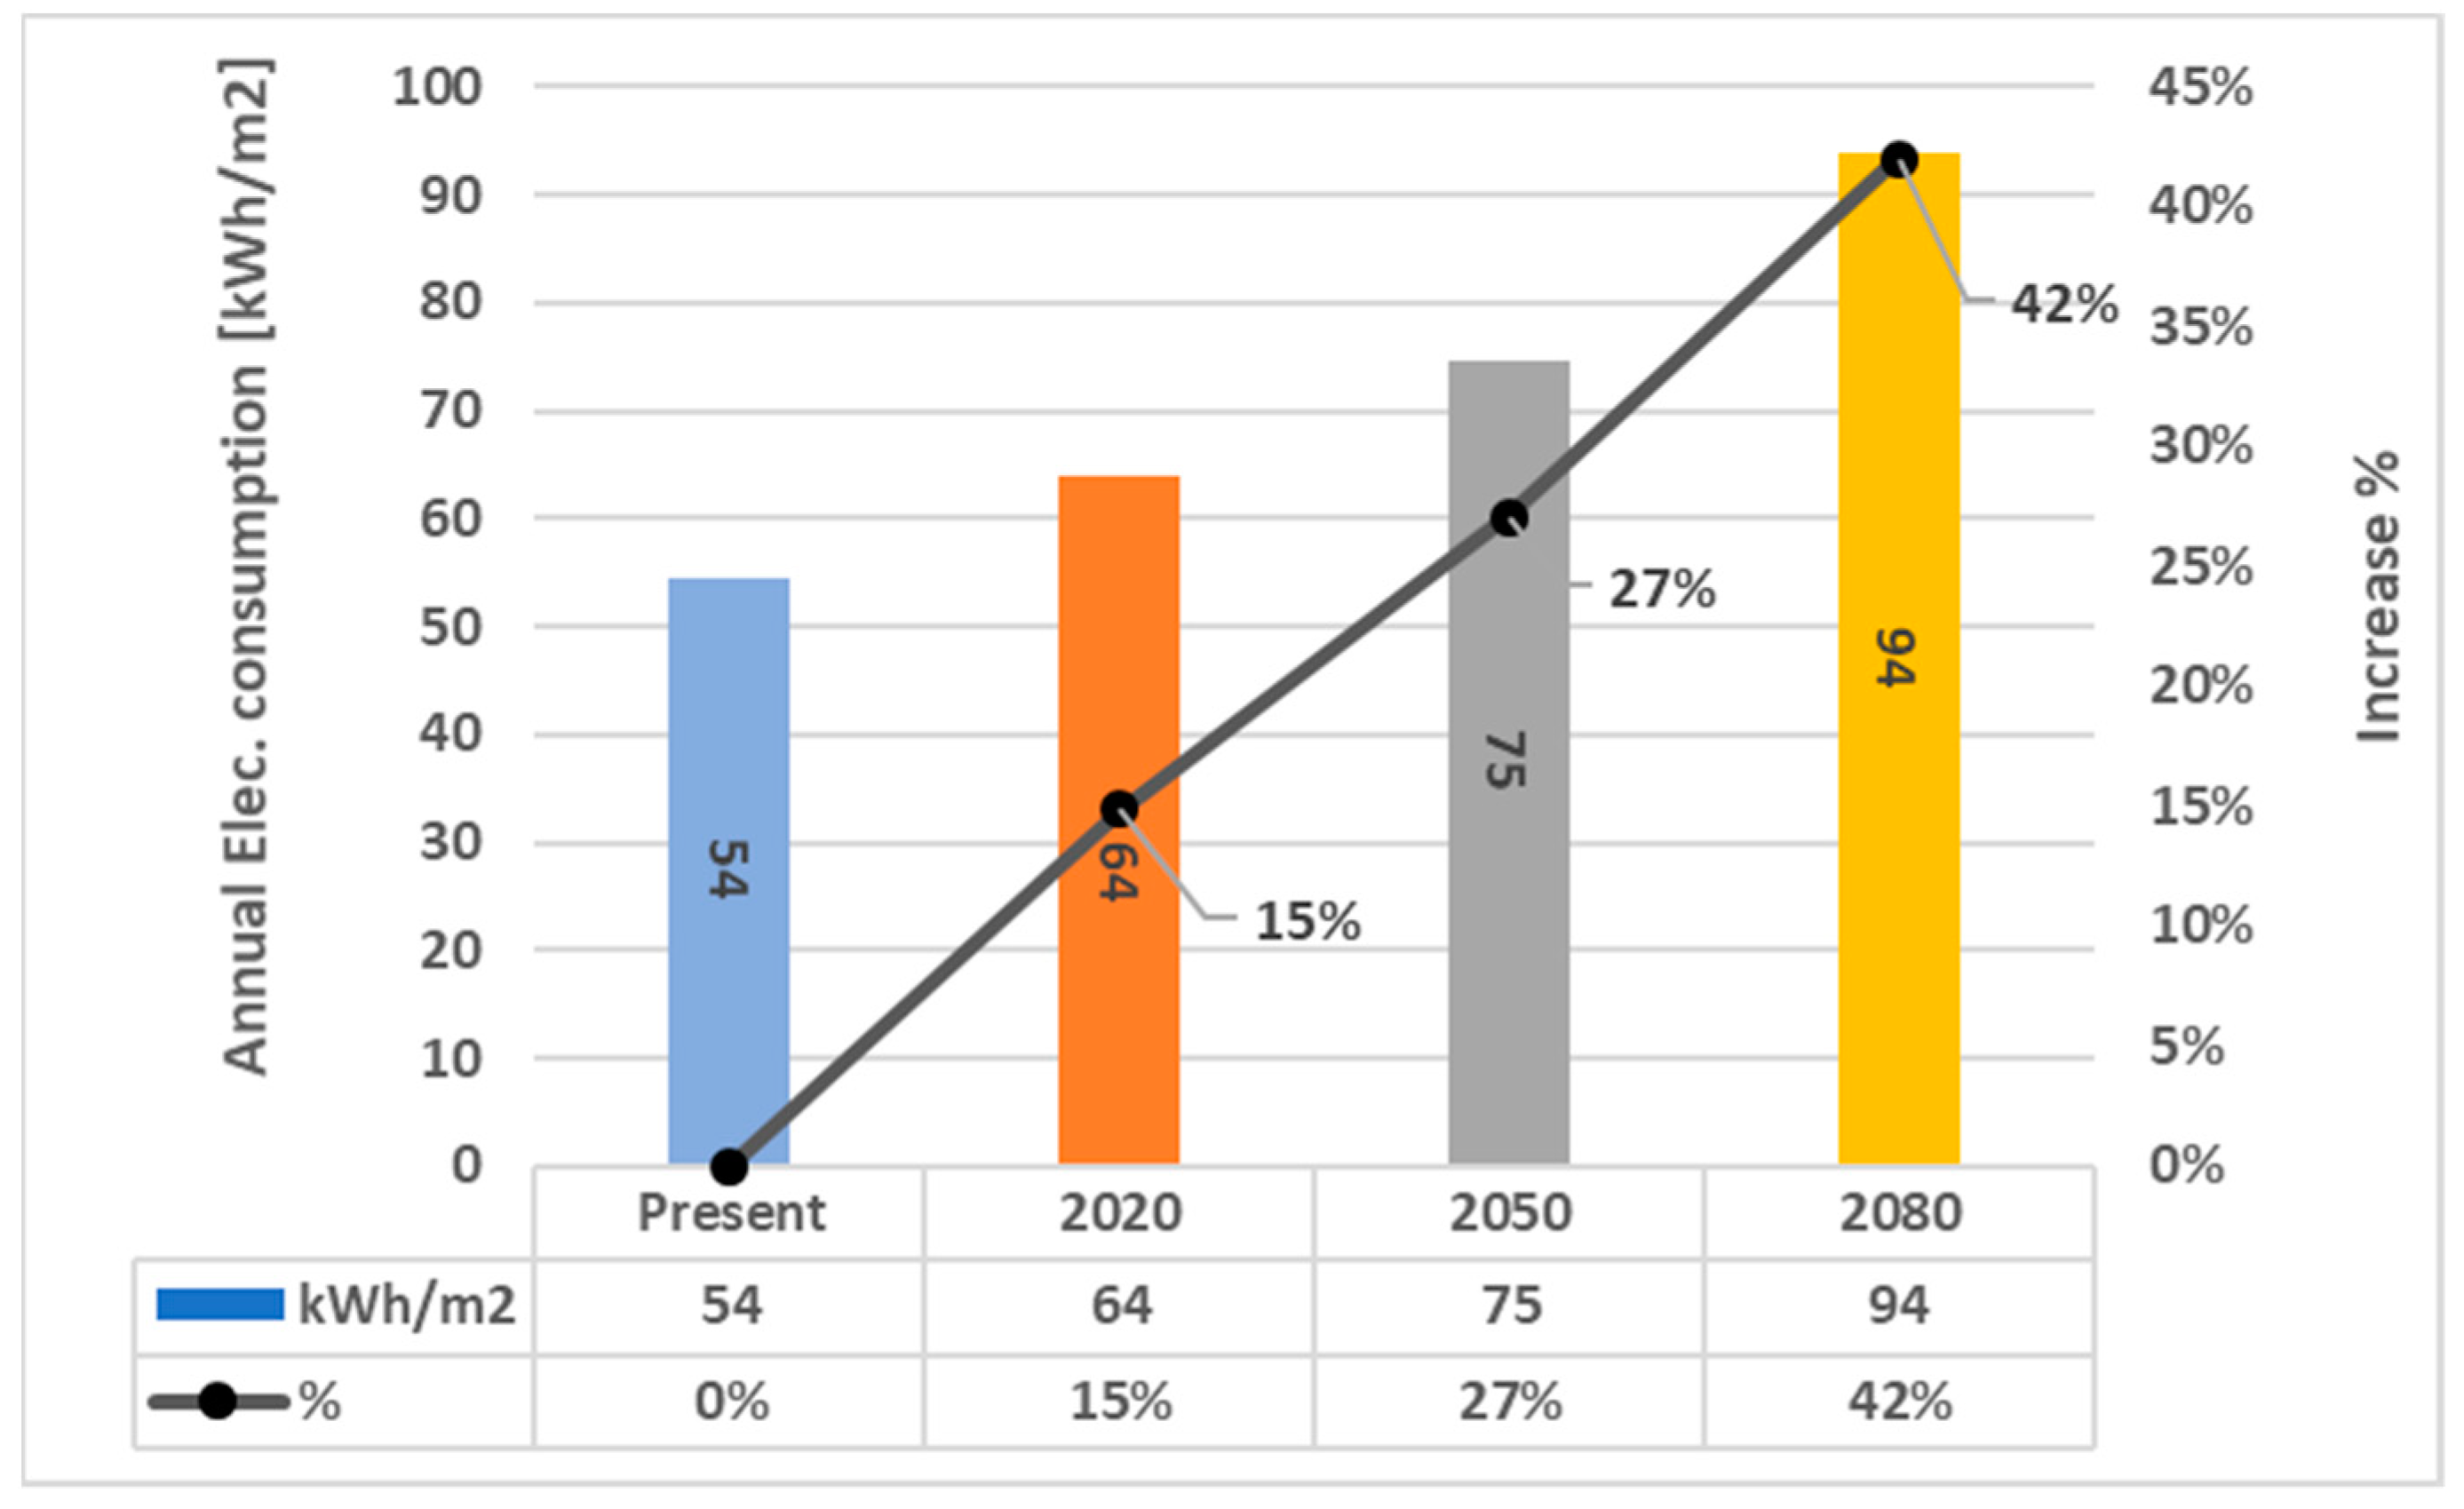
The increase in the external dry bulb temperatures will lead to a decrease in the split system performance, as shown in Figure 11. This decrease in performance will lead to a faster rate of increase in the electricity consumptions as shown in Figure 12.
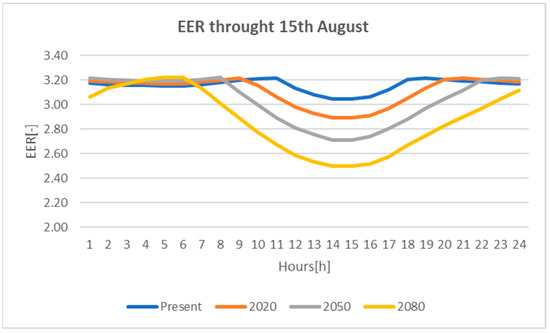
Figure 11.
The EER through 15th of August for the present and the predicted future in Hurghada.
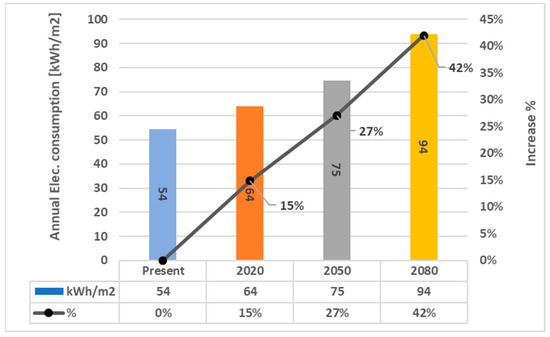
Figure 12.
Predicted increase in the annual electricity consumption in Hurghada.
After repeating the simulation campaign using the predicted future weather files, the rankings of the alternatives remained unchanged; the scores were noticed to be slightly changing in favor of the higher insulated alternatives, as shown in Figure 13. This is due to the projected increase in the cooling loads and the electricity prices.

Figure 13.
Variation of the ranking of the external wall alternatives in the predicted future; (a) the cavity wall with 4 cm of insulation; (b) the cavity wall with 6 cm of insulation.
4. Discussion
The predicted future weather files were analyzed, and it was found that the monthly average dry bulb temperatures in August was increasing from 5.33 °C in Cairo to 5.99 °C in Aswan. Moreover, the rate of increase in the summer is higher than the rate of increase in the winter. In Hurghada, the maximum daily average temperature in January was found to be increasing by a rate of 4.7%, while in July it was found to be 8.5%.
The choices available in the Egyptian market to passively decrease the cooling energy needs were found to be limited, due to the higher prices of importing such products and the current foreign currency policies Egypt is conducting. After studying the construction market in Egypt, the most viable options for the opaque part of the envelope are the clay bricks for the structural part and EPS for insulation. For the transparent part, different types of glazing are available, including double glazing; however, the prices of it are considerably high, due to the rarity of its usage in residential buildings.
The cooling energy needs were found to be slightly higher for the south-facing apartments, due to the higher solar exposure. The shading in form of horizontal overhangs and shutters, which are operating on a relatively low threshold—300 W/m2—help reduce the difference between the needs of the two orientations. In Cairo, the cooling energy needs are 119 kWh/m2 for the south-facing apartments, while they are 110 kWh/m2 for the north-facing apartments. The cooling energy needs are higher in Hurghada’s case, with 170 and 165 kWh/m2 for the two cases, respectively. The cooling needs further increase in the Aswan case, leading to 208 and 203 kWh/m2 for the two cases, respectively.
Applying the MCDA to all the alternatives, it can be noticed that, in both scenarios, the cavity wall and the 25 clay bricks alternatives have the highest scores. The 50-cm clay brick alternatives always have the lowest score. The scores of the alternatives are different across the three cities; however, the rankings are almost the same. A limitation of this study is not including the transportation from the factories to the targeted cities, which led to having close scores between cities. However, this information was neither available nor provided by the manufacturers.
Applying the optimal configuration found with the reduced lighting led to a minimum reduction of 40% in the annual cooling needs between the three cities, with a maximum payback period of 6.3 years.
The effect of the global warming on the cooling energy needs and consumption were studied in Hurghada; it was found that the cooling energy needs are expected to increase by 39% from 170 kWh/m2 under the present weather conditions up to 280.47 kWh/m2 in 2080. In addition, the peak cooling load is expected to increase by 23% from 4.52 kW to 5.52 kW, which, in this case, render the HVAC system undersized, as it exceeds the peak cooling load for the system. The EER in summer will decrease, due to the increase in the external temperatures. In Hurghada at 2 p.m. on the 15th of August, the EER is expected to drop from 3 to 2.5 in 2080. Consequently, the electricity consumption is expected to increase by 42% from 54 kWh/m2 under the present weather conditions to 94 kWh/m2. Finally, although the rankings of the alternatives have not changed, under the predicted future conditions, the scores of the higher insulated alternatives slightly increased, indicating shifting in favorability toward such alternatives.
5. Conclusions
The work addressed different methods to reduce cooling energy use in residential affordable buildings in Egypt, accounting for the negative effects of global warming. Three different cities were chosen to perform the analysis: Cairo, Hurghada and Aswan. After analyzing the weather of each city and identifying the similarities and differences of them, the generation of the climate change adapted weather files using the predictions of Hadley center’s global climate model, according to the A2 greenhouse gas emissions scenario of the SRES report, was conducted. According to this scenario, the dry bulb temperatures are expected to increase in higher rates in southern regions of Egypt, and the rate of increase was noticed to be higher in the summer months.
The usage and effective usage of shading led to having only slight difference in cooling energy needs between the simulated north and south apartments due to decreasing the effect of solar radiation effect and the external temperatures becoming the delimiting factor. These results will change when taking into account the absence or ineffective control of the shading.
The main goal of the MCDA is to find the optimum solution in accordance with the priorities of the stakeholders. In this study, two scenarios were studied: in the first one, all KPIs were distributed equally between the financial, energetic and the environmental parameters; in the second scenario, the energetic parameters were prioritized. Applying the MCDA, it was found that the double walls with air gap and insulation on the outside tended to have the highest scores on both scenarios studied, due to the relative low cost and the added layer of insulation in terms of air. The only downside of this technology is the decrease in the area of the rooms.
Despite the limitation of the Egyptian market when it comes to passively decreasing the cooling needs, the usage of the available options led to a decrease of almost 40%, on average, between the three cities with a maximum payback periods of 6.3 years.
Due to the expected increase in the ambient temperatures in the future, the cooling energy needs are expected to increase to up to 39% and the peak cooling load to 23% by 2080, which will lead to the HVAC systems being undersized. Moreover, the efficiency of the HVAC systems will decrease in performance, which will lead to further increase in the electricity consumption. Running the MCDA again, the higher insulated alternatives had higher scores; however, the rankings of the alternatives remained the same.
Author Contributions
Conceptualization, R.S.; methodology, R.S. and M.A.F.A.; software, M.A.F.A. and G.F.; validation, M.A.F.A., R.S. and G.F.; formal analysis, R.S.; investigation, M.A.F.A. and G.F.; writing—original draft preparation, M.A.F.A.; writing—review and editing, M.A.F.A. and R.S.; supervision, M.M.; funding acquisition, M.M. All authors have read and agreed to the published version of the manuscript.
Funding
This research was funded by United Nations Environment Programme, grant number DTIE17-EN006.
Data Availability Statement
Not applicable.
Conflicts of Interest
The authors declare no conflict of interest. The funders had no role in the design of the study; in the collection, analyses or interpretation of data; in the writing of the manuscript or in the decision to publish the results.
Appendix A
In this appendix, the prices of the materials collected from the BAT study and the environmental impact of the alternatives used will be reported.

Table A1.
Standard dimensions and prices of bricks used in Egypt.
Table A1.
Standard dimensions and prices of bricks used in Egypt.
| Type | Dimensions [cm] | Unit | Price [EGP] | Price [€] |
|---|---|---|---|---|
| Standard dimensions | 25 × 12 × 6.5 | Thousands bricks | 950 | 53.2 |
| 25 × 12 × 13 | 1750 | 98 | ||
| Special dimensions | 24 × 11 × 6 | 730 | 41 | |
| 24 × 11 × 12 | 1250 | 70 |

Table A2.
Expanded polystyrene (EPS) dimensions and prices in Egypt.
Table A2.
Expanded polystyrene (EPS) dimensions and prices in Egypt.
| Type | Price [EGP/m2] | Price [€/m2] |
|---|---|---|
| EPS with male/female set edges density 36 [kg/m3] | 32.56 | 1.82 |
| EPS with flat edges density 32 [kg/m3] | 29.84 | 1.67 |
| Rockwool panels 5cm density 70 [kg/m3] | 60 | 3.36 |

Table A3.
List of different glazing types and prices.
Table A3.
List of different glazing types and prices.
| Type | Price [EGP/m2] | Price [€/m2] |
|---|---|---|
| Clear 3 mm | 85 | 4.76 |
| Clear 4 mm | 110 | 6.16 |
| Clear 6 mm | 153 | 8.57 |
| Bronze 4 mm | 205 | 11.48 |
| Bronze 6 mm | 320 | 17.92 |
| Green 4 mm | 230 | 12.88 |
| Green 6 mm | 325 | 18.2 |
| Clear tempered 4 mm | 167 | 9.35 |
| Clear tempered 6 mm | 275 | 15.4 |
| Bronze tempered 4 mm | 250 | 14 |
| Bronze tempered 6 mm | 388 | 21.73 |
| Green tempered 6 mm | 400 | 22.4 |
| Double pane clear air gap “6–12–6” | 3000 | 168 |
| Double low e air gap “3–12–6” | 3750 | 210 |
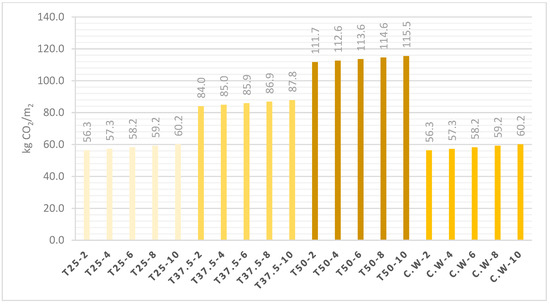
Figure A1.
CO2 emissions from the material manufacturing for the opaque alternatives.
Figure A1.
CO2 emissions from the material manufacturing for the opaque alternatives.
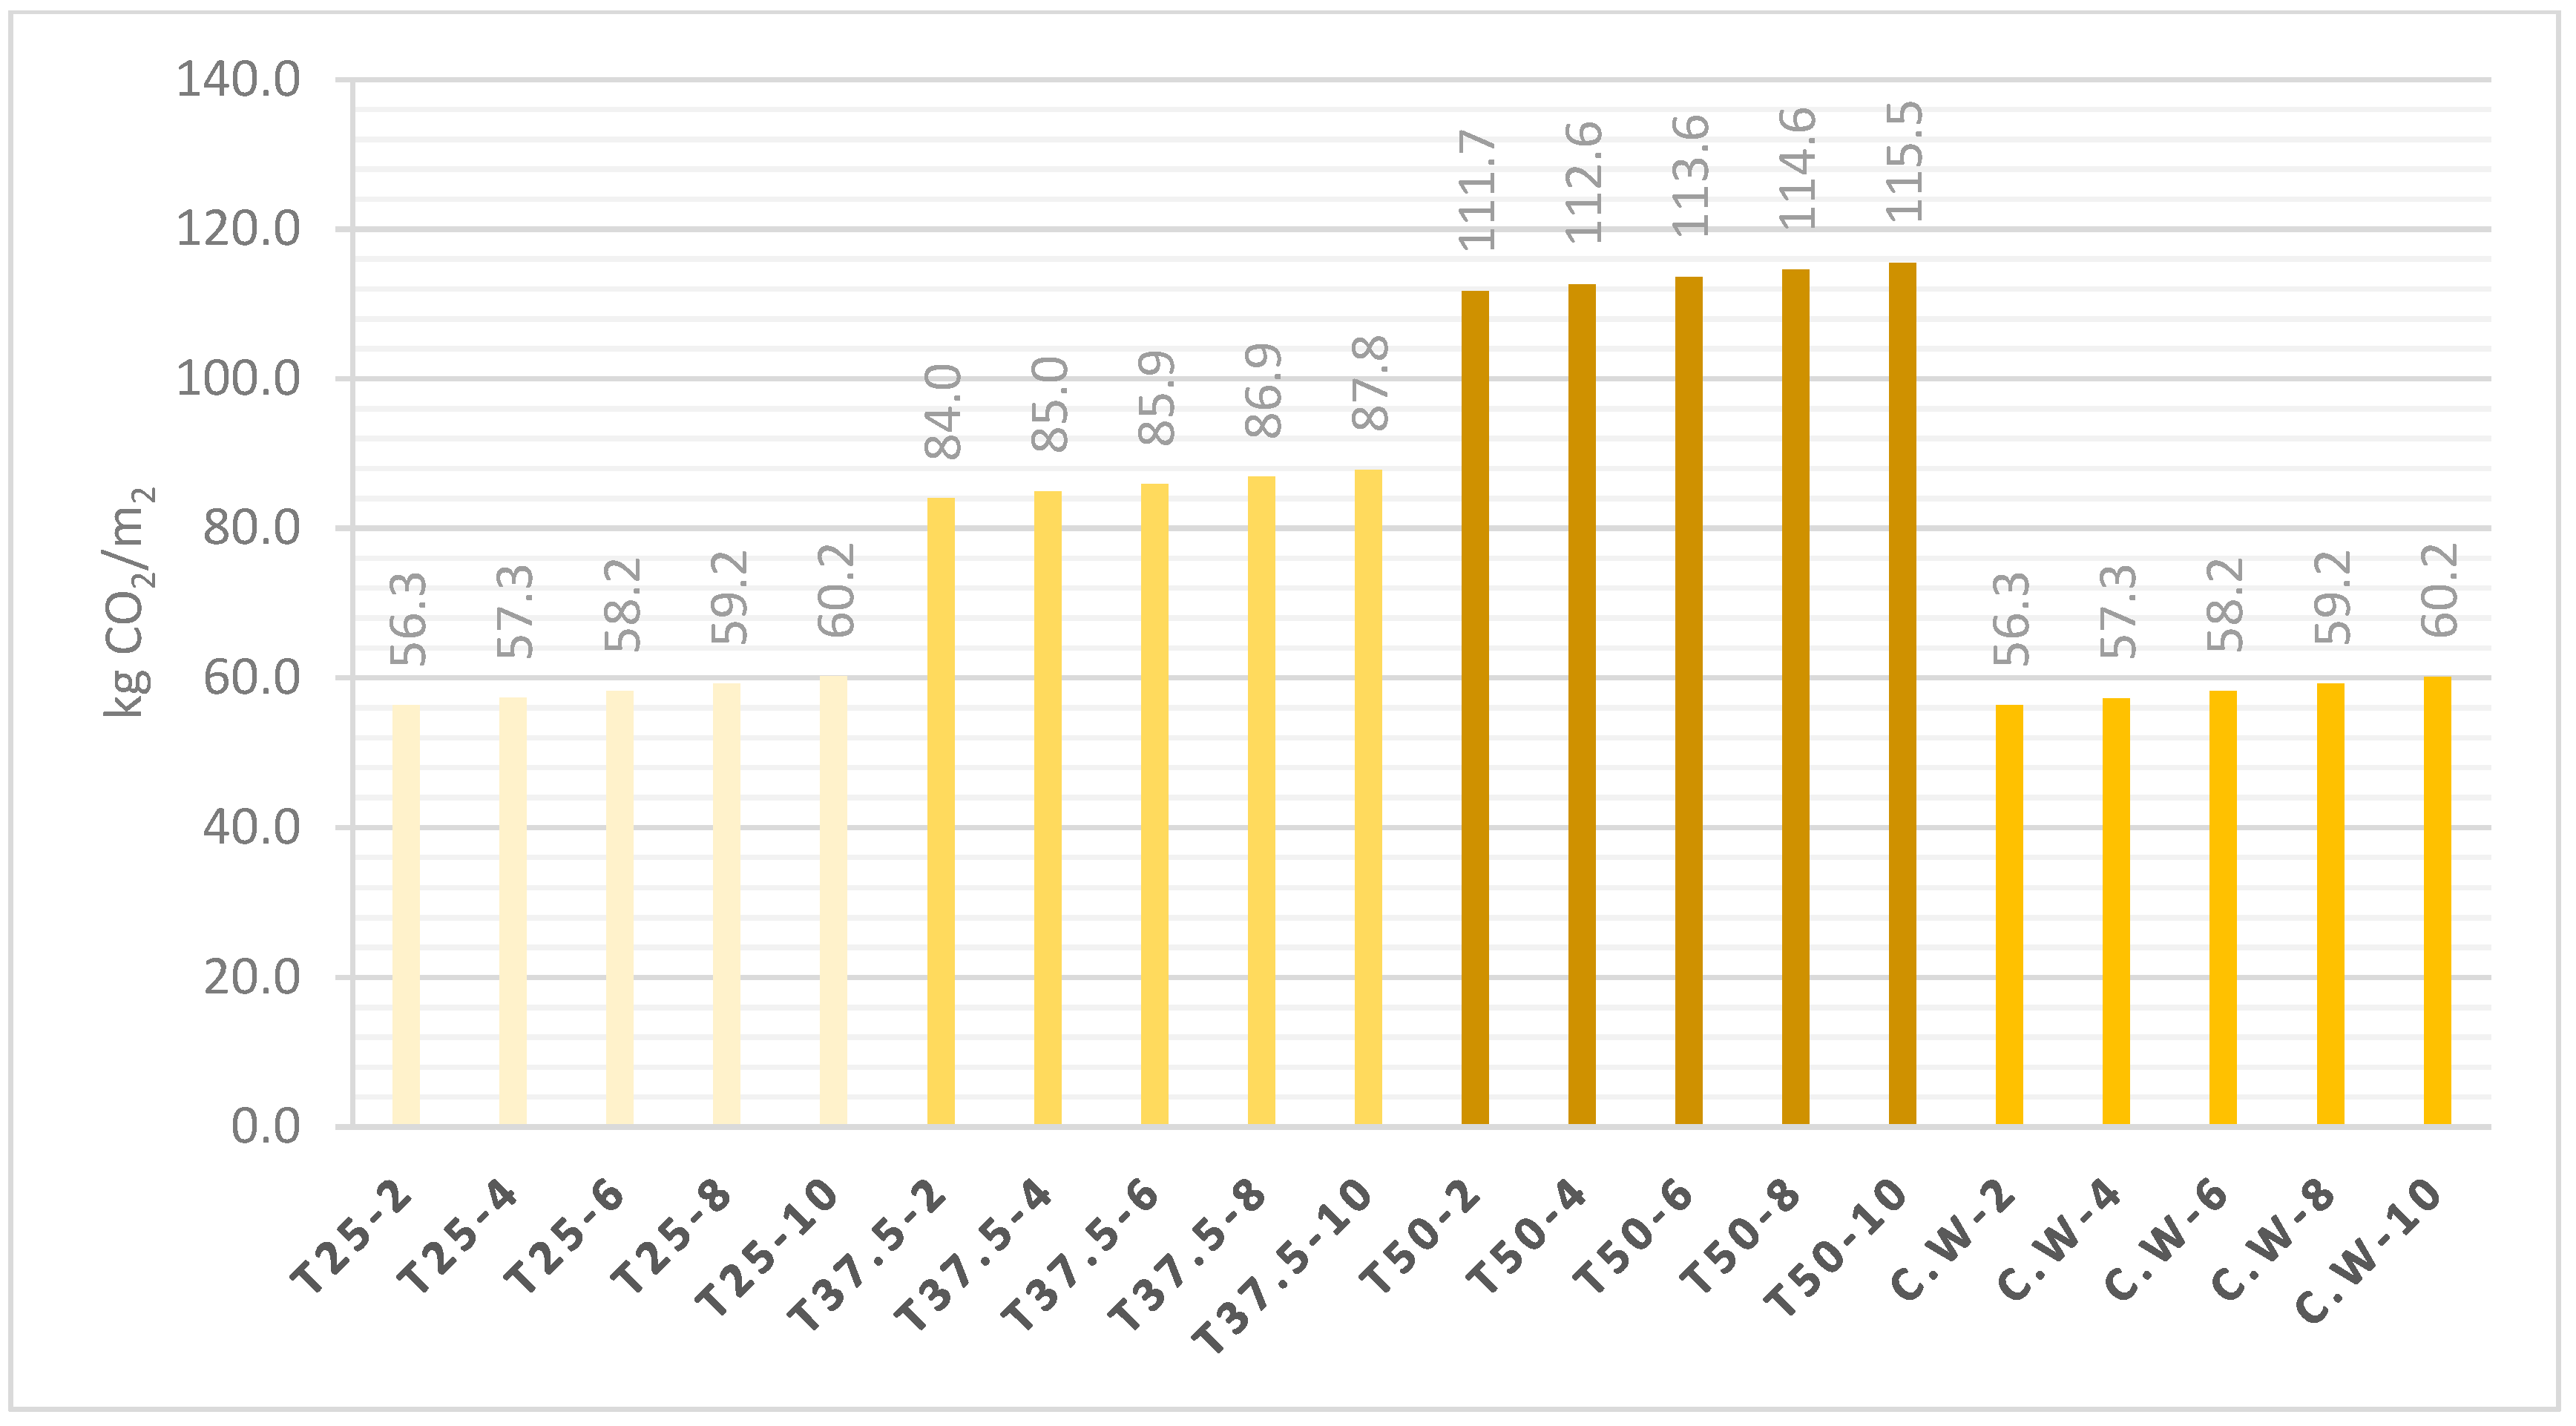
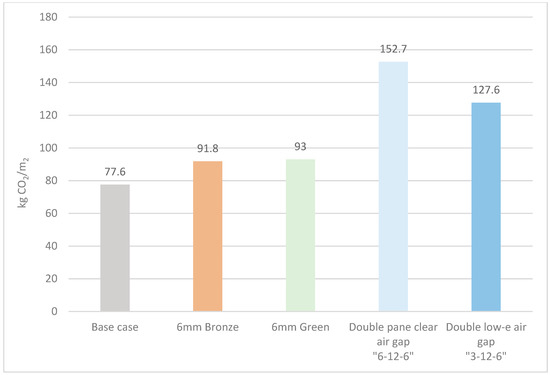
Figure A2.
CO2 emissions from the material manufacturing for the transparent alternatives.
Figure A2.
CO2 emissions from the material manufacturing for the transparent alternatives.
Appendix B
In this appendix, the morphing procedure will be illustrated as in [14]. The morphing procedure contains three generic operations; the choice of choosing which operation to choose is based on the data presented on the climate change scenario. The three operations are
- Shift: Used when the climate change scenario is presented as an absolute change to the mean.
- Stretch: Used when the climate change scenario is presented as a change to the mean or the variance as a percentage or fractional change rather than an absolute increment or when the variable can be put down to zero periodically altogether like in the case of irradiance.
- Shift+Stretch: Used when the change is happening to both the mean and the variance.
- For the dry bulb temperature, The HadCM3 data provides mean, average daily maximum and minimum temperature change predictions. So, the operation done will be Shift+Stretch as follows:where:
- αdbtm = Scaling factor for monthly dry bulb temperature variance change.
- ∆TMAX = HadCM3 predicted absolute change of the average daily maximum dry bulb temperature for the given month m (°C).
- ∆TMINm = HadCM3 predicted absolute change of the average daily minimum dry bulb temperature for the given month m (°C).
where:- = Future dry bulb temperature (°C).
- . = Current weather dry bulb temperature (°C).
- . = HadCM3 predicted absolute change of the mean dry bulb temperature for the given month m (°C).
- = Mean dry bulb temperature of the current weather for any given month (°C)
- For the atmospheric pressure, HadCM3 data gives predictions for the absolute change in the mean sea level pressure in Millibar (mbar), which is converted later to Pascal (Pa). The atmospheric pressure is shifted as follows:where:
- = HadCm3 predicted absolute change of the mean sea level pressure for the given month m (Pa).
- For the dew point temperatures, HadCM3 does not contain any predictions, but it does provide specific humidity predictions by a relative change. A stretch operation is performed as follows:where:
- = Scaling factor for monthly specific humidity change.
- = HadCM3 predicted relative change of the specific humidity for the given month m (%)
The future specific humidity for a given hour is then calculated:where:- = The future predicted specific humidity (kg/kg).
After calculating the predicted specific humidity, the future humidity ratio is then calculated as stated in ASHRAE-Fundamentals [17]:where:- = The future humidity ratio (kg/kg)
The partial pressure of water vapor pressure is then calculated as follows:where:- PV = Future water vapor partial pressure (kPa)
- Pat = Future atmospheric pressure calculated according to Equation (A3) (kPa).
Then the dew point temperature is calculated as mentioned in ASHRAE-Fundamentals [17] for temperatures from 0 to 93 °Cwhere:- = Future predicted dew point temperature (°C)
- are constants = 6.54, 14.526, 0.7389, 0.09486 and 0.4569, respectively.
- = For the relative humidity, Although [14] does not provide any formulas to morph the relative humidity, HadCM3 contains relative humidity predictions as an absolute value. A shift function is then applied as follows:where:
- φ = Future relative humidity (%)
- ∆RHUMm = HadCM3 predicted absolute change of the mean relative humidity for the given month m (%).
References
- Atlam, B.M.; Rapiea, A.M. Assessing the future of energy security in Egypt. Int. J. Energy Econ. Policy 2016, 6, 684–700. [Google Scholar]
- Obukhov, S.; Ibrahim, A.; Kozyreva, A.; Zhdanova, A.; Kuznetsov, G. Analysis of the energy potential of renewable energy sources Egypt. In MATEC Web of Conferences; EDP Sciences: Les Ulis, France, 2017; Volume 141, p. 01035. [Google Scholar] [CrossRef]
- Annual Report 2019; New & Renewable Energy Authority: Cairo, Egypt. Available online: http://nrea.gov.eg/Content/reports/English%20AnnualReport%202019.pdf (accessed on 29 October 2019).
- Abdelazim, A.I.; Ibrahim, A.M.; Aboul-Zahab, E.M. Development of an energy efficiency rating system for existing buildings using Analytic Hierarchy Process—The case of Egypt. Renew. Sustain. Energy Rev. 2017, 71, 414–425. [Google Scholar] [CrossRef]
- Renewable Energy Outlook; International Renewable Energy Agency: Cairo, Egypt, 2018. Available online: https://www.irena.org/-/media/Files/IRENA/Agency/Publication/2018/Oct/IRENA_Outlook_Egypt_2018_En.pdf (accessed on 29 October 2019).
- Caponigro, M.; Manoloudis, A.; Papadopoulos, A.M. Developing a strategy for energy efficiency in the Egyptian building sector. In IOP Conference Series: Earth and Environmental Science; IOP Publishing: Bristol, UK, 2020; Volume 410, p. 012076. [Google Scholar] [CrossRef]
- Causone, F.; Pietrobon, M.; Pagliano, L.; Erba, S. A high performance home in the Mediterranean climate: From the design principle to actual measurements. Energy Procedia 2017, 140, 67–79. [Google Scholar] [CrossRef]
- Sesana, E.; Bertolin, C.; Gagnon, A.; Hughes, J. Mitigating climate change in the cultural built heritage sector. Climate 2019, 7, 90. [Google Scholar] [CrossRef]
- Saleem, A.A.; Abel-Rahman, A.K.; Ali, A.H.H.; Ookawara, S. An analysis of thermal comfort and energy consumption within public primary schools in Egypt. IAFOR J. Sustain. Energy Environ. 2016, 3. [Google Scholar] [CrossRef]
- Beck, H.E.; Zimmermann, N.E.; McVicar, T.R.; Vergopolan, N.; Berg, A.; Wood, E.F. Present and future Köppen-Geiger climate classification maps at 1-km resolution. Sci. Data 2018, 5, 180214. [Google Scholar] [CrossRef] [PubMed]
- World Bank Climate Change Knowledge Portal|for Global Climate Data and Information! Available online: https://climateknowledgeportal.worldbank.org/country/egypt/climate-data-projections (accessed on 29 October 2019).
- Nakicenovic, J.F.; Alcamo, J.; Davis, G.; de Vries, B.; Gaffin, T.K.; Gregory, K.; Griibler, A.; Jung, T.; Rovere, T.; Michaelis, L.; et al. Special Report on Emissions Scenarios; The Edinburgh Building: Cambridge, UK, 2000. [Google Scholar]
- What Is a GCM? Available online: https://www.ipcc-data.org/guidelines/pages/gcm_guide.html (accessed on 29 October 2019).
- Belcher, S.; Hacker, J.; Powell, D. Constructing design weather data for future climates. Build. Serv. Eng. Res. Technol. 2005, 26, 49–61. [Google Scholar] [CrossRef]
- IPCC DDC: Download HadCM3 Scenario Data. Available online: http://phobos.badc.rl.ac.uk/sres/hadcm3_download.html (accessed on 31 October 2019).
- Integrated Environmental Solutions|IES. Available online: https://www.iesve.com/ (accessed on 8 October 2020).
- ASHRAE—Fundamentals 2017—SI Edition; ASHRAE: Atlanta, GA, USA, 2017. Available online: https://www.ashrae.org/File%20Library/Technical%20Resources/ASHRAE%20Handbook/I-P_F2017-IndexIX.pdf (accessed on 8 October 2020).
- Energy Performance of Buildings—Schedule and Condition of Building, Zone and Space Usage for Energy Calculation; BSI Standards Publication: London, UK, 2018.
- Slim 1Way Cassette 4Way Cassette S (600 × 600) 4Way Cassette S Slim Duct MSP (Middle Static Pressure) Duct Console Ceiling Maldives SINGLE; Product Suwon: Seoul, Korea, 2015.
- Serghides, D.K.; Georgakis, C.G. The building envelope of Mediterranean houses: Optimization of mass and insulation. J. Build. Phys. 2012, 36, 83–98. [Google Scholar] [CrossRef]
- Chamodrakas, I.; Martakos, D. A utility-based fuzzy TOPSIS method for energy efficient network selection in heterogeneous wireless networks. Appl. Soft Comput. J. 2012, 12, 1929–1938. [Google Scholar] [CrossRef]
- Alao, M.A.; Ayodele, T.R.; Ogunjuyigbe, A.S.O.; Popoola, O.M. Multi-criteria decision based waste to energy technology selection using entropy-weighted TOPSIS technique: The case study of Lagos, Nigeria. Energy 2020, 201, 117675. [Google Scholar] [CrossRef]
- Abdallah, L.; El-shennawy, D. Evaluation of CO2 emissions from electricity generation in Egypt: Present status and projections to 2030. Eur. Mediterr. J. Environ. Integr. 2020, 5, 49. [Google Scholar] [CrossRef] [PubMed]
Publisher’s Note: MDPI stays neutral with regard to jurisdictional claims in published maps and institutional affiliations. |
© 2021 by the authors. Licensee MDPI, Basel, Switzerland. This article is an open access article distributed under the terms and conditions of the Creative Commons Attribution (CC BY) license (http://creativecommons.org/licenses/by/4.0/).

