Intervention of Climate-Smart Practices in Wheat under Rice-Wheat Cropping System in Nepal


 ,
,  ,
,  and
and 
Abstract
1. Introduction
2. Materials and Methods
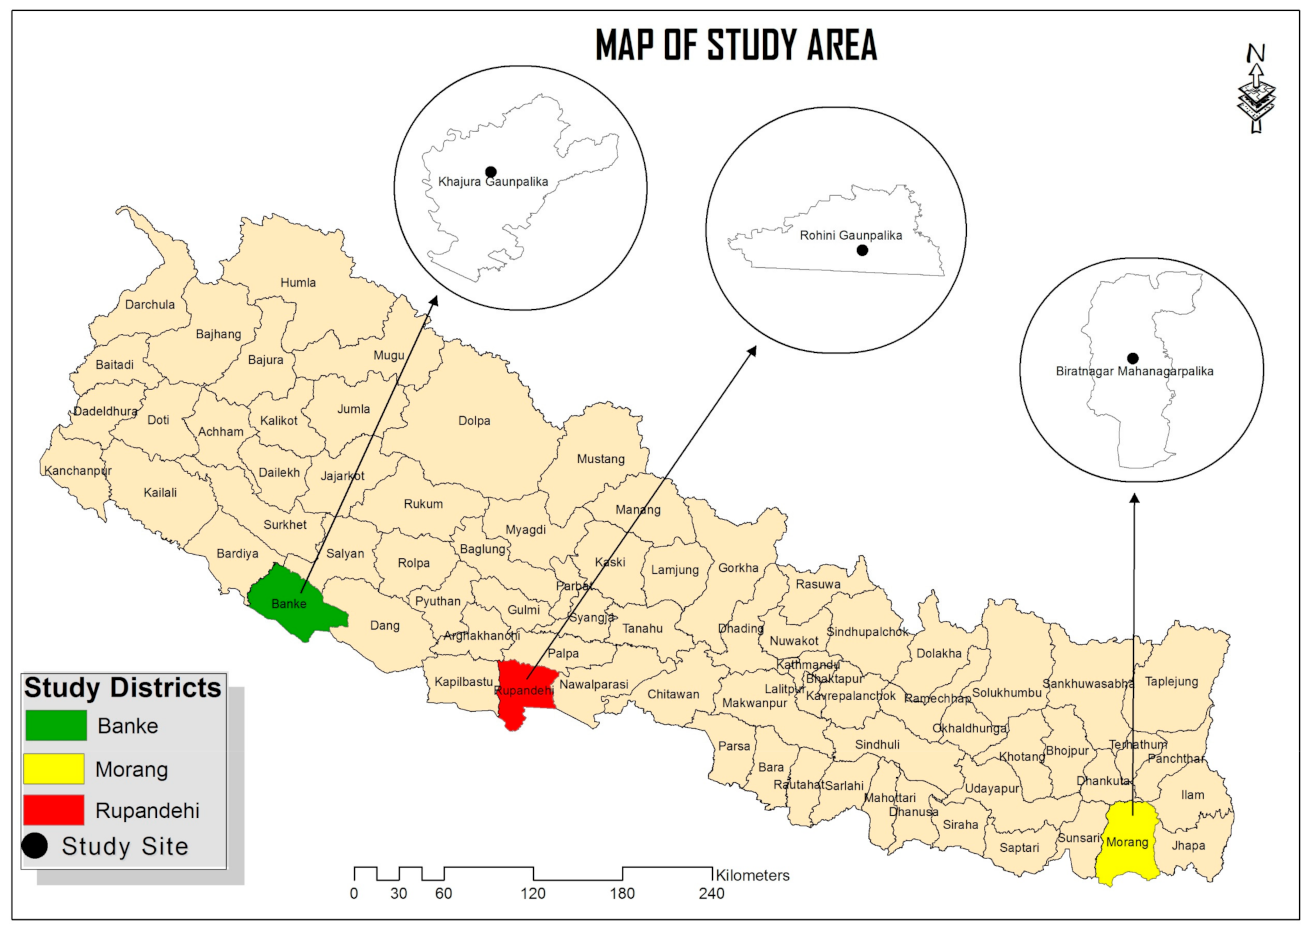
2.1. Study Location
2.2. Climate
2.3. Soil
2.4. Experimental Design and Treatment
2.5. Data Collection
2.6. Statistical Analysis
3. Results
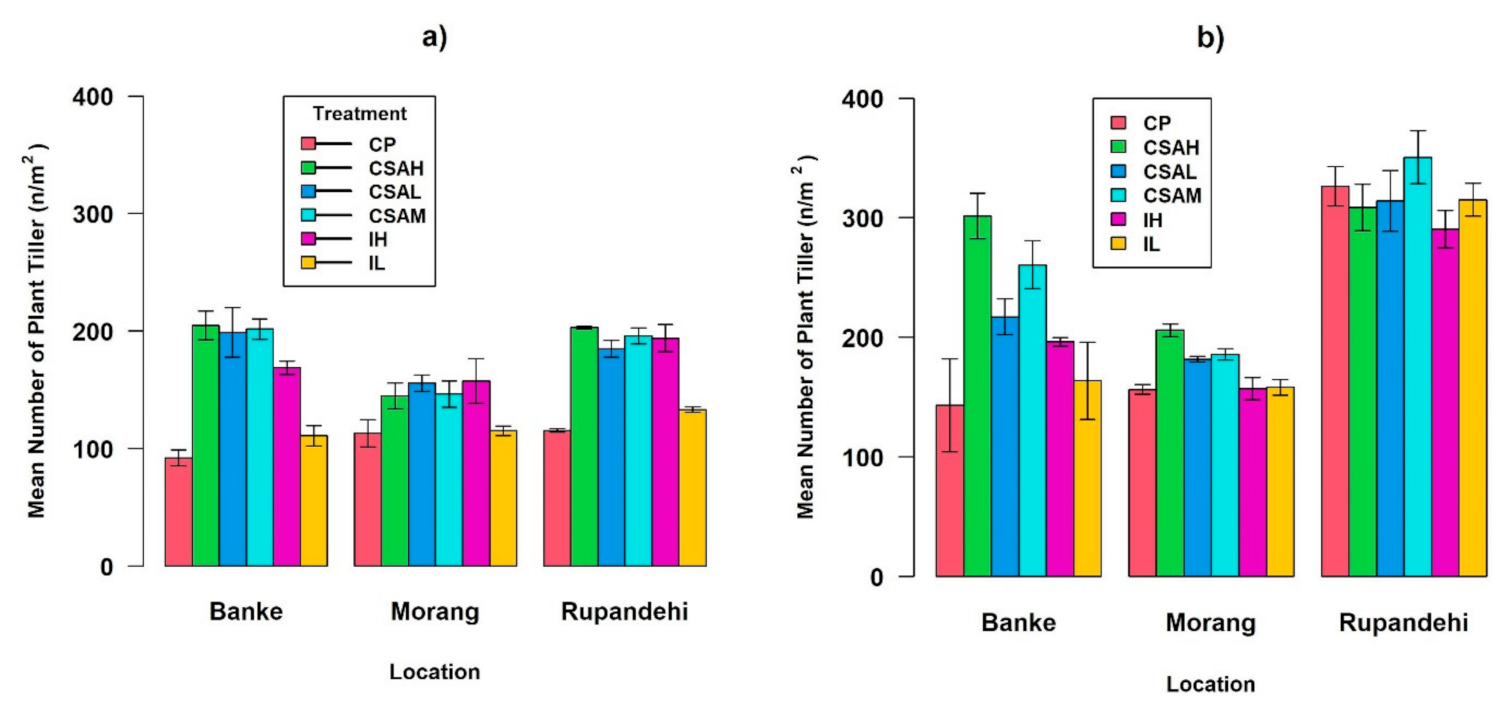
3.1. Plant Population/Tiller Per Square Meter
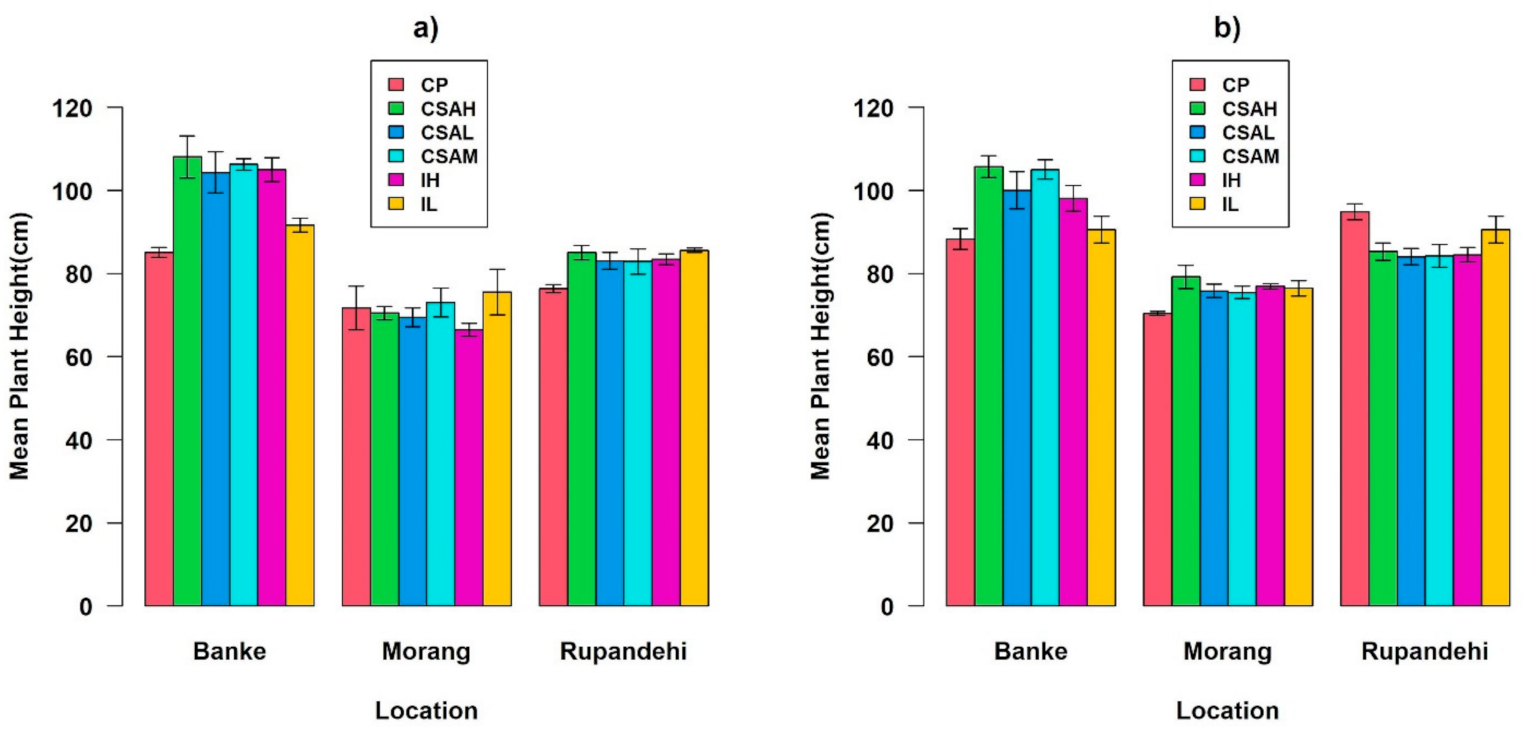
3.2. Plant Height
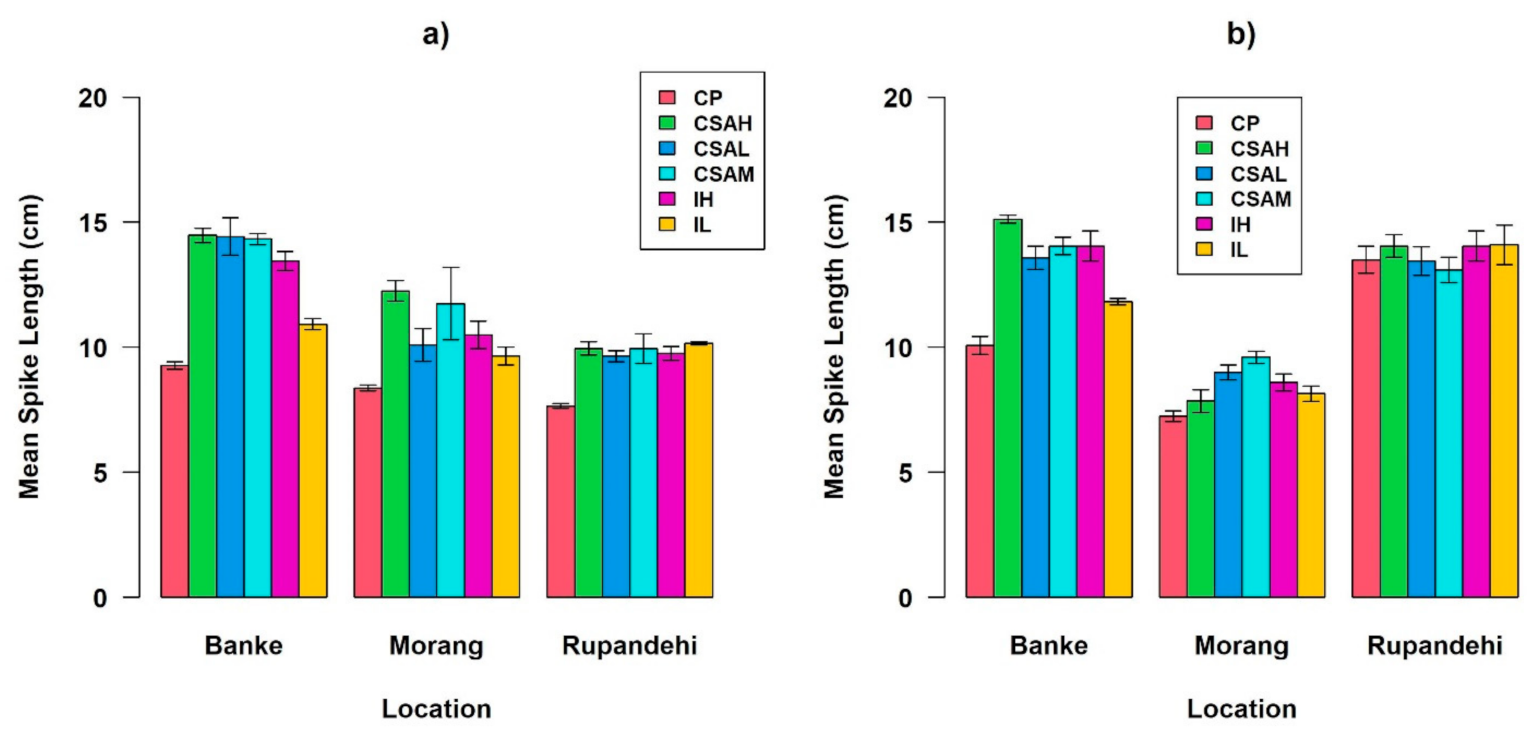
3.3. Spike Length
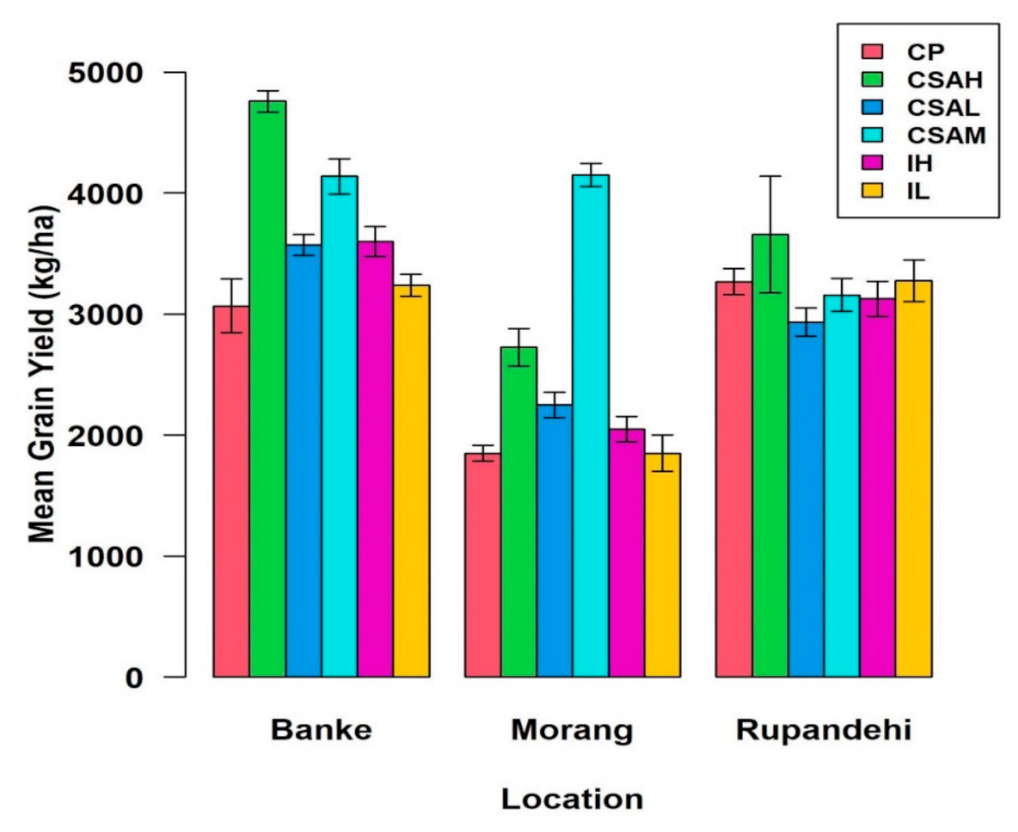
3.4. Grain Yield
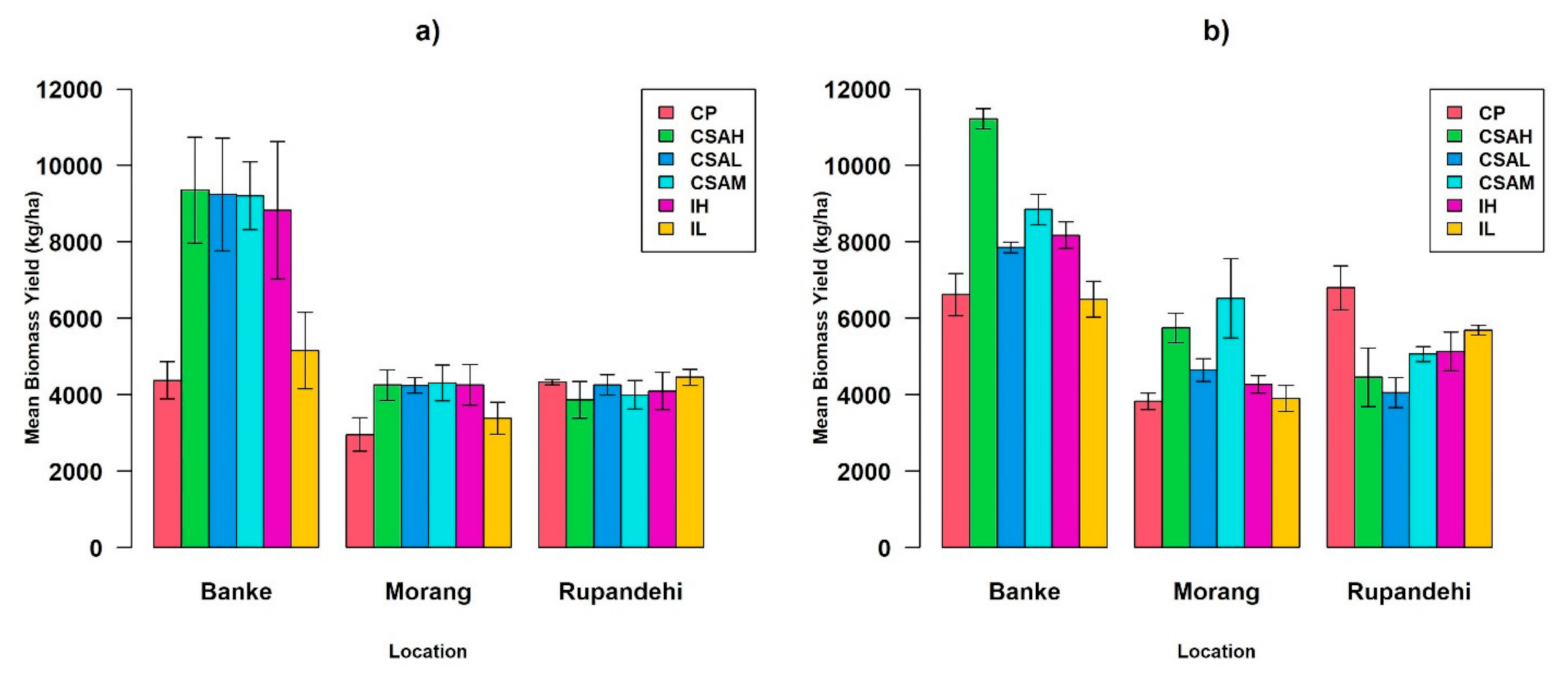
3.5. Biomass Yield
3.6. Thousand Kernel Weight
3.7. Correlation among Observed Parameters
4. Discussion
5. Conclusions
Supplementary Materials
Author Contributions
Funding
Institutional Review Board Statement
Informed Consent Statement
Data Availability Statement
Acknowledgments
Conflicts of Interest
References
- Ministry of Agriculture and Co-Operatives—MOAC, Singhadarbar, Kathmandu Nepal. Statistical Information on Nepalese Agriculture. 2014. Available online: https://nepalindata.com/resource/statistical-information-on-nepalese-agriculture-2013-2014/ (accessed on 25 September 2020).
- Gairhe, S.; Karki, T.; Upadhyay, N.; Sapkota, S. Trend Analysis of Wheat Area, Production and Productivity in Nepal: An Overview; Nepal Agricultural Research Council: Khumaltar, Nepal, 2019.
- Chatrath, R.; Mishra, B.; Ortiz Ferrara, G.; Singh, S.K.; Joshi, A.K. Challenges to Wheat Production in South Asia. Euphytica 2007, 157, 447–456. [Google Scholar] [CrossRef]
- Kataki, P.K.; Hobbs, P.; Adhikary, B. The Rice-Wheat Cropping System of South Asia. J. Crop Prod. 2001, 3, 1–26. [Google Scholar] [CrossRef]
- Park, A.G.; Davis, A.S.; McDonald, A.J. Priorities for Wheat Intensification in the Eastern Indo-Gangetic Plains. Glob. Food Sec. 2018, 17, 1–8. [Google Scholar] [CrossRef]
- Ghimire, D.; Panday, D. Interconnection of Climate Change, Agriculture and Climate Justice: Complexities for Feeding the World under Changing Climate. Development 2016, 59, 270–273. [Google Scholar] [CrossRef]
- Malla, G. Climate Change and Its Impact on Nepalese Agriculture. J. Agric. Environ. 2008, 9, 62–71. [Google Scholar] [CrossRef]
- Joshi, G.R.; Joshi, B. Climate Change Impact on Agricultural Sector of Nepal: Implications for Adaptation and Resilience Building. In Agricultural Transformation in Nepal: Trends, Prospects, and Policy Options; Thapa, G., Kumar, A., Joshi, P.K., Eds.; Springer: Singapore, 2019; pp. 119–155. [Google Scholar] [CrossRef]
- Aggarwal, P.K.; Bandyopadhyay, S.K.; Pathak, H.; Kalra, N.; Chander, S.; Kumar, S. Analysis of Yield Trends of the Rice-Wheat System in North-Western India. Outlook Agric. 2000, 29, 259–268. [Google Scholar] [CrossRef]
- Maharjan, K.L.; Joshi, N.P. Effect of Climate Variables on Yield of Major Food-Crops in Nepal: A Time-Series Analysis. In Climate Change, Agriculture and Rural Livelihoods in Developing Countries; Maharjan, K.L., Joshi, N.P., Eds.; Advances in Asian Human-Environmental Research; Springer: Tokyo, Japan, 2013; pp. 127–137. [Google Scholar] [CrossRef]
- Nayava, J.L.; Singh, R.; Bhatta, M.R. Impact of Climate, Climate Change and Modern Technology on Wheat Production in Nepal: A Case Study at Bhairahawa. J. Hydrol. Meteorol. 2009, 6, 1–14. [Google Scholar] [CrossRef]
- Hernandez-Ochoa, I.M.; Asseng, S.; Kassie, B.T.; Xiong, W.; Robertson, R.; Luz Pequeno, D.N.; Sonder, K.; Reynolds, M.; Babar, M.A.; Molero Milan, A.; et al. Climate Change Impact on Mexico Wheat Production. Agric. For. Meteorol. 2018, 263, 373–387. [Google Scholar] [CrossRef]
- Farhangfar, S.; Bannayan, M.; Khazaei, H.R.; Baygi, M.M. Vulnerability Assessment of Wheat and Maize Production Affected by Drought and Climate Change. Int. J. Disaster Risk Reduct. 2015, 13, 37–51. [Google Scholar] [CrossRef]
- Harkness, C.; Semenov, M.A.; Areal, F.; Senapati, N.; Trnka, M.; Balek, J.; Bishop, J. Adverse Weather Conditions for UK Wheat Production under Climate Change. Agric. For. Meteorol. 2020, 282–283, 107862. [Google Scholar] [CrossRef]
- Hussain, J.; Khaliq, T.; Ahmad, A.; Akhter, J.; Asseng, S. Wheat Responses to Climate Change and Its Adaptations: A Focus on Arid and Semi-Arid Environment. Int. J. Environ. Res. 2018, 12, 117–126. [Google Scholar] [CrossRef]
- Ahmad, A.; Ashfaq, M.; Rasul, G.; Wajid, S.A.; Khaliq, T.; Rasul, F.; Saeed, U.; Rahman, M.H.; Hussain, J.; Ahmad Baig, I.; et al. Impact of Climate Change on the Rice–Wheat Cropping System of Pakistan. In Series on Climate Change Impacts, Adaptation, and Mitigation; Imperial College, ASA, CSSA, and SSSA Publication: Madison, WI, USA, 2015; Volume 4, pp. 219–258. [Google Scholar] [CrossRef]
- Chandra, A.; McNamara, K.E.; Dargusch, P. Climate-Smart Agriculture: Perspectives and Framings. Clim. Policy 2018, 18, 526–541. [Google Scholar] [CrossRef]
- Totin, E.; Segnon, A.C.; Schut, M.; Affognon, H.; Zougmoré, R.B.; Rosenstock, T.; Thornton, P.K. Institutional Perspectives of Climate-Smart Agriculture: A Systematic Literature Review. Sustainability 2018, 10, 1990. [Google Scholar] [CrossRef]
- Khatri-Chhetri, A.; Aggarwal, P.K.; Joshi, P.K.; Vyas, S. Farmers’ Prioritization of Climate-Smart Agriculture (CSA) Technologies. Agric. Syst. 2017, 151, 184–191. [Google Scholar] [CrossRef]
- Subedi, R.; Bhatta, L.D.; Udas, E.; Agrawal, N.K.; Joshi, K.D.; Panday, D. Climate-Smart Practices for Improvement of Crop Yields in Mid-Hills of Nepal. Cogent Food Agric. 2019, 5, 1631026. [Google Scholar] [CrossRef]
- Paudel, B.; Khanal, R.C.; Kc, A.; Bhatta, K.; Chaudhary, P. Climate-Smart Agriculture in Nepal; LIBIRD: Pokhara, Nepal, 2017; p. 12. [Google Scholar]
- Bahri, H.; Annabi, M.; Cheikh M’Hamed, H.; Frija, A. Assessing the Long-Term Impact of Conservation Agriculture on Wheat-Based Systems in Tunisia Using APSIM Simulations under a Climate Change Context. Sci. Total Environ. 2019, 692, 1223–1233. [Google Scholar] [CrossRef]
- Li, Y.; Li, Z.; Cui, S.; Jagadamma, S.; Zhang, Q. Residue Retention and Minimum Tillage Improve Physical Environment of the Soil in Croplands: A Global Meta-Analysis. Soil Tillage Res. 2019, 194, 104292. [Google Scholar] [CrossRef]
- Kraut-Cohen, J.; Zolti, A.; Shaltiel-Harpaz, L.; Argaman, E.; Rabinovich, R.; Green, S.J.; Minz, D. Effects of Tillage Practices on Soil Microbiome and Agricultural Parameters. Sci. Total Environ. 2020, 705, 135791. [Google Scholar] [CrossRef]
- Sokolowski, A.C.; Prack McCormick, B.; De Grazia, J.; Wolski, J.E.; Rodríguez, H.A.; Rodríguez-Frers, E.P.; Gagey, M.C.; Debelis, S.P.; Paladino, I.R.; Barrios, M.B. Tillage and No-Tillage Effects on Physical and Chemical Properties of an Argiaquoll Soil under Long-Term Crop Rotation in Buenos Aires, Argentina. Int. Soil Water Conserv. Res. 2020, 8, 185–194. [Google Scholar] [CrossRef]
- Khalid, U.; Ejaz Ahmad, K.; Niamatullah, K.; Abdur, R.; Fazal, Y.; Saleem, U.D. Response of Wheat to Tillage Plus Rice Residue and Nitrogen Management in Rice-Wheat System. J. Integr. Agric. 2014, 13, 2389–2398. [Google Scholar] [CrossRef]
- Alam, M.M.; Ladha, J.K.; Foyjunnessa; Rahman, Z.; Khan, S.R.; Harun-ur-Rashid; Khan, A.H.; Buresh, R.J. Nutrient Management for Increased Productivity of Rice–Wheat Cropping System in Bangladesh. Field Crop. Res. 2006, 96, 374–386. [Google Scholar] [CrossRef]
- Singh, V.; Singh, B.; Singh, Y.; Thind, H.S.; Singh, G.; Kaur, S.; Kumar, A.; Vashistha, M. Establishment of Threshold Leaf Colour Greenness for Need-Based Fertilizer Nitrogen Management in Irrigated Wheat (Triticum Aestivum L.) Using Leaf Colour Chart. Field Crop. Res. 2012, 130, 109–119. [Google Scholar] [CrossRef]
- Samborski, S.M.; Gozdowski, D.; Stępień, M.; Walsh, O.S.; Leszczyńska, E. On-Farm Evaluation of an Active Optical Sensor Performance for Variable Nitrogen Application in Winter Wheat. Eur. J. Agron. 2016, 74, 56–67. [Google Scholar] [CrossRef]
- Ali, A.M.; Ibrahim, S.M.; Singh, B. Wheat Grain Yield and Nitrogen Uptake Prediction Using AtLeaf and GreenSeeker Portable Optical Sensors at Jointing Growth Stage. Inf. Process. Agric. 2019. [Google Scholar] [CrossRef]
- Santín-Montanyá, M.I.; Fernández-Getino, A.P.; Zambrana, E.; Tenorio, J.L. Effects of Tillage on Winter Wheat Production in Mediterranean Dryland Fields. Arid Land Res. Manag. 2017, 31, 269–282. [Google Scholar] [CrossRef]
- Coventry, D.R.; Poswal, R.S.; Yadav, A.; Gupta, R.K.; Gill, S.C.; Chhokar, R.S.; Kumar, V.; Sharma, R.K.; Kumar, A.; Mehta, A.; et al. Effect of Tillage and Nutrient Management on Wheat Productivity and Quality in Haryana, India. Field Crop. Res. 2011, 123, 234–240. [Google Scholar] [CrossRef]
- Jagir, S.S.; Singh, B.; Kuldip, K. Managing Crop Residues in the Rice-Wheat System of the Indo-Gangetic Plain. In ASA Special Publications; Ladha, J.K., Hill, J.E., Duxbury, J.M., Gupta, R.K., Buresh, R.J., Eds.; American Society of Agronomy, Crop Science Society of America, and Soil Science Society of America: Madison, WI, USA, 2015; pp. 173–195. [Google Scholar] [CrossRef]
- Paudel, B.; Acharya, B.S.; Ghimire, R.; Dahal, K.R.; Bista, P. Adapting Agriculture to Climate Change and Variability in Chitwan: Long-Term Trends and Farmers’ Perceptions. Agric. Res. 2014, 3, 165–174. [Google Scholar] [CrossRef]
- Karki, R.; Talchabhadel, R.; Aalto, J.; Baidya, S.K. New Climatic Classification of Nepal. Appl. Clim. 2016, 125, 799–808. [Google Scholar] [CrossRef]
- Panday, D. Adapting Climate Change in Agriculture: The Sustainable Way in Nepalese Context. Hydro Nepal J. Water Energy Environ. 2012, 91–94. [Google Scholar] [CrossRef]
- Karki, R.; Ul Hasson, S.; Schickhoff, U.; Scholten, T.; Böhner, J. Rising Precipitation Extremes across Nepal. Climate 2017, 5, 4. [Google Scholar] [CrossRef]
- Panday, D.; Maharjan, B.; Chalise, D.; Shrestha, R.K.; Twanabasu, B. Digital Soil Mapping in the Bara District of Nepal Using Kriging Tool in ArcGIS. PLoS ONE 2018, 13, e0206350. [Google Scholar] [CrossRef] [PubMed]
- Wheat Marketing Center, Inc. Wheat Flour Testing Methods. 2014. Available online: https://nebraskawheat.com/wp-content/uploads/2014/01/WheatFlourTestingMethods.pdf (accessed on 25 September 2020).
- Bartaula, S.; Panthi, U.; Adhikari, A.; Mahato, M.; Joshi, D.; Aryal, K. Effect of Different Tillage Practices and Nitrogen Level on Wheat Production under Inner Terai of Nepal. J. Agric. Nat. Res. 2020, 3, 233–239. [Google Scholar] [CrossRef]
- Malghani, A.L.; Malik, A.; Sattar, A.; Hussain, F.; Abbas, G.; Hussain, J. Response of Growth and Yield of Wheat to NPK Fertilizer. Sci. Int. 2010, 24, 185–189. [Google Scholar]
- Thapa, B.; Khanal, B.; Marahatta, S. Effect of Conservation Agriculture on Yield and Yield Attributing Properties of Wheat. Adv. Plants Agric. Res. 2019, 9, 329–335. [Google Scholar] [CrossRef]
- Rieger, S.; Richner, W.; Streit, B.; Frossard, E.; Liedgens, M. Growth, Yield, and Yield Components of Winter Wheat and the Effects of Tillage Intensity, Preceding Crops, and N Fertilisation. Eur. J. Agron. 2008, 28, 405–411. [Google Scholar] [CrossRef]
- Thapa, D.B.; Bhattachan, B.K.; Subedi, S.; Shrestha, J.; Sah, S.K.; Marahatta, S. Growth and Productivity of Wheat as Influenced by Tillage Methods, Mulch and Graded Nitrogen Levels in Chitwan, Nepal. Int. J. Glob. Sci. Res. 2018, 5. [Google Scholar] [CrossRef]
- Sah, G.; Sah, S.; Thapa, R.; McDonald, A.; Sidhu, H.; Gupta, R.; Sherchan, D.; Tripathi, B.; Davare, M.; Yadav, R. Tillage, Crop Residue, And Nitrogen Level Effects on Soil Properties and Crop Yields Under Rice-Wheat System in the Terai Region of Nepal. Glob. J. Biol. Agric. Health Sci. 2014, 3, 139–147. [Google Scholar]
- Pandey, B.P.; Kandel, T.P. Growth and Yield Response of Wheat to Tillage, Rice Residue and Weed Management under Rice–Wheat Cropping System. Glob. J. Agric. Allied Sci. 2019, 1, 43–48. [Google Scholar] [CrossRef][Green Version]
- Pittelkow, C.M.; Linquist, B.A.; Lundy, M.E.; Liang, X.; van Groenigen, K.J.; Lee, J.; van Gestel, N.; Six, J.; Venterea, R.T.; van Kessel, C. When Does No-till Yield More? A Global Meta-Analysis. Field Crop. Res. 2015, 183, 156–168. [Google Scholar] [CrossRef]
- Mandal, U.K.; Singh, G.; Victor, U.S.; Sharma, K.L. Green Manuring: Its Effect on Soil Properties and Crop Growth under Rice–Wheat Cropping System. Eur. J. Agron. 2003, 19, 225–237. [Google Scholar] [CrossRef]
- Verhulst, N.; Govaerts, B.; Verachtert, E.; Castellanos-Navarrete, A.; Mezzalama, M.; Wall, P.; Deckers, J.; Sayre, K.D. Conservation agriculture, improving soil quality for sustainable production systems. In Advances in Soil Science: Food Security and Soil Quality; Lal, R., Stewart, B.A., Eds.; CRC Press: Boca Raton, FL, USA, 2010; pp. 137–208. [Google Scholar]
- Six, J.; Feller, C.; Denef, K.; Ogle, S.; de Moraes Sa, J.C.; Albrecht, A. Soil Organic Matter, Biota and Aggregation in Temperate and Tropical Soils—Effects of No-Tillage. Agronomie 2002, 22, 755–775. [Google Scholar] [CrossRef]
- Hobbs, P.R.; Sayre, K.; Gupta, R. The Role of Conservation Agriculture in Sustainable Agriculture. Philos. Trans. R. Soc. B Biol. Sci. 2008, 363, 543–555. [Google Scholar] [CrossRef] [PubMed]
- Baral, B.; Pande, K.; Gaihre, Y.; Sah, S.; Thapa, Y.; Baral, K. In-Season Nitrogen Fertilizer Management in Irrigated Wheat Based on Available Decision Support Tools. In Conference Proceedings, Proceedings of the International (SAARC) Youth Scientific Conference (IYSC) 2019, Kathmandu, Nepal, 7 June 2019; Ministry of Industry, Tourism, Forests and Environment, State No. 3: Makawanpur, Nepal; Central Department of Hydrology and Meteorology Tribhuvan University: Kathmandu, Nepal, 2019. [Google Scholar]


| Treatment | Treatments |
|---|---|
| Controlled Practice (CP) | Conventional tillage + Fertilizer (Farmer practice) + No residue + No Green manuring |
| Improved Low (IL) | Conventional tillage + Fertilizer (Farmer practice) + Residue + No green manuring |
| Improved High (IH) | No tillage + Fertilizer (Farmer practice) + Residue + Green manuring |
| Climate Smart Agriculture Low (CSAL) | No tillage + Fertilizer (Recommended rate) + Residue + No green manuring |
| Climate Smart Agriculture Medium (CSAM) | No tillage + Fertilizer (based on LCC) + Residue + No green manuring |
| Climate Smart Agriculture High (CSAH) | No tillage + Fertilizer (based on crop sensor readings) + Residue + Green manuring |
| Year-I | ||||||
|---|---|---|---|---|---|---|
| Source of Variation | Tiller | Plant Height † | Spike Length † | Grain Yield ‡ | Biomass Yield ‡ | Thousand Kernel Weight |
| Location (LOC) | ||||||
| Banke | 162.92 a | 100.08 a | 12.81 a | 3772.35 a | 7696.85 a | 44.13 b |
| Morang | 138.88 b | 71.14 c | 10.44 b | 2224.94 b | 3903.60 b | 48.46 a |
| Rupandehi | 171.13 a | 82.74 b | 9.52 c | 2504.47 b | 4169.37 b | 36.30 c |
| Significance | *** | *** | *** | *** | *** | *** |
| Treatment (TRT) | ||||||
| CP | 107.00 b | 77.75 b | 8.43 d | 2011.78 b | 3890.81 b | 42.35 |
| IL | 119.83 b | 84.28 a | 10.24 c | 2567.53 a | 4334.92 b | 43.18 |
| IH | 173.47 a | 84.98 a | 11.23 b | 3069.25 a | 5729.42 a | 42.99 |
| CSAL | 179.87 a | 85.62 a | 11.39 ab | 3125.55 a | 5915.44 a | 42.72 |
| CSAM | 181.41 a | 87.42 a | 12.01 ab | 3128.08 a | 5841.67 a | 42.99 |
| CSAH | 184.26 a | 87.88 a | 12.23 a | 3101.33 a | 5827.39 a | 43.54 |
| Significance | *** | ** | *** | *** | ** | ns |
| Interactions | ||||||
| LOC × TRT | ** | *** | ** | ns | * | ns |
| Year-II | ||||||
| Source of Variation | Tiller | Plant Height † | Spike Length † | Grain Yield ‡ | Biomass Yield ‡ | Thousand Kernel Weight |
| Location (LOC) | ||||||
| Banke | 213.77 b | 97.98 a | 13.12 b | 3728.75 a | 8204.58 a | 45.93 a |
| Morang | 174.25 c | 75.73 c | 8.41 c | 2479.17 c | 4820.83 b | 40.81 b |
| Rupandehi | 317.56 a | 87.28 b | 13.71 a | 3236.17 b | 5201.25 b | 41.33 b |
| Significance | *** | *** | *** | *** | *** | *** |
| Treatment (TRT) | ||||||
| CP | 208.71 c | 84.53 | 10.28 c | 2728.08 b | 5750.00 b | 42.34 |
| IL | 212.38 c | 85.90 | 11.36 b | 2787.50 b | 5363.83 b | 41.98 |
| IH | 214.71 c | 86.53 | 12.23 a | 2925.00 b | 5861.08 b | 41.24 |
| CSAL | 237.71 bc | 86.65 | 12.01 ab | 2918.67 b | 5520.17 b | 42.79 |
| CSAM | 265.67 ab | 88.29 | 12.25 a | 3815.25 a | 6813.83 a | 44.07 |
| CSAH | 272.00 a | 90.08 | 12.34 a | 3713.67 a | 7144.42 a | 43.71 |
| Significance | *** | ns | *** | *** | *** | ns |
| Interactions | ||||||
| LOC × TRT | ** | *** | *** | *** | *** | ns |
| Tiller | Plant Height | Spike Length | Grain Yield | Biomass Yield | TKW | |
|---|---|---|---|---|---|---|
| Tiller | -- | |||||
| Plant Height | 0.39 *** | -- | ||||
| Spike Length | 0.67 *** | 0.73 *** | -- | |||
| Grain Yield | 0.41 | 0.67 *** | 0.68 *** | -- | ||
| Biomass Yield | 0.17 * | 0.74 *** | 0.48 *** | 0.72 *** | -- | |
| TKW | 0.07 | 0.62 *** | 0.38 *** | 0.60 *** | 0.66 *** | -- |
Publisher’s Note: MDPI stays neutral with regard to jurisdictional claims in published maps and institutional affiliations. |
© 2021 by the authors. Licensee MDPI, Basel, Switzerland. This article is an open access article distributed under the terms and conditions of the Creative Commons Attribution (CC BY) license (http://creativecommons.org/licenses/by/4.0/).
Share and Cite
Gairhe, J.J.; Adhikari, M.; Ghimire, D.; Khatri-Chhetri, A.; Panday, D. Intervention of Climate-Smart Practices in Wheat under Rice-Wheat Cropping System in Nepal. Climate 2021, 9, 19. https://doi.org/10.3390/cli9020019
Gairhe JJ, Adhikari M, Ghimire D, Khatri-Chhetri A, Panday D. Intervention of Climate-Smart Practices in Wheat under Rice-Wheat Cropping System in Nepal. Climate. 2021; 9(2):19. https://doi.org/10.3390/cli9020019
Chicago/Turabian StyleGairhe, Janma Jaya, Mandeep Adhikari, Deepak Ghimire, Arun Khatri-Chhetri, and Dinesh Panday. 2021. "Intervention of Climate-Smart Practices in Wheat under Rice-Wheat Cropping System in Nepal" Climate 9, no. 2: 19. https://doi.org/10.3390/cli9020019
APA StyleGairhe, J. J., Adhikari, M., Ghimire, D., Khatri-Chhetri, A., & Panday, D. (2021). Intervention of Climate-Smart Practices in Wheat under Rice-Wheat Cropping System in Nepal. Climate, 9(2), 19. https://doi.org/10.3390/cli9020019