Article

Growing Season Air mass Equivalent Temperature (TE) in the East Central USA

1
Department of Geography and Environmental Sustainability, University of Oklahoma, Norman, OK 73071, USA
2
High Plains Regional Climate Center, School of Natural Resources, University of Nebraska-Lincoln, Lincoln, NE 68583, USA
3
Department of Earth, Environmental, and Atmospheric Sciences Western Kentucky University, Bowling Green, KY 42101, USA
4
Kentucky Climate Center, Western Kentucky University, Bowling Green, KY 42101, USA
*
Author to whom correspondence should be addressed.
Climate 2020, 8(9), 95; https://doi.org/10.3390/cli8090095
Submission received: 30 June 2020 / Revised: 12 August 2020 / Accepted: 13 August 2020 / Published: 19 August 2020
(This article belongs to the Section Climate and Environment)

Abstract

:
Equivalent temperature (TE), which incorporates both dry (surface air temperature, T) and moist heat content associated with atmospheric moisture, is a better indicator of overall atmospheric heat content compared to T alone. This paper investigates the impacts of different types of air masses on TE during the growing season (April–September). The study used data from the Kentucky Mesonet for this purpose. The growing season was divided into early (April–May), mid (June–July), and late (August–September). Analysis suggests that TE for moist tropical (MT) air mass was as high as 61 and 81 °C for the early and mid-growing season, respectively. Further analysis suggests that TE for different parts of the growing seasons were statistically significantly different from each other. In addition, TE for different air masses was also statistically significantly different from each other. The difference between TE and T (i.e., TE-T) is smaller under dry atmospheric conditions but larger under moist conditions. For example, in Barren County, the lowest difference (20–10 °C) was 10 °C. It was reported on 18 April 2010, a dry weather day. On the other hand, the highest difference for this site was 48 °C and was reported on 11 August 2010, a humid day.

1. Introduction

Air temperature or dry-bulb temperature has widely been used in atmospheric research to understand weather and climate variability and change. e.g., [1]. However, this measure alone does not capture the total heat content of the air because dry-bulb temperature only accounts for dry heat content and does not include moist heat [2]. As a result, we suggest that, in addition to air temperature, equivalent temperature (TE) can be used for more accurate measurement of atmospheric heat content since TE represents both dry and moist heat [3,4,5,6,7,8]. In other words, this measure provides a more accurate representation of the near-surface energy budget.
Pielke Sr. et al. and Ribera et al. [2,9] demonstrated the value of TE as a measure of atmospheric heat content. Previously, Pielke Sr. [10] has shown that a 1 °C dew point temperature increase is equivalent to a 2.5 °C increase in air temperature and thus atmospheric moisture plays an important role in the calculation of atmospheric heat content. Subsequent research provided additional evidence of the role of atmospheric moisture in atmospheric heat content or TE calculation [5,7].
Near surface and tropospheric TE for the contiguous United States using data from 1979–2005 was analyzed and results suggest that using TE along with temperature may help to remove uncertainties in near surface and tropospheric temperature trends [5]. It is also shown that vegetation plays an important role in influencing near surface TE [5]. Analyses of high-density meso-scale data from 33 Mesonet stations in Kentucky, USA, further demonstrated the relationship between TE and atmospheric heat content [7]. This study in Kentucky [7] shows about 10% (14.14 g kg−1) moisture contribution in the summer resulted in a TE of 59 °C in comparison to the air temperature of 24 °C (see Figure 2a,b of [7]).
Previously, differences in near surface air and equivalent temperature trends from 1982–1997 over the Eastern U.S. were investigated [3]. It was found that overall TE trends were relatively larger in the eastern U.S. than temperature trends [3]. These patterns, however, vary widely from site to site, so local microclimate is very important. In another study, 123 years of data for the summer season from one location in Ohio was analyzed and it reported a positive trend in TE during the second half of the 20th century [4]. An assessment of TE trends for seven locations over the Central U.S. found that for a majority of these locations, summer trends of TE were positive and greater than annual trends [6]. This research in the Central U.S. [4] also demonstrated the potential use of TE in heat wave assessment. A follow-up study, using data from four locations in Illinois, USA, found a good relationship between summer TE hot days and antecedent 5-cm soil moisture anomalies [11]. It was reported that the highest summer TE was strongly linked to spring soil moisture [11].
In this study, we investigate and quantify intra-seasonal and inter-annual variations of atmospheric heat content (TE) of different air masses during the growing season in the east central USA, represented by the state of Kentucky (Figure 1).
Note that the growing season also represents warm months. Kentucky was selected for several reasons. First, it provides a unique opportunity to work with a high quality TE time series [7]. Second, this time series is derived from high-quality observations collected by the Kentucky Mesonet [12]. Kentucky Mesonet is a research grade weather and climate-observing network with redundant sensors that record high-quality, five-minute data from 72 locations. Third, this study is a natural progression of previous research efforts [7].
A study [7] on Kentucky and the east central U.S. investigated inter-seasonal and inter-annual variations of TE at meso-scale from 2009–2014, which was the first of its kind. The time period was determined by the availability of the highest number of stations. Note that the Kentucky Mesonet started to install stations in 2007. The current study builds on the research presented in [7] and assesses intra-seasonal variations of TE for the growing season. Moreover, previous studies were focused on continental [3,5] and regional scales [6], while the current study focuses on meso-scales by analyzing data from a Mesonet. In addition, none of the previous studies were focused on quantifying TE climatology related to air masses at this scale.
In the past, TE for different meteorological seasons (spring, summer, fall, and winter) were investigated for the east-central U.S. [7], while TE associated with different air masses during the growing season were not assessed [7]. In the current study, we investigated TE associated with different air masses during the growing season. During this season, land surface conditions and vegetation go through distinct changes along with meteorological seasonal changes. To further capture distinct atmospheric characteristics within the growing season, we have identified three periods: early (April–May), mid (June–July), and late (August–September). Previously, TE climatology for 33 stations/locations was developed and the current study used data from 10 of these stations (see Figure 1 in [7]). For identifying air masses, the present study used a Spatial Synoptic Classification (SSC) [13,14].
The SSC characterizes air masses based on the moisture and temperature of air. The present research quantified intra-growing season variations of TE and SSC influences on TE. The underlying hypothesis is that differences between TE and T, which are largest during the growing season (see Figures 4 and 5 in [7] and Figure 2 of this paper), are directly related to the air mass types over the region and, to a lesser extent, land cover differences. The reasoning is that the characteristics of the air mass types that influence the weather at a particular location also influence the temperature and moisture content of the atmosphere, and thereby produce variations in TE during the growing season.
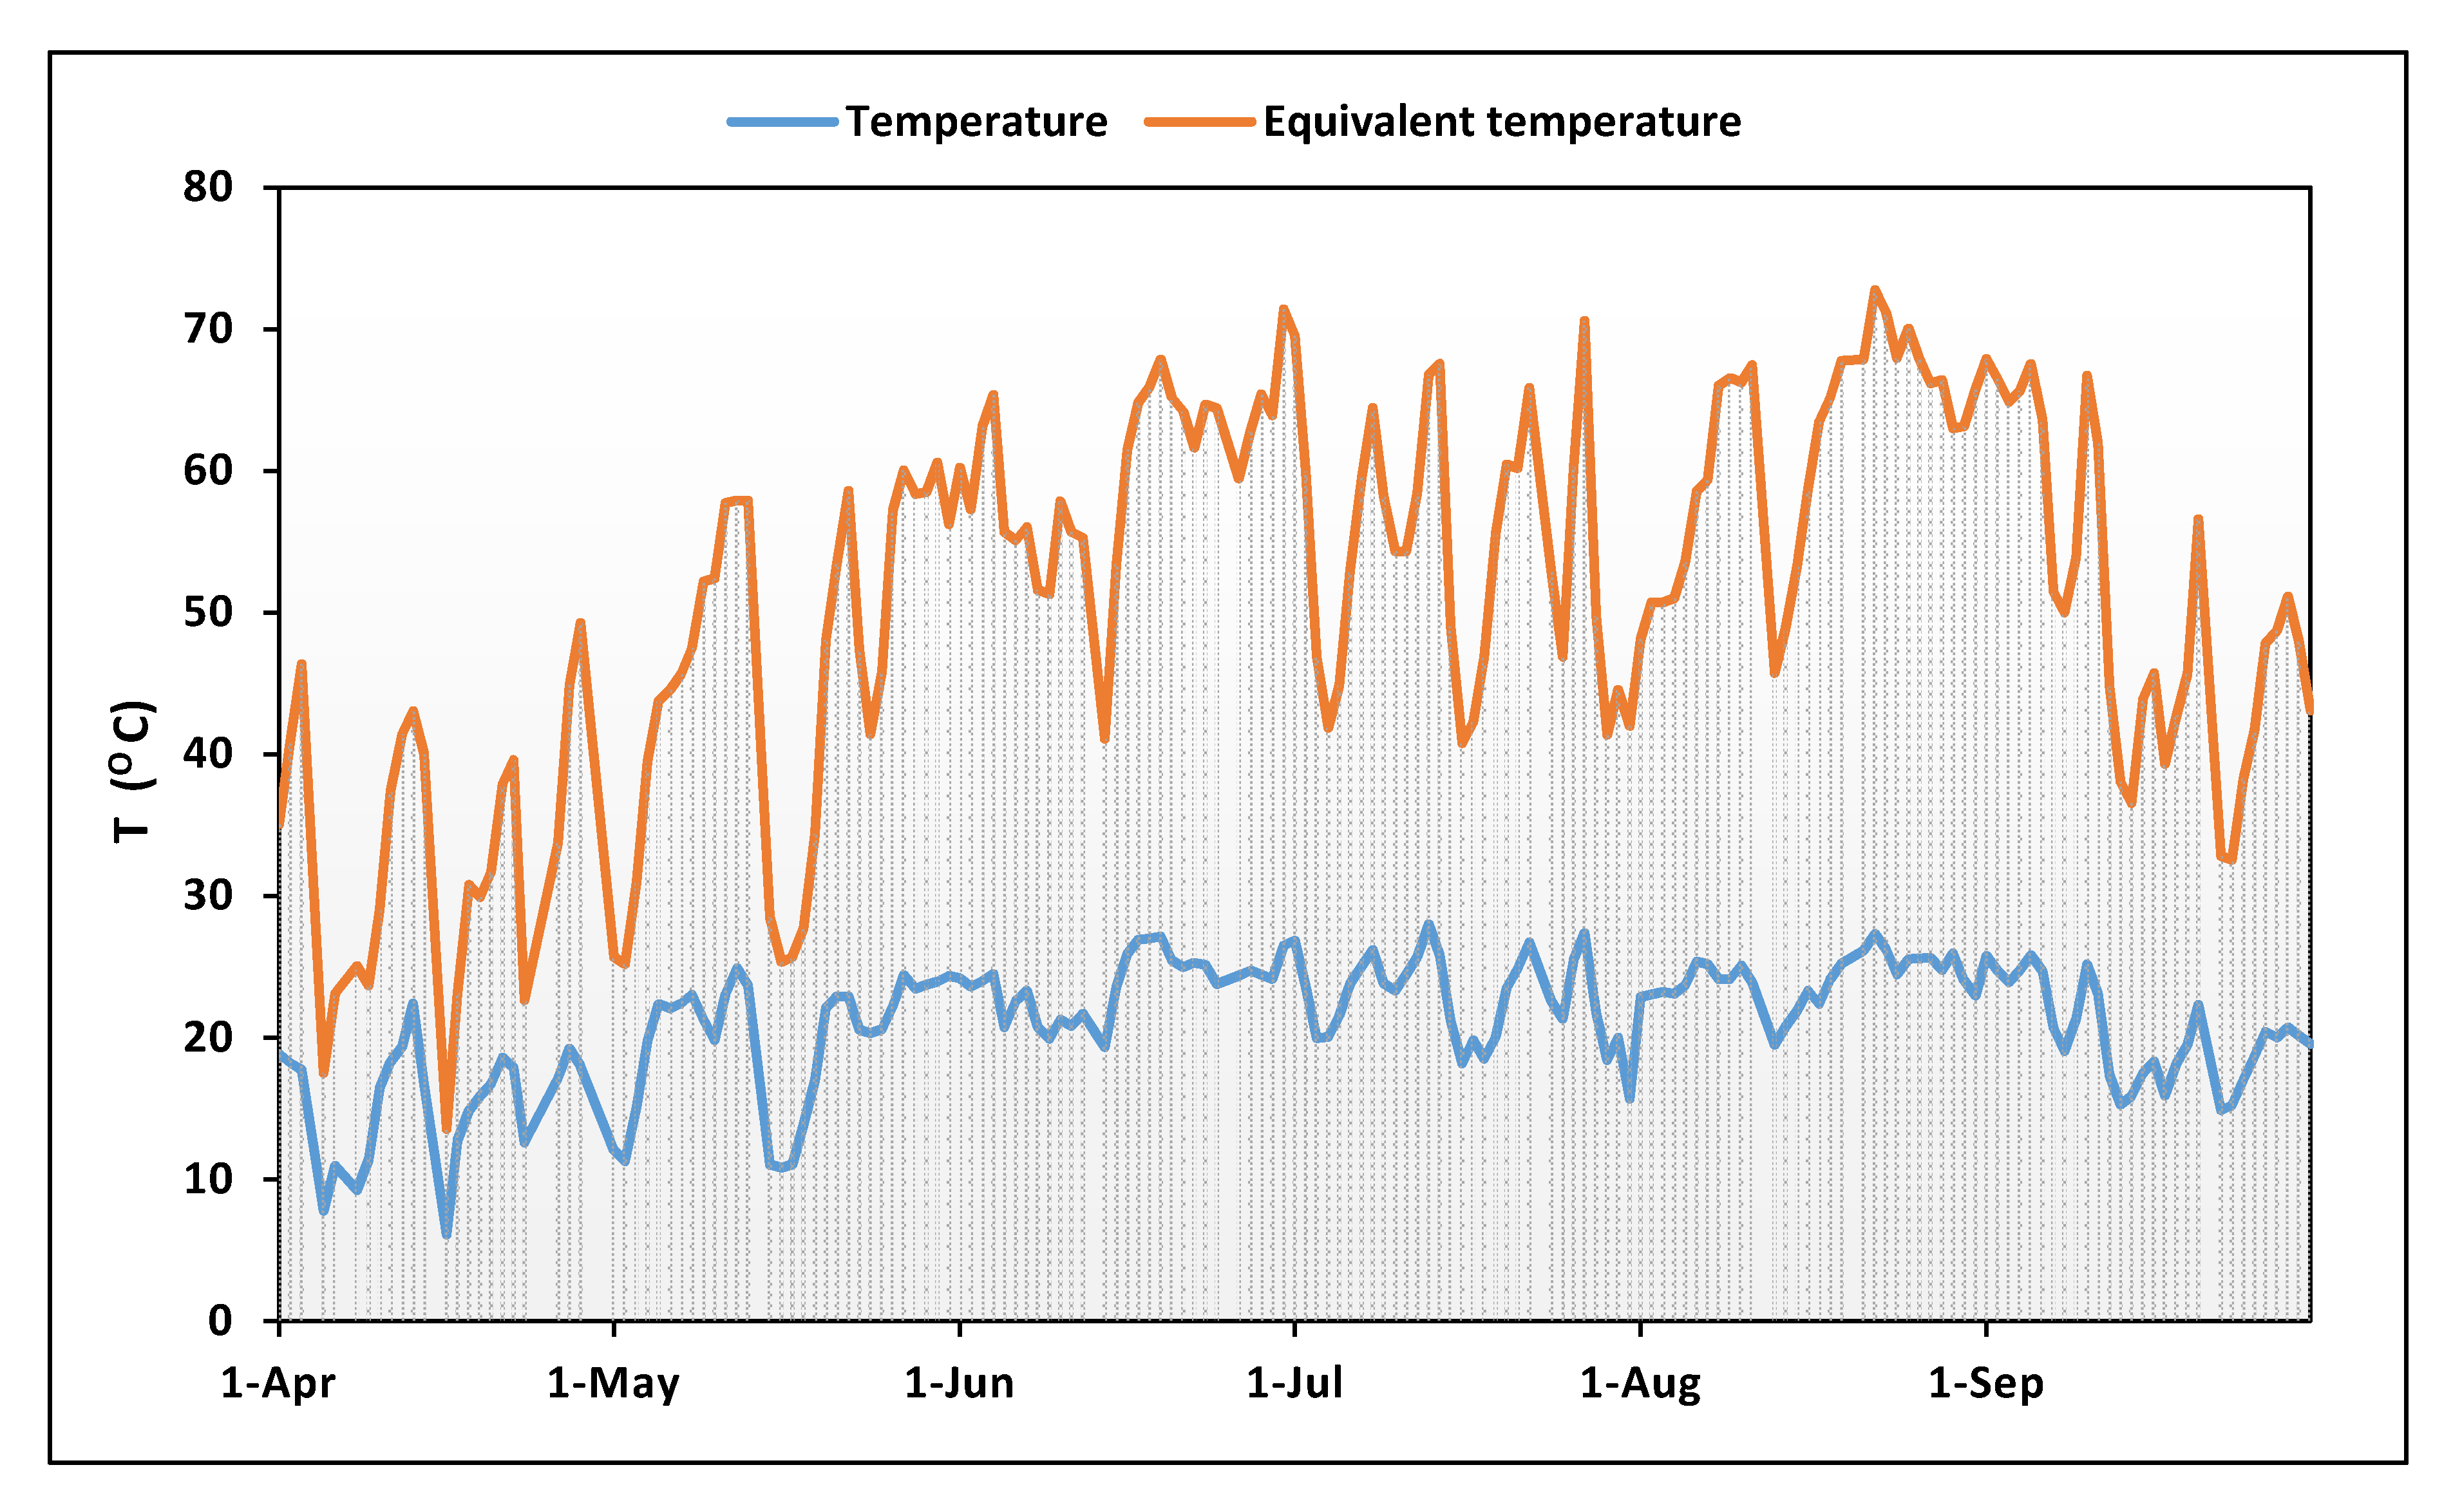
It is expected that the moist air mass types within the growing season will have higher TE, while the dry air mass types will have lower TE. In addition, generally TE would be higher compared to air temperature. Figure 2 presents TE and air temperature from a Kentucky Mesonet station during the growing season of 2014 where TE is consistently higher than air temperature. Day-to-day variations in TE are largely linked to humidity of the air mass. Thus, among others, the novelty of this research lies in the fact that it quantified magnitudes of TE for different air masses during the growing season and inter- and intra-seasonal variations of TE. Other research findings include determination of dominant air mass types that correspond to high and low TE values for different years and within the growing season of the study region.
This research recognizes that land use and land cover affects the heat and moisture budgets and influences TE. In other words, TE at a location could be the result of large-scale moisture advection and local contribution via moisture recycling. For the latter, vegetation can play an important role by transferring moisture through evapotranspiration. However, the objective of this research is to quantify TE for different air mass types throughout the growing season and not quantify relative contribution of large-scale moisture advection and contribution from local moisture sources.
The data and methods used in this study are described in Section 2. The results and discussion are presented in Section 3, followed by the conclusions in Section 4.

2. Methods and Data

2.1. Calculation of Equivalent Temperature

TE was calculated utilizing the following equation [2]:
H = C P T + L V
where H is heat content, cp is the isobaric specific heat of air (1005 J kg−1 K−1), T is the air temperature (K), Lv is the latent heat of vaporization (2.5 × 10⁶ J kg−1), and q is the specific humidity.
Since the products available from the Mesonet do not include a direct measure for specific humidity (q), it is calculated from the dew point temperature (Td) and the vapor pressure of the air (e), using an empirical relationship [15]:
e = 6.112 exp [ 17.67   T d T d + 243.5 ]
From this, q is calculated as
q =   0.622 e P 0.378 e
where P is the station pressure in hPa, obtained from the nearest Automated Surface Observation Systems (ASOS) stations [4].
Specific humidity can be calculated from measurements of relative humidity, dew point temperature, or wet bulb temperature [3,4]. H has units of Joules per kilogram, so, to enable comparison with air temperature, equivalent temperature in Kelvin is calculated by:
T E = C P T + L V q C P
As well as;
T E = H C P
Daily TE averages for this research were calculated from the hourly TE data [7].

2.2. Spatial Synoptic Classification

Unlike most existing air mass-based techniques such as the Temporal Synoptic Index (TSI), the SSC requires initial identification of the major air masses that traverse the Earth’s surface, as well as their typical meteorological characteristics [16]. The SSC is a hybrid classification scheme that is based on an initial manual identification of air masses, or air mass types, followed by automated classification based on these identifications [13,16]. Note that the weather observations for the SSC come from first order stations. These stations are typically maintained by trained professionals from the National Weather Service of the USA and comparable organizations from Canada. First order stations typically use reliable instruments and are relatively well-maintained. However, they are not totally free from some of the known challenges with instrumentation, exposure, and station siting and their influence on the data. The technique utilizes surface temperature, dew point, sea-level pressure, wind, and cloud cover to classify a given day into one of the following air mass types: dry polar (DP), dry moderate (DM), dry tropical (DT), moist polar (MP), moist moderate (MM), and moist tropical (MT). DP is a cool or cold and dry airmass and is typically associated with clear skies and northerly winds. DM signifies a mild and dry air mass. The DT air mass represents the hottest and driest conditions found at any location. The primary source region for DT is the deserts of the southwestern U.S. and northwestern Mexico. On the other hand, MP is associated with cool, cloudy, and humid weather conditions, and it is often accompanied by light precipitation. MM is warmer and more humid than MP air. MT air is warm and very humid, cloudy in winter and partly cloudy in summer. Convective precipitation is quite common in this air mass, especially in summer. MT typically forms over the Gulf of Mexico, tropical Atlantic, or the tropical Pacific Ocean. Sheridan [13] noted that for most analyses like ours, the MT+ and MT++ distinction is not required. These are subsets of the MT, and hence we grouped all of the subsets as MT air mass types. We did not use TR days because they represent days of transition from one air mass type to another, and as such, would not help with classifying the distinct air mass types.

2.3. Data Analyses

The selection of stations (Figure 1, Table 1) represents the diverse nature of the region in terms of location, geography, and length-of-time series [cf., 7]. In addition, the proximity to the SSC stations, elevations, and climatic divisions contributed to the selection of the final 10 stations to ensure consistency and representativeness of results for all the Mesonet stations.
Daily SSC for the growing season (April to September) were obtained from http://sheridan.geog.kent.edu/ssc.html (Note: data and metadata are available online at this website) to categorize each day by a designated air mass. There are six SSC sites within the study area (Nashville (BNA), Paducah (PAH), Lexington (LEX), Evansville (EVV), Louisville (SVF), and Covington (CVG)) (Table 1). The air mass at each site was defined as one of the following SSCs: DP, DM, DT, MP, MM and MT [13].
One-way and two-way analysis of variance (ANOVA) were used for this study. ANOVA identifies whether the means of samples chosen from three or more different populations are statistically different from each other [17,18,19]. Specifically, ANOVA was applied to identify whether TE of different air masses were statistically significantly different during the growing season and whether TE of different air masses were intra-seasonally statistically significantly different over the growing season. For this analysis, TE was the dependent variable and the air masses and the early (April–May), mid (June–July) and late (August–September) growing seasons were the independent variables. The analyses of TE for these three periods within the growing season provided further insight into intra-seasonal variations of TE. The average values for TE were calculated and analyzed for these three periods over a five-year period (1 April 2010 through 30 September 2014) and station-by-station to show the variations for each station. The number of days of each SSC within the three defined periods of the growing season for each station were calculated to demonstrate the influence of SSC. The averages for all stations were also computed for the SSC and TE for the five-year span. Further details can be found in Na-Yemeh [20].
One-way ANOVA for the years 2010, 2011, 2012, 2013, and 2014 for all 10 Mesonet stations was used to determine the relationship between air mass types and TE. The hypothesis for the study can be presented as:
H 0 : μ i = μ j = μ k The means of the samples are from the same population.
H 1 : μ i μ j μ k At least one of the samples is from a different population.
Again, a two-way analysis of variance (ANOVA) was used to test for significant differences between TE and air masses for the early (April–May), mid (June–July), and late (August–September) growing season. The two-way ANOVA thus analyzed the interactions between the two variables including intra-season months and air masses. Two-way ANOVA interactions are ideal for testing the significance of two variables [19].

3. Results and Discussions

The following sections provide overall key findings first, followed by specific periods (inter-annual, intra-seasonal, and other shorter periods).

3.1. Overall Findings

The results show that there are statistically significant differences in the means within the seasons and air mass groups (Table 2).
The two-way interactions between season and air mass are statistically significant for all five years for all locations. The two-way ANOVA suggests that interactions for TE and intra-seasons and TE and air masses were also statistically significant, i.e., p-value < 0.001 (Table 3).
The growing season was divided into three periods: the early, the mid and the late periods. In the early part of the growing season, the dry air masses have relatively high frequency with corresponding low mean TE values. For example, in Barren County it ranged between 33 °C to 46 °C (Table 4).
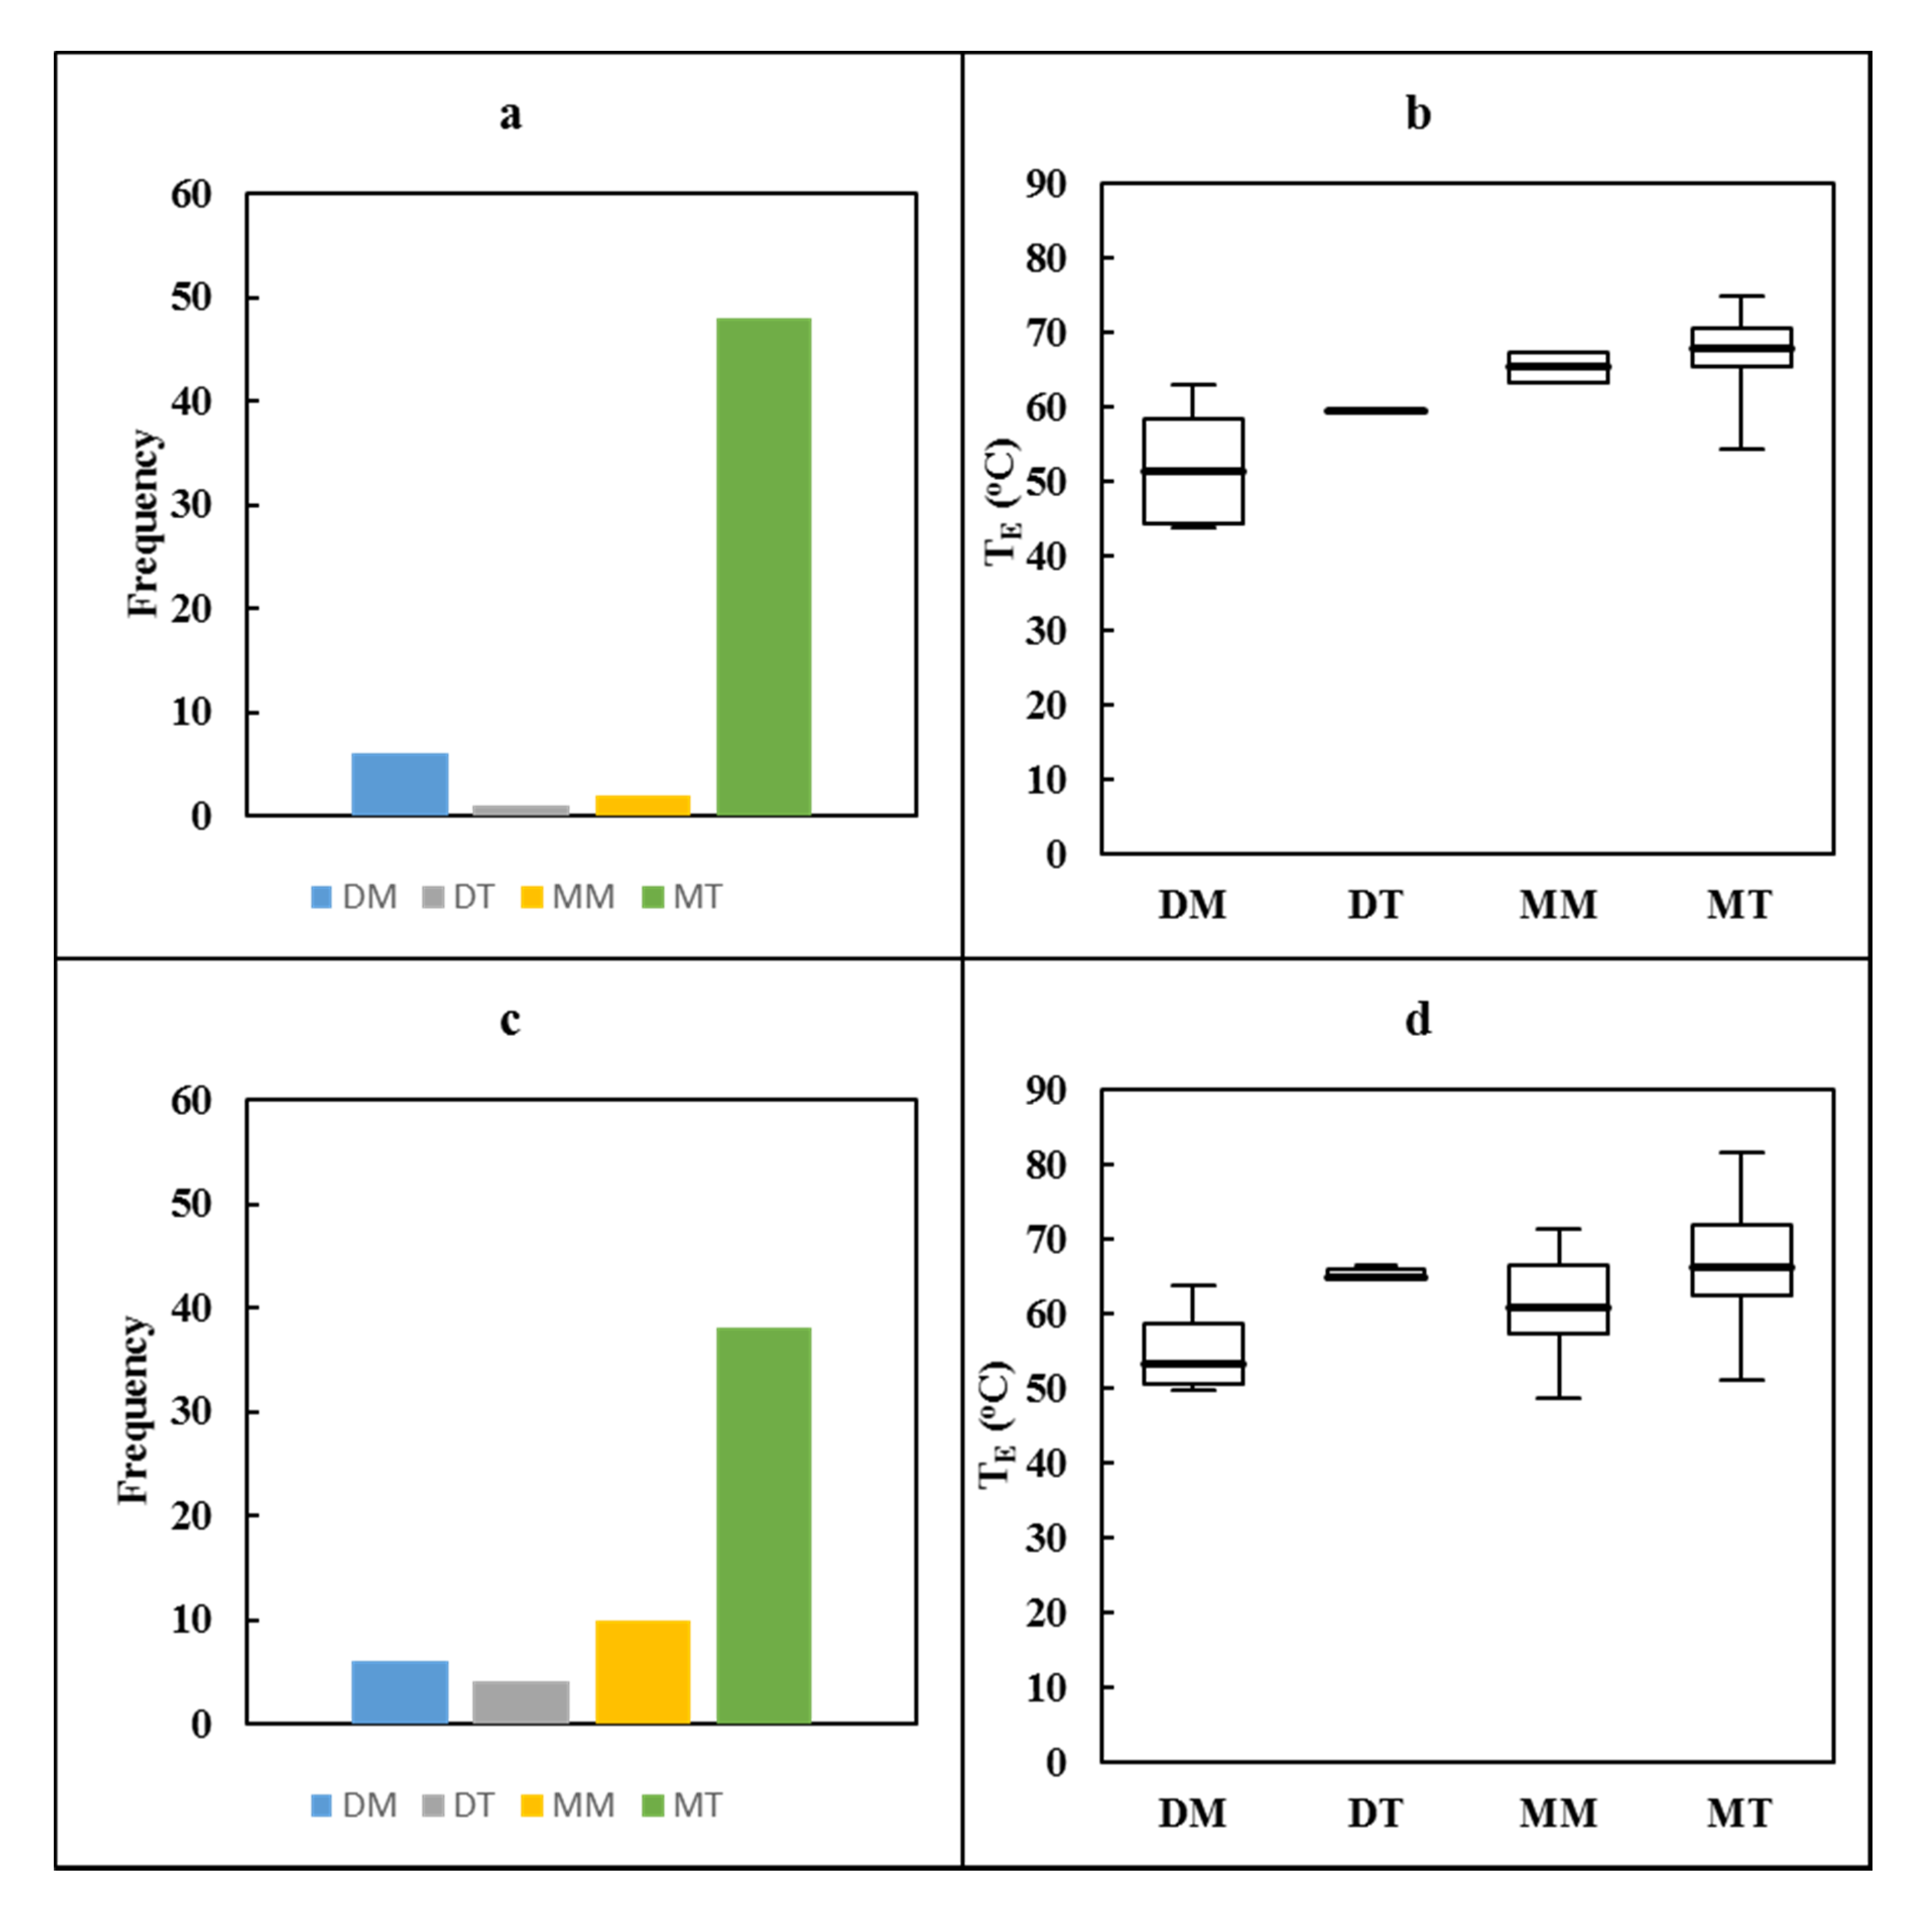
As the season transitions into the mid-season, the frequency of the moist air mass types peak (Figure 3a,b) with corresponding mean high TE values that ranged between 52 °C to 66 °C (Table 4).
Lastly, as the season reaches its late period, the dry tropical air mass begins to increase in frequency and mean TE values begin to lower, and this ranged between 34 °C to 52 °C (Table 4). These results are representative of other locations. In addition, for example, mean TE for the DP air masses for early-, mid-, and late-growing season were 24 °C, 45 °C, and 34 °C, respectively (Table 4). On the other hand, they were 52 °C, 66 °C, and 63 °C for early-, mid-, and late-growing seasons, respectively, for the MT air masses.
Additional analysis further demonstrates the influence of different air mass types on TE values. For example, the maximum annual values of TE for the Fulton County station for the moist tropical (MT) air mass were 81 °C, 80 °C, 75 °C, 70 °C and 74 °C from 2010 to 2014, respectively (Table 5).
The DM air mass, which was commonly observed in the growing season, had the highest TE of 66 °C, 64 °C, 67 °C, 61 °C and 62 °C, respectively, from 2010 to 2014. Calloway, Hopkins, and Ohio county stations in the Western climate division observed a similar pattern. For the Western climate division, 2010 and 2011 experienced the highest number of days with the MT air mass. The DM air mass dominated 2012 at all four stations, whilst the moist polar generally had the lowest frequencies. Results for this climate division are comparable to the other three.
The moist air mass types (MP, MM, and MT) combined, as expected, had the highest frequency in the growing season (Figure 4, Table 5). The MM air mass recorded its highest frequency in 2013 for most stations, whilst the DM air mass types recorded relatively higher frequencies in 2012. The MT air mass type typically increases in frequency until it peaks in the mid-growing season and begins a gradual decline by the late growing season. This can be attributed to the seasonal air mass patterns and changes in the season [21]. The MT is more common because of the influx of moisture from the Gulf of Mexico, which is the primary source of MT air masses. The frequency of DM, however, begins a decline from the early growing season and is at its lowest in the mid-growing season.

3.2. Inter-annual Variations of the Growing Season TE

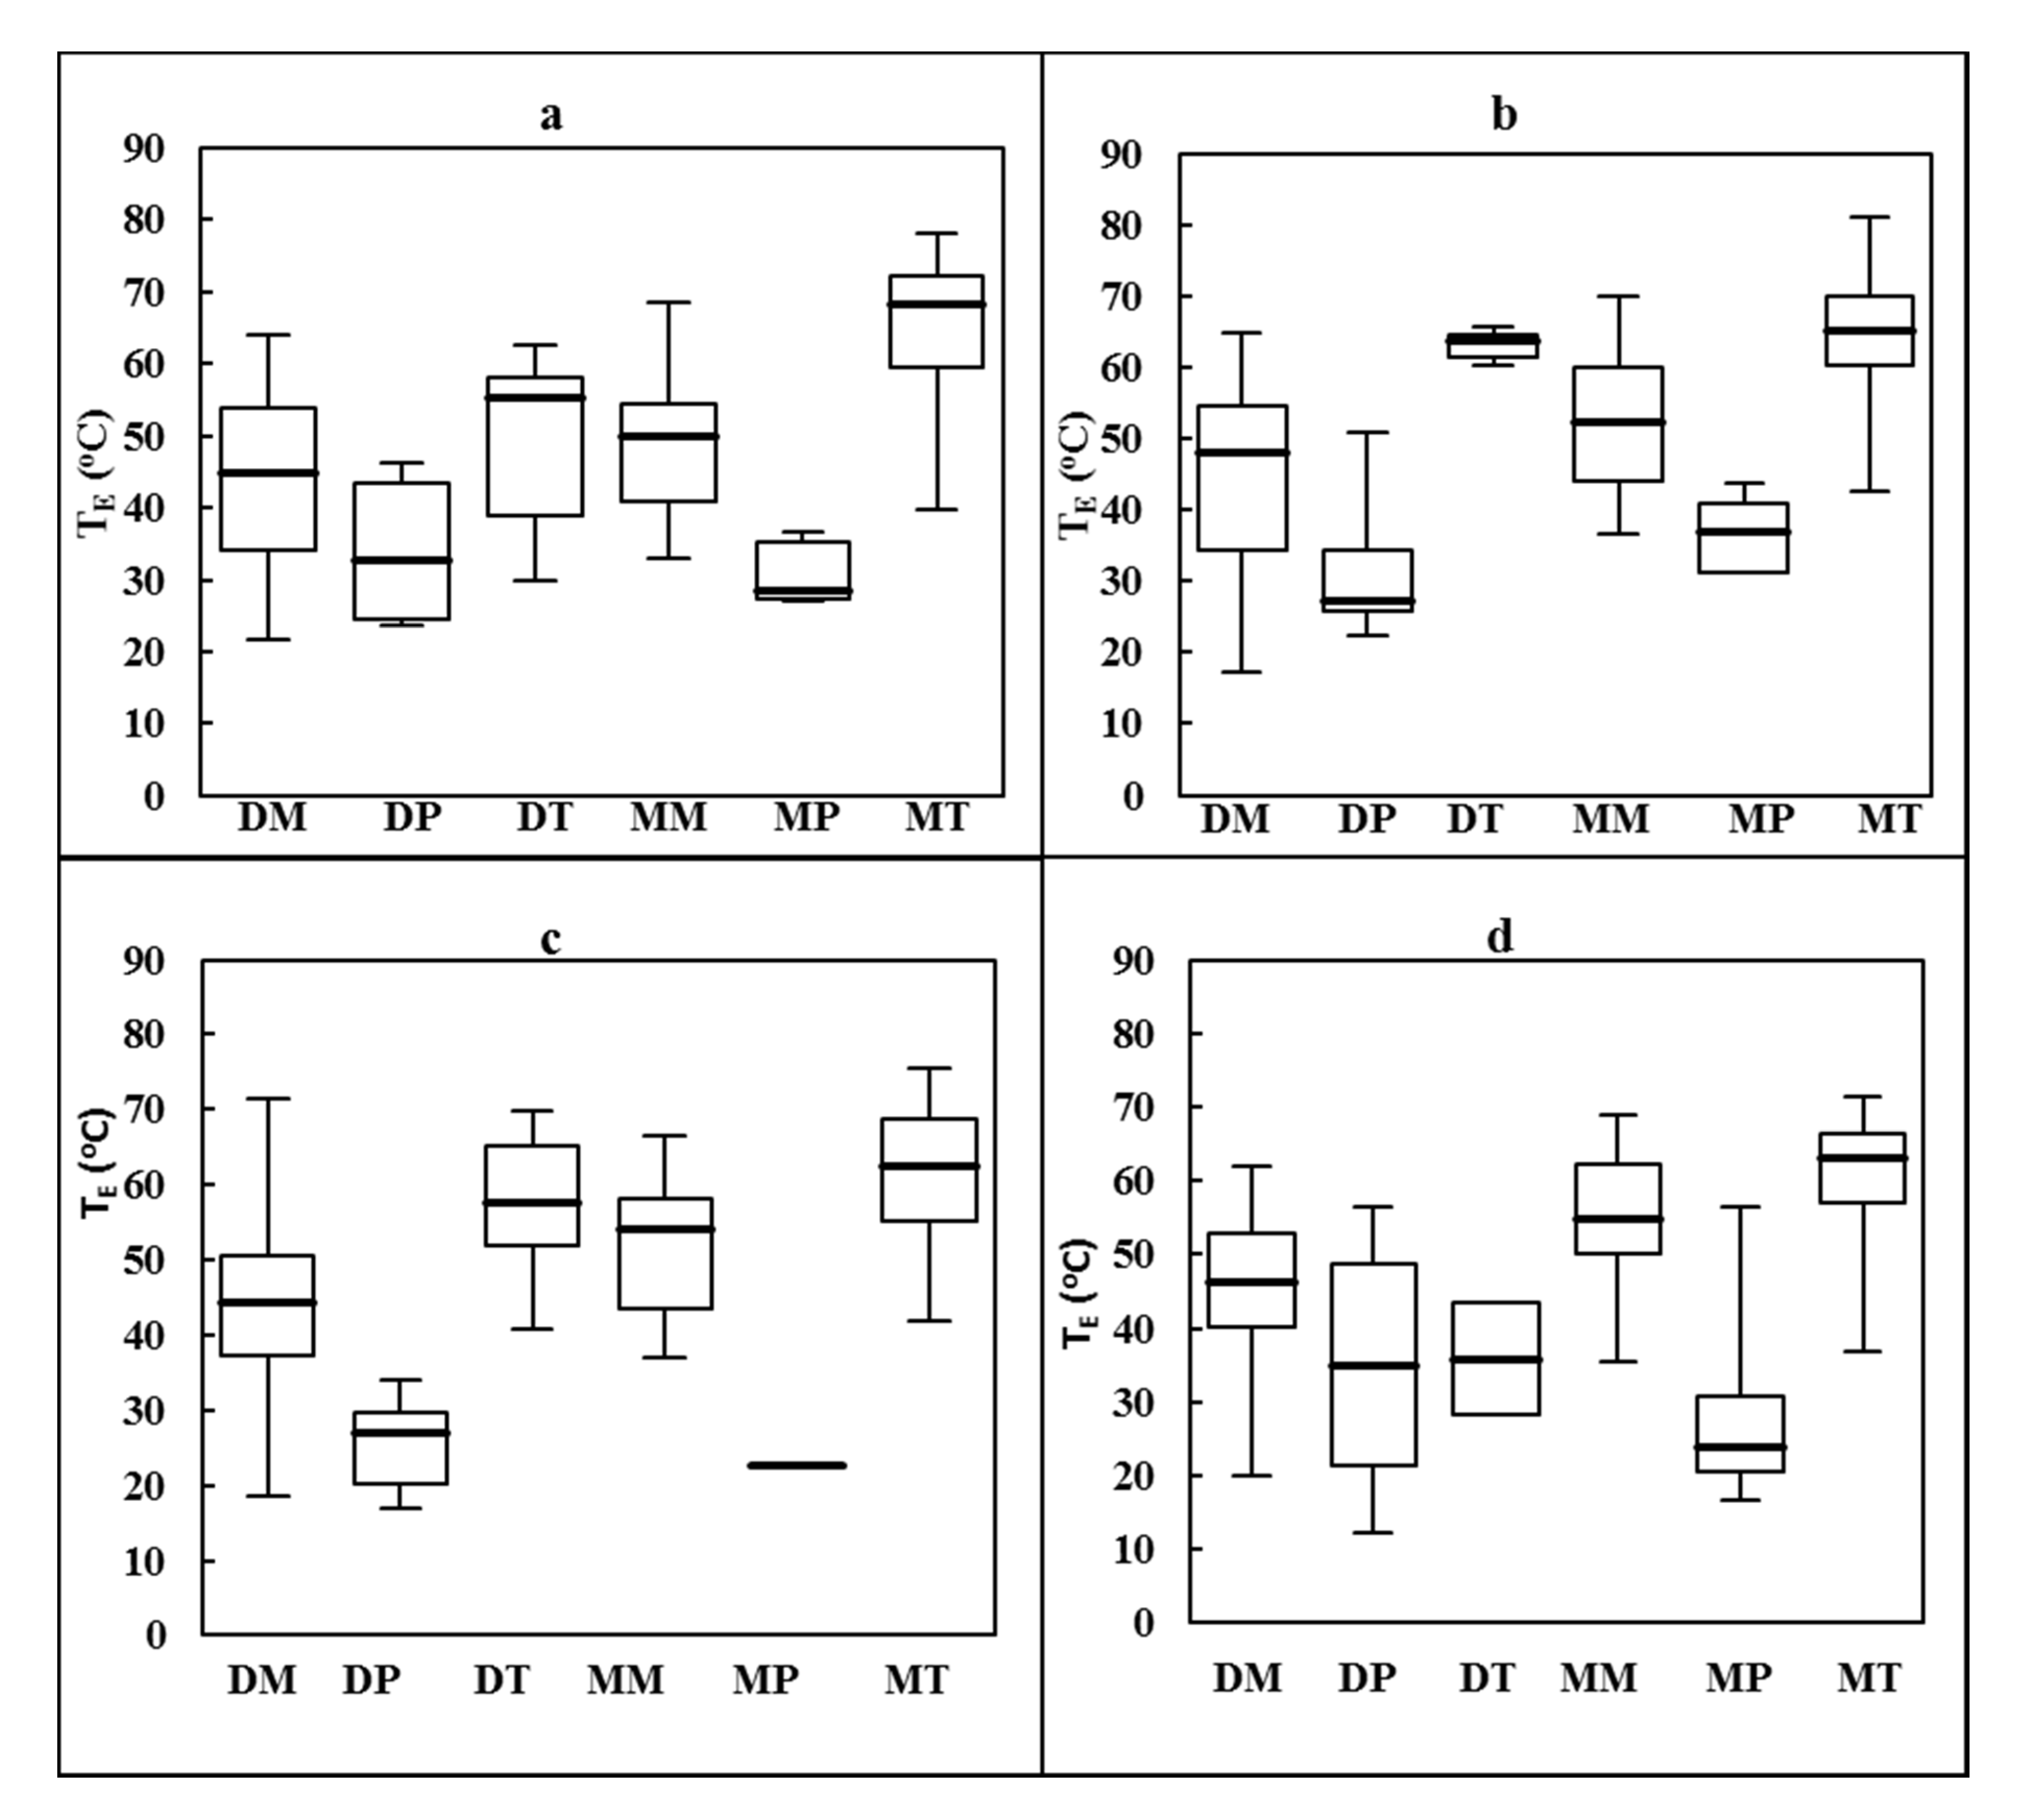
The minimum and maximum TE did not show high year-to-year variations for all stations for different air mass types (Figure 5a–d). For example, minimum TE for 2010, 2011, 2012 and 2013 for the MT air mass were 40 °C, 42 °C, 42 °C and 36 °C, respectively, for the Calloway County Mesonet station. The corresponding maximum TE for the MT air mass types for Calloway County for 2010, 2011, 2012 and 2013 were 78 °C, 81 °C, 76 °C and 71 °C, respectively, whereas minimum TE for 2010, 2011, 2012 and 2013 for the dry polar air mass were 24 °C, 22 °C, 17 °C, and 12 °C for the Calloway County Mesonet station, respectively.
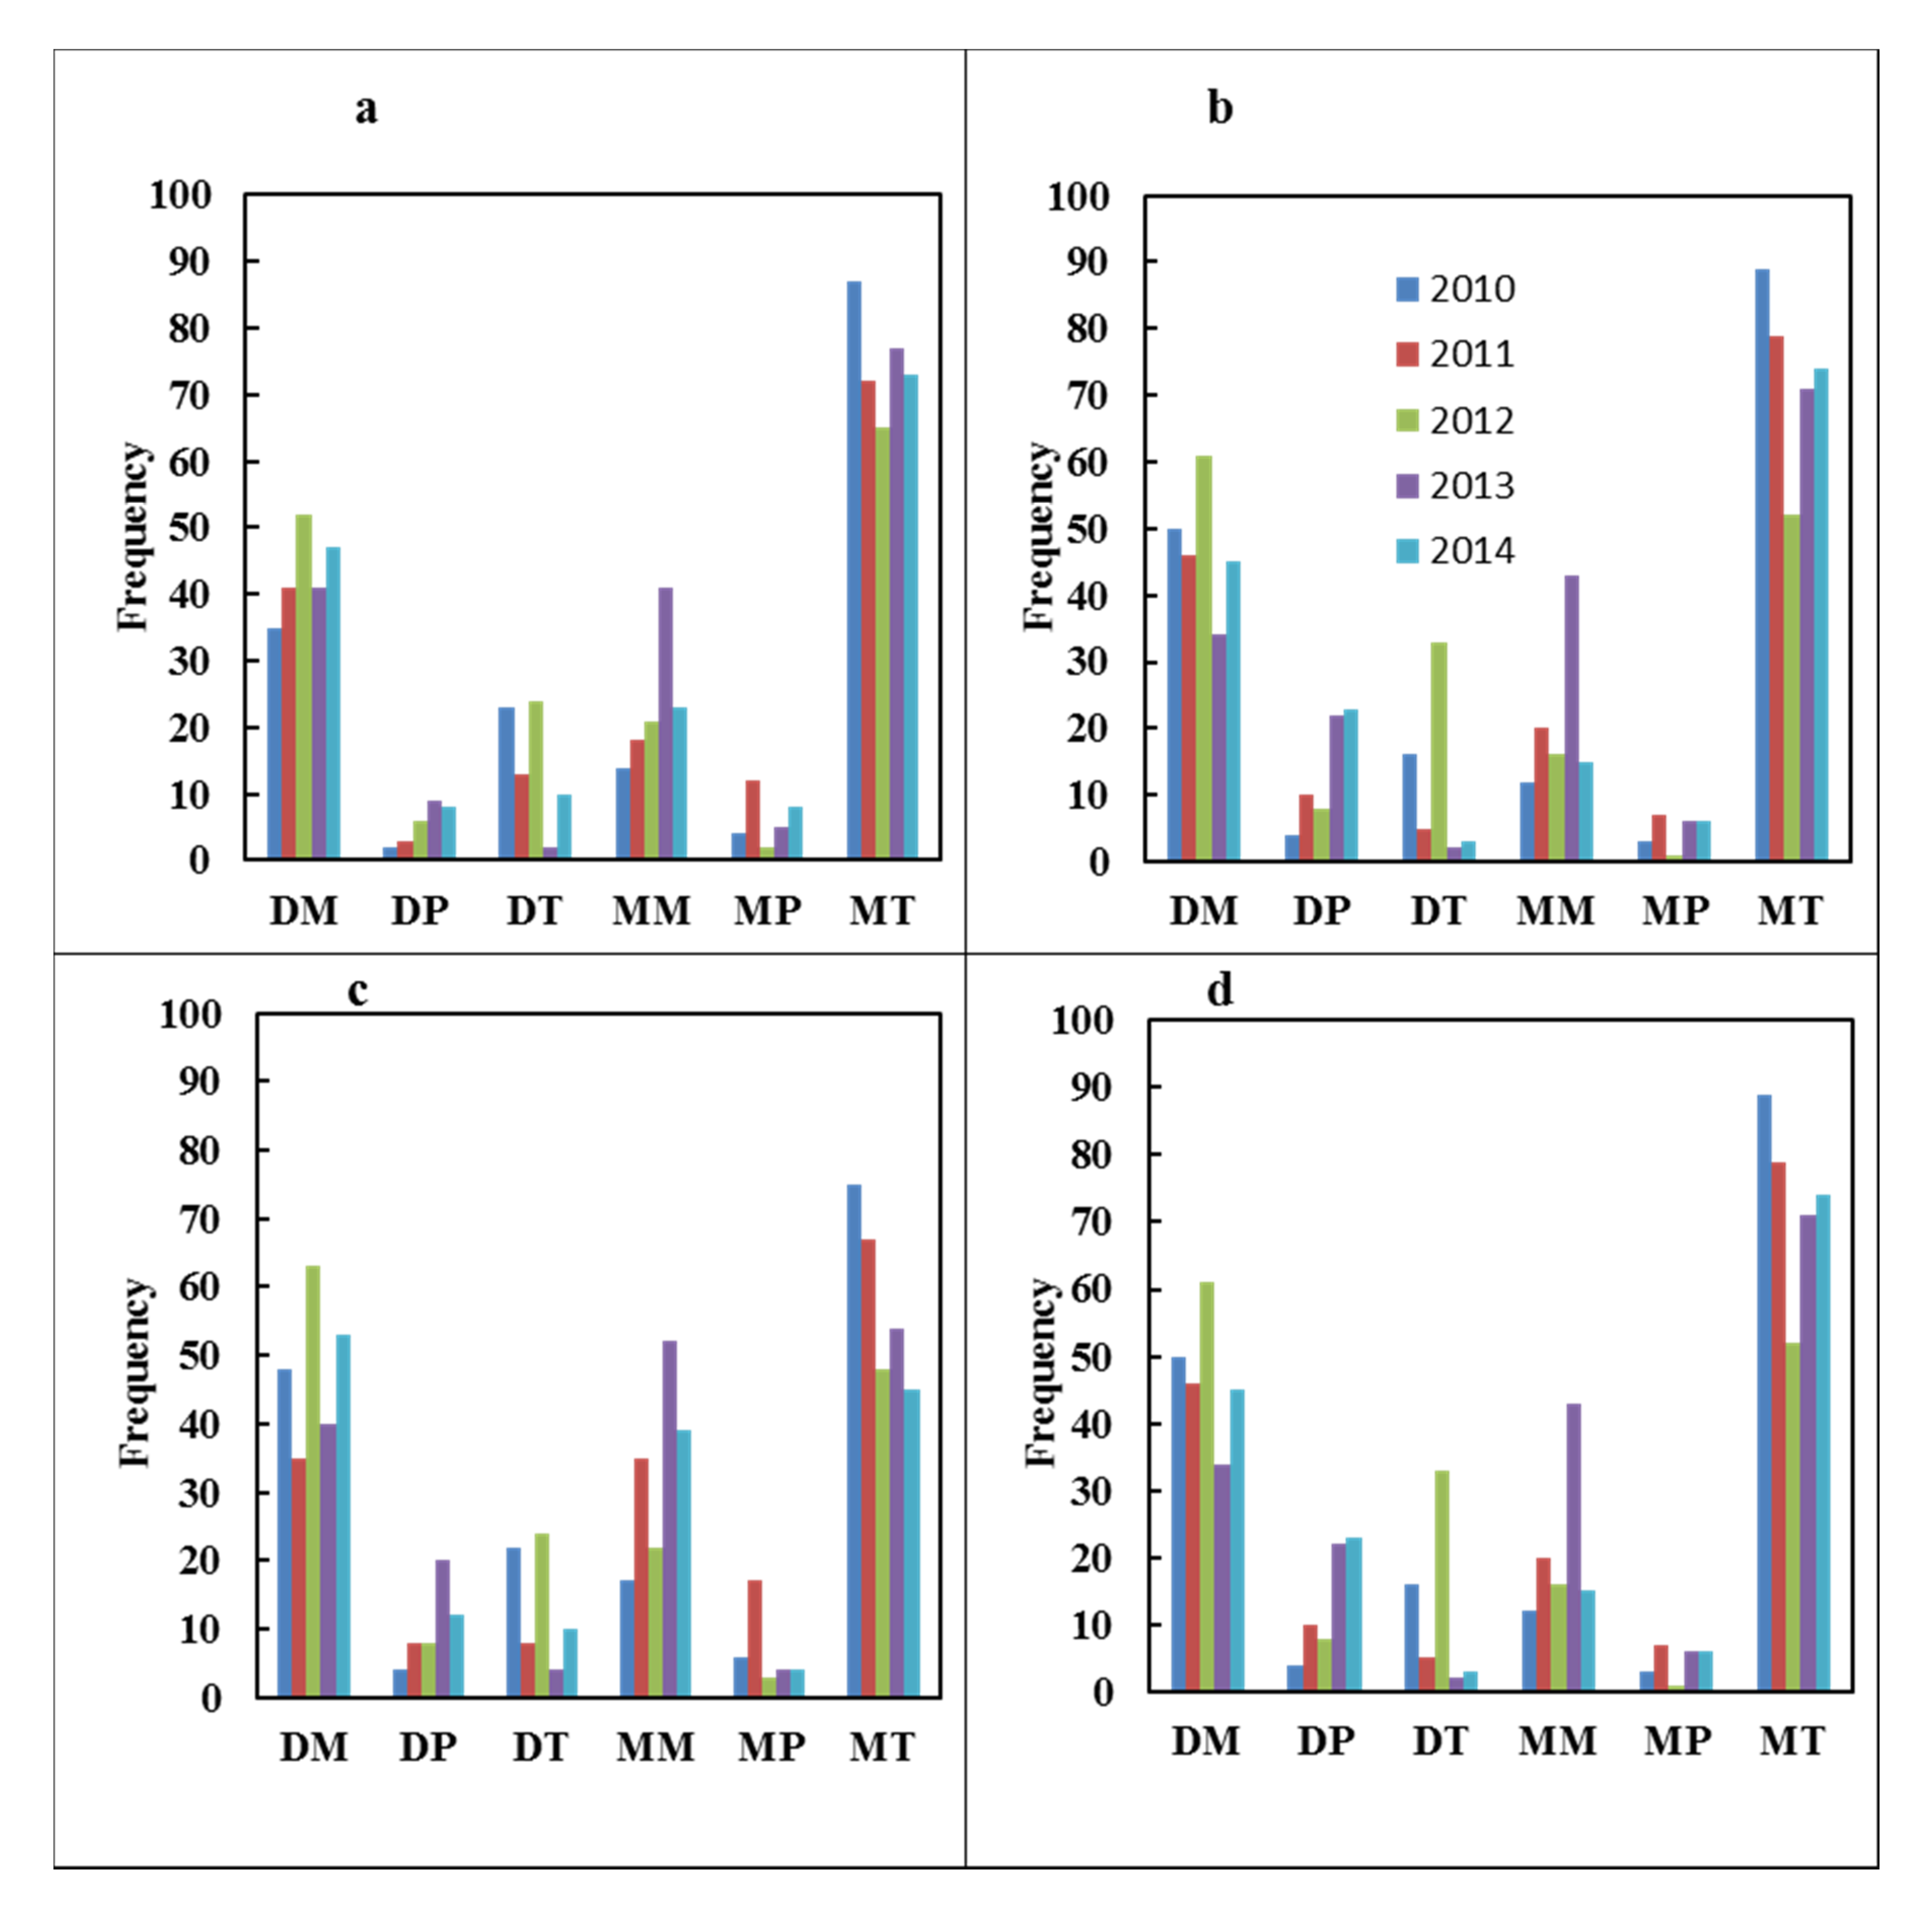
It is clear that the moist tropical air mass had the highest frequencies of all the air mass types for all stations for the growing season, with the exception of 2012. It appears that the 2012 drought in Kentucky was a reason for this exception. This drought event was associated with noticeable changes in air mass frequency, with a decrease in the moist air mass types and an increase in the dry air mass types. As explained earlier and illustrated in Figure 4, although Barren County showed an increase in frequency with the DM air mass from 41 days in 2011 to 52 days in 2012 and the moist tropical air mass decreased from 72 days to 63 days, it was the only location in 2012 where the moist tropical air mass exceeded the dry moderate air mass.

3.3. Intra-seasonal Air Mass and TE Distribution

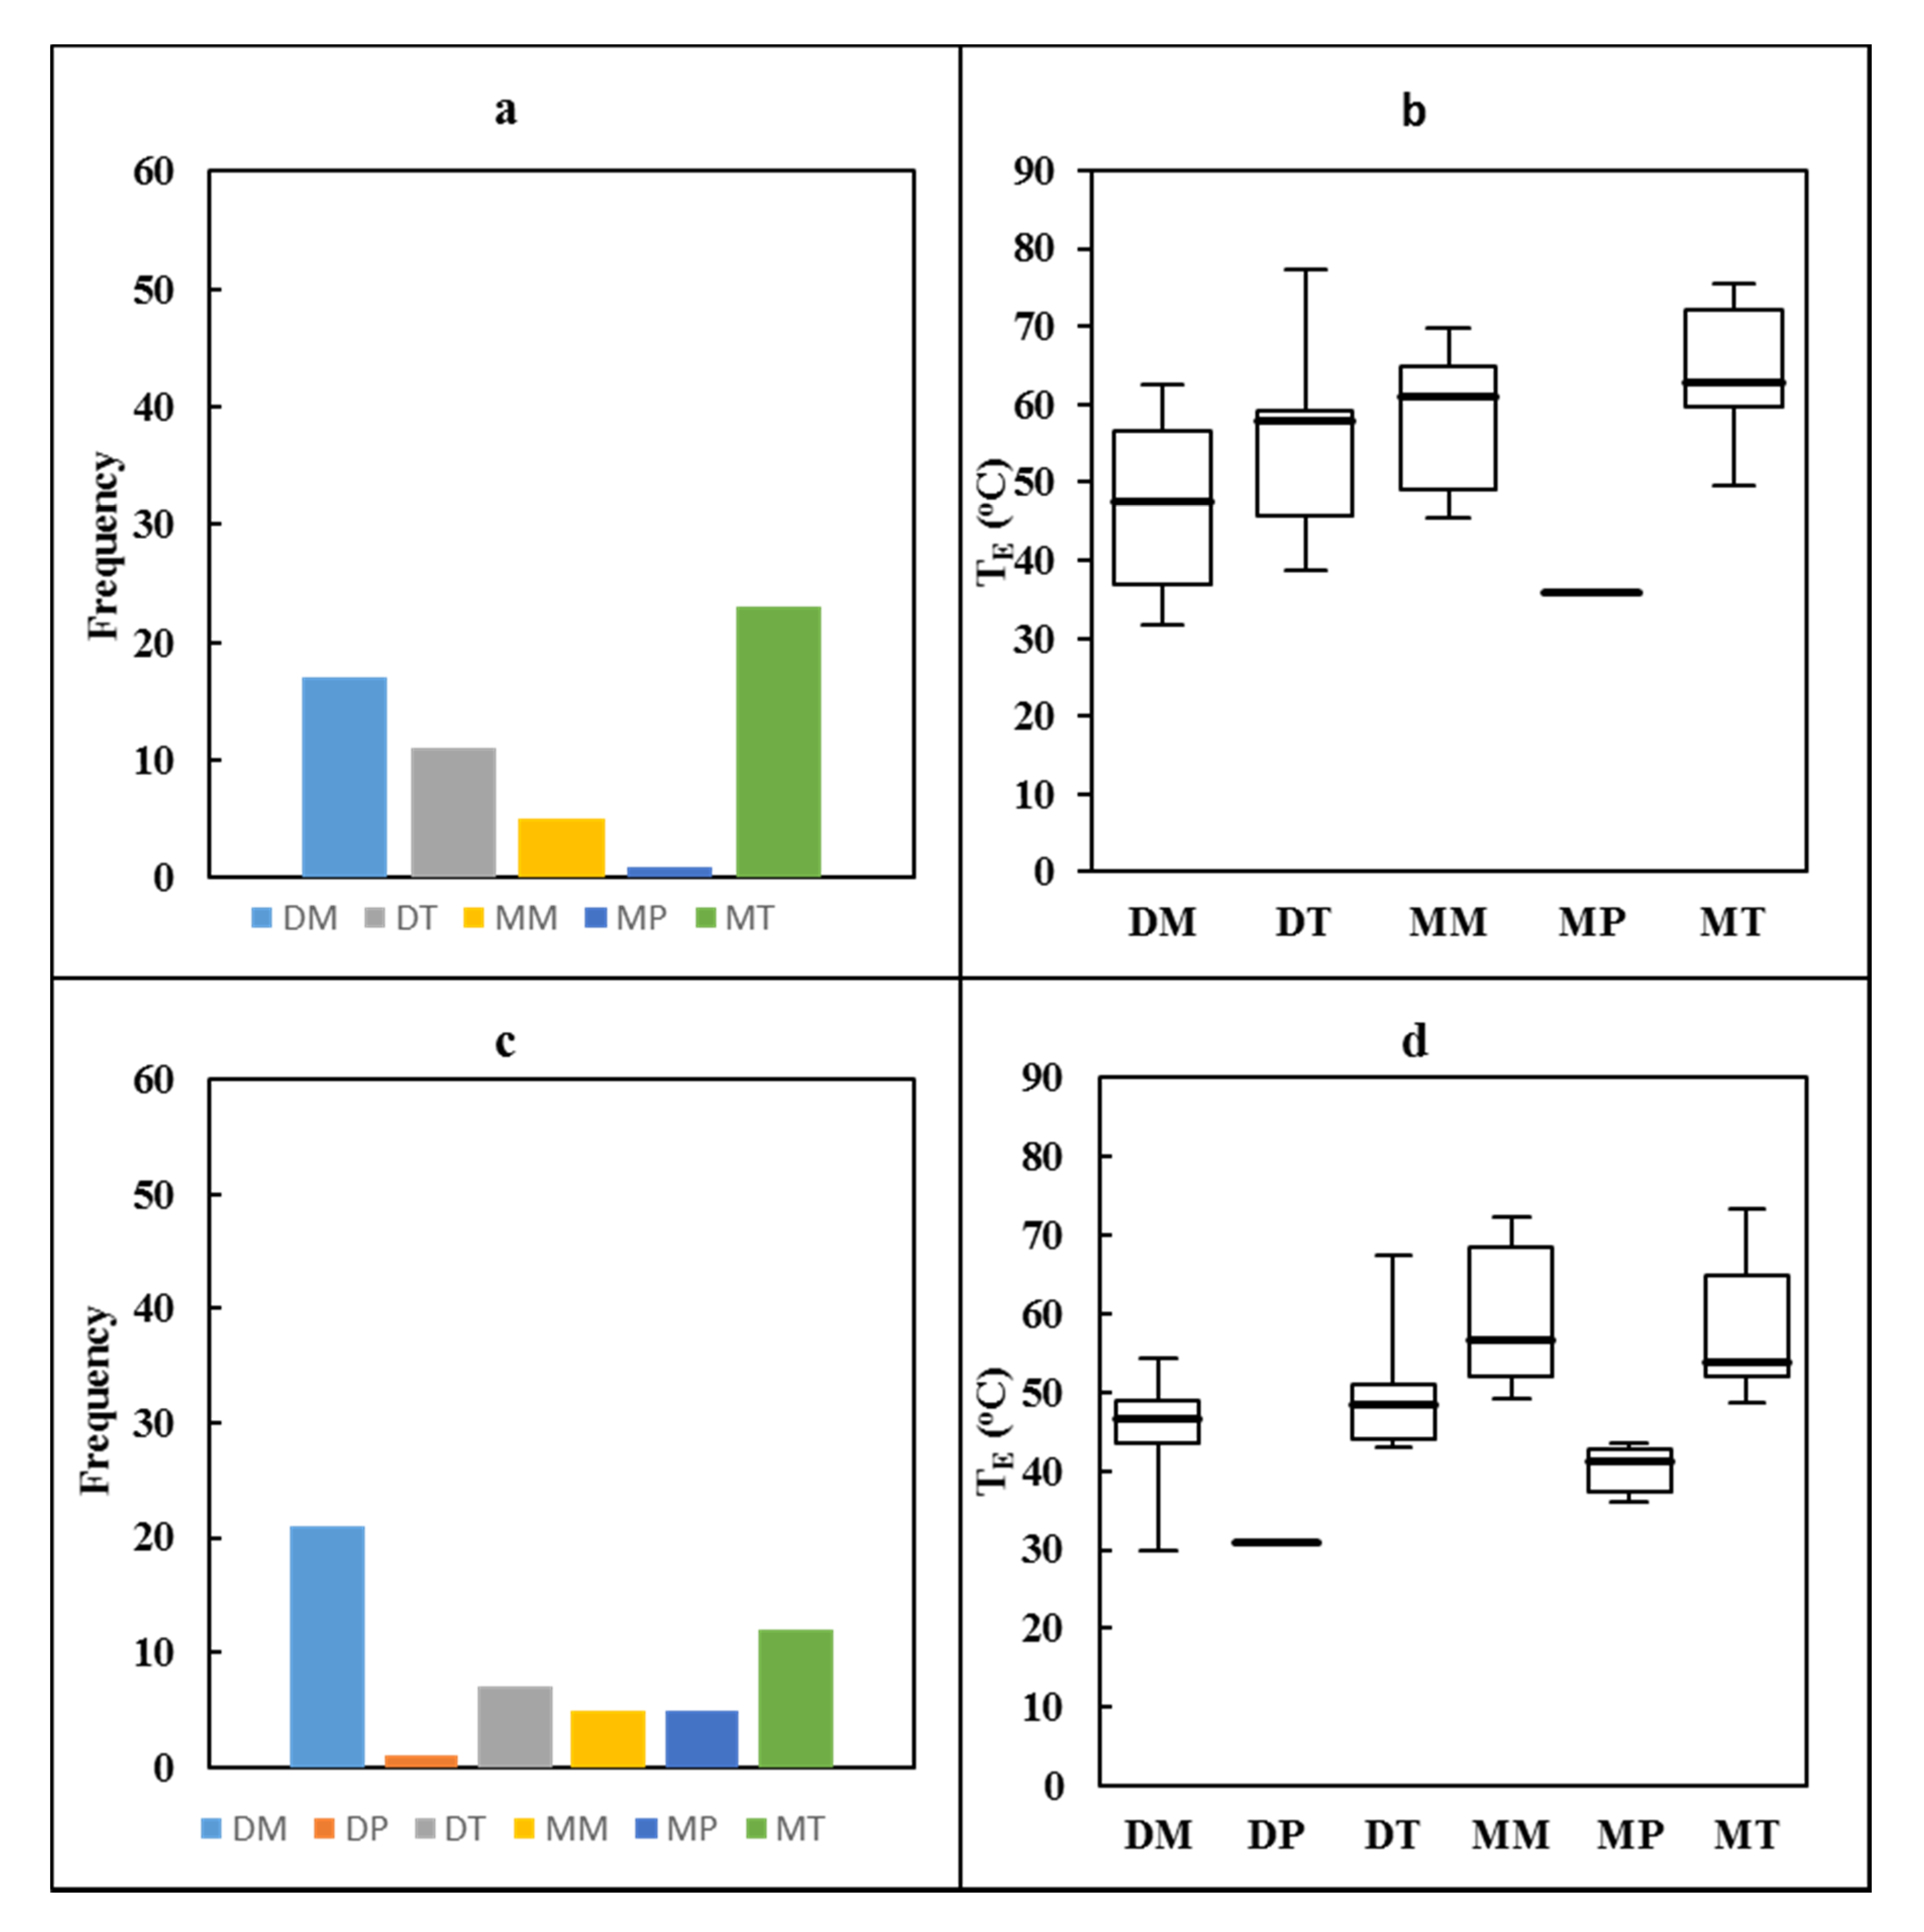
The dry air mass types had a relatively high frequency in April and May but reduced in June and July as the moist air mass peaked (Figure 3a,b and Figure 6a–d).
The frequency of the moist air mass was lower in August and September as the arrival of the dry air mass types peaked in this season (Figure 3a,b and Figure 6a–d). Calloway County, for example, experienced on average 19 days of dry moderate air mass types in April and May (not shown). This frequency was reduced to seven days in June and July and increased again to 24 days in August and September. The moist tropical air mass, on the other hand, had a frequency of 21 days in April and May, which increased to 47 in June and July and then reduced to 21 days in August and September. By the late growing season, the influence of moisture from the Gulf of Mexico was minimized and resulted in reduction of MT air mass frequency.
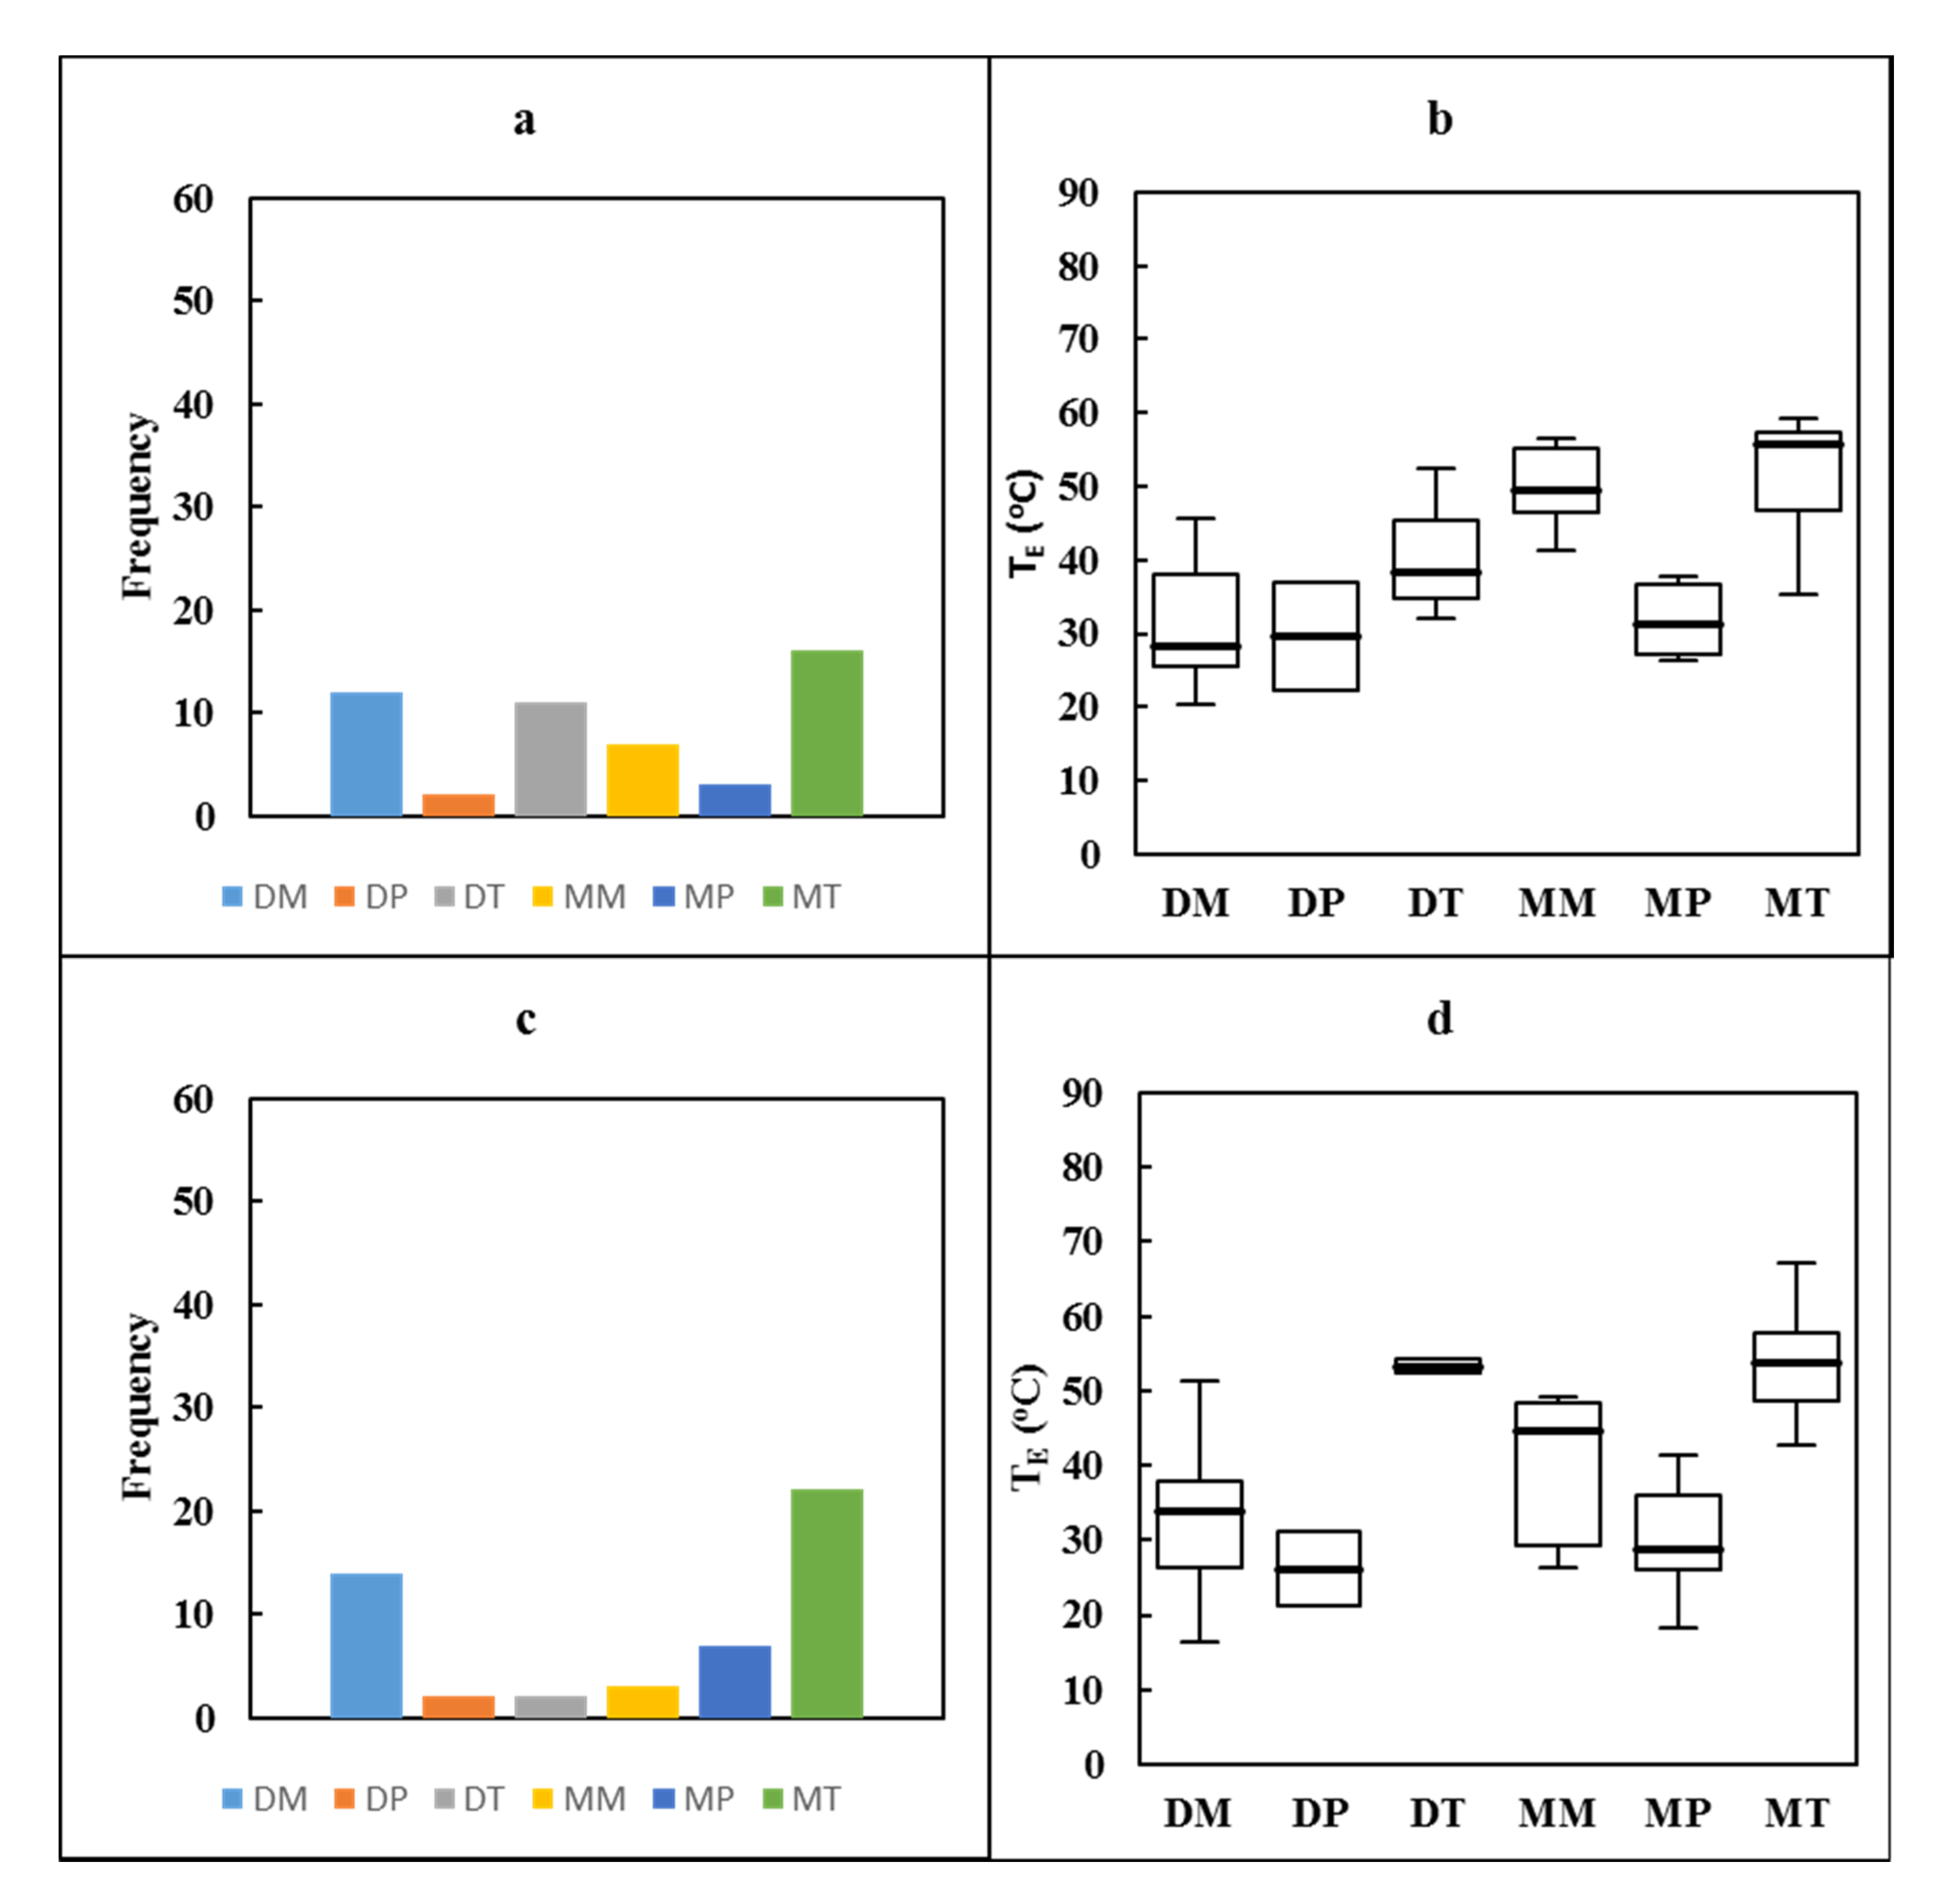
Hence, in April and May, the MT air mass dominated in terms of frequency and had high TEs for the 5-year period (Figure 6a–d). For example, Barren County in 2010 and 2011 had estimated TE ranging from 35 °C to 59 °C and 42 °C to 67 °C, respectively (Figure 6b,d). The DM air mass, on the other hand, had a relatively lower TE for the 5-year period. In 2010 and 2011, the recorded TE values were between 20 °C to 45 °C and 16 °C to 51 °C, respectively. In other words, from the box plots (Figure 6b,d), April and May recorded a wide range of TE (16–67 °C in 2011) regardless of air mass type. In the early growing season, plant water usage and requirement are generally low and increase as the season progresses. In effect, evapotranspiration rates are low early in the season and gradually increase as the season progresses. Hence, TE is generally low early in the season and increases as the growing season progresses.
In June and July, the MT air mass peaked in frequency as well as TE for the 5-year period (Figure 7a–d). This is expected for the most part because air and dew point temperatures influence TE. The maximum TE was 81 °C and the minimum TE was 51 °C for Barren County in 2011 for the MT air mass (Figure 7b,d). In the same light, the dry moderate air mass also had higher estimated values for TE compared to April and May. For example, a maximum TE of 63 °C and a minimum of 49 °C were estimated for the season. As compared to the early growing season where the minimum TE was lower, the middle growing season showed relatively higher minimum TE for prevalent air mass types. The frequency of the DP and MP air mass types was either low or nonexistent, as shown in Figure 6.
In August and September, atmospheric moisture decreases mainly due to changes in large-scale synoptic pattern and decreasing use of water by plants as they start to reach senescence and resultant lowering of evapotranspiration. The frequency of the moist tropical air mass also begins to decline as the season transitions from the middle to the late growing season (Figure 8a–d).
The frequency of dry moderate weather, however, starts to increase. The maximum and minimum TE were 73 °C and 48 °C, respectively, in 2011 in Barren County for the moist tropical air mass. The DM air mass reported a maximum TE of 54 °C and a minimum of 30 °C.

3.4. Air Mass TE and T Differences

Results from the sections above indicate that the moist air mass types dominate during the growing season. High and low TE correspond with moist and dry air mass types, respectively. This section examines selected days with their corresponding TE values, air mass types, and TE differences. The results show that the early growing season was dominated typically by dry air masses and hence low TE values. Thus, differences between TE and T in the early growing season were small.
Days with moist air mass types recorded a high TE and had a corresponding high TE-T difference for all 10 stations. In Barren County, for example, the lowest TE-T difference was 10 °C on 18 April 2010, which was a dry weather day (T = 10 °C and TE = 20 °C). On the other hand, the highest difference of 48 °C (T = 27 °C and TE = 75 °C) reported on 11 August 2010 experienced a moist tropical weather event. Although land cover influences both moisture availability and temperature in the lower atmosphere and TE is larger in areas with higher evapotranspiration rates, the biggest factor for the intra-seasonal variations in TE is air mass contribution, as indicated in Table 6. For example, the year-to-year variations of TE on May 1 are much greater than the station-to-station variations within a given year. This supports the understanding that the inter-annual and intra-seasonal variations in TE can be notably influenced by air mass. This is further confirmed by the findings that the moist air mass types commonly show large TE-T differences. A large difference in this case suggests that there is higher contribution of moisture to atmospheric heat content.
The results presented are complimentary to the findings by [7], which quantified near-surface TE for the spring, summer, fall, and winter seasons and assessed potential land-surface influence. The current study quantified intra-seasonal TE variations for different air masses during the growing season and is one of the first on this topic. The findings suggest that during the growing season intra-seasonal atmospheric moistness, linked to air mass characteristics, varies from relatively dry to moist to relatively dry during the early-, mid-, and late-growing season, respectively. Hence, TE varies also throughout the growing season from relatively low to high to relatively low, respectively.
In summary, this research not only quantified TE associated with different air masses but also provided further insight into intra-seasonal variations during the growing season. Moreover, TE estimates and TE-T differences provided in this research are comparable to TE estimates provided in previous [3,4,5,6,7,8] investigations. In addition, results from this study offered an additional perspective of TE variations, namely in meso-scale, while previous studies predominantly focused on large-scale [3,5] or a single location [2,4] assessment of TE variations. Thus, the present research partly filled a void in the literature.

4. Conclusions

The assessment of climate variability and change has largely focused on air temperature as the primary metric [1]. Research suggests that the air temperature alone is an inadequate metric of near-surface heat content, as it does not account for the changes associated with moisture content variations. We suggest that equivalent temperature (TE), which incorporates both the dry and moist heat content, is a better indicator of overall heat content. In this paper we investigate and quantify intra-seasonal and inter-annual variations of growing season TE in the east central U.S. This research explains some of the causes of these variations by examining the influence of different air mass types.
Daily TE and air mass (using the Spatial Synoptic Classification) data between 2010 and 2014 for 10 Mesonet stations were analyzed to examine how different air mass types influenced equivalent temperature. These 10 stations and their data were selected from a set of data from 33 stations. An analysis of variance (ANOVA) on all the air mass types yielded statistically significant variations among TE values and these differences varied intra-seasonally and inter-annually. The results suggest that TE changed under different air mass types as well as in different times of the seasons. From the results and analysis, it can be inferred that the intra-seasonal and inter-annual variations in TE in the study region and period were influenced by the major air mass types, and there were links between changes in and magnitudes of TE to intra-seasonal air mass differences.
Results indicated that the growing season was dominated by the MT air mass for all stations for the years 2010, 2011, 2013, and 2014. In 2012, the DM dominated the growing season for all stations except for the Barren County Mesonet station. The highest TE values were expected to be influenced most by the MT air mass. As the season transitioned into the mid-growing season (June and July), occurrences of high TE values corresponded with the higher frequency of moist air mass (MT) occurrences. In the late growing season (August and September), TE values began to decline. This is mainly due to the changes in season and synoptic weather pattern and related changes in air mass types, and also due to declining plant water requirement and evapotranspiration.
Finally, differences between TE and T in the early growing season were smaller. Days with low TE were also characterized by dry air mass types and days with high TE were typically moist and had a corresponding high TE-T difference, especially in the mid-growing season. In short, based on the findings of this study [7], we suggest that future research could focus on moisture budget analysis to shed further light on the contributions of various moisture sources to TE. In particular, future investigations may quantify relative contribution of different air masses and various types of land use land cover to TE.

Author Contributions

Author Contributions: Analysis, writing, and the first draft preparation, D.N.-Y. and R.M.; methodology, R.M., G.G., D.N.-Y. and K.C.; review and editing, R.M., G.G. and J.D.; and data curation, K.Y. All authors have read and agreed to the published version of the manuscript.

Funding

This research did not receive any external funding.

Acknowledgments

The authors would like to thank two anonymous reviewers for their valuable comments which helped to improve this paper.

Conflicts of Interest

The authors declare no conflict of interest.

References

  1. Intergovernmental Panel on Climate Change (IPCC). Contribution of Working Groups I, II and III to the Fifth Assessment Report of the Intergovernmental Panel on Climate Change. In Climate Change 2014: Synthesis Report; Core Writing Team, Pachauri, R.K., Meyer, L.A., Eds.; Cambridge University Press: Cambridge, MA, USA, 2018. [Google Scholar]
  2. Pielke, R.A., Sr.; Davey, C.A.; Morgan, J. Assessing “global warming” with surface heat content. EOS Trans. 2004, 85, 210–211. [Google Scholar] [CrossRef]
  3. Davey, C.A.; Pielke, R.A.; Gallo, K.P. Differences between near-surface equivalent temperature and temperature trends for the Eastern United States. Equivalent temperature as an alternative measure of heat content. Glob. Planet. Chang. 2006, 54, 19–32. [Google Scholar] [CrossRef]
  4. Rogers, J.C.; Wang, S.H.; Coleman, J.S.M. Evaluation of a long-term (1882–2005) equivalent temperature time series. J. Clim. 2007, 20, 4476–4485. [Google Scholar] [CrossRef] [Green Version]
  5. Fall, S.; Diffenbaugh, N.S.; Niyogi, D.; Pielke, R.A.; Rochon, G. Temperature and equivalent temperature over the United States (1979–2005). Int. J. Climatol. 2010, 30, 2045–2054. [Google Scholar] [CrossRef] [Green Version]
  6. Schoof, J.T.; Heern, Z.A.; Therrell, M.D.; Jemo, J.W.F. Assessing trends in lower tropospheric heat content in the Central USA using equivalent temperature. Int. J. Climatol. 2014, 35, 2828–2836. [Google Scholar] [CrossRef] [Green Version]
  7. Younger, K.; Mahmood, R.; Goodrich, G.; Pielke, R.A., Sr.; Durkee, J. Mesoscale surface equivalent temperature (TE) for East Central USA. Theor. Appl. Climatol. 2019, 136, 65–75. [Google Scholar] [CrossRef]
  8. Zhang, T.; Mahmood, R.; Lin, X.; Pielke, R.A., Sr. Irrigation impacts on minimum and maximum surface moist enthalpy in the Central Great Plains of the USA. Wea. Clim. Extrem. 2019, 23, 100197. [Google Scholar] [CrossRef]
  9. Ribera, P.; Gallego, D.; Gimeno, L.; Perez-Campos, J.F.; Garcia-Herrera, R.; Hernandez, E.; De La Torre, L.; Nieto, R.; Calvo, N. The use of equivalent temperature to analyse climate variability. Stud. Geophys. Geod. 2004, 48, 459–468. [Google Scholar] [CrossRef]
  10. Pielke, R.A., Sr. Influence of the spatial distribution of vegetation and soils on the prediction of cumulus convective rainfall. Rev. Geophys. 2001, 39, 151–177. [Google Scholar] [CrossRef]
  11. Ford, T.; Schoof, J.T. Oppressive heat events in Illinois related to antecedent wet soils. J. Hydrometeor. 2016, 17, 2713–2716. [Google Scholar] [CrossRef]
  12. Mahmood, R.; Schargorodski, M.; Foster, S.; Quilligan, A. A technical overview of the Kentucky Mesonet. J. Atmos. Oceanic. Tech. 2019, 36, 1753–1771. [Google Scholar] [CrossRef]
  13. Sheridan, S.C. The redevelopment of a weather-type classification scheme for North America. Int. J. Climatol. 2002, 22, 51–68. [Google Scholar] [CrossRef]
  14. Knight, D.B.; Davis, R.E.; Sheridan, S.C.; Hondula, D.M.; Sitka, L.J.; Deaton, M.; Lee, T.R.; Gawtry, S.D.; Stenger, P.J.; Mazzei, F.; et al. Increasing frequencies of warm and humid air masses over the conterminous United States from 1948 to 2005. Geophys. Res. Lett. 2008, 35, L10702. [Google Scholar] [CrossRef] [Green Version]
  15. Bolton, D. The computation of equivalent potential temperature. Mon. Wea. Rev. 1980, 108, 1046–1053. [Google Scholar] [CrossRef] [Green Version]
  16. Kalkstein, L.S.; Nichols, M.C.; Barthel, C.D.; Greene, J.S. A new spatial synoptic classification: Application to air-mass analysis. Int. J. Climatol. 1996, 16, 983–1004. [Google Scholar] [CrossRef]
  17. Walford, N. Practical Statistics for Geographers and Earth Scientists; John Wiley & Sons, Ltd.: Hoboken, NJ, USA, 2011; p. 211. [Google Scholar]
  18. Wilks, D.S. Statistical Methods in the Atmospheric Sciences; Academic Press: San Diego, CA, USA, 2011; pp. 215–236. [Google Scholar]
  19. Scheitlin, K.N.; Dixon, P.G. Diurnal temperature range variability due to land cover and air mass types in the Southeast. J. Appl. Meteorol. Climatol. 2010, 49, 879–888. [Google Scholar] [CrossRef] [Green Version]
  20. Na-Yemeh, D.Y. Synoptic Atmospheric Conditions, Land Cover, and Equivalent Temperature Variations in Kentucky. Master’s Thesis, Western Kentucky University, Bowling Green, KY, USA, 2017. [Google Scholar]
  21. Wendland, W.M.; Bryson, R.A. Northern Hemisphere airstream regions. Mon. Wea. Rev. 1981, 109, 255–270. [Google Scholar] [CrossRef]
Figure 1. State of Kentucky, Spatial Synoptic Classification (SSC) Stations, and selected Kentucky Mesonet stations.
Climate 08 00095 g001
Figure 2. Temperature (T) and Equivalent temperature (TE), for Barren County Mesonet Station, KY, in 2014.
Climate 08 00095 g002
Figure 3. The frequency of air mass types for the growing season in the Fulton County Mesonet station: (a) 2010, and (b) 2012.
Climate 08 00095 g003
Figure 4. The frequency of air mass types for: (a) Barren County, (b) Calloway County, (c) Campbell County, and (d) Fulton County Mesonet stations for the study period.
Climate 08 00095 g004
Figure 5. Box-Whisker plots of TE for Calloway County Mesonet station: (a) 2010, (b) 2011, (c) 2012, and (d) 2013. They show maximum and minimum, median, and quartile TE.
Climate 08 00095 g005
Figure 6. Distribution of air mass types and TE for the Barren County Mesonet station for April and May: (a) and (b) 2010, and (c) and (d) 2011. Panels on the left column (Figure 6a–c) show frequency of observed air mass types during the early growing seasons of 2010 and 2011. Panels on the right (Figure 6b–d) column show distribution of TE values for these air mass types using Box-Whisker plots. Explanation of Box-Whiskers plot is provided in the caption of Figure 5.
Climate 08 00095 g006
Figure 7. Distribution of air mass types and TE for the Barren County Mesonet station for June and July: (a) and (b) 2010, and (c) and (d) 2011.
Climate 08 00095 g007
Figure 8. Distribution of air mass types and TE for the Barren County Mesonet station for August and September: (a) and (b) 2010, and (c) and (d) 2011.
Climate 08 00095 g008
Table 1. Selected Mesonet stations and ASOS stations used for spatial synoptic classification (SSC).
CountySite IDLATITUDELONGITUDEELEVATION (m)SSC
BarrenMROK37.01328−86.106212BNA
CallowayMRRY36.61261−88.336173PAH
CampbellHHTS39.01997−84.475225CVG
FultonHCKM36.57108−89.159105PAH
HardinCCLA37.67939−85.979227SDF
HopkinsERLN37.26764−87.481180EVV
JacksonOLIN37.35629−83.971402LEX
MasonWSHT38.62369−83.808277LEX
OhioHTFD37.45732−86.855164EVV
WarrenFARM36.92669−86.465170BNA
Table 2. One-Way Analysis of Variance for TE by air mass types for Barren County Mesonet station for 2010.
EffectSSDFMSFp-Value
Model17,099.3153419.8635.190.001
Error15,451.1415997.18
Total32,550.45164198.48
SS—Sum of squares (This relates to the total variance of the observations); DF—Degrees of Freedom (Each sample has degrees of freedom equal to one less than their sample sizes, so with k samples the total degrees of freedom is k less than the total sample size: df = N - k.); MS—Mean Square (mean squares tell us if factors (treatments) are significant. The treatment mean square represents the variation between the sample means; F- is the ratio of two mean square values); and p-value—Statistical significance.
Table 3. Results of Barren County two-way ANOVA for the TE based on season and air mass classifications, including mean-square error (MS), F value, and p-value. In addition to an individual analysis of the three variables, the ANOVA tests two-way interactions between variables.
SourceMean SquareFp-Value
Corrected Model2138.9149.140.001
Intercept363,404.558349.150.001
Season5944.46136.570.001
Air mass7327.07168.340.001
Season Air mass164.143.770.001
Table 4. Average TE for the early-, mid-, and late-growing seasons in Barren County for different years and the different air mass types.
Air Mass TypesYearEarly (°C)Mid (°C)Late (°C)
DM2010315247
2011335546
2012354846
2013325147
2014334946
Mean335147
DP201030--
201126-31
201218-26
2013224643
2014224336
Mean244534
DT2010406055
2011536550
2012515952
201343--
201441-51
Mean466152
MM2010506658
2011406160
2012406259
2013465960
2014535756
Mean466159
MP201032-40
201130-40
201226-54
20132955-
2014264845
Mean295245
MT2010526866
2011546758
2012536663
2013506462
2014526364
Mean526663
Table 5. Minimum and maximum TE for the Fulton County Mesonet station.
2010 2011
SSCFrequencyMeanMaxMinMedianSSCFrequencyMeanMaxMinMedian
DM5045662546DM4646641949
DP434462533DP1032522428
DT1651693056DT563675864
MM1251703451MM2054743853
MP332372830MP736443036
MT8967814169MT7966804567
2012 2013
SSCFrequencyMeanMaxMinMedianSSCFrequencyMeanMaxMinMedian
DM6143671943DM3444612146
DP826341827DP2234561235
DT3357695841DT235442735
MM1652663554MM4354693255
MP123232323MP628571623
MT5262754463MT7160703762
2014
SSCFrequencyMeanMaxMinMedian
DM4545622246
DP2338531144
DT339443241
MM1560695261
MP632452529
MT7460743263
Table 6. Daily TE for May 1 for the 10 stations for all five (5) years.
1 May 2010 1 May 2011
StationMoisture content %TEDiff (TE-T)Air massStationMoisture content %TEDiff (TE-T)Air mass
Barren9.084829Moist ModerateBarren8.364527Moist Tropical
Calloway10.115233Moist ModerateCalloway9.084620Moist Moderate
Campbell8.584627Moist tropical Campbell8.254526Moist Tropical
Fulton10.755635Moist ModerateFulton9.064629Moist Moderate
Hardin9.024729Moist ModerateHardin8.824628Moist Moderate
Hopkins9.554931Moist ModerateHopkins9.064629Moist Moderate
Jackson8.454527Moist ModerateJackson7.524124Moist Tropical
Mason8.364527Moist TropicalMason7.914425Moist Tropical
Ohio9.614931Moist ModerateOhio8.844628Moist Moderate
Warren9.374930Moist ModerateWarren8.864728Moist Tropical
1 May 2012 1 May 2013
StationMoisture content %TEDiff (TE-T)Air massStationMoisture content %TEDiff (TE-T)Air mass
Barren10.195634Moist tropical Barren8.194726Moist Tropical
Calloway9.675632Moist Tropical Calloway7.854625Moist Tropical
Campbell9.555031Moist Tropical Campbell6.474220Dry Tropical
Fulton9.445631Moist Tropical Fulton7.934525Moist Tropical
Hardin9.625431Moist Tropical Hardin7.414323Dry Tropical
Hopkins9.825632Moist TropicalHopkins7.494524Dry moderate
Jackson9.605331Moist TropicalJackson6.834021Dry Moderate
Mason9.945332Moist TropicalMason7.194523Dry Tropical
Ohio9.465431Moist TropicalOhio7.504524Dry Moderate
Warren10.085633Moist TropicalWarren8.024626Moist Tropical
1 May 2014
StationMoisture content %TEDiff (TE-T)Air mass
Barren4.552614Dry Moderate
Calloway4.632514Dry Polar
Campbell3.832311Dry Moderate
Fulton4.442613Dry Polar
Hardin4.452513Dry Moderate
Hopkins4.432513Dry Polar
Jackson4.722514Dry Polar
Mason4.552514Dry Moderate
Ohio4.542514Dry Polar
Warren4.622614Dry Moderate