Article

Using the CHIRPS Dataset to Investigate Historical Changes in Precipitation Extremes in West Africa

1
African Centre of Excellence on Climate Change, Biodiversity and Sustainable Agriculture University Felix Houphouet-Boigny (UFHB), 22 B.P. 582 Abidjan 22, Cote D’Ivoire
2
Laboratory of Geosciences and Environment, University Nangui Abrogoua, UFR Science and Environmental Management, 02 BP 801 Abidjan 02, Cote D’Ivoire
3
LPAOSF/ESP, Cheikh Anta Diop University, 5085 Dakar-Fann, Senegal
4
Laboratory of Physics of Atmosphere and Fluid Mechanics, 22 B.P. 582 Abidjan 22, Cote D’Ivoire
5
Institute of Environmental Geosciences, University Grenoble Alpes, IRD, CNRS, Grenoble INP, IGE, F-38000 Grenoble, France
*
Author to whom correspondence should be addressed.
Climate 2020, 8(7), 84; https://doi.org/10.3390/cli8070084
Submission received: 23 May 2020 / Revised: 22 June 2020 / Accepted: 24 June 2020 / Published: 30 June 2020

Abstract

:
This study aims to provide improved knowledge and evidence on current (1986–2015) climate variation based on six rainfall indices over five West African countries (Senegal, Niger, Burkina Faso, Ivory Coast, and Benin) using the Climate Hazards Group InfraRed Precipitation with Station (CHIRPS) dataset. On average, precipitation has increased over the central Sahel and the western Sahel. This increase is associated with increase in the number of rainy days, longer wet spells and shorter dry spells. Over the Guinea Coast, the slight increase in precipitation is associated with an increase in the intensity of rainfall with a shorter duration of wet spells. However, these mean changes in precipitation are not all statistically significant and uniform within a country. While previous studies are focused on regional and sub-regional scales, this study contributes to deliver a climate information at a country level that is more relevant for decision making and for policy makers, and to document climate-related risks within a country to feed impact studies in key sectors of the development, such as agriculture and water resources.

1. Introduction

Since the 1990s, the frequency of hydro-climatic hazards (floods, drought, coastal erosion, storms, and strong winds) has increased in West Africa [1,2]. In the recent decades, an exponential increase in the number of floods following heavy rains has been observed over the entire region [1,2,3], as the number of such events increased from an average of less than two per year before the 1990s to more than eight or 12 per year during the 2000s. Moreover, along the coastline of the Gulf of Guinea (mainly from Dakar to Cotonou via Abidjan, Accra, and Lomé), one of the three most vulnerable coastal zones in the world [4], some districts are flooded almost every year, with a recent increase in frequency [5].
The occurrence of these extreme events are usually associated with strong rainfall [6] and may be due to a change in the stationarity of precipitation at the local or large scale. In turn, such change could result from internal variability and/or anthropogenic component of the global warming that overcomes the natural variability. According to the Intergovernmental Panel on Climate Change (IPCC) fifth assessment report [7], a further increase in the risks of extreme weather events (heavy rains, extreme temperatures, heat waves) is likely worldwide throughout the 21st century, as a result of climate change. Hence, even though [8] shows that natural disasters have always existed and are a common and recurring phenomenon in the history of mankind, these disasters will likely become more intense and more frequent in the world in the current context of climate change [9]. Moreover, West Africa is considered as one of the most vulnerable regions to climate change and is affected by changes in extreme events [7,10,11,12].
The changes in precipitation extremes have been investigated in many regions of the world [9,11]. However, in the West African region only a few studies, mostly available as part of global studies [12,13] or at very localized levels [10,14,15], have assessed trends in extreme rainfall. Among the reasons that could explain this deficit, the limited access to data seems to be one of the most important. Moreover, there are difficulties related to the evidence of the changes in the climatology of extreme rainfall across West Africa where heavy rainfall is highly variable both in space and time [11]. Furthermore, the general requirement allowing for the collection of a sufficiently large number of long-term rainfall time series, for detecting meaningful changes over the past decade, is especially difficult to meet in West Africa. This is mainly due to the fact that several difficulties emerge in accessing daily meteorological data [15]. These difficulties related to meteorological data may range from “a limited capacity of meteorological services in getting observational datasets, and human and informatic resources” as mentioned in [16]. There is also a lack of continuous long series of data associated with deficiencies in the maintenance of infrastructures.
In West Africa, recent studies have shown that the Sahelian countries that are susceptible to droughts have experienced the most severe floods in recent years (e.g., 2007, 2008 and 2009), with losses estimated at several billions of dollars and hundreds of thousands of people displaced [17]. For example, during the 2009 flood event in Ouagadougou (Burkina Faso), a rainfall amount of 161 mm was recorded within just 6 hours. This was reported as totally extraordinary based on an observed 100-year time series [18]. In Niger, the heavy rains during August 2018 caused 22 deaths and nearly 50,000 victims in several regions of the country. Similarly, flood events in 2017 caused 56 deaths, nearly 20,000 victims, and a significant loss of production and livestock [19]. Prior to these flood events, 79 damaging rainfall events were reported between 1970 and 2000 in Niger [20] and it was highlighted that not only the intensity of a single heavy rainfall is relevant to trigger a flood but the cumulative rainfall of the preceding days also determines the probability of inundations. Paeth and Hense [21] examined the causes of the 2007 flood in the northern parts of sub-Saharan Africa that affected more than 1.5 million people. During this particular year, many countries in West Africa experienced the most intense rainfall in several decades. In the upper Volta basin, 3-day accumulated precipitation amounts with return periods of more than 1000 years occurred [18]. Over the Guinea Coast, deadly floods mainly due to heavy rainfall (~50 and 100 mm) [21,22] have also become recurrent since the 2000s [22,23]. In Côte d’Ivoire, for instance, an average of 10 human deaths have been reported every year since 2009 as a consequence of flood events [24].
The region has experienced severe damages due to heavy rainfall events and its associated floods as mentioned in [25] in an analysis of historical and current extreme rainfall events. They reported that, from 1998 to 2016, there were recurrent flood events with damaging impacts to infrastructure and the resident populations of major cities along the coastal areas of the Gulf of Guinea. The number of flood events recorded include 23 in Nigeria, 9 in Benin, 5 in Togo, 11 in Ghana, 4 in Côte d’Ivoire, 3 in Liberia, and 5 in Sierra Leone. Panthou et al. [12] showed that there has been an increase in the contribution of extreme rainfall to the annual total rainfall amount over the Sahelian region in the last two decades, with an augmentation of the mean intensity of the rainy days associated with a higher frequency of heavy rainfall [26,27] has explained these new rainfall conditions will most likely be sustained by global warming thus, reshaping our understanding of food insecurity in this region. On the other hand, [10] found that the number of extreme storms has increased during the last 30 years over the whole region. In contrast to previous studies, [28] has showed that the question of recovery and regime change is not only observed during the Sahelian rainy season (July–September), but also evident for the coastal phases (April–May; major rainy season across the Gulf of Guinea), and (October–November; little rainy season across the Gulf of Guinea) of the West African monsoon. These analyses suggest that a full rainfall recovery from the droughts of the 1970s and 1980s has yet to occur. Thus, a major change in the rainfall regime occurred around 1968 and since then large-scale teleconnections have also changed markedly.
Previous studies like [17,18,19,20,21,22,23,24,25,26,27,28,29], documented the changes in rainfall variability and distribution at regional level. However, none of them has investigated the changes in extreme climate indices in individual countries, which is the scale where decisions are taken. Moreover, most of the existing works used global or regional climate models with coarse horizontal resolutions thus, not permitting detailed analysis as discussed in [25]. Regional study on trends in precipitation extremes using Climate Hazards Group InfraRed Precipitation with Station (CHIRPS) has been performed in [25] and [30] but it was focused on West African subregions (Western Sahel, Central Sahel and Guinea Coast region). Here, this study is a step beyond to better characterize those changes in precipitation extremes at national level in 5 countries representative of the West African Climate system. This study contributes to deliver climate information at country-level, which is more relevant for decision-making and policy makers.
In this work, the variability of six Expert Team on Climate Change Detection and Indices (ETCCDI) climate indices [31] are analyzed across five selected West African countries in line with the program AMMA-2050 (DFID/NERC), using the high-resolution CHIRPS [32] observational dataset. In addition to [30], this work also considers an index for very heavy precipitation, and analyzes the evolution of the six ETCCDI indices at the decadal scale, as well as at the country level, which will provide information directly applicable at the country-scale. It is worth noting that satellite-based precipitation estimates rely on the interpretation of emitted or scattered radiation received by the satellite instruments and thus estimates, come with limitations regarding the retrieval of extreme precipitation. In particular, they are usually found to overestimate light rains and underestimate high intensity precipitation (e.g., [14,33,34], and therein). Despite these limitations, the finer resolution of the CHIRPS dataset can be an advantage to better investigate changes in rainfall variability and distribution especially in the extremes [29]. This is all the more important in a region with a deficient ground network and a lack of gridded observational dataset.
Section 2 describes the data and methodology while Section 3 investigates the temporal evolution of these six indices over Senegal, Niger, Burkina Faso, Côte d’Ivoire, and Benin since 1981. Section 4 and Section 5, respectively, discuss and concludes the study.

2. Materials and Methods

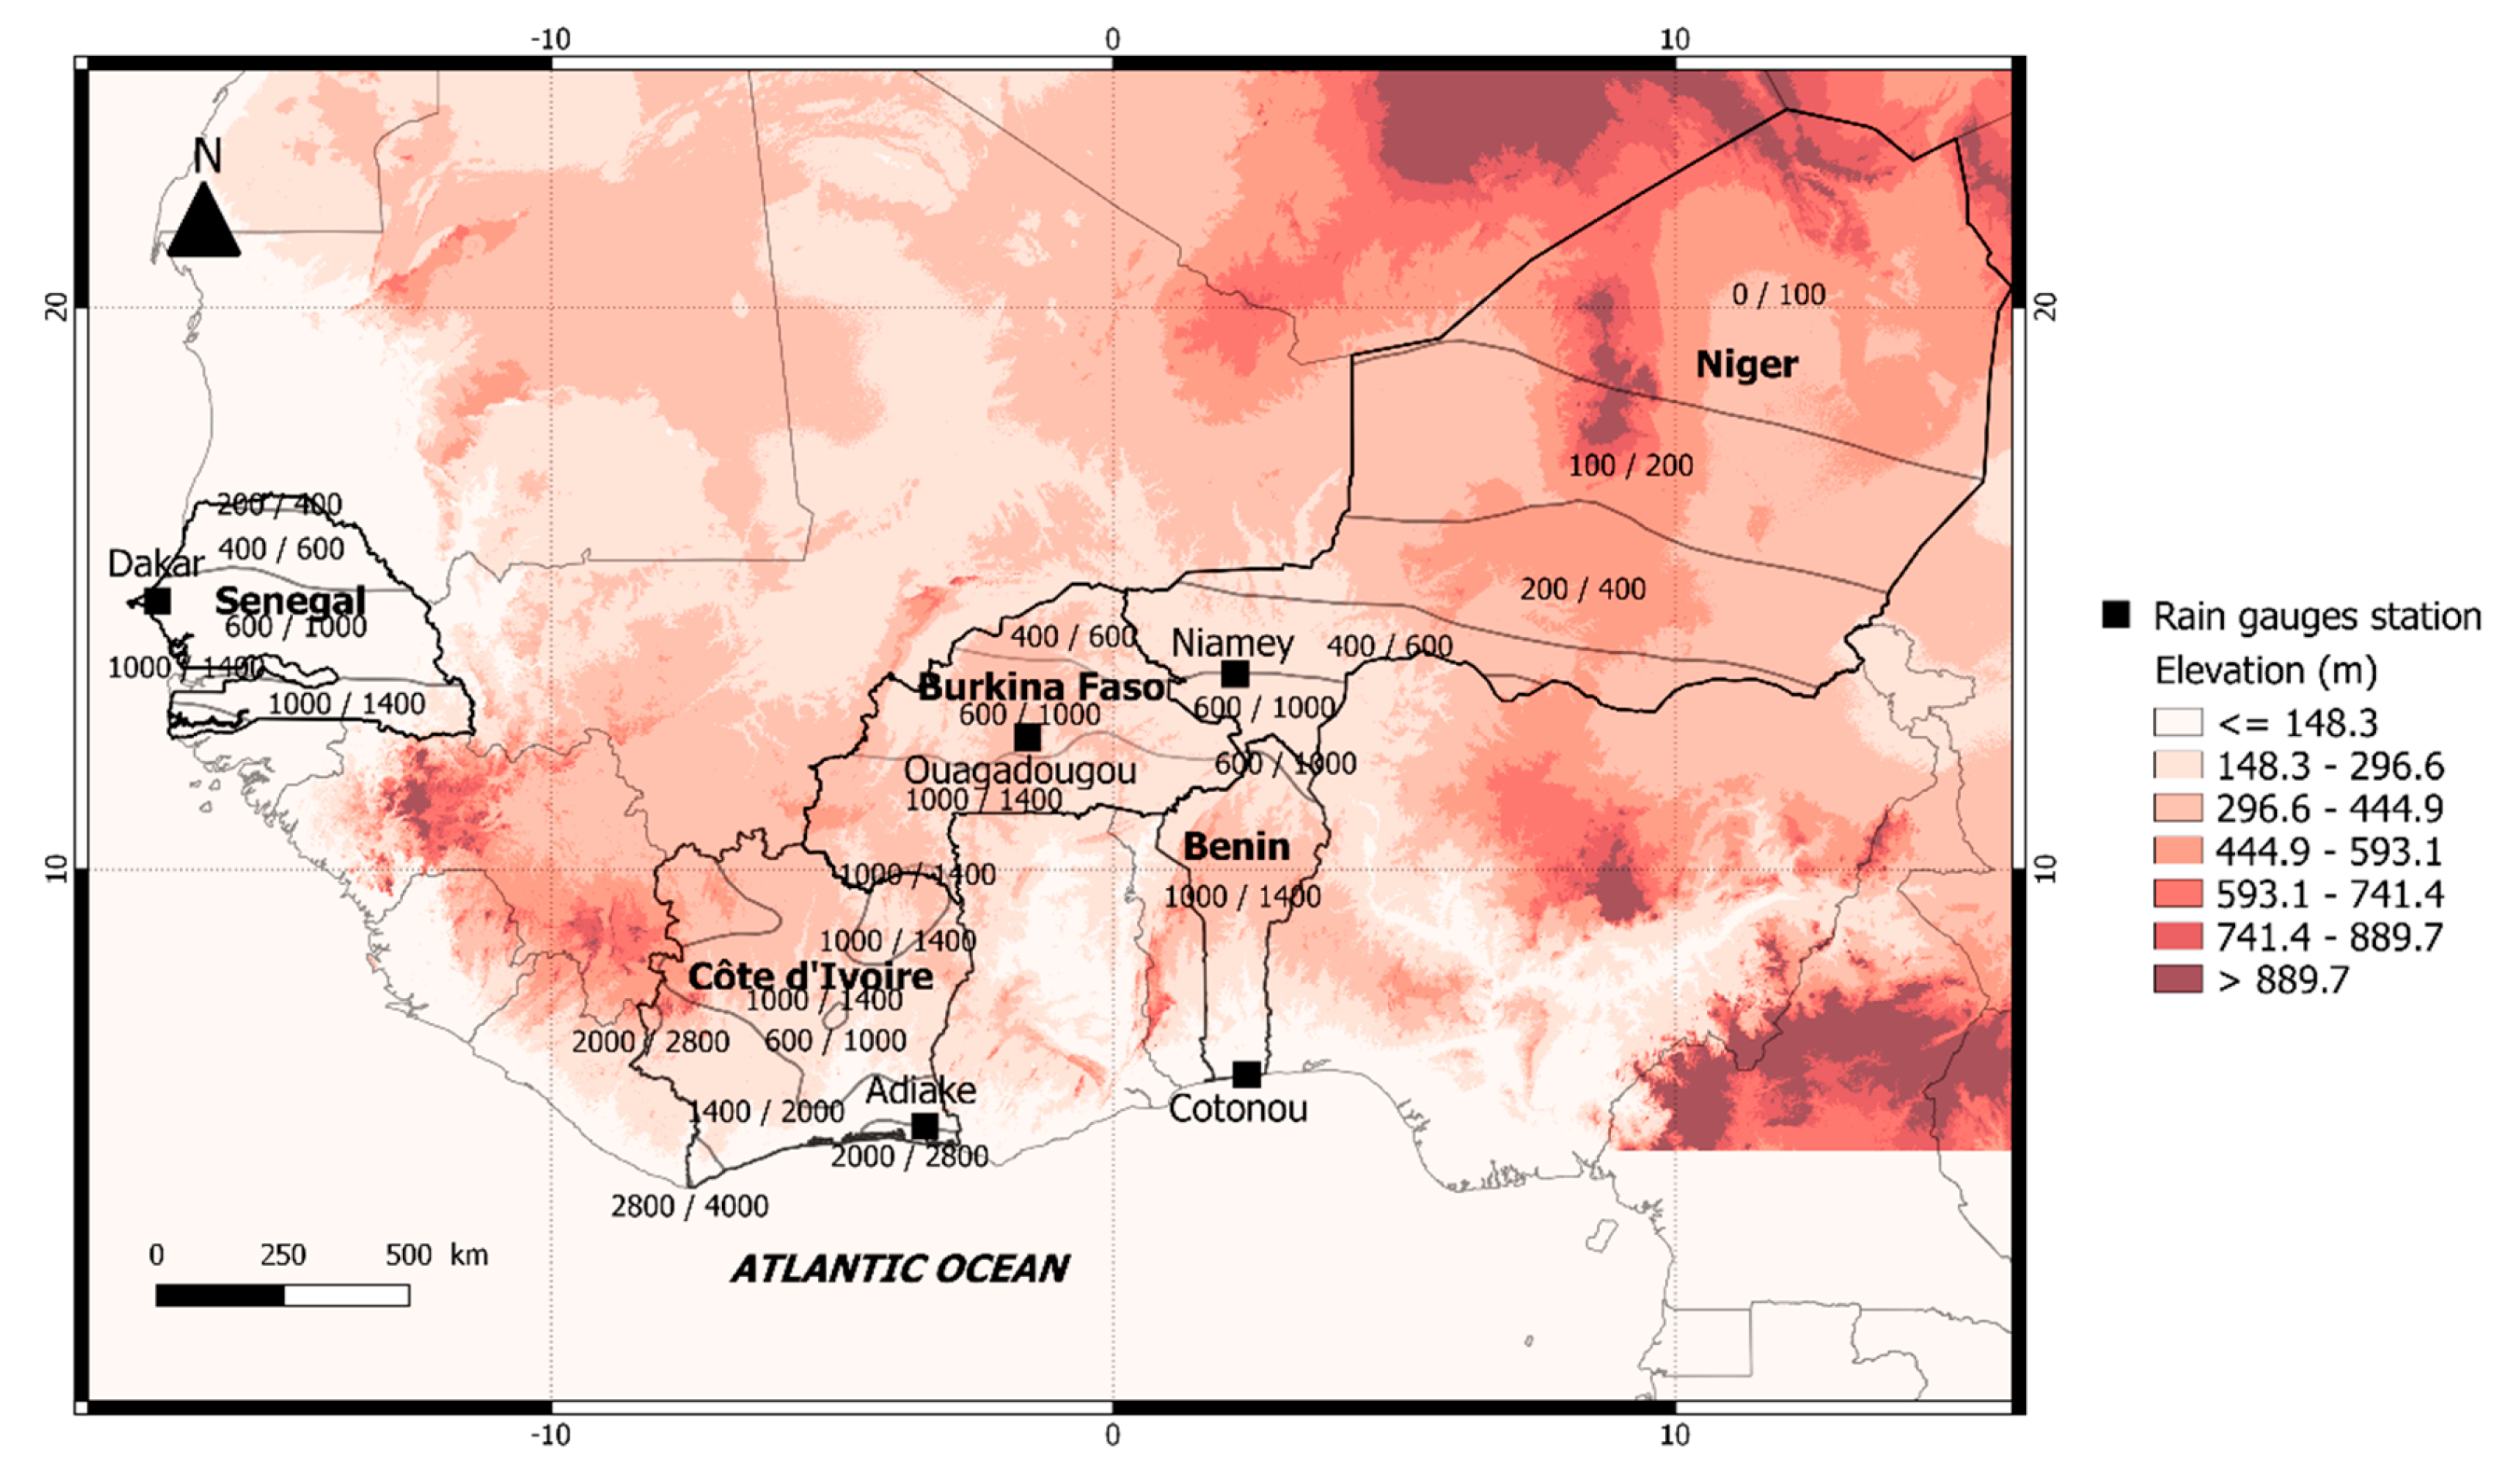
2.1. Study Area Description

The study was conducted over 5 countries located within West Africa [35,36] (Figure 1): Senegal and Niger (Western and Central Sahel respectively), Burkina Faso (the transitional zone between the Sahel and the Guinea Coast), and Côte d’Ivoire and Benin (Guinea Coast). West Africa has several climatic and ecological zones thus, facing a multitude of issues in terms of adaptation and mitigation to climate change [37]. These regions have different landscapes and surface conditions. The Sahel (Western and Central Sahel) consists of arid and semi-arid areas with savanna and trees while forests cover the Guinea Coast with complex interactions with the West African monsoon (e.g., [30]). Due to substantial differences in their location relative to the tropical Atlantic and to the Hadley Cells, those regions are characterized by very diverse hydro-meteorological regimes. The mean annual precipitation in these regions is 575 mm in Western Sahel, 450 mm in Central Sahel, and 1250 mm in Guinea Coast [38,39]. Additionally, the seasonality of precipitation is different depending on the region, with two rainy seasons over the Guinea Coast, and only one over the Sahel (western and central Sahel) [40]. The spatial mean rainfall annual mean of each country is presented in Figure 1.

2.2. CHIRPS Dataset

Due to the lack of ground-based observation data as discussed previously, satellite rainfall estimates have been used as an alternative to or to supplement in-situ observations [36,37,38,39,40,41]. Because many satellite-based rainfall products with long-time series have coarse spatial and temporal resolutions and are not homogeneous, the rainfall data from the Climate Hazards Group Infrared Precipitation with Stations (CHIRPS) version 2 developed by the Climate Hazards Group of University of California was used. The CHIRPS dataset is a quasi-global rainfall dataset covering 50° S to 50° N and spanning from 1981 to near present. It incorporates 0.05° × 0.05° resolution satellite imagery with in situ station data to create gridded rainfall time series suitable for trend analysis and seasonal drought monitoring. It is originally computed in a pentad (5 days), and all other time steps are either aggregated (decadal and monthly) or disaggregated (daily). It can be freely accessed at http://chg.geog.ucsb.edu/data/chirps/. According to previous studies by [29,42,43], the West African mean precipitation from the CHIRPS dataset shows a similar performance to the commonly used satellite products CMORPH, TMPA, PERSIANN, and TRMM at the decadal, monthly, and seasonal time scales. The authors of [25,30] noticed a satisfactory replication of the seasonal trends (1981–2015) of the mean precipitation, the number of wet days, precipitation intensity, and average dry spell length analysis, from the CHIRPS dataset against 18 daily rain gauge stations across the Sahel and the Guinea Coast. They further mentioned an exception along the Guinea Coast where, unlike the rain gauge stations, the CHIRPS dataset shows a tendency towards more (less) frequent and less (more) intense precipitation during both rainy seasons (during the first rainy season).

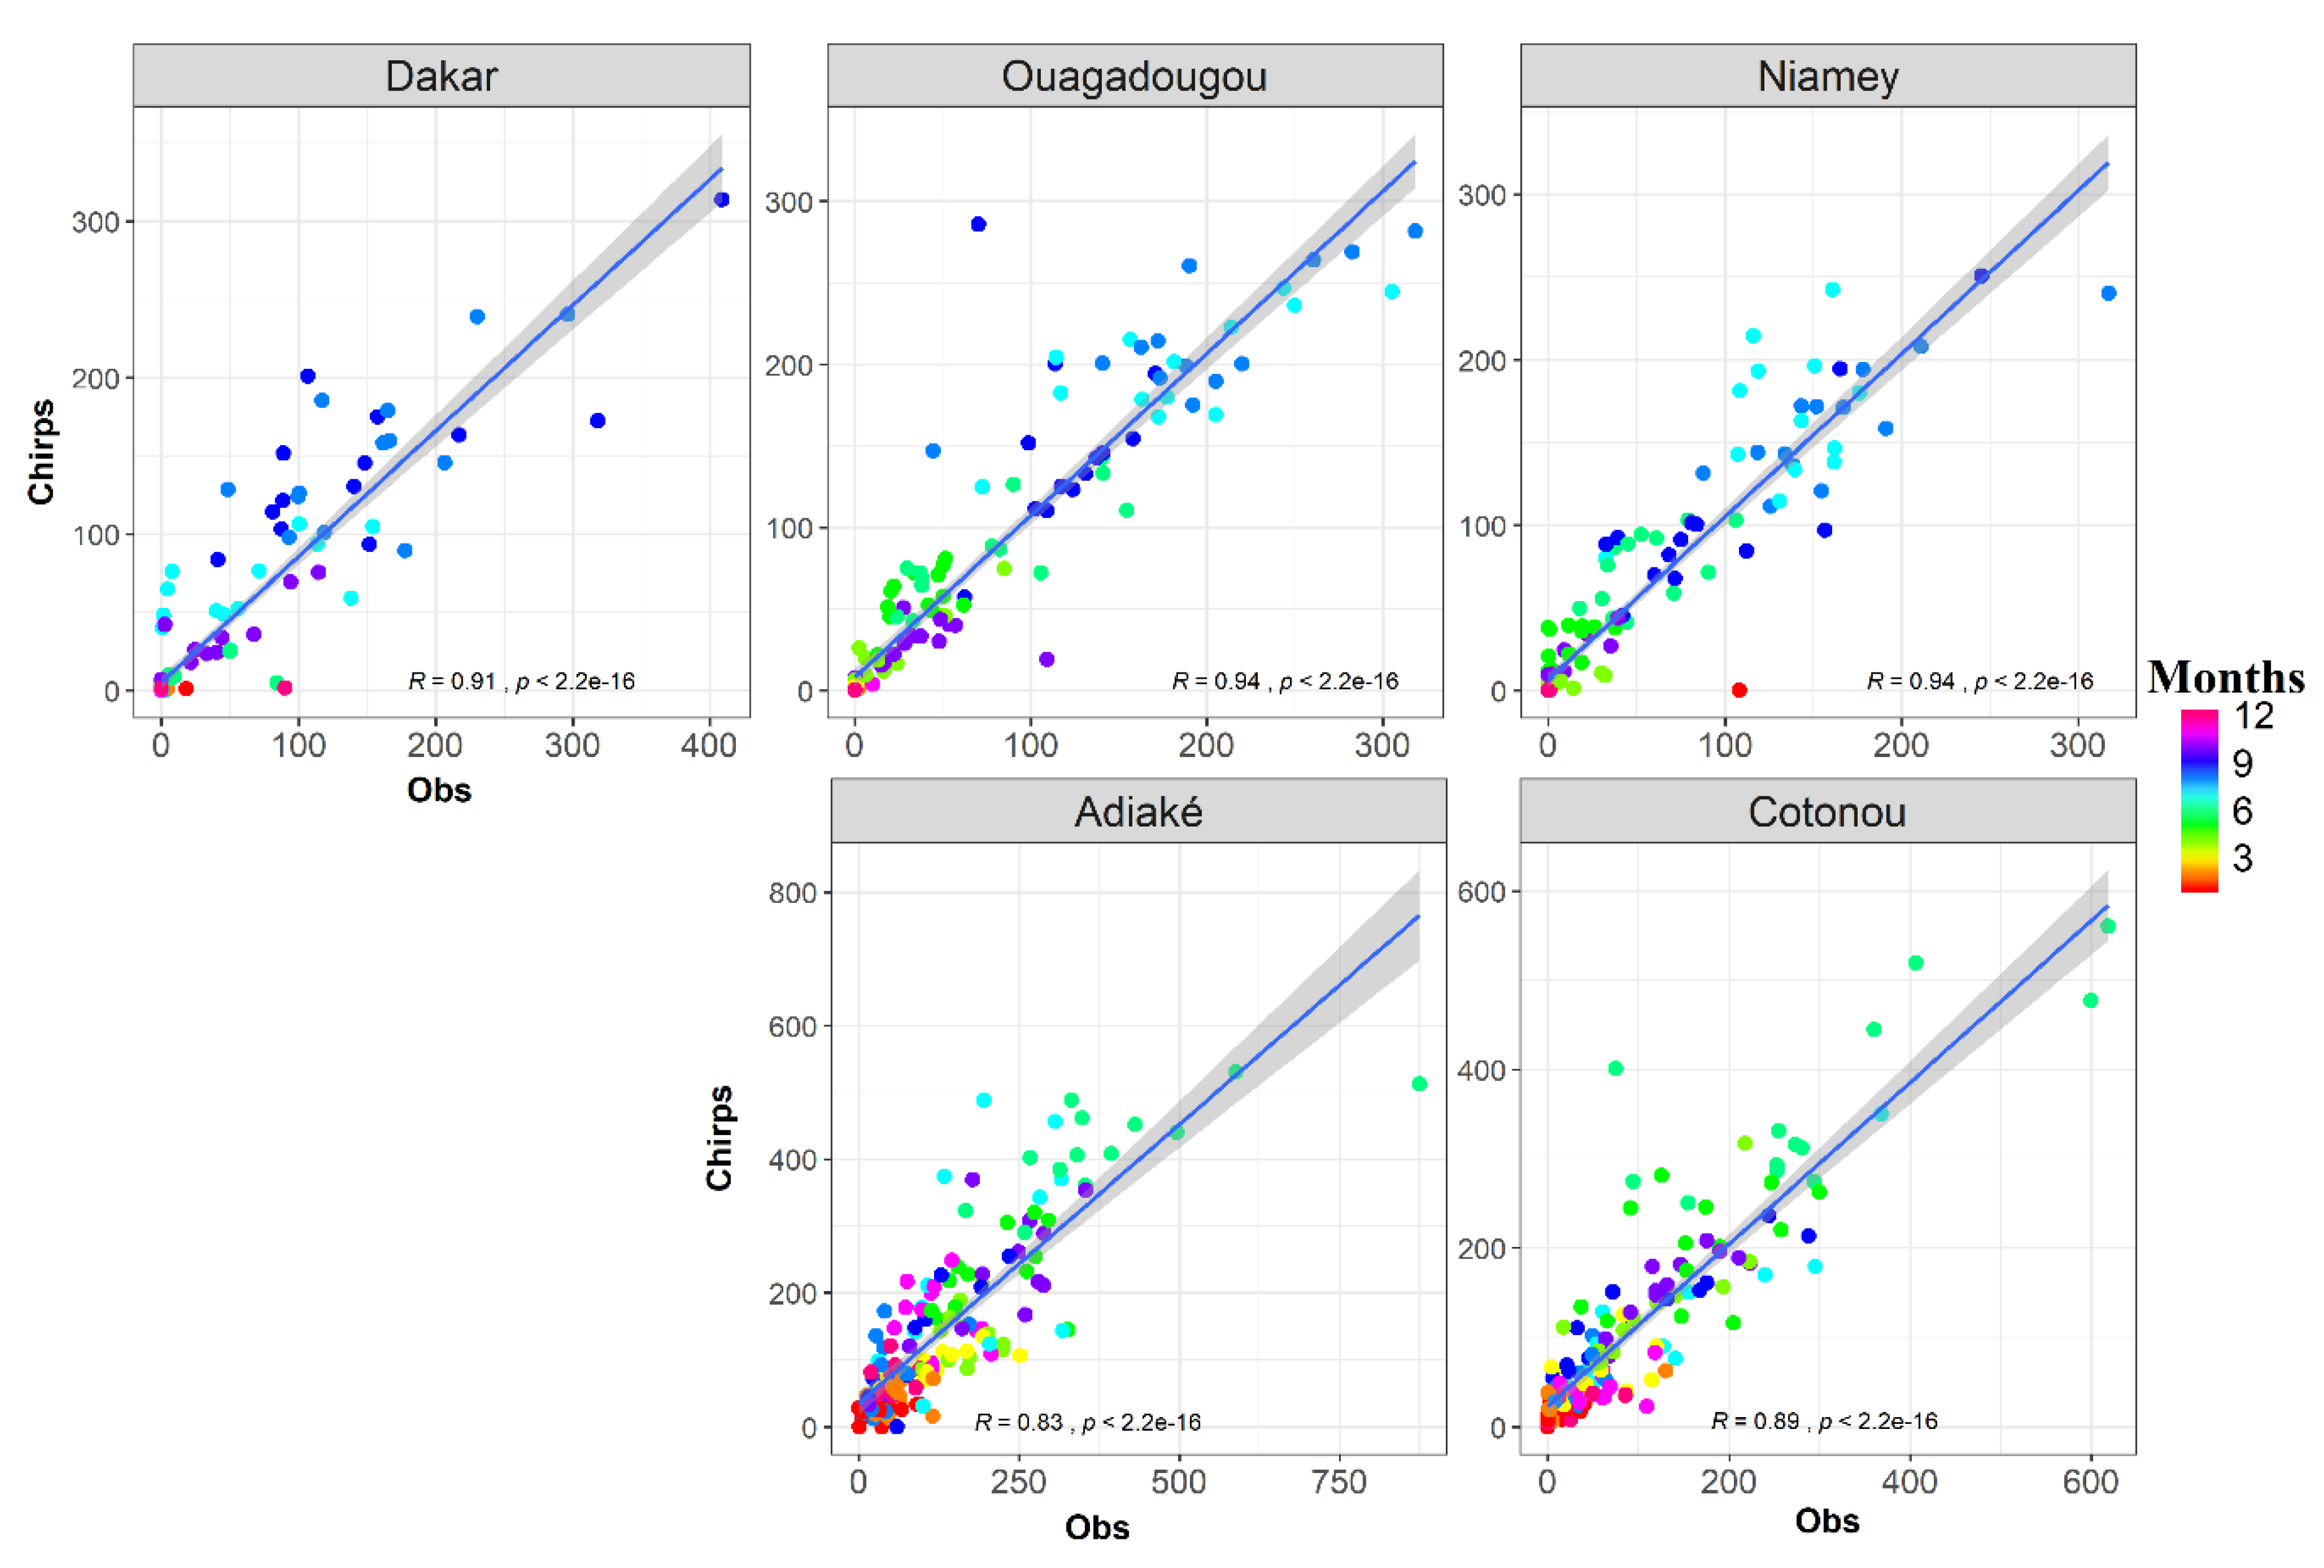
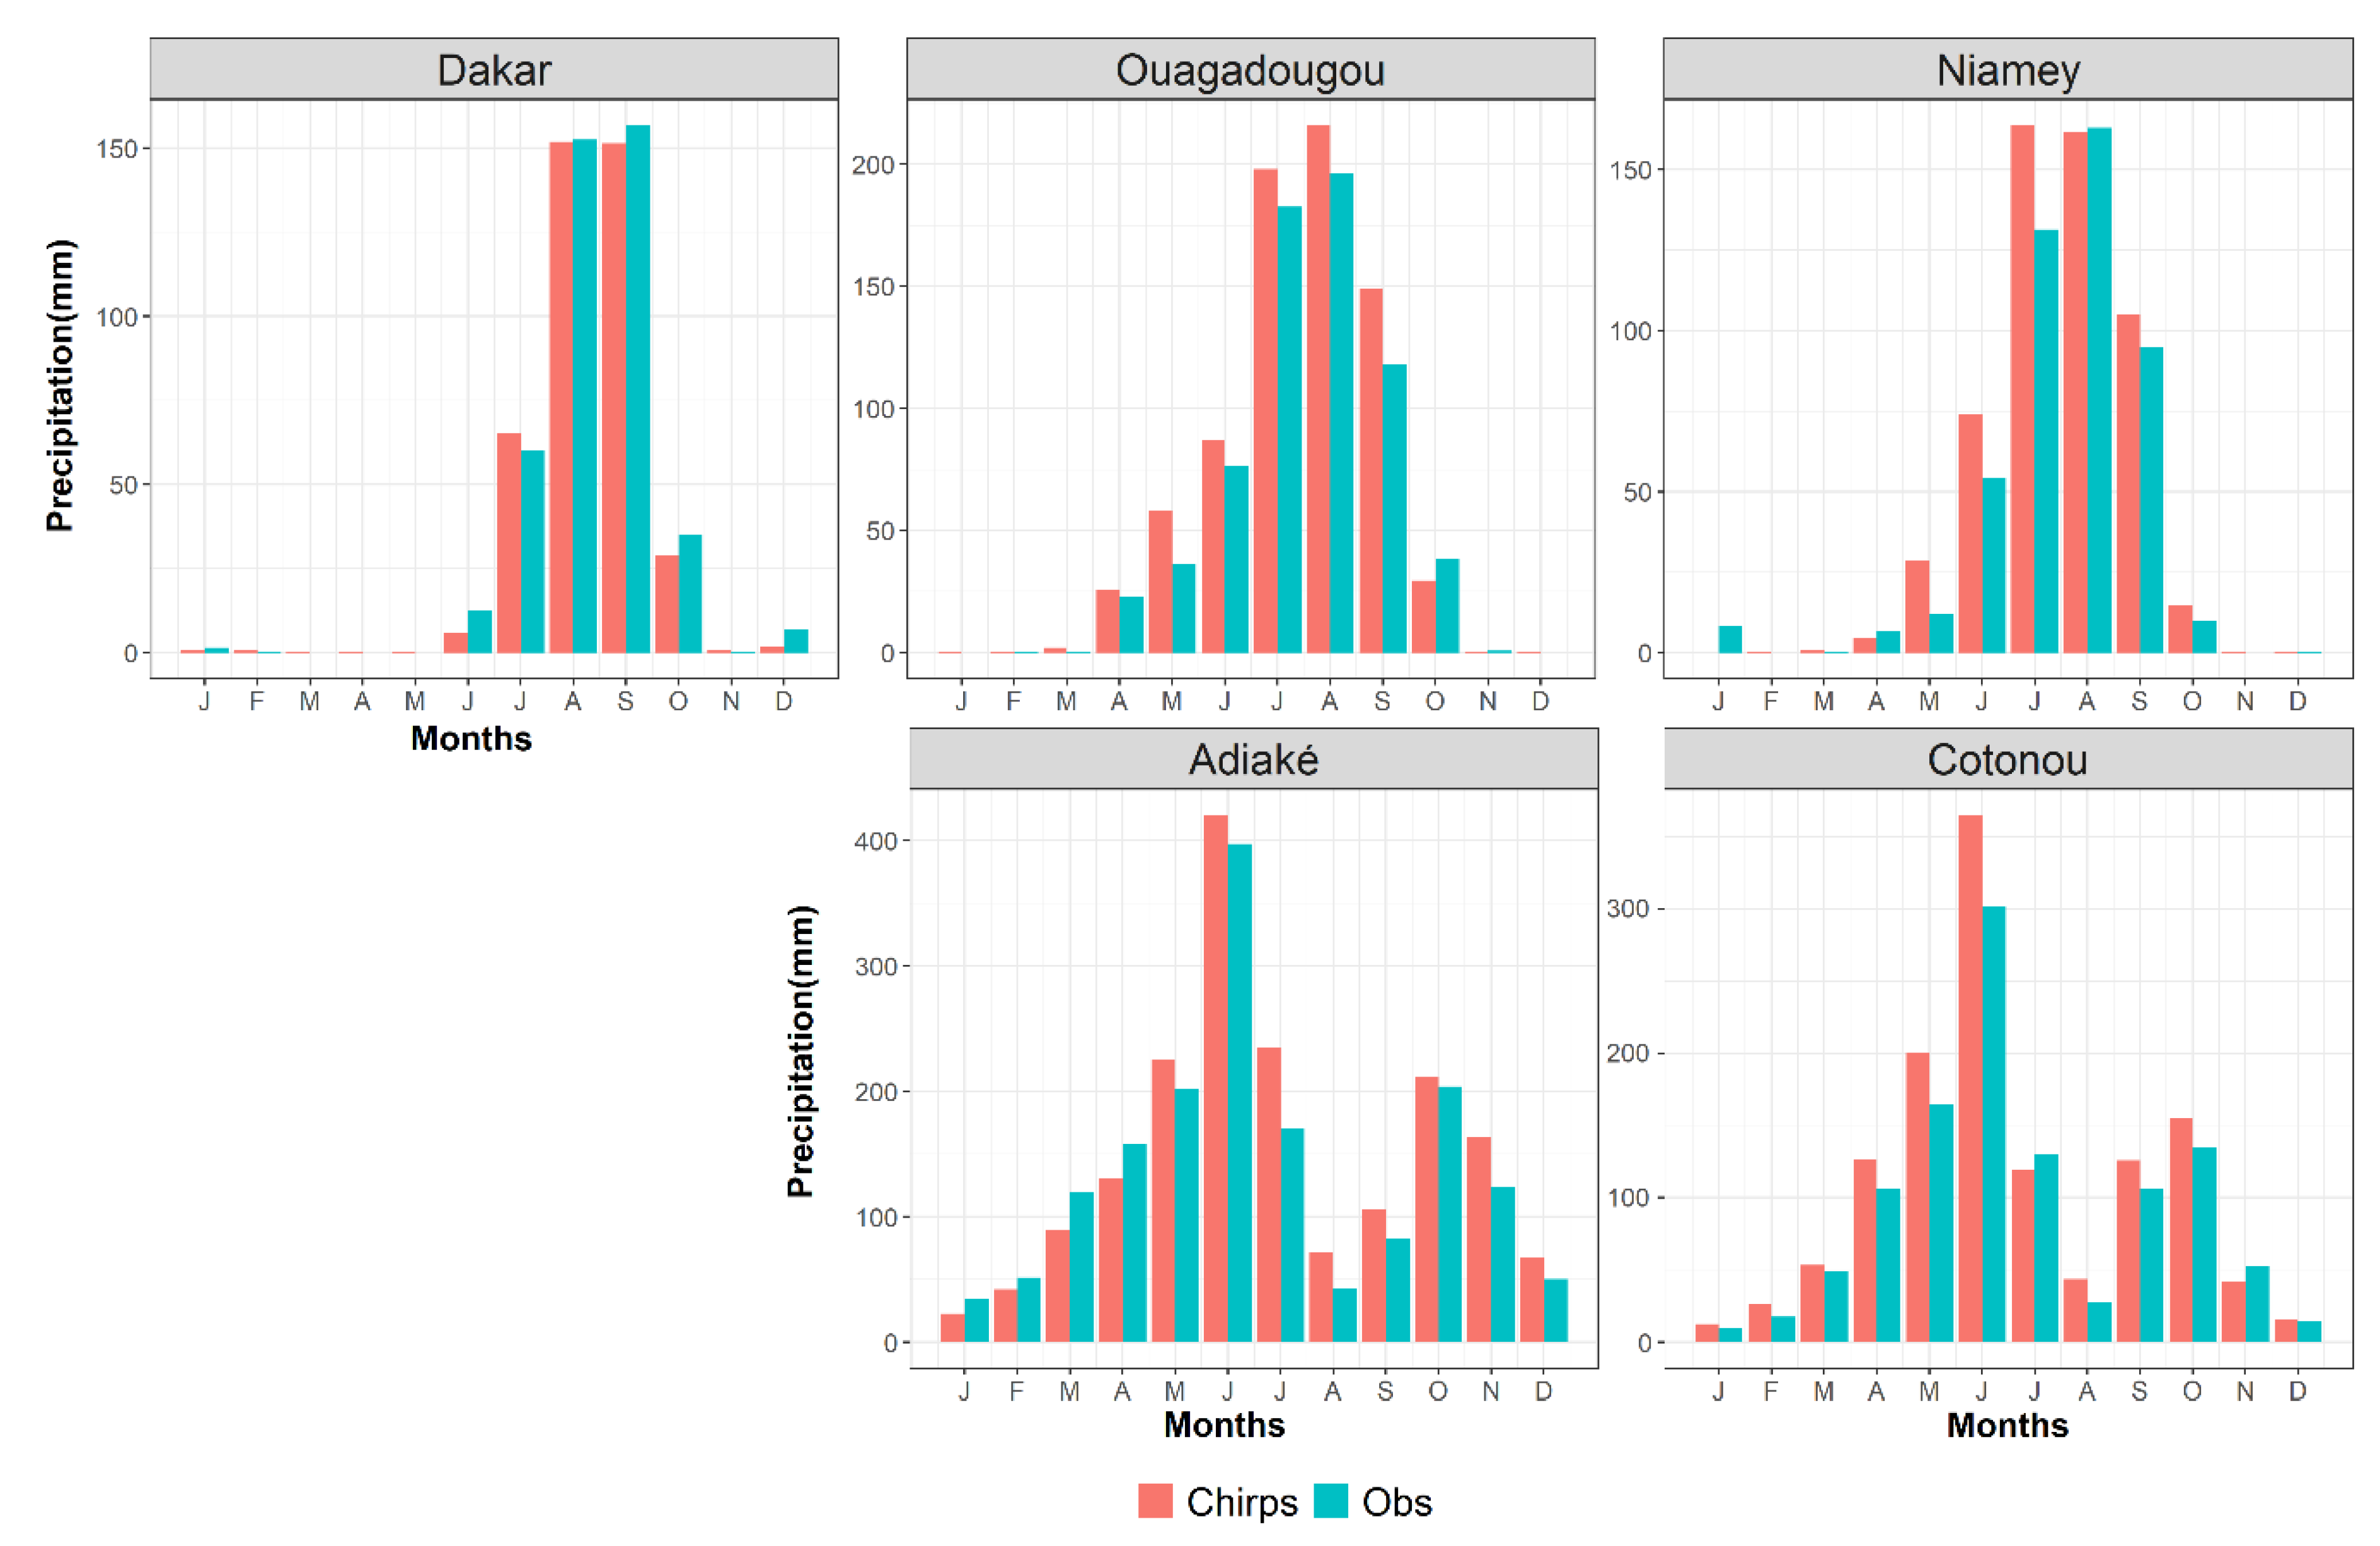
2.3. Comparison of the CHIRPS Dataset with Rain Gauges

In order to evaluate the performance of the CHIRPS data over West Africa, it has been compared with observed gauges dataset. Indeed, five near-surface daily rain gauge data were extracted from the updated BAse de DOnnées PLUviométriques (BADOPLU) database, described by Panthou et al. [44]. This was based on the availability of data over the period of interest (1998–2010). The consistency and the continuity of extracted observed data were assessed. Missing data from each station has not exceeded 15% over the considered period (Table 1). Stations with missing data occurring more than 7 consecutive days were not considered. The statistical distribution of monthly rainfall was evaluated in the BADOPLUS database from five cities (Dakar, Ouagadougou, Niamey, Adiaké and Cotonou, as seen in Figure 1) by comparing it to the CHIRPS dataset. The stations were selected based on the completeness of records and were chosen only if the complete daily records were available during the 1998 to 2010 period. The validation metric score computed for validation is the monthly mean rainfall over the considered period.
Figure 2 exhibits the correlation between the observed and CHIRPS dataset on a monthly timescale over the considered period (1998–2010). There is a good agreement between the two datasets at all the five considered stations. Over all five stations, the Pearson coefficient is greater than 0.8 (R ≥ 0.8) and all the correlations are statistically significant (p-value < 0.01). Over the five sites tested, the monthly means from the CHIRPS dataset does not correlate strongly with observations during the driest months (DJF) over Sahelian stations (Dakar, Ouagadougou and Niamey) and during the months of November and May in the coastal Guinean (Adiaké and Cotonou) zone.
Figure 3 shows the comparison of monthly mean precipitation over the 1998–2010 period between the CHIRPS dataset and rain gauge data extracted from the updated BADOPLUS database. In most of the stations, both datasets have a similar monthly mean amount except in the rainy season, during which CHIRPS overestimates precipitation for all the stations on average by 13.91 mm and at maximum by 28.38 mm. For instance, at the Dakar station, monthly mean precipitation from the CHIRPS dataset is in very good agreement with the observed data except in the month of July where CHIRPS overestimate the stations by 4.90 mm. Similarly, the CHIRPS dataset overestimates the mean precipitation on average by 16.83 mm from April to September at the Ouagadougou station and on average by 16.77 mm from May to October (except in August) at the Niamey station. Moreover, in Adiaké located in the in the Guinea zone, CHIRPS overestimate the precipitation on average by 28.38 mm from May to December. In contrast, the CHIRPS dataset overestimates the precipitations on average by 19.26 mm for all months except in July and December at the Cotonou station located in the Guinea zone. Hence, based on Figure 2 and Figure 3, we conclude that the CHIRPS-based precipitation data is good enough to be used for flood and drought monitoring in the study area.

2.4. Methodology

Following Caroletti et al. [45], the mean and the Pearson correlation coefficient were used as validation metrics to evaluate the CHIRPS dataset with in situ rain gauge data from 1998 to 2010 on a monthly time scale. Six climate indices (described in Section 2.4.2) based on Expert Team on Climate Change Detection and Indices (ETCCDI) definitions were then computed over each grid point and for each year. Two different types of analyses were mainly carried out:
(1)
The regional mean annual ETCCDI extreme climate indices over each country were computed and their trends over 1981–2015 were analyzed following the methodology of Section 2.4.1;
(2)
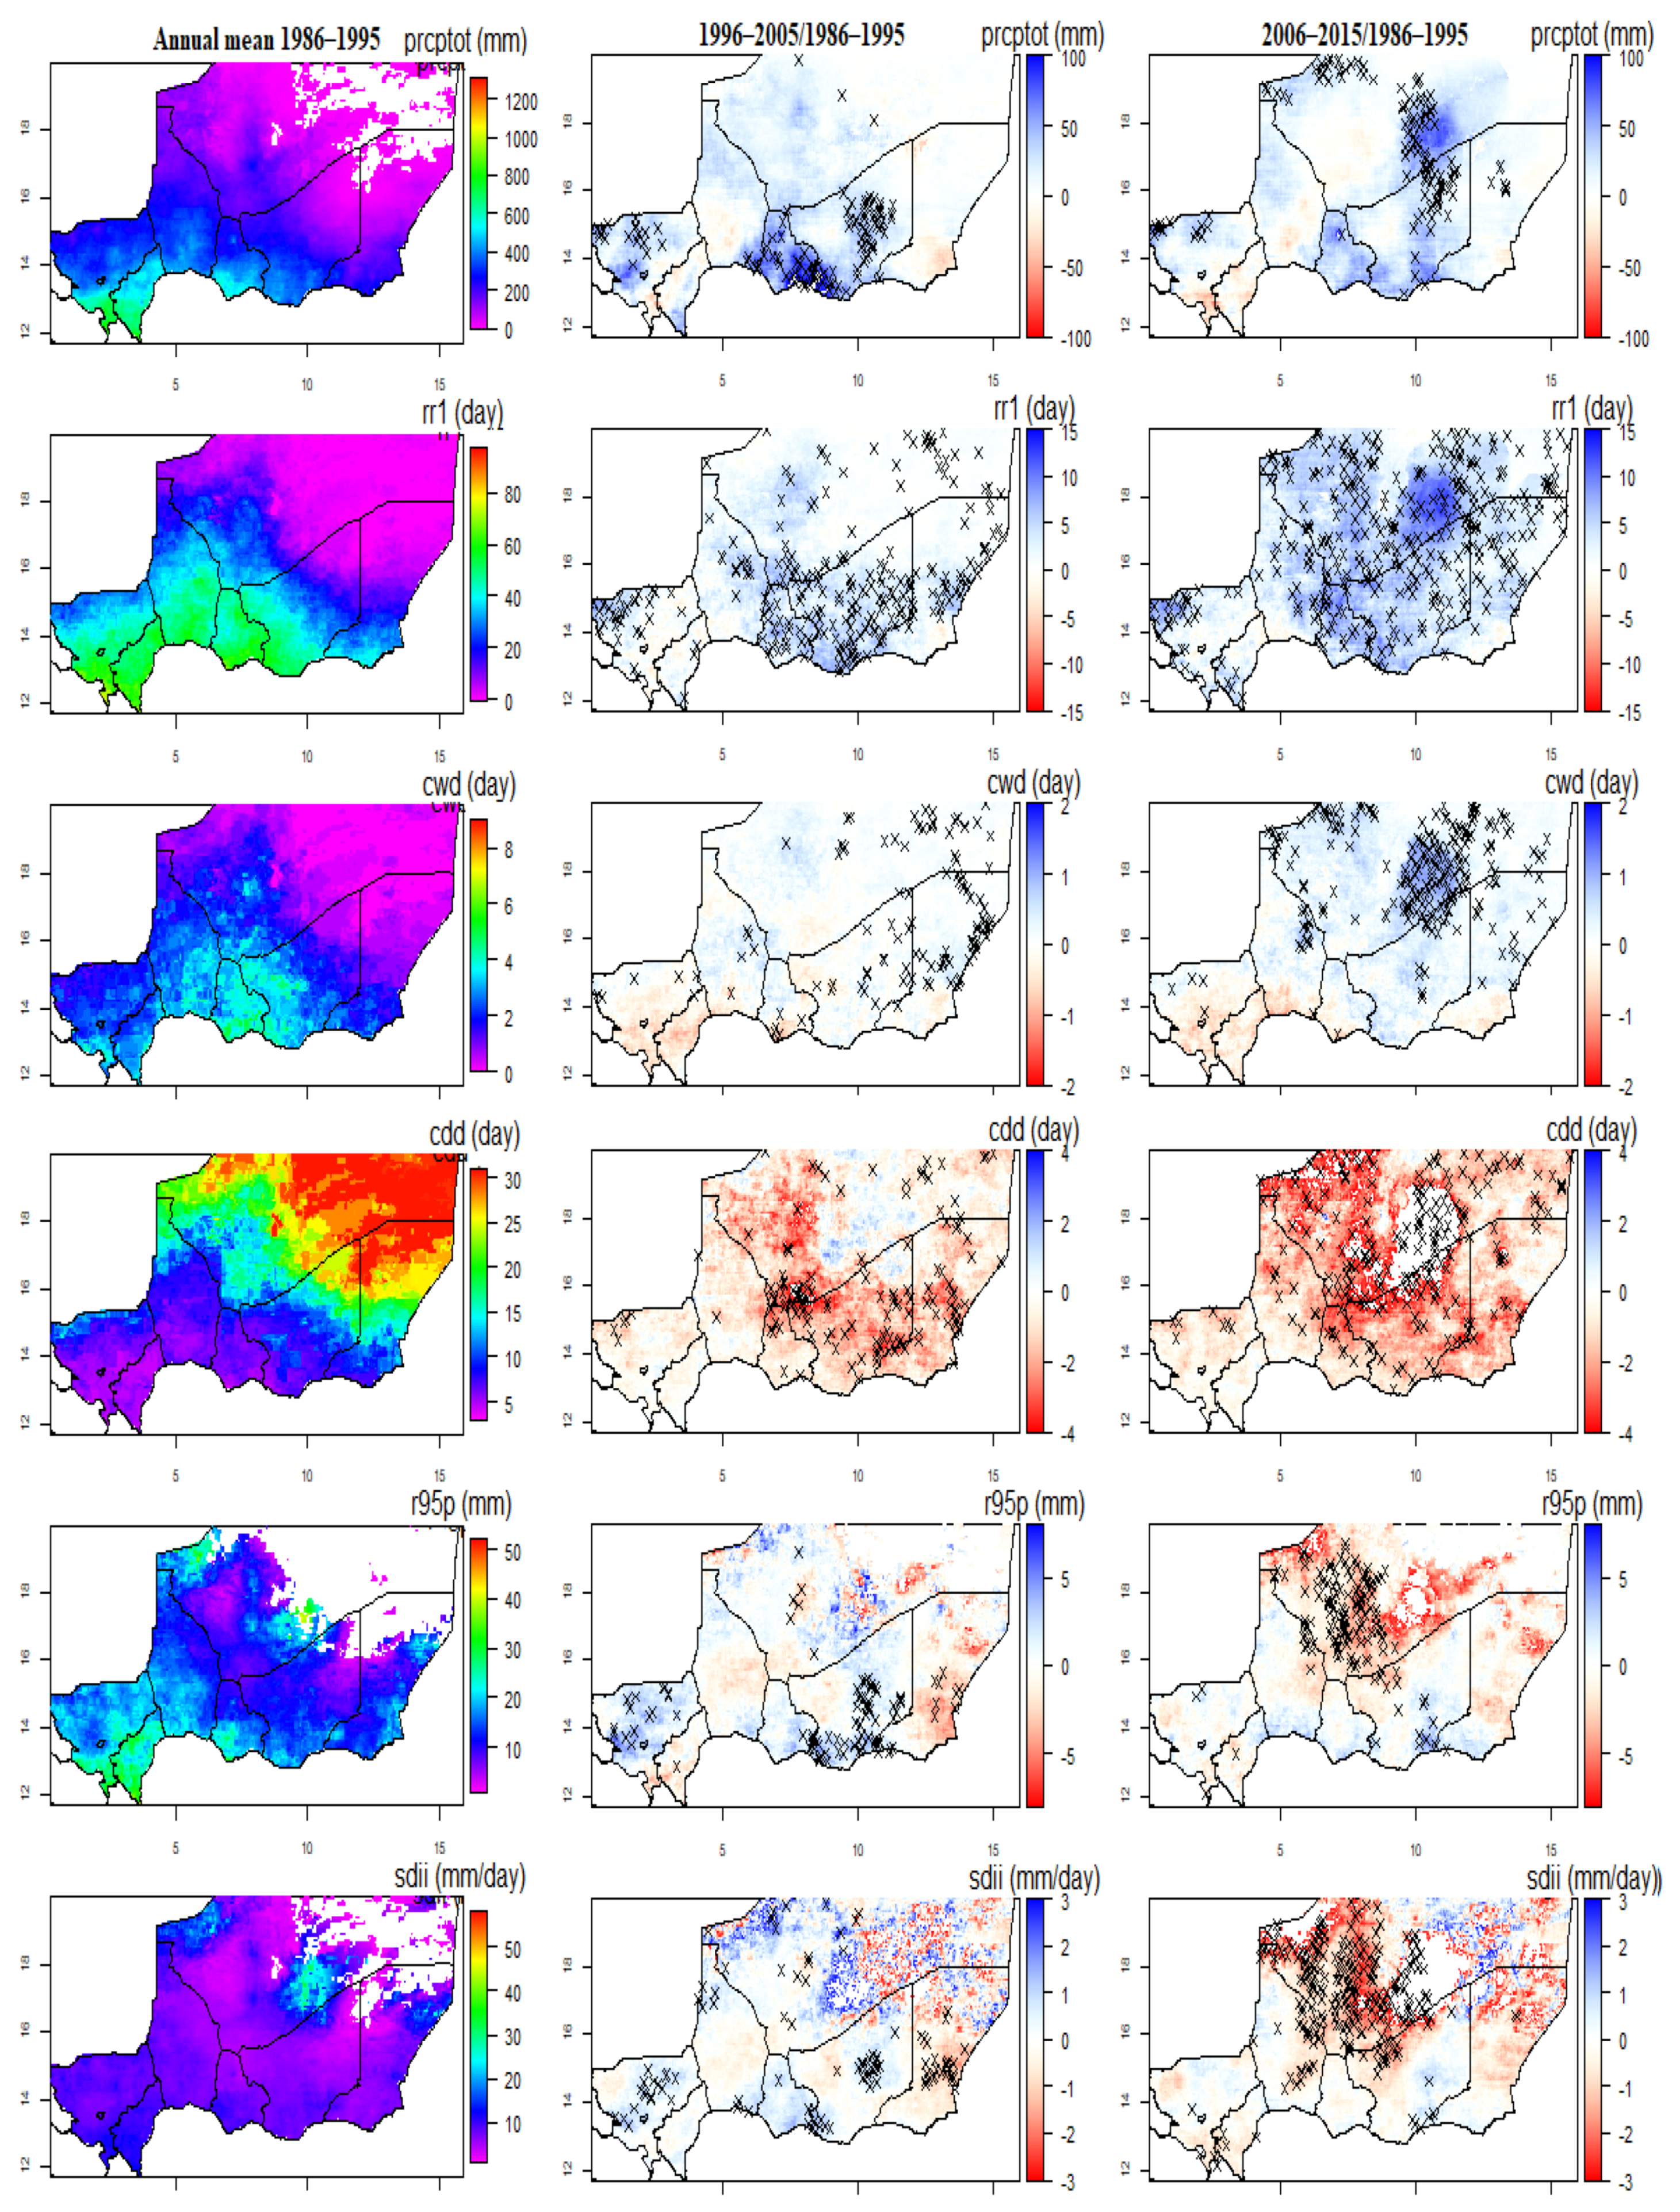
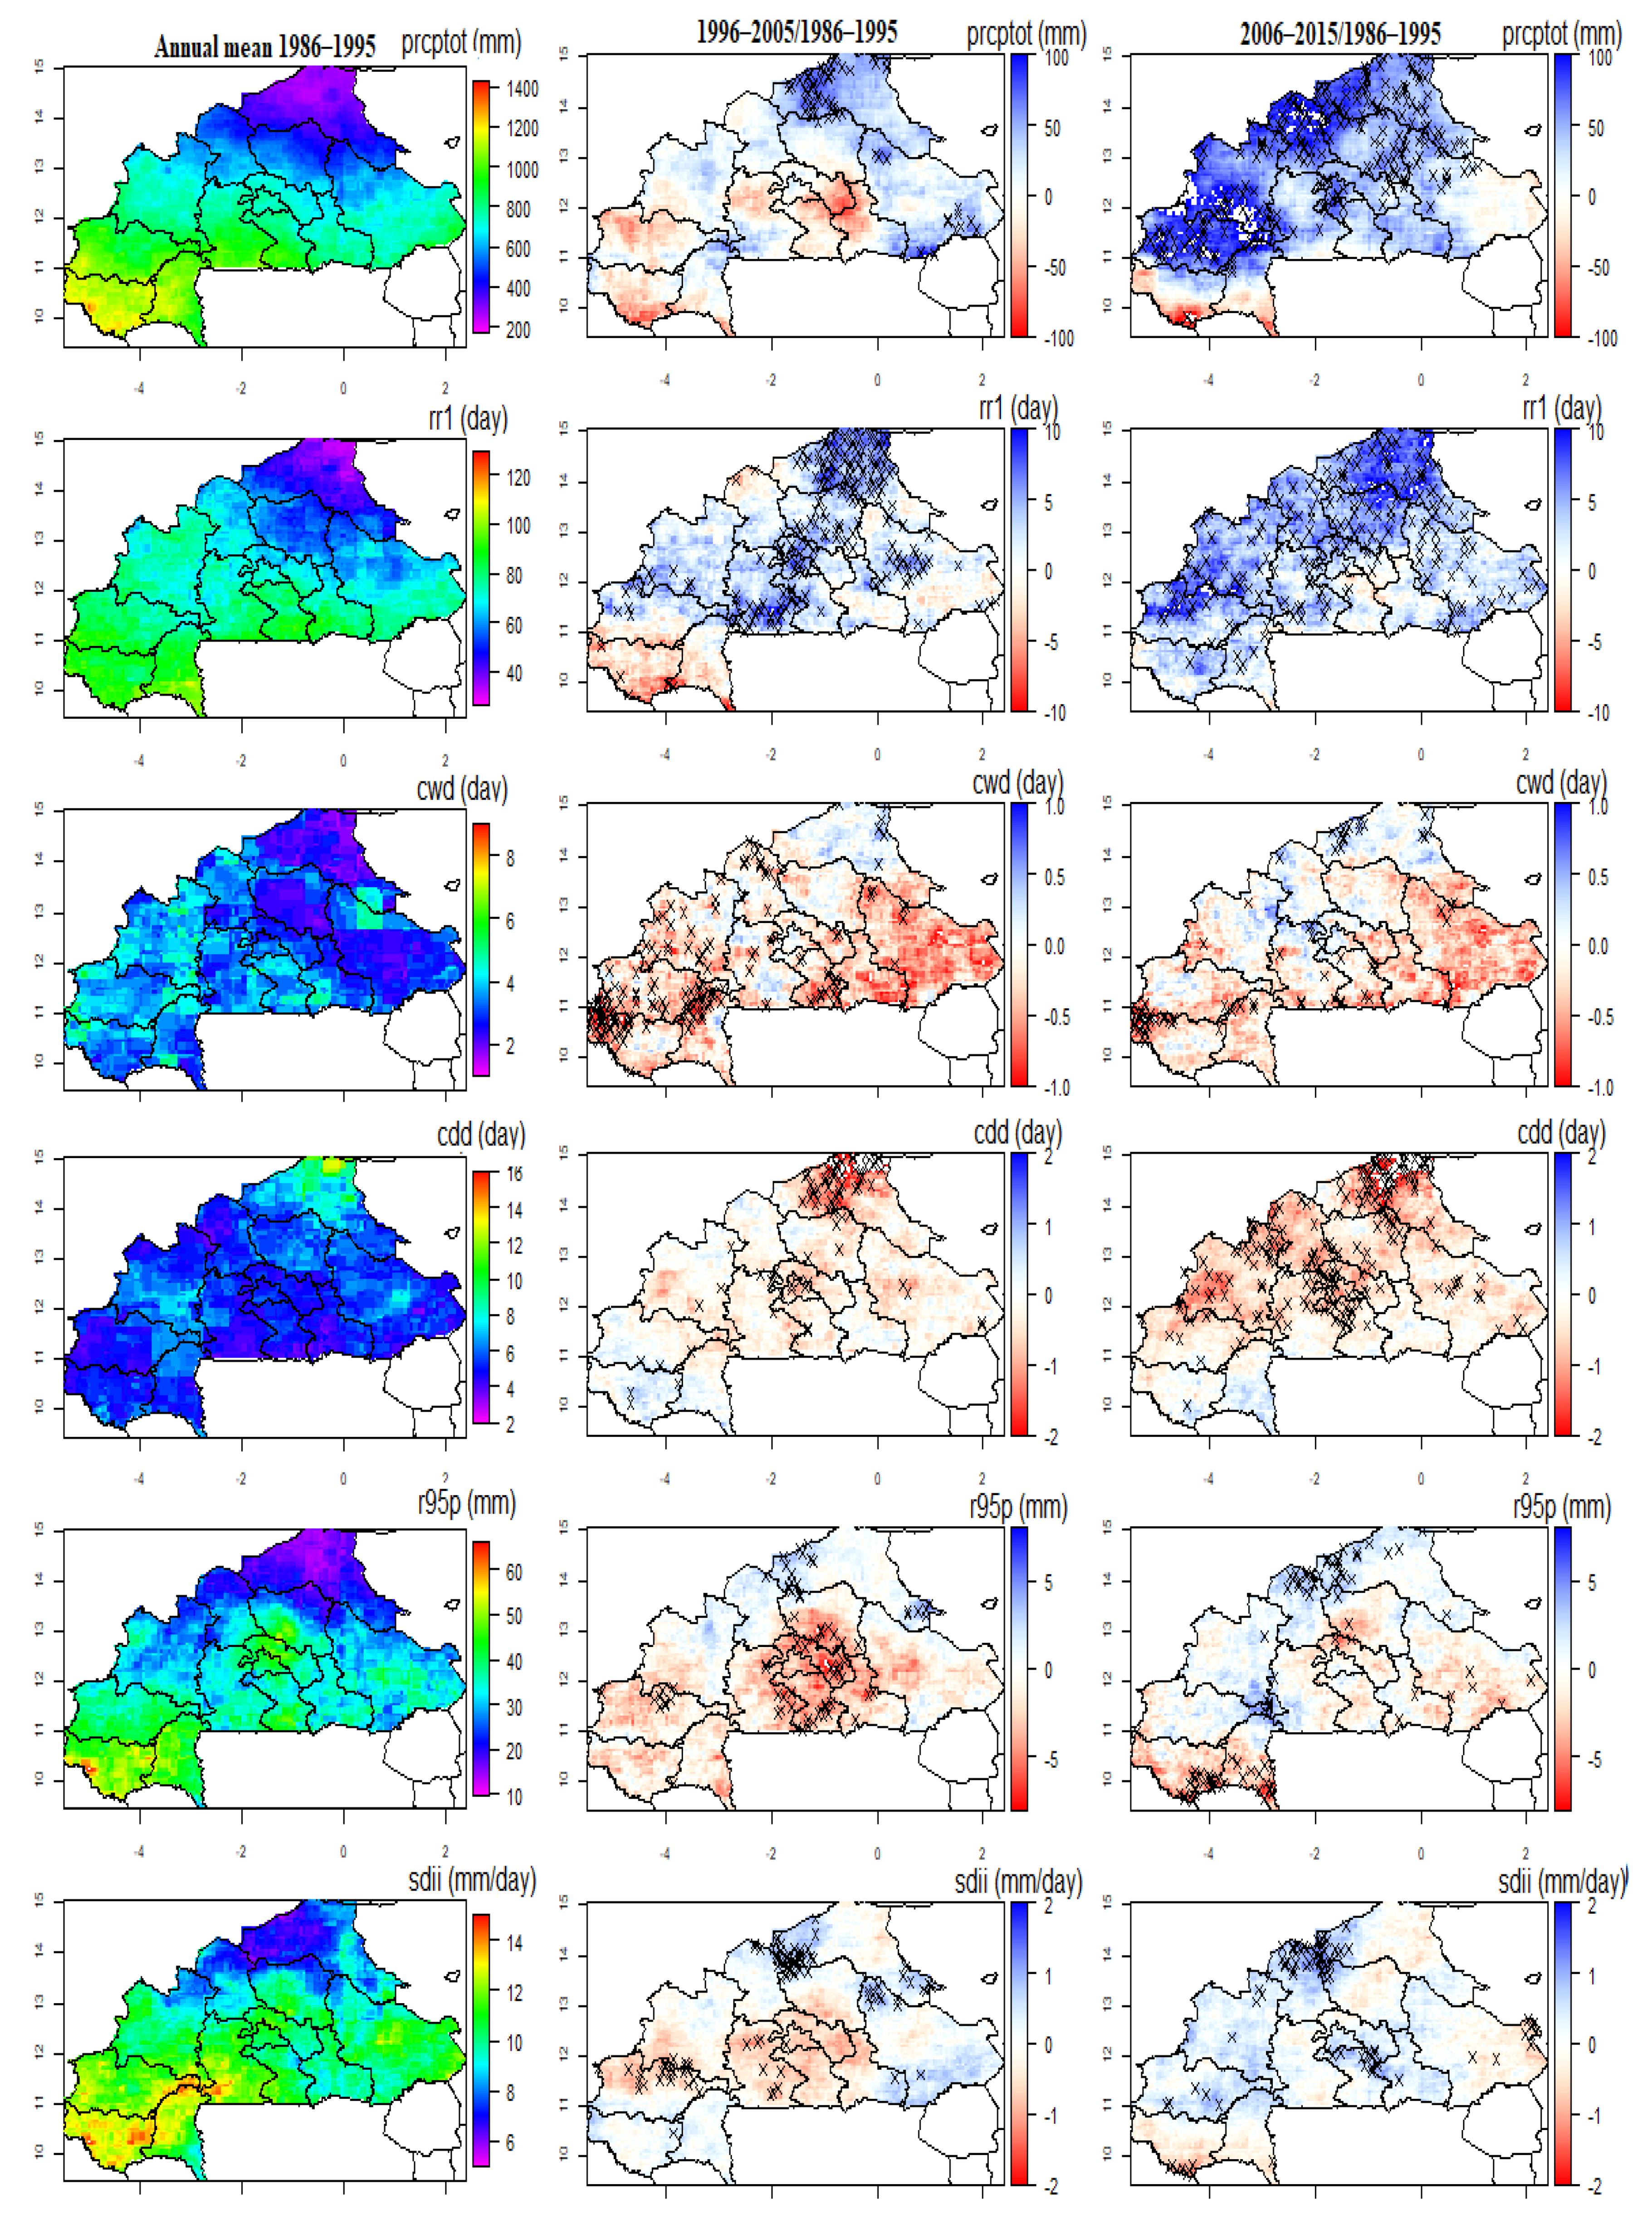
The inter-decadal change in the computed climates’ extreme indices were examined over the periods 1996–2005 and 2006–2015 relative to the 1986–1995 decade, and their significance was assessed at a 95% confidence level over each grid point based on the Mann–Kendall test (p value < 0.05).

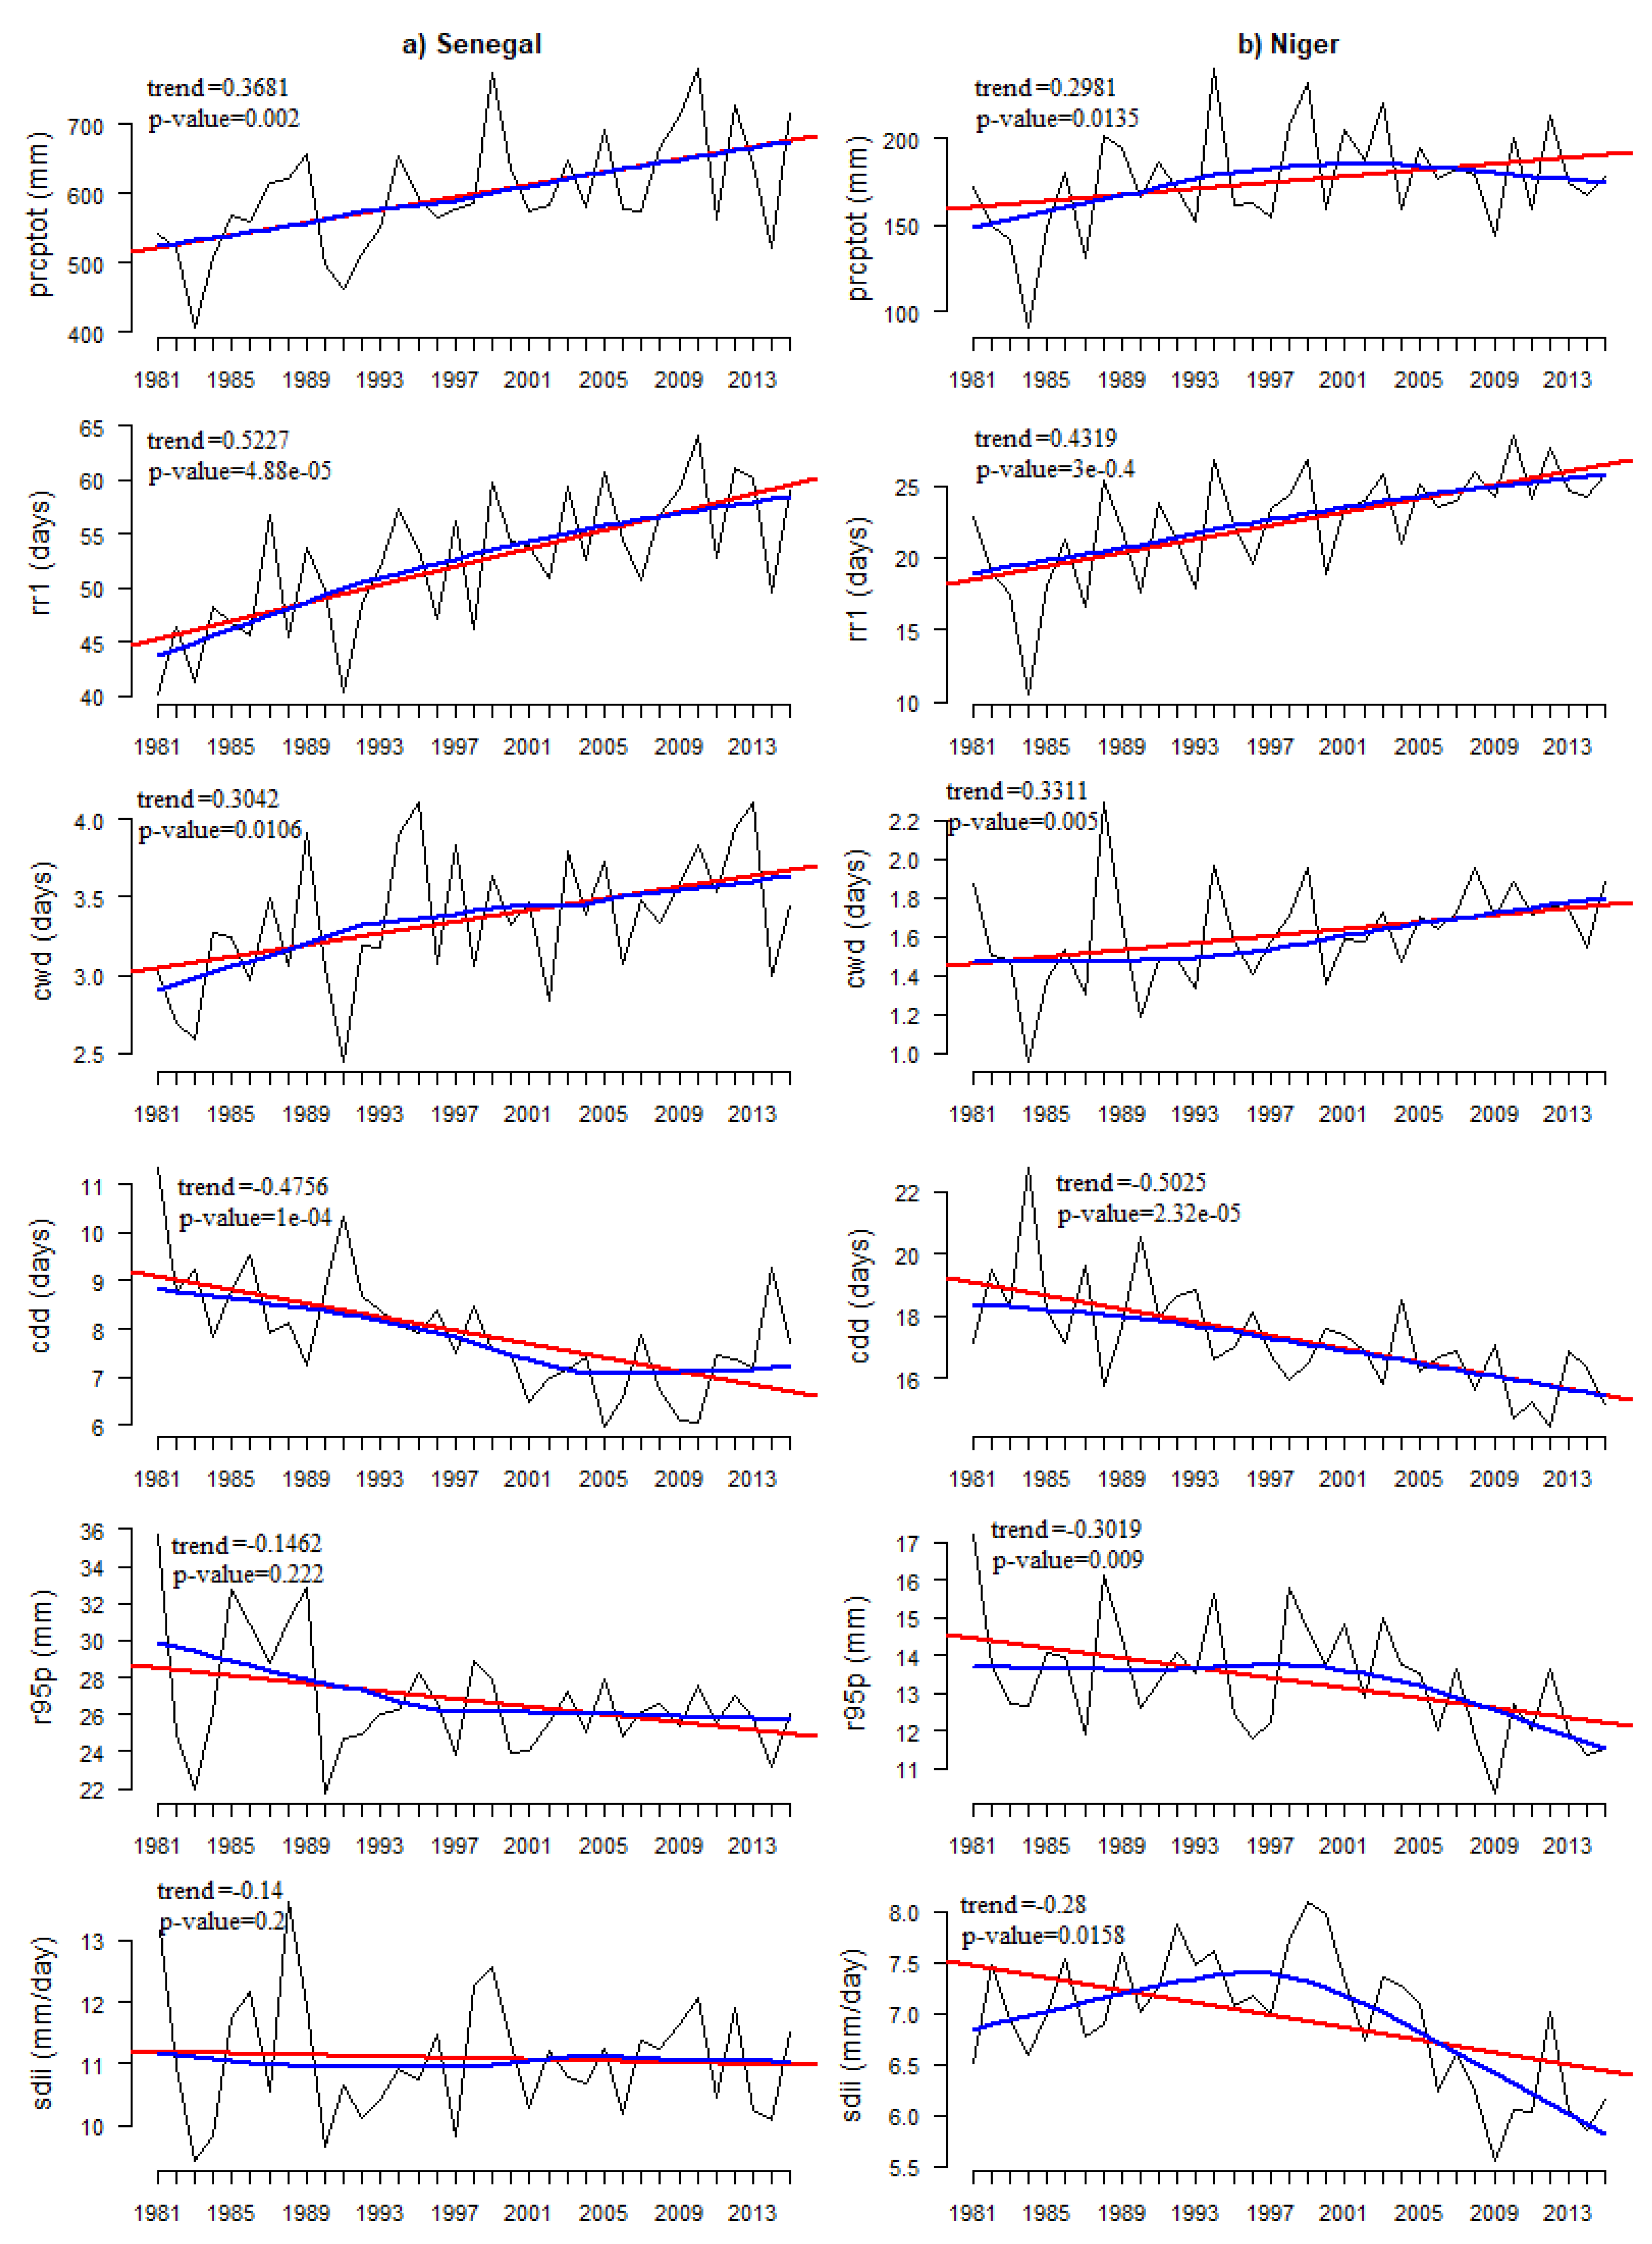
2.4.1. Trends Analysis

The best-fit linear trend is often used to analyze the temporal change of a time-series. However, it can be influenced by outliers (e.g., large values produced, for instance, during El Niño years [46] and the non-normality of the distribution, which are regularly found in extreme values. Therefore, in addition to the computation of the best-fit linear trend, we also computed an estimator of the slope based on Kendall’s rank correlation. This method was proposed by [47] and has been applied in several extreme climate studies [8,20,21,22]. The estimator is the median of the slopes obtained from all joining pairs of points in the series and the confidence interval is calculated from tabulated values [23,24]. The existence of a trend is deemed statistically significant at a p-value lower or equal to 5% equivalent to a 95% confidence level.

2.4.2. Climate Indices

The complex interaction between West African Monsoon (WAM) and the Sea Surface Temperature (SST), the land surface and aerosols forcing are not well understood and varies in different time scales with respect to seasonal to decadal scale forcing. In this regard, some recent findings support the notion to better investigate decadal climate variabilities of precipitation over West Africa [43,44] as possible deficiencies of climate models and knowledge in the dynamics of the WAM. For the decadal evolution, we compare ten-year window periods (1986–1995, 1996–2005, and 2006–2015) at each grid point for the six selected indices, namely total rainfall (PRCPTOT), the number of wet days (RR1), the maximum number of consecutive dry days (CDD), the maximum number of consecutive wet days (CWD), very wet days (R95P), and the simple daily intensity index (SDII). Following previous studies [25,30,48], we define a wet day as a day when the daily precipitation is at least 1 mm/day. The spatial evolution of climate extreme related indices is presented as an average of the difference between the three sub-periods. For a given year, PRCPTOT corresponds to the total amount of precipitation accumulated during the wet period (generally from June to September in West Africa, hereafter JJAS), RR1 corresponds to the total number of wet days in each year in the reference period, CDD (CWD) corresponds to the maximum number of consecutive dry (wet) days in each year in the reference period. The R95P is defined as a very wet day and represents the accumulated amount of precipitation that is above the 95th percentile during all wet days over the given period in JJAS. The SDII corresponds to the precipitation intensity during that year and is computed as follows: SDII = PRCPTOT/RR1 (Table 2). The selection of these 6 indices is based on their relevance for the region as discussed in previous work (e.g., [30]). For example, CDD and CWD are important indicators for agriculture in these regions, which are dominated by rainfed agriculture. In addition, the R95P index is based on the 95th percentile, which allows for comparing the evolution of very wet days in different regions even though they represent very different rainfall regimes, i.e., dry Sahel and wetter Guinea Coast. As defined in [49], the indices used in this study are “moderate extreme indices” mainly based on percentiles with thresholds set to assess moderate extremes that typically occur a few times every year rather than high impact (once-in-a-decade weather events). Nevertheless, in countries with less adaptive capacity, those moderate extremes may threaten livelihoods and human security. A detailed description of the indices and their computation is available at http://etccdi.pacificclimate.org/list_27_indices.shtml.

3. Results

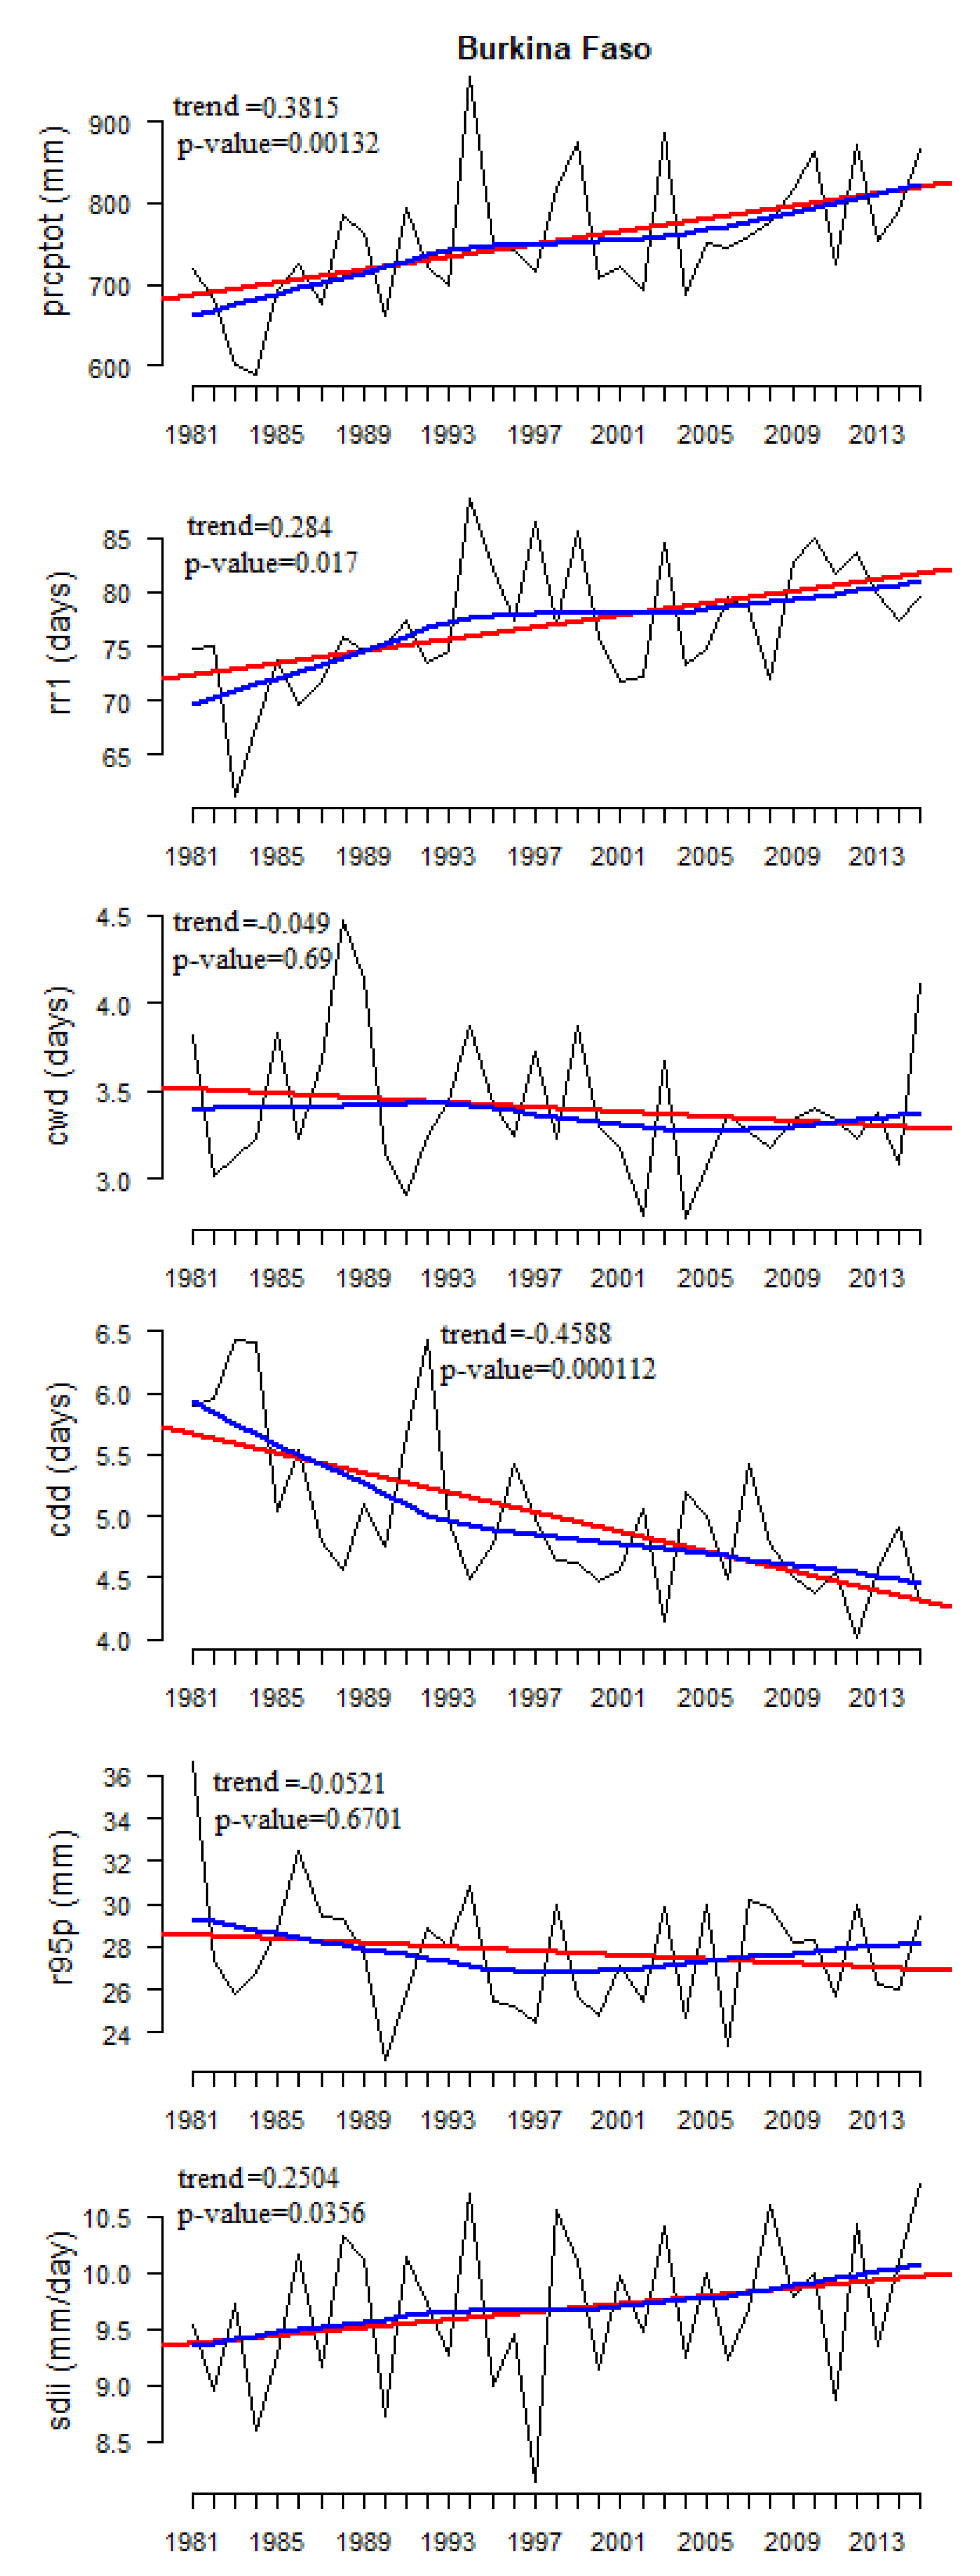
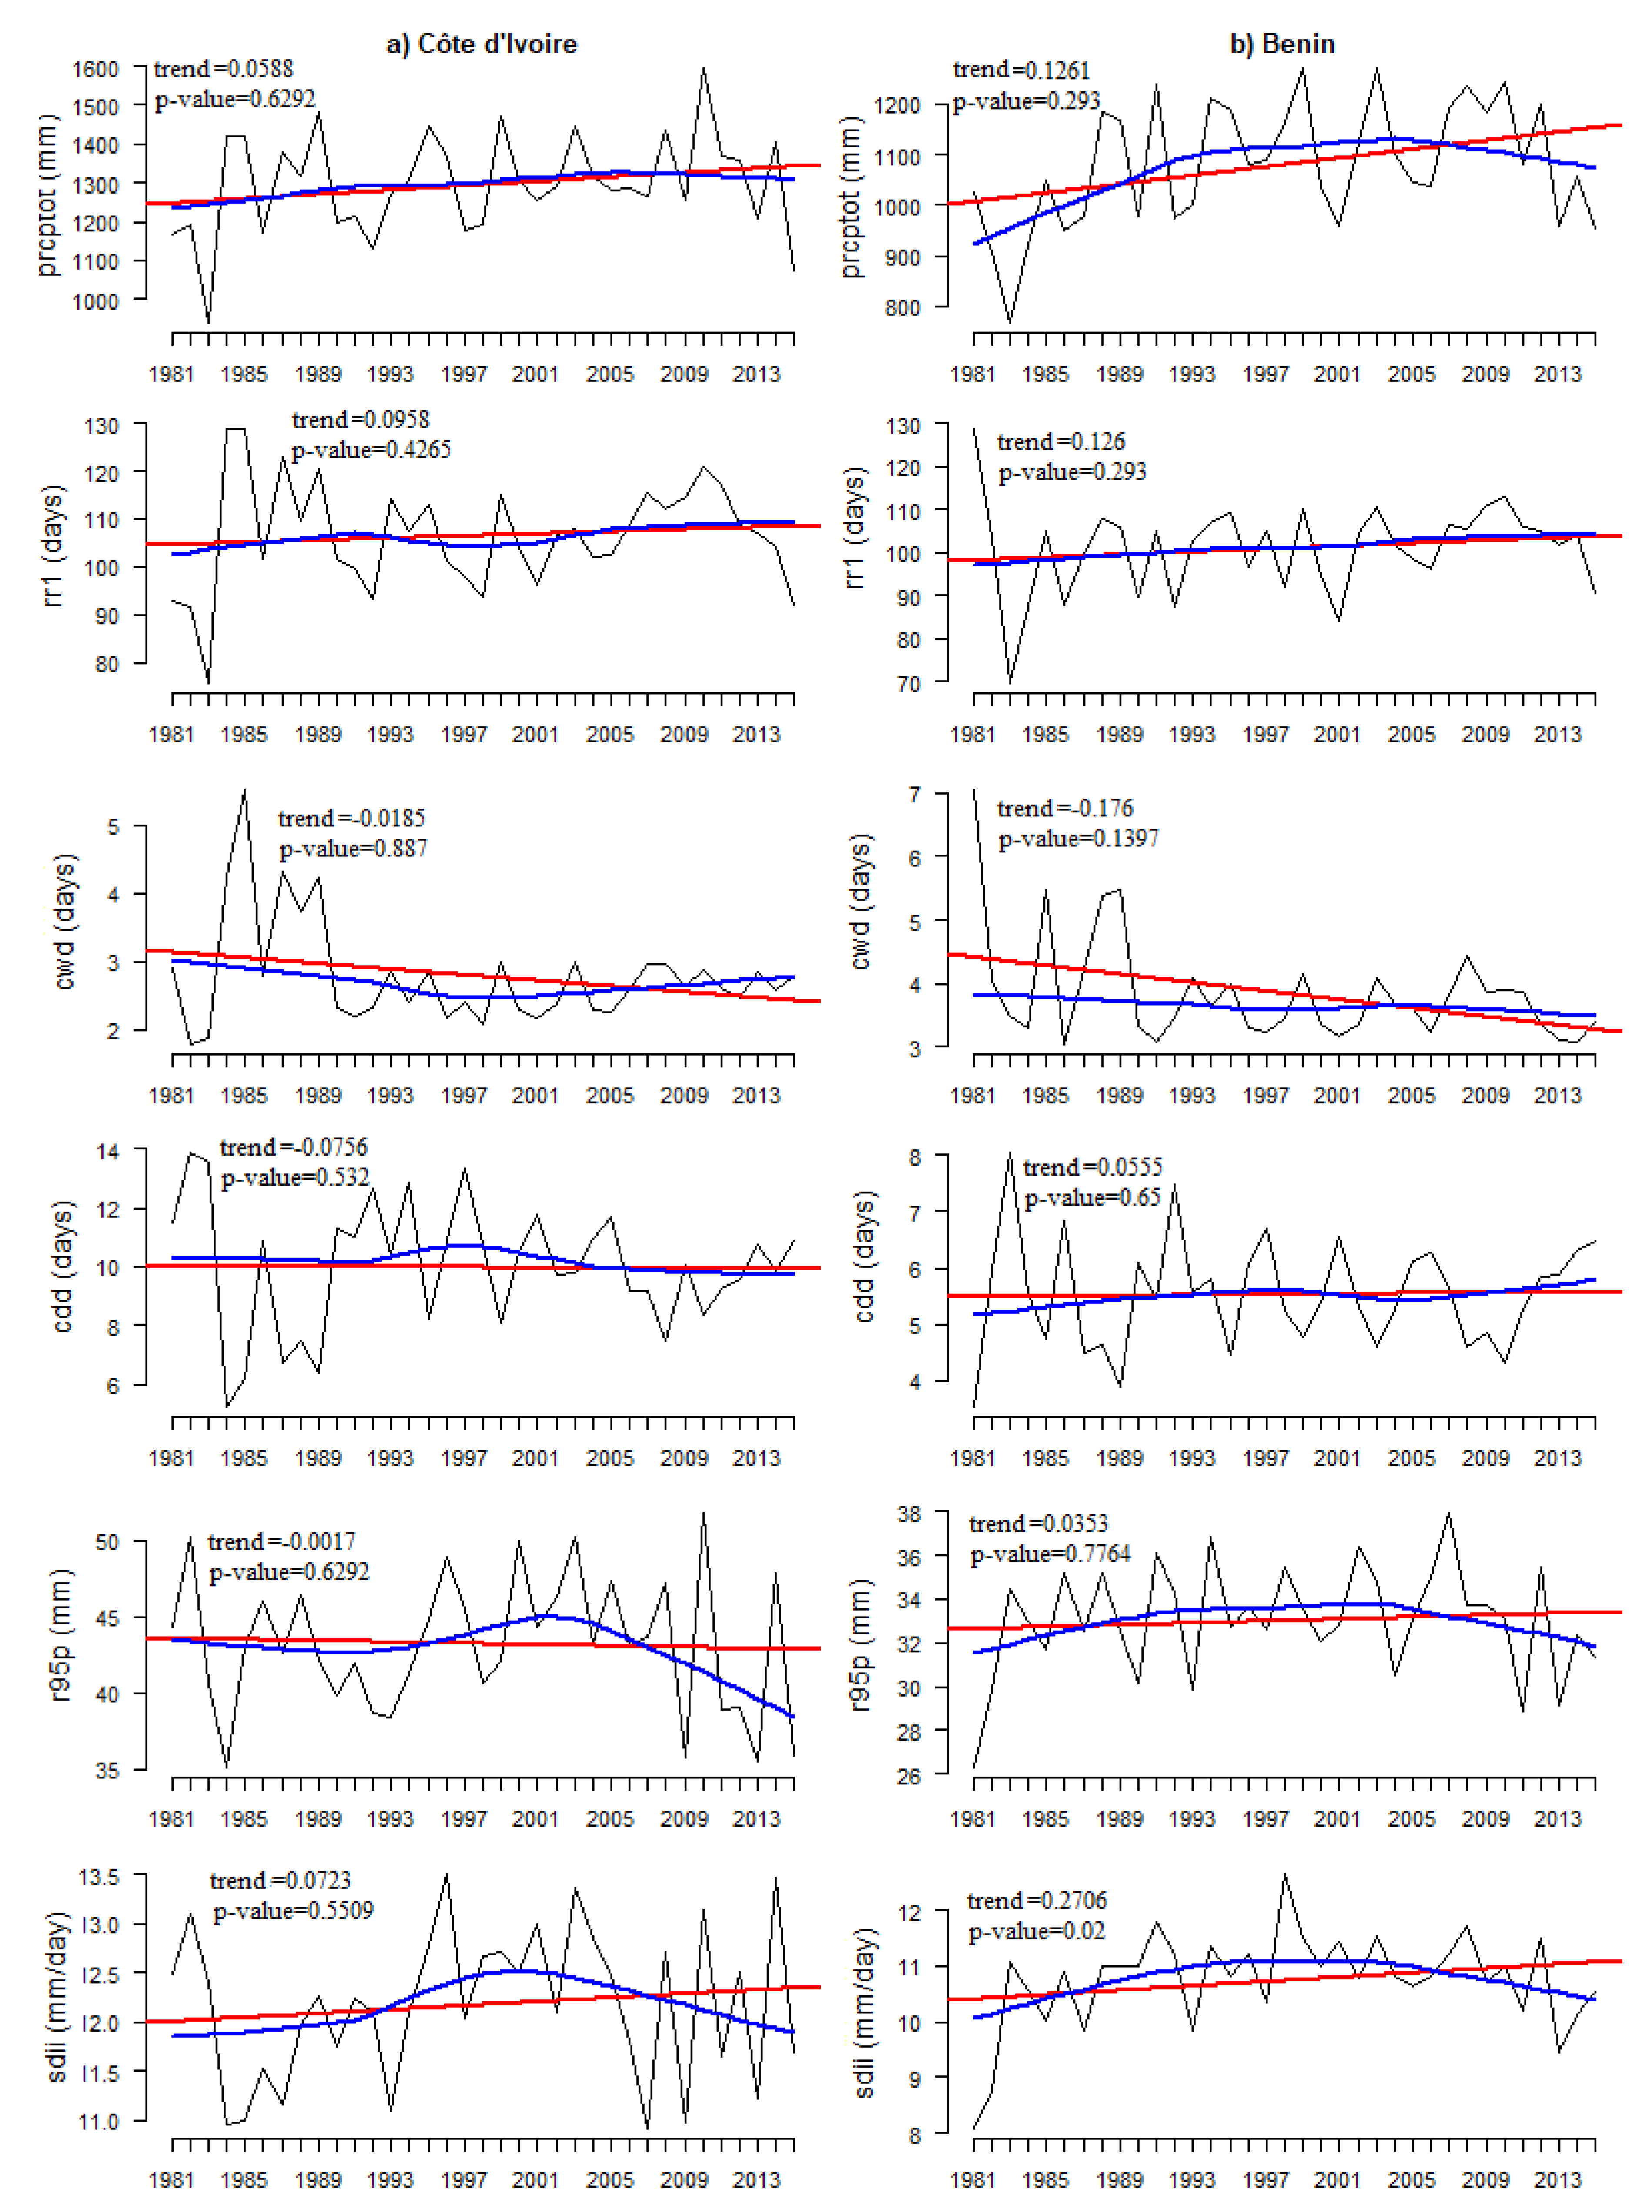
3.1. Temporal Analysis

In this section, the trends (1981–2015) of each ETCDDI extreme climate index were analyzed and then averaged over each country. For each country, the trends of the six indices and their significances are shown in Table 3.
Both Senegal and Niger (Figure 4) show significant increases in PRCPTOT (+3.7 and +2.9 mm per decade respectively, Table 3), RR1 (+5 and +4 days per decade respectively, Table 3), and CWD (+3 and +3 days per decade respectively, Table 3). However, Senegal and Niger present significant decreases in CDD (−5 days per decade each, Table 3), R95P (−1.5 and −3 mm per decade respectively, Table 3) and SDII (−1.5 and −2.9 mm/day per decade, respectively, Table 3). Hence, over Senegal and Niger, the analysis reveals a recent increase in precipitation that results from an increase in precipitation frequency (increase in RR1) as well as the maximum length of wet spells (increase in CWD).
In the adjacent area of the Sahelian zone in Burkina Faso (Figure 5), there is a significant increasing trend in PRCPTOT, RR1, and SDII (+3.8 mm, +3 days, and +2.5 mm/day per decade, respectively, Table 3), while the CDD (−5 days per decade) exhibits a significant decreasing trend. Decreasing trends of CWD and R95P (−0.5 days and −0.1mm per decade) were also observed over Burkina Faso but are not significant. It should, however, be noted that R95P increases after 2000. Hence, over Burkina Faso, the analysis shows a recent augmentation of precipitation that results from an increase in precipitation frequency (increase in RR1 but not in CWD) and intensity (increase in SDII), including very wet days after 2000 (increase in R95P after 2000).
Over Côte d’Ivoire and Benin (Figure 6), the results show an increase in PRCPTOT (+1 and +1.3 mm per decade), a decrease in CWD (−0.2 and −1.8 days per decade, respectively, Table 3) and CDD (0 and −1 days per decade, respectively, Table 3), an increase in RR1 (+1 and +1day per decade, respectively, Table 3) and SDII (+0.1 and +2.7 mm/day per decade, only significant in Benin respectively, Table 3), and no clear change in R95P (Figure 6). Hence, over Côte d’Ivoire and Benin, the analysis shows an increase in precipitation as a result of a weak increase in precipitation frequency (increase in RR1 but not in CWD) and intensity (increase in SDII but not in R95P).

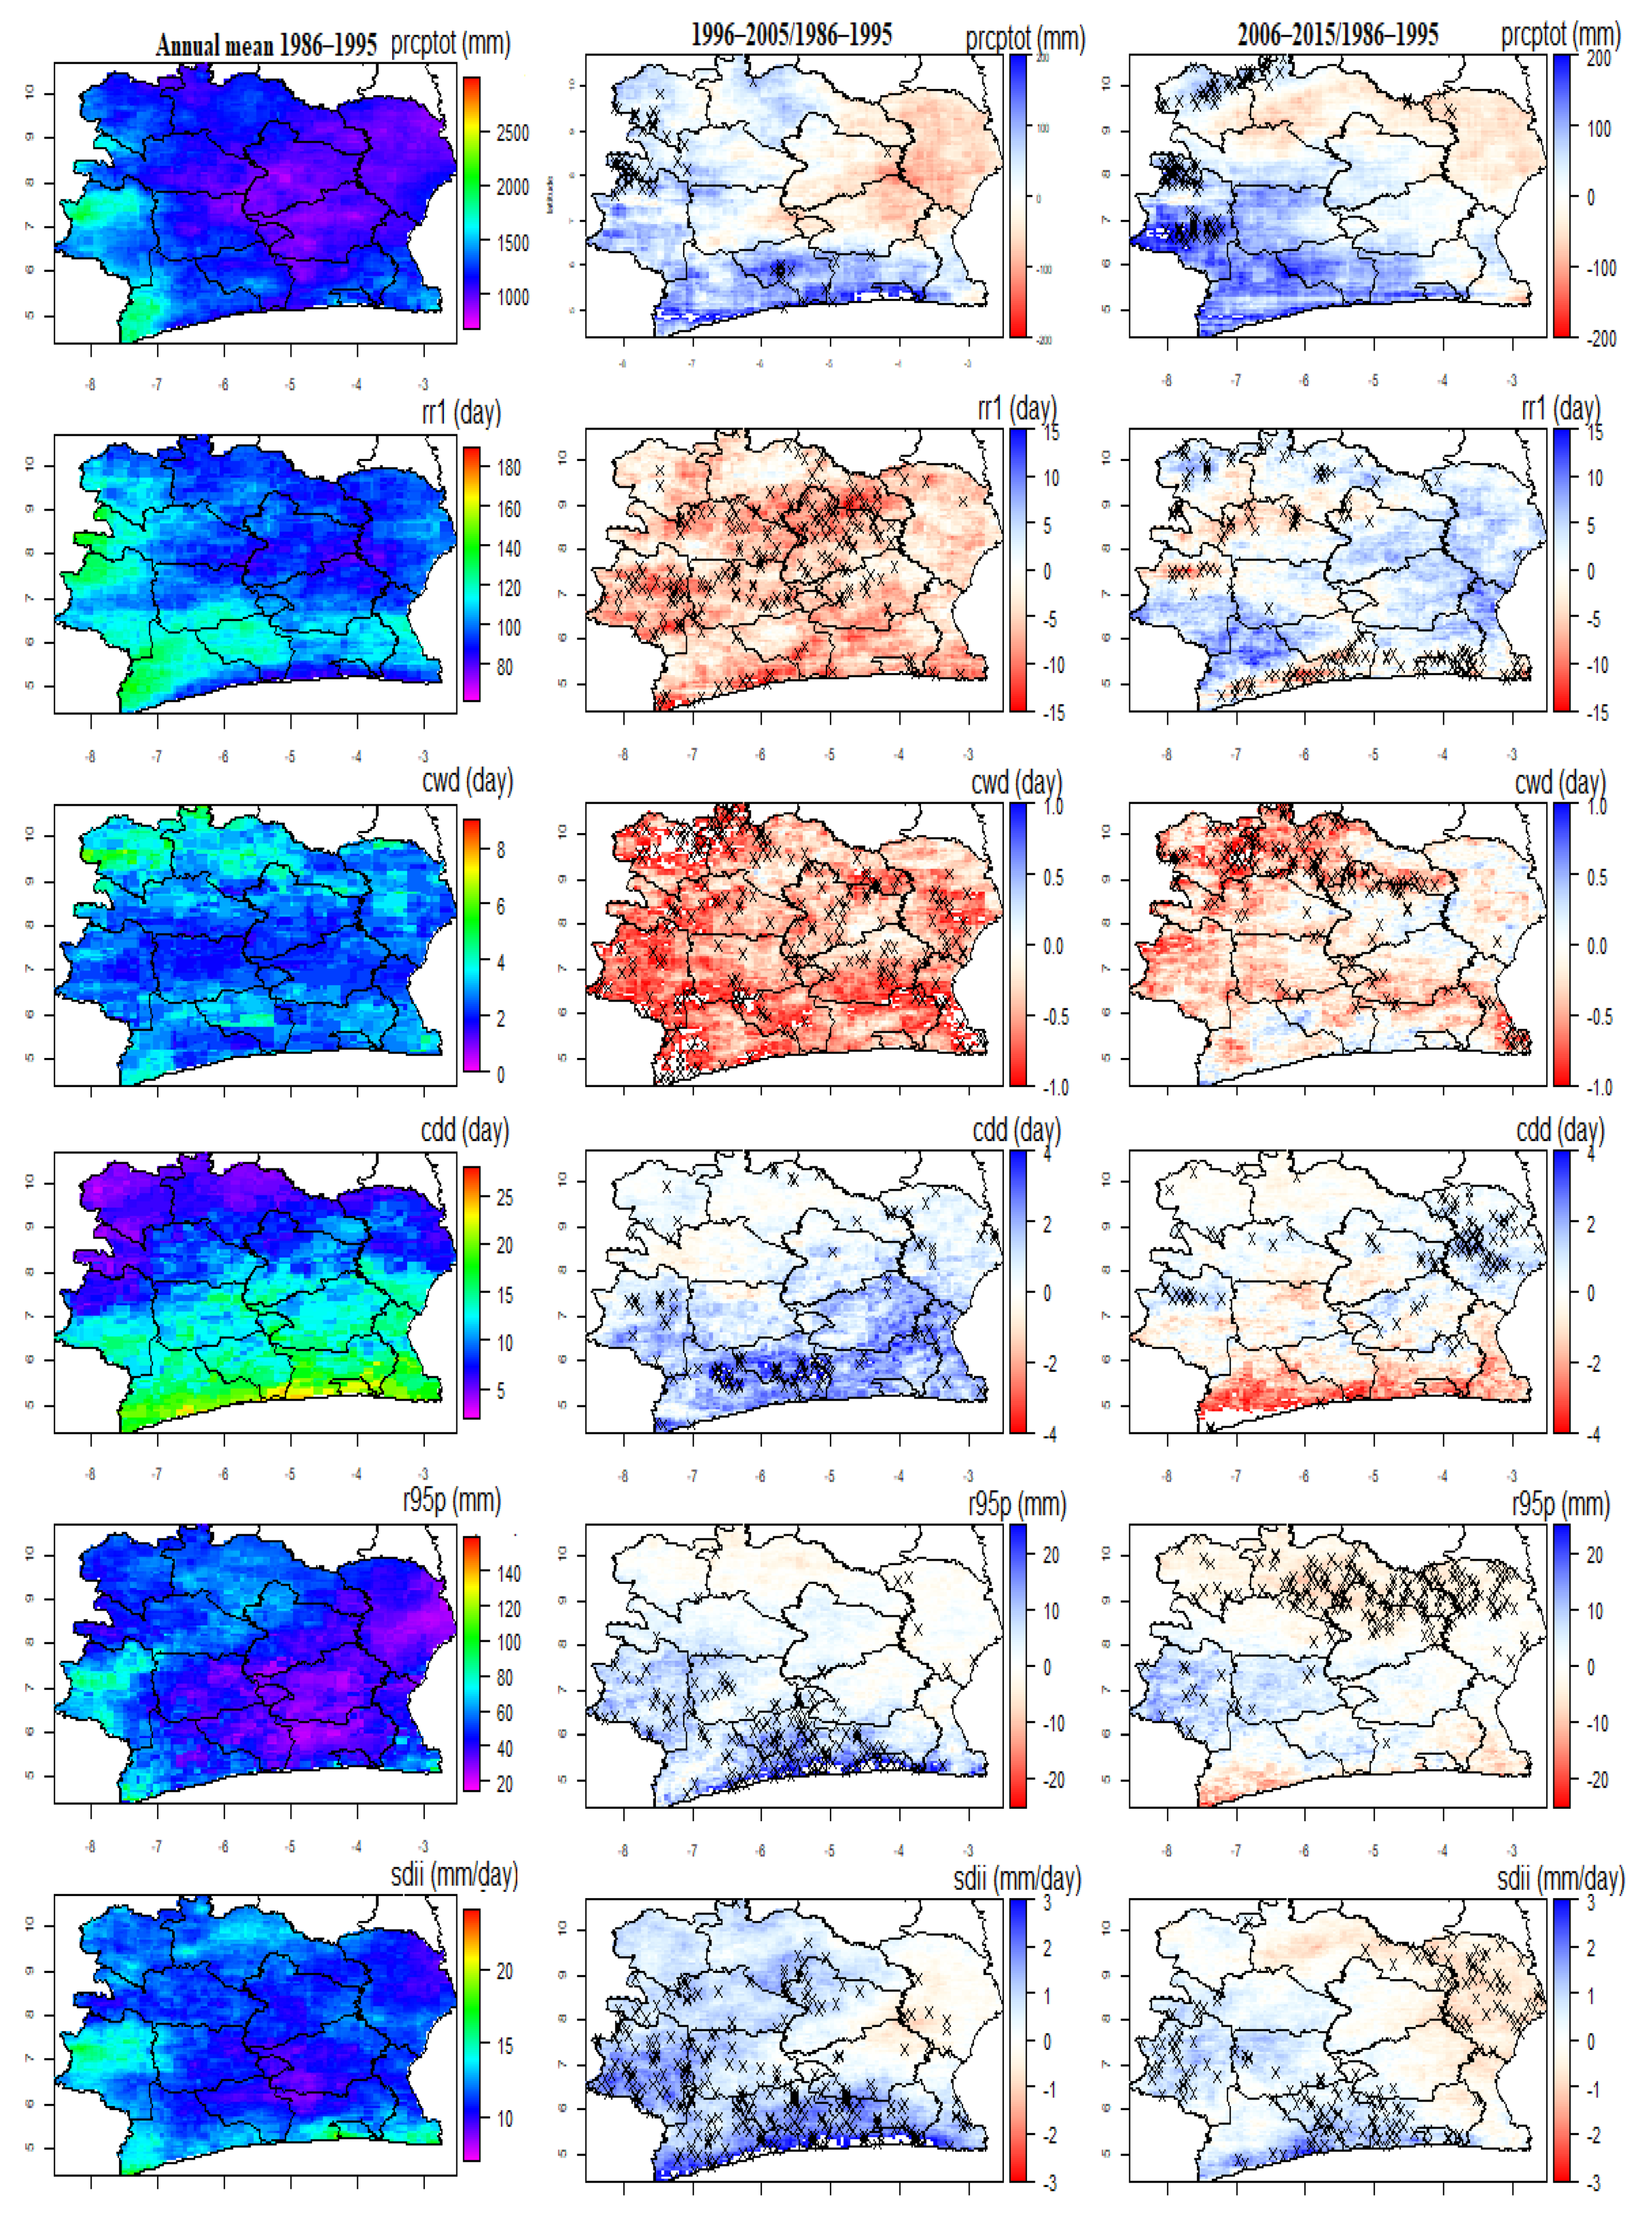
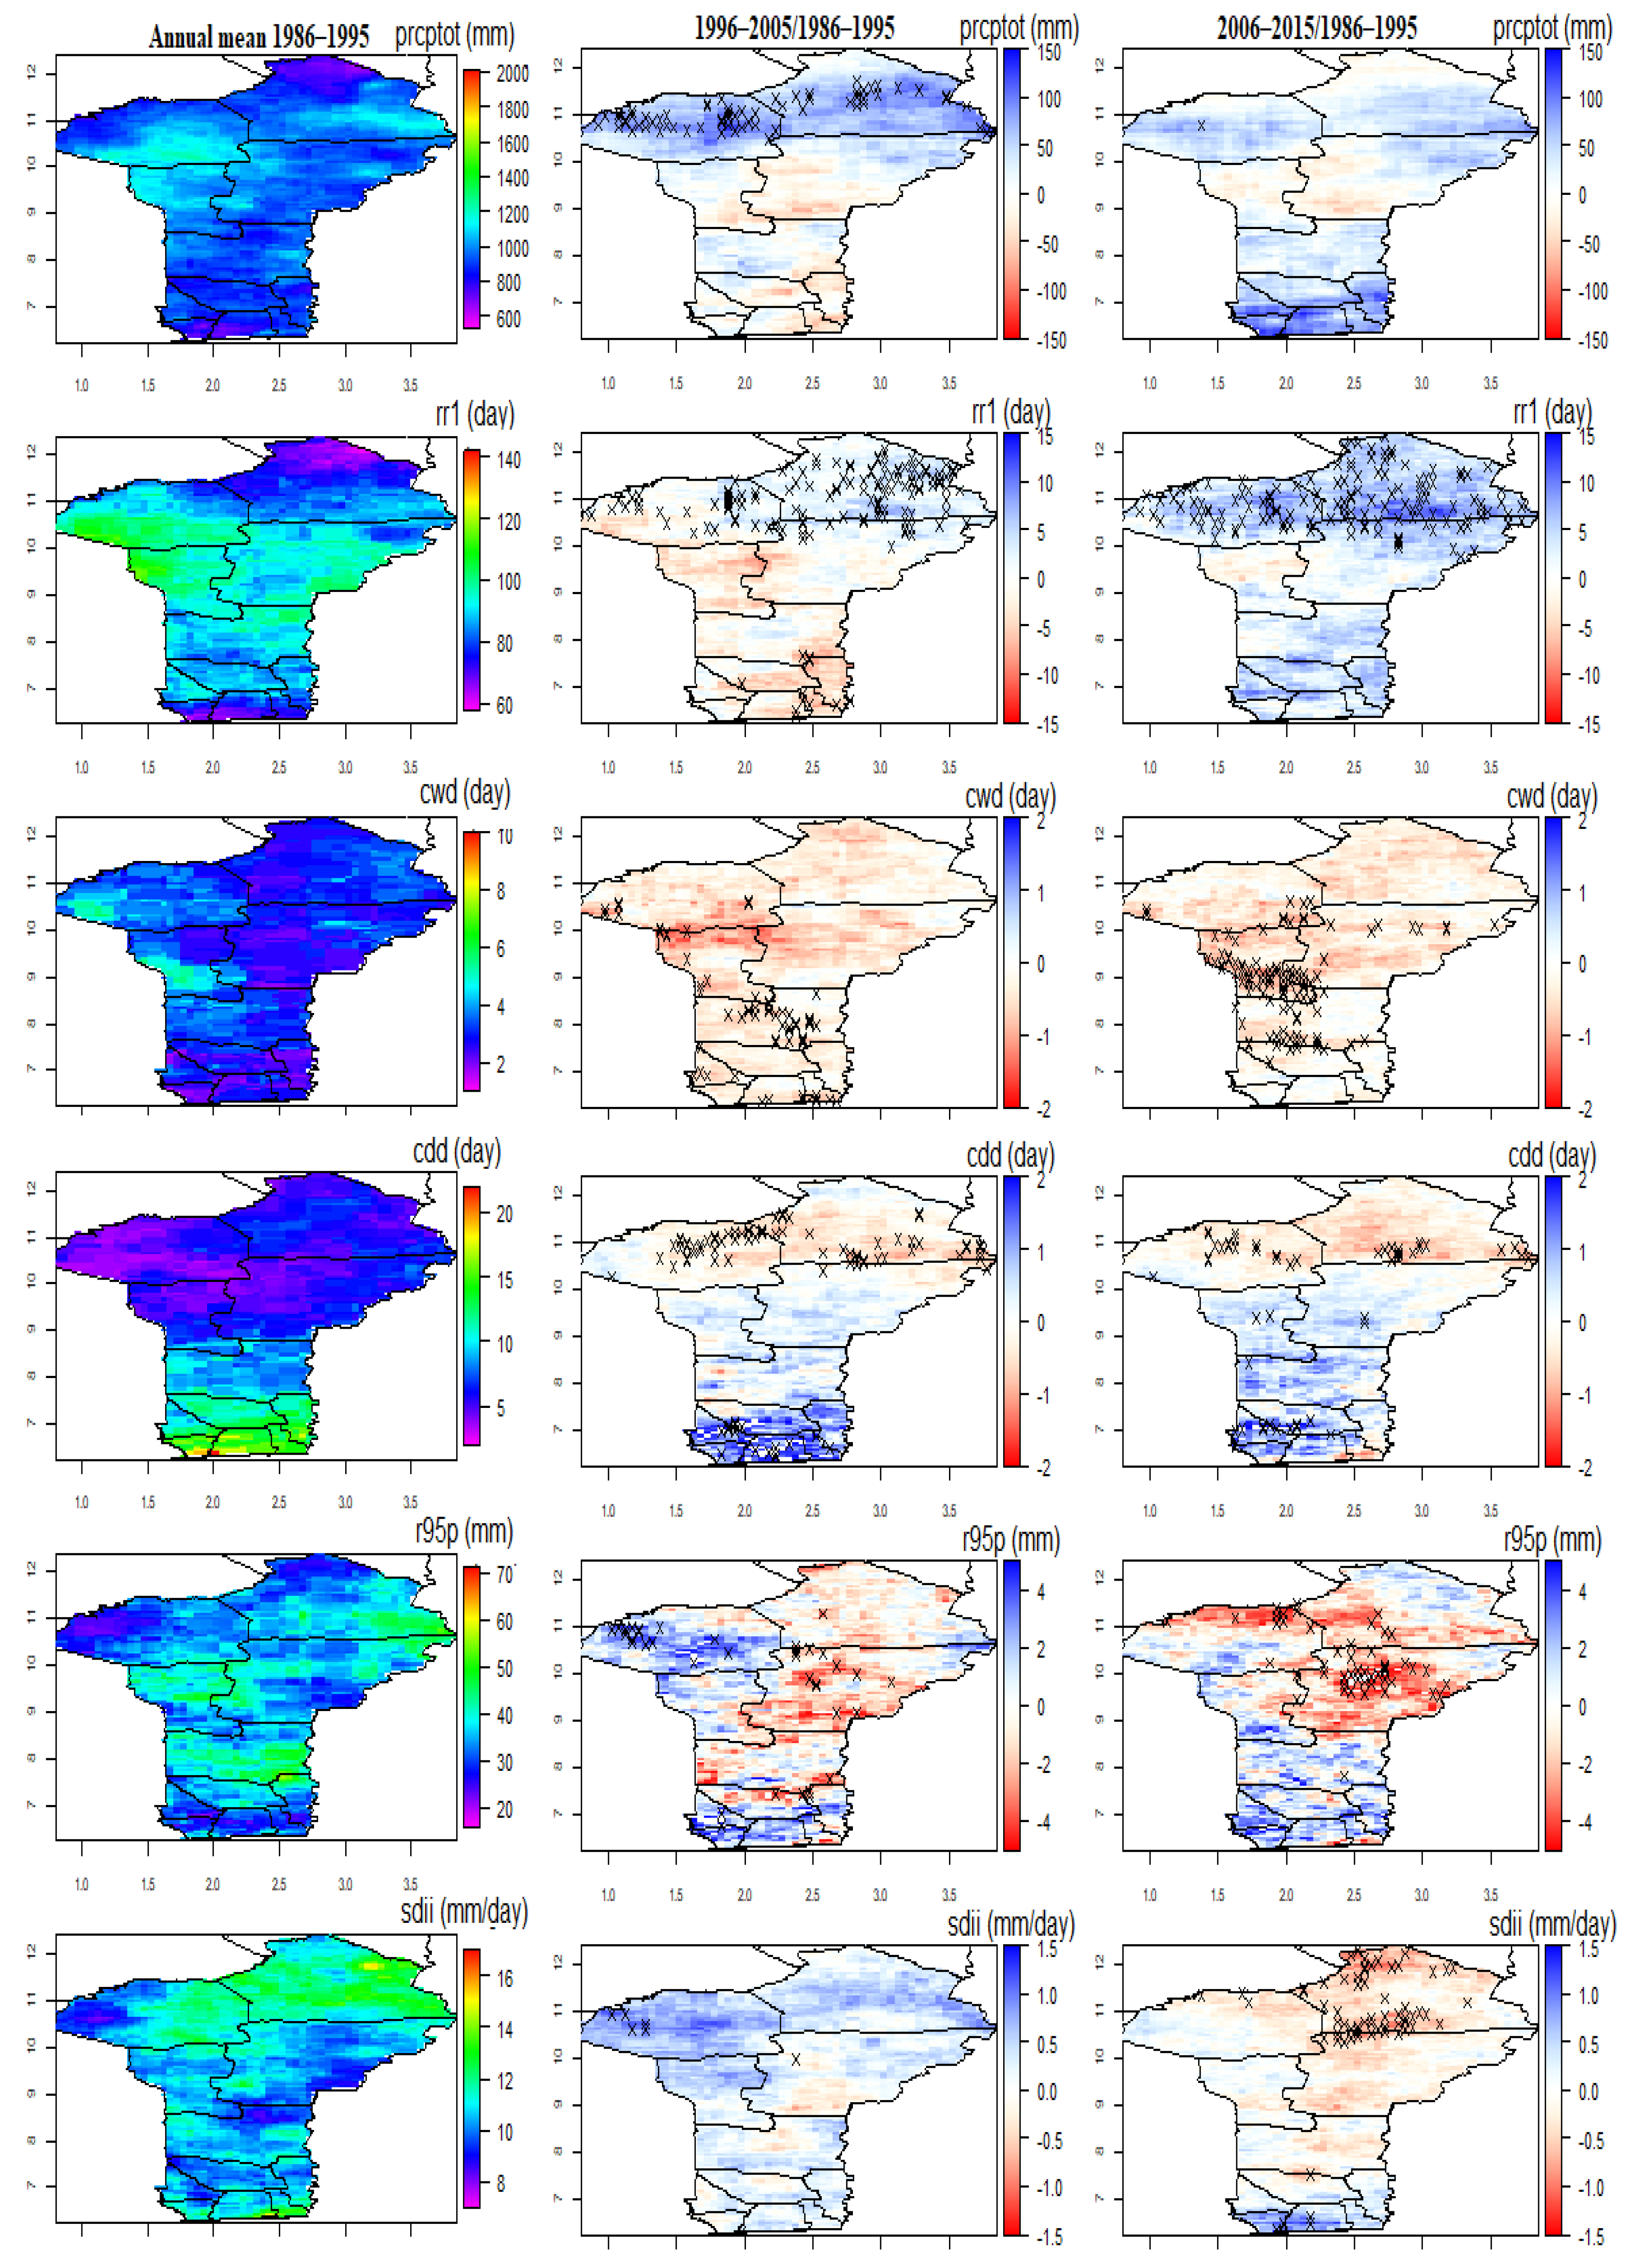
3.2. Spatial Variability of the Changes over the Last Two Decades

To highlight the spatial distribution of these variations over time, Figure 7, Figure 8, Figure 9, Figure 10 and Figure 11 show the changes in PRCPTOT, RR1, CWD, CDD, R95P and SDII over of the periods 1996–2005 and 2006–2015, using 1986–1995 as reference period in all five countries. The first column of these Figures represents the mean value of each index (according to the row) over reference decade 1986–1995 while the second and third columns show the anomaly between reference decade and the periods 1996–2005 and 2006–2015, respectively.
Over Senegal, the analysis of the annual mean over the reference decade (first column of Figure 7 exhibits that the southern part (south of 14° N) recorded the highest PRCPTOT (750–1500 mm/year), RR1 (60–100 days during JJAS period) and CWD (6–10 days), and the lowest CDD (0–10 days during JJAS period). In addition, the highest values of SDII and R95P are observed over the central and southern part of the country during the reference decade while the lowest mean values are recorded over the northern and eastern parts. During the first (1996–2005) and the last (2006–2015) decades in Senegal (second and third columns Figure 7), PRCPTOT and RR1 have increased over the entire country except for some areas in the southern part during the last decade. The increase in PRCPTOT is significant in the western, northern and southeastern parts of the country, whereas the increase in RR1 is statistically significant over the entire country for the two considered decades relative to reference decade. However, the CDD presents a significant decreasing trend over the entire country for the two decades while the CWD presents an increase, which is only significant in some areas. Large parts of the country present significant decreasing trends for R95P and SDII but present slightly increasing trends over parts of the northern and southeastern parts of the country. Hence, during the first period, the increase in precipitation observed over Senegal is mostly as a result of an increase in precipitation frequency (including shorter dry spells). In addition, an increase in precipitation intensity (including very wet days) over the northern and southeastern parts of the country contributed to the total increase in precipitation amount. Furthermore, during the second decade (2006–2015; third column Figure 7), PRCPTOT, R95P, and SDII increased over the entire country except over the central-southern region, where they clearly decrease. In addition, RR1 and CWD increased over the entire country, while CDD slightly decreased over the entire country. Indeed, during the second decade, the rise in precipitation observed over Senegal results from a clear increase in precipitation frequency (including longer wet spells and shorter dry spells) and to some extent in precipitation intensity (including very wet days). The strong decrease in precipitation observed over the central-southern part of the country is due to the weakening of the rain intensity (including a reduction in the number of the very wet days).
The agricultural system in Senegal is essentially rainfed and relies on both cash crops (groundnuts, cotton, horticultural products) and food crops (mainly cereals). Senegal suffered the worst droughts in the 1970s, which caused a major famine requiring international food aid [50,51]. However, during the last twenty years, the significant increase in cumulative annual rainfall (PRCPTOT), in the number of rainy days (RR1) and in consecutive wet days (CWD) have been favorable to agriculture [52,53]. This has led to an increase in productivity and helped to reduce the national acute malnutrition rate from 10.6% in 2010 to 8.8% in 2012 and 5.9% in 2014 [54]. Indeed, according to the National Agency of Statistics and Demography [55] in recent decades, groundnut production with a high concentration in the central-western regions (Kaolack, Kaffrine, Fatick, Diourbel, Thiès, Louga) has amounted to 1,050,042 tons, i.e., a 125% achievement rate relative to the annual target of the Programme d’Accélération de la Cadence de l’Agriculture Sénégalaise (PRACAS; 838,728 tons) and an increase of 57% compared to previous years. Similarly, cotton production, especially in the southern zone (production area), experienced a 16% increase in 2015. Generally, in the last decade, there has been an increase in the production of other food crops, particularly rice (62.1%), sorghum (84.2%), cassava (70.9%), cowpea (33.6%), fonio (48.1%), millet (83.3%) and maize (70.3%) [55]. Despite this good performance in agricultural production, the report of [56] mentions that the country suffered from locust attacks during 1987 and 1998, which devastated crops, and that a rainfall deficit caused by an early cessation of rains during the 2003 dry season had a severe impact on water resources and crops, particularly millet, which had not reached maturity. In 2012, excess rainfall was noted throughout the country and caused damage to rainfed crops [56].
Over Niger, the first column of the Figure 8 presents the spatial mean indices over the reference period. The PRCPTOT, RR1 and CWD increased in the south during the reference decade, whereas the CDD decreased. Nevertheless, the R95P show higher values (20–40 mm) in the southern and northern parts of the country while the SDII presents lower values over the entire country (0–20 mm/day) except in central and north-western parts where the values reach 20–30mm/day. The second and third columns of Figure 8 present the anomaly of computed indices for first (1996–2005) and last (2006–2015) decades, respectively. The RR1 increased significantly over entire country for both decades relative to the reference decade. PRCPTOT also increased over the entire country but the increase is only significant in some parts (especially the north-western and southern-central parts for the first decade and between 10° E–12° E longitude for last decade). North of 14° N latitude, the CWD slightly increased significantly during the two decades relative to the reference decade but the change is more pronounced during the last decade. The CDD decreased significantly over the entire country but this change is more pronounced during the last decade. R95P and SDII slightly increased during the first decade (significant in the western and southern parts) and decreased slightly during the last decade in major parts of the country, especially in the central and northern parts. Hence, during the first period, the increase in precipitation observed over the entire country was mostly due to an increase in precipitation frequency, including longer wet spells (over the north-east) and shorter dry spells. The anomalies observed over the second period (Figure 8) are very similar to the ones observed over the first period, albeit a slight decrease in precipitation observed over the western part of the country that results from a clear decrease in precipitation intensity (including very wet days).
Strongly dependent on climatic conditions characterized by high aridity accentuated by high temperatures, very high spatio-temporal variability of rainfall as well as a southward displacement of isohyets, Niger’s agricultural sector has experienced an overall increase since 1993 according to the Programme Détaillé du Développement de l’Agriculture Africaine [57]. Figure 8 shows that, over the first decade, there was a significant increase in all indices in the south and a significant decrease in the number of consecutive dry days (CDD). This increase in rainfall coupled with changes in surface conditions (increase in cultivated areas) has modified runoff and infiltration and this has contributed to a 10% increase in groundwater reservoirs since 1990 [58]. Recent reports of [59,60] on the evolution of rainfall confirm this increasing trend of rainfall and suggest that isohyets are moving northward again. Figure 8 shows that this trend is mainly explained by an increase in the number of rainy days in the last two decades. Despite the overall performance recorded, the agricultural sector in Niger has never managed to grow more than two consecutive years according to [57]. The main reason is the high inter-annual variability of rainfall. The World Bank report [60] shows that, despite a generally increasing trend, the years 1984, 1997, 1993, 1997, 2000, 2004, and 2009 rainfall deficits were very closely linked to the poor harvests and a reduction in seasonal lakes that provide drinking water to humans and animals during the rainy season [59]. Although the increase in average annual rainfall has generally been favorable to crop production, since the 1990s it has led to an increased frequency of flooding. Most floods occur during the rainy season (July to September) when the main crops are sown. They are usually the result of heavy rainfall for a short period of time, leading to flash floods or localized flooding along the banks of the Niger River, leaving little time for preparation. Damage and losses are usually localized, but floods have devastating effects where and when they occur. Homes and buildings are destroyed, fields are flooded and large numbers of livestock are washed away. The number of displaced people can also be high, especially when these floods affect urban areas.
In Burkina Faso (Figure 9), PRCPTOT, RR1, R95P and SDII increased in the southern part of the country, while CWD and CDD decreased in the same areas. The latitude 13° N is seen as the transitional zone. During the first decade (second column of Figure 9), PRCPTOT and RR1 decreased in major parts of the country, especially in the southern part, while they increased significantly in the central and northern parts over. During the last decade (3rd column), PRCPTOT increased significantly northward of 11° N latitude, while RR1 increased significantly over entire country. The CWD present a decrease below 14° N for both decades but the change is more pronounced and significant in large areas during the first decade. CDD decreased over entire country for both decades relative to the reference but is more pronounced and significant during the last decade. For the first decade, R95P and SDII decreased in major parts of the country, especially in the central region where both indices were significant while a significant increase is observed in the northern parts. Nevertheless, the decreasing trend of SDII in the central part of the country declined and even disappeared during the second decade, while the increased observed in the northern part became largely significant. Generally, in Burkina Faso, PRCPTOT, RR1, and SDII increased (decreased) over the eastern (western) part of the country during the first period, while CWD and R95P (CDD) clearly decreased (increased) over the entire country. During the second period, PRCPTOT, RR1, and SDII generally increased (decreased) over the western (eastern) part of the country, CWD slightly decreased, CDD increased (decreased) over the eastern (western) part of the country, and R95P increased over the entire country. Hence, trends in annual precipitation show an opposite east–west dipole in the two periods. Changes in both decades are due to a change in precipitation frequency and intensity (including very wet days in the second period). Note that the increase in precipitation frequency occurs despite the shortening of wet spells and the lengthening of dry spells.
Agricultural production in Burkina Faso is dominated by cereals (sorghum, millet, maize and rice), the main food crops, and cotton, the main cash crop. The agricultural production has increased overall in recent years at the national level [61,62]. This performance was not only due to an increase in the area under cultivation [63], but also due to favorable climate and a good adaptation to climatic conditions [64]. As shown in Figure 9, the country experienced significant increases in cumulative rainfall (PRCPTOT) and in the number of rainy days (RR1) over almost the entire country during the last two decades. Despite the progress made in recent years, Burkina Faso’s agricultural sector is experiencing disruptions due to several unfavorable factors, the most important of which is based on climatic hazards [65,66]. Indeed, the country regularly undergoes meteorological disturbances that cause droughts and floods. Since 1994, Burkina Faso has experienced more than ten major disasters with significant consequences [64]. Figure 9 on heavy rains (R95P) confirms that northern Burkina Faso was more prone to floods during the first two decades but much more so in the second decade. This result is in line with those obtained by [66], explaining that the country recorded violent floods, especially in the northern zone during the years 1994, 2007, 2008, 2009, 2010, 2011. Moreover, droughts have had many consequences on food security. In 2004 and 2007, severe droughts caused a significant drop in agricultural production (−16% in 2007), accentuating the food insecurity of rural populations and leading to a slowdown in the growth of the agricultural sector [67] as well as a deficit in the filling of rivers and the scarcity of water resources for various uses [68]. During the years 1995, 1996, 1997, 2001, 2011 and 2012, droughts affected 170 of the country’s 352 districts in 10 regions of the country and caused a significant cereal deficit affecting 3.5 million people [64]. This situation is consistent with the length of consecutive wet days (CWD) which showed a significant decrease during the first decade in most parts of the country and in a few places during the second decade and could have had an influence on the production of cereal crops [56]. At the same time, the results on intense days (SDII) show a significant decrease, mainly in the center and west during the first decade and only in the south during the second decade. These decreasing trends could explain the slowdown in agricultural growth, thus justifying the impact on food security during the last two decades. The recurrence of climatic shocks in Burkina Faso often affects populations that are already vulnerable due to poverty and the difficult agro-climatic environment. Among the most vulnerable in Burkina Faso, subsistence farmers and herders see their capacities eroded over time under the combined action of disasters and a lack of financial resources.
During the reference decade in Cote d’Ivoire (1st column of Figure 10), the mean PRCPTOT, RR1, R95P and SDII decreased gradually from west to east and from south to north gradients. The greatest value of PRCPTOT recorded in the western part is due to the orographic effects caused by the hills and mountains. However, the CDD increased gradually according to a north-south gradient. Northward of 9° N and southward of 6° N, the country recorded the largest value (4–6 days) of CWD. The PRCPTOT increased significantly along the coast and in the northwestern part of the country during the first decade while this increase was only significant in the western and in the northwestern parts during the last decade. The RR1 decreased significantly in entire country during the first decade, while it decreased significantly along the coast and in north-central part of the county during the last decade. The CWD decreased during both decades in the entire country and significantly during the first decade. The CDD significantly increased in the entire country except the central part during the first decade. It is important to highlight that this increase was maintained during the last decade except along the coast (below 7° N), where a reduction in CDD was observed. The R95P index increased considerably in all regions south of 8° N, while it decreased significantly in the region north of 8° N for both decades. The SDII index generally increased significantly in the regions south of 9° N, except in the northeastern part during the first decade. During the last decade, the SDII increased significantly in the south and western parts while in the northeastern part decreased significantly. Thus, during the first decade over Côte d’Ivoire, PRCPTOT increased (decreased) over the western and southern (eastern) part of the country, RR1 and CWD decreased over the entire country, CDD increased (decreased) over the southern (western) part of the country, and R95P and SDII increased over almost the entire country. During the second decade, PRCPTOT increased over the central part of the country but decreased in the other parts, RR1 and CWD increased over the entire country, and CDD, R95P, and SDII decreased over the entire country. Hence, the results show a switch from less frequent (including longer dry spells over the south and shorter wet spells over the whole country) and more intense (including very wet days) rainfall before 2005 to more frequent (including longer wet spells and shorter dry spells) and less intense (including very wet days) rainfall after 2005.
The small increase in rainy days and the reduction in the number of consecutive dry days recorded during the last two decades in the southern, south-western, western and north-western zones are consistent with the increase in cashew nut and cotton production in the north and coffee, cocoa and rubber production in the south and south-west [69]. The climate has been favorable to agriculture in Côte d’Ivoire in recent decades, but this has also had significant impacts on the environment and society. Indeed, since the 1990s, many lives and properties are lost every year due to deadly floods and landslides [70,71]. This is in line with Figure 10, which shows that the southern and western parts of the country have been marked by a significant increase in extreme rainfall and rainy intensities (R95P and SDII, respectively) since the first decade.
In Benin, PRCPTOT and CWD during the reference period (1st column of Figure 11) are highest in the northwestern part, especially in the Atacora channel (channel of mountains in Benin). The largest values of RR1 are observed between 7–11° N, while those of R95P and SDII are seen in the central, the north and northeastern parts of the country. During the reference period, the CDD decreases with the latitude (North-south direction). The PRCPTOT increased (significant only during the first decade) in the central and northern parts (north of 10° N) during both decades but was more pronounced during the first decade. During the first decade, RR1 increased significantly north of 10° N latitude except in some areas of the western part and below 10° N latitude. Moreover, this increase was significantly intensified in the last decade, during which RR1 for the areas south of 10° N latitude also increased. Furthermore, the CWD decreased in the entire country for both decades but was statistically significant in the south and central parts for the first decade and in the central–west for the last decade. In addition, the CDD increased (significantly decreased) in the areas south of latitude 10° N (north of 10° N latitude) but was significant only near the coast. The R95P decreased in both decades in large parts of the country (significant only in the central-east part). Nevertheless, the SDII increased (not significant) in the entire country between the first and the second decade, while in the last decade, the major part, especially the northern part, showed a decrease (significant from the center to the north-east region). Generally, over Benin, PRCPTOT and RR1 increased (decreased) over the northern (southern) part of the country during the first period, while CWD decreased over the entire country, and CDD, R95P and SDII increased over the entire country. During the second period, PRCPTOT decreased (increased) over the northern (southern) part of the country, RR1 increased over the entire country, CDD, R95P, and SDII decreased over the entire country, and CWD show no clear change. Hence, the precipitation increase observed over the northern part of the country during the first period was due to an increase in both precipitation frequency (despite longer dry spells and shorter wet spells) and intensity (including very wet days) while the precipitation increase observed over the southern part of the country during the second period was mainly as a result of an increase in precipitation frequency (including shorter dry spells). The reduction in rainfall amount at the southern part was due to a strong decrease in precipitation intensity (including very wet days).
Over the last thirty years, the climate in Benin has been favorable to agriculture and mainly to maize (the most consumed cereal in the country) with relatively stable production in almost all growing areas until 2015 [72]. Usually grown in the southern and central parts of the country (Ouémé, Mono, Atlantique, and Zou), maize cultivation started to develop in the northern regions (especially in Borgou) around the 1990s [73]. This is coherent with the significant increase in rainy days (RR1) as well as with a significant decrease in consecutive dry days (CDD) in this northern zone during the first and second decades, as shown in Figure 11. This improvement in production has also been observed for cotton, the country’s main export commodity, accounting for 45% of total national exports by value [74]. Cotton production is concentrated in the northern zone, in the Alibori department, and, to a lesser extent, in the departments of Borgou and Atacora (northwest). It has declined in the central zone, where the production was important in the 1990s. After reaching a record in the 2004/2005 season [75], the production fell sharply in 2010/2011. The production recovered in 2011/2012 and has continued to increase until 2014/2015. The drop of cotton yield is coherent with the increase in the number of consecutive dry days (CDD) during the rainy season in the production zones.

4. Discussion

In Senegal and Niger (Western and Central Sahel, respectively), the results show that in the CHIRPS dataset, a significant increase in annual rainfall over 1981–2015 results from an augmentation of precipitation frequency occurring at least partly under the form of longer wet spells and shorter dry spells despite the decrease (especially over Niger) in precipitation intensity (including very wet days). This result is in accordance with [76] who found from the Global Precipitation Climatology Project (GPCP) dataset that from 1998–2008, the long duration of the Sahelian wet spells (between 6 and 15 days) was a major contributor to the increase in annual cumulative rainfall. The result is also in agreement with [77], who investigated trends over 1980–2010 with rain gauge data and found that the recent increase in Sahelian precipitation (so-called ‘Sahel rainfall recovery’) is reflected in more rainy days (mostly over the northern and western parts of the Sahel), which includes the lengthening of wet spells (mostly over the western part of the Sahel). Additionally, the results are also in good agreement with the Bichet and Diedhiou [25] study, who showed from the CHIRPS dataset that the recent (1981–2014) increase in precipitation frequency over western Sahel (e.g., Senegal) is due to numerous and longer wet spells (at the expense of isolated wet days) separated by fewer and shorter dry spells. Elsewhere over the northern Sahel (e.g., Niger), [25] found that the increase in precipitation frequency was due to numerous isolated wet days and several but shorter wet spells (not observed in our case) separated by several but shorter dry spells. The clear increase in precipitation frequency observed over Senegal and Niger since 1981 (including shorter dry spells since 1981 and longer wet spells after 2005, Figure 4) suggests, as in [18], a clear decrease in drought conditions over the Sahel.
Similarly, the clear decrease in precipitation intensity (occurring at least partly under the form of numerous very wet days) found in this study suggests an agreement with [18] that the likelihood of floods has decreased since 1981 over the Sahel. Over the central-southern part of Senegal and the western part of Niger, however, this decrease only started around 2005.
Over Burkina Faso (transitional zone between the Sahel and the Guinea Coast), the results show that the significant increase in annual rainfall over 1981–2015 was due to an increase in precipitation frequency and intensity (including very wet days) despite the significant decrease in the maximum length of wet spells. In addition, the results show that the increase in precipitation occurs over the eastern (western) part of the country during the first (second) period and that the increase in very wet days occurs only after 2005 as seen in the study of [78]. The recent rainfall increases are probably due to the warming of the northern Atlantic Ocean which may have drawn the summer rains further north, increasing rainfall in the Sahel as shown by [79,80,81]. Hence, the results are in agreement with the authors of [77,82], who find a strong and significant recent recovery of rainfall in this country. However, the results also suggest an agreement with [18,83,84,85], for an increase in the likelihood of floods (recent increase in very wet days) and drought conditions (shorter wet spells and longer dry spells) over the southern and northern part of the Sahel. These regions already lack adequate infrastructure to withstand extreme weather conditions. In this region, it is worth noting that an increase in very wet days insinuates an increase in intense Mesoscale Convective Systems (MCSs) as they constitute the major contributor to annual rainfall totals [77]. In fact, [86] showed that the recent increase in moisture fluxes from the Atlantic Ocean may have fueled some of the recently observed extreme daily rainfalls related to MCSs events in the region, such as the 161 mm event in Ouagadougou (Burkina Faso) in 2009. Even though [82] showed that the increasing flood frequency over the Sahel is highly correlated with increasing rainfall intensity, it is important to keep in mind that the increase in flood risk in urban areas such as Ouagadougou is not solely related to heavy rainfall but also depends on human and environmental factors, such as land-use changes [39,42,77,87]. In addition, it was shown that, in this region, heavy rainfall events are essential to the occurrence of floods, but this condition appears to be insufficient. Other factors, such as the cumulative rainfall amount in days prior to flood events, topography and flows characteristics, are also very important [70].
In Côte d’Ivoire and Benin (Guinea Coast), the results show that the increase in annual rainfall over 1981–2015 (significantly only in Benin) results from a slight increase in precipitation frequency, shorter dry spells (despite shorter wet spells) and a slight increase in precipitation intensity that does not occur in the form of very wet days (no clear change in R95P). In Côte d’Ivoire, the results also show a clear shift in 2005, from less frequent (including longer dry spells over the south and shorter wet spells over the whole country) and more intense (including very wet days) rainfall (before 2005) to more frequent (including longer wet spells and shorter dry spells) and less intense (including very wet days) rainfall (after 2005). Such a shift is in good agreement with the authors of [70,71], who show that the different parts of Côte d’Ivoire are affected by gradual and abrupt changes, especially along the coastal region. It also suggests that after 2005, conditions have drastically changed to become more beneficial for the society (decrease in drought conditions, as suggested in [30] and in the likelihood of floods). A similar shift is observed in Benin, showing shorter dry spells and a decrease in precipitation intensity (including very wet days) after 2005. Finally, the results are in agreement with Sanogo et al. [77], who show that, over 1980–2010, the trends in ETCCDI indices related to extreme or intense precipitation, as well as precipitation frequency and wet and dry spells, are generally not significant over the Guinea Coast. According to the authors, this missing significance is partly related to the hiatus in rainfall increase in the 1990s, but also to the larger inter-annual rainfall variability. According to the results (strong switch in the hydro-climatic conditions in Côte d’Ivoire and Benin around 2005), this lack of significance may also result from the strong decadal variability observed in this region during this period (1980–2010).
At this point, it is worth reminding that in the CHIRPS dataset, the tendency (1981–2015) towards more (less) frequent and less (more) intense precipitation along the coast of the Guinea Coast (half of the stations inland) is not reproduced in the rain gauge stations. The results over the Guinea Coast should thus be carefully interpreted. We suggest that further studies regarding the recent trends in precipitation frequency and intensity over the Guinea Coast with additional observational datasets. Although the understanding of the mechanisms behind these observations is beyond the scope of this study, potential processes may include global warming, variations in sea surface temperatures, and organization of the MCSs. Future work is planned to investigate the associated changes in atmospheric circulation and the role of external forcing using regional climate models.

5. Conclusions

This article focused on the temporal and spatial variability of six annual ETCCDI climate indices over the period 1981–2015, in five countries (Senegal, Niger, Burkina Faso, Ivory Coast, and Benin). The results show that regional mean precipitation has increased in all five countries over the past 30 years. Over the Sahel area, we find that the reported ‘Sahel rainfall recovery’ results from an increase in precipitation frequency (including shorter dry spells since 1981 and longer wet spells after 2005), which suggests a clear decrease in drought incidences. A decrease in precipitation intensity (including very wet days) starting in 2005, however, indicates a decrease in the likelihood of floods and is limited to the central-southern part of Senegal and the western part of Niger. Over the transitional zone between the Sahel and the Guinea Coast, we found that the reported ‘Sahel rainfall recovery’ results from an increase in precipitation frequency and intensity but these did not explain the increase in the occurrence of floods (increase in very wet days) and droughts (shorter wet spells and longer dry spells). Lastly, over the Guinea Coast, the recent increase in precipitation hides a strong shift around 2005 from conditions that are potentially damaging to the society (rare but intense rainfall events) to conditions that are potentially beneficial for society (more frequent, longer and less intense events). Note that our results should be handled with a certain care, as satellite-based products have the tendency to underestimate intensity and overestimate frequency (e.g., see Section 2.3), which is expected to have consequences on the following indices investigated in our study: CDD, CWD, RR1, R95P, and SDII. However, additional analyses regarding the recent trends in precipitation frequency and intensity over the Guinea Coast should be conducted using additional observational datasets to evaluate the performance of the satellite products based on bias recorded in this specific zone.

Author Contributions

Conceptualization, D.A., L.M. and D.S.R.M.; Data curation and analysis, D.S.R.M., L.M., O.S. and D.A.; Formal analysis and Methodology, D.S.R.M., D.A., L.M., O.S. and B.A.; Validation, D.S.R.M., B.A. and D.A.; Writing—original draft, D.A., D.S.R.M. and L.M.; Writing—review & editing, K.K., L.M., B.A., D.A., C.H.S.J., K.K.C.A., C.T.J.H., O.S. and S.I. All authors have read and agreed to the published version of the manuscript.

Funding

The research leading to this publication has received funding from the NERC/DFID “Future Climate for Africa” through the AMMA-2050 project, grant number NE/M019969/1 and from AFD—CLIMSUCAF project (Convention IRS/ECO/N°499-2019).

Acknowledgments

The authors acknowledge the usage of the CHIRPS data set from the Climate Hazards Group (http://chg.geog.ucsb.edu/data/chirps). Additionally, this work has benefited from access to rainfall data sets provided by the AMMA-CATCH observatory, the AMMA international program, DMN Burkina, ANACIM, and DMN Niger; we sincerely thank all of them, as well as Geremy Panthou for his role in accessing the data and insights into the dataset, Moctar Camara (University Assane Seck of Ziguinchor, Senegal) and Ernest Amoussou (Université Abomey Calavi and University of Parakou, Benin) for their insights during the preliminary analyses and to Derrick Danso for helpful comments and English language improvements in the revised version. The daily station rain-gauge data are subject to third-party restrictions and are not freely available. We thank all the reviewers for their careful review and positive comments which helped to improve the manuscript.

Conflicts of Interest

The authors declare no conflict of interest.

References

  1. FAO. The Impact of Natural Hazards and Disasters on Agriculture, Food Security and Nutrition; FAO: Rome, Italy, 2015. [Google Scholar]
  2. Wade, C.T.; Touré, O.; Diop, M. Gestion des risques climatiques. In Recherche Pour des Futurs Résilients au Climat; IED: Dakar, Senegal, 2015; 96p. [Google Scholar]
  3. Nnomo, B.N. Contribution à L’actualisation des Normes Hydrologiques en Relation Avec les Changements Climatiques et Environnementaux en Afrique de L’ouest. These de Doctorat, à l’Université Pierre et Marie Curie, Paris, France, 2016. [Google Scholar]
  4. CEDEAO-CSAO/OCDE. Le climat et les changements climatiques. Atlas L’intégration Régionale Série Environ. 2008, 1, 1–24. [Google Scholar]
  5. Wallez, L. Inondations Dans les Villes d’Afrique de l’Ouest: Diagnostic et Elements de Renforcement des Capacites D’adaptation Dans le Grand Cotonou. Master’s Thesis, University of Technology of Troyes, Troyes, France, 2010. [Google Scholar]
  6. Few, R. Flooding, vulnerability and coping strategies: Local responses to a global threat. Prog. Dev. Stud. 2003, 3, 43–58. [Google Scholar] [CrossRef]
  7. IPCC. Summary for Policymakers. Climate Change 2014: Synthesis Report. Contribution of Working Groups I, II and III to the Fifth Assessment Report of the Intergovernmental Panel on Climate Change; IPCC: Geneva, Switzerland, 2014. [Google Scholar]
  8. Coppola, D.P. The management of disasters. In Introduction to International Disaster Management; Butterworth-Heinemann: Oxford, UK, 2015; pp. 1–35. [Google Scholar]
  9. IPCC. Summary for Policymakers. Climate Change, Mitigation of Climate Change Contribution of Working Group III to the Fifth Assessment Report of the Intergovernmental Panel on Climate Change; IPCC: Cambridge, UK; New York, NY, USA, 2014. [Google Scholar]
  10. Taylor, C.M.; Belušić, D.; Guichard, F.; Parker, D.J.; Vischel, T.; Bock, O. 1982 in satellite observations. Nature 2017, 544, 475–478. [Google Scholar] [CrossRef] [PubMed] [Green Version]
  11. Niang, I.; Ruppel, O.C.; Abdrabo, M.A.; Essel, A.; Lennard, C.; Padgham, J.; Urquhart, P.; Adelekan, I.; Archibald, S.; Balinga, M.; et al. Africa. In Climate Change 2014: Impacts, Adaptation, and Vulnerability. Part B: Regional Aspects. Contribution of Working Group II to the Fifth Assessment Report of the Intergovernmental Panel on Climate Change; Barros, V.R., Field, C.B., Dokken, D.J., Eds.; Mastrandre: Giulianova, Italy, 2014; pp. 1199–1265. [Google Scholar]
  12. Panthou, G.; Vischel, T.; Lebel, T. Short Communication Recent trends in the regime of extreme rainfall in the Central. Int. J. Clim. 2014, 34, 3998–4006. [Google Scholar] [CrossRef]
  13. Sylla, M.B.; Nikiema, P.M.; Gibba, P.; Kebe, I.; Klutse, N.A.B. Climate change over West Africa: Recent trends and future projections. In Adaptation to Climate Change and Variability in Rural West Africa; Yaro, J.A., Hesselberg, J., Eds.; Springer: Cham, Switzerland, 2016; pp. 25–40. [Google Scholar]
  14. Todzo, S.; Bichet, A.; Diedhiou, A. Intensification of the hydrological cycle expected in West Africa over the 21st century. Earth Syst. Dynam. 2020, 11, 319–328. [Google Scholar] [CrossRef] [Green Version]
  15. Alpert, P.; Baharad, A.; Ramis, C.; Homar, V.; Romero, R.; Manes, A. The paradoxical increase of Mediterranean extreme daily rainfall in spite of decrease in total values. Geophys. Res. Lett. 2002, 29, 1–4. [Google Scholar] [CrossRef] [Green Version]
  16. Alexander, L.V.; Zhang, X.; Peterson, T.C.; Caesar, J.; Gleason, B.; Klein Tank, A.M.G.; Haylock, M.; Collins, D.; Trewin, B.; Rahimzadeh, F.; et al. Global observed changes in daily climate extremes of temperature and precipitation. J. Geophys. Res. Atmos. 2006, 111, 1–22. [Google Scholar] [CrossRef] [Green Version]
  17. USAID. Climate Change Risk Profile West. Africa Sahel: Regional Fact. Sheet; USAID: Washington, DC, USA, 2017.
  18. Engel, T.; Fink, H.A.; Knippertz, P.; Pante, G. Extreme Precipitation in the West African Cities of Dakar and Ouagadougou: Atmo- spheric Dynamics and Implications for Flood Risk Assessments. J. Hydrometeorol. 2017, 18, 2937–2957. [Google Scholar] [CrossRef]
  19. ANP (Agence Nigérienne de Presse). 22 Décès et Près de 50.000 Sinistrés Dans des Inondations au Niger (Ministre). CA/MHM/ANP–0030 Août 2018. Available online: http://www.anp.ne/?q=printpdf/9927 (accessed on 24 September 2018).
  20. Tarhule, A. Damaging rainfall and flooding: The other Sahel hazards. Clim. Chang. 2005, 72, 355–377. [Google Scholar] [CrossRef]
  21. Paeth, H.; Hense, A. SST versus climate change signals in West African rainfall: 20th-century variations and future projections. Clim. Chang. 2004, 65, 179–208. [Google Scholar] [CrossRef]
  22. Boko, M.I.; Niang, A.; Nyong, C.; Vogel, A.; Githeko, M.; Medany, B.; Osman-Elasha, R.T. Africa. In Climate Change 2007: Impacts, Adaptation and Vulnerability. Contribution of Working Group II to the Fourth Assessment Report of the Intergovernmental Panel on Climate Change; Parry, M.L., Canziani, O.F., Palutikof, J.P., van der Linden, P.J., Hanson, C.E., Eds.; Cambridge University Press: Cambridge, UK, 2007; pp. 433–467. [Google Scholar]
  23. Nicholson, E.; Selato, C. The influence of la nina on african rainfall. Int. J. Climatol. 2000, 20, 1761–1776. [Google Scholar] [CrossRef]
  24. Konate, L.; Kouadio, B.H.; Djè, B.K.; Ake, G.E.; Guessan, V.H.N. Caractérisation des pluies journalières intenses et récurrences des inondations: Apport des totaux glissants trois (3) jours à la détermination d’une quantité seuil d’inondation (District d’Abidjan au Sud-Est de la Côte d’Ivoire ) Heavy dail. Int. J. Innov. Appl. Stud. 2016, 17, 990–1003. [Google Scholar]
  25. Bichet, A.; Diedhiou, A. West African Sahel has become wetter during the last 30 years, but dry spells are shorter and more frequent. Clim. Res. 2018, 75, 155–162. [Google Scholar] [CrossRef] [Green Version]
  26. Panthou, G.; Lebel, T.; Vischel, T.; Quantin, G.; Sane, Y.; Ba, A.; Ndiaye, O.; Diongue-Niang, A.; Diopkane, M. Rainfall intensification in tropical semi-arid regions: The Sahelian case. Environ. Res. Lett. 2018, 13, 064013. [Google Scholar] [CrossRef]
  27. Paeth, H.; Fink, A.H.; Pohle, S.; Keis, F.; Mächel, H.; Samimi, C. Meteorological characteristics and potential causes of the 2007 flood in sub-Saharan Africa. Int. J. Climatol. 2011, 31, 1908–1926. [Google Scholar] [CrossRef]
  28. Nicholson, C.F.; Sharon, E.; Andreas, H. Assessing recovery and change in West Africa’s rainfall regime from a 161-year record. Int. J. Climatol. 2018, 38, 1–17. [Google Scholar] [CrossRef]
  29. Kouadio, K.; Bastin, S.; Konare, A.; Ajayi, V.O. Does convection-permitting simulate better rainfall distribution and extreme over Guinean coast and surroundings? Clim. Dyn. 2018, 1–24. [Google Scholar] [CrossRef]
  30. Bichet, A.; Diedhiou, A. Less frequent and more intense rainfall along the coast of the Gulf of Guinea in West and Central Africa (1981–2014). Clim. Res. 2018, 76, 191–201. [Google Scholar] [CrossRef] [Green Version]
  31. Zhang, X.; Alexander, L.; Hegerl, G.C.; Jones, P.; Tank, A.K.; Peterson, T.C.; Trewin, B.; Zwiers, F.W. Indices for monitoring changes in extremes based on daily temperature and precipitation data. Wiley Interdiscip. Rev. Clim. Chang. 2011, 2, 851–870. [Google Scholar] [CrossRef]
  32. Funk, C.; Peterson, P.; Landsfeld, M.; Pedreros, D.; Verdin, J.; Shukla, S.; Husak, G.; Rowland, J.; Harrison, L.; Hoell, A.; et al. The climate hazards infrared precipitation with stations—A new environmental record for monitoring extremes. Sci. Data 2015, 2, 1–21. [Google Scholar] [CrossRef] [Green Version]
  33. Aghakouchak, A.; Behrangi, A.; Sorooshian, S.; Hsu, K.; Amitai, E. Evaluation of satellite—retrieved extreme precipitation rates across the central United States. J. Geophys. Res. 2011, 116, 1–11. [Google Scholar] [CrossRef]
  34. Hur, J.; Raghavan, S.V.; Nguyen, N.S.; Liong, S. Evaluation of high-resolution satellite rainfall data over singapore. Proc. Eng. 2016, 154, 158–167. [Google Scholar] [CrossRef] [Green Version]
  35. Groisman, P.Y.; Knight, R.W.; Easterling, D.R.; Karl, T.R.; Hegerl, G.C. Trends in Intense Precipitation in the Climate Record. J. Clim. 2005, 18, 1326–1350. [Google Scholar] [CrossRef]
  36. New, M.; Hewitson, B.; Stephenson, D.B.; Tsiga, A.; Kruger, A.; Manhique, A.; Gomez, B.; Coelho, C.A.S.; Masisi, D.N.; Kululanga, E.; et al. Evidence of trends in daily climate extremes over southern and west Africa. J. Geophys. Res. Atmos. 2006, 111, 1–11. [Google Scholar] [CrossRef]
  37. Redelsperger, J.; Thorncroft, C.D.; Diedhiou, A.; Lebel, T.; Parker, D.J.; Polcher, J. African monsoon multidisciplinary analysis (AMMA): An international research project and field campaign. Bull. Am. Meteorol. Soc. 2006, 87, 1739–1746. [Google Scholar] [CrossRef] [Green Version]
  38. Ardoin-Bardin, S. Variabilité Hydroclimatique et Impacts sur les Ressources en Eau de Grands Bassins Hydrographiques en Zone Soudano-Sahélienne. Ph.D. Thesis, Sciences Et Techniques Du Languedoc T, Université Montpellier II, Montpellier, France, 2004. [Google Scholar]
  39. Lienou, G. Impacts de la Variabilité Climatique sur les Ressources en Eau et les Transports de Matières en Suspension de Quelques Bassins Versants Représentatifs au Cameroun. Ph.D. Thesis, Universite De Yaounde I, Yaounde, Cameroon, 2007. [Google Scholar]
  40. Sultan, B.; Roudier, P.; Quirion, P.; Alhassane, A.; Muller, B.; Dingkuhn, C.; Baron, M. Assessing climate change impacts on sorghum and millet yields in the Sudanian and Sahelian savannas of West Africa. Environ. Res. Lett. 2013, 8, 014040. [Google Scholar] [CrossRef]
  41. Lamptey, B. An analytical framework for estimating the urban effect on climate. Int. J. Climatol. 2009, 30, 72–88. [Google Scholar] [CrossRef]
  42. Poméon, B.; Jakisch, T.; Diekkrüger, D. Evaluating the performance of remotely sensed and reanalysed precipitation data over West Africa using HBV light. J. Hydrol. 2017, 547, 222–235. [Google Scholar] [CrossRef]
  43. Nile, B.; Bayissa, Y. Evaluation of Satellite-Based Rainfall Estimates and Application to Monitor Meteorological Drought for. Remote Sens. Artic. 2017, 9, 1–17. [Google Scholar]
  44. Panthou, G.; Vischel, T.; Lebel, T.; Blanchet, J.; Quantin, G.; Ali, A. Extreme rainfall in West Africa: A regional modeling. Water Resour. Res. 2012, 48, W08501. [Google Scholar] [CrossRef]
  45. Caroletti, G.N.; Coscarelli, R.; Caloiero, T. Validation of Satellite, Reanalysis and RCM Data of Monthly Rainfall in Calabria (Southern Italy). Remote Sens. 2019, 11, 1625. [Google Scholar] [CrossRef] [Green Version]
  46. Trenberth, K.E.; Dai, A.; Rasmussen, R.M.; Parsons, D.B. The changing character of precipitation. Bull. Am. Meteorol. Soc. 2003, 84, 1205–1217. [Google Scholar] [CrossRef]
  47. Sen, P.K. Estimates of the Regression Coefficient Based on Kendall’s Tau. J. Am. Stat. Assoc. 1968, 63, 1379–1389. [Google Scholar] [CrossRef]
  48. Froidurot, S.; Diedhiou, A. Characteristics of wet and dry spells in the West African. Atmos. Sci. Lett. 2017, 131, 125–131. [Google Scholar] [CrossRef]
  49. World Meteorological Organization. Guidelines on Analysis of Extremes in a Changing Climate in Support of Informed Decisions for Adaptation; World Meteorological Organization: Geneva, Switzerland, 2009. [Google Scholar]
  50. Sultan, B.; Roudier, P.; Traore, S. Chapitre 10. Les impacts du changement climatique sur les rendements agricoles en Afrique de l’Ouest. In Les sociétés rurales face aux changements climatiques et environnementaux en Afrique de l’Ouest; IRD Editions: Marseille, France, 2017; pp. 209–225. [Google Scholar]
  51. Noblet, M.; Faye, A.; Camara, I.; Seck, A.; Sadio, M.; Bah, A. Etat des lieux des connaissances scientifiques sur les changements climatiques pour les secteurs des ressources en eau, de l’agriculture et de la zone côtière au Sénégal. In Report produced under the project “Projet d’Appui Scientifique aux processus de Plans Nationaux d’Adaptation dans les pays francophones les moins avancés d’Afrique subsaharienne”; Climate Analytics GmbH: Berlin, Germany, 2018; 76p. [Google Scholar]
  52. Bodian, A. Caractérisation de la variabilité temporelle récente des précipitations annuelles au Sénégal (Afrique de l’Ouest). Phys.-Géo 2014, 8, 297–312. [Google Scholar] [CrossRef]
  53. Descroix, L.; Diongue, N.A.; Panthou, G.; Bodian, A.; Sane, Y.; Dacosta, H.; Quantin, G. Évolution récente de la pluviométrie en Afrique de l’Ouest à travers deux régions: La Sénégambie et le bassin du Niger moyen. Climatologie 2015, 12, 25–43. [Google Scholar] [CrossRef] [Green Version]
  54. FAO (Food and Agriculture Organization of the United Nations). Profil national genre des secteurs de l’agriculture et du développement rural-Sénégal. In Série des Évaluations Genre des Pays; FAO: Dakar, Senegal, 2018; 108p. [Google Scholar]
  55. ANSD (Agence Nationale de la Statistique et de la Demographie). Situation Economique et Sociale du Senegal en 2015; ANSD: Dakar, Senegal, 2018; 10p. [Google Scholar]
  56. Faye, A.; Camara, I.; Noblet, M.; Mboup, S. Evaluation de la vulnérabilité du secteur agricole à la variabilité et aux changements climatiques dans la région de Fatick Secteur: Agriculture. In Report produced under the project “Projet d’Appui Scientifique aux processus de Plans Nationaux d’Adaptation dans les pays francophones les moins avancés d’Afrique subsaharienne”; Climate Analytics gGmbH: Berlin, Germany, 2019; 100p. [Google Scholar]
  57. PDDAA (Programme Détaillé du Développement de l’Agriculture Africaine). Rapport sur l’évaluation de la déclaration de Maputo dans le secteur agricole: Cas du Niger; PDDAA: Ouagadougou, Burkina Faso, 2014; 103p. [Google Scholar]
  58. Dezetter, A. Impacts climatiques sur les ressources en eau en Afrique de l’Ouest; 10e École d’été de l’IEPF et du SIFÉE Du 6 au 10 juin 2006: Bamako, Mali, 2006; 50p. [Google Scholar]
  59. UNEP (Programme des Nations Unies pour l’environnement). Sécurité des Moyens de Subsistance: Le Changement Climatique, les Migrations et les Conflits au Sahel; UNEP: Nairobi, Kenya, 2011; 112p. [Google Scholar]
  60. Banque Mondiale. Évaluation des Risques du Secteur Agricole au Niger: De la Réaction aux Crises à la Gestion des Risques à Long Terme. Assistance Technique; Rapport Numero 74322-NA; Département Agriculture et Services Environnementaux (AES); Unité Agriculture, Développement Rural et Irrigation: Washington, DC, USA, 2013; 96p. [Google Scholar]
  61. DGPAAT (Direction Générale Des Politiques Agricole, Agroalimentaire et des Territoires). Les Politiques Agricoles à Travers le Monde: Quelques Exemples; DGPAAT: Paris, France, 2014; 6p. [Google Scholar]
  62. Banque Mondiale. Burkina Faso: L’agriculture, un Puissant Instrument de Réduction de la Pauvreté. Available online: https://www.banquemondiale.org/fr/results/2017/06/29/burkina-faso-agriculture-as-a-powerful-instrument-for-poverty-reduction (accessed on 31 May 2020).
  63. INSD (Institut National de la Statistique et de la Démographie). Annuaire statistique 2016, Burkina Faso; INSD: Ouaga, Burkina Faso, 2017; 370p. [Google Scholar]
  64. PAM (Programme Alimentaire Mondial des Nations Unies). Analyse Globale de la Vulnérabilité, de la Sécurité Alimentaire et de la Nutrition (AGVSAN), Burkina Faso; PAM: Rome, Italy, 2014; 108p. [Google Scholar]
  65. Sorgho, Z. L’Economie agricole du Burkina Faso: Un potentiel de développement; Editions Baudelaire: Lyon, France, 2010; 163p. [Google Scholar]
  66. MAFAP (Monitoring and Analysing Food and Agricultural Policies). Revue des Politiques Agricoles et Alimentaires au Burkina Faso; Série rapport pays SPAAA; FAO: Rome, Italy, 2013; 234p. [Google Scholar]
  67. Ministère de l’Agriculture, de l’Hydraulique et des Ressources Halieutiques et des Représentants des Chambres Régionales d’Agriculture et des Organisations Paysannes. Analyse de la filière maraichage au Burkina Faso; Module EASYPol 107; FAO: Ouagadougou, Burkina Faso, 2007; 127p.
  68. Goula, B.T.A.; Kouassi, V.J.; Savane, I. Impacts du changement climatique sur les ressources en eau en zone tropicale humide: Cas du bassin versant du Bandama en Côte d’Ivoire. Agron. Afr. 2006, 18, 1–11. [Google Scholar] [CrossRef] [Green Version]
  69. Banque Mondiale. Situation Economique en Côte D’ivoire: Que la Route Soit Bonne, Ameliorer la Mobilité Urbaine à Abidjan. Huitieme Edition; 2019; 64p, Available online: https://documents.worldbank.org/en/publication/documents-reports/documentdetail/624341549322162402/que-la-route-soit-bonne-am%c3%a9liorer-la-mobilit%c3%a9-urbaine-%c3%a0-abidjan (accessed on 17 June 2020).
  70. Goula, A.; Tie, B.I.; Konan, B.; Brou YA, O.T.; Fadika, V.; Srohourou, B. Estimation des pluies exceptionnelles journalières en zone tropicale: Cas de la Côte d’Ivoire par comparaison des lois lognormale et de Gumbel Estimation des pluies exceptionnelles journalières en zone tropicale: Cas de la Côte d’Ivoire par comparai. Hydrol. Sci. J. 2007, 52, 49–67. [Google Scholar]
  71. Goula, B.T.A.; Soro, E.G.; Kouassi, W.; Srohourou, B. Tendances et ruptures au niveau des pluies journalières extrêmes en Côte d’Ivoire (Afrique de l’Ouest). Hydrol. Sci. J. 2012, 57, 1067–1080. [Google Scholar] [CrossRef] [Green Version]
  72. Akponikpe, P.B.I.; Tovihoudji, P.; Lokonon, B.; Kpadonou, E.; Amegnaglo, J.; Segnon, A.C.; Yegbemey, R.; Hounsou, M.; Wabi, M.; Totin, E.; et al. Etude de Vulnérabilité aux Changements Climatiques du Secteur Agriculture au Bénin. Report Produced under the project “Projet d’Appui Scientifique aux processus de Plans Nationaux d’Adaptation dans les Pays Francophones les Moins Avancés d’Afrique Subsaharienne; Climate Analytics gGmbH: Berlin, Germany, 2019; 101p. [Google Scholar]
  73. CIRAD (Centre de Cooperation Internationale en Recherche Agronomique pour le Développement). Production et Valorisation du Maïs à’ L’échelon Villageois en Afrique de L’ouest; CIRAD: Paris, France, 1995. [Google Scholar]
  74. UEMOA (Union Economique et Monetaire Ouest Africaine). Rapport 2015 de la Surveillance Commerciale dans L’espace; UEMOA: Dakar, Senagal, 2015; 64p. [Google Scholar]
  75. Ministre de l’Environnement, de l’Habitat et de l’Urbanisme. Deuxieme Communication Nationale de la Republique du Benin sur les Changements Climatiques; MEHU-UNDP: Cotonou, Benin, 2011; 168p. [Google Scholar]
  76. Sy, A.; Duroure, C.; Baray, J.-L.; Gour, Y.; Baelen, J.V.; Diop, B. Space-Time Variability of the Rainfall over Sahel: Observation of a Latitudinal Sharp Transition of the Statistical Properties. Atmosphere 2018, 9, 482. [Google Scholar] [CrossRef] [Green Version]
  77. Sanogo, S.; Fink, A.H.; Omotosho, J.A.; Ba, A.; Redl, R.; Ermert, V. Spatio-temporal characteristics of the recent rainfall recovery in West Africa. Int. J. Climatol. 2015, 35, 4589–4605. [Google Scholar] [CrossRef]
  78. De Longueville, P.; Hountondji, F.; Kindo, Y.C.; Gemenned, I.; Ozer, F. Long-term analysis of rainfall and temperature data in Burkina Faso (1950–2013). Int. J. Climatol. 2016, 36, 4393–4405. [Google Scholar] [CrossRef]
  79. Hoerling, M.; Hurrell, J.; Eischeid, J.; Phillips, A. Detection and Attribution of Twentieth-Century Northern and Southern African Rainfall Change. J. Clim. 2006, 19, 3989–4008. [Google Scholar] [CrossRef]
  80. USAID. A Climate Trend Analysis of Burkina Faso. Famine Early Warning Systems Network—Informing Climate Change Adaptation Series. Publ. Support. Provid. Roll. Publ. Serv. Cent. 2012, 1–4. [Google Scholar] [CrossRef]
  81. Crawford, A.; Price-Kelly, H.; Terton, A.; Echeverría, D. Review of Current and Planned Adaptation Action in Burkina Faso. CARIAA Working Paper no. 17; International Development Research Centre: Ottawa, ON, Canada; UK Aid: London, UK, 2016. [Google Scholar]
  82. Barry, A.A.; Caesar, J.; Klein Tank, A.M.G.; Aguilar, E.; McSweeney, C.; Cyrille, A.M.; Nikiema, M.P.; Narcisse, K.B.; Sima, F.; Stafford, G.; et al. West Africa climate extremes and climate change indices. Int. J. Climatol. 2018, 38, e921–e938. [Google Scholar] [CrossRef]
  83. Sarr, B.; Kafando, L. Identification des risques climatiques de la culture du maïs au Burkina Faso. Int. J. Biol. Chem. Sci. 2011, 5, 1659–1675. [Google Scholar] [CrossRef]
  84. Fowe, T.; Abdoulaye, D.; Rodrigue, F.K.; Boubacar, I.; Maïmouna, B.; Traoré, H.K. Trends in flood events and their relationship to extreme rainfall in an urban area of Sahelian West Africa: The case study of Ouagadougou, Burkina Faso. J. Flood Risk Manag. 2018. [Google Scholar] [CrossRef] [Green Version]
  85. Ibrahim, B.; Polcher, J.; Karambiri, H. Characterization of the rainy season in Burkina Faso and it’s representation by regional climate models Characterization of the rainy season in Burkina Faso and it’s representation by regional climate models. Clim. Dyn. 2012, 39, 1287–1302. [Google Scholar] [CrossRef] [Green Version]
  86. Samson, M.H.; Cook, K.H. Ocean Warming and Late-Twentieth-Century Sahel Drought and Recovery. J. Clim. 2008, 21, 3797–3814. [Google Scholar]
  87. Nicholson, S.E. The ITCZ and the Seasonal Cycle over Equatorial Africa. Bull. Am. Meteorol. Soc. 2018, 99, 337–348. [Google Scholar] [CrossRef]
Figure 1. Map of West Africa indicating the countries included in the study (Senegal, Niger, Ivory Coast, Benin, and Burkina Faso). Numbers represent the total annual rainfall (mm/year) between two isohyets (Northern/Southern). This region stretches from the semi-arid Sahel, on the southern fringes of the Sahara Desert, down to the moist tropical conditions bordering the Gulf of Guinea.
Climate 08 00084 g001
Figure 2. Comparison of monthly rain gauge stations and the corresponding nearest grid points in the Climate Hazards Group InfraRed Precipitation with Station (CHIRPS) dataset for the considered five stations. Each colored dot represents a month, and the gray shaded area around the line represents the 95% confidence interval around the regression line.
Climate 08 00084 g002
Figure 3. Comparison of the monthly mean rain gauge stations and the corresponding nearest grid points in the CHIRPS dataset for the considered five stations.
Climate 08 00084 g003
Figure 4. Time evolution of PRCPTOT (mm), RR1 (days), CWD (days), CDD (days), R95P (mm), and SDII (mm/day), averaged over (a) Senegal and (b) Niger. The red line corresponds to the linear regression in the time series (1981–2015) and the blue curve corresponds to the best fit of the weighted least squares, shown as the best line with the minimal distance from the data.
Climate 08 00084 g004
Figure 5. Time evolution of PRCPTOT (mm), RR1 (days), CWD (days), CDD (days), R95P (mm), and SDII (mm/day), averaged over Burkina Faso. The red line corresponds to the linear regression in the time series (1981–2015) and the blue curve corresponds to the best fit of the weighted least squares, shown as the best line with the minimal distance from the data.
Climate 08 00084 g005
Figure 6. Time evolution of PRCPTOT (mm), RR1 (days), CWD (days), CDD (days), R95P (mm), and SDII (mm/day), averaged over a) Côte d’Ivoire and b) Benin. The red line corresponds to the linear regression in the time series (1981–2015) and the blue curve corresponds to the best fit of the weighted least squares, shown as the best line with the minimal distance from the data.
Climate 08 00084 g006
Figure 7. Spatial patterns of precipitation indices over Senegal: mean over the reference decade 1986–1995 (first column); change over the 1996–2005 decade (second column) and changes over the 2006–2015 decade relative to the reference decade (third column). Areas with symbol (x) are significant at a 95% confidence level.
Climate 08 00084 g007
Figure 8. Spatial patterns of precipitation indices over Niger: mean over the reference decade 1986–1995 (first column); change over the 1996–2005 decade (second column) and changes over the 2006–2015 decade relative to reference decade (third column). Areas with the symbol (x) are significant at a 95% confidence level.
Climate 08 00084 g008
Figure 9. Spatial patterns of precipitation indices over Burkina-Faso: mean over reference decade 1986–1995 (first column); change over the 1996–2005 decade (second column) and changes over the 2006–2015 decade relative to the reference decade (third column). Areas with the symbol (x) are significant at a 95% confidence level.
Climate 08 00084 g009
Figure 10. Spatial patterns of precipitation indices over Côte d’Ivoire: mean over the reference decade 1986–1995 (first column); change over the 1996–2005 decade (second column) and changes over the 2006–2015 decade relative to the reference decade (third column). Areas with the symbol (x) are significant at a 95% confidence level.
Climate 08 00084 g010
Figure 11. Spatial patterns of precipitation indices over Benin: mean over the reference decade 1986–1995 (first column); change over the 1996–2005 decade (second column) and changes over 2006–2015 decade relative to the reference decade (third column). Areas with the symbol (x) are significant at a 95% confidence level.
Climate 08 00084 g011
Table 1. Data used for validation.
CountryStation NameLatitudeLongitudeAltitude (m)PeriodMissing Value (%)
SénégalDakar14.73−17.5281998–20107.92
Burkina-FasoOuagadougou12.35−1.523061998–201011.86
NigerNiamey13.482.172341998–20108.07
Côte d’IvoireAdiake5.3−3.3401998–20100
BeninCotonou6.352.38061998–201014.6
Table 2. Definition of the six Expert Team on Climate Change Detection and Indices (ETCCDI) rainfall-based indices used in the study.
IndexDescription NameDefinitionUnits
PRCPTOTTotal annual precipitationtotal precipitation amount of wet daysmm
RR1Annual number of wet daysAnnual count of wet daysdays
CWDMaximum consecutive wet daysMaximum number of consecutive wet daysdays
CDDMaximum consecutive dry daysMaximum number of consecutive dry daysdays
R95PVery wet daysTotal annual precipitation accumulated above the 95th percentile of 1981–2015mm
SDIISimple daily intensity indexTotal annual precipitation averaged over wet daysmm/day
Table 3. Trend and mean values of PRCPTOT (mm per year and mm, respectively), RR1 (days per year and days, respectively), CWD (days per year and days, respectively), CDD (days per year and days, respectively), R95P (mm per year and mm, respectively), and SDII (mm/day per year and mm/day, respectively) averaged over each country. The significant results are indicated with the symbols ‘*’ when the Mann–Kendall test is highly significant (99% confidence level) and ‘**’ when it is significance (95% confidence level).
1981–2015
SenegalNigerBurkina FasoCôte d’IvoireBenin
TrendMeanTrendMeanTrendMeanTrendMeanTrendMean
PRCPTOT0.3681599.04 *0.2941175.73 *0.3815753.51 *0.05881297.330.12611080.9
RR10.522752.40 *0.431922.479 *0.28477.01 *0.0387106.550.126101.07
CWD0.30423.36 *0.33111.61 *−0.04873.40−0.01852.78−0.1763.84
CDD−0.47567.90 *−0.502517.26 *−0.45884.99 *−0.07510.010.05555.54
R95P−0.146226.73−0.301913.35 *−0.052127.74−0.001743.230.03530.77
SDII−0.0146211.10−0.28746.95 *0.25049.67 **0.072312.170.270610.75 **

