Article

On the Efficiency of Using Transpiration Cooling to Mitigate Urban Heat

1
Faculty of Built Environment, University of New South Wales, Sydney 2052, Australia
2
Anita Lawrence Chair on High Performance Architecture, Faculty of Built Environment, University of New South Wales, Sydney 2052, Australia
*
Author to whom correspondence should be addressed.
Climate 2020, 8(6), 69; https://doi.org/10.3390/cli8060069
Submission received: 19 April 2020 / Revised: 28 May 2020 / Accepted: 29 May 2020 / Published: 1 June 2020

Abstract

:
Trees are considered to be effective for the mitigation of urban overheating, and the cooling capacity of trees mainly comes from two mechanisms: transpiration and shading. This study explores the transpiration cooling of large trees in urban environments where the sea breeze dominates the climate. In the experiment, sap flow sensors were used to measure the transpiration rate of two large trees located in Sydney over one year. Also, the temperature difference between the inside and outside of the canopy, as well as the vertical temperature distribution below the canopy, were measured during summer. In this experiment, the temperature under the canopies decreased by about 0.5 degrees from a 0.5 m height to a 3.5 m height, and the maximum temperature difference between the inside and outside of the canopy was about 2 degrees. After applying a principal component analysis of multiple variables, we found that when a strong sea breeze is the primary cooling mechanism, the sap flow still makes a considerable contribution to cooling. Further, the sea breeze and the transpiration cooling of trees are complementary. In conclusion, the characteristics of synoptic conditions must be fully considered when planting trees for mitigation purposes. Since the patterns of sea breeze and sap often do not coincide, the transpiration cooling of trees is still effective when the area is dominated by sea breeze.

Graphical Abstract

1. Introduction

Climate change and the urban heat island effect have caused a worldwide issue of urban overheating [1]. Urban overheating will increase the total energy consumption and peak electricity demands, thereby deteriorating outdoor and indoor thermal comfort, as well as the health of the public [2,3,4]. In order to mitigate urban overheating, researchers have proposed a variety of options: integrating cool materials, such as reflective materials [5] and radiative cooling surfaces, into facades and roofs [6]; using cool pavement on roads [4,7]; and expanding green spaces in the urban environment [8].
In the past few decades, the mitigation effect of trees has been proven effective by a large number of studies [9,10,11]. The difference between the ambient temperature and the temperature in the canopy is usually used as an essential indicator of plant cooling capacity. For instance, the daily average difference of the air temperature between the shady area of a street tree and an open space is 0.9 °C in Melbourne, Australia [12]; 1 °C in Munich, Germany [13]; and up to 2.8 °C in Southeast Brazil [14]. The cooling effect of trees mainly comes from shading and transpiration. The cooling effect caused by shading at a macroscopical level is very limited, as the albedo of the tree canopy is very similar to that of the ground surface, indicating that the total energy balance is not significantly affected by the presence of trees. Transpiration, on the other hand, alters the energy balance of the whole area by converting sensible heat flux to latent heat flux and has a cooling effect both locally and on a large scale. When sufficient water is supplied, the transpiration rate can be maximized, providing a considerable cooling effect. Plenty of studies have shown that the air temperature over vegetated land is significantly reduced after applying irrigation [15,16,17].
Since research in forestry and agronomy usually focuses on large-scale crops and woodland, the heat flux over the land is easier to quantify to determine the transpiration cooling effect. However, in cities, where the surface is highly heterogeneous, the heat flux method is not suitable. Existing studies on urban tree cooling often use the sap flow method to measure the transpiration rate of a single tree or a small number of trees.
When switching to microscale studies, the transpiration cooling effect of urban trees can be explored more in depth. Researchers have found that the cooling effect of trees is closely related to their species [18,19,20] and hydraulic architecture. The leaf area index (LAI) is considered to be a particularly critical parameter that determines the cooling capacity of trees. Trees with a high LAI can achieve more efficient shading and exhibit higher transpiration potential.
However, microscale studies also face difficulties. The temperature difference indicator reflects the cooling capacity of a plant to a certain extent, but this indicator can be environmentally sensitive. Remoting sensing research [21] has found that in the core areas of several U.S. cities, the urban tree cooling effect was significantly affected by the surrounding thermal conditions. Compared with studies in forestry, experiments conducted in cities usually found larger temperature decreases under the canopy. For instance, an experiment in the Munich urban area [22] reported that under the canopy, temperature reduced by 3.5 degrees, from 0.5 m above the ground to 4 m above the ground. However, in a Picea abies L. forest, research [23] found that the temperature only reduces by one degree every 4 m vertically under the canopy. Possibly, the warming effect of the paved street prevented the downward penetration of the tree cooling effect in the experiment conducted in Munich [22]. This possibility emphasizes the influence of the energy balance of the local environment on the magnitude of the vertical temperature difference. Moreover, since a tree cooling mechanism differs from that of short vegetation, the vertical temperature cannot be used as the only indicator for transpirational cooling. Short vegetation directly provides cooling on the ground, while the transpiration cooling effect of trees needs to penetrate several meters to reach the ground from the canopy. The overall cooling performance is determined only after determining both the vertical temperature difference and the horizontal temperature difference between the inside and outside of the canopy.
At the same time, weather conditions could also affect the cooling effects of trees [24]. The research in [21] observed the variation of the urban tree cooling effect under different climatic conditions, and in [25], more effective cooling was observed from trees in the dessert compared to trees on the coast. In scenarios where strong advection exists, the temperature difference under the canopy in the vertical direction and that between the inside and outside of the canopy may be affected. On the one hand, if the wind is dry and hot, the vapour pressure deficit (VPD) in the canopy will increase, and transpiration cooling will be stimulated [26]. However, continuous dry and hot wind will also blow away the cold air that is mass-produced by the trees [27]. On the other hand, if the wind is cold and humid, such as a sea breeze, transpiration can be weakened. At the same time, the canopy can directly block the wind, making it receive less cold from the wind compared to that received by the outside. If the space outside the canopy is also shaded, the temperature under the canopy can be even hotter than that outside. This possible phenomenon indicates that the effect of the wind may completely offset the cooling effect of transpiration. However, the effect of sea breeze on the cooling of trees has not been sufficiently studied, and many issues remain unclear. For example, in cities where the sea breeze is the dominant cooling mechanism, does planting more trees have an obvious cooling effect? How much tree cooling contributes to local temperature distribution? Answering such questions is crucial for mitigating overheating in coastal cities.
At the same time, some cities are affected by both desert and marine climates, such as Sydney, Australia. In Sydney, a synoptic condition exists where the east side of Sydney is adjacent to the Pacific Ocean and is affected by strong humid and cold sea breeze, while the west side of Sydney faces a vast desert and is influenced by the dry and hot desert winds. If a large number of trees are planted to alleviate urban overheating in the city, how should we arrange these trees spatially to achieve the most effective cooling? An analysis of the impact of sea breeze on tree cooling can help answer this question.
In this paper, when discussing the effect of the transpiration cooling of big trees, weather station data are used to include the impact of Sydney’s synoptic conditions, and the temperature difference between the inside and outside of the canopy was measured. The experimental site in this paper is about 2 km away from the coastline and is significantly affected by the sea breeze. As the elevation of the experimental site is higher than that of the eastern coast, the sea breeze can easily reach this area. Thus trees here are significantly affected by the sea breeze. After obtaining the transpiration rate, temperature difference, and wind speed, a principal component analysis (PCA) was used to determine the contribution of transpiration to the temperature difference inside and outside the canopy. At the same time, this research also studies the factors that affect the transpiration rates of plants. The results show that the sea breeze does play a crucial role in ooling, and sap flow also makes a considerable contribution to cooling. The analysis also shows that the daily peaks of sea breeze and sap flow do not overlap, indicating that the introduction of trees in coastal cities can complement the cooling of the sea breeze. This result answers the above questions and affirms the plant’s cooling potential under sea breeze conditions.
In the study, attention was also paid to the vertical temperature gradient below the tree, and the influence of the ground surface on the vertical temperature distribution was discussed according to the measurement results. This result further emphasizes the effect of the ground surface on the cooling capacity of trees and highlights that when measuring the cooling effect of trees in a microenvironment, the vertical temperature difference cannot be used as the only criterion to assess the cooling capacity of plants; the assessments should instead be made after correcting the possible impact of the surface. We believe that this study makes an important contribution to rationalizing the layout of urban greenery to achieve a better mitigation effect.

2. Methods

2.1. Experiment Design

In order to analyse the transpiration cooling effects of large urban trees, the transpiration rate and surrounding temperature of two large Melaleuca trees were measured. The transpiration rate was measured using sap flow sensors. The studied site was located on campus at the University of New South Wales in Sydney.
The recording of sap flow and soil moisture began in early 2018 and continued until May 2019. To obtain an understanding of the trees’ cooling effect, multiple temperature sensors were placed under the canopies and outside the canopies of Maleluca from January 2019 to March 2019. The temperature sensors were placed outside canopy. Since aluminum foil was also proven to be an effective solar protection measure in [28], we used it to shield the sensors from direct solar radiation. At the same time, the vertical air temperature distribution under the canopies was recorded for 2 weeks in the middle of February 2019. The weather data were extracted from the nearest weather station.

2.2. Measurement Set Up

2.2.1. Site Details

Two almost-identical Melaleuca trees were investigated, as shown in Figure 1. The lawn at the university of New South Wales (UNSW) campus has dense grass and is regularly irrigated. Hence, the soil in the studied site has remained moist for the entire period of measurement, ensuring that the transpiration of trees is not limited by soil water content.
The essential information of the studied trees is measured and listed in Table 1. The canopy of the trees starts at around 3 m of height. Site weather data were extracted from the nearest weather station (Randwick weather station, 33.92° S, 151.2° E), which is in similar condition to the experimental site. The vapour pressure deficit used in our experiment was calculated from the vapour pressure and saturated vapour pressure of the weather station observations. The air temperature, wind direction, and speed were also extracted from the station observation. The site soil surface moisture and soil surface temperature was monitored at 5 cm beneath the soil surface using an Edaphic TEROS-11 model sensor.

2.2.2. Sap Flow Method

In this study, the transpiration rate of trees was reflected by the sap flow rate, and we used Edaphic SF3 model heat pulse sensors to record the sap flow rate. The sap flow rate was recorded in a 30 min time interval, which provided a balance between battery life and experimental accuracy. A sensor was installed on the north side of each tree.
The sensor used analog signals to record the time, and the sensor received the heat pulse signal after the heat pulse was generated from the heat source. Both the sap flow data and soil moisture were recorded using a CR100 datalogger from Campbell Science.
In order to obtain more accurate sap flow data, two methods were used to calculate the sap flow velocity. The Marshall heat pulse method [29] was applied to calculate the slow sap flow rate, while the T-max method [30] was used to calculate the high sap flow rate. The T-max method is written as
V h = x 2 4 k t m t m ,
where V h is the heat pulse velocity(cm/hr), x is the distance to the axial temp, k is the thermal diffusivity, and t m is the time it takes the sensor to reach its max temperature after a heat pulse is generated by a heater.
To calculate the slow sap flow rate, the heat pulse method was used, which is written as
V h = k x ln ( Δ T d Δ T u ) ,
where Δ T d and Δ T u are the temperature changes recorded by the upstream sensors and downstream sensors, respectively. Later, the heat pulse velocity was transformed into sap flow velocity. Since we were unable to obtain a trunk sample from the studied trees, the calculated sap flow rate was not calibrated. Therefore, the analysis of sap flows only focused on patterns.

2.2.3. Temperature Measurement

The Log tag sensors were used to record the air temperature. Two Log tag temperature sensors were set up and fixed at around 1.5 m height under the canopies; they were attached to the trunk on the south side to avoid direct sunlight. Two other Log tag sensors were placed outside the canopy at the same height as the sensors inside canopy. All Log tags were shaded from direct sunlight, and the measurement interval was 15 min.
The vertical temperature was measured using globe thermal meters. The measurements were conducted under the canopy for two weeks in February 2019, from 12:30 to 16:20 every day, with a measurement interval of 10 min. The height from 0.5 m to 3.5 m was measured with a space interval of 0.3 m, and the vertical temperature distribution was measured manually. The globe thermometers were fixed on supports (tripods). Each time after adjusting the heights of the globe thermometers, the researchers walked away to avoid interference of the human body in the measurements. The readings were recorded after they became stable. To reduce random errors, the measurement of the temperature at each height was repeated 8 times from eight different points, which were all about 1 m away from the trunk in different directions. The average value of the 8 measurements was considered to be the value of the temperature at the specific height.
All sensors were calibrated, and the error of the temperature sensors was negligible (±0.2 °C).

3. Results

3.1. Site Analysis

In Sydney, summer weather is dominated alternately by the wet and cold sea breeze from the east side and the hot and dry desert wind from the west side. Desert wind brings heat, but, at the same time, it facilitates evapotranspiration and improves the cooling effect of evapotranspiration. In contrast, the wet and cold sea breeze has a cooling effect but can also hinder evapotranspiration. The extra moisture produced by the sea breeze can also increase evapotranspiration resistance. In our case, the effect of the sea breeze was substantial because the study area was very close to the coastline. Figure 2 shows an analysis of the wind direction from an observation of the nearest weather station. It can be seen in Figure 2d that most of the wind came from the southeast starting at noon every day during summer 2019.
The wind speed of the sea breeze gradually increased in the afternoon, as shown in Figure 3. The wind speed reached its maximum between 17:00 and 19:00 in the summer.

3.2. Diurnal Sap Flow Patterns

The Diurnal period in this study is defined as the time between 6:00 and 20:00, and we analysed the average sap flow during this period. The canopy temperature is the average temperature recorded by two log tag sensors under the canopies.
As mentioned above, the UNSW campus is regularly irrigated, and the measured Melaleuca canopy is a large tree with a deep root system. Thus, the pattern of sap flow is not limited by the soil moisture content. The analysis shows that the correlation coefficient between the sap flow rate and soil moisture was smaller than 5%. Moreover, the multiple linear regression analysis shows that the diurnal sap flow patterns are positively correlated to both the temperature and the VPD, as shown in Figure 4.
A non-linear model, expressed as f(x) = c − a × exp(−b × x), was used to fit the relationship between the VPD and diurnal sap flow, as shown in Figure 5. When considering 95% confidence bounds, the fit results are a = 61.27 (58.54, 63.99) and b = 0.05848 (0.0534, 0.06357), while c is determined as 58.4534. At the same time, a linear regression relationship was built between the sap flow and the canopy temperature, which has an R2 of 0.65, as shown in Figure 6.
The Pearson correlation coefficient [31] was also calculated. The correlation coefficient between the diurnal sap flow and diurnal canopy temperature is 0.8, while the correlation coefficient between the diurnal sap flow and diurnal VPD is 0.69.

3.3. Air Temperature Distribution

3.3.1. Vertical Temperature Distribution

Measurement of the vertical temperature distribution was performed between 12:30 and 16:30 since the highest daily radiation and temperatures usually occur within these hours. The measurement results show that the maximum temperature difference vertically was only about 0.5 °C. Figure 7 shows the vertical temperature change recorded during the experiment.

3.3.2. Temperature Difference between the Inside and outside of the Canopy

A linear regression of the temperature difference between the inside and outside of the canopy showed that a stronger sap rate was associated with a larger temperature difference between the inside and outside, as shown in Figure 8a. However, the same relationship was also found in the analysis of VPD and wind speed, as shown in Figure 8b,c.
At the same time, most of the variables in this study are highly correlated with each other, especially when strong wind conditions are considered. The variation of the temperature difference inside and outside the canopy can be explained only when the correlation between the observed variables is eliminated. Therefore, a PCA analysis was performed using the VPD, sap flow rate, and wind speed as input observational groups. Ultimately, three groups of components were created. The results showed that principal components 1 and 2 account for 92.04% of the variability in the data set. As shown in Figure 9, in the configuration of principal components 1 and 2, the contributions of wind speed and sap flow rate dominate with similar contributions. The details of the principle components are shown in Table 2.
A multiple linear regression with canopy temperature difference (CTD) was also performed using principal components 1 and 2, and the results are shown in Figure 10. The R square is 0.32, and principal component 1 shows a negative correlation with temperature difference.

4. Discussion

4.1. Horizontal Cooling Effect

In this experiment, the temperature difference between the outside and inside canopy was measured. The analysis indicates that the synoptic conditions in Sydney may have made a significant contribution to the results.
Changes in the transpiration rates of large trees depend largely on direct radiation changes, while regional synoptic conditions rule the wind in the studied area. The study area is close to the coastline and faces open spaces in both the eastern and the western directions, making the sea breeze the dominant factor in the surface energy balance despite the impact of downward shortwave radiation input. Further, the cooling effect of transpiration is negligible compared to the cold brought by the sea breeze. Studies conducted in Munich [13] reported that the sap flow has a significant relationship with the difference between the temperature under the canopy and that outside the canopy. Munich has a mild climate, and in the researched area, no climatic conditions (such as a stiff sea breeze) were observed. This indicates that the presence of a windy environment must be considered before using plants for transpiration cooling. The difference between the results of this study and the results in [13] indicates the high dependence of tree transpiration cooling on the environment, especially on local wind environments and under regional synoptic conditions.
In order to make a comparison between variables, the daily variation of several variables was calculated, as shown in Figure 11 (daily variation is calculated as the average at a specific hour equal to the sum of all the data measured that hour during the two weeks divided by the total number of data at that specific hour). The maximum daily temperature difference appears after around 17:00 (
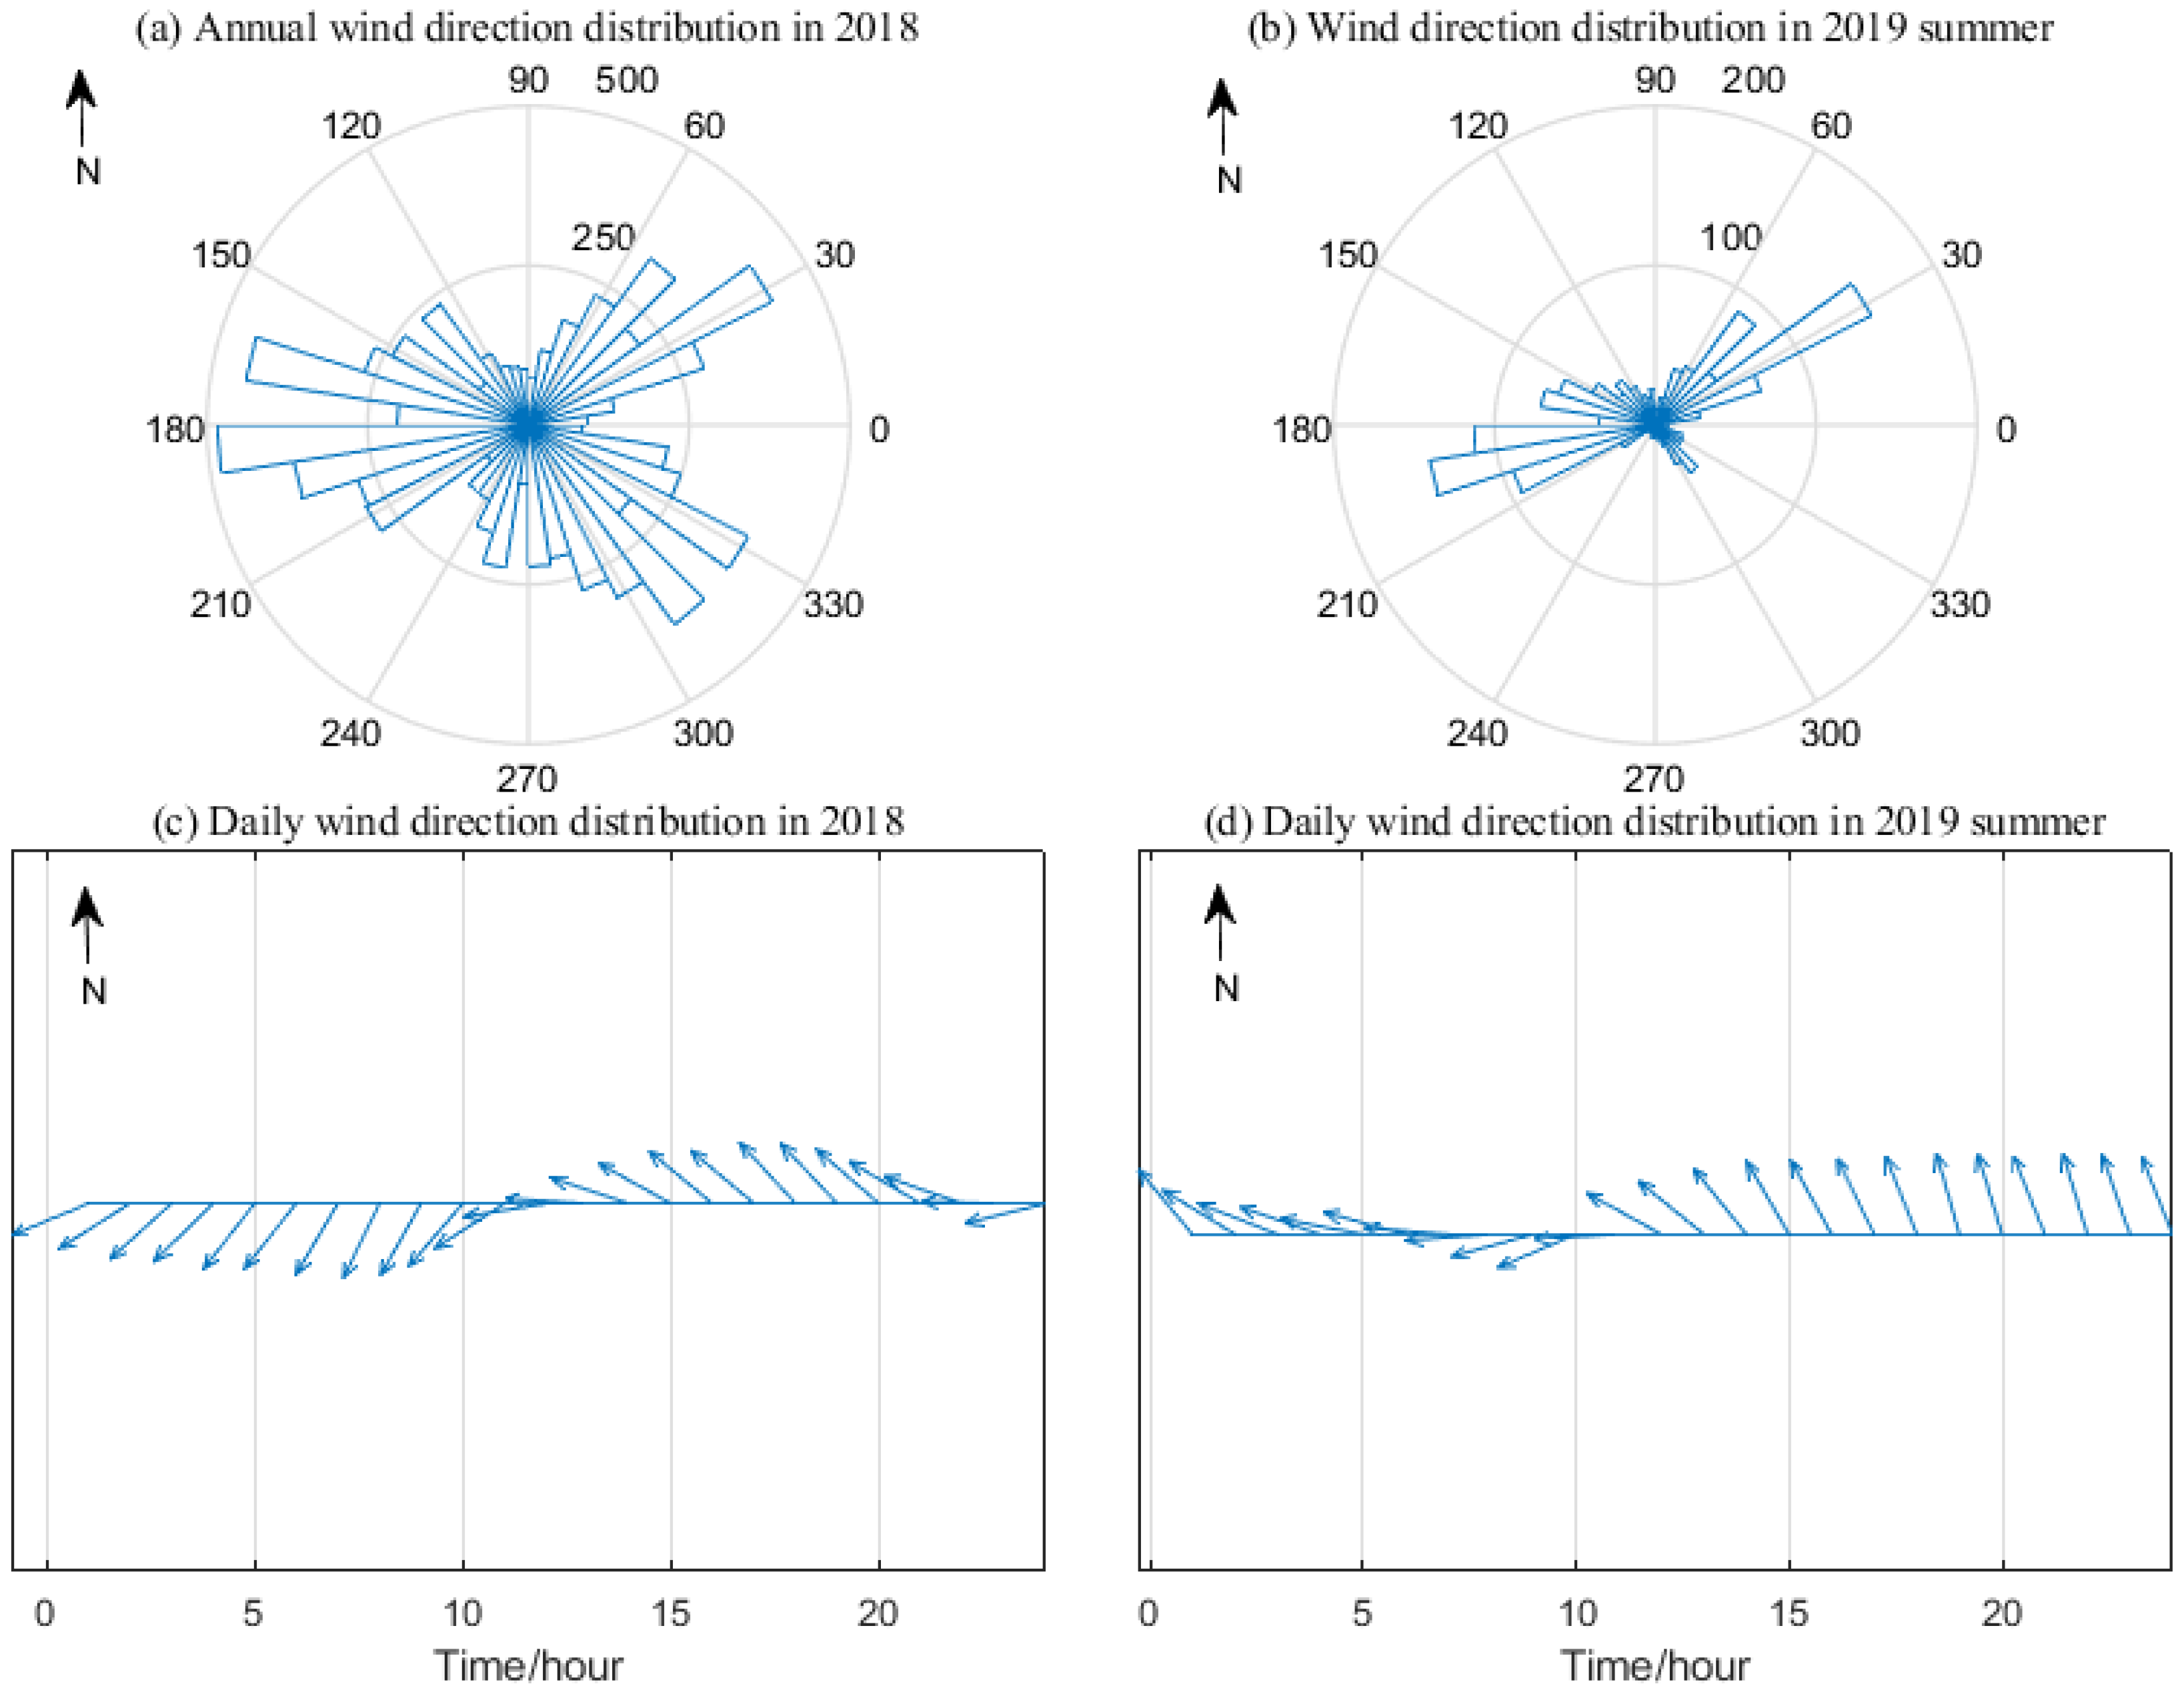
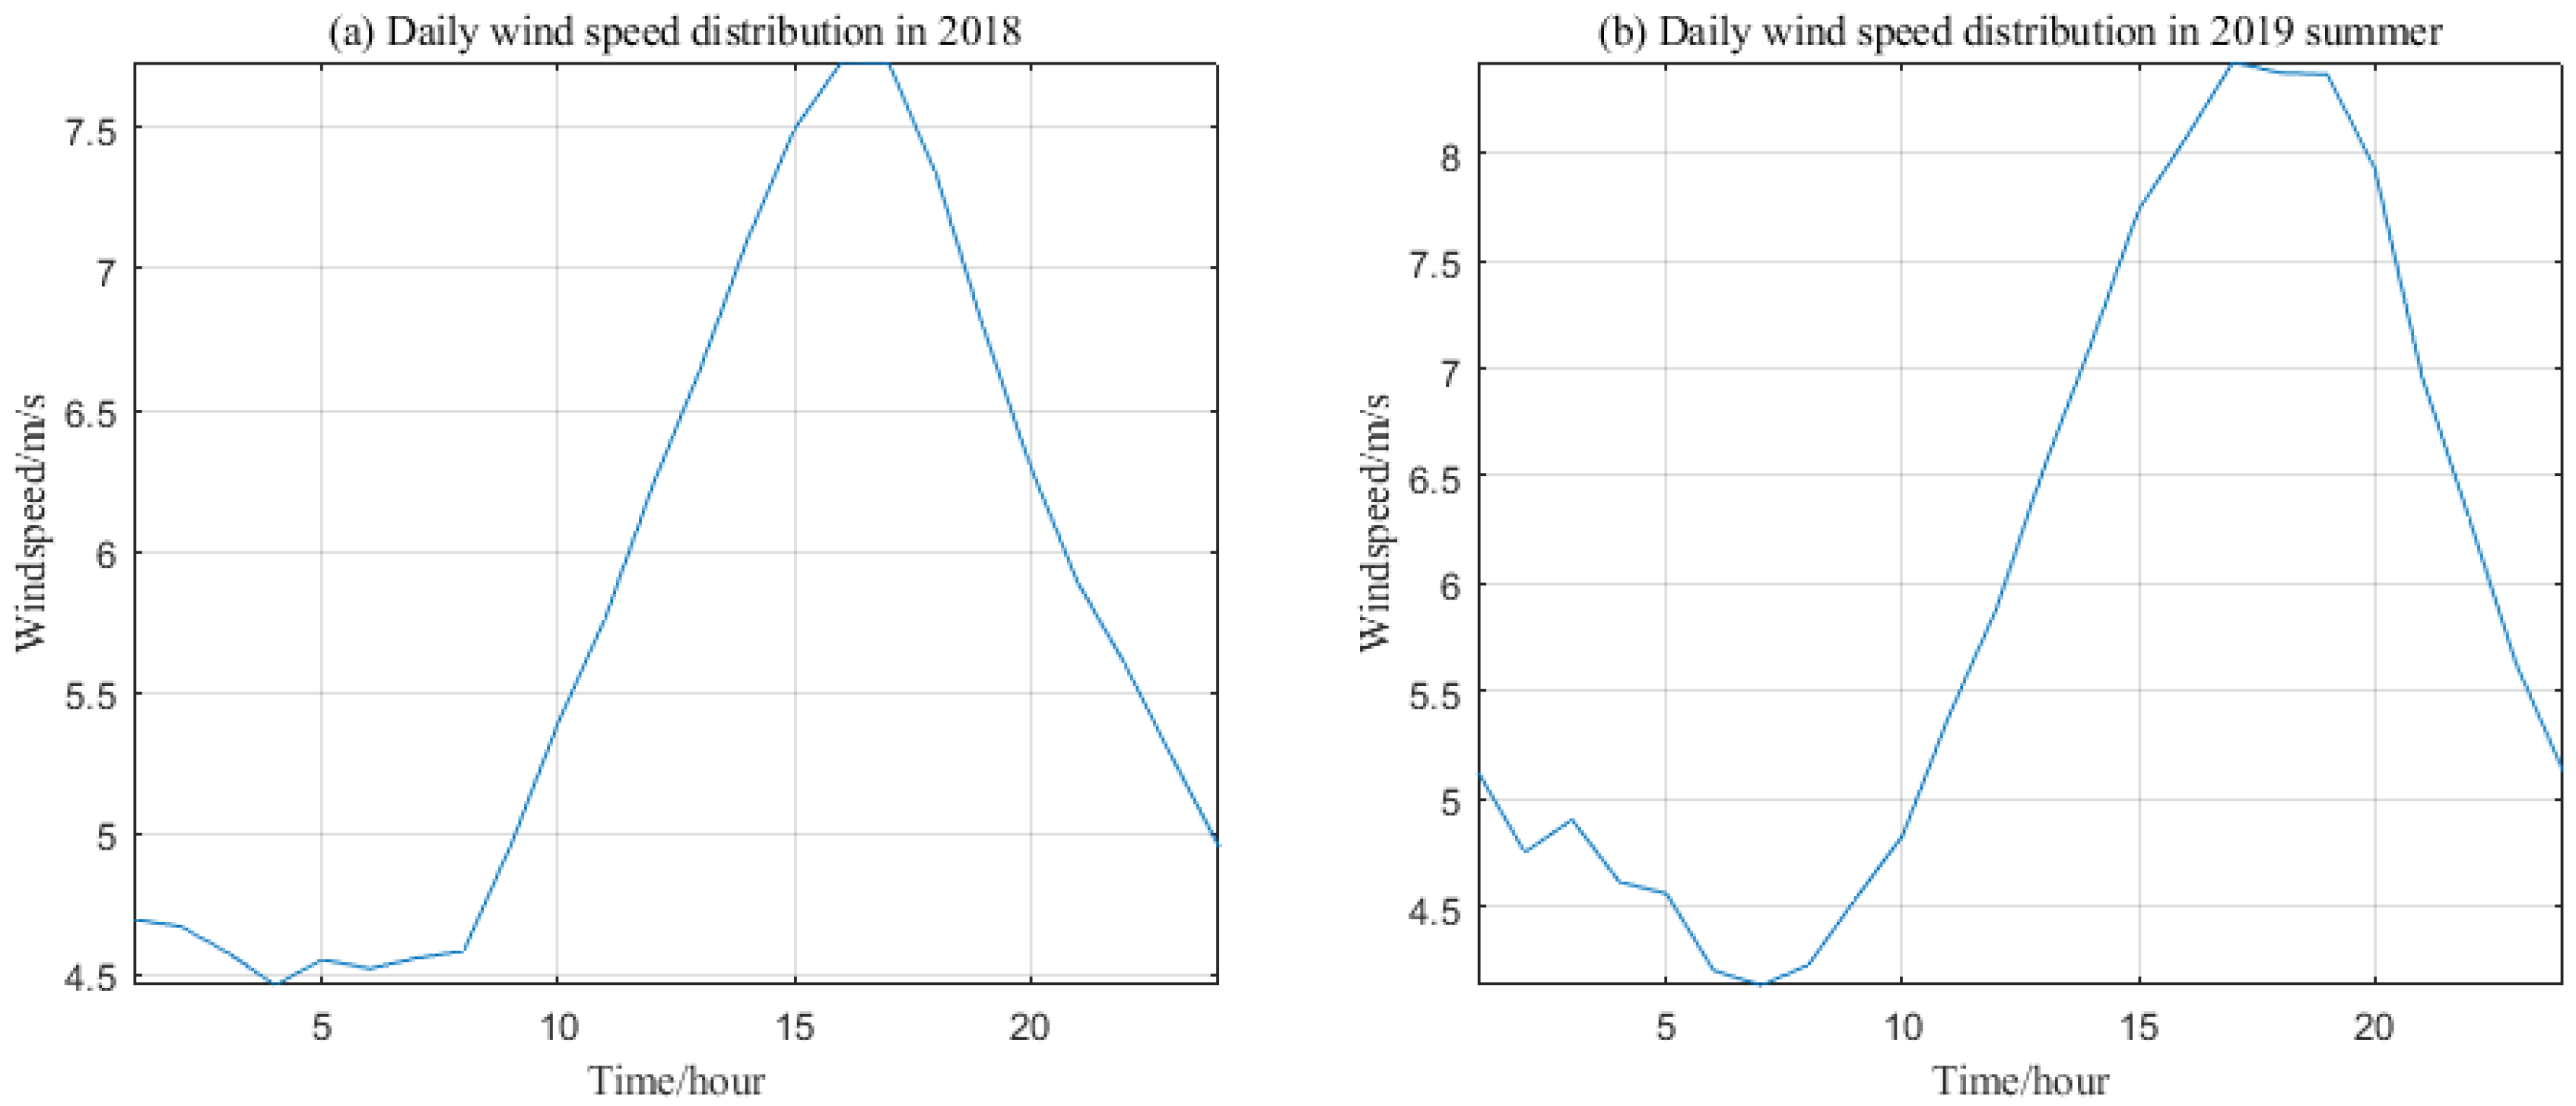
Figure 11d), which is earlier than the peak of the wind speed (Figure 3b) but later than the peak of the sap flow rate (Figure 11a). This indicates that the wind may exert influence on the temperature difference in the afternoon and delay the time of the peak temperature difference. At the same time, starting from 11 am, the difference between the canopy temperature and the air temperature remained at a similar level (Figure 11c). In our experiment, this also indicates that the wind is likely to dominate the energy balance and negate the effects of other factors in the local space under the canopy. If the wind is not the dominant factor, the variation in sap flow and solar radiation will lead to a significant peak on the curve in 11c after 11 am.
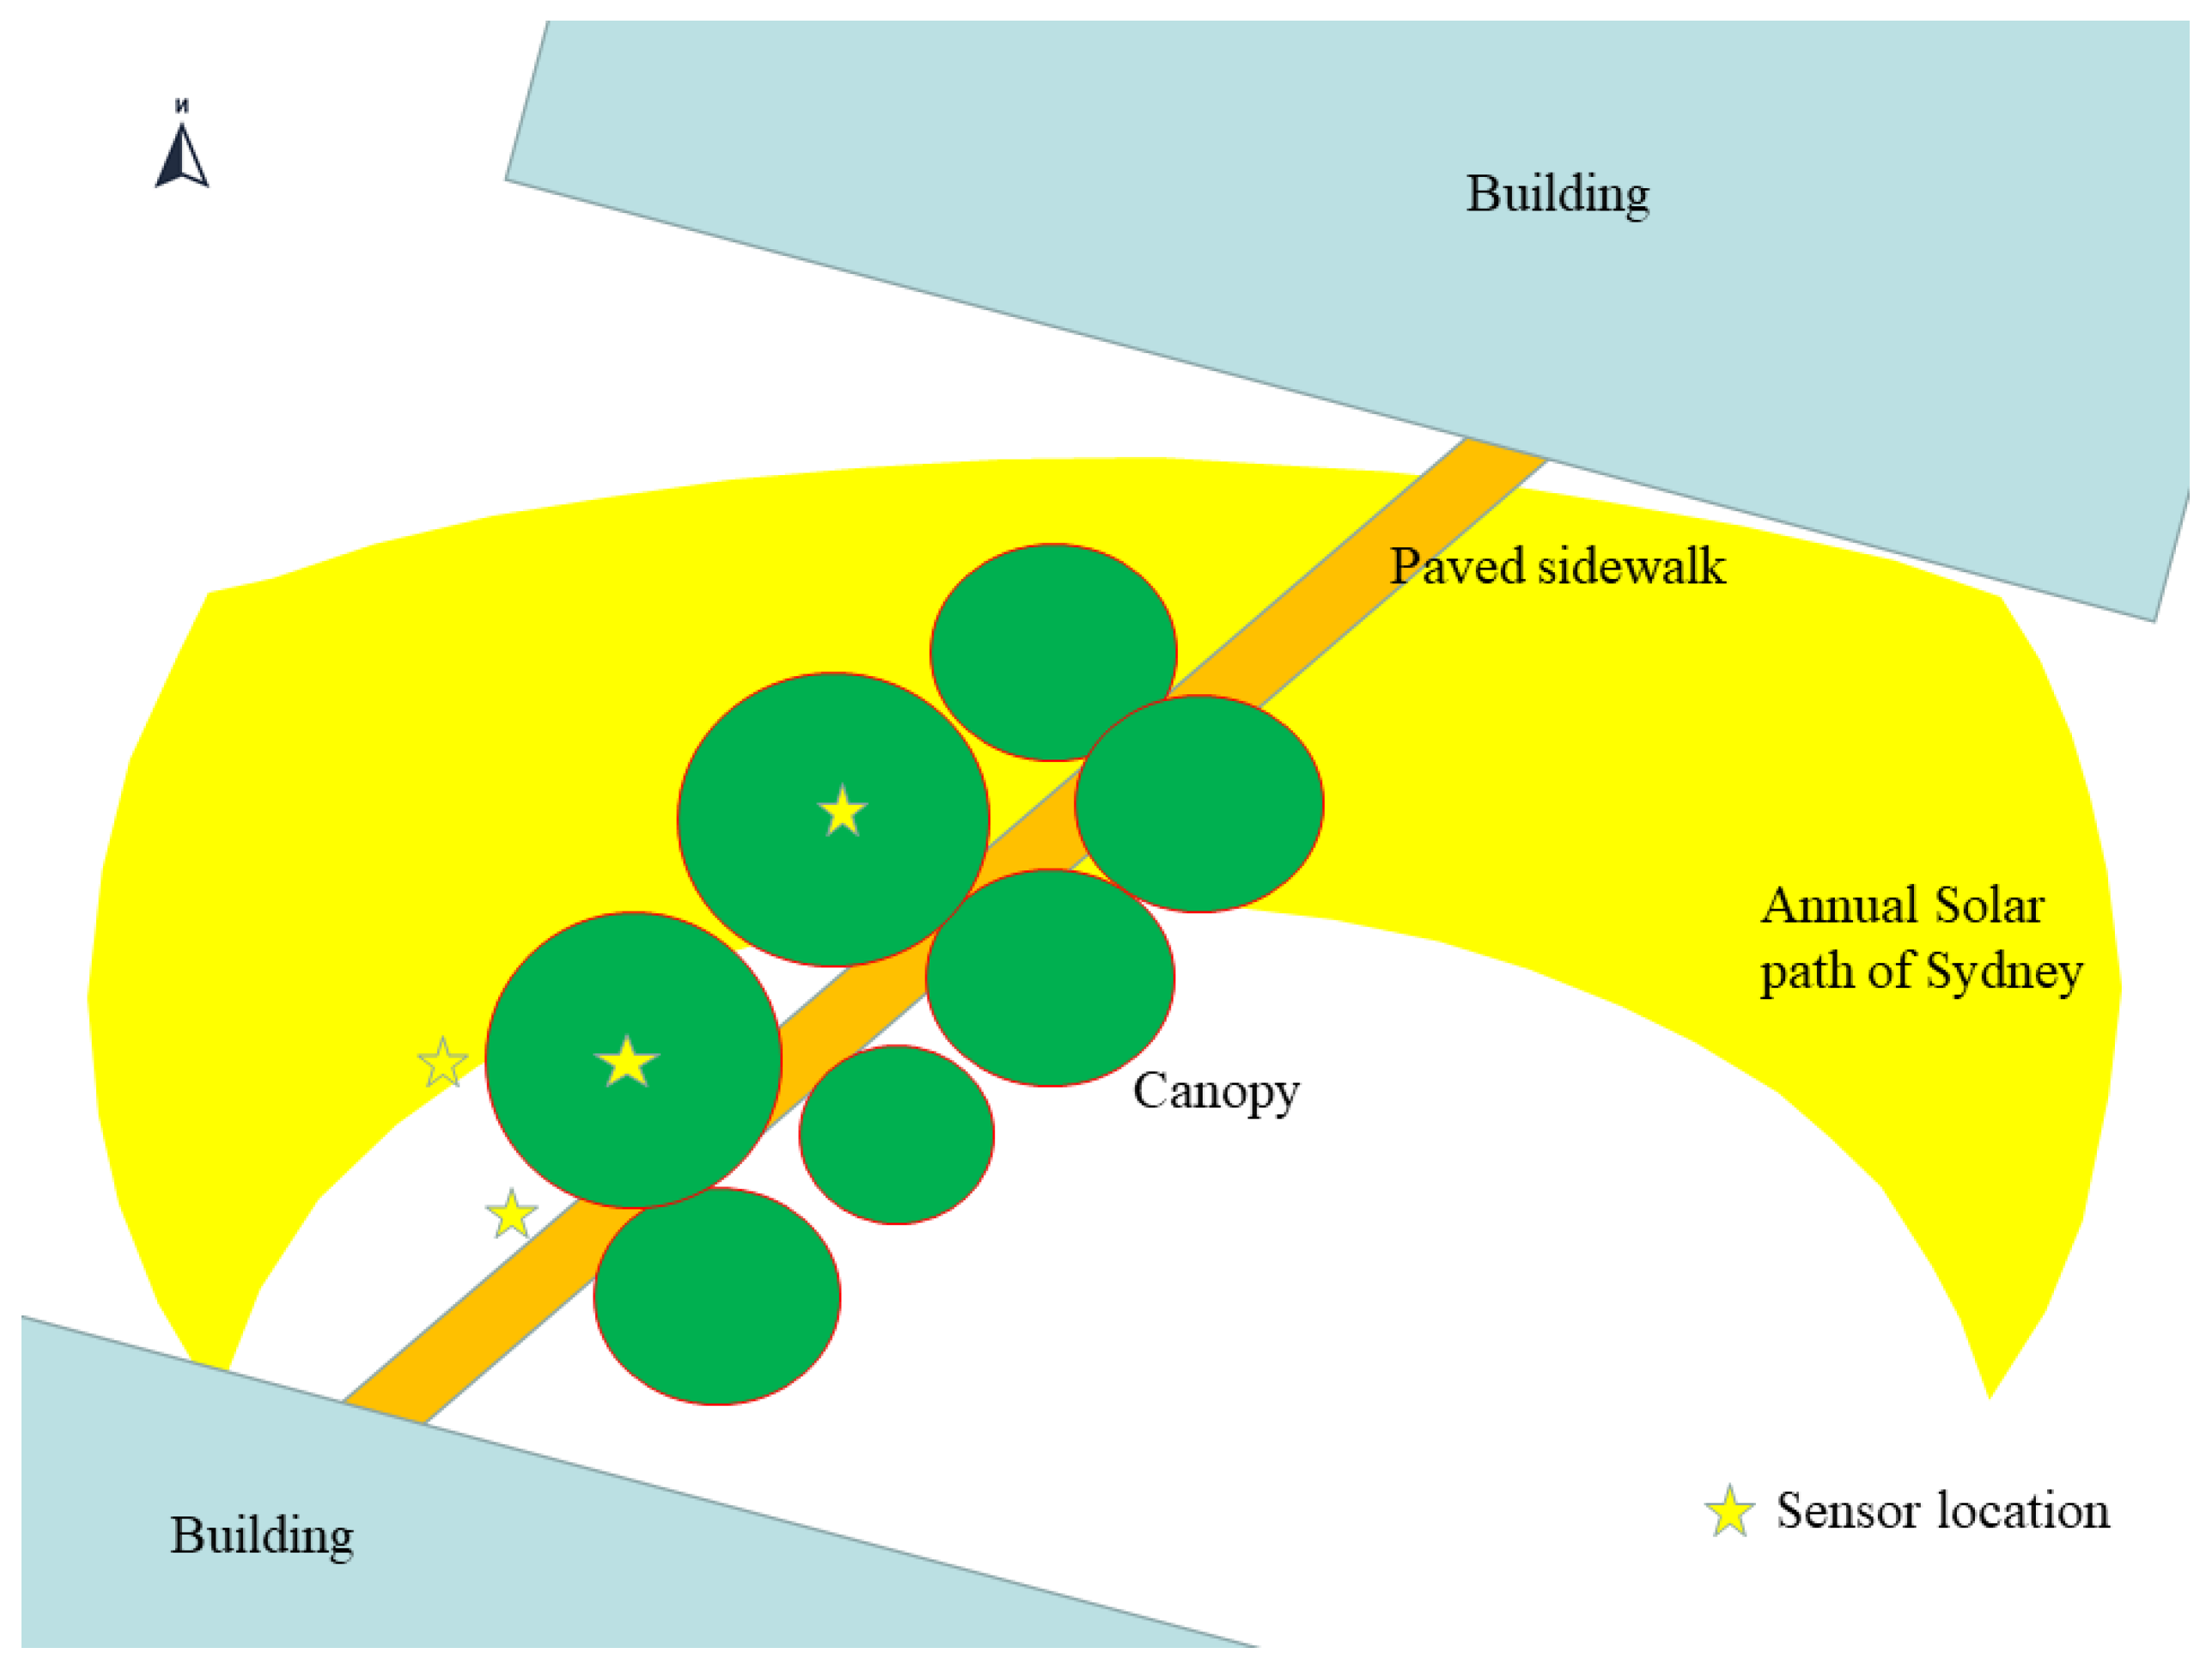
It should be noted that the temperature sensor outside the canopy was located in the downwind direction for most of the time in the afternoon, as shown in Figure 12. The northeast wind was significantly blocked by the large thick canopies and the layout, causing the wind in the downwind direction in the local environment to significantly weaken. This could be the reason for the results of our experiment: The wind cooled the canopy more than it cooled the outer areas in the downwind direction. Furthermore, if a sensor was placed in the upwind direction outside the canopy, the results indicate that the sensor was able to record a lower air temperature.
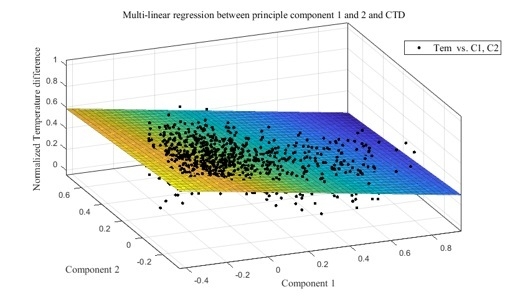
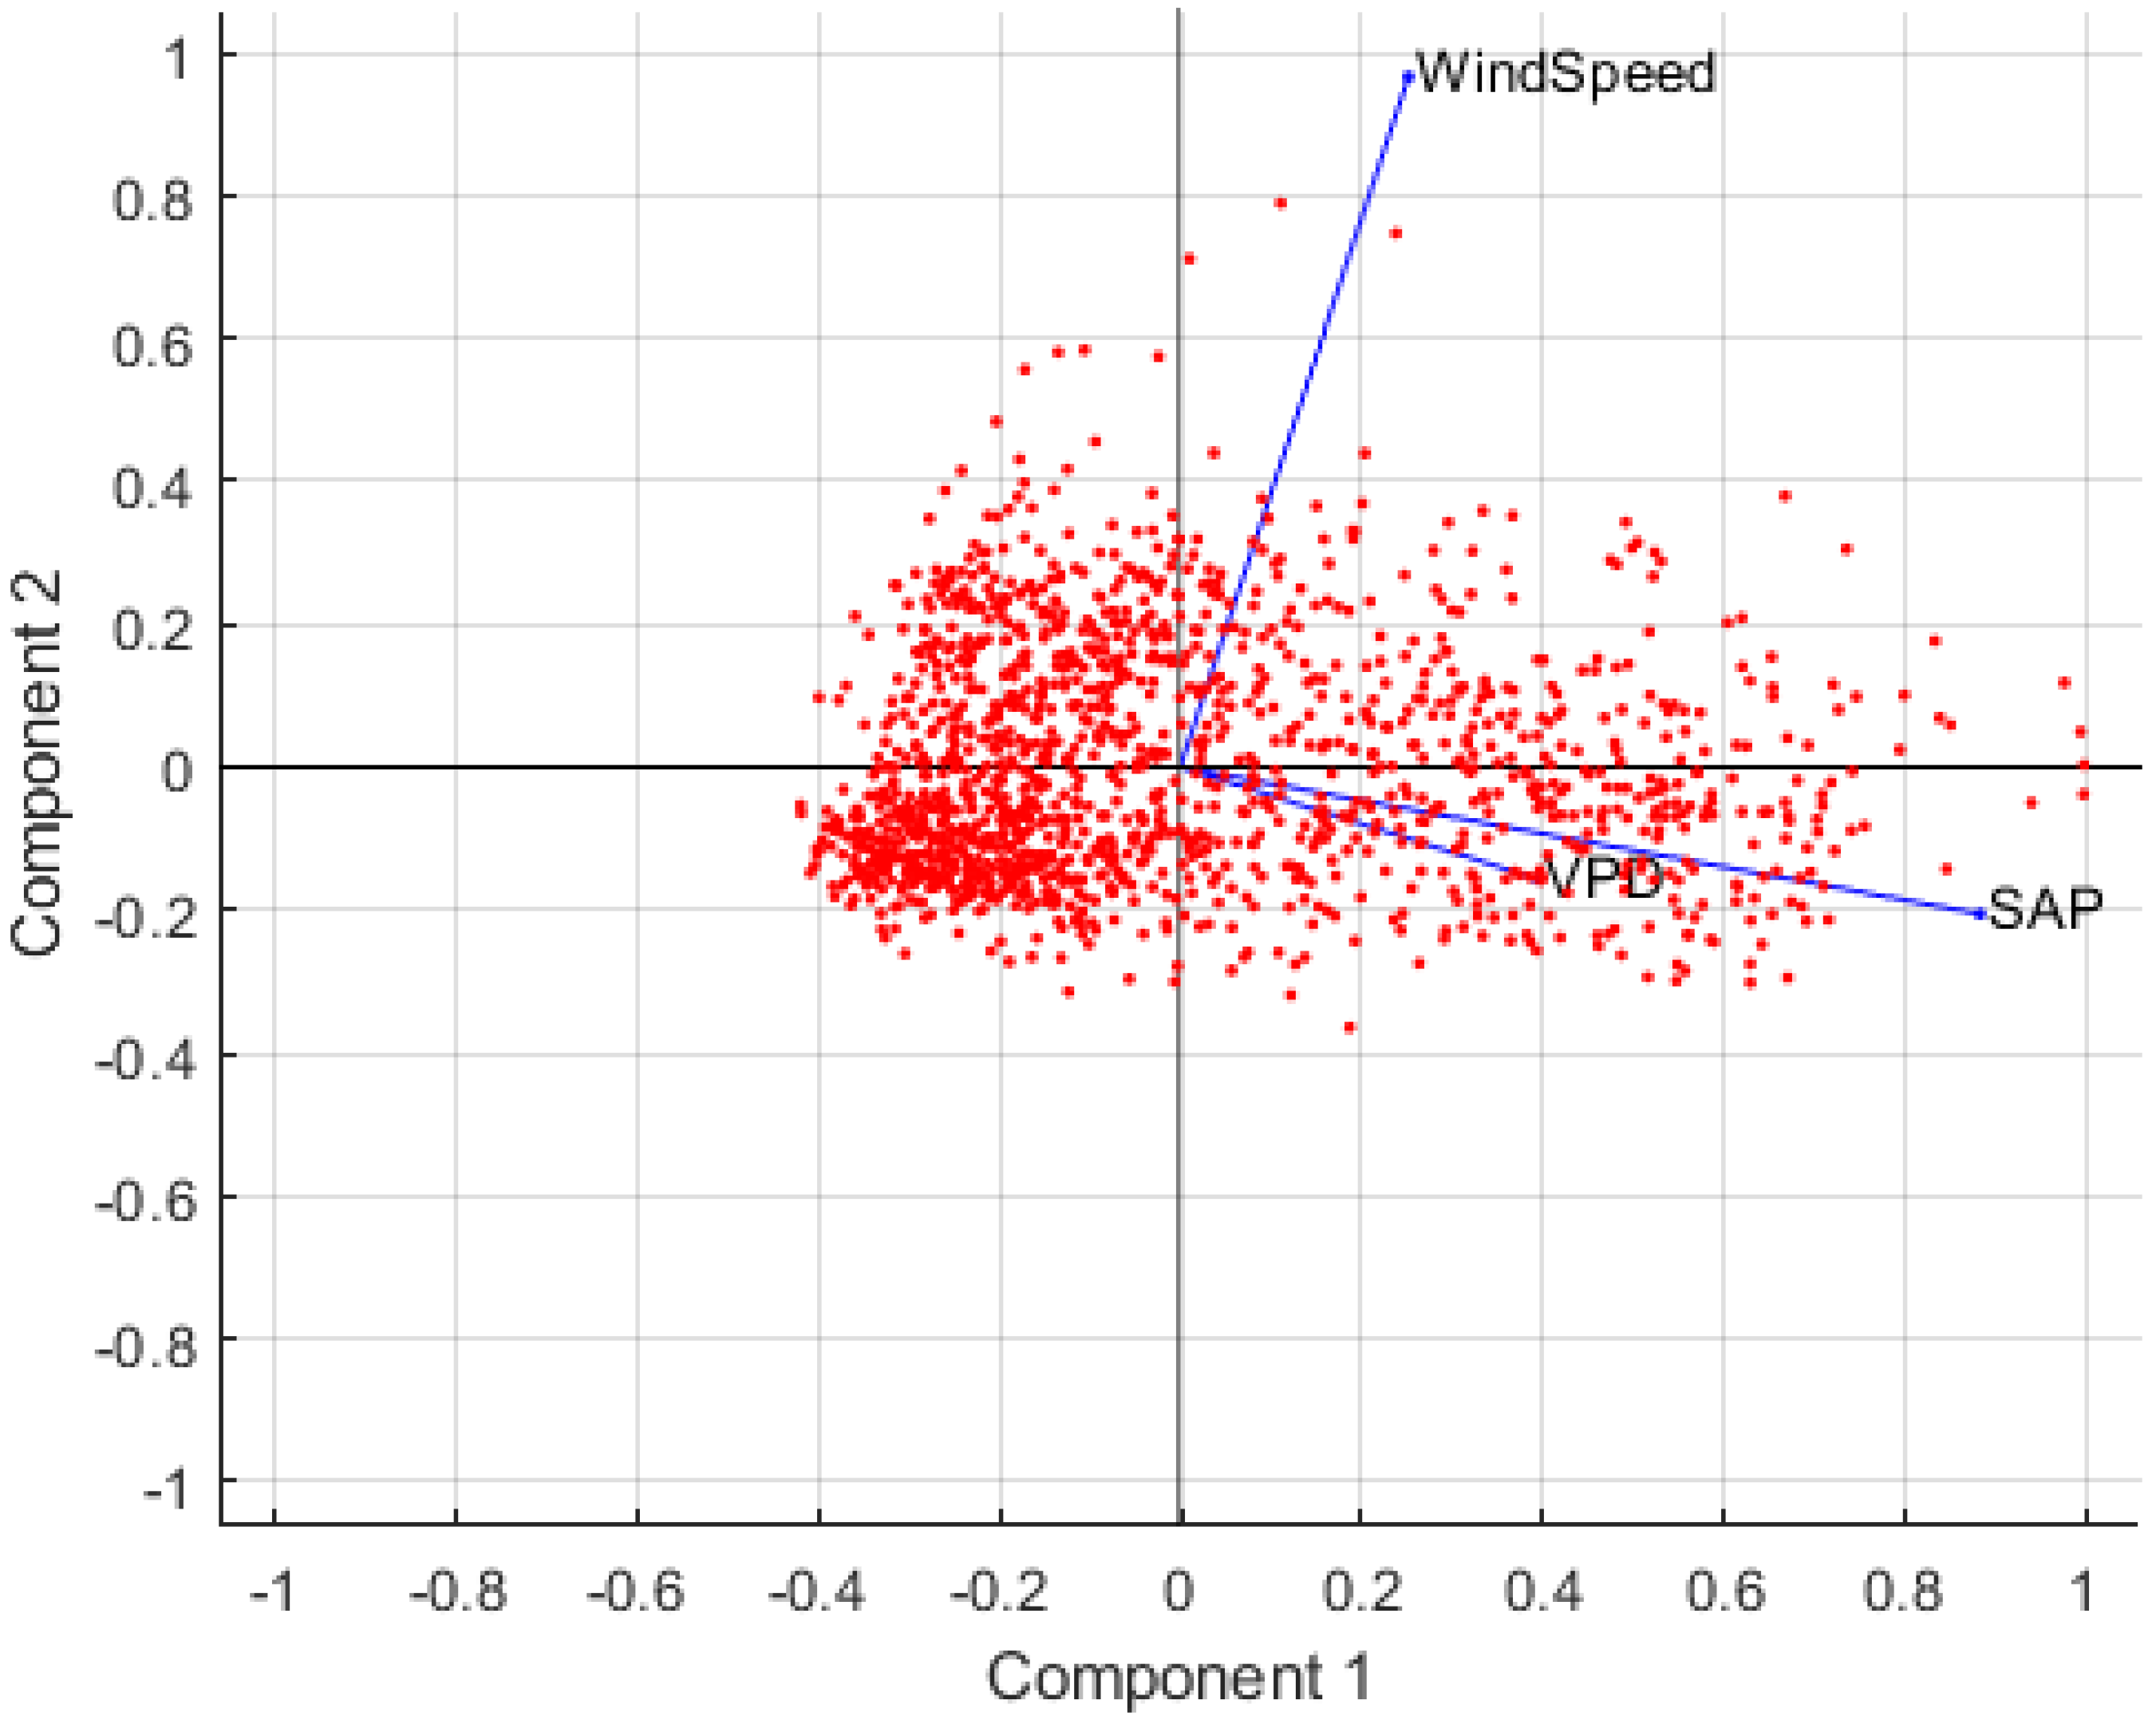
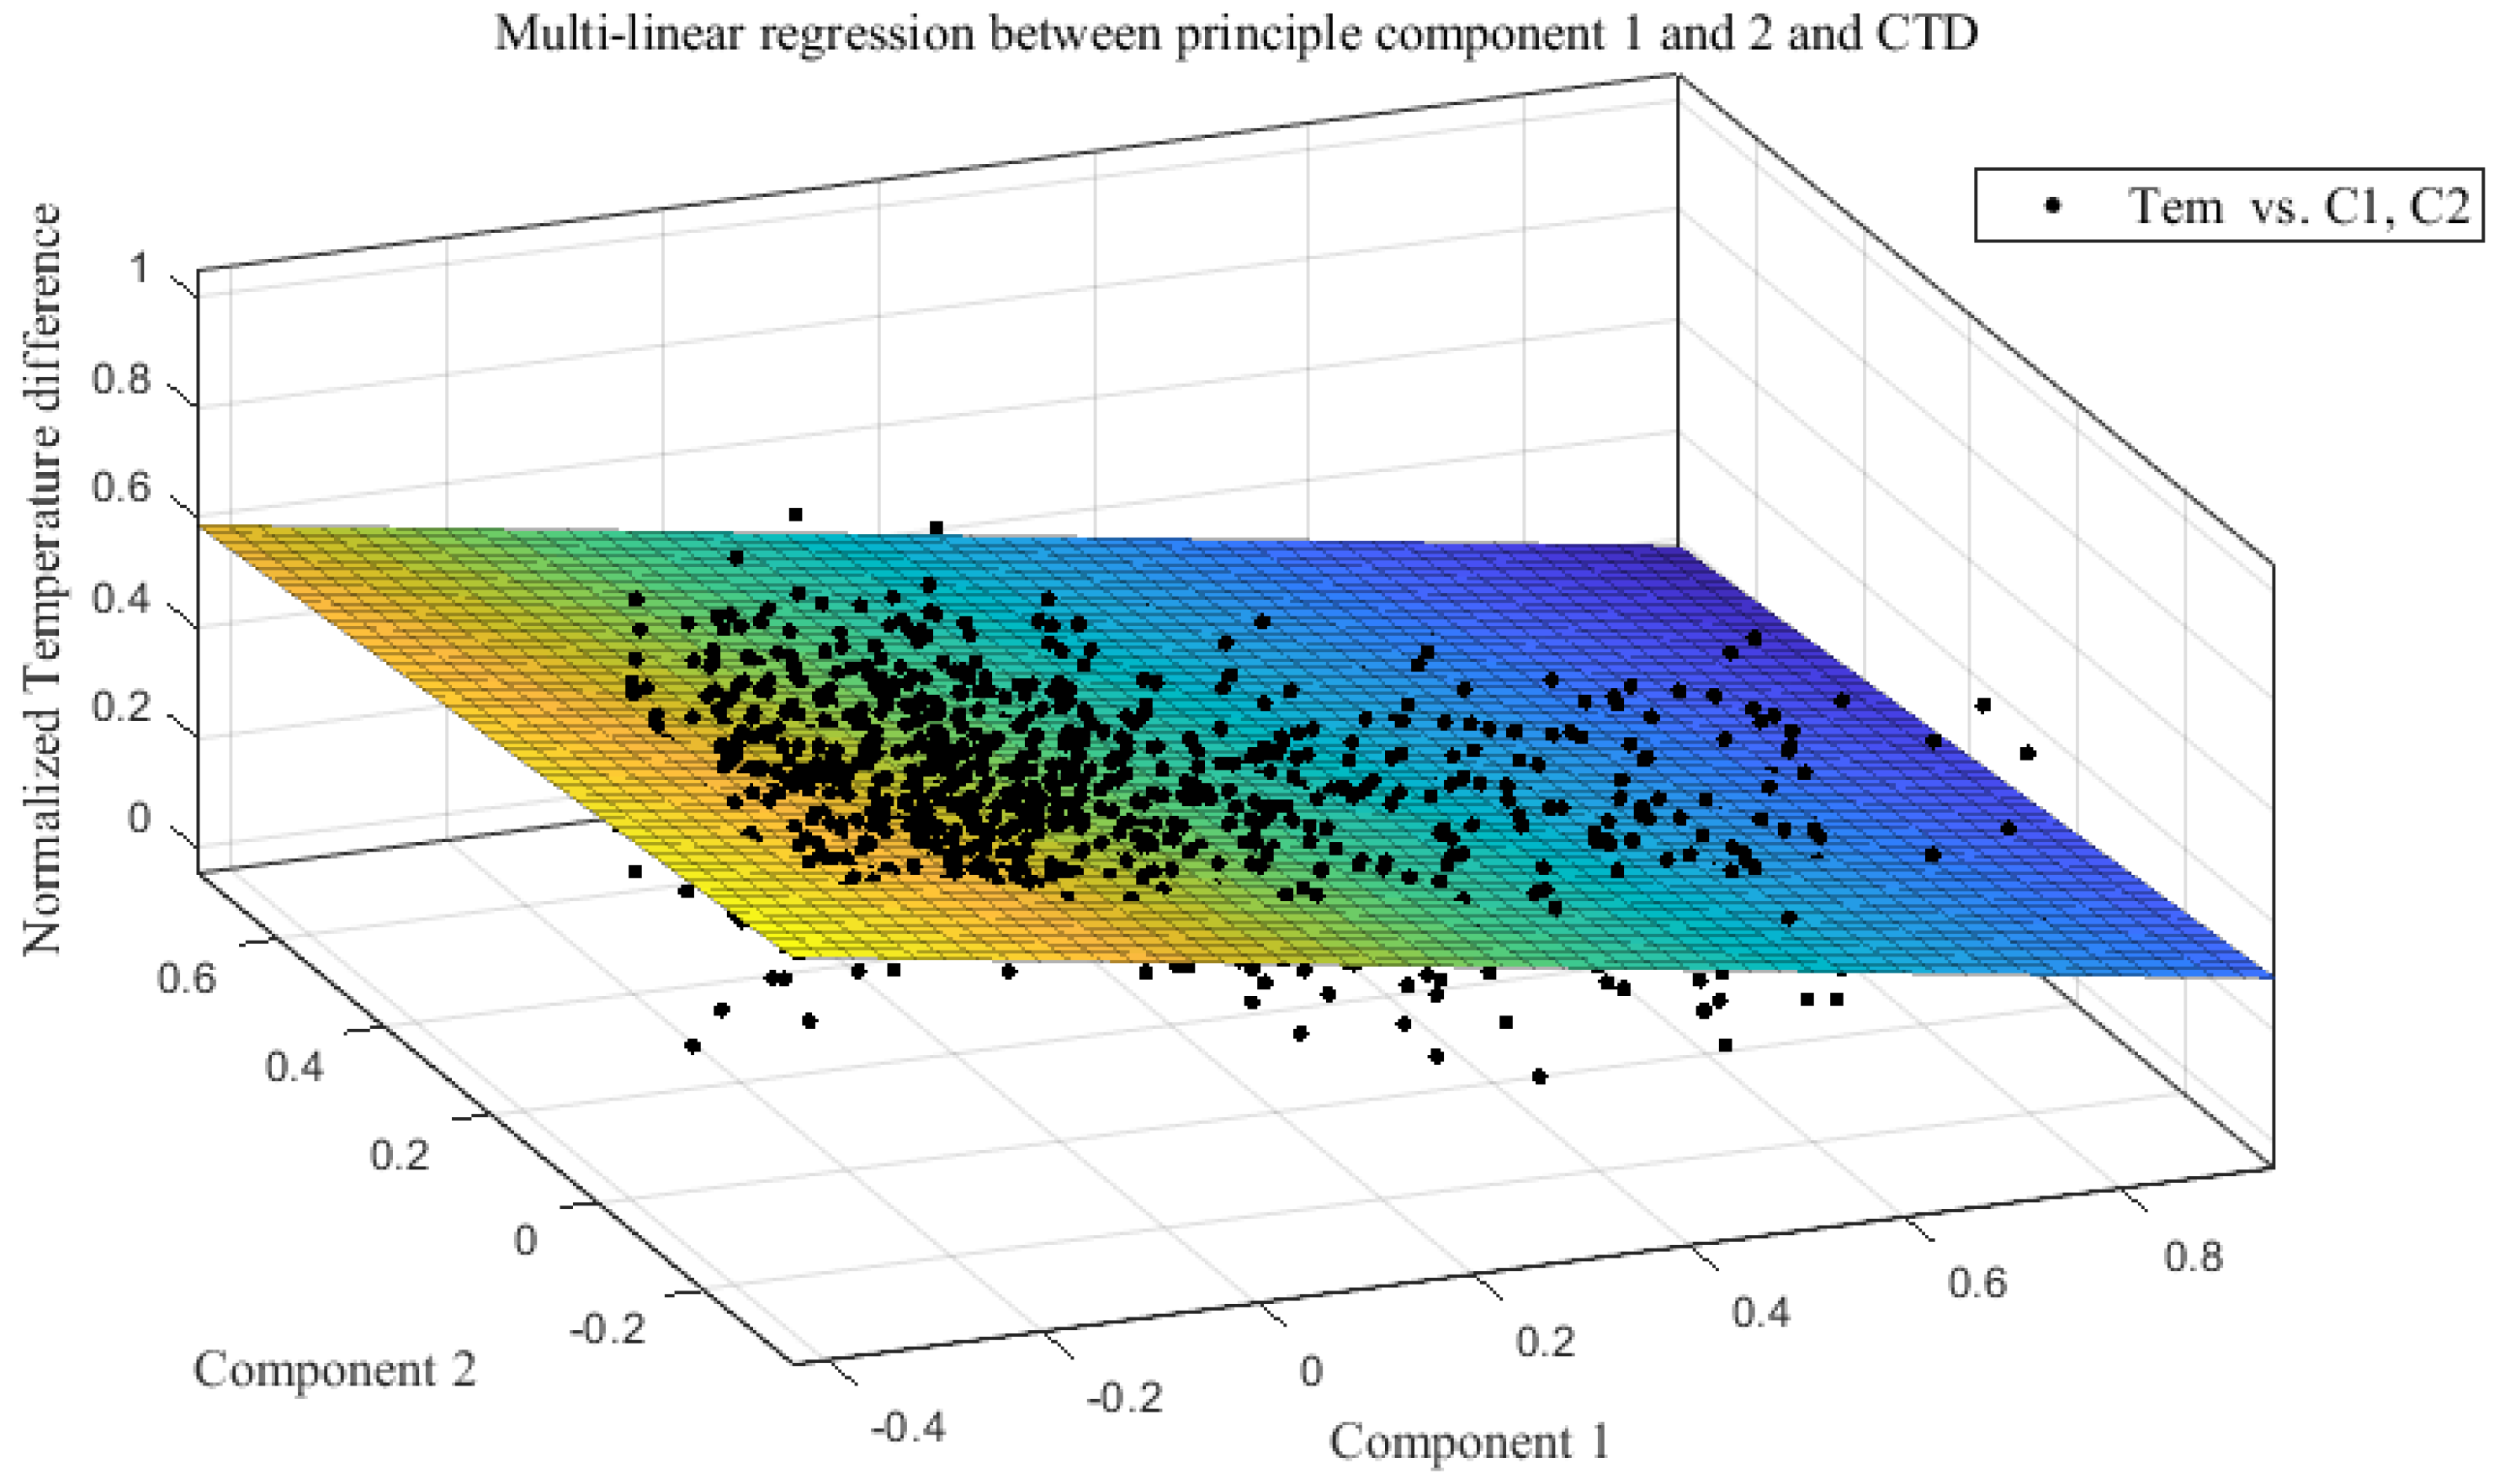
The PCA helped us eliminate the correlation between variables, showing that transpiration made similar contributions to cooling compared to the wind in the experiment. As mentioned above, the peaks of the daily sap flow, temperature difference, and wind appeared in sequence during the afternoon. This pattern suggests that in the early afternoon, when the daily maximum air temperature is most likely to occur, transpiration cooling plays a leading cooling role in the cooling mechanism. The transpiration cooling and cooling of the sea breeze complement each other in different periods under specific synoptic conditions, providing the city with a considerable cooling effect in the daytime and further emphasizing the critical impact of trees on the local climate.
However, it should be noted that after the principal value analysis, the correlation between the temperature difference and the principal component remained limited because the transpiration cooling of trees only accounts for a part of the cooling effect, and the shading effect is also an essential cooling mechanism of trees. Though the shading effect was not able to be analysed in the experiment, the effect of shading should not be ignored. In the daytime, changes in the incoming radiation intensity and direction can affect the temperature difference between the outside and inside of the canopy.
Moreover, a sharp peak in the soil temperature is shown in Figure 11a. This is because the soil was receiving direct solar radiation at this moment. During the time when the the soil temperature peak occured, the recorded soil surface was not shaded by the canopy. Hence, a sharp rise in the soil surface temperature was observed. This result also underscores the importance of shading effects in tree cooling mechanisms.

4.2. Vertical Cooling Effect

In the studied area, a vertical temperature of 0.5 °C from 0.5 m to 3.5 m was observed under the canopy. This value is relatively small compared to the values in urban tree cooling studies, as mentioned above [22]. The surrounding surface conditions made the largest contributions to this result.
Different ground surfaces have different thermal properties, optical properties, and evapotranspiration capabilities. Therefore, under the same environmental conditions, different ground surfaces will have different surface temperatures and lead to a diverse vertical temperature and humidity distribution near the ground. Studies that distinguish vertical temperature differences are usually conducted on built surfaces like paved streets [22]. The warming effect of built surfaces enlarges the vertical temperature difference. This warming effect is considerable, especially when the trees are sparsely distributed. However, in our experiment, the trees are located on a dense grassland, where the soil surface remains moist most of the time. The transpiration of grass and direct evaporation from the soil cause a considerable cooling effect, and the cooling effect of the lawn and canopy work together, resulting in a more uniform vertical temperature distribution.
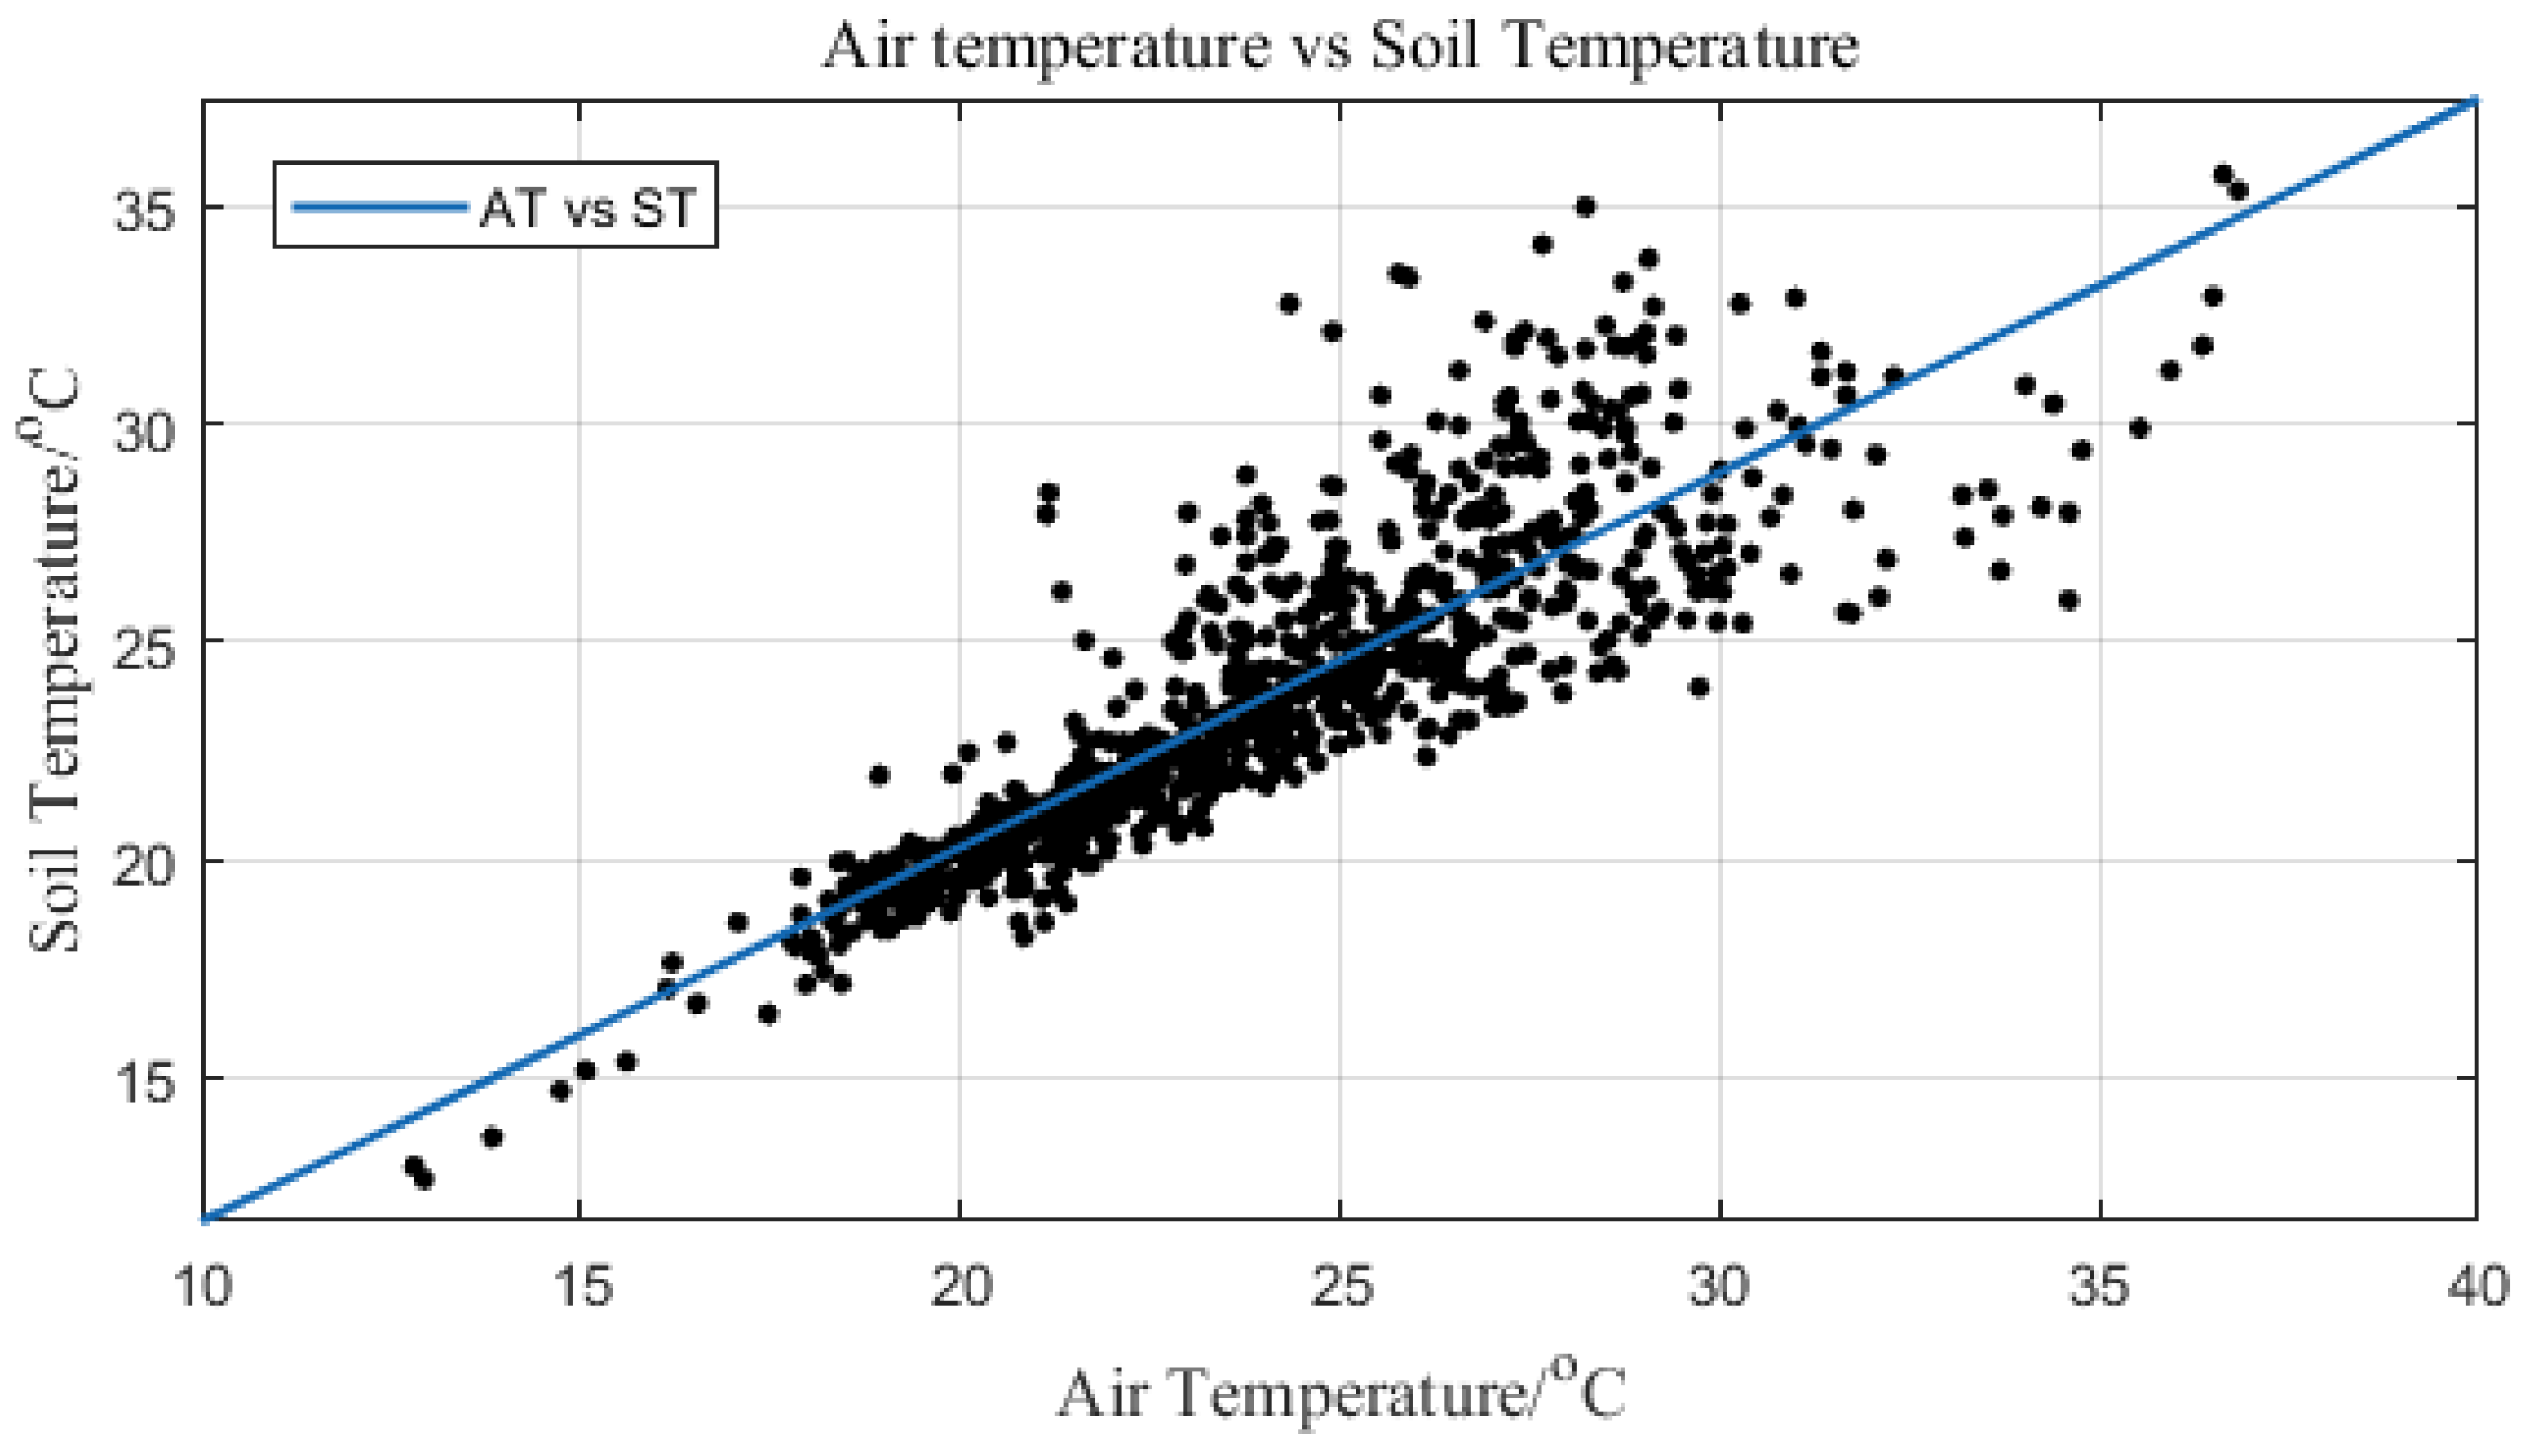
To confirm the cooling effect of the lawn on our measurements, a regression of the surface soil temperature and air temperature was developed, and the results are presented in Figure 13. According to the fitting equation, the projected soil temperature is significantly lower than the air temperature. When the air temperature is 30 °C, the projected soil surface temperature is 28.9 °C at the experimental site, and the temperature difference is 1.1 °C. When the air temperature is 35 °C, the projected soil surface temperature is 33.1 °C, and the temperature difference reaches 1.9 °C. This means that the cooling effect of the lawn did contribute to the vertical temperature distribution.

4.3. Limitation of the Research

Due to the complexity of the urban environment and the experimental conditions, the following limitations exist in this study. In this experiment, the sap flow rate was recorded but not calibrated. Hence, only the sap flow pattern was analyzed. The transpiration cooling ability is thus unable to be quantified since the transpiration cooling power cannot be calculated. Part of the data used in this experiment was taken from the nearest observation station. The distance between the experimental site and the nearest station was around 1.1 km, and the conditions of the station were similar to those of the experiment site. Since distance remained between the observation stations and the experimental site, the correlation coefficient between the station observation and site data inevitably decreased, although some studies have shown that it is feasible to use data from nearby observation stations in this kind of research. Considering the analysis results above, the influence of wind may cause a significant difference in the air temperature from the east and west sides of the canopies. However, this difference was not quantified in the present measurements since only one side of the canopy was measured. Also, the absence of radiation data can also have an impact on the multi-linear fiting results of the principle components. The R square value of the current result may be lower than the fitting result using principle components that consider radiation.
Due to the complexity of the urban environment, the results of this experiment may not be suitable for all places that have a strong coastal breeze because the local wind environment is also greatly affected by the terrain and building layout. If there are large buildings present in the upwind direction, the contribution of the wind field to the cooling of the local environment could be significantly weakened, so the role of the transpiration cooling of the plants in such scenarios is more critical. However, the shading effect produced by the possible appearance of buildings may also obfuscate the shading effect of plants. These scenarios also need to be investigated. The results of this experiment are only suitable for occasions where the local wind environment is profoundly affected by weather conditions.

5. Conclusions

The results of this study emphasize the importance of climatic conditions for the transpiration cooling effects of trees in urban overheating. We found that transpiration clearly contributes to decreasing the temperature, even under strong coastal wind conditions. Therefore, in cities, where the climate is dominated by the sea breeze, the side of the city that is far from the coastal line is less affected by the sea breeze, but transpiration still plays a critical role in the cooling of these areas. At the same time, the experiment also showed that the patterns of sea breeze and sap often do not coincide and that trees and the wind can complement each other in terms of urban overheating mitigation at different times of day. Hence, even in the areas near the coast, transpiration cooling could still be useful.
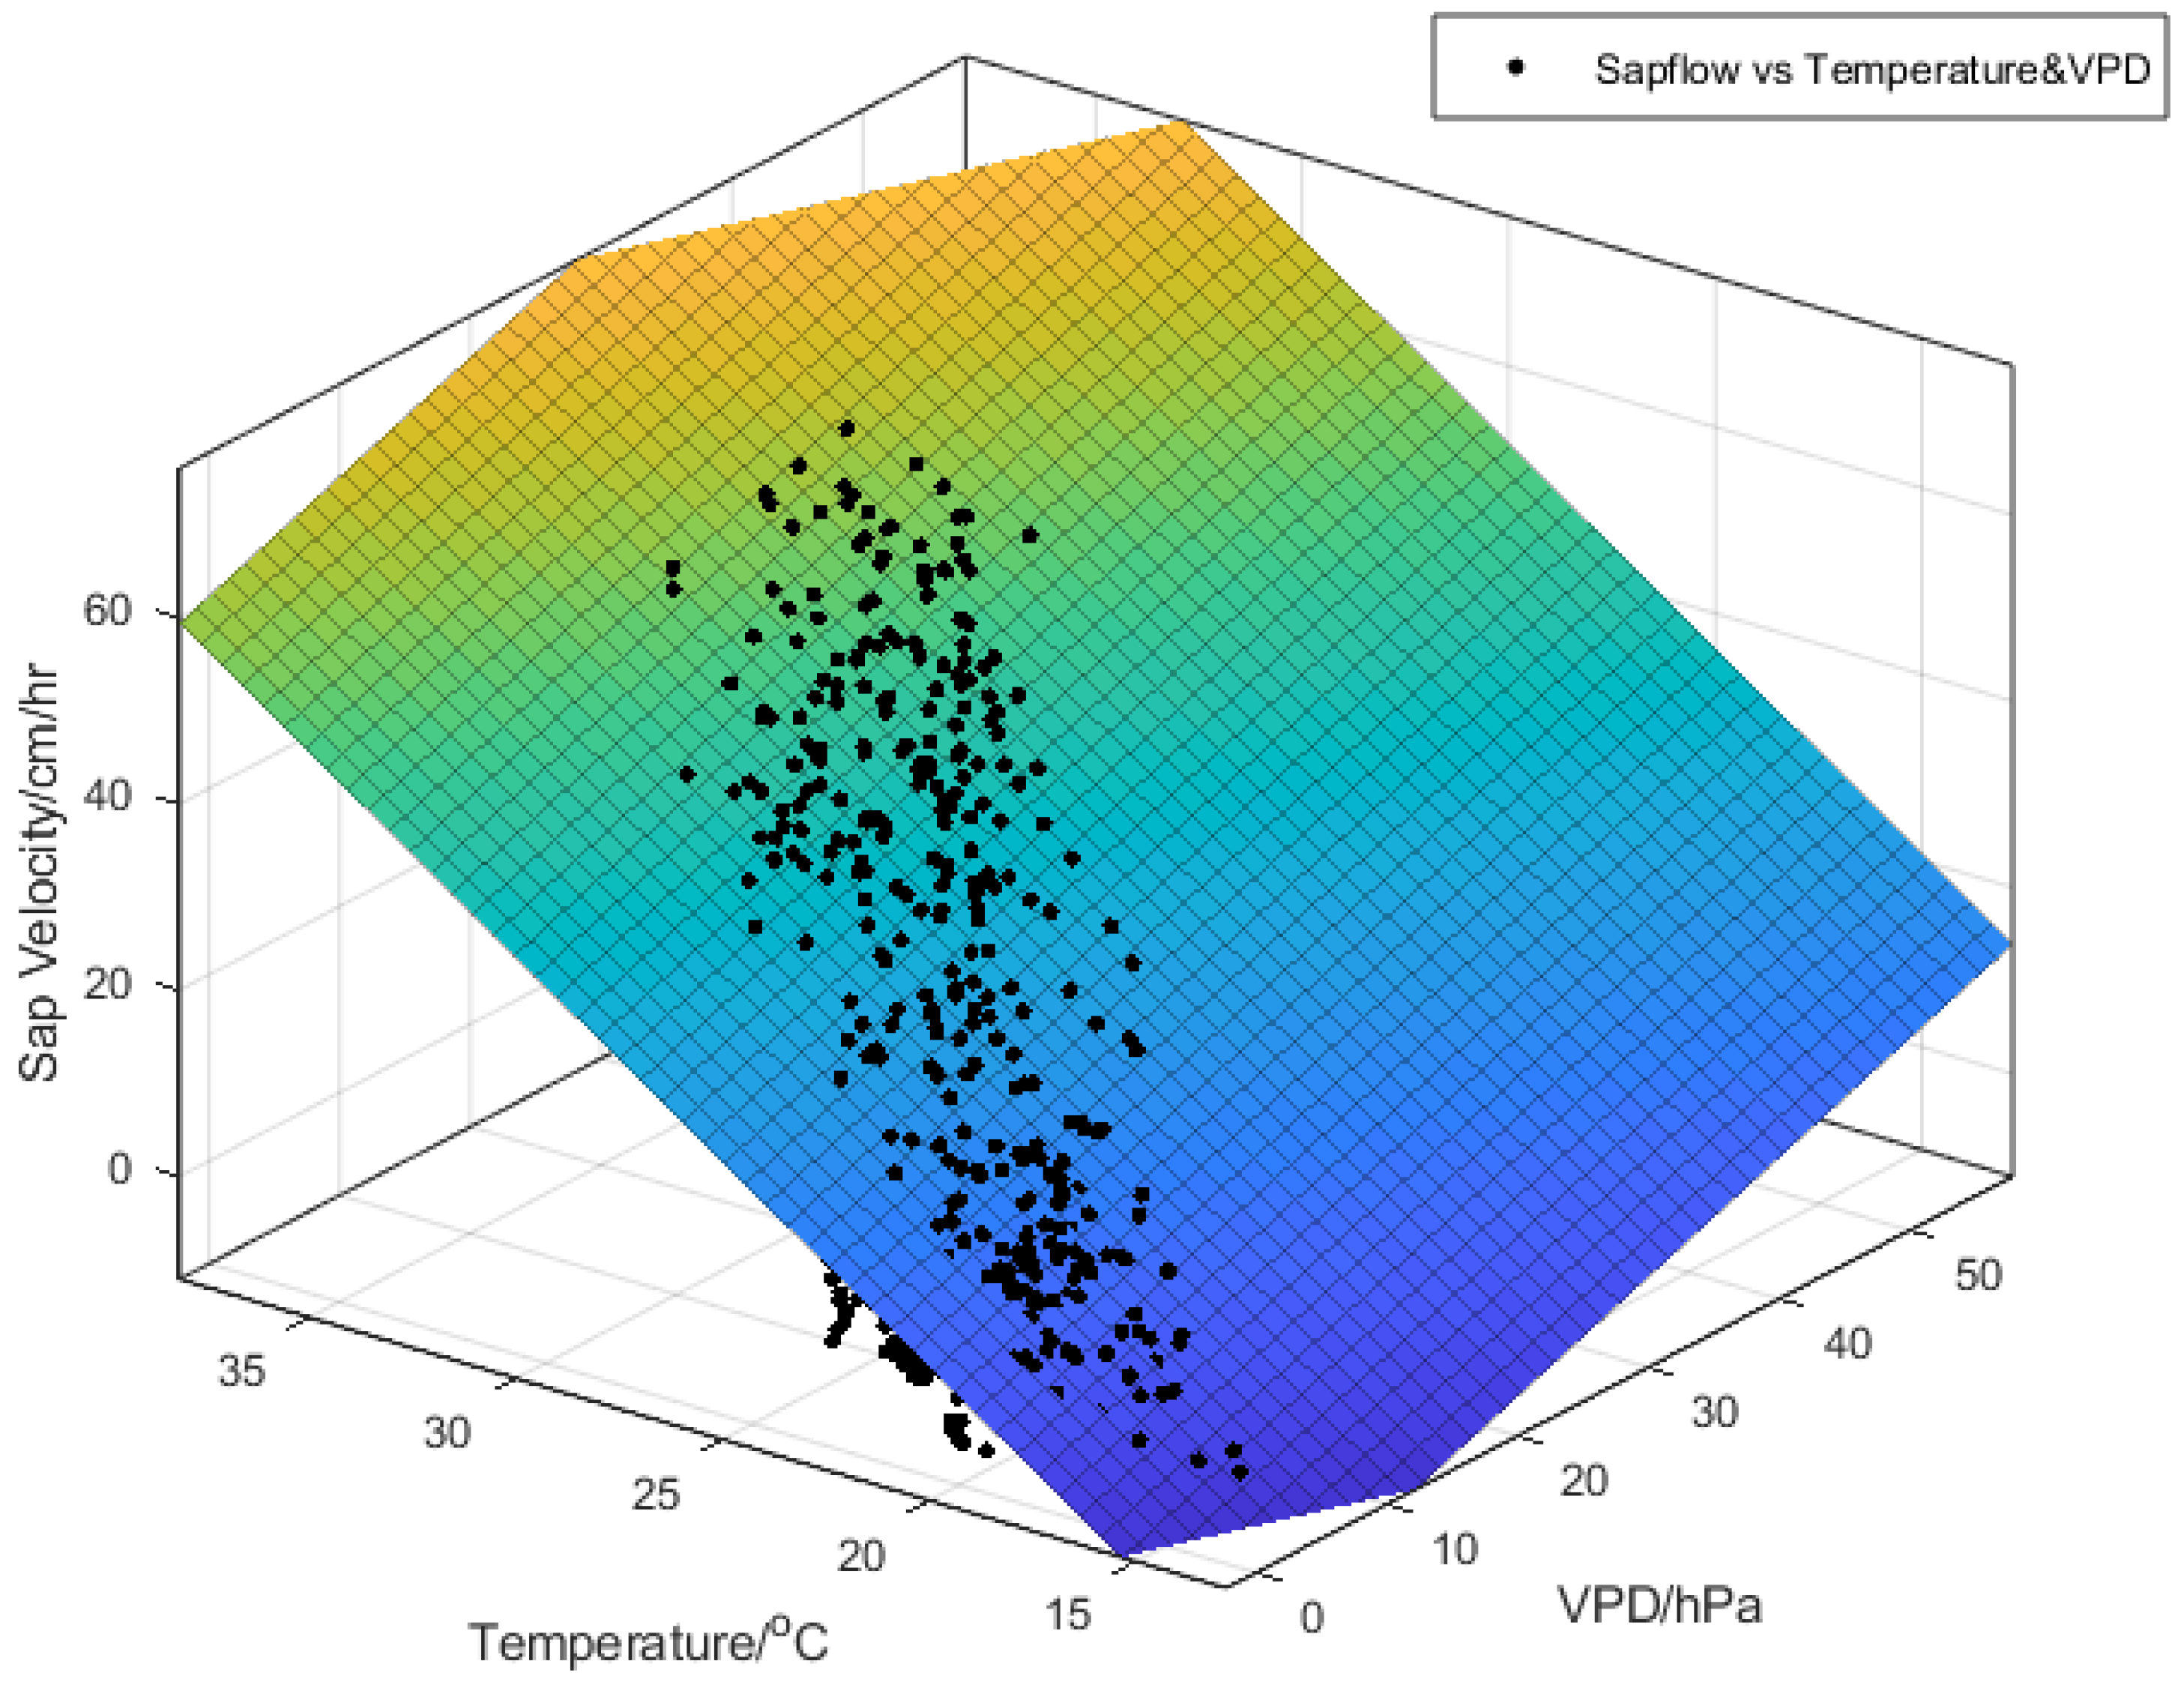
Furthermore, for cities in the desert, the situation may be opposite to the situation in this article. Dry and hot desert wind can bring heat to the city. However, the desert wind will also increase the VPD of the local space, thus amplifying the transpiration rate. Therefore, in such cities, the mitigation potential of trees planted in well-ventilated areas can be maximized. The canopy barrier can reduce the invasion of the desert wind into the city and further enhance the value of the trees in alleviating urban overheating. At the same time, it should be noted that sufficient irrigation of trees in these areas may be a precondition for effective mitigation.
At the same time, the measurement results and analysis of the vertical temperature distribution emphasize the influence of the microenvironment on the cooling effect of the trees. In a highly built urban environment, the warming effect of surfaces, such as concrete sidewalks or asphalt roads, is considerable at noon in the summer, and the warm air flow near the ground surface can be substantial. If the canopies of the trees are not large and dense enough, the warming effects of the surroundings can easily conceal the shading and transpiration cooling effects of the trees, leading to a decreased cooling effect. Therefore, in urban landscape design, to achieve effective vegetation cooling in a highly built environment, trees with a high LAI and a large canopy projection area must be selected.

Author Contributions

Conceptualization, K.G. and M.S.; Data curation, K.G. and J.F.; Formal analysis, K.G., M.S. and J.F.; Investigation, K.G.; Methodology, K.G. and M.S.; Writing—review & editing, J.F. All authors have read and agreed to the published version of the manuscript.

Funding

This research received no external funding.

Acknowledgments

This research was supported in part by the City of Parramatta with the research contract “Parramatta Urban Overheating. Thanks also for the assistance from Riccardo Paolini in the experiment preparation.

Conflicts of Interest

The authors declare no conflict of interest.

References

  1. Santamouris, M.; Cartalis, C.; Synnefa, A.; Kolokotsa, D. On the impact of urban heat island and global warming on the power demand and electricity consumption of buildings—A review. Energy Build. 2015, 98, 119–124. [Google Scholar] [CrossRef]
  2. Santamouris, M. Analyzing the heat island magnitude and characteristics in one hundred Asian and Australian cities and regions. Sci. Total Environ. 2015, 512–513, 582–598. [Google Scholar] [CrossRef] [PubMed]
  3. Santamouris, M. Recent progress on urban overheating and heat island research. Integrated assessment of the energy, environmental, vulnerability and health impact. Synergies with the global climate change. Energy Build. 2020, 207, 109482. [Google Scholar] [CrossRef]
  4. Santamouris, M.; Paolini, R.; Haddad, S.; Synnefa, A.; Garshasbi, S.; Hatvani-Kovacs, G.; Gobakis, K.; Yenneti, K.; Vasilakopoulou, K.; Gao, K.; et al. Heat Mitigation Technologies Can Improve Sustainability in Cities an Holistic Experimental and Numerical Impact Assessment of Urban Overheating and Related Heat Mitigation Strategies on Energy Consumption, Indoor Comfort, Vulnerability and Heat-Related Mortality and Morbidity in Cities. Energy Build. 2020, 217, 110002. [Google Scholar]
  5. Santamouris, M.; Synnefa, A.; Karlessi, T. Using advanced cool materials in the urban built environment to mitigate heat islands and improve thermal comfort conditions. Sol. Energy 2011, 85, 3085–3102. [Google Scholar] [CrossRef]
  6. Feng, J.; Gao, K.; Santamouris, M.; Shah, K.W.; Ranzi, G. Dynamic impact of climate on the performance of daytime radiative cooling materials. Sol. Energy Mater. Sol. Cells 2020, 208, 110426. [Google Scholar] [CrossRef]
  7. Santamouris, M. Using cool pavements as a mitigation strategy to fight urban heat island—A review of the actual developments. Renew. Sustain. Energy Rev. 2013, 26, 224–240. [Google Scholar] [CrossRef]
  8. Santamouris, M. Cooling the cities—A review of reflective and green roof mitigation technologies to fight heat island and improve comfort in urban environments. Sol. Energy 2014, 103, 682–703. [Google Scholar] [CrossRef]
  9. Armson, D.; Stringer, P.; Ennos, A. The effect of tree shade and grass on surface and globe temperatures in an urban area. Urban For. Urban Green. 2012, 11, 245–255. [Google Scholar] [CrossRef]
  10. Edmondson, J.L.; Stott, I.; Davies, Z.G.; Gaston, K.J.; Leake, J.R. Soil surface temperatures reveal moderation of the urban heat island effect by trees and shrubs. Sci. Rep. 2016, 6, 1–8. [Google Scholar] [CrossRef] [Green Version]
  11. Zölch, T.; Maderspacher, J.; Wamsler, C.; Pauleit, S. Using green infrastructure for urban climate-proofing: An evaluation of heat mitigation measures at the micro-scale. Urban For. Urban Green. 2016, 20, 305–316. [Google Scholar] [CrossRef]
  12. Coutts, A.M.; White, E.C.; Tapper, N.J.; Beringer, J.; Livesley, S.J. Temperature and human thermal comfort effects of street trees across three contrasting street canyon environments. Theor. Appl. Climatol. 2016, 124, 55–68. [Google Scholar] [CrossRef]
  13. Rahman, M.A.; Moser, A.; Rötzer, T.; Pauleit, S. Within canopy temperature differences and cooling ability of Tilia cordata trees grown in urban conditions. Build. Environ. 2017, 114, 118–128. [Google Scholar] [CrossRef]
  14. De Abreu-Harbich, L.V.; Labaki, L.C.; Matzarakis, A. Effect of tree planting design and tree species on human thermal comfort in the tropics. Landsc. Urban Plan. 2015, 138, 99–109. [Google Scholar] [CrossRef]
  15. Lobell, D.B.; Bonfils, C.J.; Kueppers, L.M.; Snyder, M.A. Irrigation cooling effect on temperature and heat index extremes. Geophys. Res. Lett. 2008, 35. [Google Scholar] [CrossRef]
  16. Biggs, T.W.; Scott, C.A.; Gaur, A.; Venot, J.-P.; Chase, T.; Lee, E. Impacts of irrigation and anthropogenic aerosols on the water balance, heat fluxes, and surface temperature in a river basin. Water Resour. Res. 2008, 44. [Google Scholar] [CrossRef]
  17. Broadbent, A.M.; Coutts, A.M.; Tapper, N.J.; Demuzere, M. The cooling effect of irrigation on urban microclimate during heatwave conditions. Urban Clim. 2018, 23, 309–329. [Google Scholar] [CrossRef]
  18. Konarska, J.; Uddling, J.; Holmer, B.; Lutz, M.; Lindberg, F.; Pleijel, H.; Thorsson, S. Transpiration of urban trees and its cooling effect in a high latitude city. Int. J. Biometeorol. 2016, 60, 159–172. [Google Scholar] [CrossRef]
  19. Armson, D.; Rahman, M.A.; Ennos, A.R. A comparison of the shading effectiveness of five different street tree species in Manchester, UK. Arboric. Urban For. 2013, 39, 157–164. [Google Scholar]
  20. Rahman, M.; Armson, D.; Ennos, A. A comparison of the growth and cooling effectiveness of five commonly planted urban tree species. Urban Ecosyst. 2015, 18, 371–389. [Google Scholar] [CrossRef]
  21. Wang, C.; Wang, Z.-H.; Wang, C.; Myint, S.W. Environmental cooling provided by urban trees under extreme heat and cold waves in U.S. cities. Remote Sens. Environ. 2019, 227, 28–43. [Google Scholar] [CrossRef]
  22. Rahman, M.A.; Moser, A.; Gold, A.; Rotzer, T.; Pauleit, S. Vertical air temperature gradients under the shade of two contrasting urban tree species during different types of summer days. Sci. Total Environ. 2018, 633, 100–111. [Google Scholar] [CrossRef] [PubMed]
  23. Zweifel, R.; Böhm, J.; Häsler, R. Midday stomatal closure in Norway spruce—Reactions in the upper and lower crown. Tree Physiol. 2002, 22, 1125–1136. [Google Scholar] [CrossRef]
  24. Wang, Y.; Bakker, F.; de Groot, R.; Wortche, H.; Leemans, R. Effects of urban trees on local outdoor microclimate: Synthesizing field measurements by numerical modelling. Urban Ecosyst. 2015, 18, 1305–1331. [Google Scholar] [CrossRef] [Green Version]
  25. Tayyebi, A.; Jenerette, G.D. Increases in the climate change adaption effectiveness and availability of vegetation across a coastal to desert climate gradient in metropolitan Los Angeles, CA, USA. Sci. Total Environ. 2016, 548, 60–71. [Google Scholar] [CrossRef]
  26. Pfautsch, S.; Bleby, T.M.; Rennenberg, H.; Adams, M.A. Sap flow measurements reveal influence of temperature and stand structure on water use of Eucalyptus regnans forests. For. Ecol. Manag. 2010, 259, 1190–1199. [Google Scholar] [CrossRef]
  27. Dimoudi, A.; Nikolopoulou, M. Vegetation in the urban environment: Microclimatic analysis and benefits. Energy Build. 2003, 35, 69–76. [Google Scholar] [CrossRef] [Green Version]
  28. Holden, Z.A.; Klene, A.E.; Keefe, R.F.; Moisen, G.G. Design and evaluation of an inexpensive radiation shield for monitoring surface air temperatures. Agric. For. Meteorol. 2013, 180, 281–286. [Google Scholar] [CrossRef]
  29. Marshall, D. Measurement of sap flow in conifers by heat transport. Plant Physiol. 1958, 33, 385. [Google Scholar] [CrossRef] [Green Version]
  30. Cohen, Y.; Fuchs, M.; Green, G. Improvement of the heat pulse method for determining sap flow in trees. Plant Cell Environ. 1981, 4, 391–397. [Google Scholar] [CrossRef]
  31. Kendall, M.G. The Advanced Theory of Statistics, 2nd ed.; Charles Griffin and Co., Ltd.: London, UK, 1946. [Google Scholar]
Figure 1. (a) site plan of the studied area; the red circles are the canopies of the researched trees. (b) weather station information.
Climate 08 00069 g001
Figure 2. Wind direction distribution of the studied area in summer (a) 2018 and (b) 2019. Average daily wind direction distribution in summer (c) 2018 and (d) 2019.
Climate 08 00069 g002
Figure 3. Daily average wind speed variation of the studied area in summer (a) 2018 (b) 2019.
Climate 08 00069 g003
Figure 4. Multilinear regression for sap flow, canopy temperature, and VPD.
Climate 08 00069 g004
Figure 5. The non-linear fit between the sap flow rate and VPD.
Climate 08 00069 g005
Figure 6. The linear fit between the sap flow rate and canopy temperature.
Climate 08 00069 g006
Figure 7. 0.5–3.5 m height vertical temperature distribution under the canopy.
Climate 08 00069 g007
Figure 8. Canopy temperature difference between (a) sap; (b) VPD; (c) wind speed. The R squares are 0.30, 0.15, and 0.14, respectively.
Climate 08 00069 g008
Figure 9. Recentered component configuration after applying PCA to the observations. The lengths of the vectors indicate the contribution of the specific observation.
Climate 08 00069 g009
Figure 10. Multi-linear regression of the temperature difference and principle components 1 and 2.
Climate 08 00069 g010
Figure 11. Daily variation of the temperature difference.
Climate 08 00069 g011
Figure 12. Canopy temperature sensor location.
Climate 08 00069 g012
Figure 13. Correlation between the air temperature and soil temperature.
Climate 08 00069 g013
Table 1. Tree parameters.
IDHeightTrunk Diameter at 1 m Height
114 m1 m
212 m0.9 m
Table 2. Details of the principle components.
Component1Component2Component3
VPD0.39497241−0.156666920.905236031
Sap flow rate0.883478921−0.205421118−0.421031067
Wind speed0.2519162380.9660526080.057276247

