Article

Sugar Beet Harvests under Modern Climatic Conditions in the Belgorod Region (Southwest Russia)

by
Maria G. Lebedeva
1,
Anthony R. Lupo
2,3,*,
Alexandr B. Solovyov
4,
Yury G. Chendev
4 and
Lalith M. Rankoth
2
1
Department of Geography and Geoecology, Belgorod State University, Belgorod 308015, Russia
2
School of Natural Resources, Atmospheric Sciences Program, University of Missouri, Columbia, MO 65211, USA
3
Missouri Climate Center, University of Missouri, Columbia, MO 65211, USA
4
Department of Natural Resources Management and Land Cadastre, Belgorod State University, Belgorod 308015, Russia
*
Author to whom correspondence should be addressed.
Climate 2020, 8(3), 46; https://doi.org/10.3390/cli8030046
Submission received: 12 February 2020 / Revised: 16 March 2020 / Accepted: 18 March 2020 / Published: 20 March 2020

Abstract

:
The weather and climate conditions contributing to the energy and water availability during the sugar beet vegetation period within the Belgorod Region were studied. It was found that the sugar beet yield in the region currently depends on the climate at the 15% level. The variability and trends of sugar beet yields and sugar content dynamics correlated with that of the observed during a 60-year period are determined using statistical techniques such as correlation, and regression and time series analysis. The variation for the sugar content (or “sugariness”) over this period as related to the regional weather and climate showed a nonlinear relationship. The sugar content is related inversely to the combined (via the Hydrothermal Coefficient—HTC) influence of precipitation and temperature during the warm season (temperatures between 15 and 20 °C). A decrease (increase) in HTC contributes to an increase (decrease) in the beet sugar content. However, it was noted that during sugar content increases, there is a decrease in the regional sugar beet yield. We can conclude that the increased sugar content of beet in relevant years compensates for the decrease in the yield parameter. Finally, there was a correlation between the regional variability in the sugar content of beets with Bruckner solar cycles and atmospheric teleconnections in that during warm and dry periods, the sugar content increases, and for cold and wet periods is reduced.

1. Introduction

The study of crop yield and agro-climatic potential and the agriculture and crop production outcome is of great interest to the agricultural communities in regions that economically depend on agricultural production. It is known that the processes contributing to crop growth and yield formation are dependent on many factors. The major factors are: the influx of solar radiation and the degree to which it is absorbed upon sowing, moisture, heat, soil fertility, the level of agricultural technology, and the variety and characteristics of plants. Knowledge of the specific degree to which these individual factors contribute, the choice of the most significant of these factors, and the quantitative expression or description of their relationship with the harvest, all contribute to the successful and practically significant analysis of the complex processes occurring in agrocenoses (e.g., [1,2,3]).
The consideration of both climatic and hydrologic factors is important in order to increase crop yields. Skillful and effective exploitation of favorable weather and climate conditions and overcoming harmful conditions is one of the main objectives of modern agriculture (e.g., [4]). Currently, efforts are being directed toward projecting changes in agro-climatic conditions related to crop production including sugar beet (air and soil temperature regimes, the amount and mode of precipitation, the duration of the growing period, changes in soil fertility, carbon dioxide content in the atmosphere, etc.) (e.g., [5,6,7]). The determination of these factors and their impact on the dynamics of crop yields is the subject of many recent studies (e.g., [6,7,8]).
In this regard, there is the agrometeorological problem of determining the degree of influence of climate-related variability and changes in environmental factors on plant life cycle and crop yields (e.g., [9] and references therein). They [9] demonstrated that interannual variability (e.g., El Nino and Southern Oscillation—ENSO) and interdecadal variability of local climate strongly contributed to variability the corn and soybean yield in the Midwestern USA. References [10,11,12] examine climatological factors such as drought, sowing time, and light absorption on sugar beet yields in particular. An assessment of these variables is necessary for optimal crop allocation and production planning [13,14,15].
Agro-climatic factors, the most important of which are temperature and precipitation, play a decisive role in determining what crops are planted and crop yields regionally, although quantitative estimates of this impact are ambiguous. The main industrial crops in the Belgorod Region, which is within the Central Chernozem Region in southwest and central Russia, are sugar beet and sunflower. The yield dynamics for these industrial crops within the region are influenced significantly by the specifics of the material and technical conditions for growing these crops, the observed changes in regional climate and agro-climatic resources, and increasing anthropogenic impacts on the environment. Thus, the aim of this research is to study the effect of heat and moisture availability on the yield and sugar content of sugar beets, and compare these results to studies conducted in other regions. In particular, the study will focus on the weather and climate conditions during the sugar beet growing season and relating the variability in weather and climate to the sugar beet yield character.

2. Data and Methods

In order to meet the objective of this research, the temperature and precipitation characteristics within the Belgorod Region (southwest Russia) (Figure 1) during the vegetated period or the growing season for sugar beet will be examined. The meteorological and agrometeorological data set (temperature, °C, and precipitation, mm) was provided by the Belgorod Center for Hydrometeorology and Environmental Monitoring (BCHEM) at six stations for the period from 1954 to 2018, or 65 years. The BCHEM also provided the calculated characteristics and methodologies for assessing the agricultural productivity of climate, i.e., the bioclimatic potential (BCP) using the methodology of [16], which accounts for the thermal character of the region as well as the seasonal humidity deficit. In addition to the BCP, the moisture index in [17] was also calculated. Reference [14] used both of these quantities to study and compare yield potential for the central United States and southwest Russia. Additional material used in this research was the catalog of Northern Hemisphere (NH) circulation regime classifications (called essential circulation mechanisms or modes—ECM) as proposed by [18] in 1946 and used widely in later studies (e.g., [17,19,20]) and discussed in detail by [20,21,22].
The Hydrothermal Coefficient (HTC) is also an indicator of moisture content published by the Soviet climatologist G. T. Selyaninov [23]. The HTC is determined by the ratio of the precipitation amount (r) (mm) during the period with average daily air temperatures above 10 °C to the sum of temperature (∑T*) during the same time-period (multiplied by 0.1), that is:
HTC = r / (0.1 ∑T*)
The HTC is one of the indicators of agricultural growth in different parts of the world (e.g., [14,24,25,26]). As an important agro-climatic indicator that defines the resource and energy demands of crops, the period when the daily mean temperature greater than 10 °C is a viable baseline because it describes the period of active vegetation for a majority of plants, including sugar beets. Changes or spatial variations in the HTC are a function of changes or spatial variations in the daily mean temperature and/or precipitation during the period with temperatures above 10 °C. Crops also have a maximum temperature limit for productivity, which could also be tested. For sugar beet in the Belgorod region, this is 40 °C, which is an extremely rare occurrence here.
Meteorological data were also used to calculate the two additional climatic indexes connected to agricultural productivity such as the BCP (see [14] or [24,25,26]) index and the moisture index (Cp). The moisture index is actually part of the calculation of the BCP (2a). For this reason, we use the BCP baseline for our region (reference [27]), and this baseline can be found in [14]. BCP is a function of complex meteorological factors that determine the potential growth and development for plants in order to evaluate the agricultural productivity of climate. This index empirically takes into account the difference between the surface temperature and dew point, or the humidity deficit.
According to references [14,24], the maximum biological productivity is determined by the total influence of heat, moisture, and soil fertility. For a particular region with similar soil conditions, the BCP index can be reduced to a function of heat and moisture expressed as a ratio. In particular, the BCP is the ratio of the sum of the average daily temperatures over the period of active vegetation (°C) to the analogous sum for a reference region (°C), multiplied by the coefficient reflecting the influence of moisture (moisture index) on agricultural yield. The formulae are:
BCP = Cp(CH) (ΣT*) (ΣTbase)−1
Cp(CH) = (0.5 Px + Pm) (0.18 ΣT*)−1
where BCP is the relative bioclimatic potential, Cp(CH) is the moisture index (reference [17]), ΣT* is the same as in reference [14,17], ΣTbase is the base sum of the average daily temperatures for the period of active vegetation for this region (19.0 °C). In Equation (2b), Px is the total precipitation during the cold period of the year, for the Belgorod Region this is October to March. The variable Pm is the total precipitation for the warm period of the year, here April to September [14,17].
Regional sugar beet yield data were collected directly from Belgorod Region farming operations. These data are archived at the Department of Agriculture and Environmental Reproduction (DAER) of the Belgorod Region, and these archived data were used in this research. The weighted average yield for sugar beet in the Belgorod Region during the period ranged from 11.0 to 42.4 tons ha−1. The weighted average yield from the entire planting area in the Belgorod Region is calculated by dividing the gross harvest by planting area.
The mathematical and statistical methodologies used here can be found in, for example, [14,24]. A correlation analysis was used to determine the dependence of sugar beet yield with the main indexes based on agrometeorological conditions. The trend lines and higher order functions were calculated to describe the dynamics of changes in the yield of sugar beet and its sugar content over the 65-year period. All the trend lines were tested at the 95% confidence level using analysis of variance (ANOVA) techniques and the F-test in particular. Additionally, the trends were tested using the Mann–Kendall (e.g., [28]) and Theil–Sen [29] tests at the 95% confidence level, which are generally regarded as more stringent or able to handle outliers better than the F-test.
In order to analyze the weather and sugar beet yield character time series data, Fourier transforms were applied to the series from 1960 to 2018 after the mean for all variables and trend for the yield data were removed. Removing the mean and the trend for yield data was done in order to at least partly account for increases in yield due to technology (e.g., [9]). Fourier transforms are used routinely to convert data in Cartesian space (x, y, z, t) to wave space. Plots of the wave power versus wave number then can be analyzed in order to extract dominant periods from a time series. These spectral peaks can be tested for statistical significance against a red or white noise continuum (e.g., [28]). This depends on whether there is an a priori expectation that low frequency (red) or no particular frequencies (white) should be dominant. Occasionally, this type of analysis is referred to as the ‘method of cycles’ (e.g., reference [9] and references therein). The underlying assumption is that the system being studied behaves like a regular pendulum or is cyclical (or at least quasi-cyclical).
A cross-spectral analysis (e.g., [30]) then was performed using the HTC, sugar beet yield and beet sugar content time series in order to determine the link between sugar beet yield character and weather. This analysis involves the convolving of two spectra and then examining the resultant spectrum (or the covariance). These spectral peaks were also tested for statistical significance using the same techniques used for the original spectra.

3. Results

3.1. Climatology of the Belgorod Region—Previous Results

Climatic factors, especially temperature, have a direct impact on the state and functioning of the components of terrestrial ecosystems, their biodiversity and productivity. This section will set the climatological context for the Belgorod Region and the next section will be related to sugar beet productivity. The mean winter season long-term temperature within the Belgorod Region has increased significantly over the past 65 years (e.g., [22]). The mean January temperature alone has increased by about 4 °C (see [22]). In recent years, however, there has been a tendency to increase the annual amplitude for temperature—mainly due to increases in the July temperature (Figure 2). Since the middle of the 20th century, annual temperature amplitude has averaged at 25.5 °C and 28.0 °C in the northern and southern parts of the Belgorod Region, respectively [31]. Additionally, in the last 15 years, there has been an increase in the surface temperatures during the warm season of about 1.3 °C [32].
The increase in Belgorod Region seasonal mean temperatures for the period 1971–2015 has been accompanied by an increase in the length of the warm season or vegetated period by five to seven days and an increase in warm season mean temperature (0.4 °C—significant at the 90% confidence level, e.g., [14]). The start of the active vegetation season has shifted to an earlier date—now the beginning of April, which is consistent with earlier studies (e.g., [33]).
The growing season duration for sugar beet (average daily temperature above 5 °C) for the period 1980–2010 increased by an average of five to seven days; however, during the period 1971–2015, the duration of the active vegetation period increased by 7–10 days. During the same period, a statistically significant positive trend (at the 90% confidence level) was observed (the coefficient of the linear trend is 2 days decade−1). There have been symmetric changes in the timing for the start and end of the active growing season. During the spring season, it arrives three to five days earlier, while in the autumn, the period of active vegetation has been extended ending three to five days later than during the 1950s–1970s (reference [33,34]).
The beginning of a more meridional NH circulation regime commencing in 1998 has been associated with an increased frequency of meteorological extremes [22,33,34,35], and led to more variable conditions for crop growth interannually [14]. Reference [20] demonstrates that this recent meridional NH flow period is significantly different from the expectation that zonal and meridional flow regimes should occur nearly equally in frequency or from the mean long-term (1899–2018) frequency of meridional NH flow regimes.
Dangerous agrometeorological phenomena are observed throughout the year (references [20,31]) such as prolonged anticyclonic regimes or atmospheric blocking have caused damage to crops in the Belgorod Region. However, the frequency with which these anticyclonic regimes occur vary interannually (e.g., [36]). In particular, the recent increase in anticyclonic atmospheric circulation regimes has led to higher temperatures and more variable precipitation in the summer, contributing to an increased likelihood of drought. In spite of this, the total annual mean precipitation within the Belgorod Region has not changed significantly since the middle of the 20th century [22]. During the warm season, there was a slight increase in mean precipitation observed, however, this was not statistically significant (e.g., [22,33]).
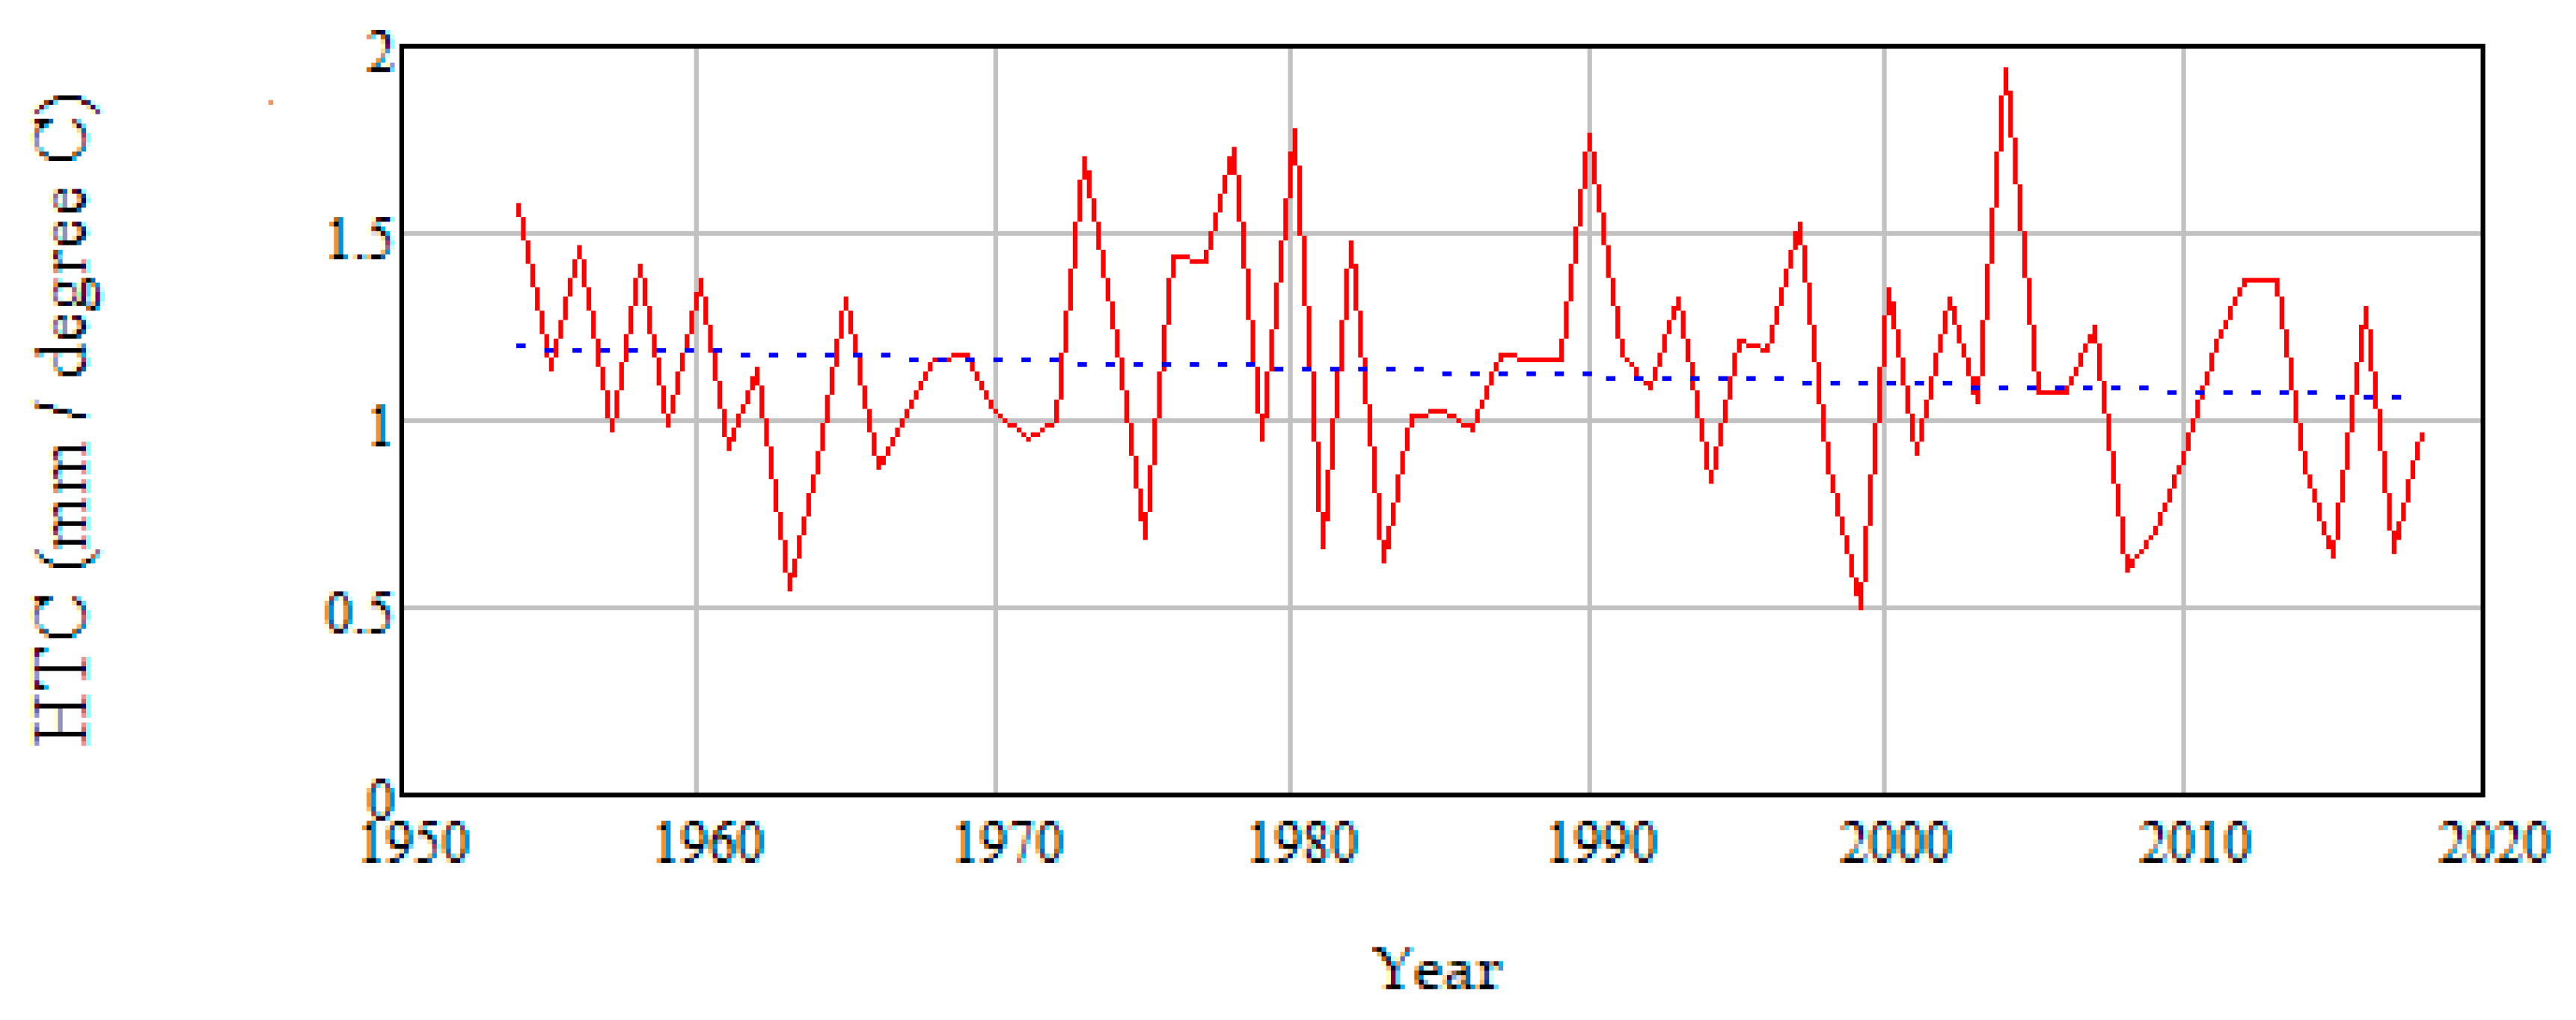
Since 1947 within the Belgorod Region, the mean HTC was 1.11 and the index varies from 1.20 in the northwest part of the region to 0.90 in the southeast of the region. Adverse weather conditions for the cultivation of agricultural crops occur during years when the value of the HTC is 1.00 to 1.40. However, in particular, favorable drought conditions emerge during years in which the HTC is less than 1.00 [24,37,38]. Since the late 1980s, there has been a weak decrease in the HTC variable against the background of strong variability ranging from to 0.67 to 3.30 (Figure 3).
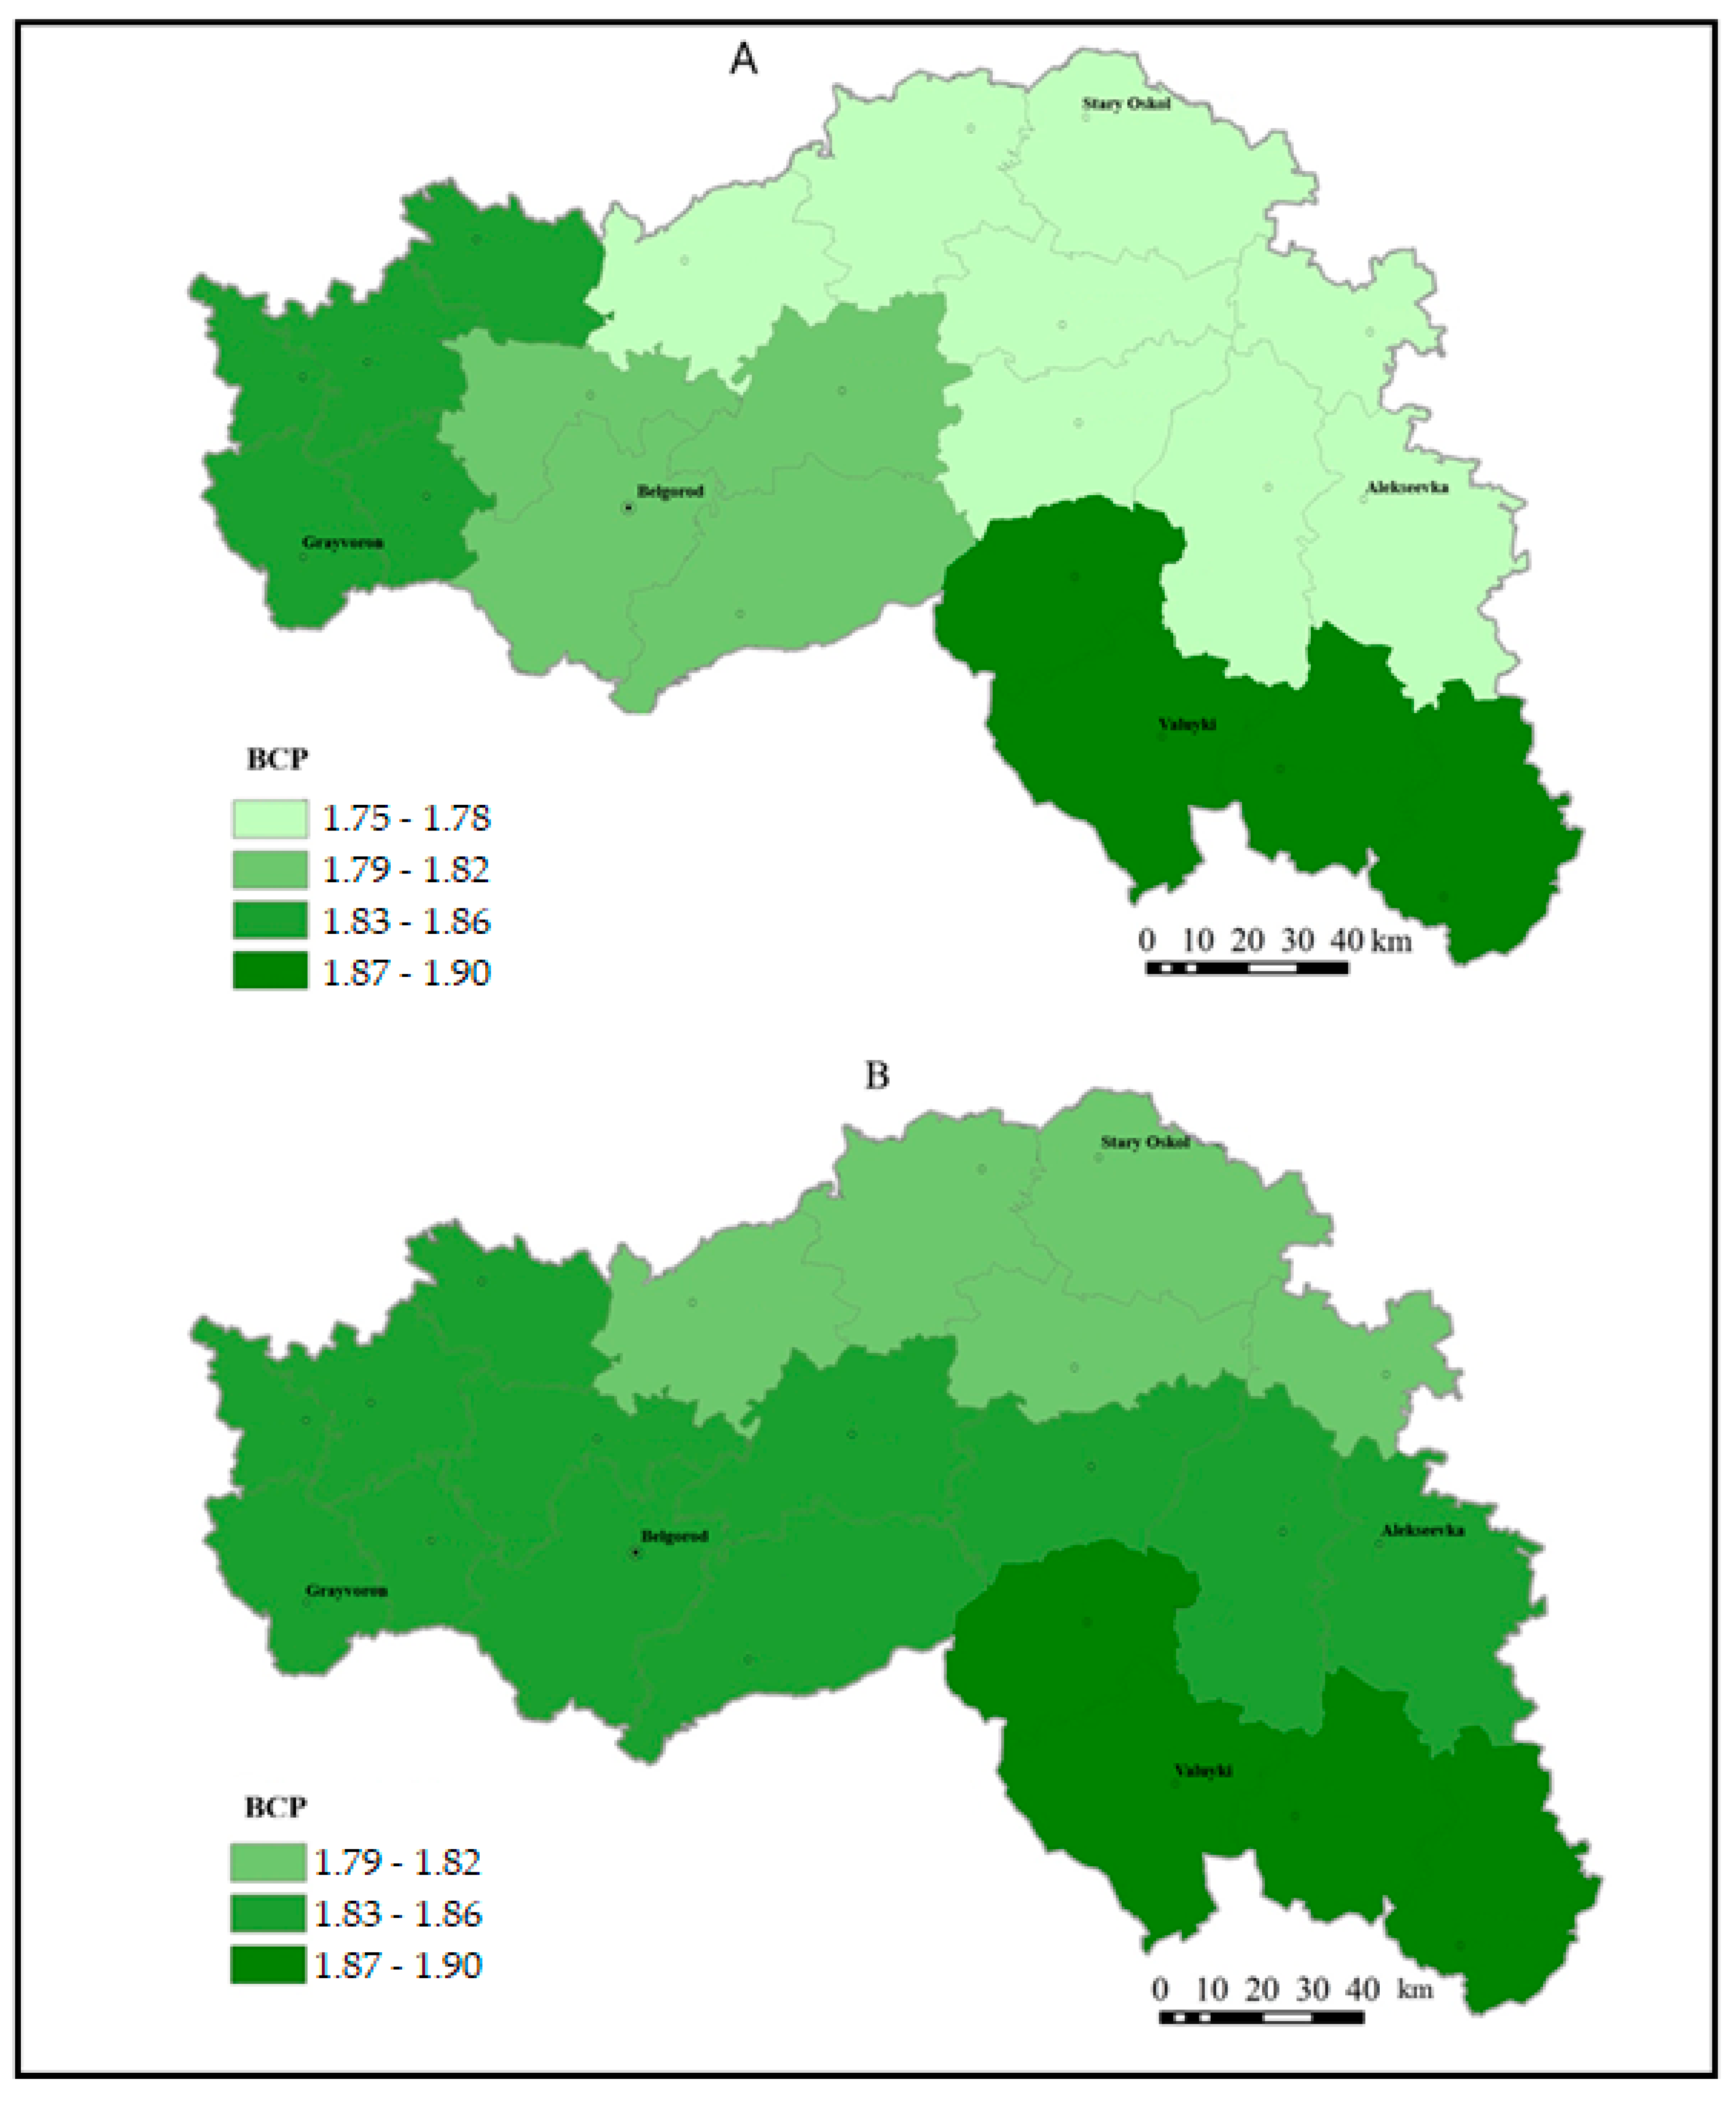
The BCP in the Belgorod Region has changed over the years from 1.81 during the period 1988–2000, to 1.85 since the beginning of the 21st century (2001–2015) (reference [14]). A qualitative assessment of the regional BCP for the two periods showed that during the first period 96% of growing season BCP conditions were characterized as typical, but only 4% of growing seasons were relatively moist. During the second period, the BCP variability increased along with the average BCP. For 81% of growing seasons, the BCP were typical, but in 10% of cases the BCP was characterized as dry and 9% as moist (Figure 4). This demonstrates that regional agricultural conditions have become more variable since the turn of the 21st century.

3.2. Sugar Beet Yield Character and Climatic Conditions in the Belgorod Region

One of the most important cash crops for the Belgorod Region is sugar beet, which was ranked third as measured by cultivated area within the region until 1991. During the period from 1965 to 1991, the planted acreage for this profitable crop was steady, within the range of 147-164 thousand hectares (ha). Since 1991, due to economic and technological reasons, the planted acreage for sugar beet crops began to decline quickly. The minimum number for sugar beet acreage was recorded in 2008, amounting to 75.9 thousand ha.
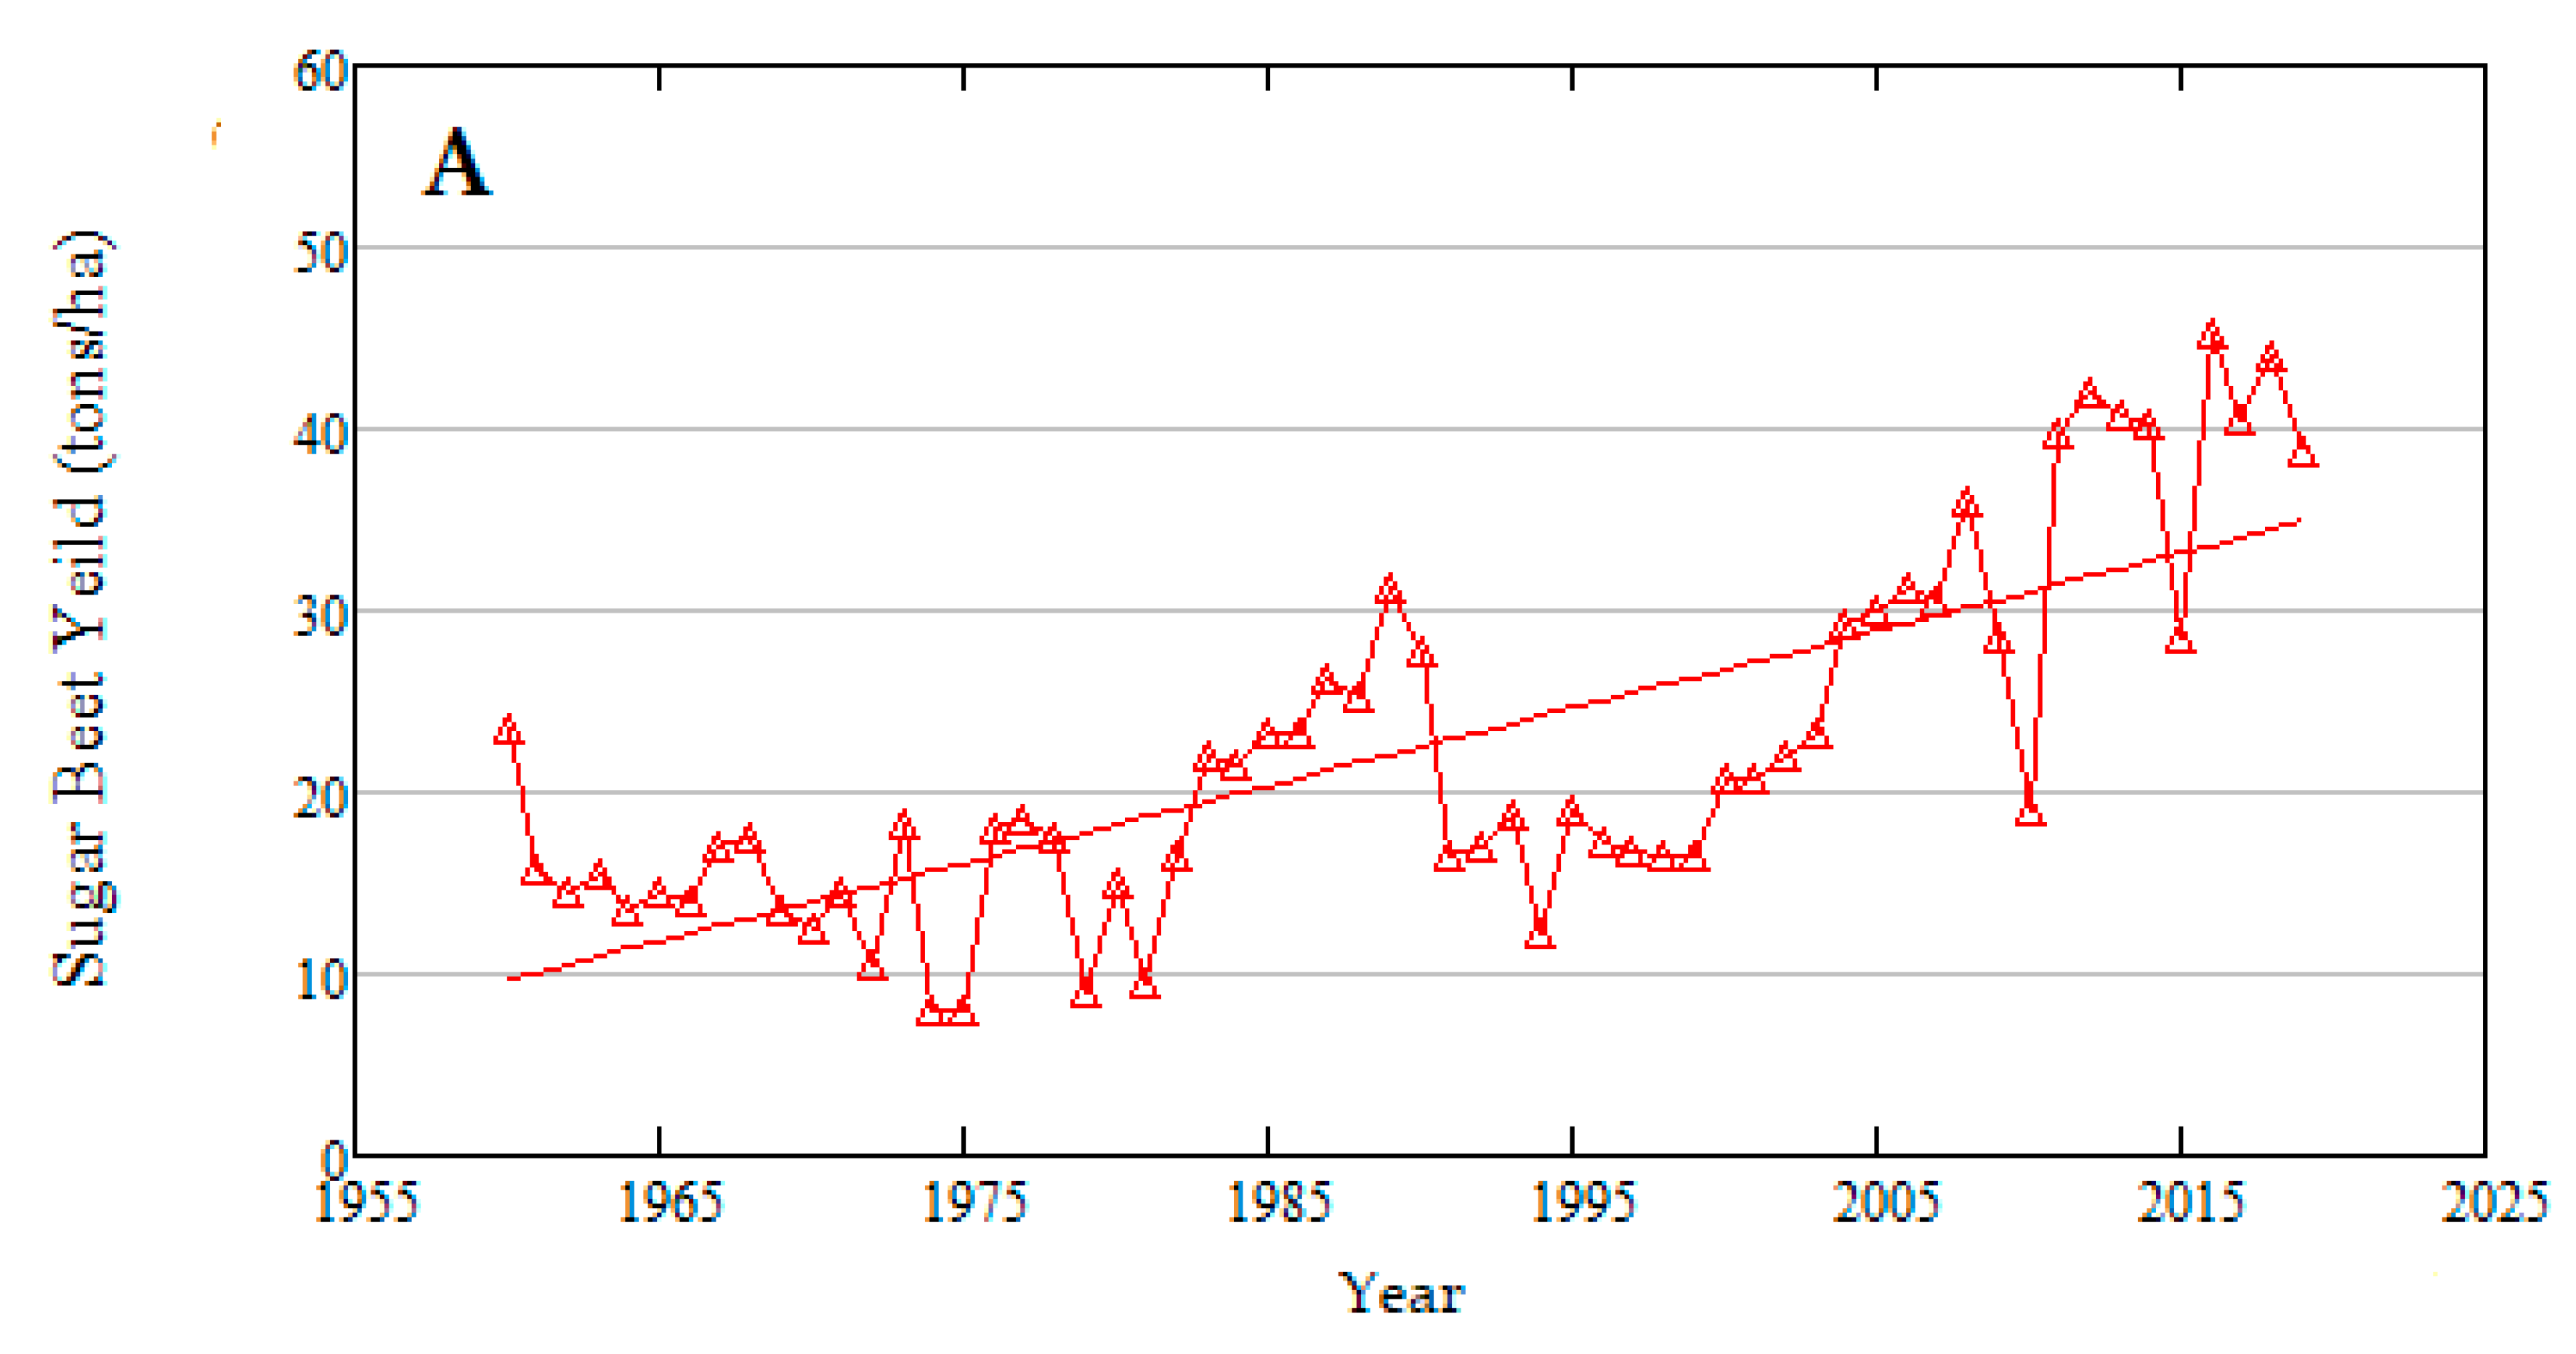
The HTC (Figure 3) and sugar beet yield over sub-regions in the Belgorod Region is shown in Figure 5. Note that the sugar beet yield has increased in recent years (the trend is significant at the 95% confidence level using all three tests)—at least some of this increase likely due to better agricultural technology as found by many studies of crop yield (e.g., reference [9]) in spite of less land area being devoted to the crop (e.g., [39]). Significant changes in the thermal conditions during the warm season, or HTC, have also occurred since 1998, which is linked to changes in the general circulation as stated above (e.g., [14,20,21,22,23]). The correlation between HTC and sugar beet yield is 0.11, which is not significant. However, if the sugar beet yield is detrended in order to at least partly remove technology trends, the correlation is 0.22, which is significant at the 90% confidence level.
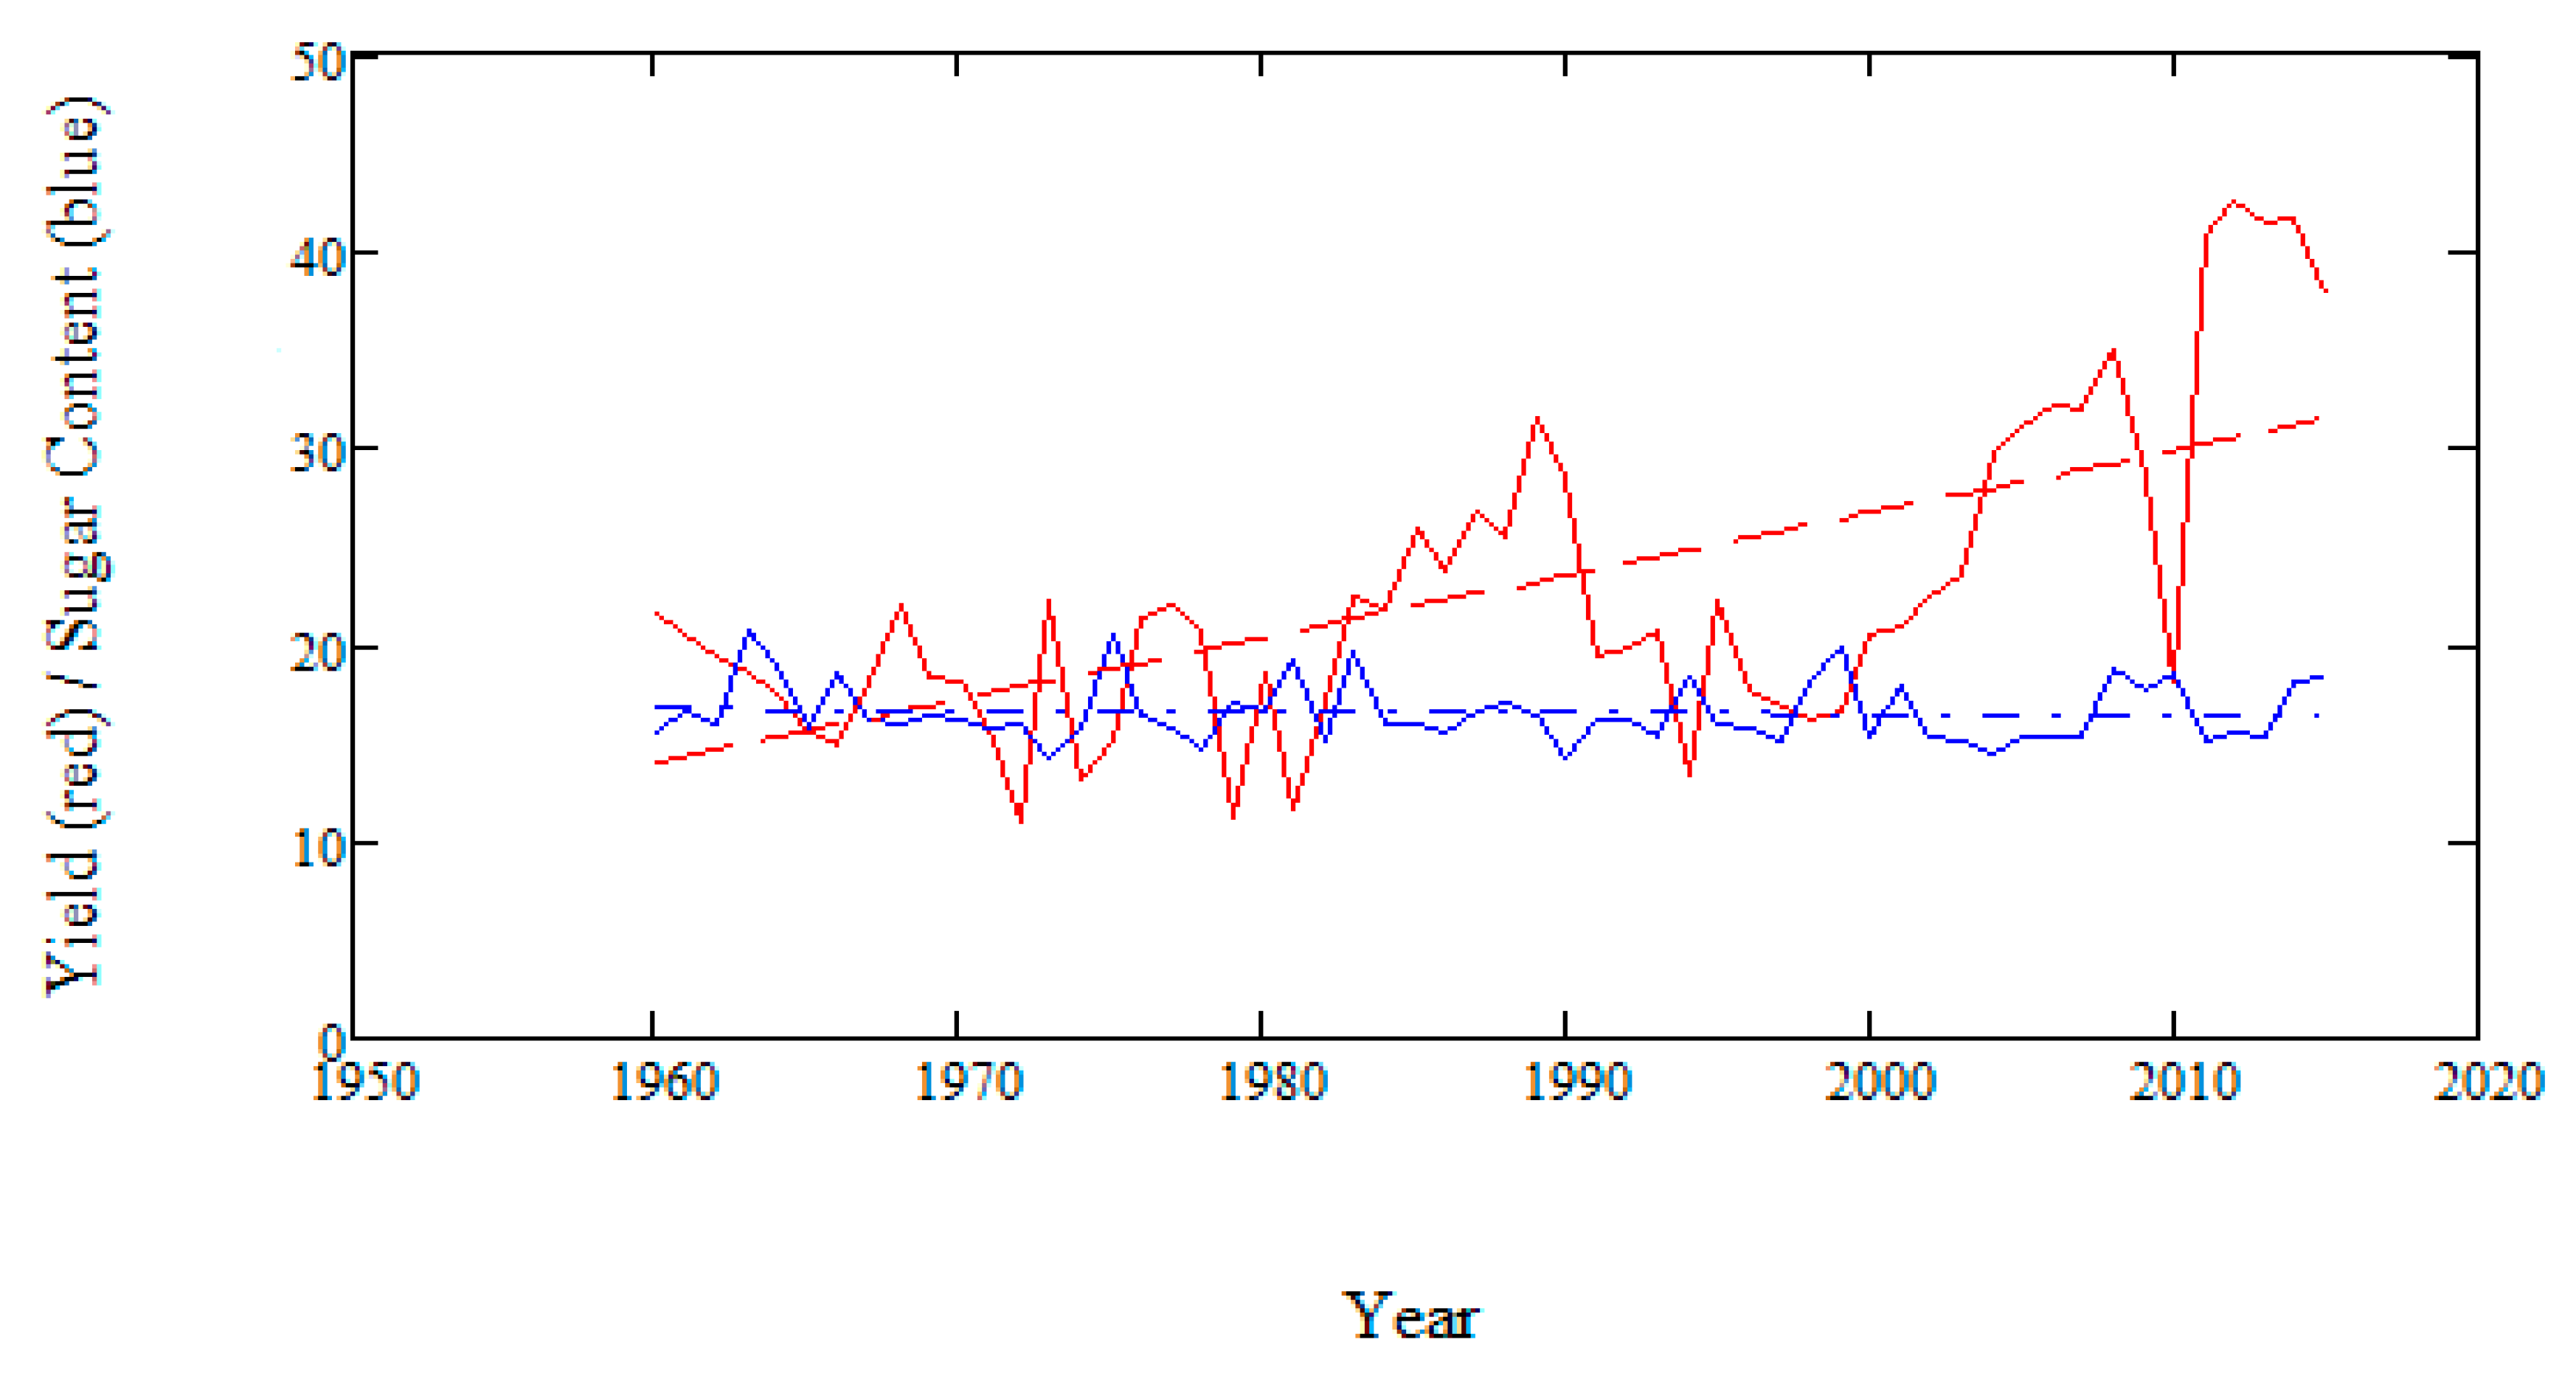
The three lowest harvests for this root crop per unit area were noted in 1972 (11.0 tons ha−1), 1979 (11.2 tons ha−1), and 1981 (117 tons ha−1) (Figure 6). The reason for low sugar beet yields during these years was dry conditions in May and June. During these months, the HTC for 1972, 1979, and 1981 was 0.95, 0.28, and 0.38, respectively. Furthermore, shown in Figure 6 is the sugar beet content and this variable correlated with beet yield at −0.21, which is significant at the 90% confidence level. If the sugar beet yield is detrended, the correlation improves to −0.26, which is significant at the 95% confidence level. Thus, there is an inverse relationship between sugar beet yield and content. The increase in sugar beet yield in Figure 6 was statistically significant at the 95% confidence level using all three tests for trend; however, the sugariness trend was not significant at the 95% confidence level when using these three tests.
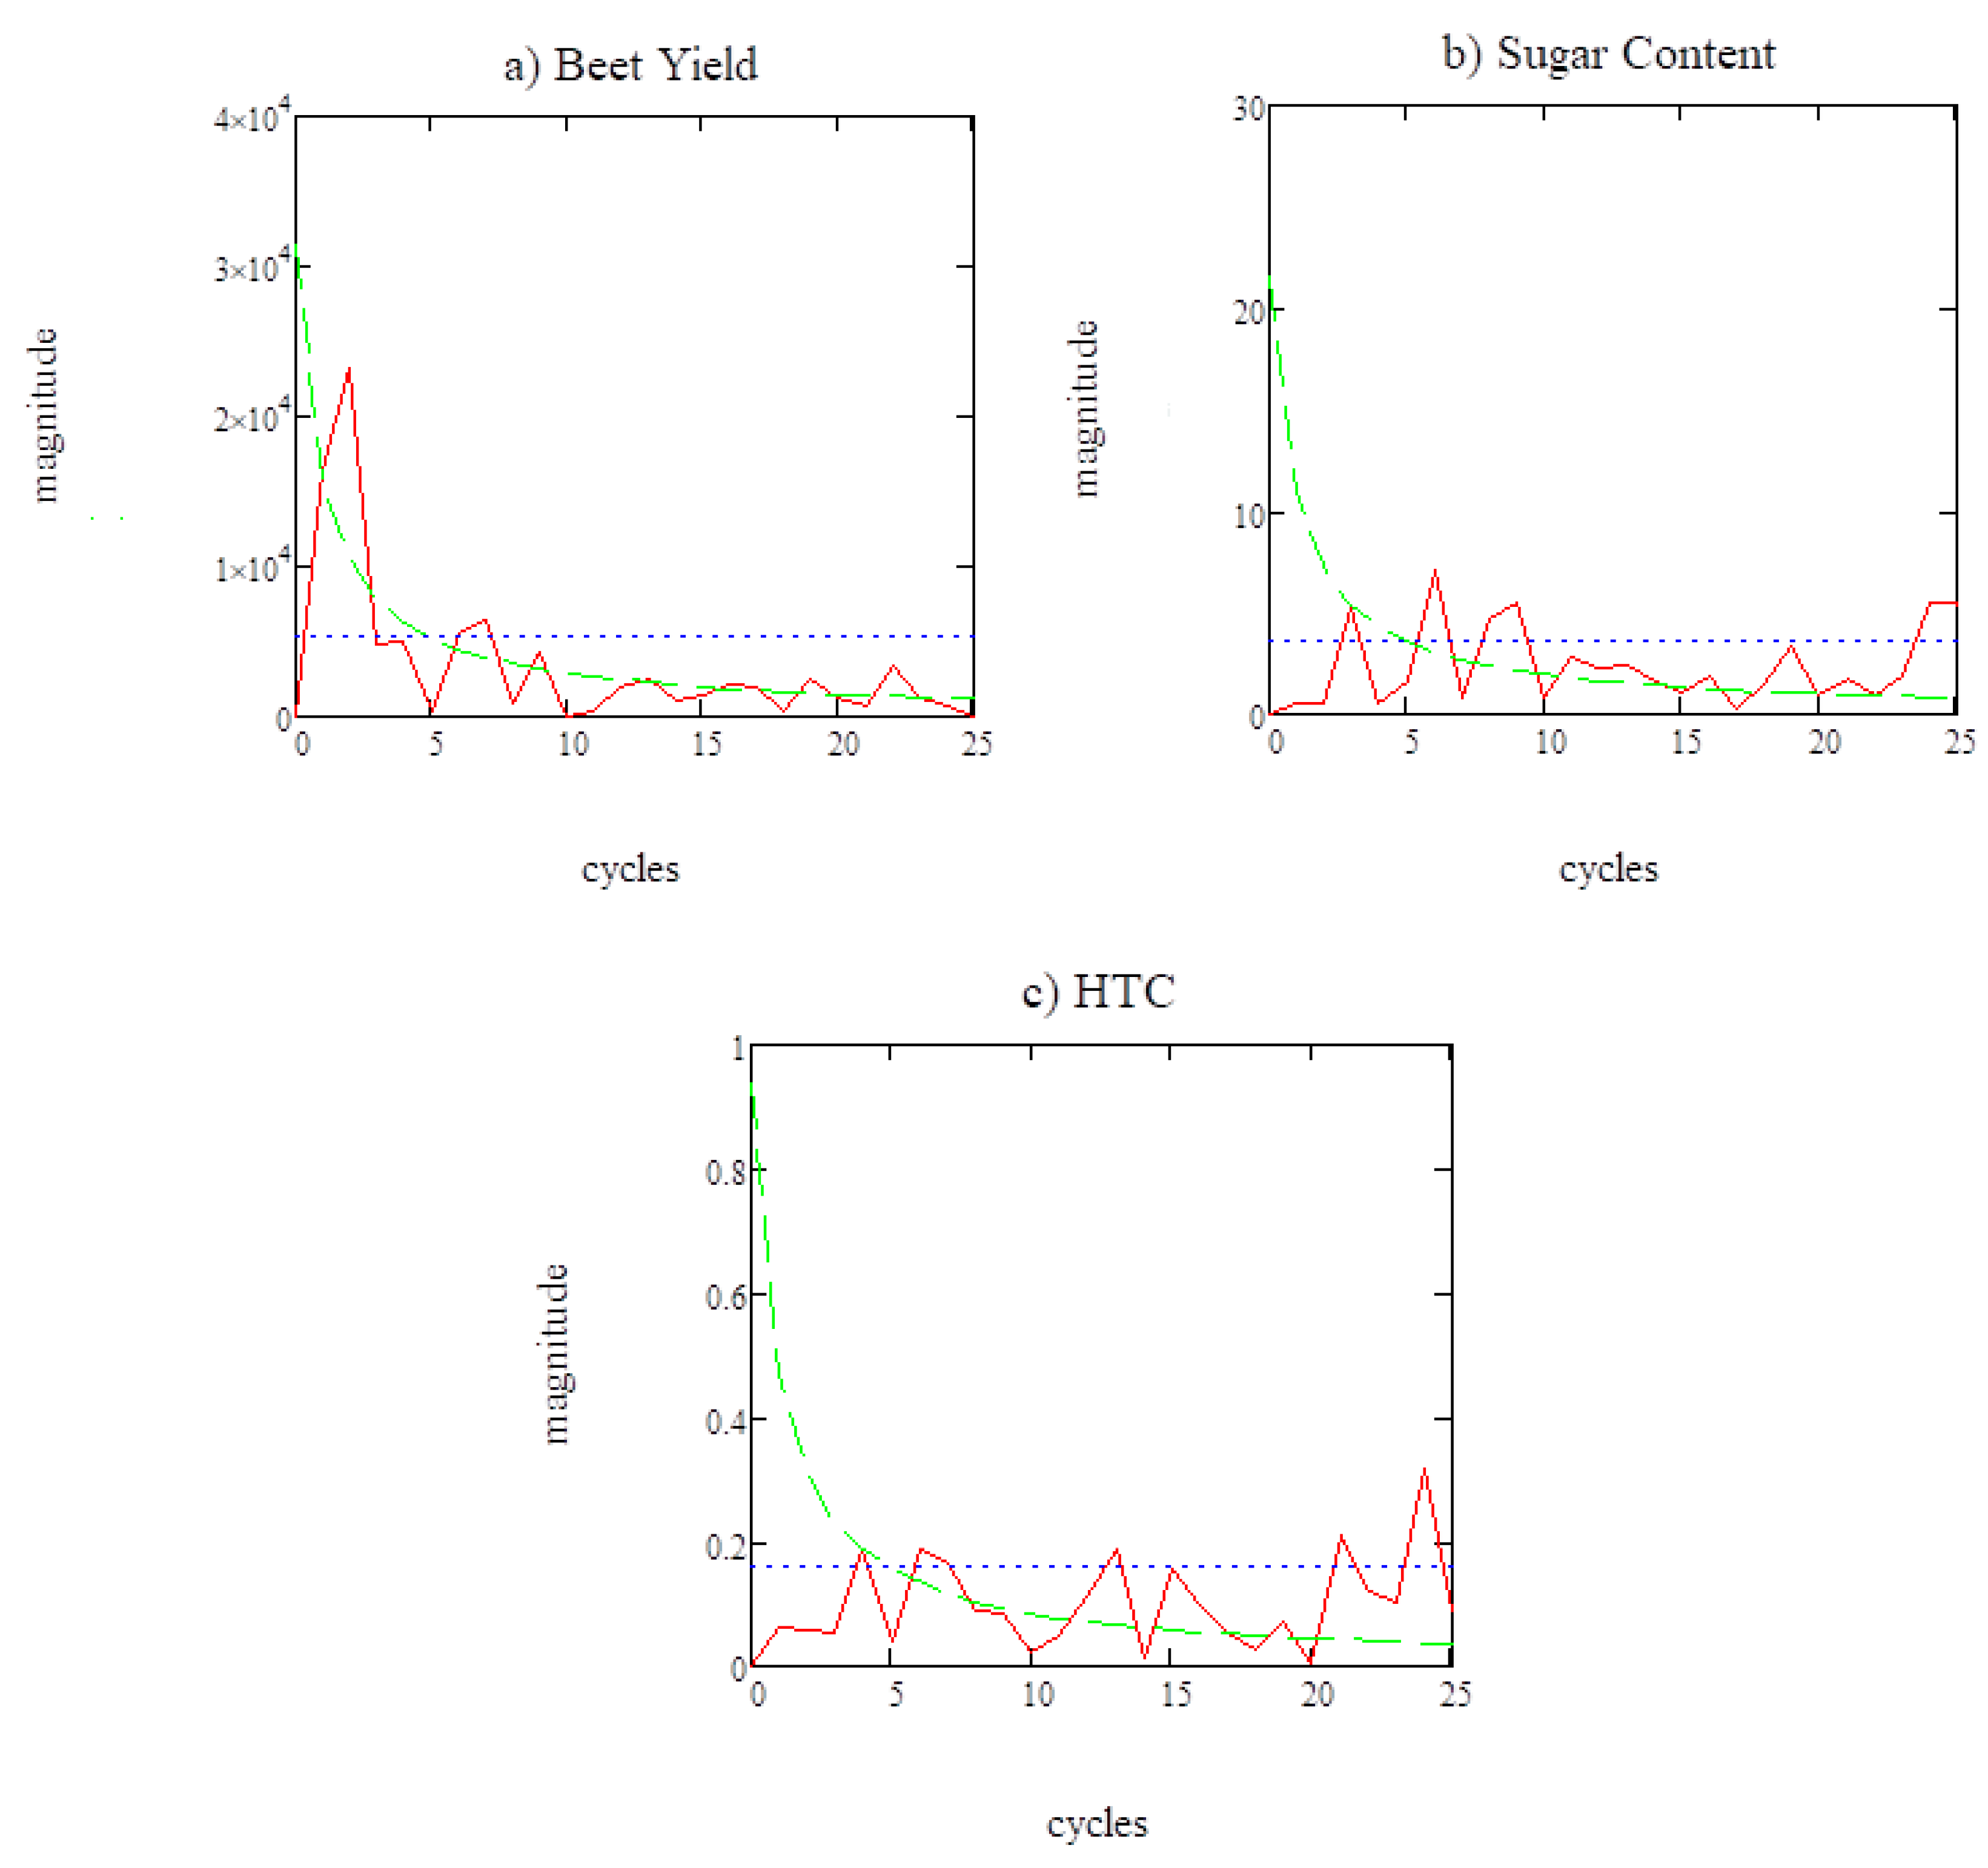
Large-scale atmospheric circulation has a significant influence on regional-scale surface weather conditions and the occurrence of extreme values in meteorological parameters (e.g., [20,34,35,36,40]). As such, changes and variability in the regional general circulation [14,20,22] have had a significant impact on sugar beet yields. In order to test this, the time series for sugar beet yields and HTC were transformed into spectral space (Figure 7a,c) and there were statistically significant (at the 95% confidence level) peaks found for beet yield (HTC) at wave number two and seven (four, six, 13, 15, 21, 24) per 59 years. These correspond to a periodicity of about eight and 30 years (two-to-five, 10, and 15 years) in the beet yield and HTC series.
Performing a cross-spectral analysis between these two variables (Figure 8a) yields statistically significant variability at wave numbers four, six, nine, 14, 17, and 24 per 59 years, corresponding to a period of two-to-seven, 10, and 15 years. The former is related likely to El Nino and Southern Oscillation (ENSO) (see [14]). The latter may be related to the decadal mode of the North Atlantic Oscillation (NAO) (reference [22]), while the middle value (10) is likely an interannual-interdecadal interaction mode [9]. The 30-year period found in the sugar beet yield may relate to the interdecadal mode of the NAO ([22] and references therein), but which may also be related to the Bruckner solar cycle found to be influential in Central Chernozem Regional forest growth [24]. Additionally, these results are supported by Table 1, and the HTC results are similar to those of [14]. Even stronger statistical relationships are present (Table 1) if these data are partitioned by an ENSO phase across each phase of the NAO (similar to [9,41]).
The most optimal period climatically for sugar beet was the period between 1970 and 1987 (e.g., [20,22]). During this time-period, the temperature regime of this region contributed positively to the outcome of crop yield, then from 1989-1996, the temperature regime became a negative influence.
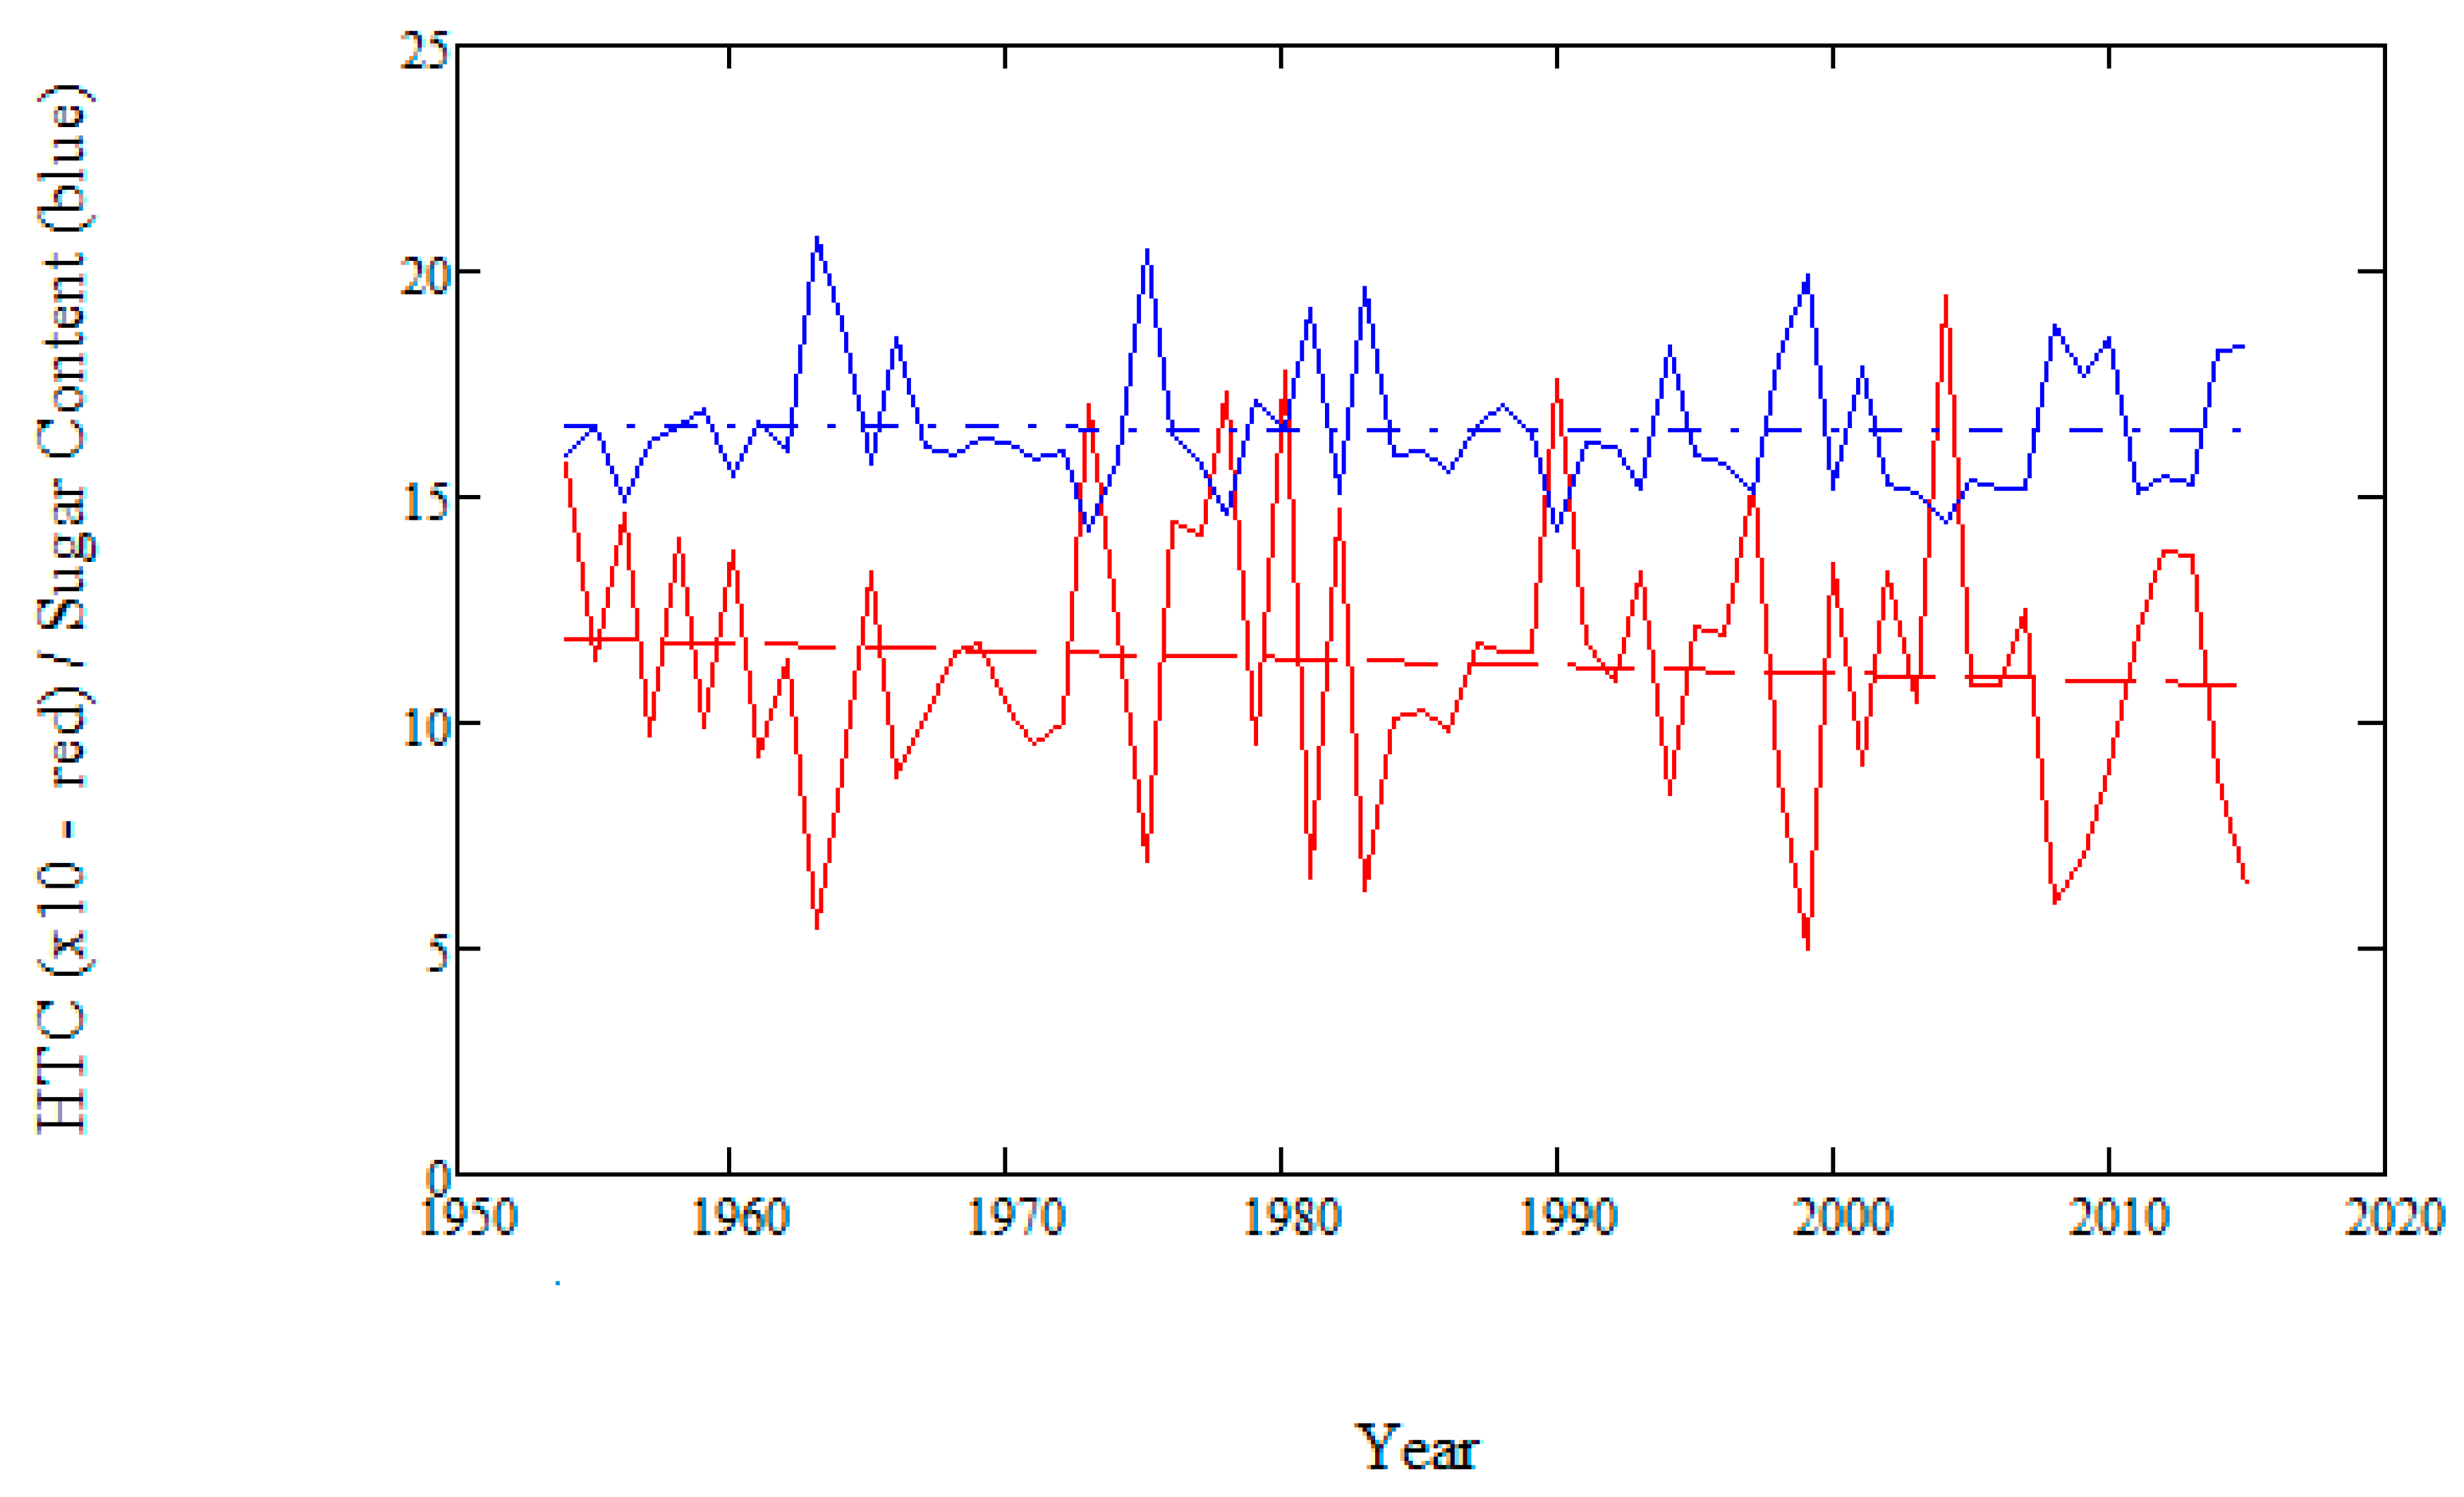
Sufficient amounts of precipitation in combination with typical temperature conditions during the intensive growth period for sugar beet ensures the establishment of a high yield. Then, dry and sunny September conditions lead to sugar accumulation and the improvement in other characteristics for the technological quality of sugar beet crops. Here, the contribution of the influence of agro-climatic factors in the yield of sugar beet was estimated to be in the range of 12% to 18% (depending on the land and soil characteristics). Furthermore, the sugar content of beets from 1954–2018 (Figure 9) in this region correlated at -0.80 with HTC, which is significant at greater than the 99% confidence level. The trend in sugar content of beets over this 60-year period in relation to the climate conditions as represented by HTC in the Belgorod region showed a non-linear dynamic character (Figure 7). In spite of the strong negative correlation both showed concurrent decreases albeit at different rates (Figure 9). The decreasing trend in HTC was statistically significant at the 95% confidence level using the F-test, but not statistically significant using the Mann–Kendal or Theil–Sen tests.
Then, Figure 7b shows significant variability in sugar content at wave numbers three, six, nine, 19, and 24 corresponding to periods of roughly three, six to eight, 10, and 20 years. The cross-spectral analysis (Figure 8b) shows significant peaks at wave numbers 16, 19, and 21, representing strong variability at the two-to-four-year period, which is related to ENSO [14] in the region. Spatially, the amount of precipitation during the growing season in the forest-steppe part of the Belgorod region is 30–100 mm more than in the steppe, which provides an additional increase in yield of 1.5–5 tons ha−1 of sugar beet. However, the analysis above demonstrates that depending on the moisture character of a growing season, the yield of sugar beet varies. This is due to interannual fluctuations in rainfall during the critical growth period of beets during the year (from 100 to 300 mm), as well as the close dependence of beet yields on precipitation in the second half of summer.
We have identified variability in the dynamics of the beet sugar content in the Belgorod region in connection with the observed climate change and variability during the period under review. However, there is also a strong negative correlation between sugar beet yield and sugar content of the beets. The spectral analysis of sugar beet content has significant variability for the periods of three, six to eight, 10, and 20 years as above, while the cross-spectral analysis with sugar beet yield showed significant peaks at wave numbers seven, 10, 14, and 23 corresponding to strong interannual variability in the two-to-eight-year time frame (Figure 8c). Thus, the sugar beet content and yield vary inversely and these two quantities are related to the interannual climate variability (ENSO) of the region. These results can also be used in planning for short term (a few decades) future climatic conditions and variability as projected using general circulation models (e.g., [42]).
A comparison of these results to those of other studies demonstrates that the production of sugar beets is limited strongly by weather and climate (e.g., [15]) since water demand for this crop is not typically met by precipitation alone. The mean production worldwide has been about 58 tons ha−1 [43], and according to this source, a good yield is 40-60 tons ha−1. The yields for the Belgorod Region during this study were about 11 – 42 tons ha−1. Since 2010, yields in this region have been close to the lower bound of a “good” yield (Figure 6), in spite of the fact that climatologically this region would not be as favorable as those in other parts of the world. Thus, the impact of technology on sugar beet yield is profound here as it is for other crops (e.g., [9]). As in other studies, the sugar content in the beets is related to weather and climate (see [15] and references therein). Furthermore, we found the sugar content in this region is inversely related to yield and modern increases in yield over the period are associated with decreases in sugar content (e.g., [15] and references therein).

4. Summary and Conclusions

This study examined the relationship between climatic variables such as temperature and precipitation to the character of sugar beet harvest in the Belgorod Region in southwest Russia from 1954 until 2018. This area is identified as the Central Chernozem Region and is known for being agriculturally fertile land. The climatic data were provided by the BCHEM and the sugar beet data were provided by the DAER of the Belgorod Region. Variables that combine the effect of temperature and precipitation such as the HTC and BCP were used here and related to the sugar beet harvest as well as the sugar content of the beets themselves. Trends and variability found in these variables were tested using standard statistical tests. The following results were gathered. These would be useful for sub-seasonal and seasonal forecasters or the agricultural community in the Belgorod region similar to the results of [9] used in central USA.
  • The modern climate era has been associated with the strong interannual variability of meteorological parameters such as temperature and precipitation (the last few decades of instrumental observations and calculated quantities like HTC or BCP). The trend in HTC has been downward and the trend (using ANOVA) and variability found in HTC is statistically significant.
  • The current climate changes are favorable for the traditional branches of agricultural production, including the cultivation of sugar beet. The yield of sugar beet during years of insufficient moisture is reduced, but this occurs against the background of a sharp increase in the sugar content of tubers.
  • It was found here that the yield of sugar beet in the region currently depends on climatic forcing (approximately 15%). The factors that caused the corresponding changes were revealed using regression analysis. This study of sugar content of the tubers during the 60-year period in the Belgorod Region displayed a nonlinear dynamic relationship.
  • At high values of HTC, the sugar content decreases, and in years with low values of HTC the sugar content increases. The correlation coefficient between the sugar content of beet with HTC is -0.80, which is significant at the 99% confidence level. This reflects an inverse relationship between the HTC trend and the production for this crop, and this crop has the potential to reduce the degree of soil moisture deficits observed in recent decades.
  • The significant influence on sugar content for the sugar beets is related to the precipitation and temperature during periods with temperatures between 15 and 20 °C. It should be noted that during periods of sugar content increase, there is a general decrease in the yield of sugar beet in the region, in short, high sugar content, low yield. These results are similar to those found elsewhere.
  • However, this study shows that not only are sugar beet crop yields related to teleconnections and other natural cycles, there is also a correlation between the dynamics of changes in the sugar contents of beet in the region. This was demonstrated using a time series analysis and a statistical analysis. These cycles are the Bruckner solar cycles and interannual (e.g., ENSO) or interdecadal atmospheric teleconnections (e.g., NAO), that during warm and dry periods, the sugar content increases, and in cold and wet is reduced.

Author Contributions

The following contributions were identified by using the author initials. Conceptualization, M.G.L., Y.G.C. and A.B.S.; methodology, M.G.L., Y.G.C., A.B.S and L.M.R.; software, M.G.L., Y.G.C., A.B.S and L.M.R.; validation, M.G.L., Y.G.C., A.B.S and L.M.R.; formal analysis, M.G.L and A.R.L.; investigation, M.G.L., Y.G.C., A.B.S and L.M.R.; resources, M.G.L. and Y.G.C.; data curation, M.G.L.; writing—original draft preparation, M.G.L.; writing—review and editing, A.R.L.; visualization, M.G.L., Y.G.C., A.B.S and L.M.R.; project administration, M.G.L. and Y.G.C.; funding acquisition, M.G.L. and Y.G.C.. All authors have read and agreed to the published version of the manuscript.

Funding

This research received no external funding.

Acknowledgments

The authors acknowledge the time and effort of the three anonymous reviewers whose contributions have made this a stronger paper.

Conflicts of Interest

The authors declare no conflict of interest.

References

  1. Maximov, S.A. Weather and agriculture. Leningr. Gidrometeoroizdat 1963, 19, 203. [Google Scholar]
  2. Keppenne, C.L. An ENSO Signal in Soybean Futures Prices. J. Clim. 1995, 8, 1685–1689. [Google Scholar] [CrossRef] [Green Version]
  3. Hu, Q.; Buyanovsky, G. Climate Effects on Corn Yield in Missouri. J. Appl. Meteorol. 2003, 42, 1626–1635. [Google Scholar] [CrossRef]
  4. Qi, A.; Kenter, C.; Hoffmann, C.; Jaggard, K. The Broom’s Barn sugar beet growth model and its adaptation to soils with varied available water content. Eur. J. Agron. 2005, 23, 108–122. [Google Scholar] [CrossRef]
  5. Monteith, J.L.; Moss, C.J. Climate and the efficiency of crop production in Britain. Philos. Trans. R. Soc. B Boil. Sci. 1977, 281, 277–294. [Google Scholar]
  6. Manderscheid, R.; Pacholski, A.; Weigel, H.-J. Effect of free air carbon dioxide enrichment combined with two nitrogen levels on growth, yield and yield quality of sugar beet: Evidence for a sink limitation of beet growth under elevated CO2. Eur. J. Agron. 2010, 32, 228–239. [Google Scholar] [CrossRef]
  7. Okom, S.; Russell, A.; Chaudhary, A.J.; Scrimshaw, M.; Francis, R. Impacts of projected precipitation changes on sugar beet yield in eastern England. Meteorol. Appl. 2017, 24, 52–61. [Google Scholar] [CrossRef] [Green Version]
  8. Ashabokov, B.M.; Calow, H.M.; Fedchenko, L.M.; Stasenko, D.V. Some problems and methods of agriculture adaptation to climate change. Regional effects of global climate change (causes, effects, predictions). In Proceedings of the International Scientific Conference, Voronezh, Russia, 26–27 June 2012; pp. 360–365. [Google Scholar]
  9. Henson, C.; Market, P.; Lupo, A.; Guinan, P. ENSO and PDO-related climate variability impacts on Midwestern United States crop yields. Int. J. Biometeorol. 2016, 61, 857–867. [Google Scholar] [CrossRef]
  10. Hoffmann, C.M. Sucrose Accumulation in Sugar Beet under Drought Stress. J. Agron. Crop. Sci. 2010, 196, 243–252. [Google Scholar] [CrossRef]
  11. Hoffmann, C.M.; Kluge-Severin, S. Light absorption and radiation use efficiency of autumn and spring sown sugar beets. Field Crop. Res. 2010, 119, 238–244. [Google Scholar] [CrossRef]
  12. Hoffmann, C.M.; Kluge-Severin, S. Growth analysis of autumn and spring sown sugar beet. Eur. J. Agron. 2011, 34, 1–9. [Google Scholar] [CrossRef]
  13. Ivanov, A.L. Problems of global manifestation of technogenesis and climate change in agriculture. In Proceedings of the World Conference on Climate Change, Moscow, Russia, 29 September 2003; pp. 339–346. [Google Scholar]
  14. Lebedeva, M.G.; Lupo, A.R.; Henson, C.B.; Solovyov, A.B.; Chendev, Y.G.; Market, P. A comparison of bioclimatic potential in two global regions during the late twentieth century and early twenty-first century. Int. J. Biometeorol. 2017, 62, 609–620. [Google Scholar] [CrossRef]
  15. Hoffmann, C.M.; Kenter, C. Yield Potential of Sugar Beet—Have We Hit the Ceiling? Front. Plant Sci. 2018, 9. [Google Scholar] [CrossRef]
  16. Shashko, D.I. Agroclimatic Resources of the USSR. Leningr. Gidrometeoroizdat 1985, 41, 248. [Google Scholar]
  17. Sapozhnikova, S.A. To clarify of agricultural land capability climate assessment, Agro climatic resources of natural zones of the USSR and their use. Leningr. Gidrometeoroizdat 1970, 26, 80–92. [Google Scholar]
  18. Dzerdzeevskii, B.L.; Kurganskaya, V.M.; Vitviskaya, Z.M. The Classification of Circulation Mechanisms in the Northern Hemisphere and the Characteristics of Synoptic Seasons. Synoptic Meteorology. Tr. N.-i. institutions Ch. Control Hydrometeorological Services under the Council of Ministers of the USSR. Central Institute Forecasts. Moscow. Leningr. Gidrometeoroizdat 1946, 2, 80. [Google Scholar]
  19. Zolotokrylin, A.N.; Titkova, T.B. The dependence of the climate anomalies in the growing season forest on the Russian plains on large-scale atmospheric circulation. Izv. Geog. 1998, 5, 121–128. [Google Scholar]
  20. Kononova, N.K.; Lupo, A.R. Dynamics of the Global Atmospheric Circulation and Climate Variability and Change. Atmosphere 2020, 11. in press. [Google Scholar]
  21. Lebedeva, M.; Krymskaya, O.; Lupo, A.R.; Chendev, Y.G.; Petin, A.; Solovyov, A.B. Trends in Summer Season Climate for Eastern Europe and Southern Russia in the Early 21st Century. Adv. Meteorol. 2016, 2016, 1–10. [Google Scholar] [CrossRef] [Green Version]
  22. Lebedeva, M.; Lupo, A.R.; Chendev, Y.G.; Krymskaya, O.V.; Solovyev, A.B. Changes in the Atmospheric Circulation Conditions and Regional Climatic Characteristics in Two Remote Regions Since the Mid-20th Century. Atmosphere 2019, 10, 11. [Google Scholar] [CrossRef] [Green Version]
  23. Selyaninov, G.T. On agricultural climate valuation. Proc. Agric. Meteor. 1928, 20, 165–177. [Google Scholar]
  24. Matveev, S.; Chendev, Y.G.; Lupo, A.R.; Hubbart, J.A.; Timashchuk, D.A. Climatic Changes in the East-European Forest-Steppe and Effects on Scots Pine Productivity. Pure Appl. Geophys. Pageoph. 2016, 174, 427–443. [Google Scholar] [CrossRef]
  25. Chendev, Y.G.; Novykh, L.L.; Sauer, T.J.; Petin, A.; Zazdravnykh, E.A.; Burras, C.L. Evolution of Soil Carbon Storage and Morphometric Properties of Afforested Soils in the U.S. Great Plains. Soil Carbon 2014, 47, 475–482. [Google Scholar]
  26. Chendev, Y.G.; Sauer, T.J.; Hernandez-Ramirez, G.; Burras, C.L. History of East European Chernozem Soil Degradation; Protection and Restoration by Tree Windbreaks in the Russian Steppe. Sustainability 2015, 7, 705–724. [Google Scholar] [CrossRef] [Green Version]
  27. Gordeev, A.V.; Kleschenko, A.D.; Chernyakov, B.A.; Sirotenko, O.D. Bioclimatic Potential of Russia: Theory and Practice; Partnership of Scientific Editions KMK: Moscow, Russia, 2006. [Google Scholar]
  28. Mastachi-Loza, C.; Becerril-Piña, R.; Albores, M.A.G.; Díaz-Delgado, C.; Contreras, A.T.R.; García-Aragón, J.A.; Bordi, I.V. Regional analysis of climate variability at three time scales and its effect on rainfed maize production in the Upper Lerma River Basin, Mexico. Agric. Ecosyst. Environ. 2016, 225, 1–11. [Google Scholar] [CrossRef] [Green Version]
  29. Sen, P.K. Estimates of the regression coefficient based on Kendall’s tau. J. Amer. Stat. Assoc. 1968, 63, 1379–1389. [Google Scholar] [CrossRef]
  30. Levine, R.A.; Wilks, D.S. Statistical Methods in the Atmospheric Sciences. J. Am. Stat. Assoc. 2000, 95, 344. [Google Scholar] [CrossRef]
  31. Agroclimatic Resources of the Belgorod Region, Leningrad; Hydrometeorological Service of the Central Chernozem Regions: Leningrad, USSR, 1972.
  32. Lebedeva, M.G.; Solovyov, A.B.; Tolstopyatova, O.S. Agroclimatic zoning of the Belgorod region in the context of climate change. Sci. Sheets BelSU 2015, 31, 160–167. [Google Scholar]
  33. Lebedeva, M.G.; Krymskaya, O.V. A manifestation of modern climate changes in the Belgorod region. Sci. Sheets BelSU 2008, 6, 188–196. [Google Scholar]
  34. Gustokashina, N.N.; Maksutova, E.V. The tendencies of the climatic change in steppe and forest-steppe of the Baikal Region. Geog. Nat. Res. 2006, 4, 76–81. [Google Scholar]
  35. Nunes, M.J.; Lupo, A.R.; Lebedeva, M.; Chendev, Y.G.; Solovyov, A.B. The Occurrence of Extreme Monthly Temperatures and Precipitation in Two Global Regions. Pap. Appl. Geogr. 2017, 38, 1–14. [Google Scholar] [CrossRef] [Green Version]
  36. Lupo, A.R.; Mokhov, I.I.; Chendev, Y.G.; Lebedeva, M.; Akperov, M.; Hubbart, J.A. Studying Summer Season Drought in Western Russia. Adv. Meteorol. 2014, 2014, 1–9. [Google Scholar] [CrossRef] [Green Version]
  37. Losev, A.P.; Zhurina, L.L. Agrometeorology; Kolos Publishing House: Moscow, Russia, 2001; pp. 296p. [Google Scholar]
  38. Kolomeychenko, B.V. Crop: A Textbook for Students; Agrobusiness Center: Moscow, Russia, 2007; Volume 52. [Google Scholar]
  39. Edgerton, M.D. Increasing Crop Productivity to Meet Global Needs for Feed, Food, and Fuel. Plant Physiol. 2009, 149, 7–13. [Google Scholar] [CrossRef] [PubMed] [Green Version]
  40. Petin, A.N.; Lebedeva, M.G.; Krymskaya, O.V.; Chendev, Y.G.; Kornilov, A.G.; Lupo, A.R. Regional manifestations of changes in atmospheric circulation in the Central Black Earth Region (By the Example of Belgorod Region). Adv. Environ. Bio. 2014, 8, 544–547. [Google Scholar]
  41. Lupo, A.R.; Jensen, A.D.; Mokhov, I.I.; Timazhev, A.V.; Eichler, T.; Efe, B. Changes in global blocking character during the most recent decades. Atmosphere 2019, 10, 92. [Google Scholar] [CrossRef] [Green Version]
  42. Reddy, V.; Pachepsky, Y. Predicting crop yields under climate change conditions from monthly GCM weather projections. Environ. Model. Softw. 2000, 15, 79–86. [Google Scholar] [CrossRef]
  43. FAOSTAT. Food and Agriculture Organization of the United Nations, Statistics Division. Forestry Production and Trade. Available online: http://www.fao.org/faostat/en/#data/FO (accessed on 4 April 2019).
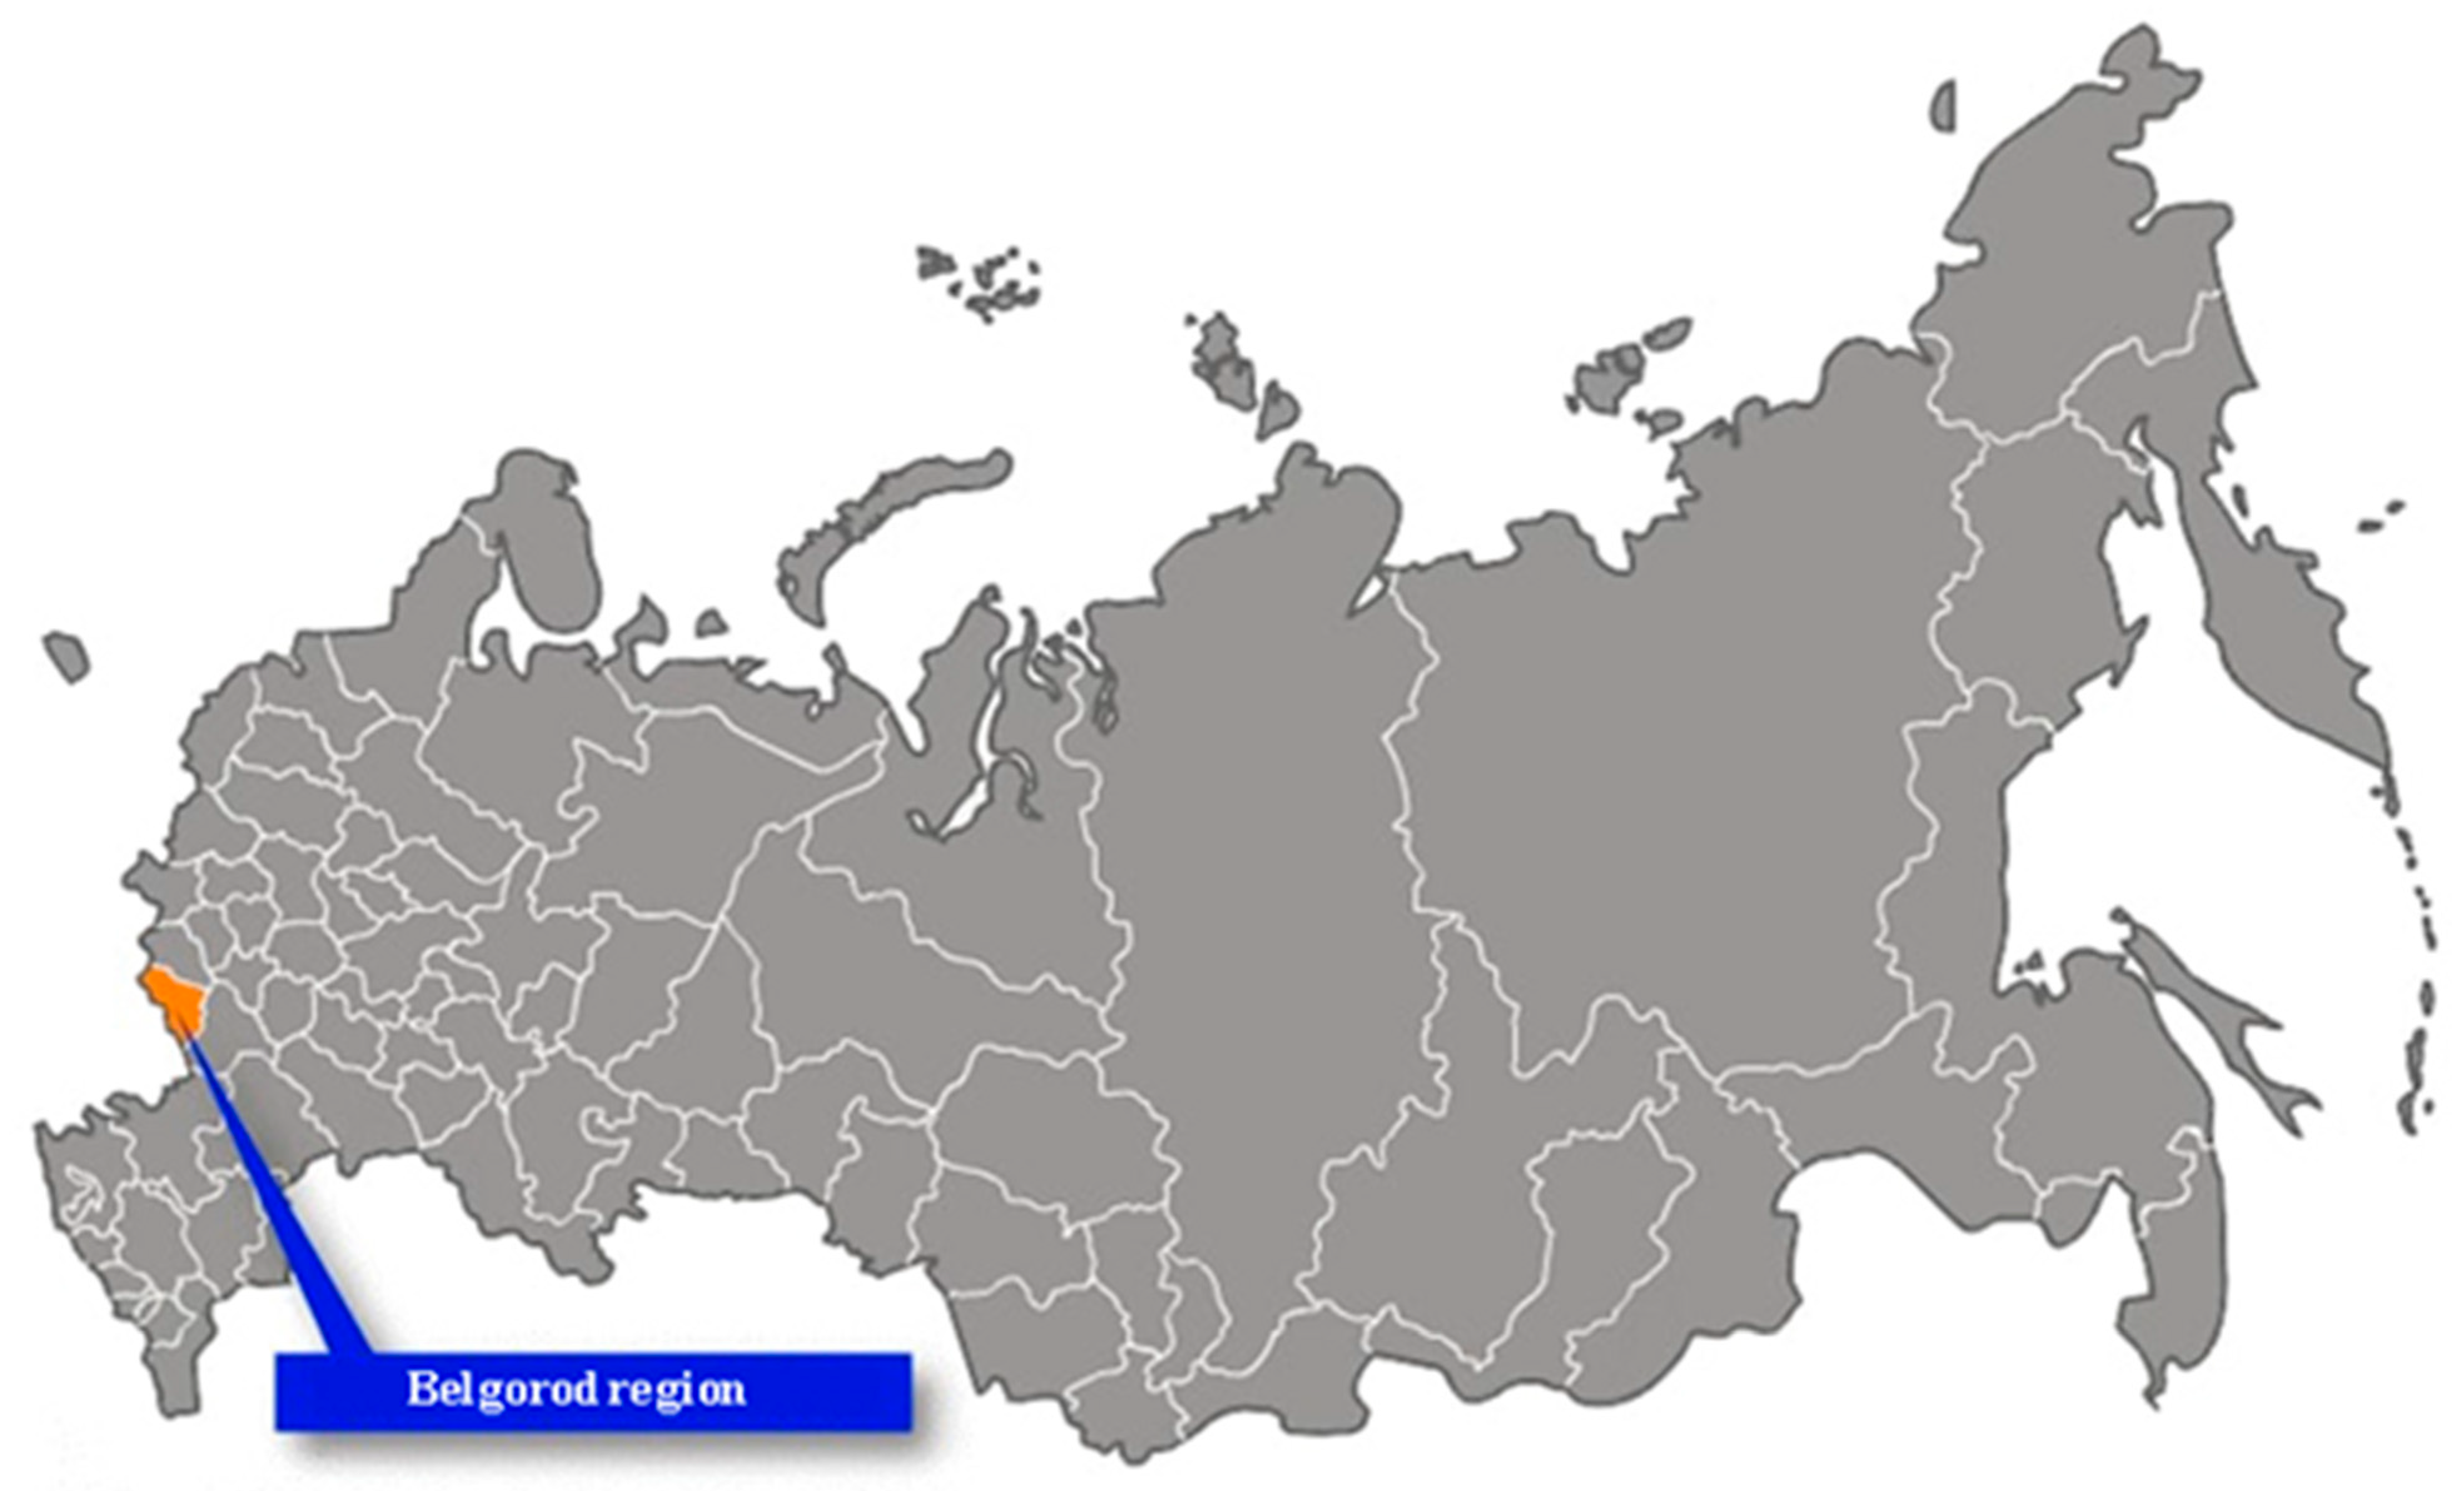
Figure 1. The location of the study region in relation to the Russia.
Climate 08 00046 g001
Figure 2. Mean temperature anomalies (°C) during the summer season in the Belgorod Region. A quadratic fit line is shown in red (°C).
Climate 08 00046 g002
Figure 3. The values of HTC (mm °C−1) from 1954 to 2018 for the Belgorod Region. The blue dashed line is the linear trend line (mm °C−1).
Climate 08 00046 g003
Figure 4. Values of Belgorod Region bioclimatic potential (BCP – mm °C−1) during the periods 1988–2000 (A) and 2001–2014 (B).
Climate 08 00046 g004
Figure 5. Sugar beet yield (tons ha−1) over the (a) northern, (b) central and western, and (c) southeastern districts within the Belgorod Region (see Figure 4). The solid line is the regression line for each (tons ha−1).
Climate 08 00046 g005aClimate 08 00046 g005b
Figure 6. The Belgorod Region sugar beet yield (red - tons ha−1) and sugar content (blue - %). The linear regression (trend) models are also shown, where the red line is sugar beet yield (tons ha−1) and the blue line is sugar content (%).
Climate 08 00046 g006
Figure 7. The time series of (a) sugar beet yield (tons ha−1), (b) sugar content (%) of the beets, and (c) HTC (mm °C−1) converted to wave space using a Fourier transform. The abscissa (ordinate) is cycles 59 y−1 (spectral power). The units of the transformed quantity (ordinate) are the square of those in the time series. The blue dotted (green dashed) lines are the 95% confidence level curves using [30] assuming a white (red) noise spectrum.
Climate 08 00046 g007
Figure 8. As in Figure 7, except for the cross-spectral analysis for (a) sugar beet yield (tons ha−1) and HTC (mm °C−1), (b) sugar content (%) versus HTC(mm °C−1), and (c) sugar beet yield (tons ha−1) versus sugar content (%). The units for the ordinate in each are the product of the two wave series squared Also, only the white noise line is shown here.
Climate 08 00046 g008
Figure 9. As in Figure 6, except for sugar content of beet (blue - %) and HTC (red – mm °C−1), respectively. The variable HTC is multiplied by 10 in order to fit the data to the graph software. The linear regression models are also shown, where the red line is the HTC (mm °C−1) and the blue line is sugar content (%).
Climate 08 00046 g009
Table 1. Average sugar beet yield (tons ha−1), sugar content (%), and HTC (mm °C−1) during different phases of El Niño and Southern Oscillation or the North Atlantic Oscillation. A bold (*, **) value indicates a mean different from the total sample at 90% (95%, 99%) confidence level as in [30].
PhaseSugar Beet Yield (ton ha−1)Sugar Content (%)HTC(mm °C−1)
El Niño (EN)22.617.0**1.05*
Neutral (N)23.716.1*1.21*
La Niña (LA)21.516.81.05*
NAO-21.416.51.07*
NAO+24.216.51.18*
NAO-/EN20.0**17.2**0.98**
NAO-/N23.615.9**1.20*
NAO-/LA19.5**16.80.98**
NAO+/EN25.2**16.81.12
NAO+/N19.6**16.1*1.22*
NAO/LA24.316.81.14