Article

The Global Trend of the Net Irrigation Water Requirement of Maize from 1960 to 2050

by
Abdoulaye Oumarou Abdoulaye
1,
Haishen Lu
1,*,
Yonghua Zhu
1,
Yousef Alhaj Hamoud
2 and
Mohamed Sheteiwy
3
1
State Key Laboratory of Hydrology-Water Resources and Hydraulic Engineering, College of Hydrology and Water Resources, Hohai University, Nanjing 210098, China
2
College of Agriculture Engineering, Hohai University, Nanjing 210098, China
3
Department of Agronomy, Faculty of Agriculture, Mansoura University, Mansoura 35516, Egypt
*
Author to whom correspondence should be addressed.
Climate 2019, 7(10), 124; https://doi.org/10.3390/cli7100124
Submission received: 1 July 2019 / Revised: 12 October 2019 / Accepted: 14 October 2019 / Published: 22 October 2019
(This article belongs to the Special Issue Impact of Climate-Change on Water Resources)

Abstract

:
Irrigated production around the world has significantly increased over the last decade. However, climate change is a new threat that could seriously aggravate the irrigation water supplies and request. In this study, the data is derived from the IPCC Fifth Assessment Report (AR5). For the climate change scenarios, five Global Climate Models (GCMs) have been used. By using the CROPWAT approach of Smith, the net irrigation water requirement (IRnet) was calculated. For the estimation of the potential evapotranspiration (Epot), the method in Raziei and Pereira was used. According to representative concentration pathway (RCP) 4.5, these increases vary between 0.74% (North America) and 20.92% (North America) while the RCP 8.5 predict increases of 4.06% (sub-Saharan Africa) to more than 68% (North America). The results also show that the region of Latin America is the region with the large amount of IRnet with coprime value between 1.39 km3/yr (GFDL 4.5) and 1.48 km3/yr (CSIRO 4.5) while sub-Saharan Africa has the smallest IRnet amount between 0.13 km3/yr (GFDL 8.5) and 0.14 km3/yr (ECHAM 8.5). However, the most affected countries by this impact are those in sub-Saharan Africa. This study will probably help decision-makers to make corrections in making their decision.

1. Introduction

The increasing speed of climate change and related changes in rainfall have officially influenced biological systems and biodiversity on Earth [1]. Indeed, agriculture and environmental change are deeply intertwined. Ecological changes are now having an impact on the agri-food sector, with implications that have unevenly adapted to the world. Future environmental changes are likely to harm crop production in low-perch countries, while the consequences in the Nordic are likely to be less affected. Besides, environmental changes will likely create a danger of food insecurity for some powerless gatherings, such as the poor. The World Health Organization (WHO) assessments over the last 30 years have already helped more than 150,000 victims per year due to global warming and precipitation trends caused by anthropogenic climate change [2]. Many other studies have been undertaken to examine the impact of climate change on animal and plants health [3,4,5,6,7,8]. According to some studies on a global scale, regional variations associated with climate change are not expected to lead to significant changes in food production over the next century [5,9]. Several simulation models have been made about climate change [10]. The majority of climate simulation models show: an increase in the global temperature average; the temperatures are projected to increase between 1.4 and 5.88 ºC by the end of this century; a related rise in sea level is also expected [11]. The impact on the economy was also studied [12,13,14,15,16], with developing countries expected to suffer most of the damage caused by climate change, while the wealthiest countries are likely to be less affected [17,18,19].
Precise and multi-variable predictions of anthropogenic climate change are needed to assess the effects [20]. Several studies have addressed the problem of the impact of climate change on agriculture. Several aspects of the question were analyzed. One of the topics is the impact of climate change on irrigation [21,22,23,24]. Among the sectors of water use, irrigation will be most influenced by the effects of climate change [25,26,27,28,29,30,31]. Agriculture and mainly irrigated agriculture is the sector with by far the primary consumptive water use and water withdrawal. To assess the gravity of irrigation on the available water resources, an estimate has been made mutually for the irrigation water requirement and also, irrigation water withdrawal [32]. Irrigation ensures summer production and produces valuable crops that would otherwise be impossible to cultivate [33,34].
Nevertheless, the effects on regional and local food supplies in some low latitude regions could amount to significant percentage changes in current production [35]. Asia’s intensive agriculture consumes 20% of its internal renewable resources, of which more than 80% goes to irrigation. In most low-rainfall areas of the Middle East, North Africa, and Central Asia, most of the exploitable water is already very scarce, with 80-90% of this water destined for agriculture. Rivers and aquifers are, therefore, operating beyond their sustainable levels. In the long list of possible problems from worldwide warming, the menaces to world agriculture stand out as among the most important [36]. Regional predictions are needed for improving the assessments of vulnerability to and impacts of change [37].
Several recent articles have focused on the impact of climate change on plant production [38,39,40], but also on how to adapt to climate change [41,42,43,44]. In 2002, Petra Doll and Stefan Siebert presented a global model on the demand for irrigation water. The model simulates the cropping patterns, the growing seasons, and the net and gross irrigation requirements, distinguishing between two crops, rice and non-rice [45,46]. The correspondence between their model results and independent assessments of irrigation water use is considered to be adequate for applying the model in global and continental studies.
In this study, the variations in long-term averages of precipitation and temperature are the only characteristics that define climate change. In our agro-climatological approach, one cereal was selected and it was assumed that it was planted under optimal conditions for their growth. Any change in the dimension and location of the flooded areas due to an adaptation to climate change or for any other reason were neglected. In addition, the increase in CO2 and its direct effects crops had to be ignored due to insufficient quantitative knowledge.
Therefore, based on IPCC-5 data, the purpose of this study was to: First, to estimate the variation of IRnet of maize in the past and the future around the world; second, to map this variation. At the end of this study, it is possible to observe the evolution of the IRnet under the effect of climate change according to the models.

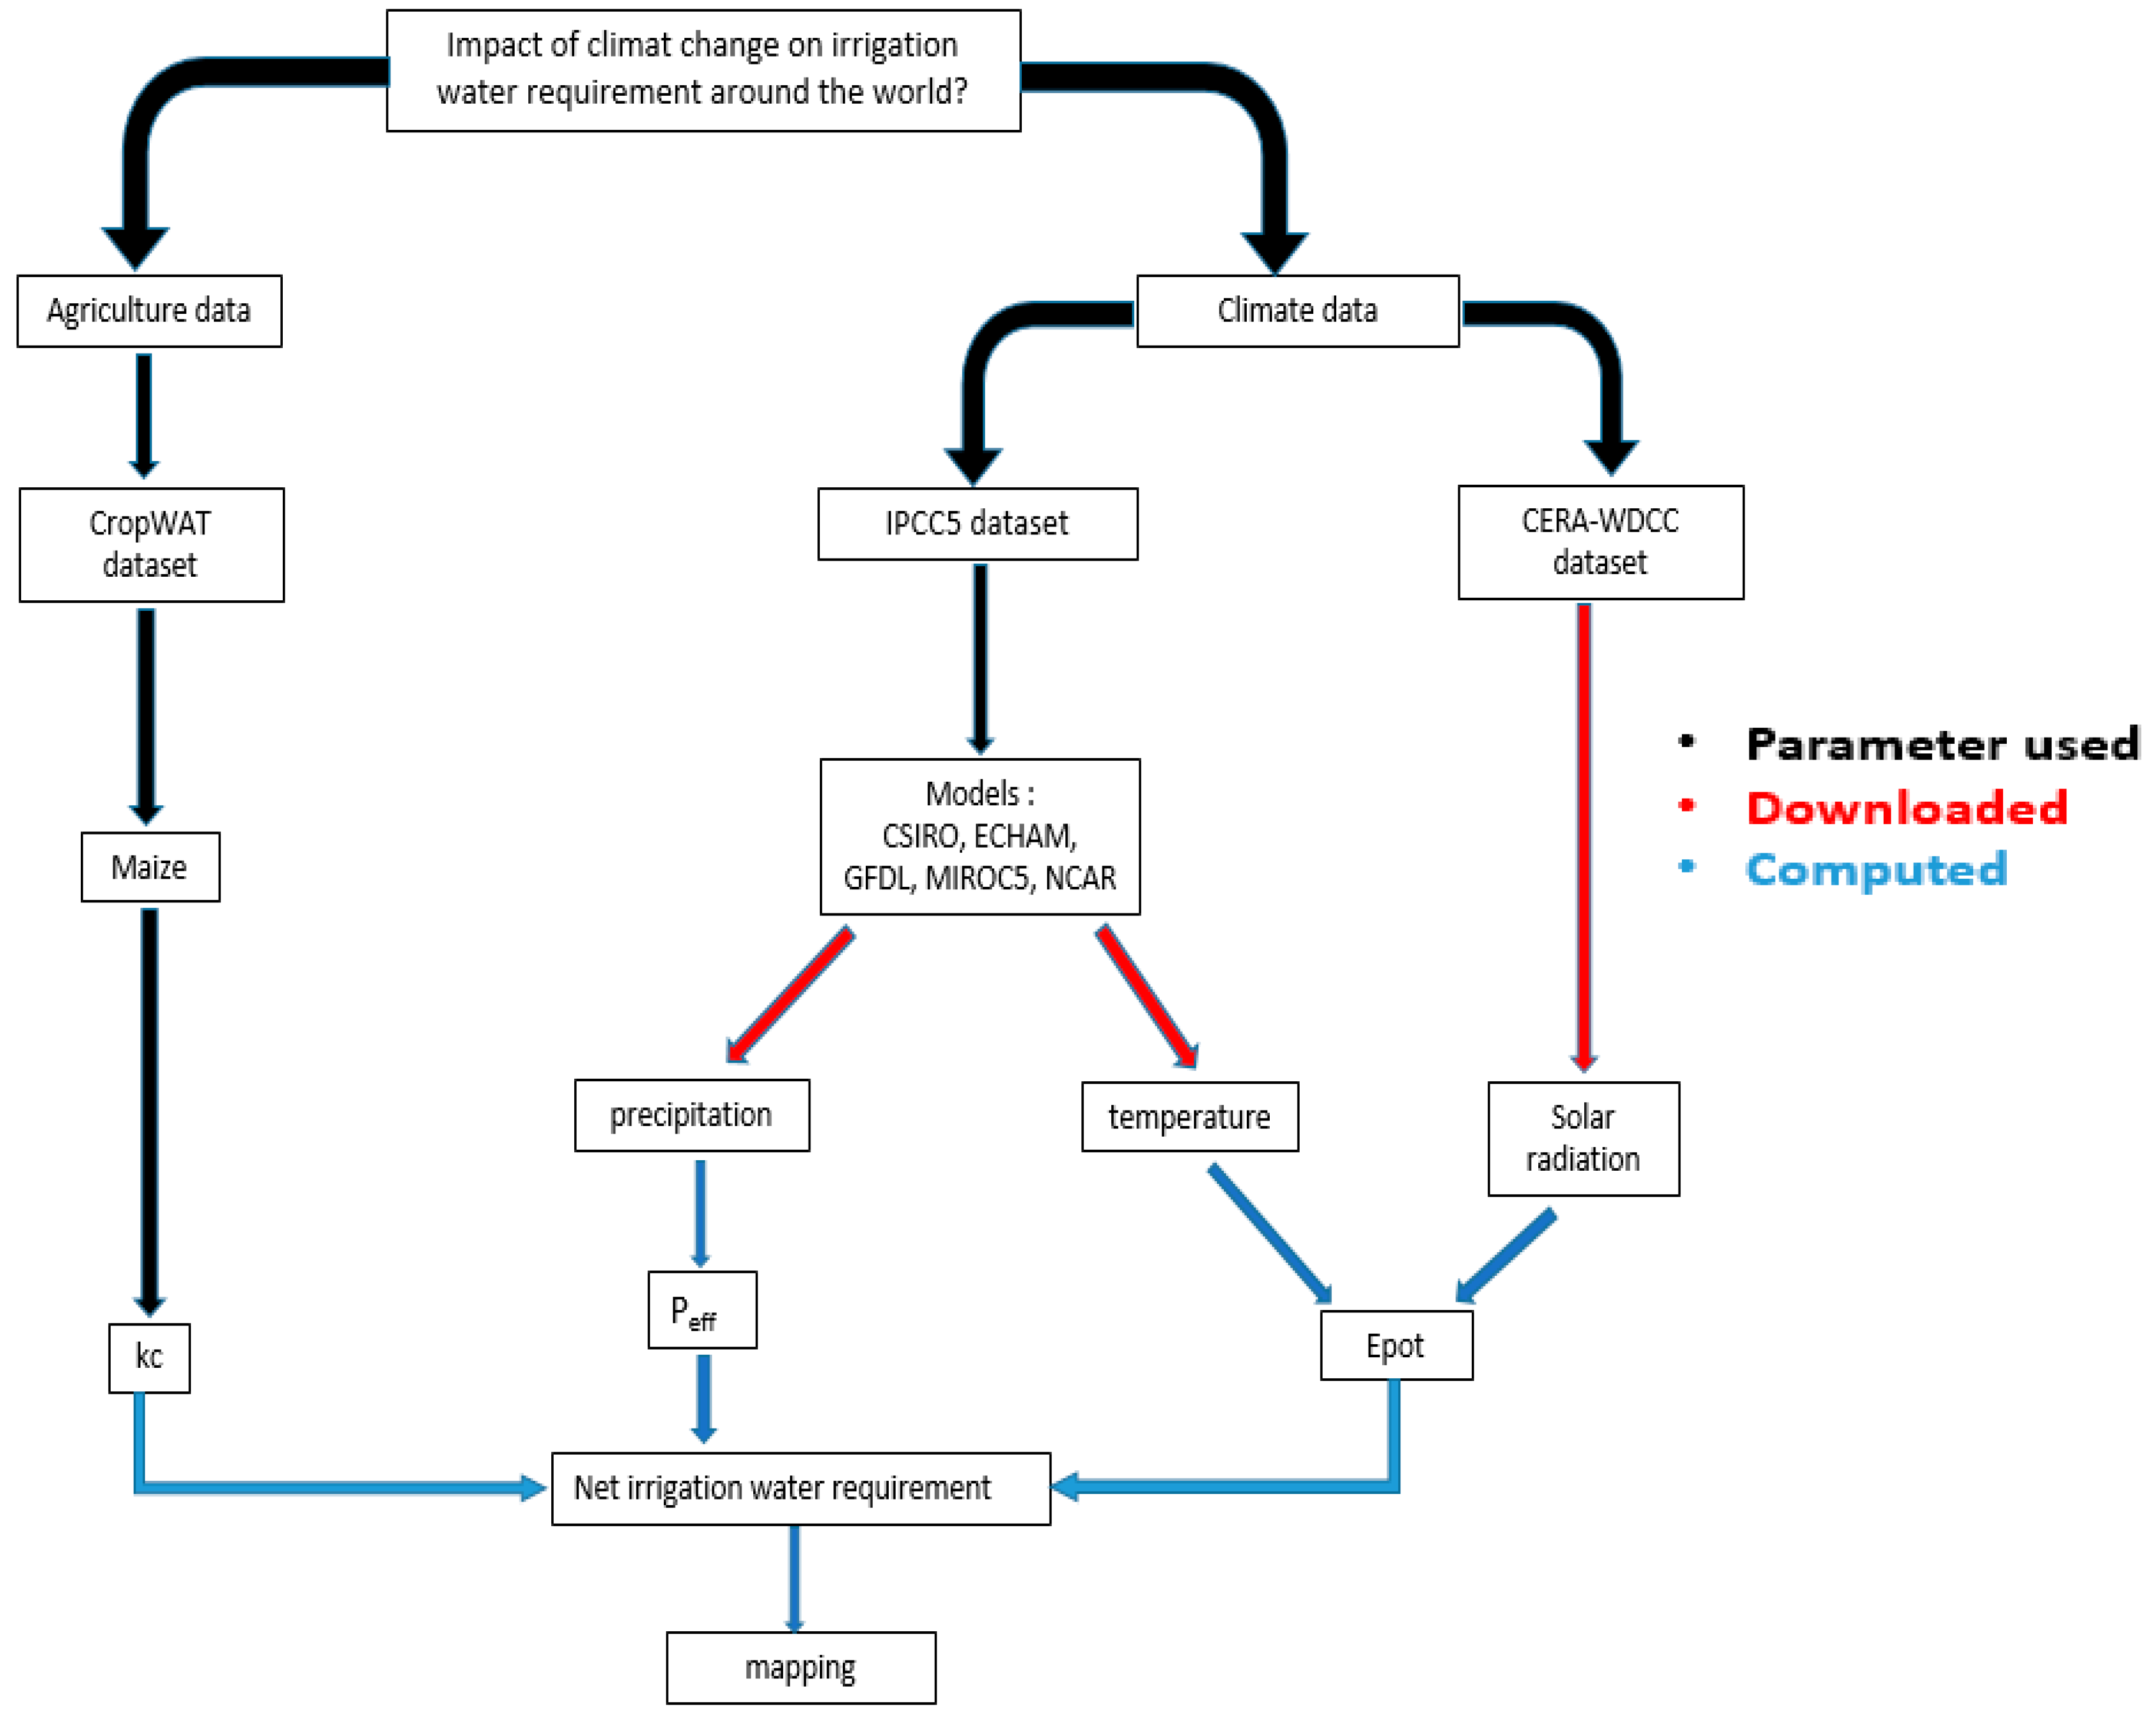
2. Materials and Methods

2.1. Data

In this study, climate change data were derived from the IPCC Fifth Assessment Report (AR5) (http://www.ipcc-data.org/sim/gcm_global/index.html). Climate change scenarios were utlized from five GCMs (CSIRO, ECHAM.MPI-ESM-LR, GFDL.ESM2G, MIROC5, and NCAR.CCSM4), moreover for each model two representative concentration pathways (RCP) were chosen. They were RCP 4.5 and 8.5. The global map of the currently irrigated areas has been uploaded to the food and agriculture organization (FAO) website (http://www.fao.org/nr/water/aquastat/irrigationmap/index10.stm). This map represents the totality of the growing regions irrigated in 2005.

2.2. Net Irrigation Requirement Model

Following the CROPWAT approach of Smith [47], the net irrigation requirement per unit irrigated area through the growing season is calculated, with a daily time step, as the variance between the effective precipitation and the crop-specific potential evapotranspiration as:
I R n e t = k c . E p o t P e f f       i f     k c . E p o t > P e f f
I R n e t = 0
Otherwise, with IRnet instead of the net irrigation requirement per unit area [mm/d]; Peff is the effective precipitation [mm/d]; Epot is the potential evapotranspiration [mm/d]; kc is the crop coefficient.
The crop coefficient, kc, depends on the crop type (maize) and the day of the growing period. Peff is the fraction of P (the total precipitation) that is accessible to the crop and does not run off. Without detailed site-specific information, Peff is very hard to determine. A simple estimate following the USDA soil conservation method is used, as cited in Smith [47], with:
P e f f = P ( 4.17 0.2 P ) 4.17     f o r   P < 8.2
P e f f = 4.17 + 0.1 P     f o r   P 8.3
CROPWAT uses monthly rainfall data from which 10-day-averages are derived as input for the calculations [47]. The application of Equation (1) with daily rainfall values, i.e., the days with and without precipitation, would lead to a gross overestimation of the net irrigation water requirement.
For the estimation of E p o t , the method in Raziei and Pereira [48] was used. By replacing R a by his equation:
E p o t = 0.0135   k R s R a λ T m a x T m i n ( T + 17.8 )
R s = k R s T m a x T m i n ( T + 17.8 ) R a
where:
R a = R s k R s T m a x T m i n
In addition, assuming that k R s = 0.17 in Equations (4) and (6), Equation (4) gives after simplification:
E p o t = 0.0135   R s λ   ( T + 17.8 )
where R s is the solar radiation (MJ/m2/day). It was obtained by adding the surface down-welling shortwave flow air and surface down-welling longwave flux in the air; λ is commonly equal to 2.45; T is the mean temperature (◦C); R a is extraterrestrial radiation (MJ/m2/d);

2.3. Climate Input

The temperature and precipitation data of each model was converted according to the units of the different formulas. The same method was applied for the solar radiation data, which was also calculated for each day from 1960 to 2050. After having calculated the Peff from Equations (2) and (3), as well as the I R n e t (Equation (1)) and the potential evapotranspiration Equation (7) of the selected plant (according to the data of the five models), the results were used in ArcGIS to observe more closely the evolution of the net irrigation of the plant.

3. Results

According to the FAO global map of irrigation areas, the amounts of irrigation water ( IRnet ) vary from one model to another, but also from one RCP to another of the same model. The period 1960-1999 is considered here as being historical years. The year 1960 is the year of reference. The period 2050 is be regarded as the future, which allows appreciating the evolution of IRnet.

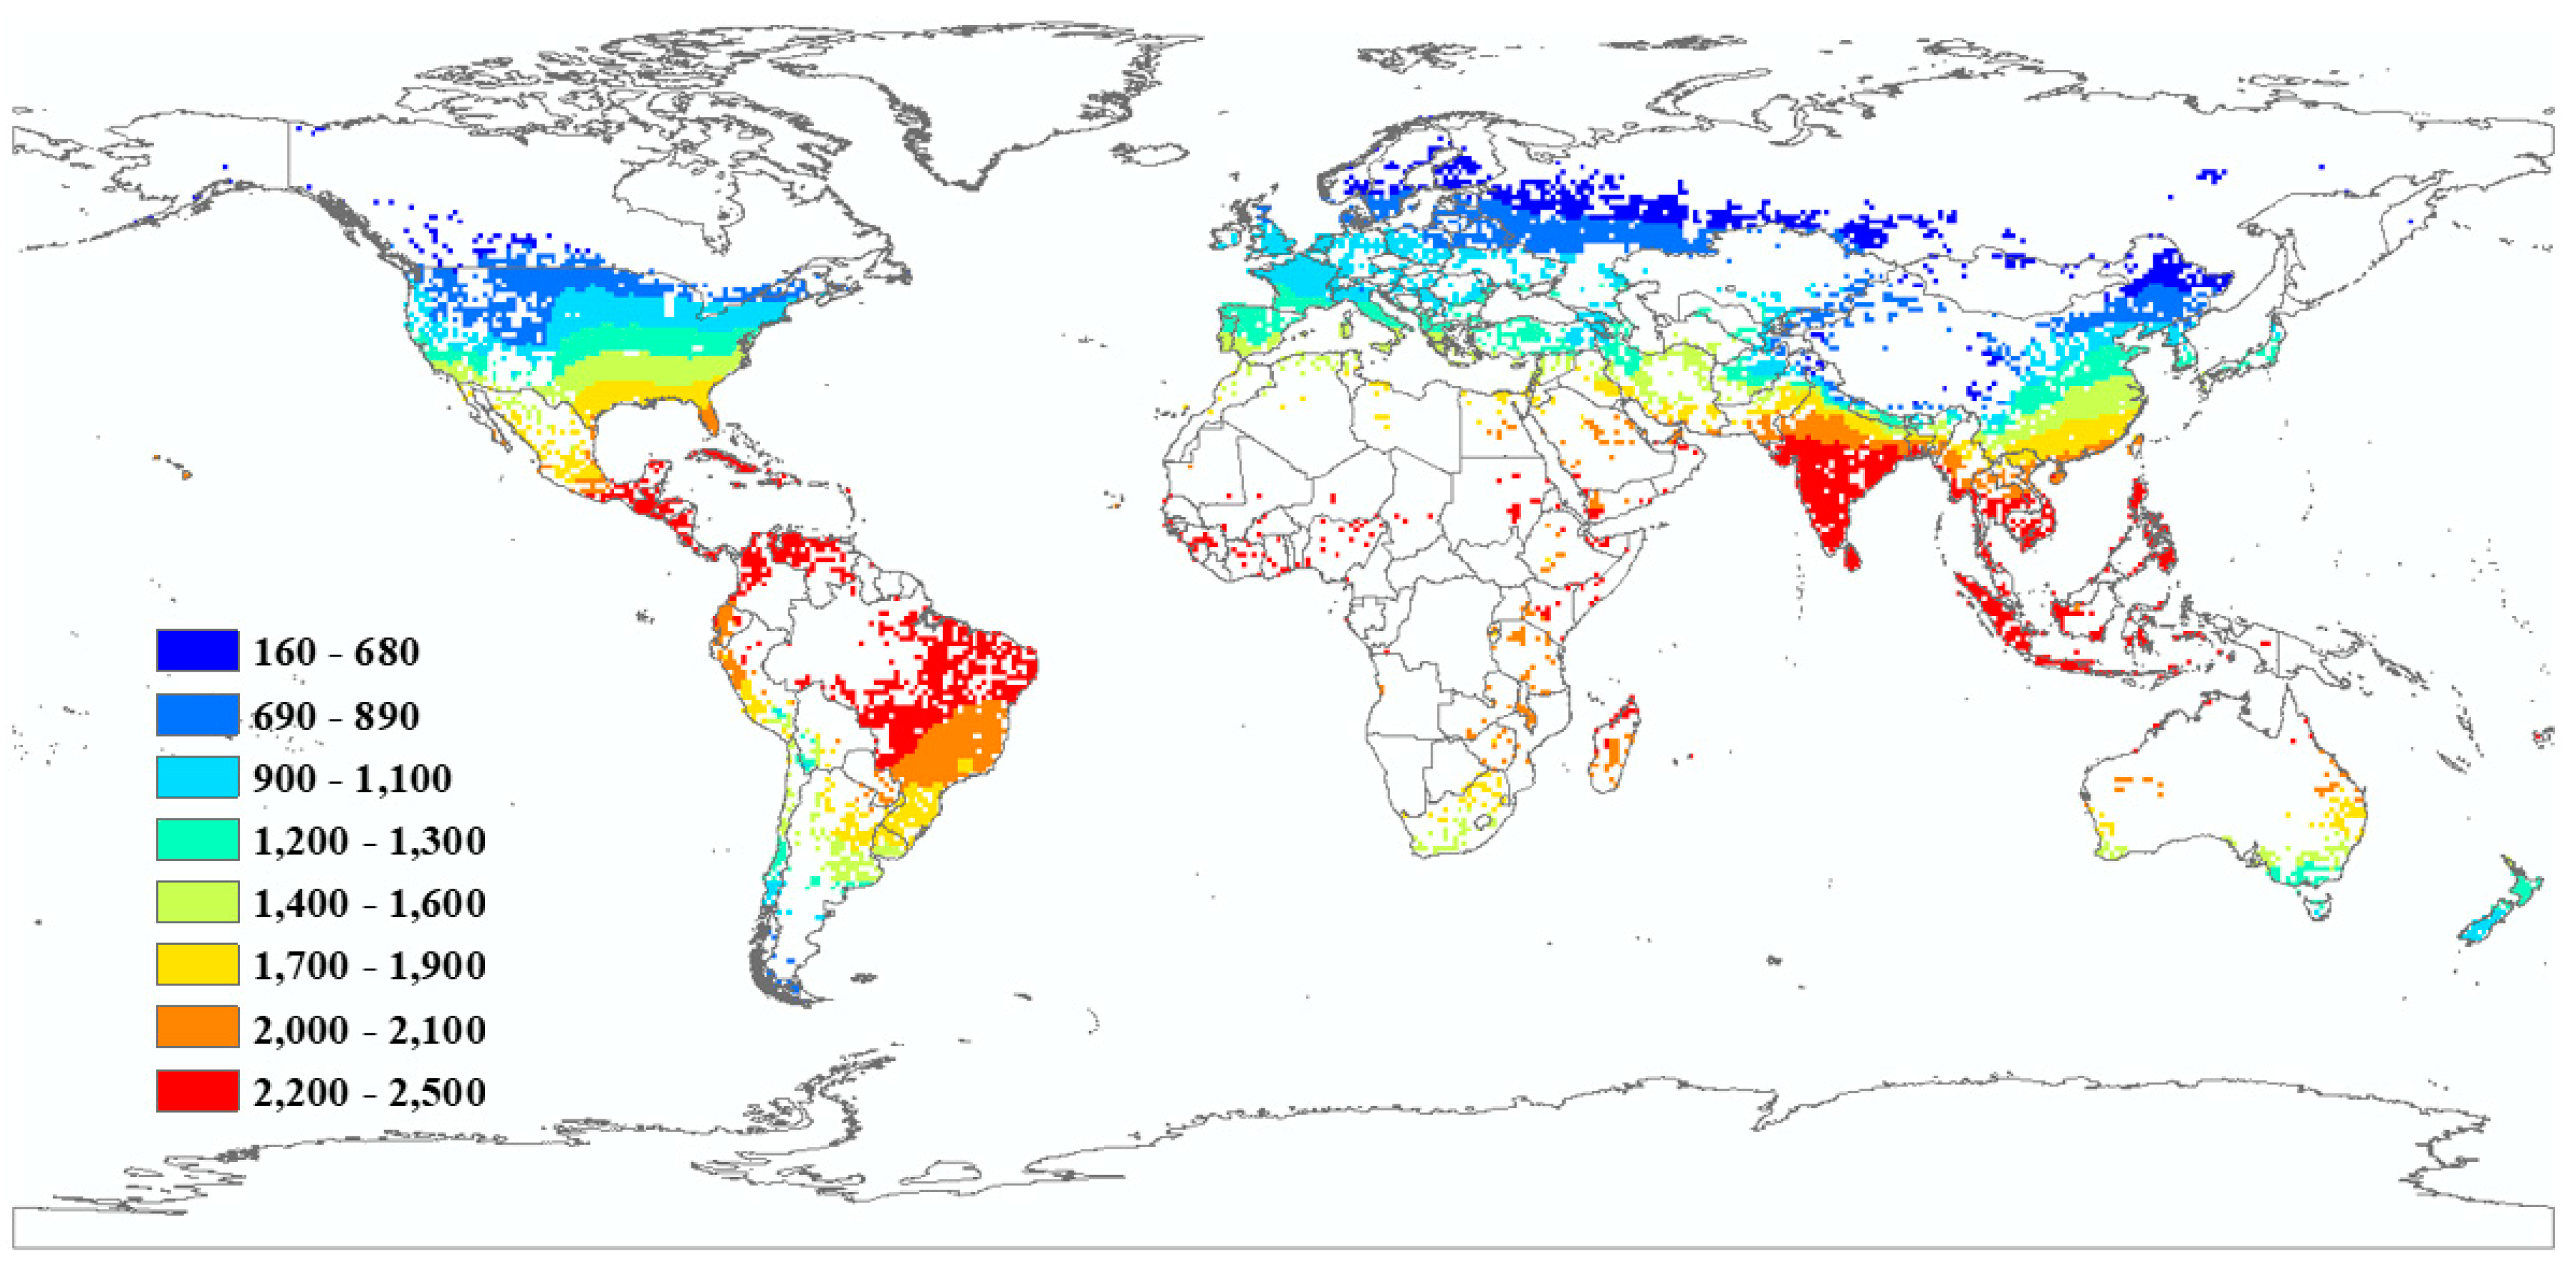
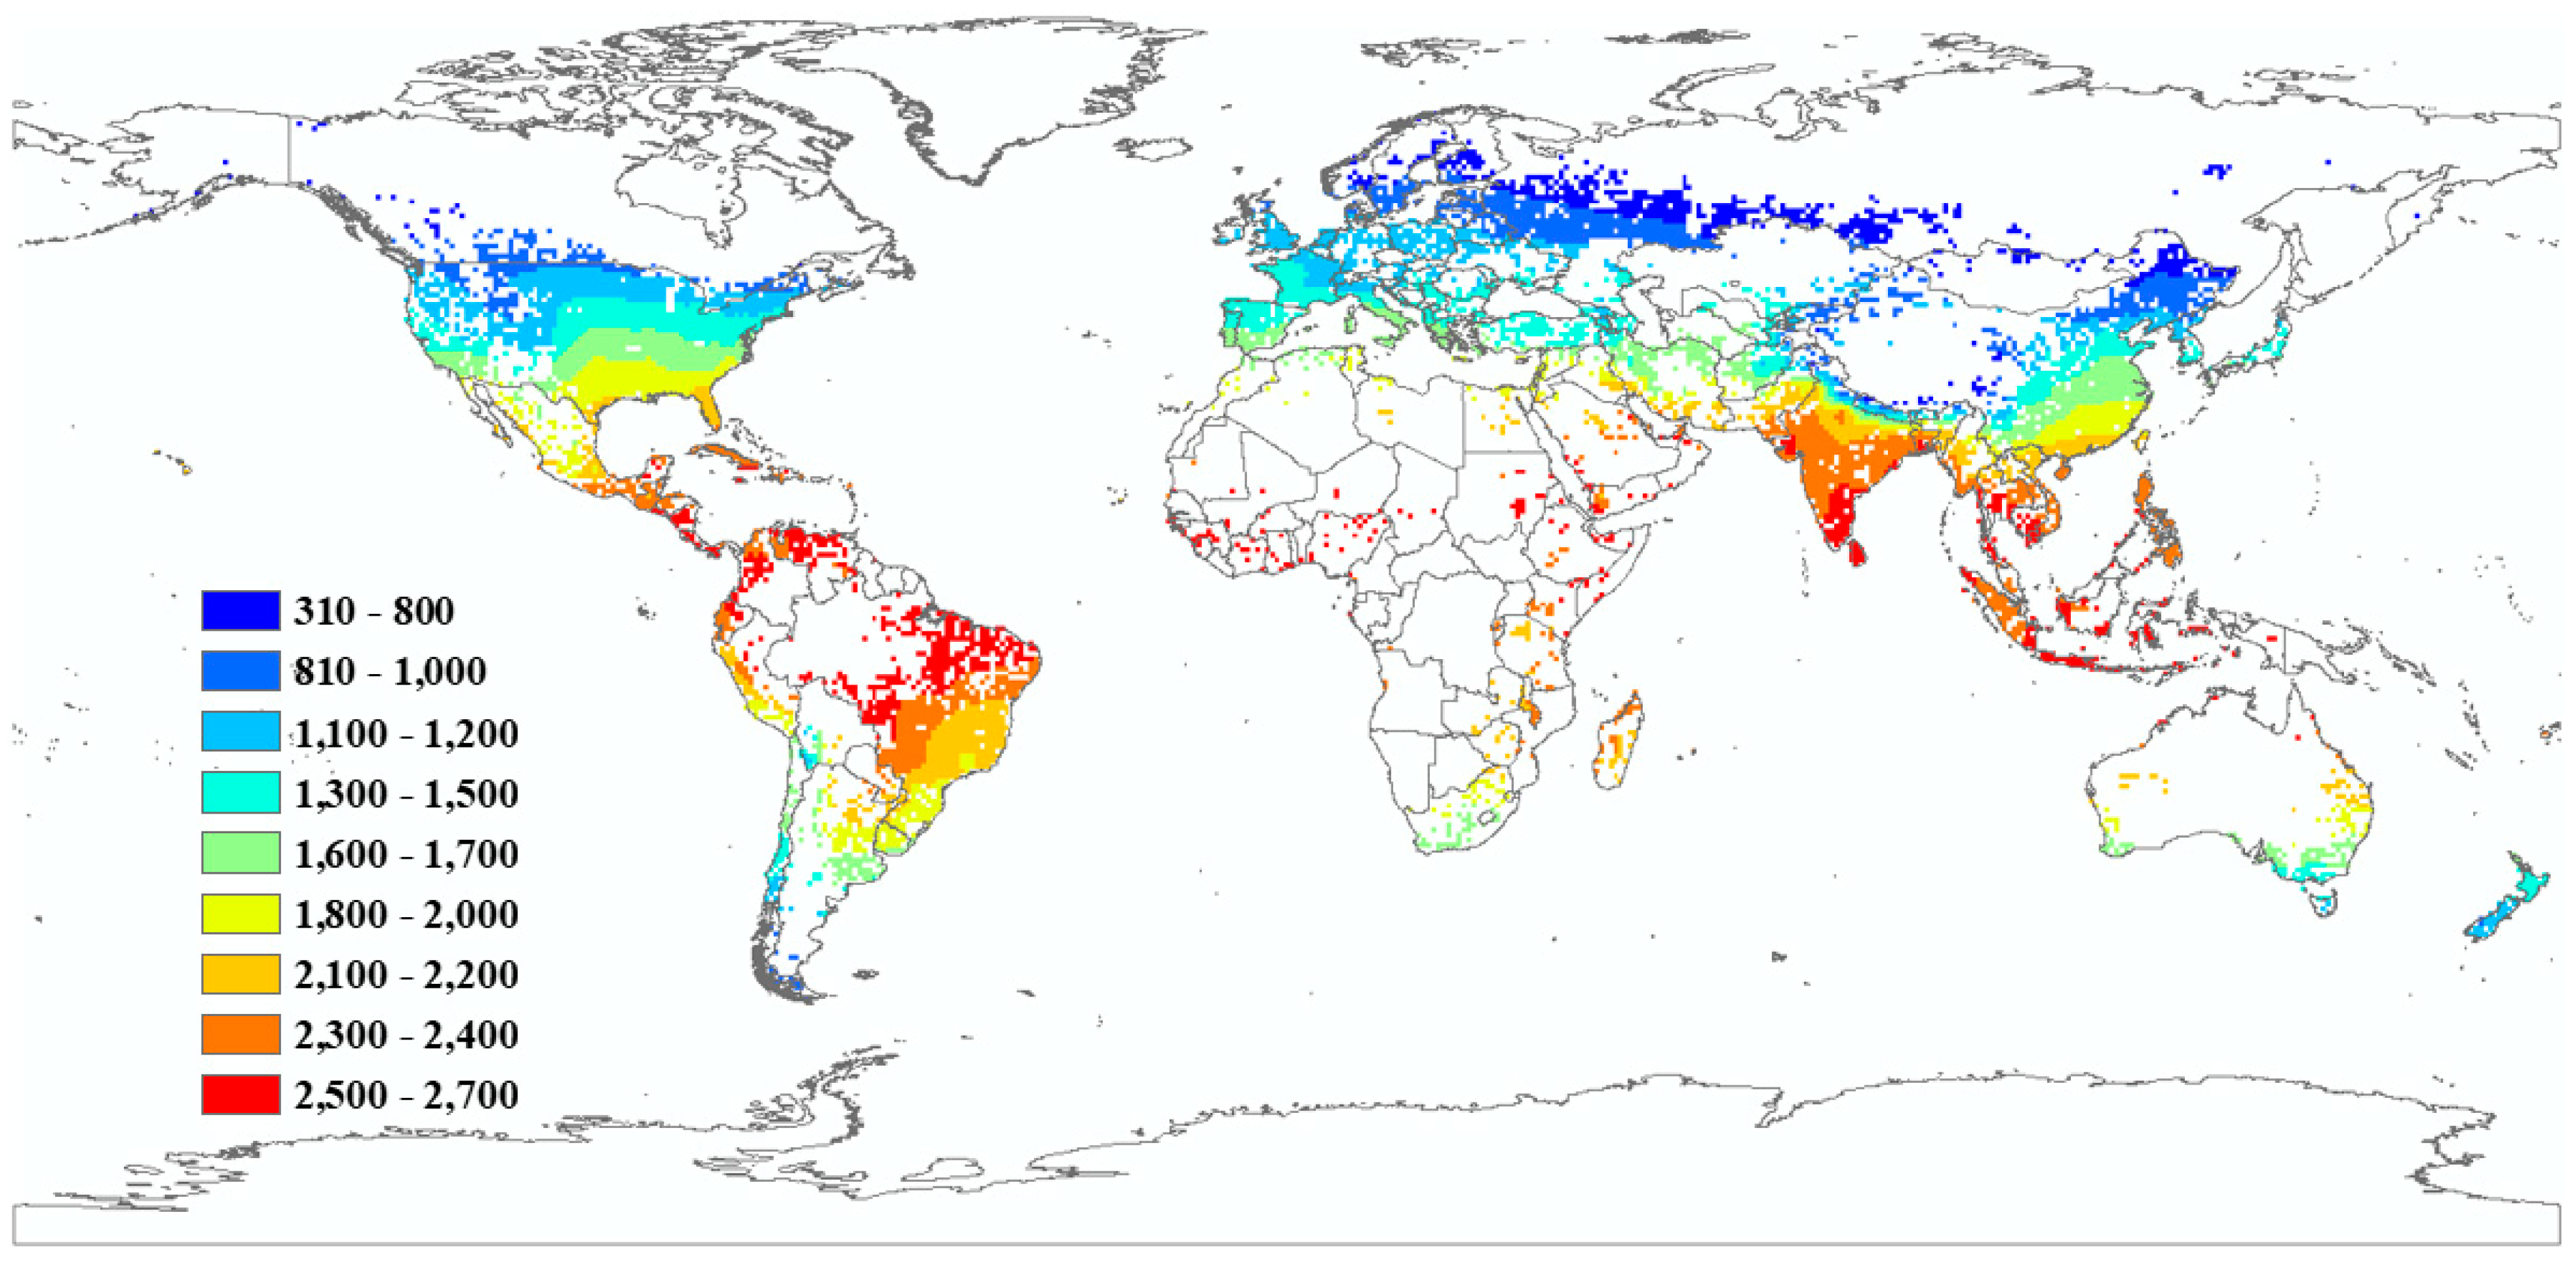
3.1. The Net Irrigation Water Requirements (IRnet) for Historical Period

3.1.1. The IRnet in 1960

The region of Latin America and the Caribbean has a total IRnet more than 1.34 km3/year, followed by the East Asia and Pacific region with a quantity of 1 km3/yr. The parts of the Middle East and North Africa with only 0.25 km3/yr front the region of sub-Saharan Africa with 0.13 km3/year (Table 1). Figure 1 shows the distribution of FAO areas in 2005. This study observed that areas using large quantities of I R n e t are located between the latitude of Cancer and that of Capricorn, which are located respectively north and south of the equator. The quantities vary between 2000 and 2500 mm/year. The countries that lie beyond these two latitudes, there are quantities between 160 and 1800 mm3/year.

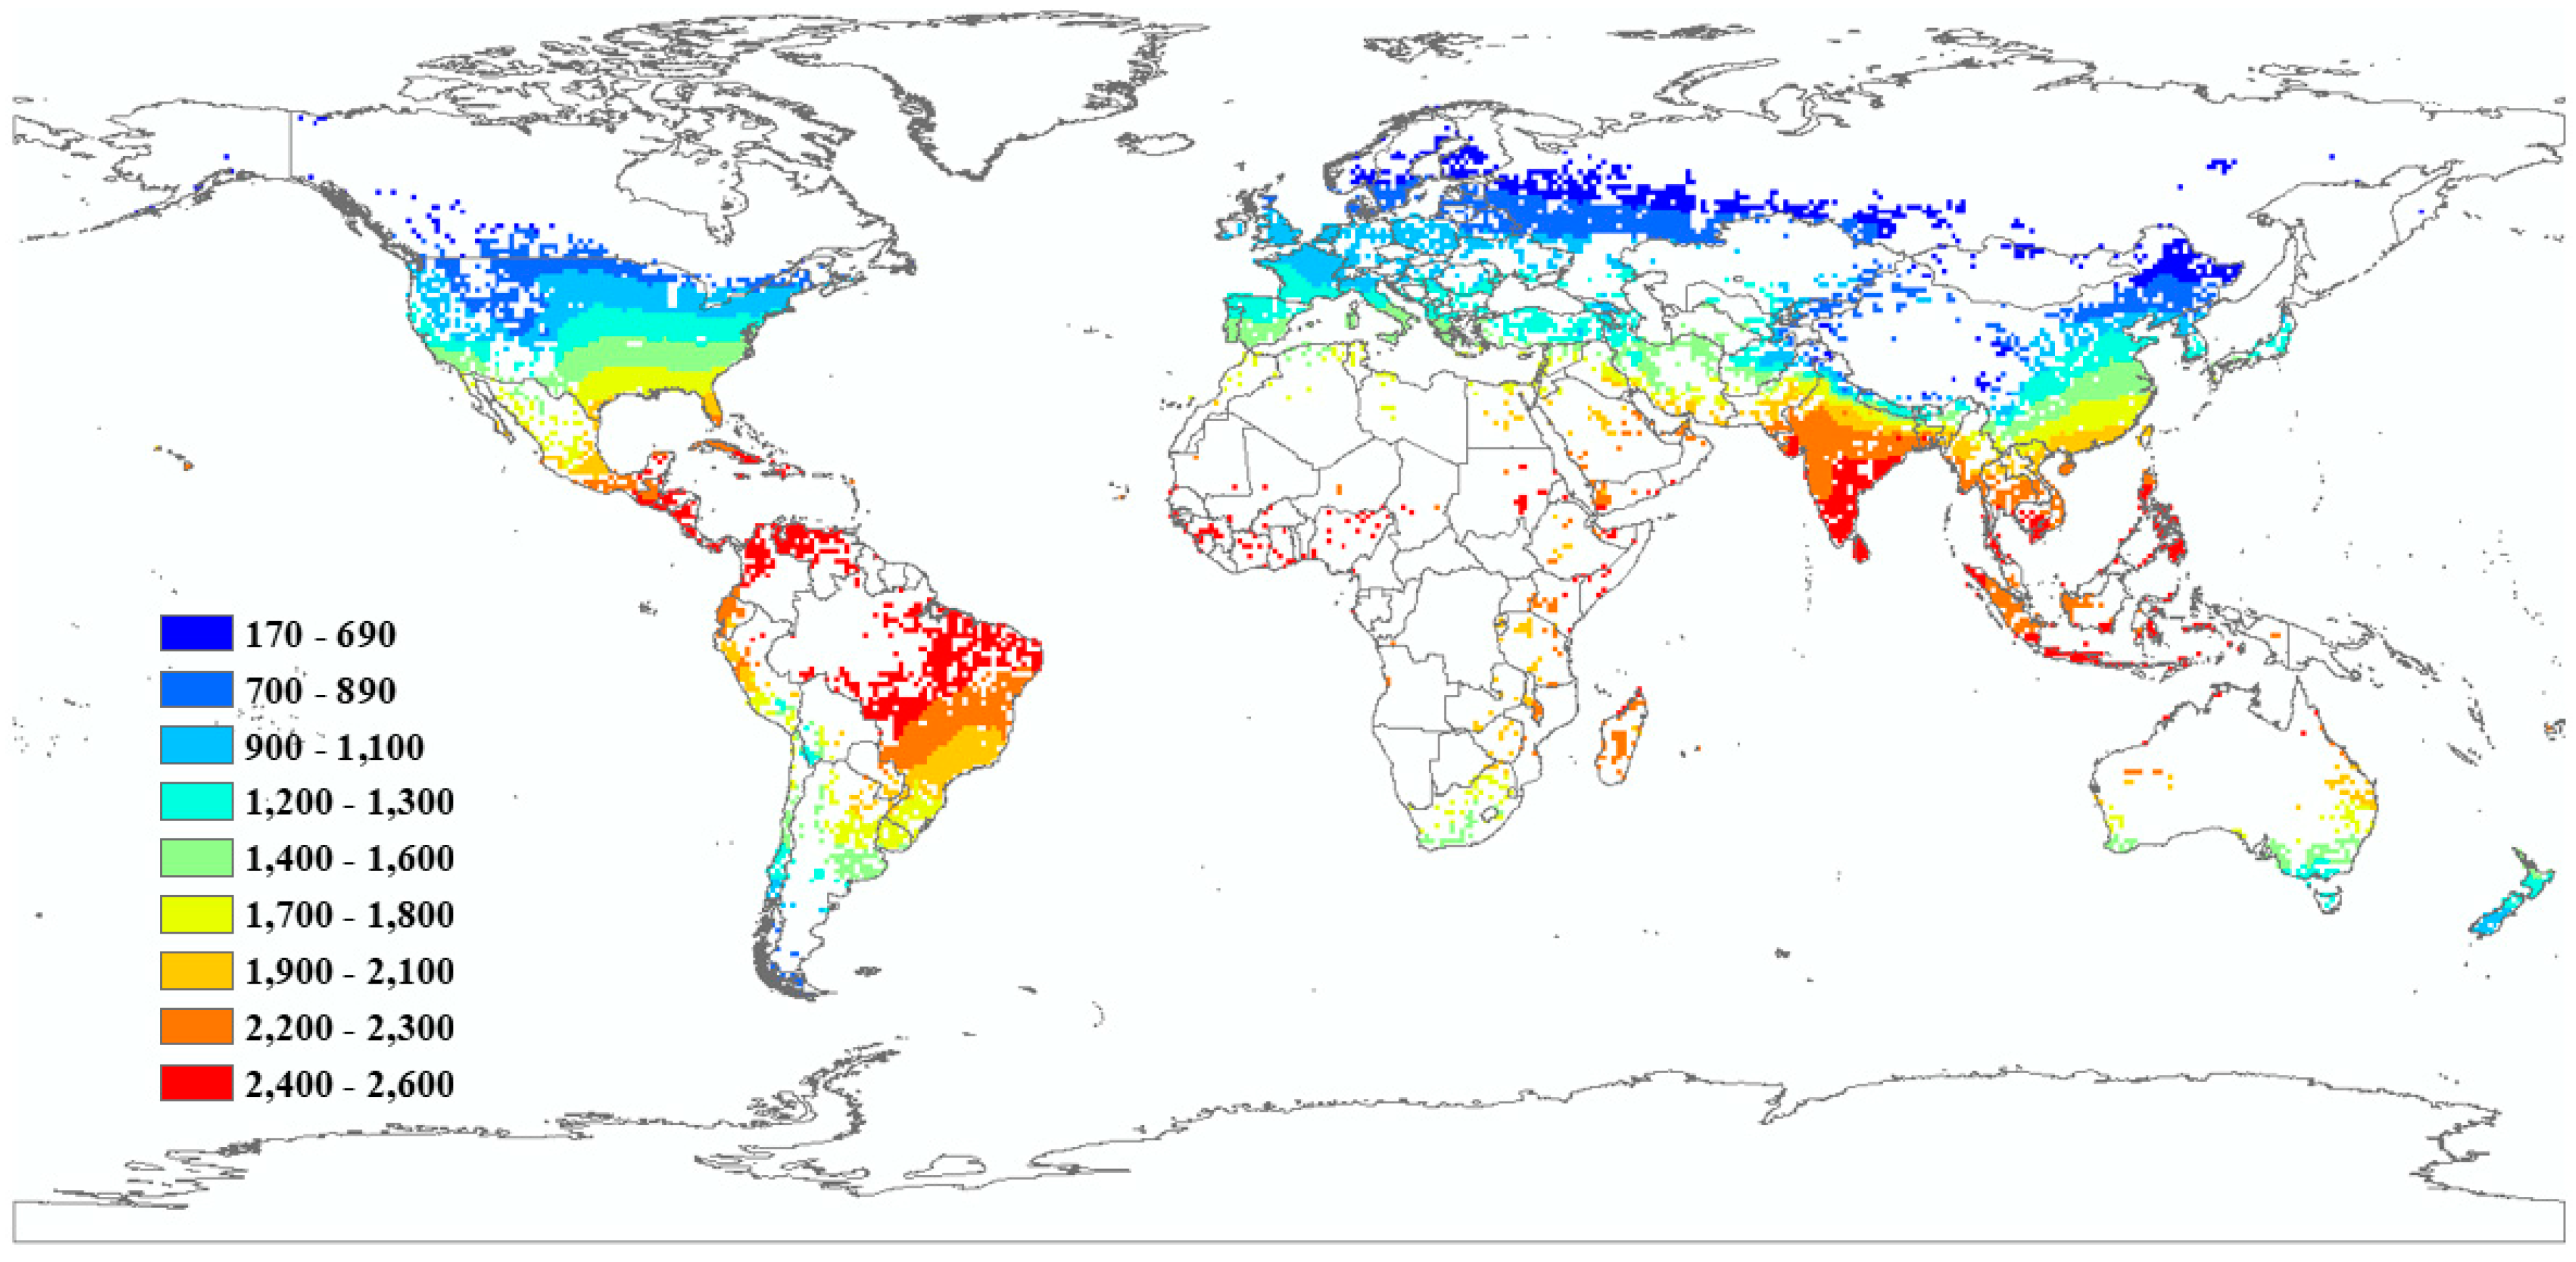
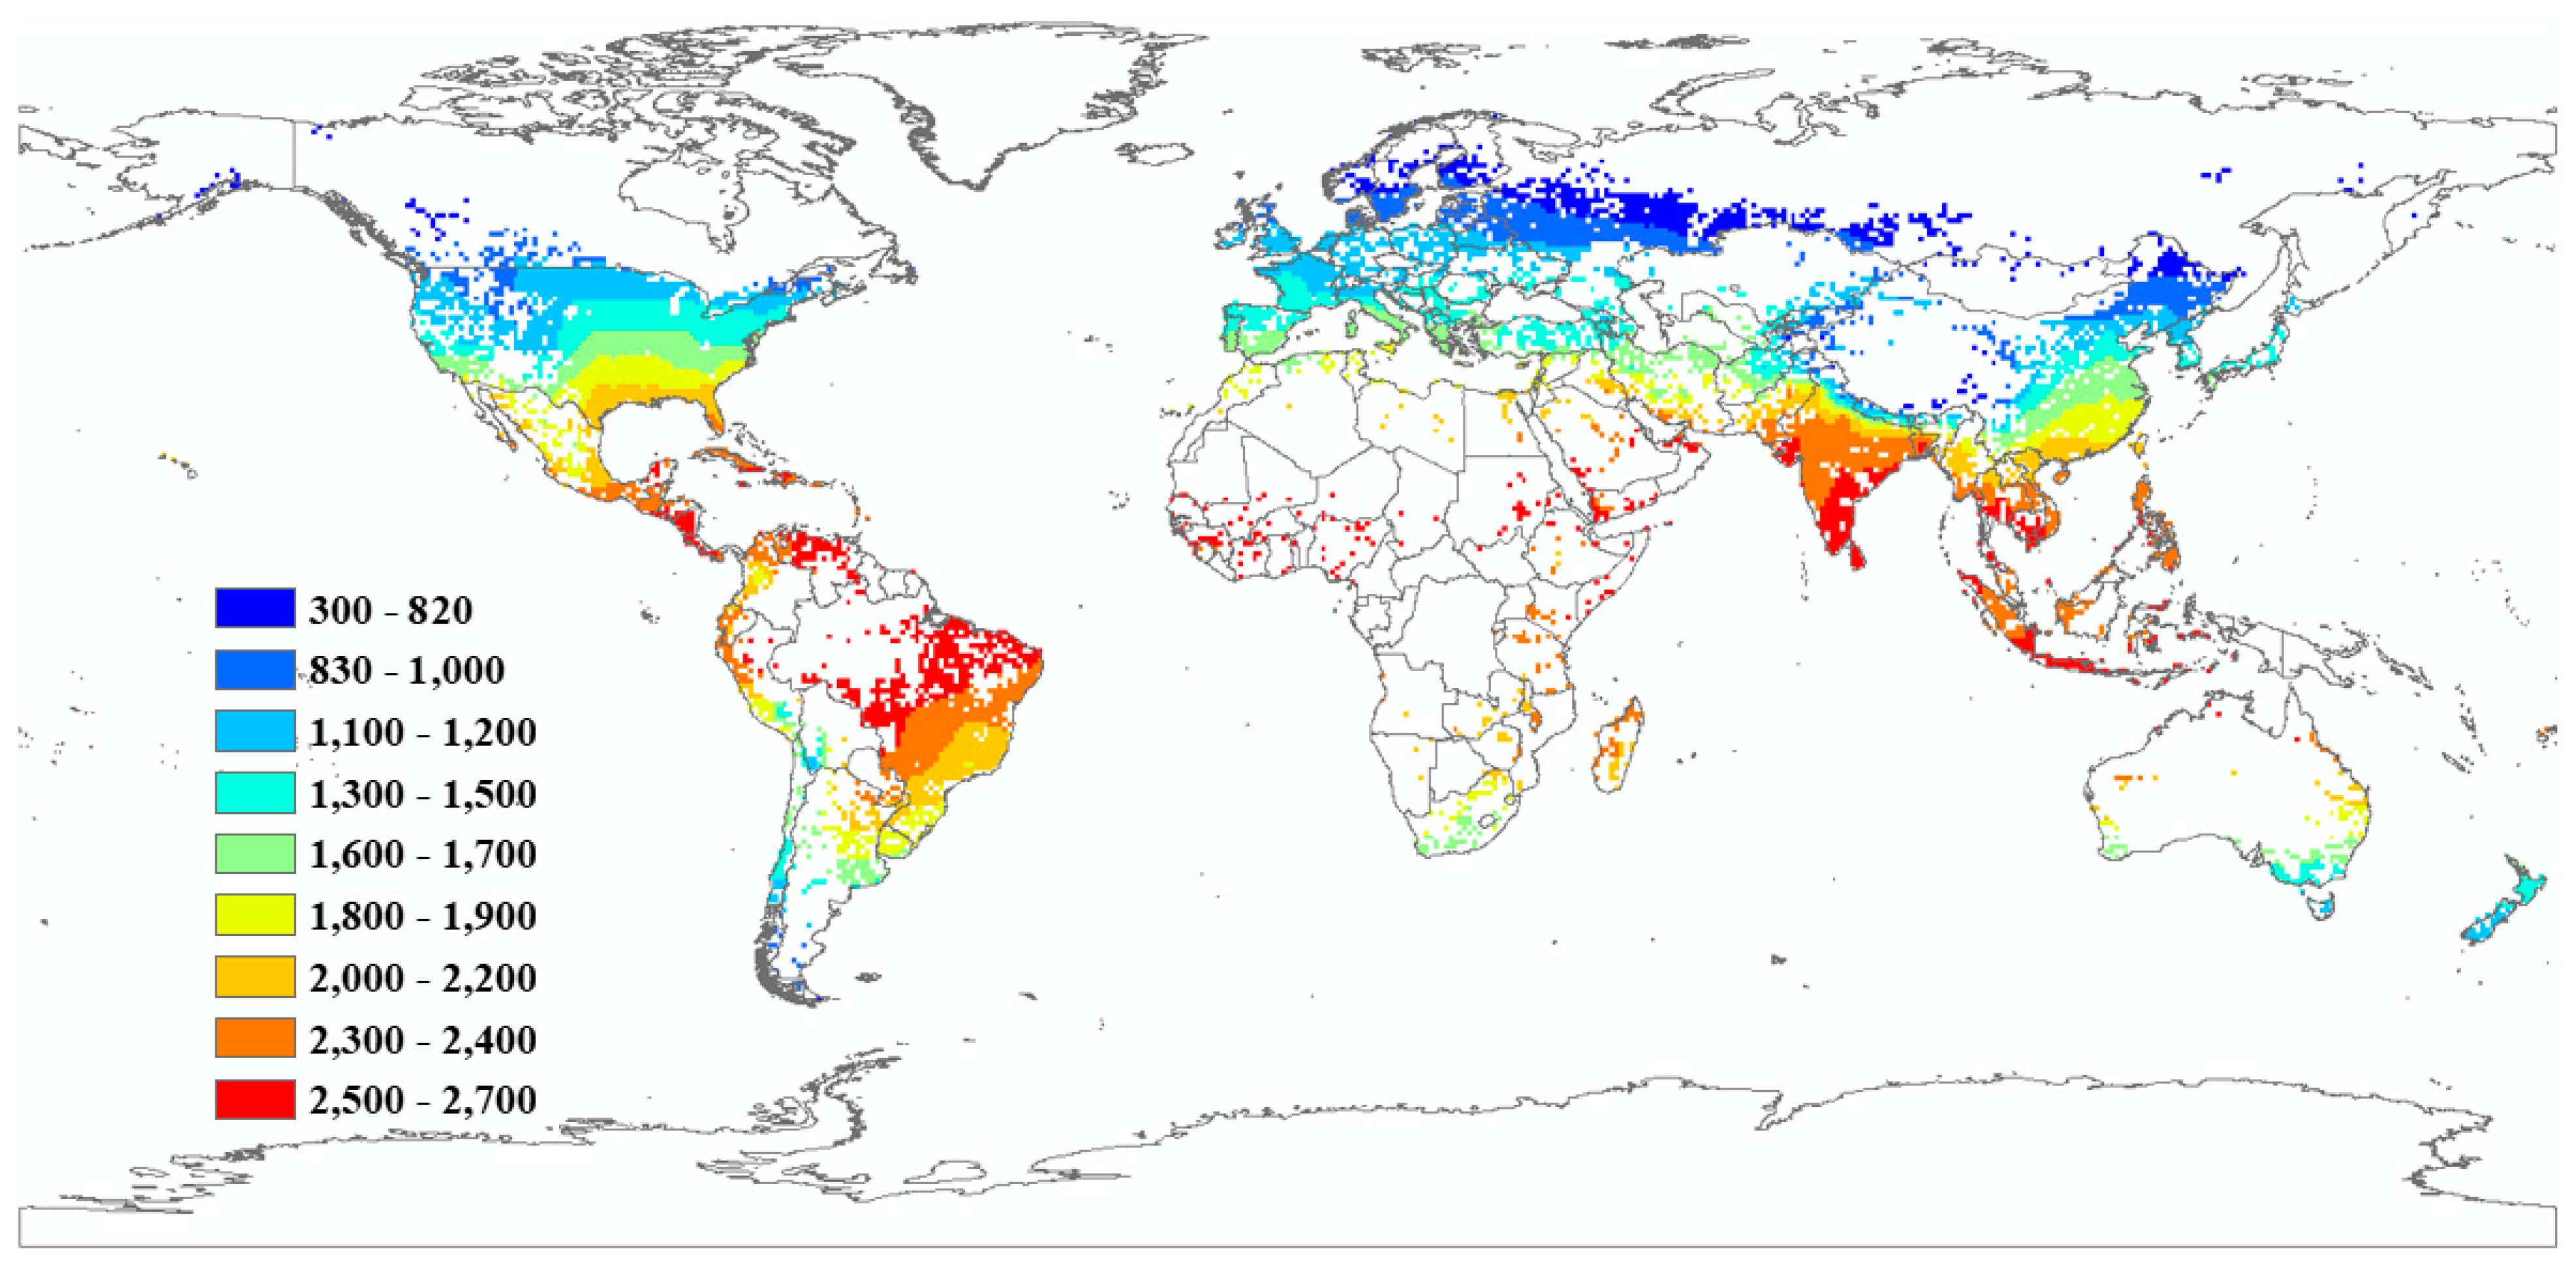
3.1.2. The IRnet in 1999

Figure 2 shows the evolution of the IRnet in 1999. There is an increase in IRnet in a global manner. As a result, the region of Europe and Central Asia, for example, saw a rise of 4.78%, as did the East Asian and Pacific region with an increase of 2.64%, compared with 1960. However, the region of Latin America and the Caribbean has the highest IRnet total at 1.36 Km3/year followed by the East and Pacific region (1.02 km3/yr) and the region of North America (0.83 km3/year) (Table 1).

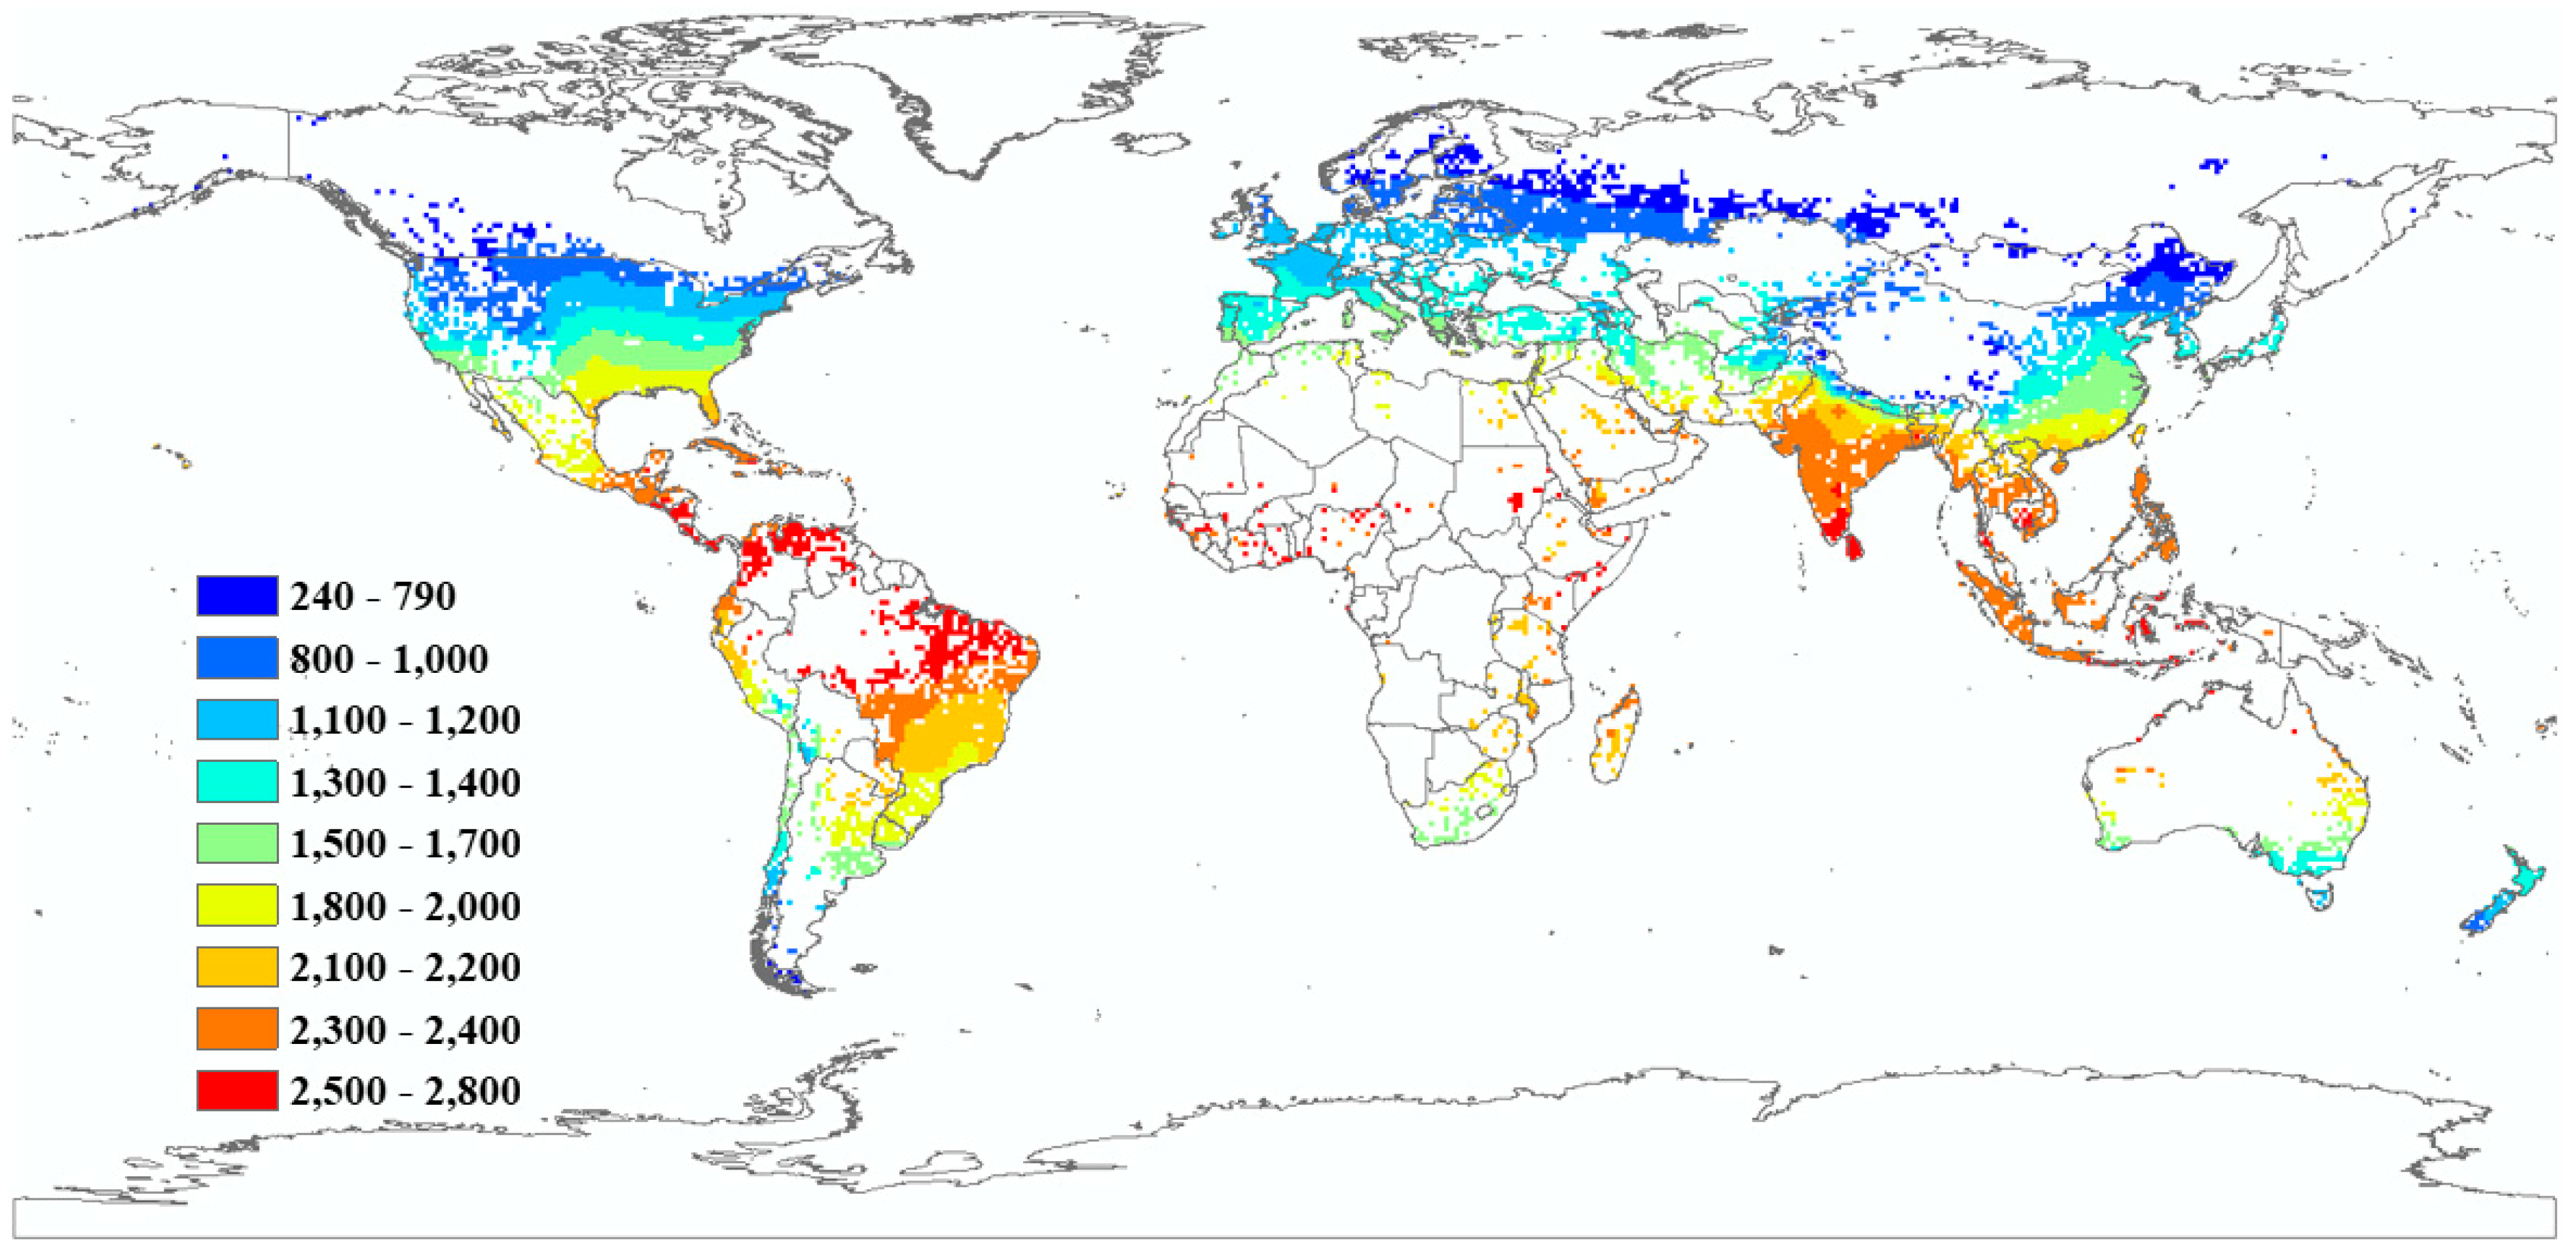
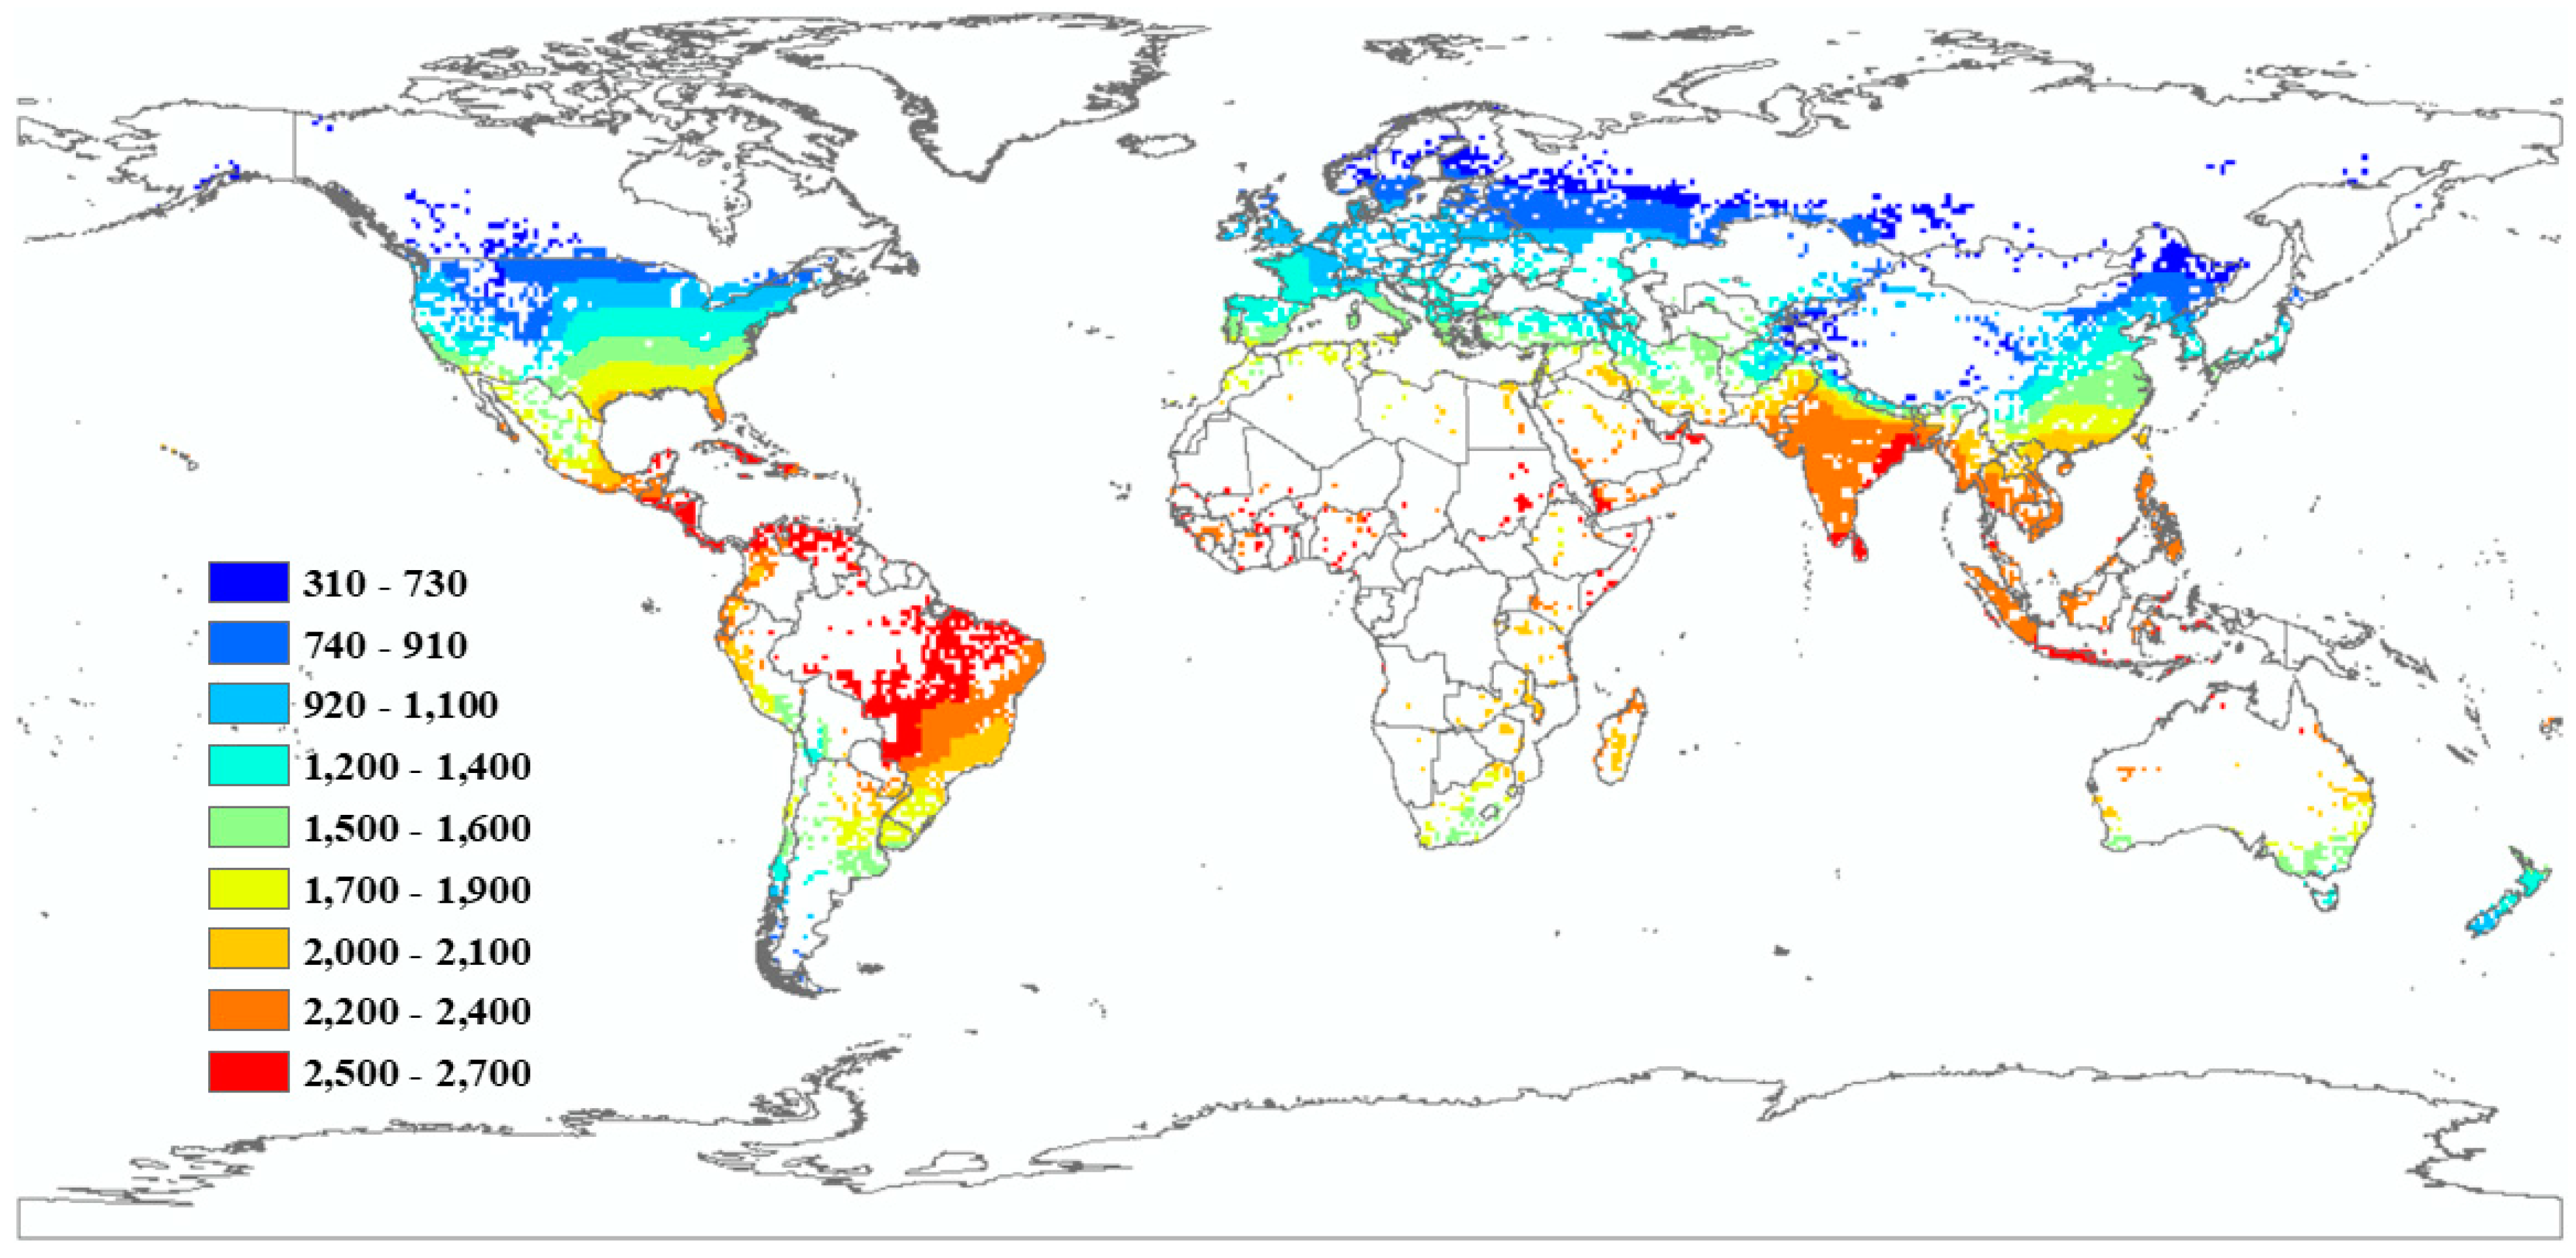
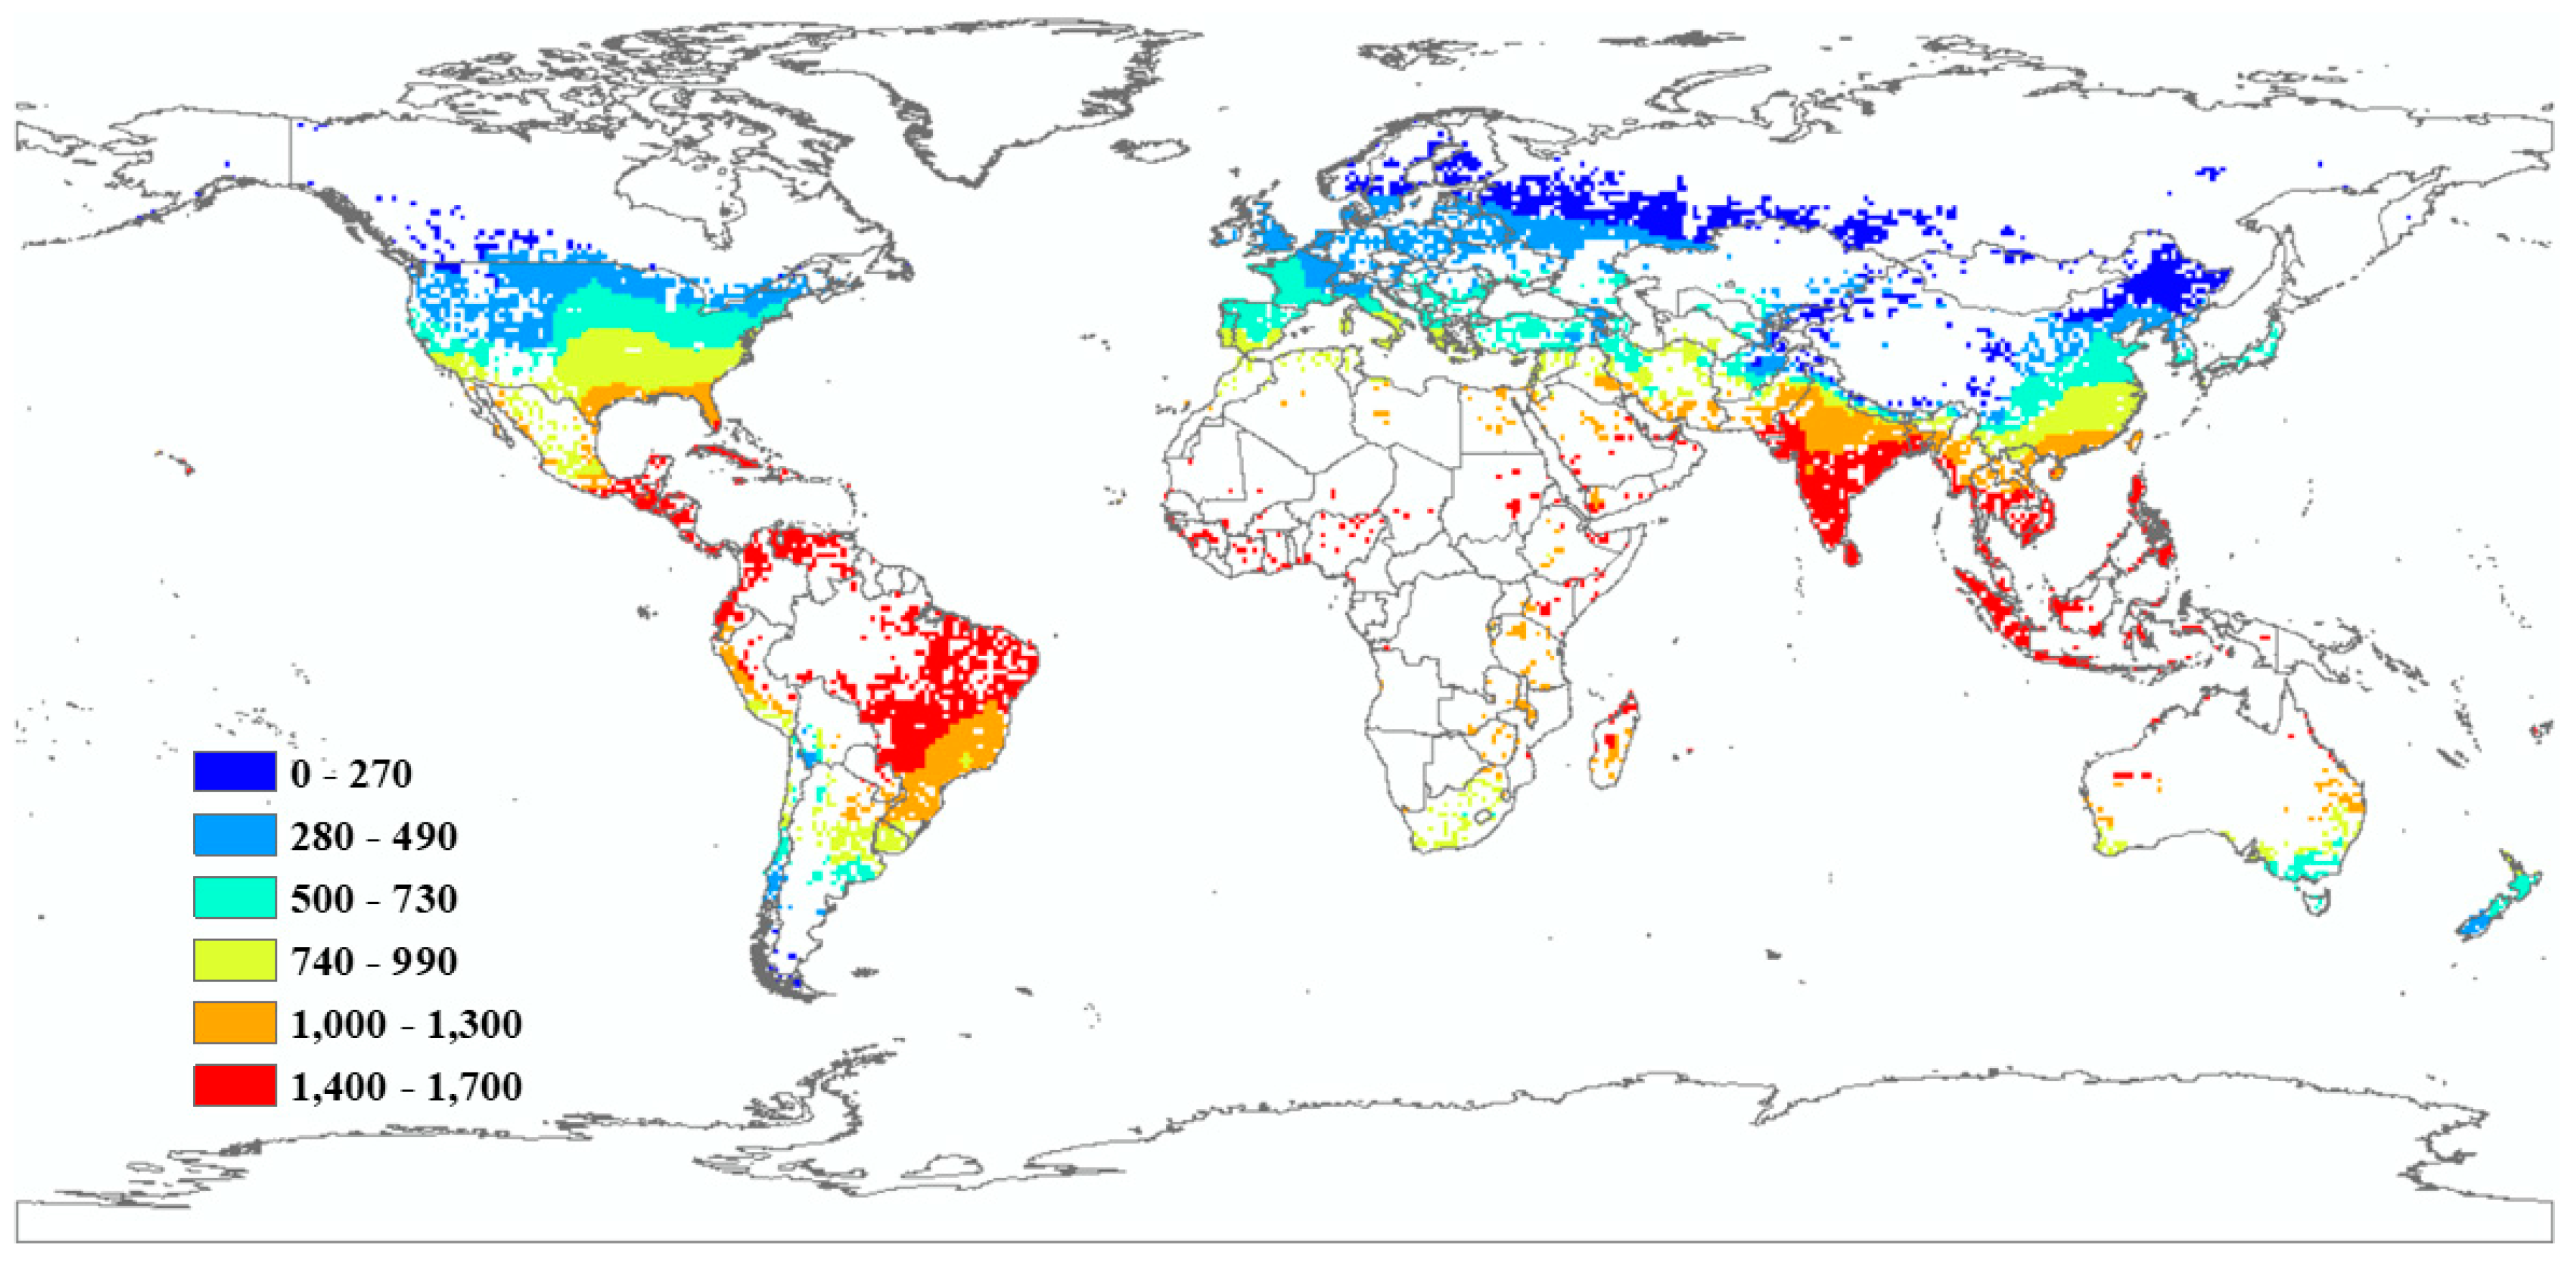
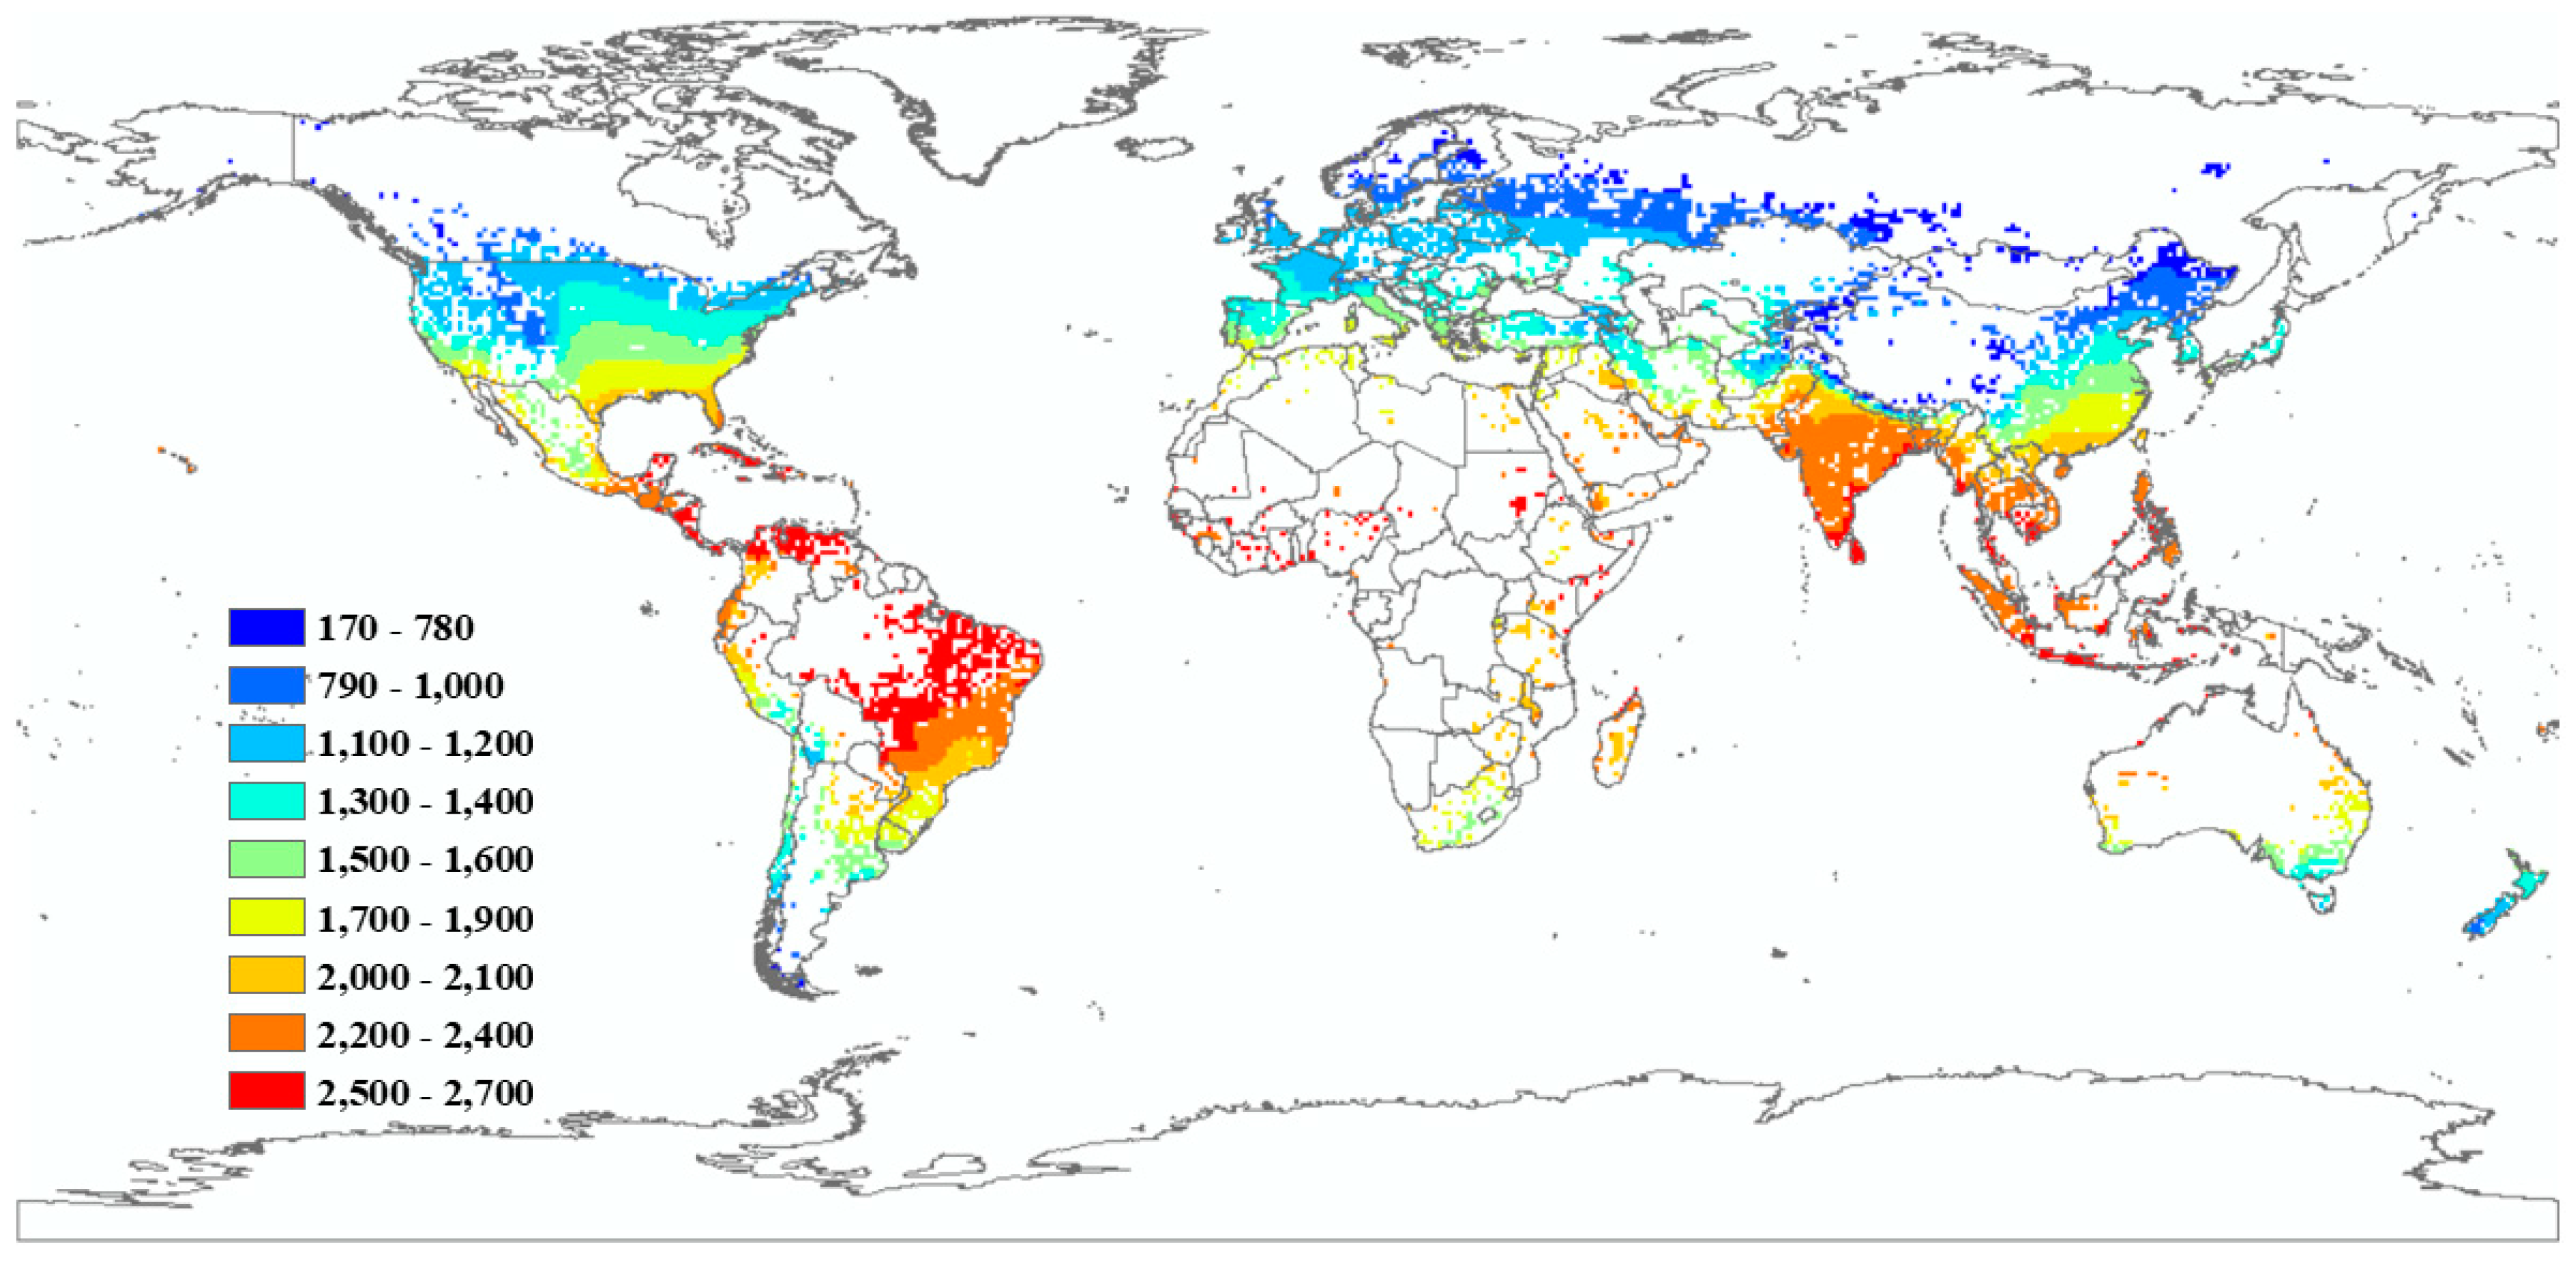
3.2. Net Irrigations Requirements for Future Climate Projections

3.2.1. Climate Data from the CSIRO Model under RCP 4.5 Emissions Scenarios

Figure 3 shows the distribution of IRnet , according to RCP 4.5. As a result, the regions around the equator have I R n e t between 2400 and 3100 mm/year, while at the level of the Arctic Circle, it is 210 and 990 mm/year. However, North America and the Middle East and the North Africa region have an increase of 15.62% and 11.07% respectively (Table 2). Furthermore, it should be noted that the region of Latin America and the Caribbean has the highest total of IRnet with more than 1.48 km3/year, followed by the region of East Asia and the Pacific and the region of North America.

3.2.2. Climate Data from the CSIRO Model under RCP 8.5 Emissions Scenarios

According to RCP 8.5, Latin America and the Caribbean have the highest IRnet quantity at 1.47 km3/year, followed by the East and Pacific region and the region of North America. However, the North American region is expected to have the most significant increase with more than 16% (Table 2) compared to 1960, followed by Europe and Central Asia (11.79%). Figure 4 shows the distribution of IRnet. As a result, the countries around the equator have an Irnet between 2300 and 3000 mm/year, while around the Arctic Circle, it is 250 to 990 mm/year.

3.2.3. Climate Data from the ECHAM Model under RCP 4.5 Emissions Scenarios

In Figure 5, the value of the IRnet is between 240 and 2800 mm/year. The countries above the latitude of Cancer have an Irnet between 240 and 2000 mm/year. According to RCP 4.5, the Latin American and Caribbean region has a large Irnet total of 1.43 km3/year (Table 3), followed by the North American region, and the region of Europe and Central Asia. However, the region of Europe and Central Asia increased by more than 16% compared with 1960, followed by the North American region, with an increase of 11.83%.

3.2.4. Climate Data from the ECHAM Model under RCP 8.5 Emissions Scenarios

Figure 6 shows that the amount of IRnet varies between 260 and 2800 mm/year. The small quantities are mostly observed around the poles. However, between Cancer and Capricorn latitude, the values are quite high between 2300 and 2800 mm/yr. Compared with 1960, the region of the Middle East and North Africa and part of Europe and Central Asia have an increase of more than 13%, followed by North America (10.93%). However, the region of Latin America and the Caribbean has the highest total of IRnet with a quantity of more than 1.45 km3/year, followed by the area of East Asia and the Pacific with over 1.12 km3/year (Table 3).

3.2.5. Climate Data from the GFDL Model under RCP 4.5 Emissions Scenarios

According to RCP 4.5, the quantity of IRnet varies between 230 and 2600 mm/year (Figure 7), and the countries located near the equator have the most considerable amounts between 2200 and 2600 mm/year. However, those situated, for example, above the latitude of Cancer have relatively low values, notably the countries near the arctic polar circle with quantities between 230 and 890 mm/year. However, there is an increase of approximately 7.37% (Table 4) in the European and Central Asian region. For example, the North American region is expected to increase by approximately 0.75%. However, the Latin American and Caribbean region has the highest IRnet total at 1.39 km3/year, while sub-Saharan Africa has a total of 0.13 km3/year.

3.2.6. Climate Data from the GFDL Model under RCP 8.5 Emissions Scenarios

For RCP 8.5, the amount of IRnet varies from 250 to 2700 mm/year (Figure 8). However, the region of East Asia and the Pacific has a total of 1.06 km3/year behind the Latin American and Caribbean region (1.13 km3/year), while the region of sub-Saharan Africa has a total of 0.13 Km3/year (Table 4). However, the European region has an increase of 11.27% over 1960 followed by South Asia (7.62%), the region of sub-Saharan Africa, for example, has a rise of 4.06%. The countries around the equator have a relatively large quantity of IRnet. These quantities vary from 2100 to 2700 mm/year. On the other hand, and the countries around the poles have I R n e t between 310 and 910 mm/year.

3.2.7. Climate Data from the MIROC 5 Model under RCP 4.5 Emissions Scenarios

According to RCP 4.5, the range of IRnet varies between 310 and 2700 mm/year. The countries situated between Cancer and Capricorn have the highest quantities, between 2300 and 2700 mm/year (Figure 9). On the other hand, countries outside these latitudes and near poles have an amount between 310 and 1000 mm/year. The region of Latin America and the Caribbean has a total IRnet of 1.44 km3/year (Table 5), followed by the East Asian and Pacific region and the North American region. It should be added, however, that the North American part shows an increase of more than 24% while the sub-Saharan Africa region is likely to increase by only 8.37%.

3.2.8. Climate Data from the MIROC 5 Model under RCP 8.5 Emissions Scenarios

With a total of 1.44 km3/year, the region of Latin America and the Caribbean has the most significant amount of IRnet (Table 5), followed by part of East Asia and the Pacific (1.12 km3/year) and the area of North America (1 km3/year). The countries close to the equator have the most substantial quantities between 2200 and 2700 mm/year (Figure 10). It should be added, however, that the North American region shows an increase of 24.38% followed by the region of Europe and Central Asia with an increase of 20.29%.

3.2.9. Climate Data from the NCAR Model under RCP 4.5 Emissions Scenarios

According to RCP 4.5, the region of Latin America and Caribbean has a total net share of 1,699,770 mm/year, followed by the East Asian and Pacific region (Table 6). The countries near the polar circles have an IRnet between 0 and 270 mm/year, while those between Cancer and Capricorn have an IRnet between 1300 and 1700 mm/year (Figure 11). RCP 4.5 shows a decrease of more than 57% in the region of Europe and Central Asia, more than 46% in the North American area, and over 39% in the region of sub-Saharan Africa.

3.2.10. Climate Data from the NCAR Model under RCP 8.5 Emissions Scenarios

Figure 12 shows the variation of IRnet according to RCP 8.5 with extremes between 2200 and 2700 mm/year around the equator and the minimums between 170 and 1000 mm/year near the polar circles. However, it is the region of Latin America and the Caribbean which has the most significant amount of IRnet with more than 1.43 km3/year, followed by part of North America and the region of East Asia and the Pacific. Besides, the area of North America shows an increase of over 68% (Table 6), followed by Europe and Central Asia region with 23.20%, while the area of sub-Saharan Africa has only 5.66%.

4. Discussion

This global study examines and quantifies the impacts of climate change on the net irrigation needs of IRnet maize and thus provides new information required for an optional production of maize. The harshness of the effect of climate change on IRnet is evaluated by comparing the impact of climate change on IRnet in the year 1960 and the year 2050.
By examining the results of the process of this paper (Figure 13), it appears that between 1960 and 1999, IRnet’s overall average was 1550.74 mm/year in 1960, compared to 1587.55 mm/year in 1999. This represents an increase in the global IRnet average of approximately 2%. The same observation can be made by comparing the means of the global IRnet in 1960 with the other five models. For example, for CSIRO, RCP 4.5 presents a total average of 1707.88 mm/year, which is an overall increase of just over 10%.
However, according to most of the five GCMs, the sub-Saharan Africa region is the region with the highest average of Irnet. The values range from 2110.88 mm/year (GFDL) to 2209 mm/year (MIROC 5) according to RCP 8.5, while RC 4.5 has values ranging from 1228.65 mm/year (NCAR) to 2215 mm/year (ECHAM). However, the sub-Saharan Africa region is also one of the regions with the smallest variation of Irnet. Indeed, this region is characterized by its low rainfall and also often confronted with drought. Most of the countries in this area are generally developing countries, which explains the low expansion of irrigation. Nevertheless, maize production covers a vast area in Nigeria. It is 7th in the world, followed by Tanzania and South Africa. The highest producers are South Africa, which is 9th in the world, followed by Nigeria, and Ethiopia [49]. According to FAO in 1995, Nigeria produced 6.93 million tonnes of maize (Mt), followed by South Africa with 4.87 Mt and Ethiopia with 1.99 Mt. For parts that were equipped for irrigation in 1995, to maintain efficient production according to the result in 2050, Nigeria should reach an IRnet of 2688 mm/year (CSIRO), against 2333.17 mm/year (CSIRO) for Ethiopia and 1858.15 mm/year (CSIRO) for South Africa. The countries such as Niger, Mali, or even Chad are at the gateway to the desert (Sahara), and they produced respectively 2000 t, 266,136 t and 62,537 t in 1995. Those countries are expected to improve their production in 2050, by reaching an IRnet of approximately 2662.14 mm/year for Niger (CSIRO), 2773.05 mm/year for Mali (CSIRO) and 2754.60 mm/year for Tchad (CSIRO). It can also be the cause of the unfortunate practice of irrigation. The sub-Saharan African region has the smallest area of irrigation according to the FAO. As a result, the total water quantity used for irrigation in this region is also the lowest, as predicted by the different models.
However, the Middle East and North African region has a much lower average than the sub-Saharan African region. According to RCP 4.5, the region has an average of approximately 1615.6 mm/year, while the RCP 8.5 predicts an average of 1782.36 mm/year. The North African and Middle East region have better rainfall conditions than the sub-Saharan region. As a result, the amount of water associated with irrigation is much higher. In sub-Saharan Africa, maize is the foremost widely grown crop and could be stapled nourishment for an assessed 50% of the populace [49]. However, the area of the irrigation areas is much larger than that of the sub-Saharan African region, so maize cultivation in the Middle East and North Africa region requires more significant amounts of water due to the increase of the irrigation area. It should also be added that this region has a much more advanced economy than that of the sub-Saharan African region. In 1995, maize production in this part of the world, according to FAO, was negated by Egypt (4.5 Mt), followed by Iran (697,246 t) and Syria (199,000 t). In 2050, according to ECHAM RPC 8.5 for example, to increase the production in this region, the amount of IRnet should be approximately 2127.62 mm/year in Egypt, followed by Syria with 1829.01 mm/year and 1828.41 mm/year in Iran. However, it should be noted that these different quantities concern only the areas equipped for irrigation in 1995.
The region of Europe and Central Asia is one of the areas with the lowest average of Irnet. In spite of a reasonably large surface area, this region uses a minimal amount of water for irrigation. The proportion varies from 859.57 mm/year for RCP 4.5 to 1012.92 mm/year for RCP 8.5. This region is most often plentiful in rainfall, and in most countries, it rains throughout the year in general. It should similarly be pointed out that most of this region comprises developed countries, hence the extension of the irrigation areas in this region. Unlike countries in the sub-Saharan African region, most countries do not experience more than three or four months of the rainy season. It shows, on the one hand, the difference in the irrigation surface, but also, on the other hand, the quantity of water used for irrigation. According to Eurostat, France and Romania alone accounted for approximately 45% of maize production in Europe in 2017. However, in 1995, according to FAO, France’s production was 12.58 Mt and 9.92 Mt for Romania.
On the other hand, in central Asia, according to the FAO, Afghanistan remains the leading producer of maize in this zone. In 1995, maize production in Afghanistan was 530,000 t. To maintain this production or in the perspective of increasing it, France should reach an average IRnet of 1254.55 mm/year in 2050, according to MIROC 5 RPC 8.5. However, according to the same GCM, Romania should have an IRnet of 1308.17 mm/year against 1462.08 mm/year for Afghanistan, in 2050.
The region of South Asia has a smaller irrigated area than the region of Europe and Central Asia. However, the South Asian region uses a large amount of water for irrigation. The precipitations in this region are not as abundant as that in the European and Central Asian region. Nevertheless, the countries of the South Asian region have economies that are solid enough to support the costs of irrigation, but also the existence of several water sources to meet the water needs of irrigation. Unlike the region of sub-Saharan Africa, water sources for irrigation are not always accessible or nonexistent. According to the models, South Asia is one of the regions that is expected to be moderately affected by the effects of climate change. Most of the models estimate that the amount of water used for maize growing will be between 0.6 and 0.62 km3/year. This total amount of Irnet is more significant than that of the region of Europe and Central Asia. Maize production in this region is dominated by India with the production of 9.53 Mt in 1995 against 12.04 Mt in 2000 according to the FAO. In 2050, MIROC 5 RCP 8.5 predicts an IRnet of approximately 2151.82 mm/year. Pakistan was the second producer with a production of 1.50 Mt in 1995 and 1.65 Mt in 2000. The prediction of MIROC 5 is 1879.68 mm/year, to ensure a better production in 2050.
The region of Latin America and the Caribbean is the region that uses the most considerable amount of water for irrigation, according to almost all models. The total irrigation values vary from 0.81 km3/year to 1.48 km3/year. The total area of irrigation is expected to be approximately 673.68 km2 far in front of the sub-region of Africa or the region of Europe, and in Central Asia or even in the South Asian area. It should be pointed out that the region of Latin America and the Caribbean is often confronted with drought, yet this region is full of enough water source but also a more or less stable economy to meet the demands of irrigation. However, the Latin American and Caribbean region uses large quantities of water for irrigation because it has countries with the maximum IRnet used worldwide, with values of up to 3030 mm/year according to GCS CSIRO RCP 8.5. Ranking third and eighth as world maize producers in 2019 by the Index Mundin, Brazil and Mexico are the top two maize producers in Latin America and Caribbean. in 1995. The production of Brazil was 36.27 Mt, against 18.35 Mt for Mexico. To ensure sustainable production, the GCM ECHAM RCP 8.5 predicts an average Irnet of 2465.46 mm/year for 2050 and 2171.20 mm/year for Mexico.
East Asia and Pacific is the second region with the largest area irrigated, just behind the North American region. China holds most of this area. The East Asian and Pacific region also ranks second for the total amount of water used in irrigation (Irnet), behind the Latin American and Caribbean region. However, this region has substantial quantities of the water source. It enables it to cope with the high demand for irrigation water in most of the countries of this region. It must also be added that the countries of this region have, for the most part, an economy powerful enough to meet the requirements of their irrigation. There is notably China, which is the first economic power in the world. According to MO Xing-Guo [50], the potential evapotranspiration is expected to increase by 8%–16% and 7%–10% in the 2050s. However, the 2019 Index Mundin rankings reported that China and Indonesia are respectively the second and the eleventh world maize producers. As a result, they are the first producers of this region. According to the FAO, maize production in 1995 was 112.36 Mt and 8.25 Mt for Indonesia. Given the growth in demography, especially in China, and to ensure better production, China is expected to, according to ECHAM RPC 8.5, reach an Irnet of 1433.3 mm/year in 2050. For Indonesia, in 2050, the Irnet is expected to be 2534.72 mm/year. However, the East Asian and Pacific region is expected to experience an increase in Irnet quantity from 1960.
The North American region is the region with the largest irrigated area. This area is approximately 729 km2, placing this region first in the East Asian and Pacific region. As this large area floods, the North American region uses a total Irnet amount of 0.81 km3/year at 1 km3/year. This region also has one of the smallest Irnet averages. The North American region is a region with good rainfall. This region is one of the areas that has, more or less, water throughout the year. It is also necessary to add the existence of important water resources. As a result, despite the vast area of irrigated areas, the region of North America, because of the pluviometry abundance it possesses, can cope with the water requirements of irrigation. As the world’s largest producer, the United States of America dominates maize production in the North American region. Its production amounts to more than 380 Mt in 2019. According to the FAO, the production of maize was 187.97 mm/year in 2000 and the production reached 251.85 Mt. According to the NCAR RCP 8.5, the United States of America is expected to foresee an Irnet of 1503.05 mm/year in 2050 to ensure production. It should be added, however, that the economy of this region is one of the most powerful in the world, which could explain the expansion of the irrigation areas.
According to RCP 4.5, these increases vary between 0.74% (North America) and 20.92% (North America), while the RCP 8.5 predicts increases of 4.06% (sub-Saharan Africa) to more than 68% (North America). The region of sub-Saharan Africa is expected to have a slight increase according to the different models, perhaps due to its already extreme climate, while North America is the region with the most variation due to climate change. However, NCAR’s RCP 4.5 looks somewhat like an overall decrease of I R n e t . This decrease varies from more than 39% (sub-Saharan Africa) to more than 57% (Europe and Central Asia).
To consider the value of the importance of this study, it is essential to talk about the many sources of uncertainty. In general, GCMs do not take into account the influence of CO2 on plant physiology. As a result, there is an underestimation of regional warming and an overestimation of humidity, particularly in the tropics. Further, the modeling of the wetlands in climate change research on water wants is not ideal. In this study, only one plant was used for the simulation. However, if the simulation was carried out with a multicultural mode, this would indicate that these areas are more favored by climate change than other irrigated areas in the same region of the world. However, determining the impact of climate change on the water requirements of irrigation requires the inclusion of the different indirect effects of climate change. Moreover, the economic conditions are an essential factor in any adaptation, a state that in this study that is not taken into account.
However, the same conclusions have been observed in other works. As Wenfeng Liu [51] has shown in his work, the regions as arid desert hot and cold, arid steppe hot and cold, temperate dry and hot summer, temperate dry and warm summer have a high level of irrigation water requirements. The same results can be observed in the different pictures in our study. Those regions have the most elevated amount of irrigation water requirements. The increase is highest in the RCP 8.5 scenario than RCP 4.5 scenario as Hanqing Xu [52] concludes. If the country is specified, Tianwa Zhou [53] shows that the irrigation water requirement in his study area which is western Inner Mongolia in China is expected to be 648 mm under scenario A2 and 639 mm under B2. These values are included in the predicted interval for this area in 2050 in our study.

5. Conclusions

The analysis of the results shows an increase across the different regions. Fisher [21] estimates that the impact of climate change on IRnet is very significant, with a 20% increase between 2000 and 2080. Based on IPCC-5 data, this study also shows an increase in IRnet between 1960 and 2050. However, the continent of America (the region of North America and the region of Latin America and the Caribbean) is the continent with the most significant increase of I R n e t . According to the RCP 4.5, the continent of America has the highest total of IRnet which is between 1.24 km3/yr (NCAR) and 2.42 km3/yr (MIROC 5). For the RCP 8.5, it is between 2.29 km3/yr (GFDL) and 2.79 km3/yr (NCAR). The African continent (the region of sub-Saharan Africa and the Middle East and North Africa) is the continent with the smallest increase in I R n e t as well as the smallest irrigation area. In this part of the world, the amount of the IRnet is between 0.22 km3/yr (NCAR) and 0.43 km3/yr (MIROC) according to RCP 4.5. For RCP 8.5, the amount of the IRnet in Africa is between 0.39 km3/yr (GFDL) and 0.43 km3/yr (MIROC 5). On the other hand, the region of North America is the region with the largest area of irrigated area, followed by the region of East Asia and the Pacific and the region of Latin America and the Caribbean. The European and Central Asian region has the lowest average of I R n e t , followed by the region of East Asia and the Pacific. In other words, the continent of Europe and of Asia are the continents that use the least water globally in irrigation. It should be remembered, that RCP 4.5 of the GCM NCAR predicts, in contrast to other models, an overall decrease in I R n e t in all regions of the globe. By using maps from different models, decision-makers can indeed observe sensitive areas and thus develop a water distribution policy for more efficient irrigation. Although they show different values, the cards all have, for the most part, one thing in common: They predict an increase in IRnet. Based on the data of the IPCC-5, the different models reveal the zones that will face important increases. This way, decision-makers have to create new water policy strategies to deal with different changes. The previous work is mainly based on the data of the IPCC-4, while this study can be considered as another version of the update of the research carried out on the global representation of the IRnet. Thereby, this study helps decision-makers to make corrections in making their decision, and by interpolation on the other cultivated plants, to affirm that the result will be more or less the same. Specifically, that is to say, that the I R n e t of the greatest majority of plants of culture will know an important increase, more or less, depending on the region.

Author Contributions

Conceptualization, H.L.; methodology, A.O.A.; software, A.O.A.; validation, A.O.A. and H.L.; formal analysis, A.O.A., Y.A.H. and M.S.; investigation, A.O.A., and Y.Z.; resources, H.L.; data curation, A.O.A.; writing—original draft preparation, A.O.A. and Y.A.H.; writing—review and editing, A.O.A., Y.A.H., M.S., H.L., and Y.Z.; visualization, H.L.; supervision, H.L.; project administration, H.L.; funding acquisition, H.L.

Funding

This research is supported by National Key Research and Development Program (grant Nos. 2018YFA0605400, 2016YFA0601504); NNSF (grant Nos. 41830752 and 41571015); and the open funding of the Laboratory (grant Nos. OFSLRSS201806, HRM201704, 2018B44114).

Acknowledgments

The authors thank the reviewers and editors for their valuable comments about the manuscript.

Conflicts of Interest

The authors declare no conflict of interest.

References

  1. Kotir, J.H. Climate change and variability in Sub-Saharan Africa: A review of current and future trends and impacts on agriculture and food security. Environ. Dev. Sustain. 2011, 13, 587–605. [Google Scholar] [CrossRef]
  2. Rossati, A. Global warming and its health impact. Int. J. Occup. Env. Med. (IJOEM) 2017, 8. [Google Scholar] [CrossRef] [PubMed]
  3. Ebi, K.L.; Ogden, N.H.; Semenza, J.C.; Woodward, A. Detecting and attributing health burdens to climate change. Environ. Health Perspect. 2017, 125, 085004. [Google Scholar] [CrossRef] [PubMed]
  4. Pecl, G.T.; Araújo, M.B.; Bell, J.D.; Blanchard, J.; Bonebrake, T.C.; Chen, I.-C.; Clark, T.D.; Colwell, R.K.; Danielsen, F.; Evengård, B. Biodiversity redistribution under climate change: Impacts on ecosystems and human well-being. Science 2017, 355, eaai9214. [Google Scholar] [CrossRef] [PubMed]
  5. Myers, S.S.; Smith, M.R.; Guth, S.; Golden, C.D.; Vaitla, B.; Mueller, N.D.; Dangour, A.D.; Huybers, P. Climate change and global food systems: Potential impacts on food security and undernutrition. Annu. Rev. Public Health 2017, 38, 259–277. [Google Scholar] [CrossRef]
  6. Serdeczny, O.; Adams, S.; Baarsch, F.; Coumou, D.; Robinson, A.; Hare, W.; Schaeffer, M.; Perrette, M.; Reinhardt, J. Climate change impacts in Sub-Saharan Africa: From physical changes to their social repercussions. Reg. Environ. Chang. 2017, 17, 1585–1600. [Google Scholar] [CrossRef]
  7. Caney, S. Human rights, responsibilities, and climate change. In Environmental Rights; Routledge: London, UK, 2017; pp. 117–137. [Google Scholar]
  8. Moazenzadeh, R.; Mohammadi, B. Assessment of bio-inspired metaheuristic optimisation algorithms for estimating soil temperature. Geoderma 2019, 353, 152–171. [Google Scholar] [CrossRef]
  9. Ahmadzadeh Araji, H.; Wayayok, A.; Massah Bavani, A.; Amiri, E.; Abdullah, A.F.; Daneshian, J.; Teh, C.B.S. Impacts of climate change on soybean production under different treatments of field experiments considering the uncertainty of general circulation models. Agric. Water Manag. 2018, 205, 63–71. [Google Scholar] [CrossRef]
  10. Aghelpour, P.; Mohammadi, B.; Biazar, S.M. Long-term monthly average temperature forecasting in some climate types of Iran, using the models SARIMA, SVR, and SVR-FA. Theor. Appl. Climatol. 2019. [Google Scholar] [CrossRef]
  11. Nerem, R.S.; Beckley, B.D.; Fasullo, J.T.; Hamlington, B.D.; Masters, D.; Mitchum, G.T. Climate-change–driven accelerated sea-level rise detected in the altimeter era. Proc. Natl. Acad. Sci. USA 2018, 115, 2022–2025. [Google Scholar] [CrossRef]
  12. Clapp, J.; Newell, P.; Brent, Z.W. The global political economy of climate change, agriculture and food systems. J. Peasant Stud. 2018, 45, 80–88. [Google Scholar] [CrossRef]
  13. Tol, R.S. The economic impacts of climate change. Rev. Environ. Econ. Policy 2018, 12, 4–25. [Google Scholar] [CrossRef]
  14. Hsiang, S.; Kopp, R.; Jina, A.; Rising, J.; Delgado, M.; Mohan, S.; Rasmussen, D.; Muir-Wood, R.; Wilson, P.; Oppenheimer, M. Estimating economic damage from climate change in the United States. Science 2017, 356, 1362–1369. [Google Scholar] [CrossRef] [PubMed] [Green Version]
  15. Zhang, P.; Zhang, J.; Chen, M. Economic impacts of climate change on agriculture: The importance of additional climatic variables other than temperature and precipitation. J. Environ. Econ. Manag. 2017, 83, 8–31. [Google Scholar] [CrossRef]
  16. Estrada, F.; Botzen, W.W.; Tol, R.S. A global economic assessment of city policies to reduce climate change impacts. Nat. Clim. Chang. 2017, 7, 403. [Google Scholar] [CrossRef]
  17. Hallegatte, S.; Rozenberg, J. Climate change through a poverty lens. Nat. Clim. Chang. 2017, 7, 250. [Google Scholar] [CrossRef]
  18. Sonwa, D.J.; Dieye, A.; El Mzouri, E.-H.; Majule, A.; Mugabe, F.T.; Omolo, N.; Wouapi, H.; Obando, J.; Brooks, N. Drivers of climate risk in African agriculture. Clim. Dev. 2017, 9, 383–398. [Google Scholar] [CrossRef]
  19. Weber, T.; Haensler, A.; Rechid, D.; Pfeifer, S.; Eggert, B.; Jacob, D. Analyzing regional climate change in africa in a 1.5, 2, and 3 C global warming world. Earth’s Future 2018, 6, 643–655. [Google Scholar] [CrossRef]
  20. Murphy, J.M.; Sexton, D.M.H.; Barnett, D.N.; Jones, G.S.; Webb, M.J.; Collins, M.; Stainforth, D.A. Quantification of modelling uncertainties in a large ensemble of climate change simulations. Nature 2004, 430, 768. [Google Scholar] [CrossRef]
  21. Fischer, G.; Tubiello, F.N.; van Velthuizen, H.; Wiberg, D.A. Climate change impacts on irrigation water requirements: Effects of mitigation, 1990–2080. Technol. Forecast. Soc. Chang. 2007, 74, 1083–1107. [Google Scholar] [CrossRef]
  22. Lesley, H.; Michael, A.; Stephanie, T. Climate change and Australia. Wiley Interdiscip. Rev. Clim. Chang. 2014, 5, 175–197. [Google Scholar] [CrossRef]
  23. Kapetanaki, G.; Rosenzweig, C. Impact of climate change on maize yield in central and northern Greece: A simulation study with CERES-Maize. Mitig. Adapt. Strateg. Glob. Chang. 1997, 1, 251–271. [Google Scholar] [CrossRef]
  24. Konzmann, M.; Gerten, D.; Heinke, J. Climate impacts on global irrigation requirements under 19 GCMs, simulated with a vegetation and hydrology model. Hydrol. Sci. J. 2013, 58, 88–105. [Google Scholar] [CrossRef]
  25. Döll, P. Impact of Climate Change and Variability on Irrigation Requirements: A Global Perspective. Clim. Chang. 2002, 54, 269–293. [Google Scholar] [CrossRef]
  26. Al-Ghobari, H.M.; Dewidar, A.Z. Deficit irrigation and irrigation methods as on-farm strategies to maximize crop water productivity in dry areas. J. Water Clim. Chang. 2017, 9, 399–409. [Google Scholar] [CrossRef]
  27. Lehn, H.; Simon, L.M.; Oertel, M. Climate Change Impacts on the Water Sector. In Climate Adaptation Santiago; Krellenberg, K., Hansjürgens, B., Eds.; Springer: Berlin/Heidelberg, Germany, 2014; pp. 59–79. [Google Scholar] [CrossRef]
  28. Lengoasa, J. Climate variability and change: Impacts on water availability. Irrig. Drain. 2016, 65, 149–156. [Google Scholar] [CrossRef]
  29. Novoa, D.C. Hydro-economic analysis for water resources management in a changing climate. In Climate Change and the Sustainable Use of Water Resources; Springer: Berlin, Germay, 2012; pp. 127–141. [Google Scholar]
  30. Babel, M.S.; Agarwal, A.; Shinde, V.R. Climate Change Impacts on Water Resources and Selected Water Use Sectors. In Climate Change and Water Resources; CRC Press: Boca Raton, FL, USA, 2014; pp. 126–169. [Google Scholar]
  31. Hamoud, Y.A.; Guo, X.; Wang, Z.; Shaghaleh, H.; Chen, S.; Hassan, A.; Bakour, A. Effects of irrigation regime and soil clay content and their interaction on the biological yield, nitrogen uptake and nitrogen-use efficiency of rice grown in southern China. Agric. Water Manag. 2019, 213, 934–946. [Google Scholar] [CrossRef]
  32. Frenken, K.; Gillet, V. Irrigation Water Requirement and Water Withdrawal by Country; FAO: Rome, Italy, 2012. [Google Scholar]
  33. Rodríguez Díaz, J.A.; Weatherhead, E.K.; Knox, J.W.; Camacho, E. Climate change impacts on irrigation water requirements in the Guadalquivir river basin in Spain. Reg. Environ. Chang. 2007, 7, 149–159. [Google Scholar] [CrossRef]
  34. Hamoud, Y.A.; Shaghaleh, H.; Sheteiwy, M.; Guo, X.; Elshaikh, N.A.; Khan, N.U.; Oumarou, A.; Rahim, S.F. Impact of alternative wetting and soil drying and soil clay content on the morphological and physiological traits of rice roots and their relationships to yield and nutrient use-efficiency. Agric. Water Manag. 2019, 223, 105706. [Google Scholar] [CrossRef]
  35. Richard, M.A.; Brian, H.H.; Stephanie, L.; Neil, L. Effects of global climate change on agriculture: An interpretative review. Clim. Res. 1998, 11, 19–30. [Google Scholar]
  36. Cline, W.R. Global warming and agriculture. Financ. Dev. 2008, 45, 23. [Google Scholar]
  37. Karl, T.R.; Trenberth, K.E. Modern Global Climate Change. Science 2003, 302, 1719–1723. [Google Scholar] [CrossRef] [PubMed] [Green Version]
  38. Boonwichai, S.; Shrestha, S.; Babel, M.S.; Weesakul, S.; Datta, A. Climate change impacts on irrigation water requirement, crop water productivity and rice yield in the Songkhram River Basin, Thailand. J. Clean. Prod. 2018, 198, 1157–1164. [Google Scholar] [CrossRef]
  39. Ali, S.; Liu, Y.; Ishaq, M.; Shah, T.; Ilyas, A.; Din, I. Climate change and its impact on the yield of major food crops: Evidence from Pakistan. Foods 2017, 6, 39. [Google Scholar] [CrossRef]
  40. Alhaj Hamoud, Y.; Wang, Z.; Guo, X.; Shaghaleh, H.; Sheteiwy, M.; Chen, S.; Qiu, R.; Elbashier, M. Effect of Irrigation Regimes and Soil Texture on the Potassium Utilization Efficiency of Rice. Agronomy 2019, 9, 100. [Google Scholar] [CrossRef]
  41. Kang, S.; Hao, X.; Du, T.; Tong, L.; Su, X.; Lu, H.; Li, X.; Huo, Z.; Li, S.; Ding, R. Improving agricultural water productivity to ensure food security in China under changing environment: From research to practice. Agric. Water Manag. 2017, 179, 5–17. [Google Scholar] [CrossRef]
  42. Davis, K.F.; Rulli, M.C.; Seveso, A.; D’Odorico, P. Increased food production and reduced water use through optimized crop distribution. Nat. Geosci. 2017, 10, 919. [Google Scholar] [CrossRef]
  43. Yue, Q.; Xu, X.; Hillier, J.; Cheng, K.; Pan, G. Mitigating greenhouse gas emissions in agriculture: From farm production to food consumption. J. Clean. Prod. 2017, 149, 1011–1019. [Google Scholar] [CrossRef]
  44. Jägermeyr, J.; Gerten, D.; Schaphoff, S.; Heinke, J.; Lucht, W.; Rockström, J. Integrated crop water management might sustainably halve the global food gap. Environ. Res. Lett. 2016, 11, 025002. [Google Scholar] [CrossRef]
  45. Döll, P.; Siebert, S. Global modeling of irrigation water requirements. Water Resour. Res. 2002, 38, 1–10. [Google Scholar] [CrossRef]
  46. Hamoud, Y.A.; Guo, X.; Wang, Z.; Chen, S.; Rasoul, G. Effects of irrigation water regime, soil clay content and their combination on growth, yield, and water use efficiency of rice grown in South China. Int. J. Agric. Biol. Eng. 2018, 11, 144–155. [Google Scholar]
  47. Smith, M. CROPWAT: A Computer Program for Irrigation Planning and Management; Food and Agriculture Organization of the United Nations: Rome, Italy, 1992. [Google Scholar]
  48. Raziei, T.; Pereira, L.S. Estimation of ETo with Hargreaves–Samani and FAO-PM temperature methods for a wide range of climates in Iran. Agric. Water Manag. 2013, 121, 1–18. [Google Scholar] [CrossRef]
  49. Badu-Apraku, B.; Fakorede, M.A.B. Maize in Sub-Saharan Africa: Importance and Production Constraints. In Advances in Genetic Enhancement of Early and Extra-Early Maize for Sub-Saharan Africa; Springer: Cham, Germany, 2017; pp. 3–10. [Google Scholar] [CrossRef]
  50. Mo, X.-G.; Hu, S.; Lin, Z.-H.; Liu, S.-X.; Xia, J. Impacts of climate change on agricultural water resources and adaptation on the North China Plain. Adv. Clim. Chang. Res. 2017, 8, 93–98. [Google Scholar] [CrossRef]
  51. Liu, W.; Yang, H.; Folberth, C.; Wang, X.; Luo, Q.; Schulin, R. Global investigation of impacts of PET methods on simulating crop-water relations for maize. Agric. For. Meteorol. 2016, 221, 164–175. [Google Scholar] [CrossRef]
  52. Xu, H.; Tian, Z.; He, X.; Wang, J.; Sun, L.; Fischer, G.; Fan, D.; Zhong, H.; Wu, W.; Pope, E.; et al. Future increases in irrigation water requirement challenge the water-food nexus in the northeast farming region of China. Agric. Water Manag. 2019, 213, 594–604. [Google Scholar] [CrossRef]
  53. Zhou, T.; Wu, P.; Sun, S.; Li, X.; Wang, Y.; Luan, X. Impact of future climate change on regional crop water requirement—A case study of Hetao Irrigation District, China. Water 2017, 9, 429. [Google Scholar] [CrossRef]
Figure 1. Map of the historical global net irrigation water requirement in 1960 of the area actually irrigated expressed as a percentage of the area equipped for irrigation in mm/yr.
Climate 07 00124 g001
Figure 2. Historical net irrigation water requirement in 1999. The same irrigated area than in 1960 is used the same in Figure 1.
Climate 07 00124 g002
Figure 3. Net irrigation water requirement of CSIRO model in 2050 (RCP4.5). The same irrigated area than in 1960 is used the same in Figure 1.
Climate 07 00124 g003
Figure 4. Net irrigation water requirement of CSIRO model in 2050 (RCP8.5). The same irrigated area than in 1960 is used the same in Figure 1.
Climate 07 00124 g004
Figure 5. Net irrigation water requirement of ECHAM model in 2050 (RCP4.5). The same irrigated area than 1960 is used the same in Figure 1.
Climate 07 00124 g005
Figure 6. Net irrigation water requirement of ECHAM model in 2050 (RCP8.5). The same irrigated area than in 1960 is used the same in Figure 1.
Climate 07 00124 g006
Figure 7. Net irrigation water requirement of GFDL model in 2050 (RCP4.5). The same irrigated area than in 1960 is used the same in Figure 1.
Climate 07 00124 g007
Figure 8. Net irrigation water requirement of GFDL model in 2050 (RCP8.5). The same irrigated area than in 1960 is used the same in Figure 1.
Climate 07 00124 g008
Figure 9. Net irrigation water requirement of MIROC5 model in 2050 (RCP4.5). The same irrigated area than in 1960 is used the same in Figure 1.
Climate 07 00124 g009
Figure 10. Net irrigation water requirement of MIROC5 model in 2050 (RCP8.5). The same irrigated area than in 1960 is used the same in Figure 1.
Climate 07 00124 g010
Figure 11. Net irrigation water requirement of NCAR model in 2050 (RCP4.5). The same irrigated area than in 1960 is used the same in Figure 1.
Climate 07 00124 g011
Figure 12. Net irrigation water requirement of NCAR model in 2050 (RCP8.5). The same irrigated area than in 1960 is used the same in Figure 1.
Climate 07 00124 g012
Figure 13. Work chart. Diagram of our work which briefly shows the process of our work.
Climate 07 00124 g013
Table 1. Historical regional net irrigation water requirement.
YEARRegionSurface (km2)Min (mm/yr)Max (mm/yr)Mean (mm/yr)Change of Irnet (%)Total of Irnet (km3/yr)
1960Latin America and Caribbean673.68710.132520.921992.63 1.34
South Asia327.56583.752374.341835.98 0.60
Sub-Saharan Africa63.391431.732423.922028.61 0.13
Europe and Central Asia395.01159.761716.05873.67 0.34
Middle East and North Africa154.2910182241.111613.53 0.25
East Asia and Pacific709.39383.822370.291404.84 1.00
North America729.38205.722082.771105.92 0.81
1999Latin America and Caribbean673.68727.222570.092025.221.631.36
South Asia327.56626.892390.151861.011.360.61
Sub-Saharan Africa63.391438.552453.892070.112.050.13
Europe and Central Asia395.01173.771741.73915.474.780.36
Middle East and North Africa154.291061.682285.731663.753.110.26
East Asia and Pacific709.39399.292417.711441.972.641.02
North America729.38246.462108.191135.322.660.83
Surface = total irrigation area according to the FAO in 2005, Min = the minimum value of the Irnet in the region, Max = maximum value of the Irnet in the region, Mean = the average of Irnet in the region, Variation of Irnet = comparison of Means compare to 1960, Total of Irnet = global irrigation water requirement used.
Table 2. CSIRO regional net irrigation water.
RCPRegionSurface (km2)Min (mm/yr)Max (mm/yr)Mean (mm/yr)Change of Irnet (%)Total of Irnet (km3/yr)
4.5Latin America and Caribbean673.68759.353120.932199.4810.381.48
South Asia327.56720.482597.772034.2610.800.67
Sub-Saharan Africa63.391515.652610.282161.836.570.14
Europe and Central Asia395.01239.242572.42940.887.690.37
Middle East and North Africa154.291089.542500.361792.1011.070.28
East Asia and Pacific709.39482.162518.661547.8910.181.10
North America729.38211.972220.061278.7115.620.93
8.5Latin America and Caribbean673.68751.643030.972175.679.191.47
South Asia327.56772.232597.771999.008.880.65
Sub-Saharan Africa63.391539.502702.802190.637.990.14
Europe and Central Asia395.01247.371814.57976.6511.790.39
Middle East and North Africa154.291149.252409.281747.958.330.27
East Asia and Pacific709.39512.352529.231528.128.781.08
North America729.38249.812226.861290.6816.710.94
Same than Table 1.
Table 3. ECHAM regional net irrigation water requirement.
RCPRegionSurface (km2)Min (mm/yr)Max (mm/yr)Mean (mm/yr)Change of Irnet (%)Total of Irnet (km3/yr)
4.5Latin America and Caribbean673.68702.982828.202116.196.201.43
South Asia327.56706.122537.351997.278.780.65
Sub-Saharan Africa63.391501.702679.442187.807.850.14
Europe and Central Asia395.01242.691725.621015.3616.220.40
Middle East and North Africa154.291151.412407.621772.939.880.27
East Asia and Pacific709.39470.502519.951522.598.381.08
North America729.38328.152226.511236.7111.830.90
8.5Latin America and Caribbean673.68723.292808.932151.617.981.45
South Asia327.56738.322538.452024.6910.280.66
Sub-Saharan Africa63.391563.682683.622212.089.040.14
Europe and Central Asia395.01262.361796.76988.7713.170.39
Middle East and North Africa154.291181.752451.361825.4513.130.28
East Asia and Pacific709.39457.142534.391577.1512.271.12
North America729.38287.192252.331226.8010.930.89
Same than Table 1.
Table 4. GFDL regional net irrigation water requirement.
RCPRegionSurface (km2)Min (mm/yr)Max (mm/yr)Mean (mm/yr)Change of Irnet (%)Total of Irnet (km3/yr)
4.5Latin America and Caribbean673.68766.572610.372070.563.911.39
South Asia327.56722.692396.121898.113.380.62
Sub-Saharan Africa63.391421.082503.052103.973.710.13
Europe and Central Asia395.01233.901852.88938.027.370.37
Middle East and North Africa154.291152.522385.551724.596.880.27
East Asia and Pacific709.39431.422457.201453.153.441.03
North America729.38375.572118.831114.220.750.81
8.5Latin America and Caribbean673.68740.602728.362121.706.481.43
South Asia327.56478.132455.811975.897.620.65
Sub-Saharan Africa63.391483.762546.202110.884.060.13
Europe and Central Asia395.01251.241819.90972.1211.270.38
Middle East and North Africa154.291073.822430.301709.145.930.26
East Asia and Pacific709.39445.782834.221491.476.171.06
North America729.38402.832224.011172.296.000.86
Same than Table 1.
Table 5. MIROC 5 regional net irrigation water requirement.
RCPRegionSurface (km2)Min (mm/yr)Max (mm/yr)Mean (mm/yr)Change of Irnet (%)Total of Irnet (km3/yr)
4.5Latin America and Caribbean673.68808.482723.542139.777.391.44
South Asia327.56629.892481.522003.809.160.66
Sub-Saharan Africa63.391549.442699.462215.858.700.14
Europe and Central Asia395.01306.891801.471035.5618.530.41
Middle East and North Africa154.291214.592538.071852.3614.810.29
East Asia and Pacific709.39510.652506.921565.3611.431.11
North America729.38309.592207.781337.3020.920.98
8.5Latin America and Caribbean673.68805.322682.332135.467.171.44
South Asia327.56644.632477.882016.459.850.66
Sub-Saharan Africa63.391585.262703.022209.228.370.14
Europe and Central Asia395.01334.811808.631050.9020.290.42
Middle East and North Africa154.291268.992515.181882.2516.650.29
East Asia and Pacific709.39548.552519.201574.4412.071.12
North America729.38300.502211.161375.5724.381.00
Same than Table 1.
Table 6. NCAR regional net irrigation water requirement.
RCPRegionSurface (Km2)Min (mm/yr)Max (mm/yr)Mean (mm/yr)Change of Irnet (%)Total of Irnet (km3/yr)
4.5Latin America and Caribbean673.68170.731677.691201.25-39.720.81
South Asia327.560.001521.431085.52-40.880.36
Sub-Saharan Africa63.39707.831601.781228.65-39.430.08
Europe and Central Asia395.010.001016.78368.18-57.860.15
Middle East and North Africa154.29406.591458.61936.02-41.990.14
East Asia and Pacific709.390.001508.02732.07-47.890.52
North America729.380.001325.51591.91-46.480.43
8.5Latin America and Caribbean673.68716.762691.602122.186.501.43
South Asia327.56380.502523.662002.299.060.66
Sub-Saharan Africa63.391520.562643.692143.385.660.14
Europe and Central Asia395.01168.031783.161076.3823.200.43
Middle East and North Africa154.291090.512350.351746.618.250.27
East Asia and Pacific709.39421.132563.411527.918.761.08
North America729.38381.652247.391865.7468.701.36
Same than Table 1.

