1. Introduction and State of the Art
Global energy consumption has strong implications on human socio-economic and political spheres. Improved data about the global energy consumption reveal systemic patterns and trends that can be useful for solving current energy issues. In this regard, looking at the worldwide scenario, the energy consumption increased by just 1% in 2016, by following a growth of 0.9% in 2015 and 1% in 2014, and the 10-year average is 1.8% per year [
1]. Moreover, in the last decade, with reference to the European Union (EU) there was even a slow but continuous decrease of energy consumption (the 10-year average is −1.1% per year) [
1]. This is due to the EU’s rigorous policy regarding the reduction of energy consumption. The recent weak growth in energy demand implied that the global greenhouse gas (GHG) emissions from energy consumption were almost flat during 2016 for the third consecutive year. They increased by only 0.1% in 2016 and during 2014–2016 the average emission growth was the lowest over any three-year period since 1981–1983 [
1]. This means that, during recent years, many governments are moving in the direction of sustainable development [
2].
In this scenario, buildings bear a large responsibility as they account for about 40% of energy consumption and 36% of CO
2-eq emissions in the EU. For this reason, it is fundamental to act on them to strongly reduce energy consumption and polluting emissions. In fact, by improving the energy efficiency of buildings, it is possible to reduce total EU energy consumption by 5–6% as well as CO
2-eq emissions by about 5% [
3]. Therefore, the mandatory improvement of energy performance of existing buildings, as well as the high energy quality of new constructions have been established by several European guidelines, Directives and regulations, starting from 2002, when the first version of the Energy Performance of Buildings Directive (EPBD), i.e., the Directive 2002/91/EU [
4], was enacted. More recently, the EPBD recast 2010/31/EU [
5] upgraded the previous version, introducing the concept of nearly zero-energy buildings and proposing the new methodology of cost-optimality, detailed in the Delegated Regulation 244/2012 [
6]. Other mandatory prescriptions, mainly emphasizing the exemplary role of the public hand, were provided by the so-called energy-efficiency Directive, namely the 2012/27/EU [
7].
The cited EU guidelines outline that the reduction of building energy consumption is a crucial issue of our generation and is fundamental to promote a sustainable development. In this regard, to optimize building energy performance, firstly it is important to act on building thermal envelope because this enables strong reductions of thermal energy demand (TED), since around 50% of a general-purpose building’s energy needs depend on heat losses through the envelope [
8]. However, a comprehensive intervention on the envelope composition is possible only for new buildings, while existing ones constitute the largest portion of buildings in service. This can be a problem, but it can be easily solved because there are many other solutions to reduce building energy consumption. In fact, while the envelope defines the TED, the primary energy consumption and the GHG emissions depend on the whole system “building + energy plants” and the designers operate on this whole system when investigating the retrofit of an existing building.
Generally, the minimization of energy consumption and related polluting emissions is the main objective of the public perspective, since it allows the fighting of crucial issues of contemporary society such as climate change and energy poverty. However, when the optimization of building energy performance is faced, it is fundamental to consider the cost-effectiveness of the design and the respect of a certain level of thermal comfort, which are the principal aims of the private perspective. For this reason, the optimization of building design is a complex multi-objective problem with a huge domain of design variables and several potential objective functions. In this regard, occupants’ thermal comfort—which is defined as “the order at which occupants have no intention to modify their environment” [
9]—represents a very critical aspect [
10] because it has serious health-related consequences [
9,
11,
12] and, as clear, a significant impact on energy consumption [
13]. Aiming at understanding the extensive influence of occupants and thermal comfort on building energy performance, many studies have been performed in recent years. Unfortunately, there is a deep gap between the theoretical results of the researches and the practical aspects of their application to real-world buildings, mainly because of the financial implications. For this reason, the scientific literature provides many papers reporting attempts to design optimal financially-appealing retrofit strategies ([
8,
14,
15] for instance). Finally, to develop a retrofit design that can be cost-effective and practically feasible—attracting investments from decision-makers—it is important to accurately estimate the energy savings and the financial benefits.
In addition, nowadays environmental problems, such as climate change and thus GHG emissions, have pushed designers to comprehensively assess the environmental impact of building designs according to current law prescriptions. At the same time, customer expectations on the design budget imposes higher pressure on designers to limit the project costs. Aiming at better understanding building environmental impact, different procedures and indicators have been implemented during the last decades, such as the life cycle assessment (LCA). “The LCA includes accumulating of all environmentally relevant streams inventory associated with production processes, transportation, and demolition of a product” [
16]. According to this, a relevant number of studies has been conducted to identify the optimal designs with minimum life cycle cost (LCC) [
17,
18] and life cycle emission (LCE) [
19]. The literature shows many investigations that implemented different strategies to support the professionals in determining the environmental impact of their designs (e.g., [
17,
18]). In the same vein, during the last few years, designs of high-energy performance using optimization techniques have had a significant diffusion. Many studies have been performed to find out which are the best strategies to minimize building energy needs and many other objective functions, such as global costs, environmental impact, occupants’ discomfort. For instance, Asadi et al. [
20] proposed an optimization technique that makes use of a genetic algorithm and artificial neural networks, with the aim of minimizing the retrofit cost, the energy consumption and the thermal discomfort hours. The two latter objectives were the main aims also of Delgarm et al. in [
21], in which an artificial bee colony methodology was used.
More in general, Nguyen et al. [
22] provided an accurate explanation concerning the optimization process in building design. To properly design a new building or to retrofit an existing one, dynamic energy simulation tools should be used by designers. The “parametric simulation method” approach is very common to improve building energy performance. According to this method, the designer must vary the input of each variable with the aim of highlighting the effect of the selected variable on the objective functions. This procedure can be iterated with all the variables. However, the limit is that this method often requires a huge computational time and it gives reliable results only in partial improvements because of the non-linear interactions among the different input variables. A different and more robust approach is the one known as “simulation-based optimization” or “numerical optimization”, which performs sequences of progressively better approximations to a solution that satisfies an “optimality condition”, previously-defined. This permits the attainment of the optimal solution to a problem (or a sub-optimal solution sufficiently close to the optimum [
23]) with lower computational time and effort. The simulation-based optimization of building performance is usually conducted automatically by means of the coupling between a building simulation software and an optimization “engine”, which implements one or several optimization algorithms that need to be properly set [
24]. Generally, a simplification of the building model to be optimized should be done, but it is crucial to not over-simplify, to avoid the risk of inaccurate modeling of building phenomena. In addition, the convergence of the adopted optimization algorithm should be monitored. Convergence behaviors of different optimization algorithms are an extremely active research area [
25,
26]. Regarding errors, it is fundamental to say that they may occur because of infeasible combinations of variables (e.g., windows areas that extend the boundary of a surface), output reading errors (as in the coupling between MATLAB
® [
27] and EnergyPlus [
28]), and so on. Furthermore, the entire optimization process may crash by a single simulation failure. To minimize such errors, some authors run parametric simulations to make sure that there are no failed simulation runs before running the optimization [
22], or they make use of evolutionary algorithms because even the presence of a failed solution among the population does not interrupt the optimization process. Finally, it is important to verify if the found solutions are reliable and robust. There are no standard rules for this task, but the literature provides many strategies (for instance, the sensitivity-analysis [
25,
29], the brute-force search method [
30], the comparison with different models [
31]).
Since the building sector accounts for a large amount of global energy consumption and GHG emissions, the optimization of building energy design, in terms of minimization of energy demands and global costs, is strictly related to climatic conditions at large scale and can significantly support the mitigation of climate change and urban overheating. The proposed study aims to address this strong correlation between energy performance and climate to highlight that the optimization of building energy design is fundamental for solving the climatic issues of contemporary society.
Research Aim and Originality
Among the numerous optimization methodologies described in literature, the methodology proposed in this paper is structured in two consequent and interdependent stages, as in [
32]. More precisely, during the first stage, there is the implementation of the GA and, by means of the continuous coupling between MATLAB
® [
27] and EnergyPlus [
28], the thermal energy demands (TED) for heating and cooling, respectively, and the discomfort hours (DH) are minimized. Conversely, the second stage is entirely conducted under MATLAB
® environment and enables the discovery of constrained cost-optimal solutions that ensure a drastic reduction of global cost (GC) as well as of CO
2-eq (i.e., GHG) emissions. Then, the effect of such solutions on building heat emissions into the external environment is assessed to evaluate the contribution to the mitigation of urban overheating, which highly affects the external human comfort and the livability of our cities. This is a crucial aspect, due to the constantly increasing urbanization, in fact more than half the global population (i.e., the 54%) lives in urban areas nowadays [
33,
34] and it is forecasted to be rising during the next few years [
35,
36], with obvious implications on environmental degradation, being the cities and their inhabitants the principal players in heat wasting and CO
2 emitting [
35,
37].
The main novelty of the proposed methodology consists of the possibility to satisfy both the perspectives, the public one (by reducing the GHG emissions) and the private one (by minimizing GC and reducing DH), thereby allowing to fight climate change and ensuring the design cost-effectiveness at the same time. The focus on the reduction of heat emissions is a further novel aspect for investigations concerning building energy efficiency. In this regard, since the second stage is conducted entirely in MATLAB
® it is not time-consuming, thus many objective functions can be investigated and optimized without computational efforts. It should be noticed that similar optimization methodologies—based on the coupling of EnergyPlus and MATLAB
® to implement a genetic algorithm—have been already proposed by the authors, such as in [
32,
38,
39]. However, the frameworks and final purposes of these previous studies were different, such as to find cost-optimal retrofit solutions for single complex hospital [
32] or educational buildings [
38] or for a whole building category by using artificial neural networks [
39]. The aforementioned studies applied a financial approach (detailed in the EU Commission Delegate Regulation [
6]) in global cost assessment without considering the cost of GHG emissions and building heat emissions into the external environment. Therefore, they did not comprehensively address the issues of climate change and urban overheating related to building energy performance. Finally, the originality of this study is combining the optimization of building energy design in terms of global cost minimization to the reduction of building environment impact in terms of contribution to climate change and urban overheating. The global cost is assessed through a macro-economic approach by considering also the cost of CO
2eq emissions, and thus the achieved cost-optimal solution implies a drastic reduction of GHG emissions. Indeed, the results will show the solution that minimizes the global cost is very close to the one that minimizes CO
2-eq emissions, ensuring a very satisfying trade-off between the private and the public perspectives. Therefore, the application of the methodology at large scale can produce a significant reduction of building environmental impact since the detected solutions imply a drastic reduction of GHG emissions, thereby giving a strong support to the mitigation of climate change and urban overheating.
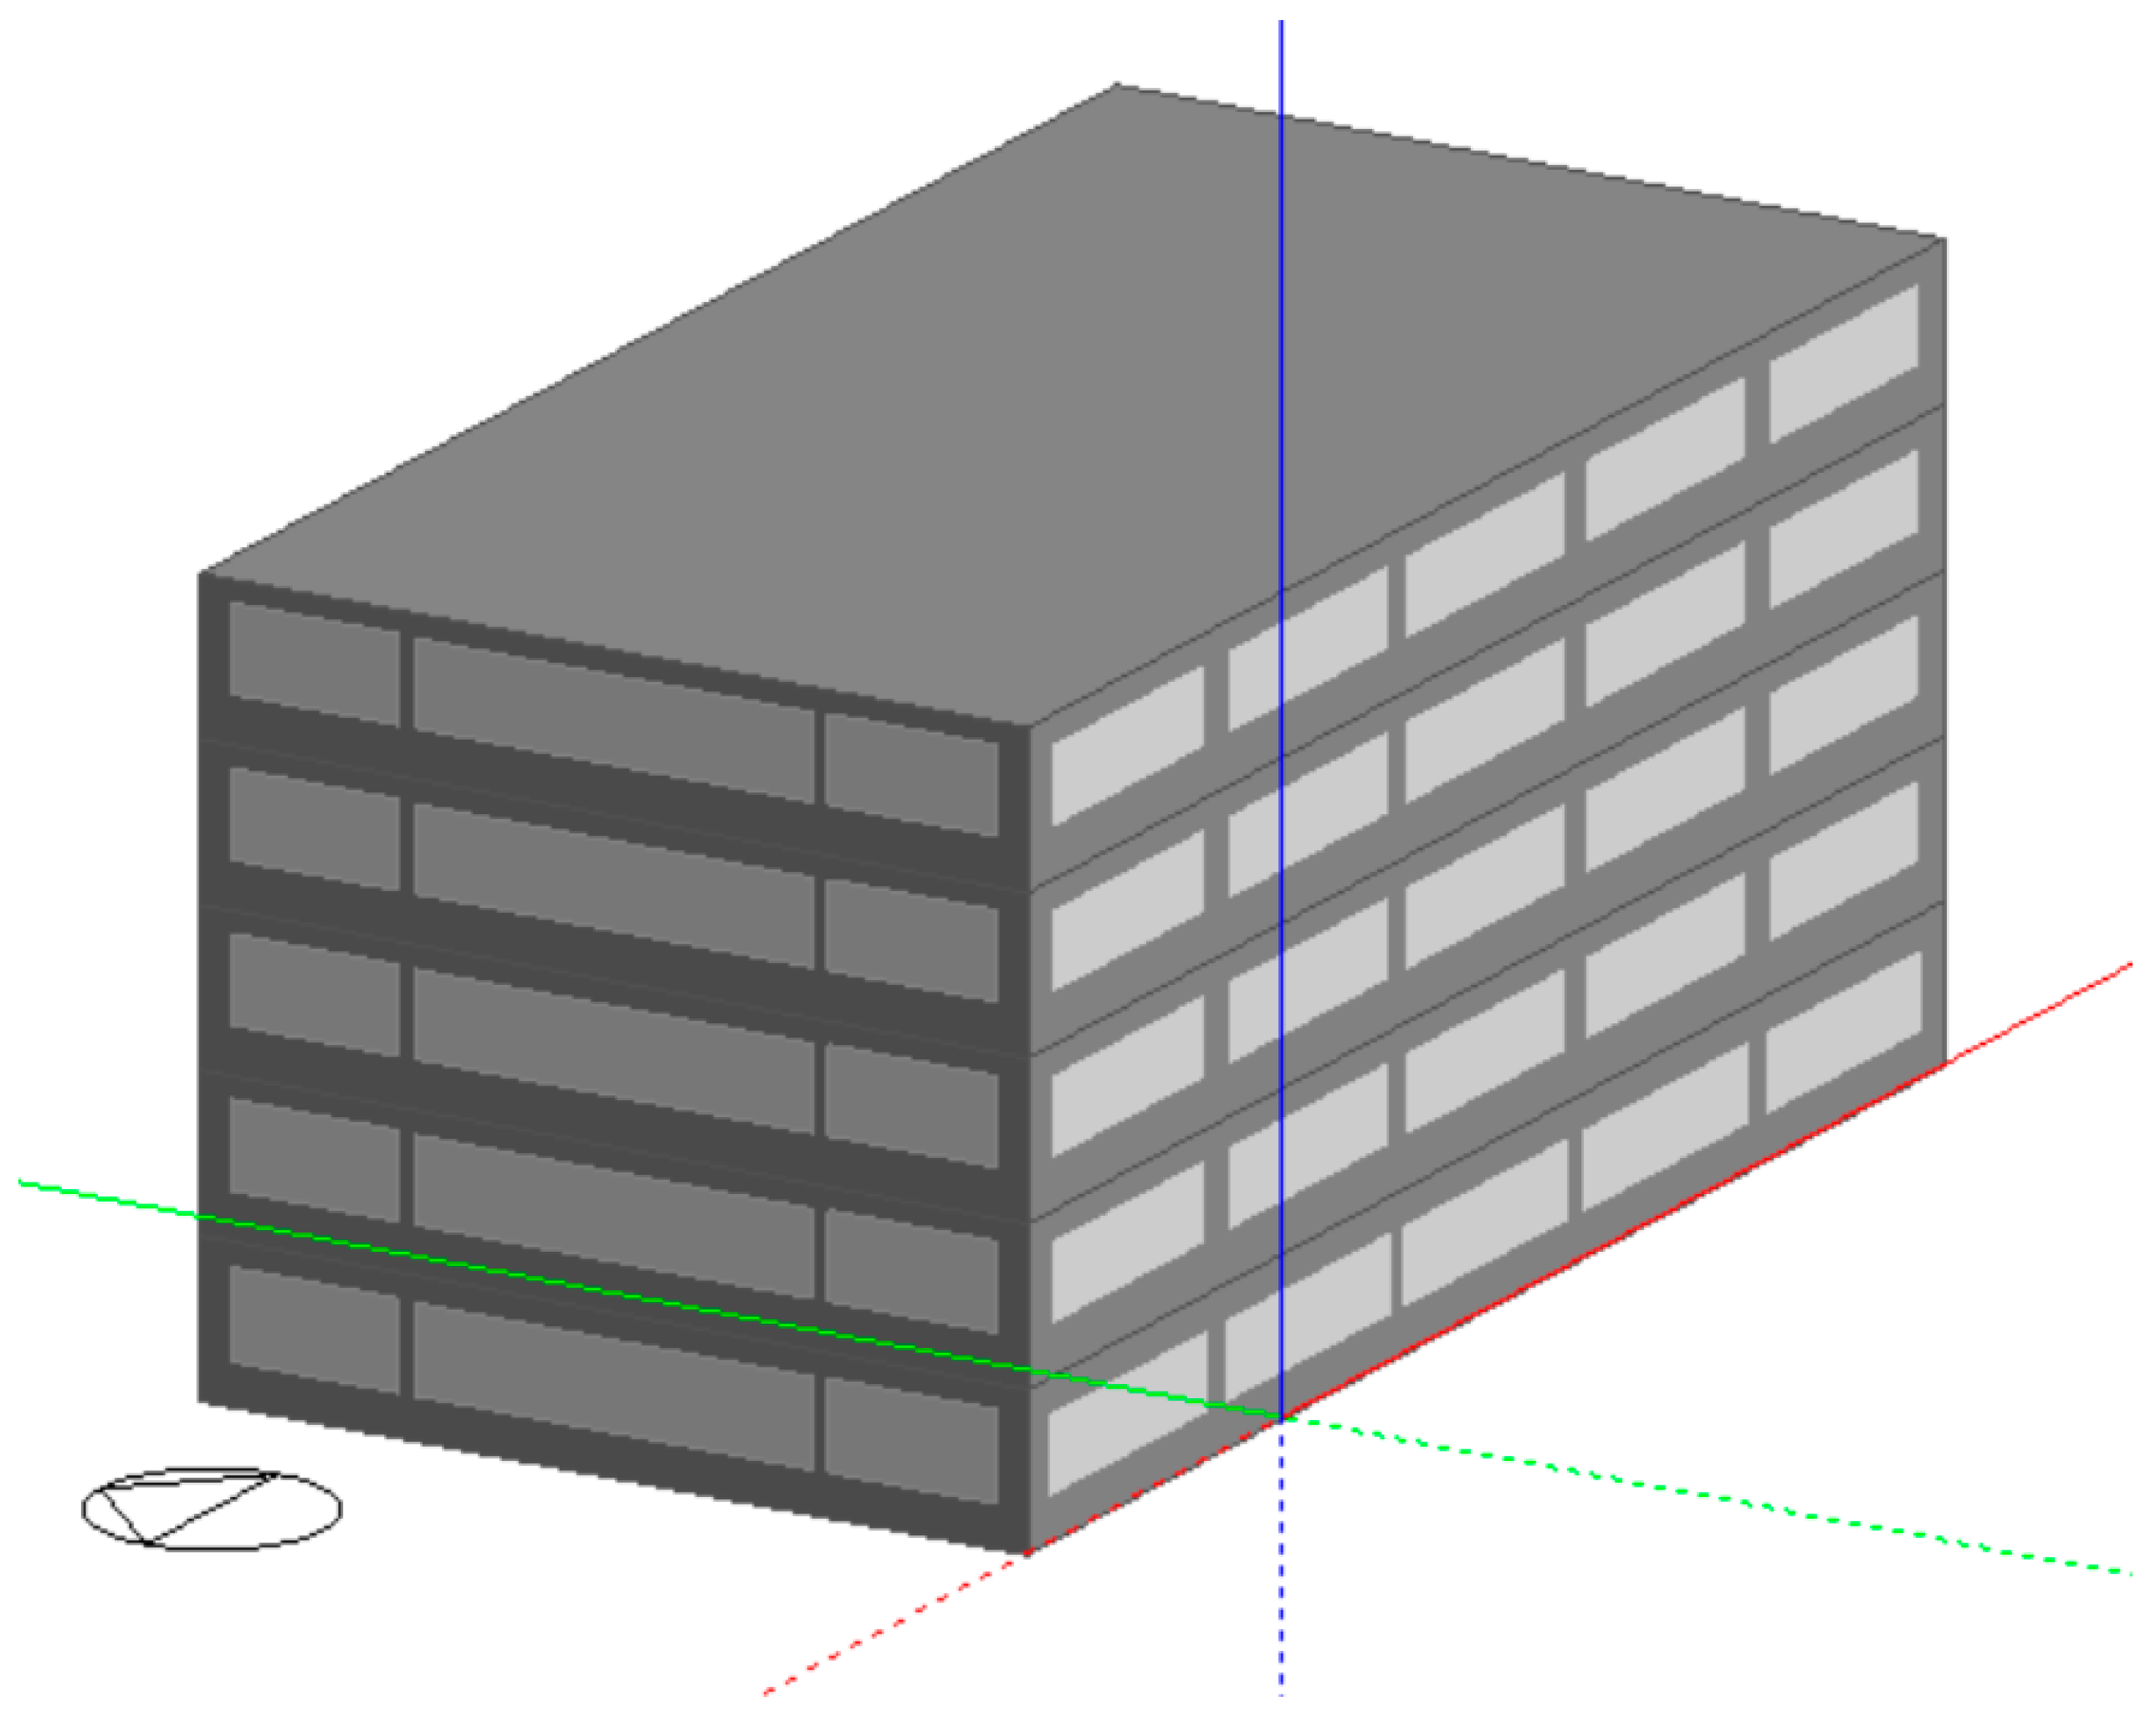
As a case study, the methodology is applied to a typical existing office building, representative of the Italian building stock since the 1970s.
2. Methodology
2.1. Framework
The proper choice of the energy efficiency measures to adopt for a new building or an existing one is a highly complicated issue, which affects two different perspectives:
the private one, whose aim is to achieve financial benefits or minor indoor discomfort;
the public one, whose aim is to reduce energy consumption, polluting emissions and to have an exemplary role for all citizens.
Regarding these differences, the methodology proposed in this paper ensures the best trade-off between these two perspectives, because it allows the addressing of more objectives at the same time, ensuring a good level of satisfaction for both the private and the public perspectives. Finding the cost-optimal solution usually requires high computational efforts, because of the huge amount of energy efficiency measures’ combinations that must be simulated by means of building performance simulation (BPS) tools, which run time-costly dynamic simulations. For this computational issue, the cost-optimal analysis could not be applied to every building. Conversely, it should be limited to reference buildings (RBs) only, as established in the EPBD-recast. However, even when only RBs are examined, the robust assessment of cost-optimality is very time costly. For this reason, it is crucial to adopt proper building performance optimization (BPO) algorithms that can reduce the required computational efforts, by reducing, at the same time, the domain of the explored scenarios without affecting the detection of robust cost-optimal solutions. In this paper, a multi-objective and multi-stage optimization procedure is implemented to find a constrained cost-optimal solution that fulfils these three conditions:
it ensures the Pareto optimization of TED (thermal energy demand) for heating, TED for cooling, discomfort hours (DH) if the retrofit involves the building envelope (in fact, it can be effective to act merely on the energy systems);
it implies a drastic reduction of GHG emissions since a macroeconomic approach is applied for global cost (GC) assessment thereby considering the cost of such emissions [
6];
minimizes GC by respecting the first two conditions, which is why it is defined “constrained”.
Once fixed the main boundary conditions, concerning geometry, occupancy profiles and climatic conditions, several energy efficiency measures are combined and examined. The considered energy efficiency measures concern all levers of energy efficiency in buildings, i.e.,
the building envelope (e.g., new kind of low-emissive or selective glazing, addition of thermal insulation, particular plasters);
the primary energy systems, considering also renewable energy sources (e.g., efficient air-source heat pumps, photovoltaic generators).
Specifically, EnergyPlus is used for dynamic energy simulations, because it ensures high accuracy and reliability, while MATLAB
® is used to run the optimization algorithm and to perform the data-processing, because of its large opportunities of programming. Furthermore, MATLAB
® is used to launch EnergyPlus simulations. Thus, the coupling of these two software allows the automatic running of a huge set of dynamic energy simulations that are managed by the optimization algorithm, developed directly in MATLAB
® environment. More precisely, the methodology performs a multi-stage and multi-objective optimization by implementing a genetic algorithm (GA)—1st stage—and running a smart exhaustive sampling—2nd stage. The GA, born as a modification of NSGA-II, operates by iteratively improving the models of the building with the aim of identifying the non-dominated solutions (i.e., the Pareto front) for what concerns the building envelope design or retrofit, by minimizing TED for heating, TED for cooling and DH. Then, the smart exhaustive sampling stage allows the investigation of the Pareto front solutions obtained during the 1st stage and the baseline situation, aiming at reducing GC and GHG emissions thereby conducting a constrained cost-optimal analysis. Thus, decision making is performed by providing a recommended trade-off design/retrofit solution. A similar technique was used in [
32,
38], but this study addresses different objective functions to provide solutions that allow the fighting of climate change and ensure cost-effectiveness at the same time. This represents the main worthy and original contribution of the proposed approach that enables the conciliation of the private and public perspectives.
Since the 2nd stage is conducted entirely in MATLAB®, the required computational efforts are strongly reduced. The following subsections provide a description of the two methodology stages.
2.2. 1st Methodology Stage: Optimization Algorithm
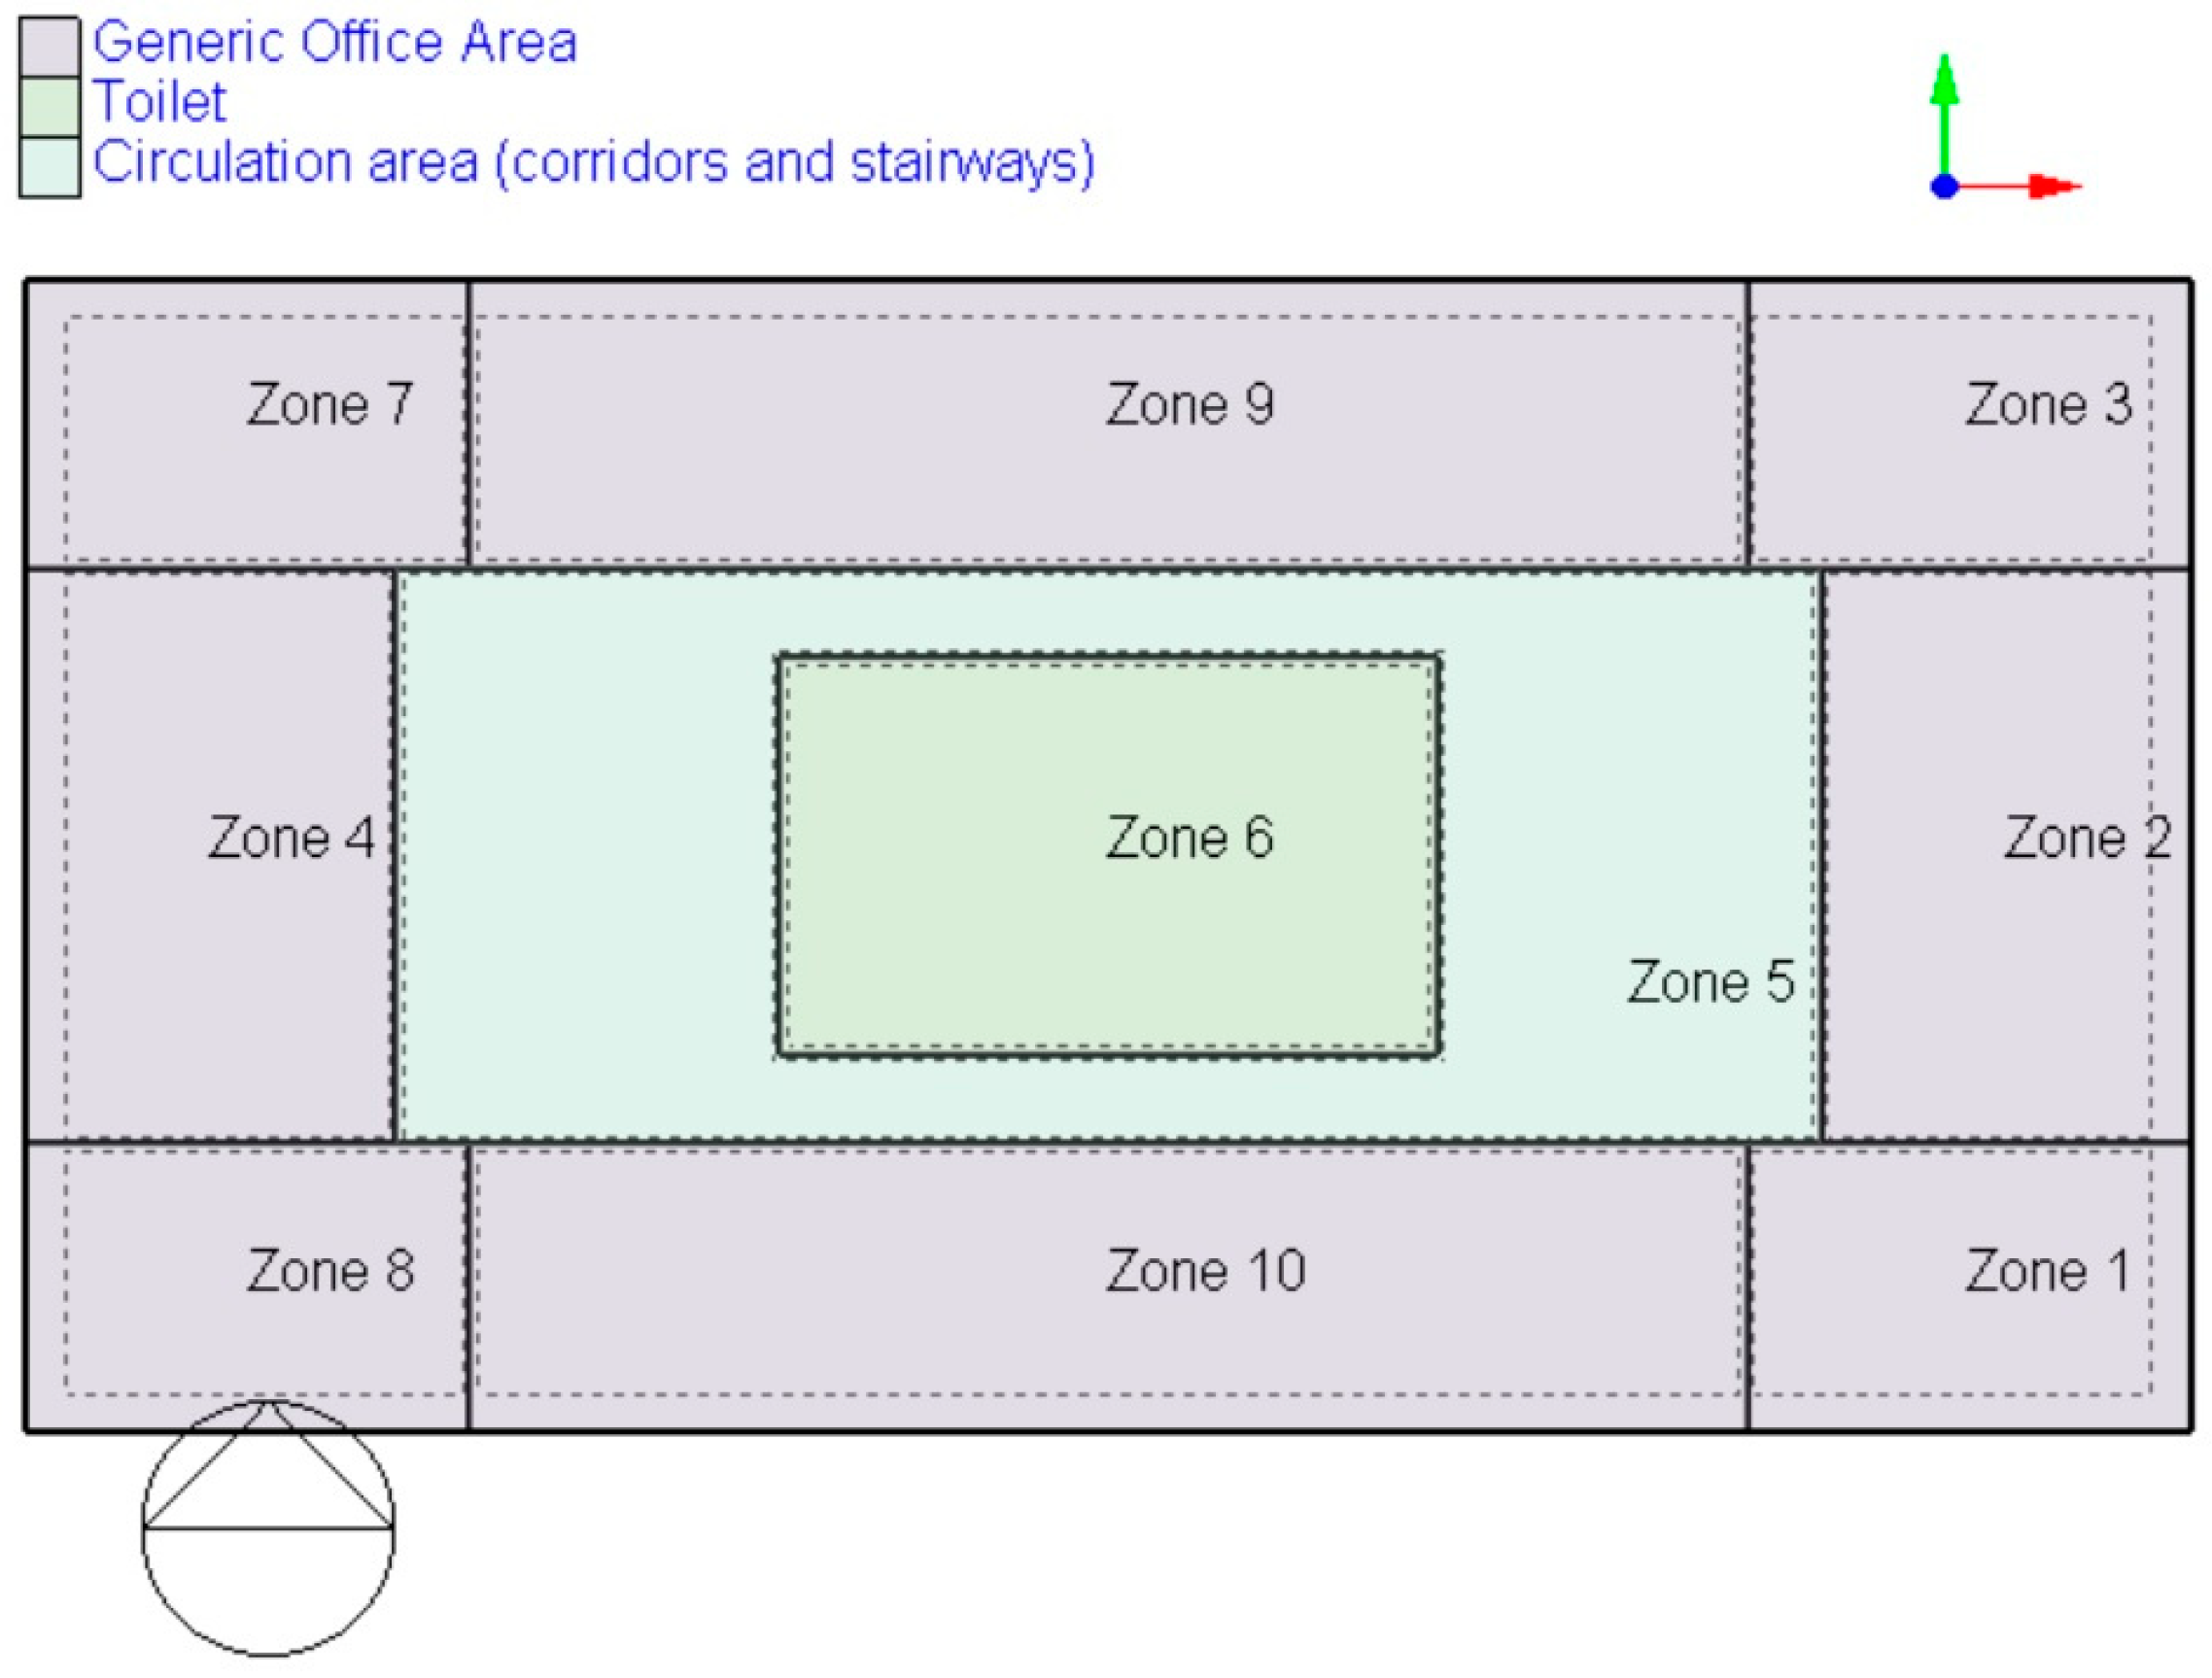
In this stage, the baseline energy performance of the building (“as built”) is assessed, in terms of TED for space cooling, TED for space heating and DH, respectively. The building is modeled in EnergyPlus by using the graphical interface DesignBuilder [
40], that allows a careful definition of geometry and subdivision into thermal zones. It is quite important, for the EnergyPlus model, to set:
the thermo-physical characteristics of the building envelope;
the profiles of building use for each thermal zone, in terms of hourly schedules of occupancy, people activity, ventilation need, and so on;
the operation of HVAC (heating, ventilating and air conditioning) systems by setting the values of set-point temperatures;
the type of HVAC systems in terms of characteristics of the heating and cooling terminals as well as of the distribution network.
It should be noted that the heating/cooling primary systems are not modeled in this phase, because, during this stage, the aim is to calculate the thermal energy demand (i.e., the “net requirement”) and not the primary energy consumption, which is assessed later by means of MATLAB
®. After modeling the baseline building (BB), an EnergyPlus simulation is run by using a proper weather data file, usually available at the EnergyPlus online database. The annual values of TED for space heating (TED
heat), for space cooling (TED
cool) per unit of conditioned area, and DH are the simulation outputs. DH provides the annual percentage of discomfort hours. As done in [
39], an occupied hour is considered a discomfort one if the average predicted mean vote (PMV) in the building thermal zones is out of the range −0.85 ÷ 0.85, implying a value of predicted percentage of dissatisfied (PPD) higher than 20%.
After the investigation of the energy behavior of the BB, a set of “n” energy efficiency measures for the reduction of TED
heat, TED
cool and DH is identified, based on the current energy performance, building peculiarities and best practices. A design variable is associated to each energy efficiency measure and it can be, potentially, discrete or continuous, even if in the case study presented in this paper all variables are considered as “discrete”. Finally, “n” variables are introduced, and a range of variability is assigned to each of them, by defining the sample space that should be explored with the aim of examining the energy efficiency measures’ combinations. At this point, the GA carries out a smart research within the entire solution domain by investigating only a limited number of solutions, properly selected by the optimization logic. As aforementioned, a large amount of computational time is saved if the method is compared to exhaustive researches. Since three objective functions are chosen—i.e., TED
heat, TED
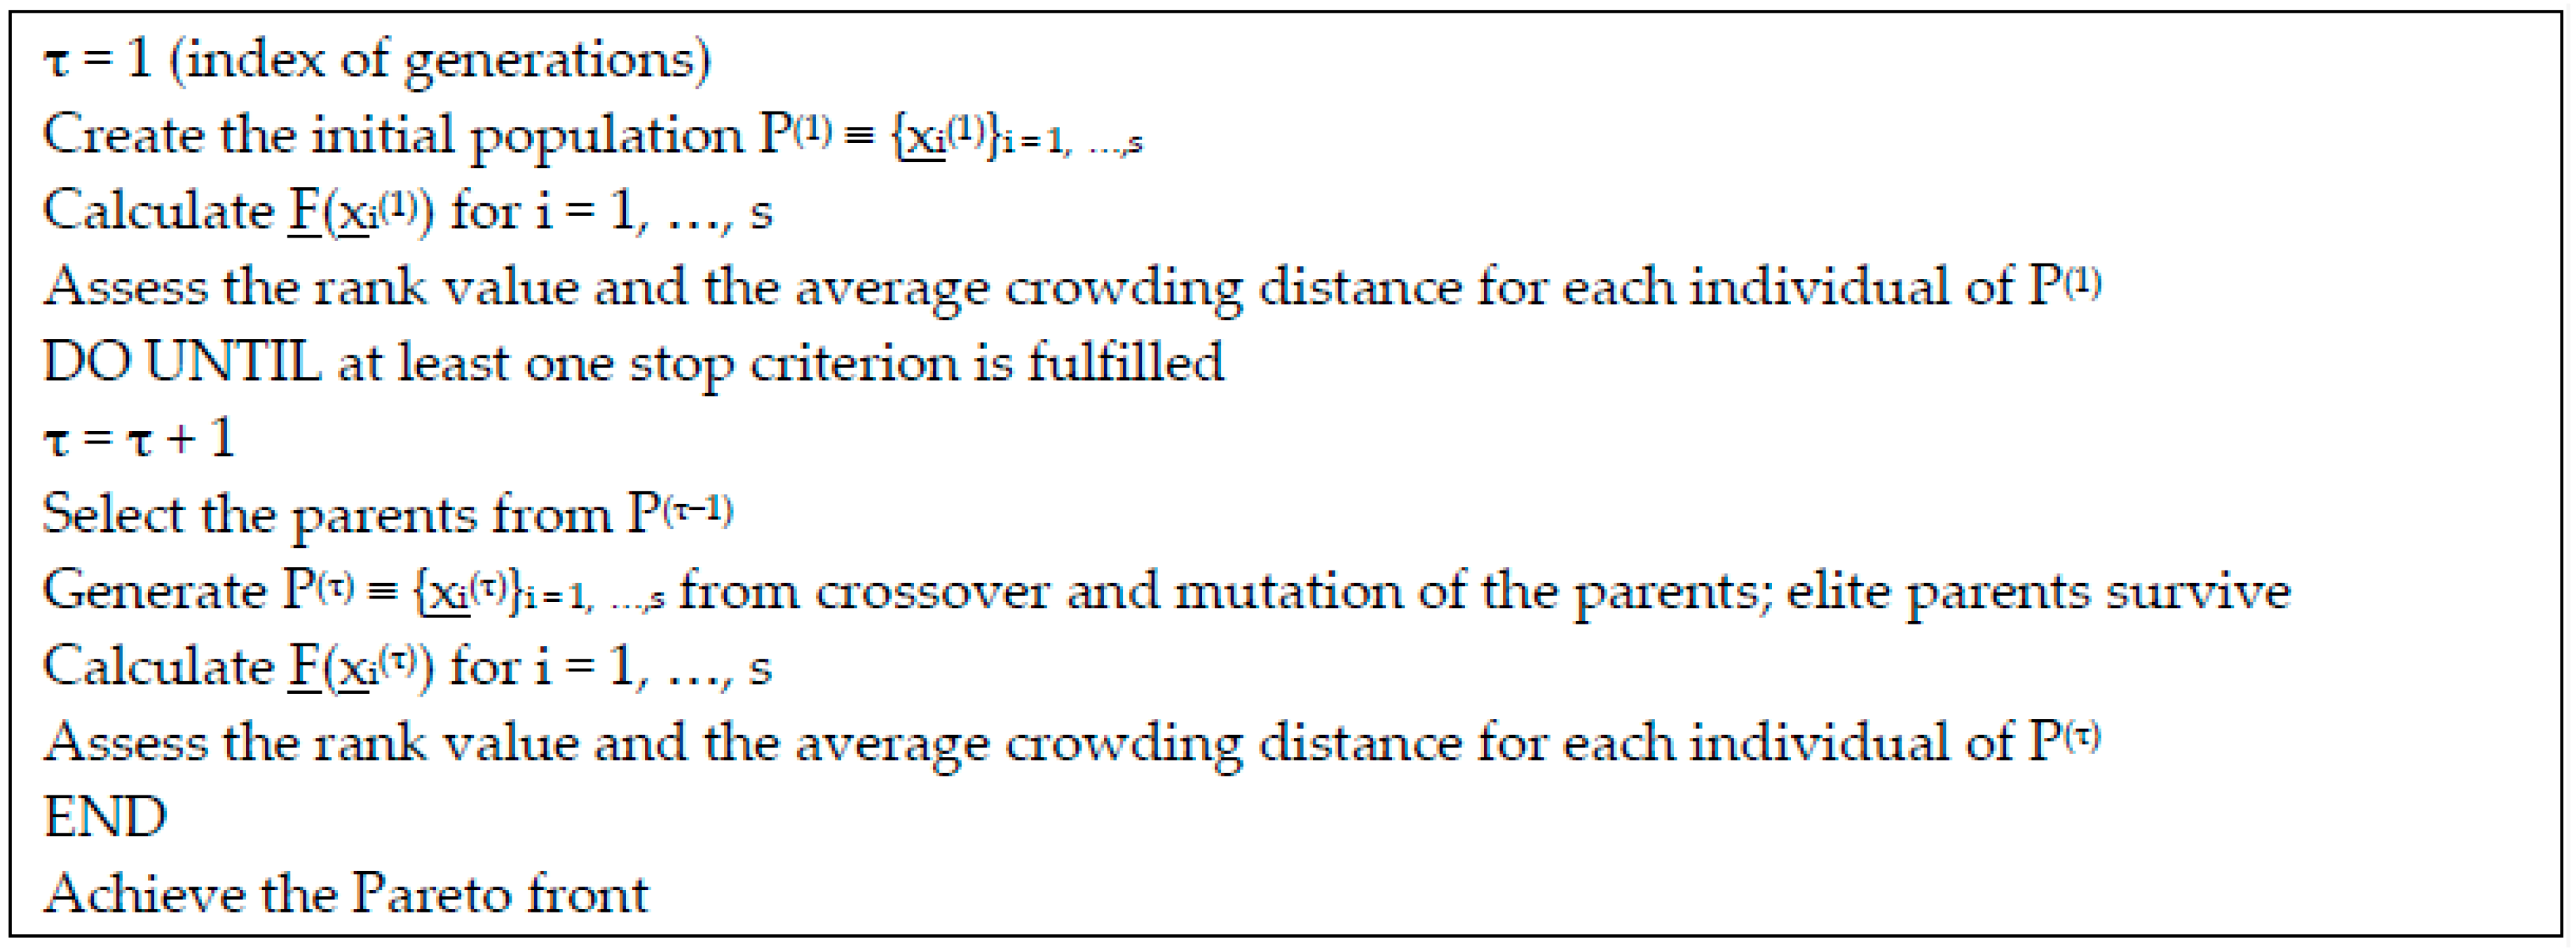
cool and DH—the algorithm provides one three-dimensional (3-D) and three bi-dimensional (2D) Pareto fronts (one for each couple of objectives), by collecting the non-dominated solutions, which represent optimal packages of the investigated energy efficiency measures. Obviously, the goal is the minimization of all targets at the same time, but this is impossible because usually the objective functions are conflicting. Thus, the GA provides trade-off solutions collected in the aforementioned Pareto fronts (for this reason we call them “non-dominated”). The used GA has been already implemented by Ascione et al. [
39] in MATLAB
® environment according to the scheme reported in
Figure 1, where the vector
F collects the objective functions (
F = [TED
heat, TED
cool, DH]) while the vector
x is composed of bits that encode the design variables representing energy efficiency measures.
Each design variable can assume a limited number of values, because this allows the reduction of the solution domain and it is much closer to reality and availability of the market. The possible values must be carefully chosen according to best practices and experiences. The GA performs, iteratively, an evolution of a population of “s” (population size) individuals, denoted as “chromosomes”, each one characterized by a set of values of the vector x, whose components are called “genes” and correspond to a combination of building energy efficiency measures. The process is performed through numerous iterations, the so-called “generations”. It is required to improve the characteristics of the population by the selection of the best chromosomes as well as through the operations of mutation and crossover of their genes (e.g., the bits encoding the thicknesses of thermal insulation layer) in order to have new individuals that improve the energy and thermal performance of the building. The individuals that derive from crossover, called “children”, are randomly generated by combining the design variables (i.e., bit strings) of two parents. The population fraction that originates from crossover is indicated by the crossover fraction “fc”. All other remaining individuals (“mutated children”) are originated by the mutation of random parents, specifically by changing each bit with a mutation probability equal to “fm”. The best chromosomes are called “parents” and are chosen based on a rank assigned from the values of objective functions and from the average crowding distance among individuals. The best parents constitute the “elite” that survives to the generation. After the random creation of the initial population, the described “Darwinian evolution” occurs during each generation and ends when one of the following termination criteria is satisfied:
a threshold number of generations () is reached;
the Pareto front does not change significantly between two following generations. This means that the variation of the front spread is lower than a tolerance “”.
In the case study here investigated, the used termination criterion is the first one and most GA parameters take the same values employed in [
32,
38], namely (n is the number of design variables):
ce = 2;
fc = 0.6:
fm = 0.1;
s = 4∙n;
gmax = 20.
For what concerns the values of
s and
, it is important to notice that these must be properly set depending on the complexity of the case study, because they crucially affect the reliability of the results and the required computational efforts. Ascione et al. [
32] assessed that reliable “s” values are 2–6 times the number of design variables (in this study, it is set equal to 4), while reliable
values are included in the range 10–100 generations. In this paper, this is set equal to 20.
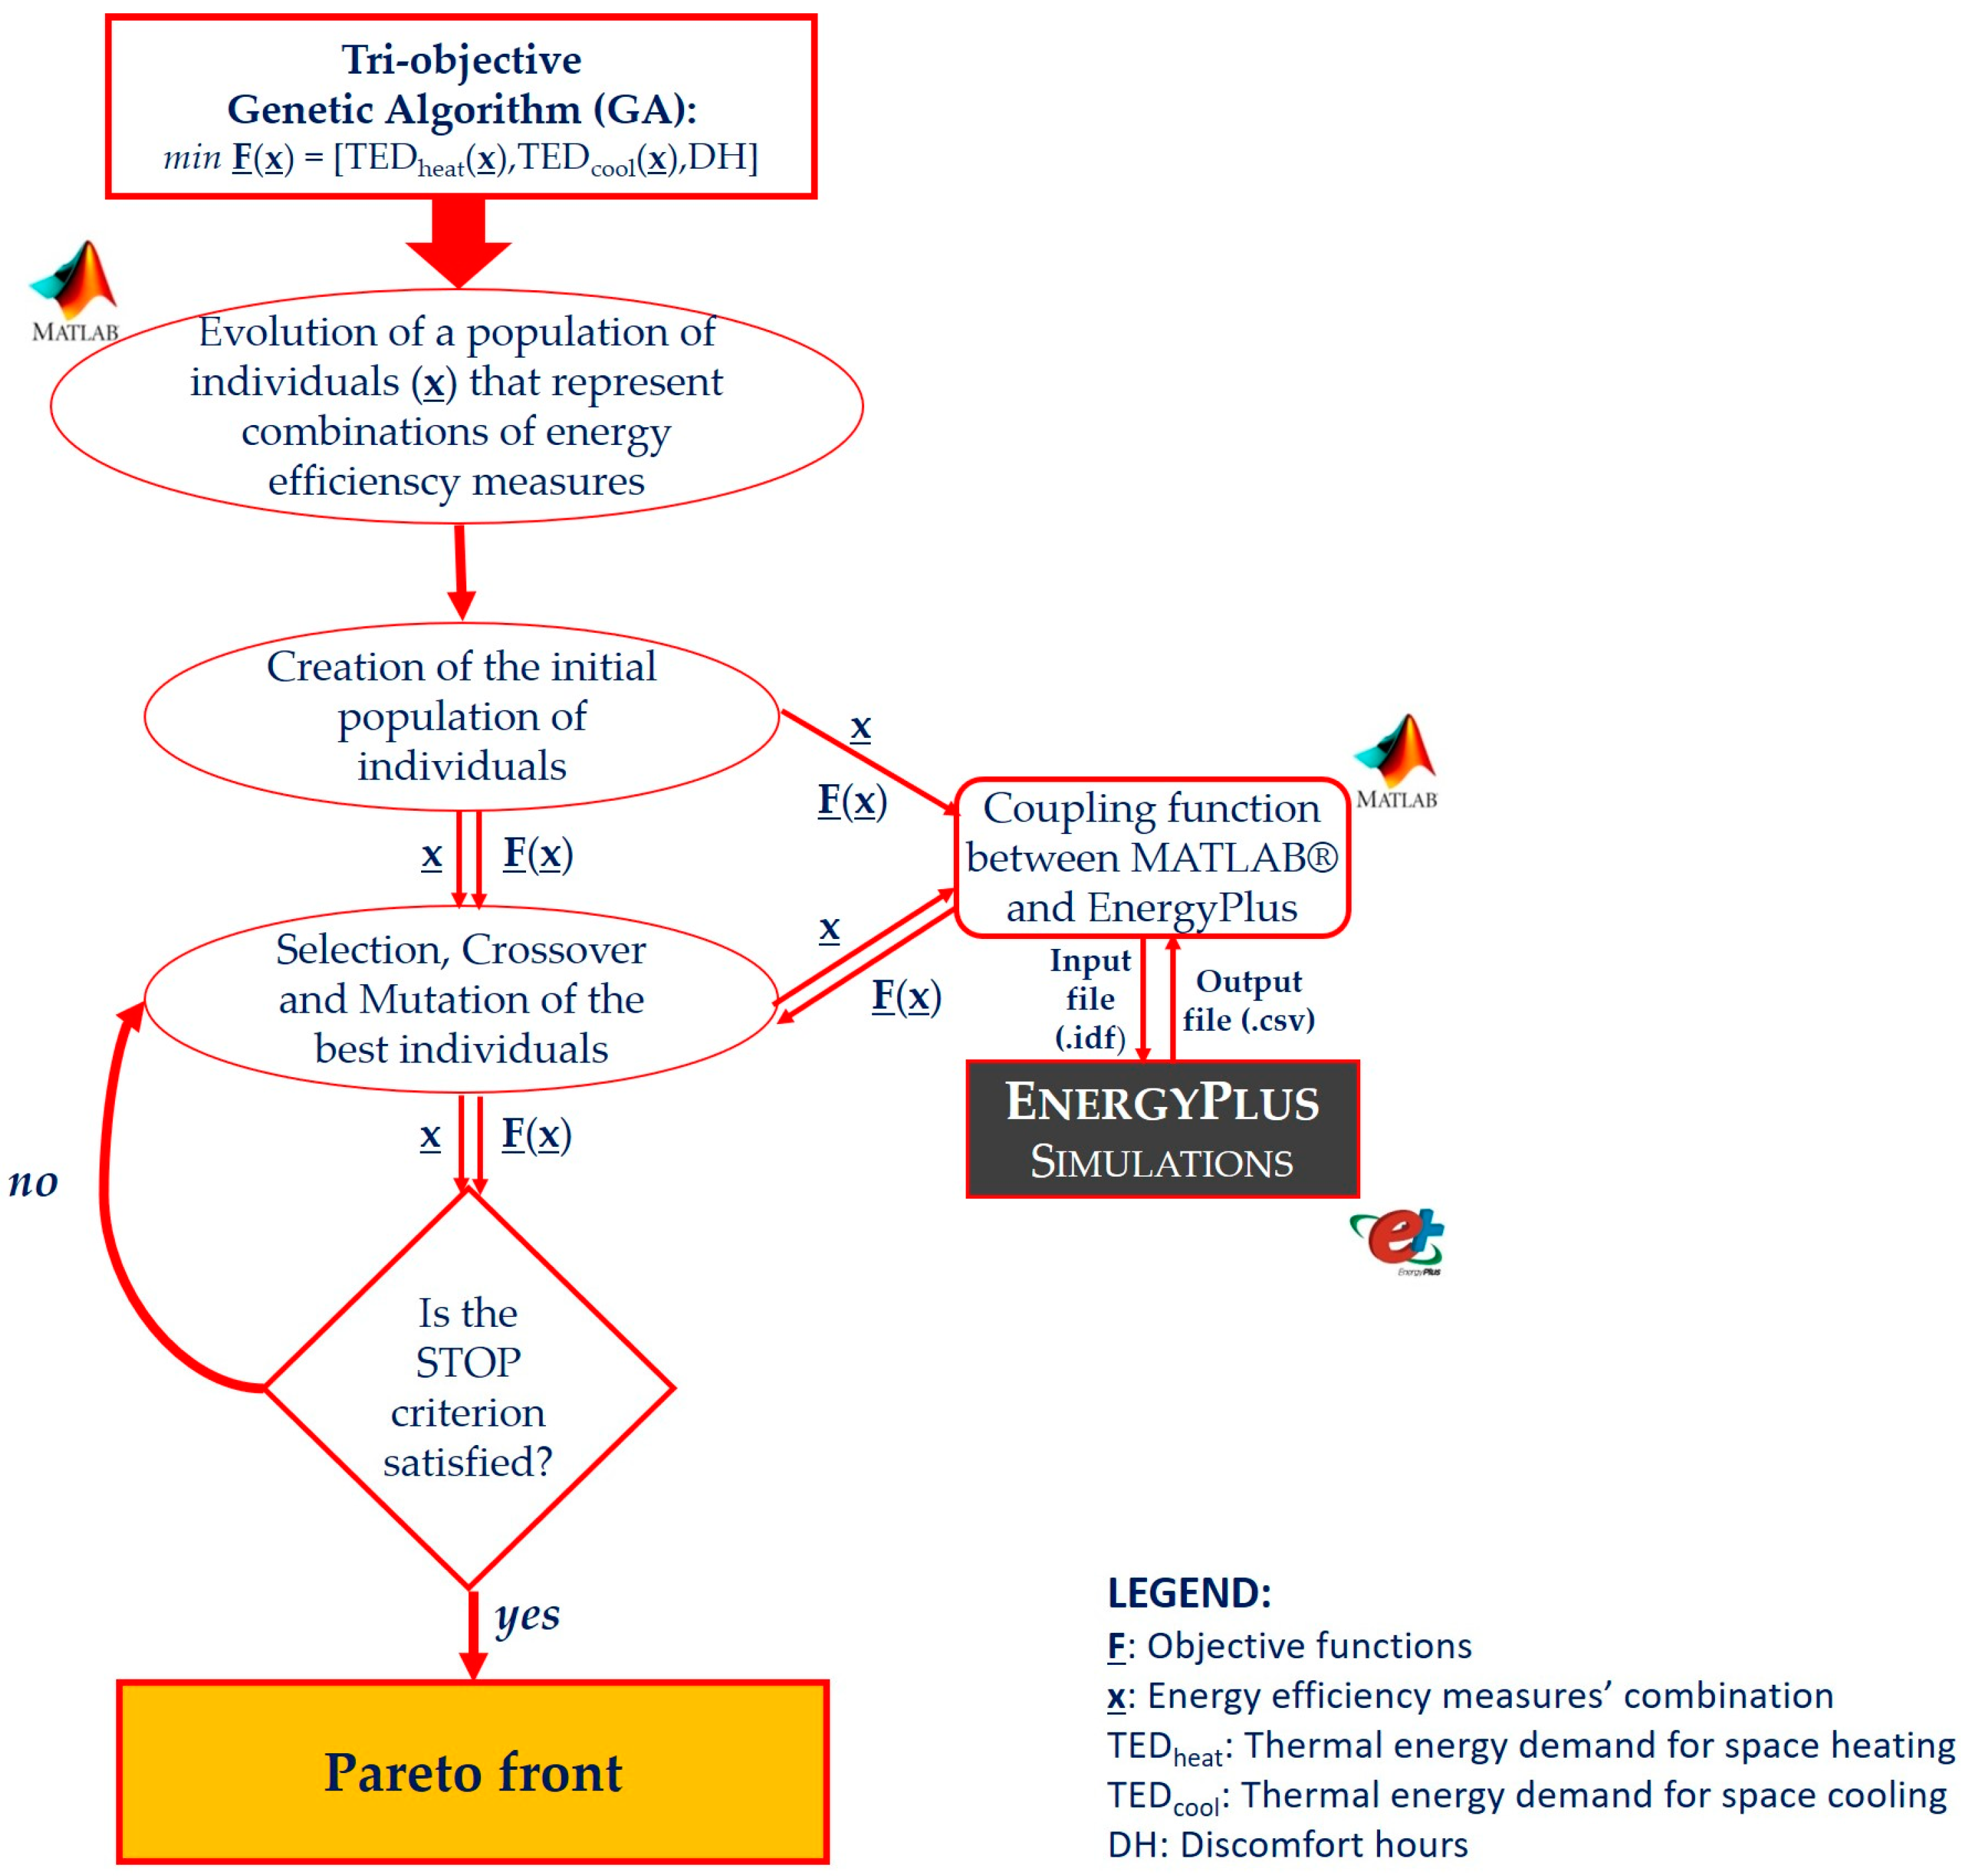
Specifically, for each energy efficiency measures’ combination, which is encoded by certain values of the vector
x, MATLAB
® launches EnergyPlus to run a dynamic energy simulation. Then, the results of this simulation are post-processed for obtaining the values of the objective functions (i.e., TED
heat, TED
cool, DH) with reference to each examined combination. The coupling scheme between the two software is shown in
Figure 2The “coupling function” between EnergyPlus and MATLAB®” converts x into a new building model to be simulated (the “.idf” file) and consequently handles the output file of EnergyPlus (the “.csv” file) to calculate the values of the objectives contained in F. It is noticed that the energy efficiency measures are implemented and parametrized directly within the “.idf” EnergyPlus file. Moreover, also a constrain is defined, since all solutions that cause an increase of DH compared to the base building configuration are excluded. This constraint is set to ensure that the optimized energy retrofit does not cause a worsening of occupants’ thermal comfort. Indeed, energy efficiency should not prejudice people well-being. Hence, the GA implementation must be followed by the decision-making process, which aims at selecting one recommended solution from the Pareto front. This process is performed during the second stage.
2.3. 2nd Methodology Stage: Decision-Making
In this phase, the decision-making process is performed, aiming at selecting one combination of energy efficiency measures among all non-dominated configurations. It is a crucial task and it can be carried out according to different criteria. Obviously, none of the solutions of the Pareto front can be chosen “a priori”, because it cannot be defined better than another. For this reason, a selection criterion is essential. For what concerns the methodology described in this paper, the chosen criterion is the so-called “cost-optimality”, which means that, at the end of the entire optimization process, the chosen solution (i.e., package of energy efficiency measures) is the one that minimizes the global cost (GC) over building predicted lifecycle, assessed according to a macro-economic approach [
6]. The cost-optimal analysis is applied by means of a smart exhaustive sampling. This latter permits the investigation of further energy efficiency measures—addressed to primary energy systems—besides those examined in the 1st stage, which are addressed to the envelope and to the operation parameters of the HVAC systems. It is important to notice that GC considers the initial investment cost, the GHG emissions costs and the running costs, those latter evaluated for a certain number of years (depending on the category of the building) and actualized at the starting time. Such cost-optimal analysis is conducted according to EU guidelines, reported in the Energy Performance of Buildings Directive (EPBD) recast 2010/31/EU [
5] and detailed in the Delegated Regulation 244/2012 [
6]. In particular, in the global cost assessment, the macro-economic approach is used to consider the cost of CO
2-eq emissions. This allows the comprehensive consideration and minimization of the impact of building energy performance on climate change, which is one to of the main goals of the proposed study. Indeed, the achieved cost-optimal solution will imply a drastic reduction of GHG emissions, as shown in the
Section 4, thereby ensuring a very satisfying trade-off between the private and the public perspectives.
Specifically, during this stage, a smart exhaustive sampling is carried out by investigating the energy performance of different solutions of primary energy systems, in presence of the non-dominated energy efficiency measures’ combinations selected in the first stage, and in absence of energy efficiency measures (baseline configuration). For each combination, the GC and the GHG emissions are evaluated, and, finally, the cost-optimal solution is found. A sensitivity analysis is then performed in correspondence of different values of the discount rate, to investigate the robustness of the found cost-optimal solution. This stage is entirely implemented in MATLAB
® environment, without launching further EnergyPlus simulations. For this reason, it needs a negligible computational time compared to the first stage (i.e., the order of magnitude is few seconds). The exhaustive sampling is “smart” [
32] because:
it is performed in MATLAB® environment, without needing further EnergyPlus simulations;
it explores, besides the baseline building (BB), only the packages of energy efficiency measures that are properly selected through the GA implementation.
More precisely, the chosen energy efficiency package represents a “constrained” cost-optimal solution, since only suitable packages are selected for the cost-optimal analysis based on the results of the 1st methodology stage. Furthermore, the impact of such optimal retrofit solution on the annual heat emissions of building HVAC systems into the external environment is assessed. This analysis aims at investigating the contribution to the mitigation of urban overheating, which significantly affects the external thermal comfort of people, and thus the livability of our cities, as well as building energy needs.
4. Results and Discussion
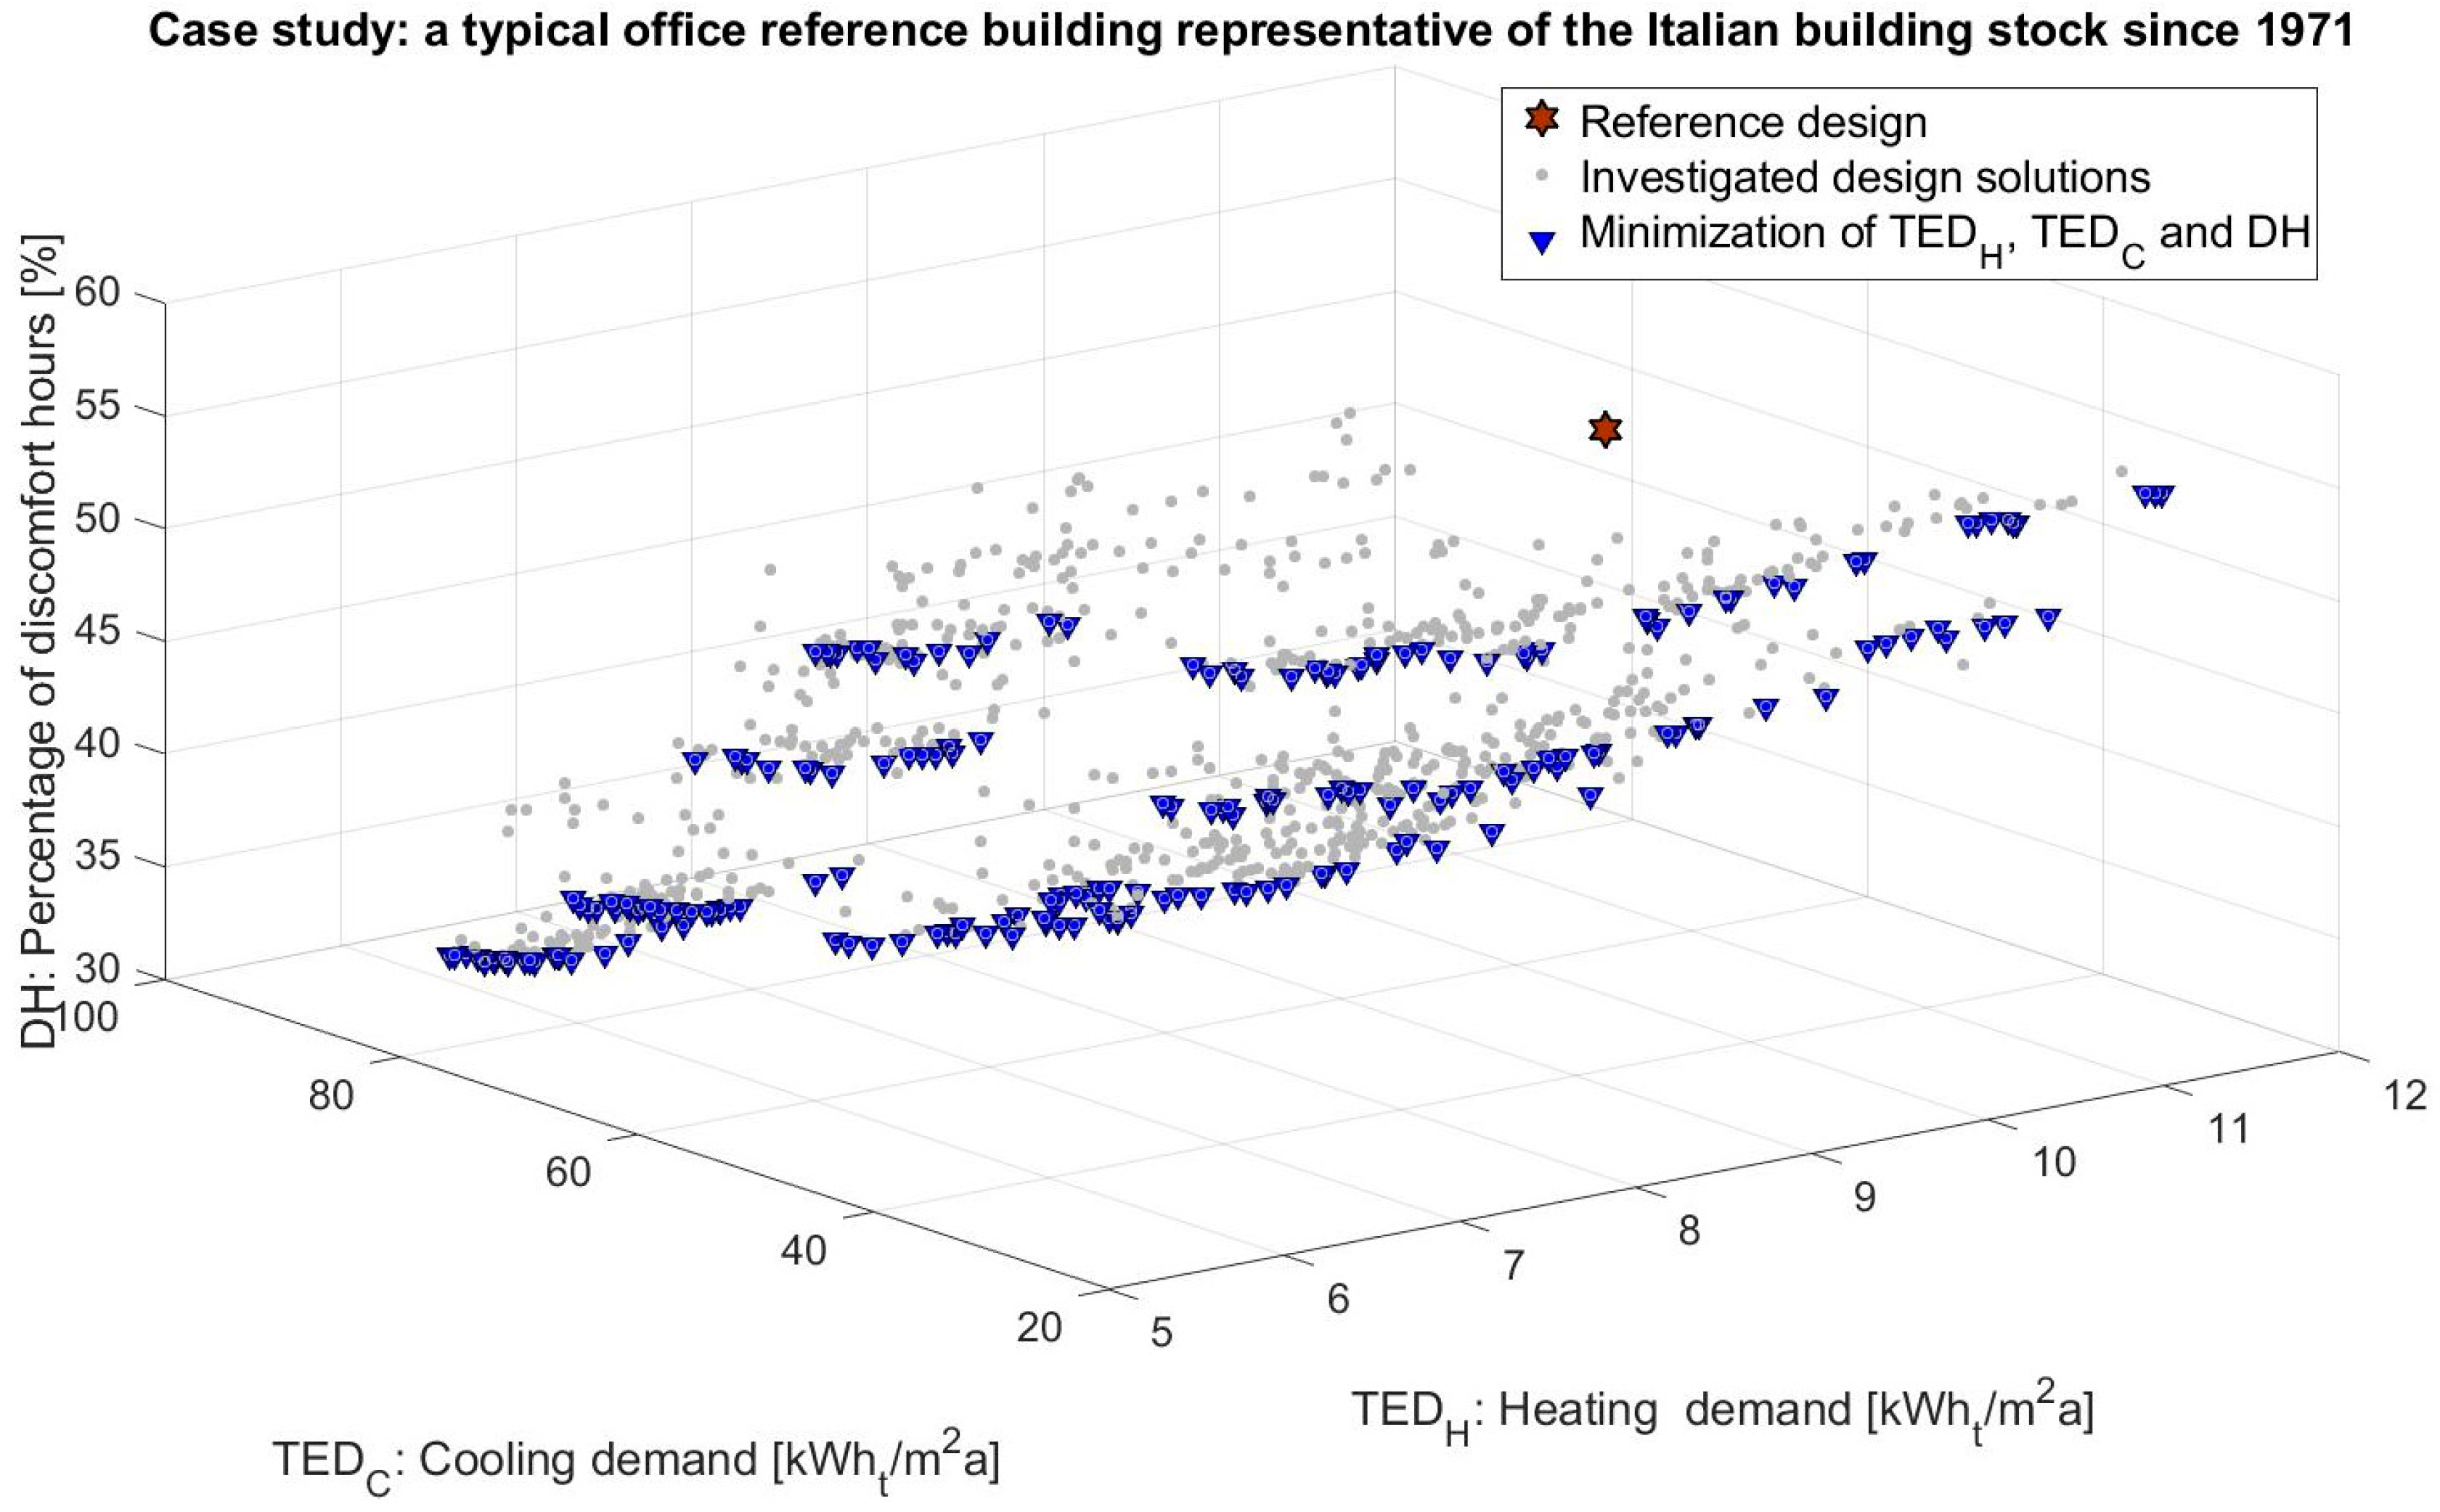
During the 1st stage of the optimization process, the genetic algorithm (GA) is implemented to find optimal solutions for the building energy retrofit with regard to the minimization of thermal energy demands and discomfort hours. A starting population of 44 individuals is considered and 20 generations are set as termination criterion of the GA. Considering also the randomly generated starting population, more than 900 different dynamic energy simulations (through the automatic coupling between EnergyPlus and MATLAB
®) are run to achieve the Pareto minimization of TED
heat, TED
cool and DH. The resulting Pareto fronts (one 3-D and three 2-D) for the multi-objective optimization are shown in
Figure 6,
Figure 7,
Figure 8 and
Figure 9:
Figure 6 outlines the non-dominated solutions that minimize all three objective functions (3D Pareto front);
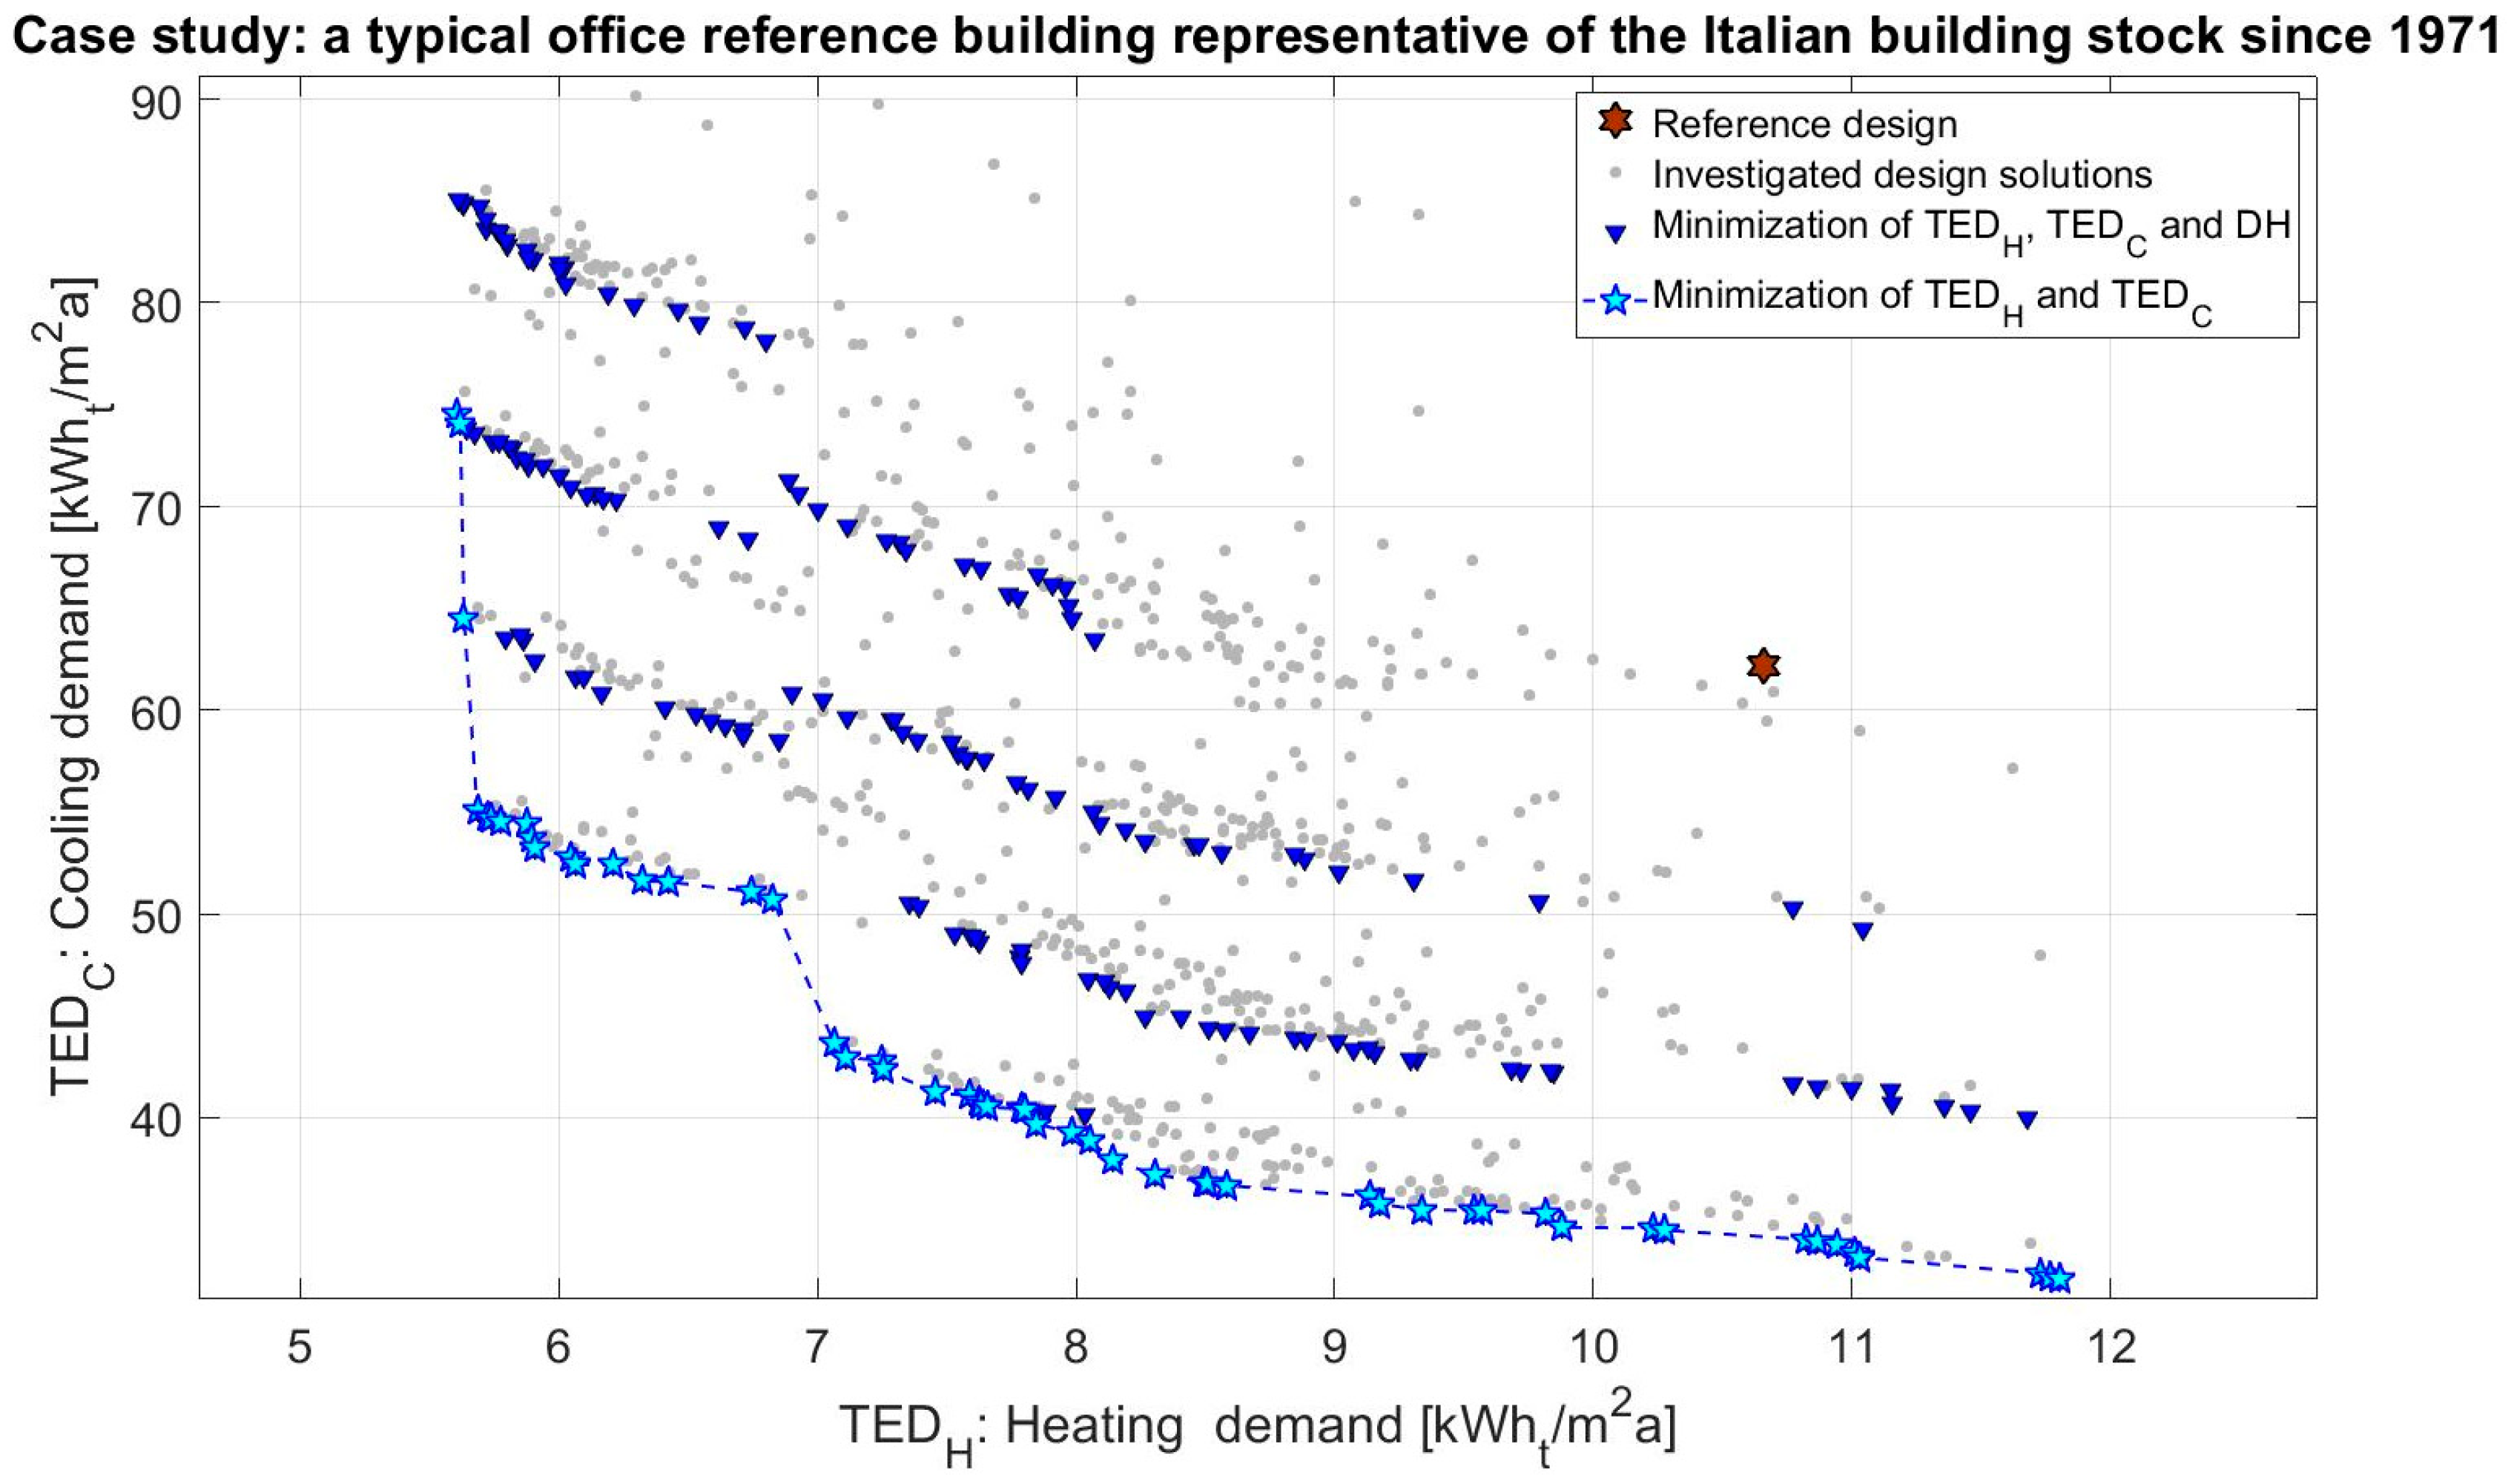
Figure 7 outlines the non-dominated solutions that minimize TED
heat and TED
cool (2D front);
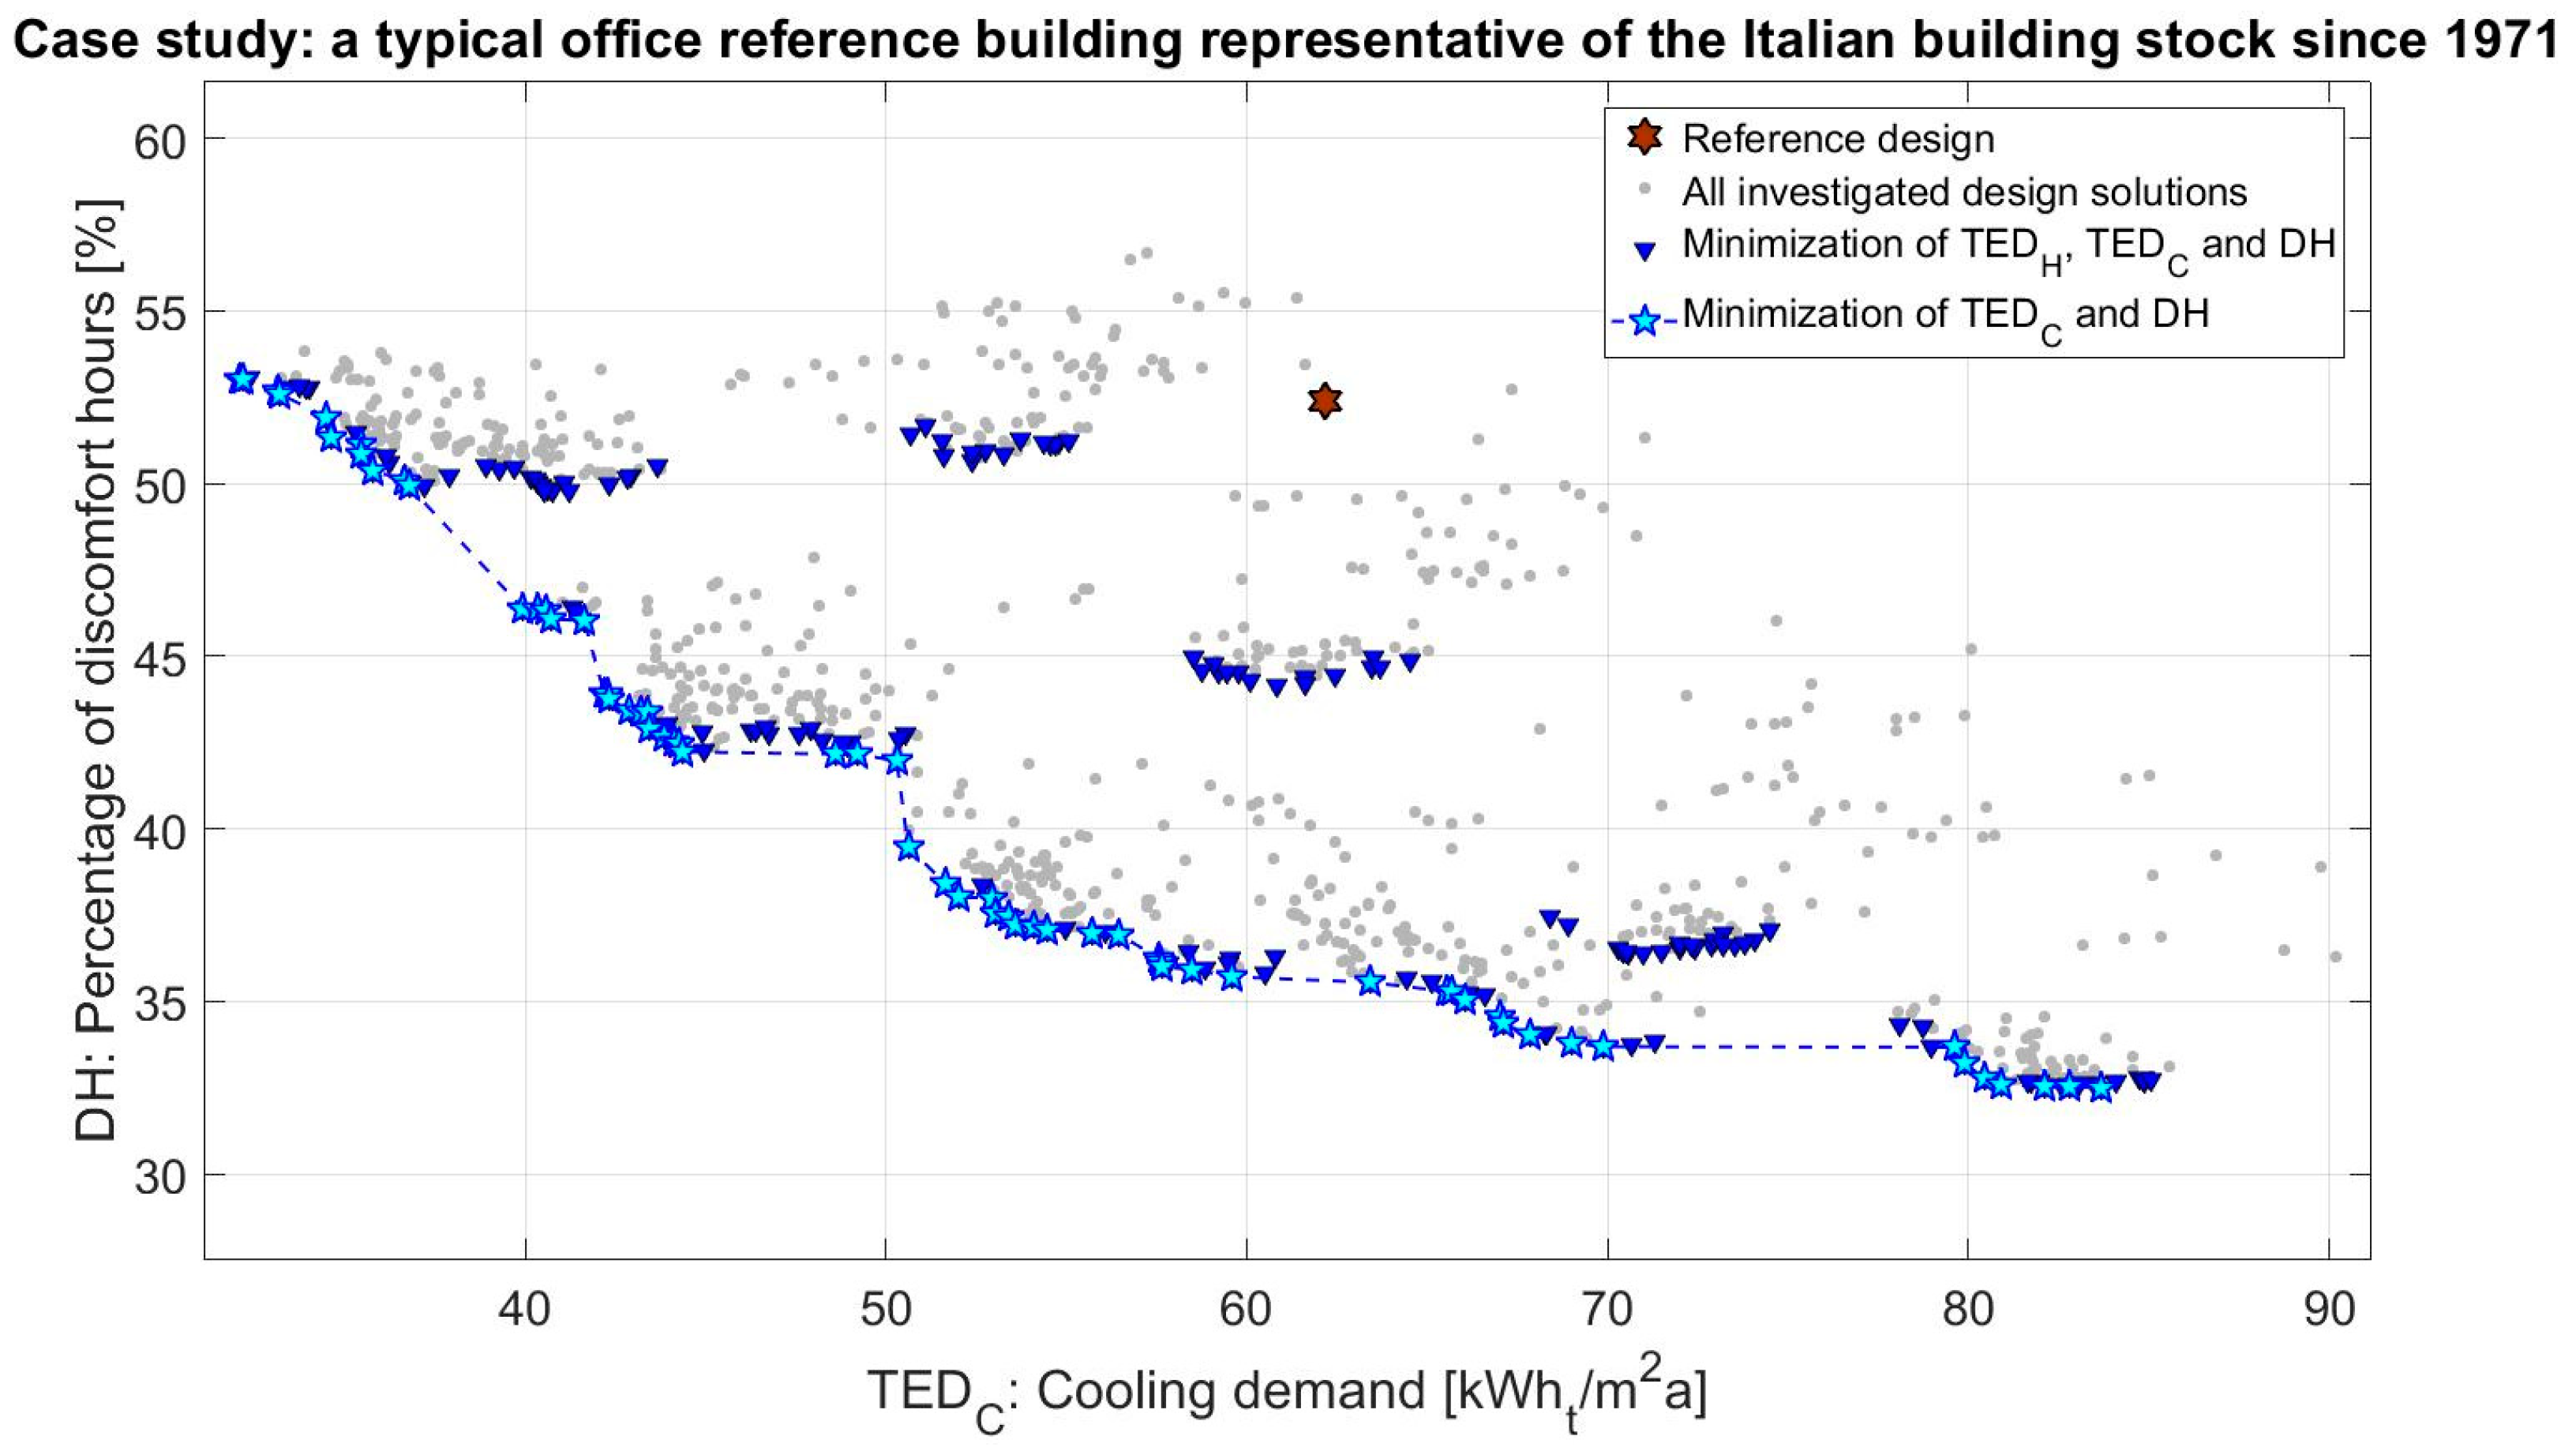
Figure 8 outlines the non-dominated solutions that minimize TED
cool and DH (2D front);
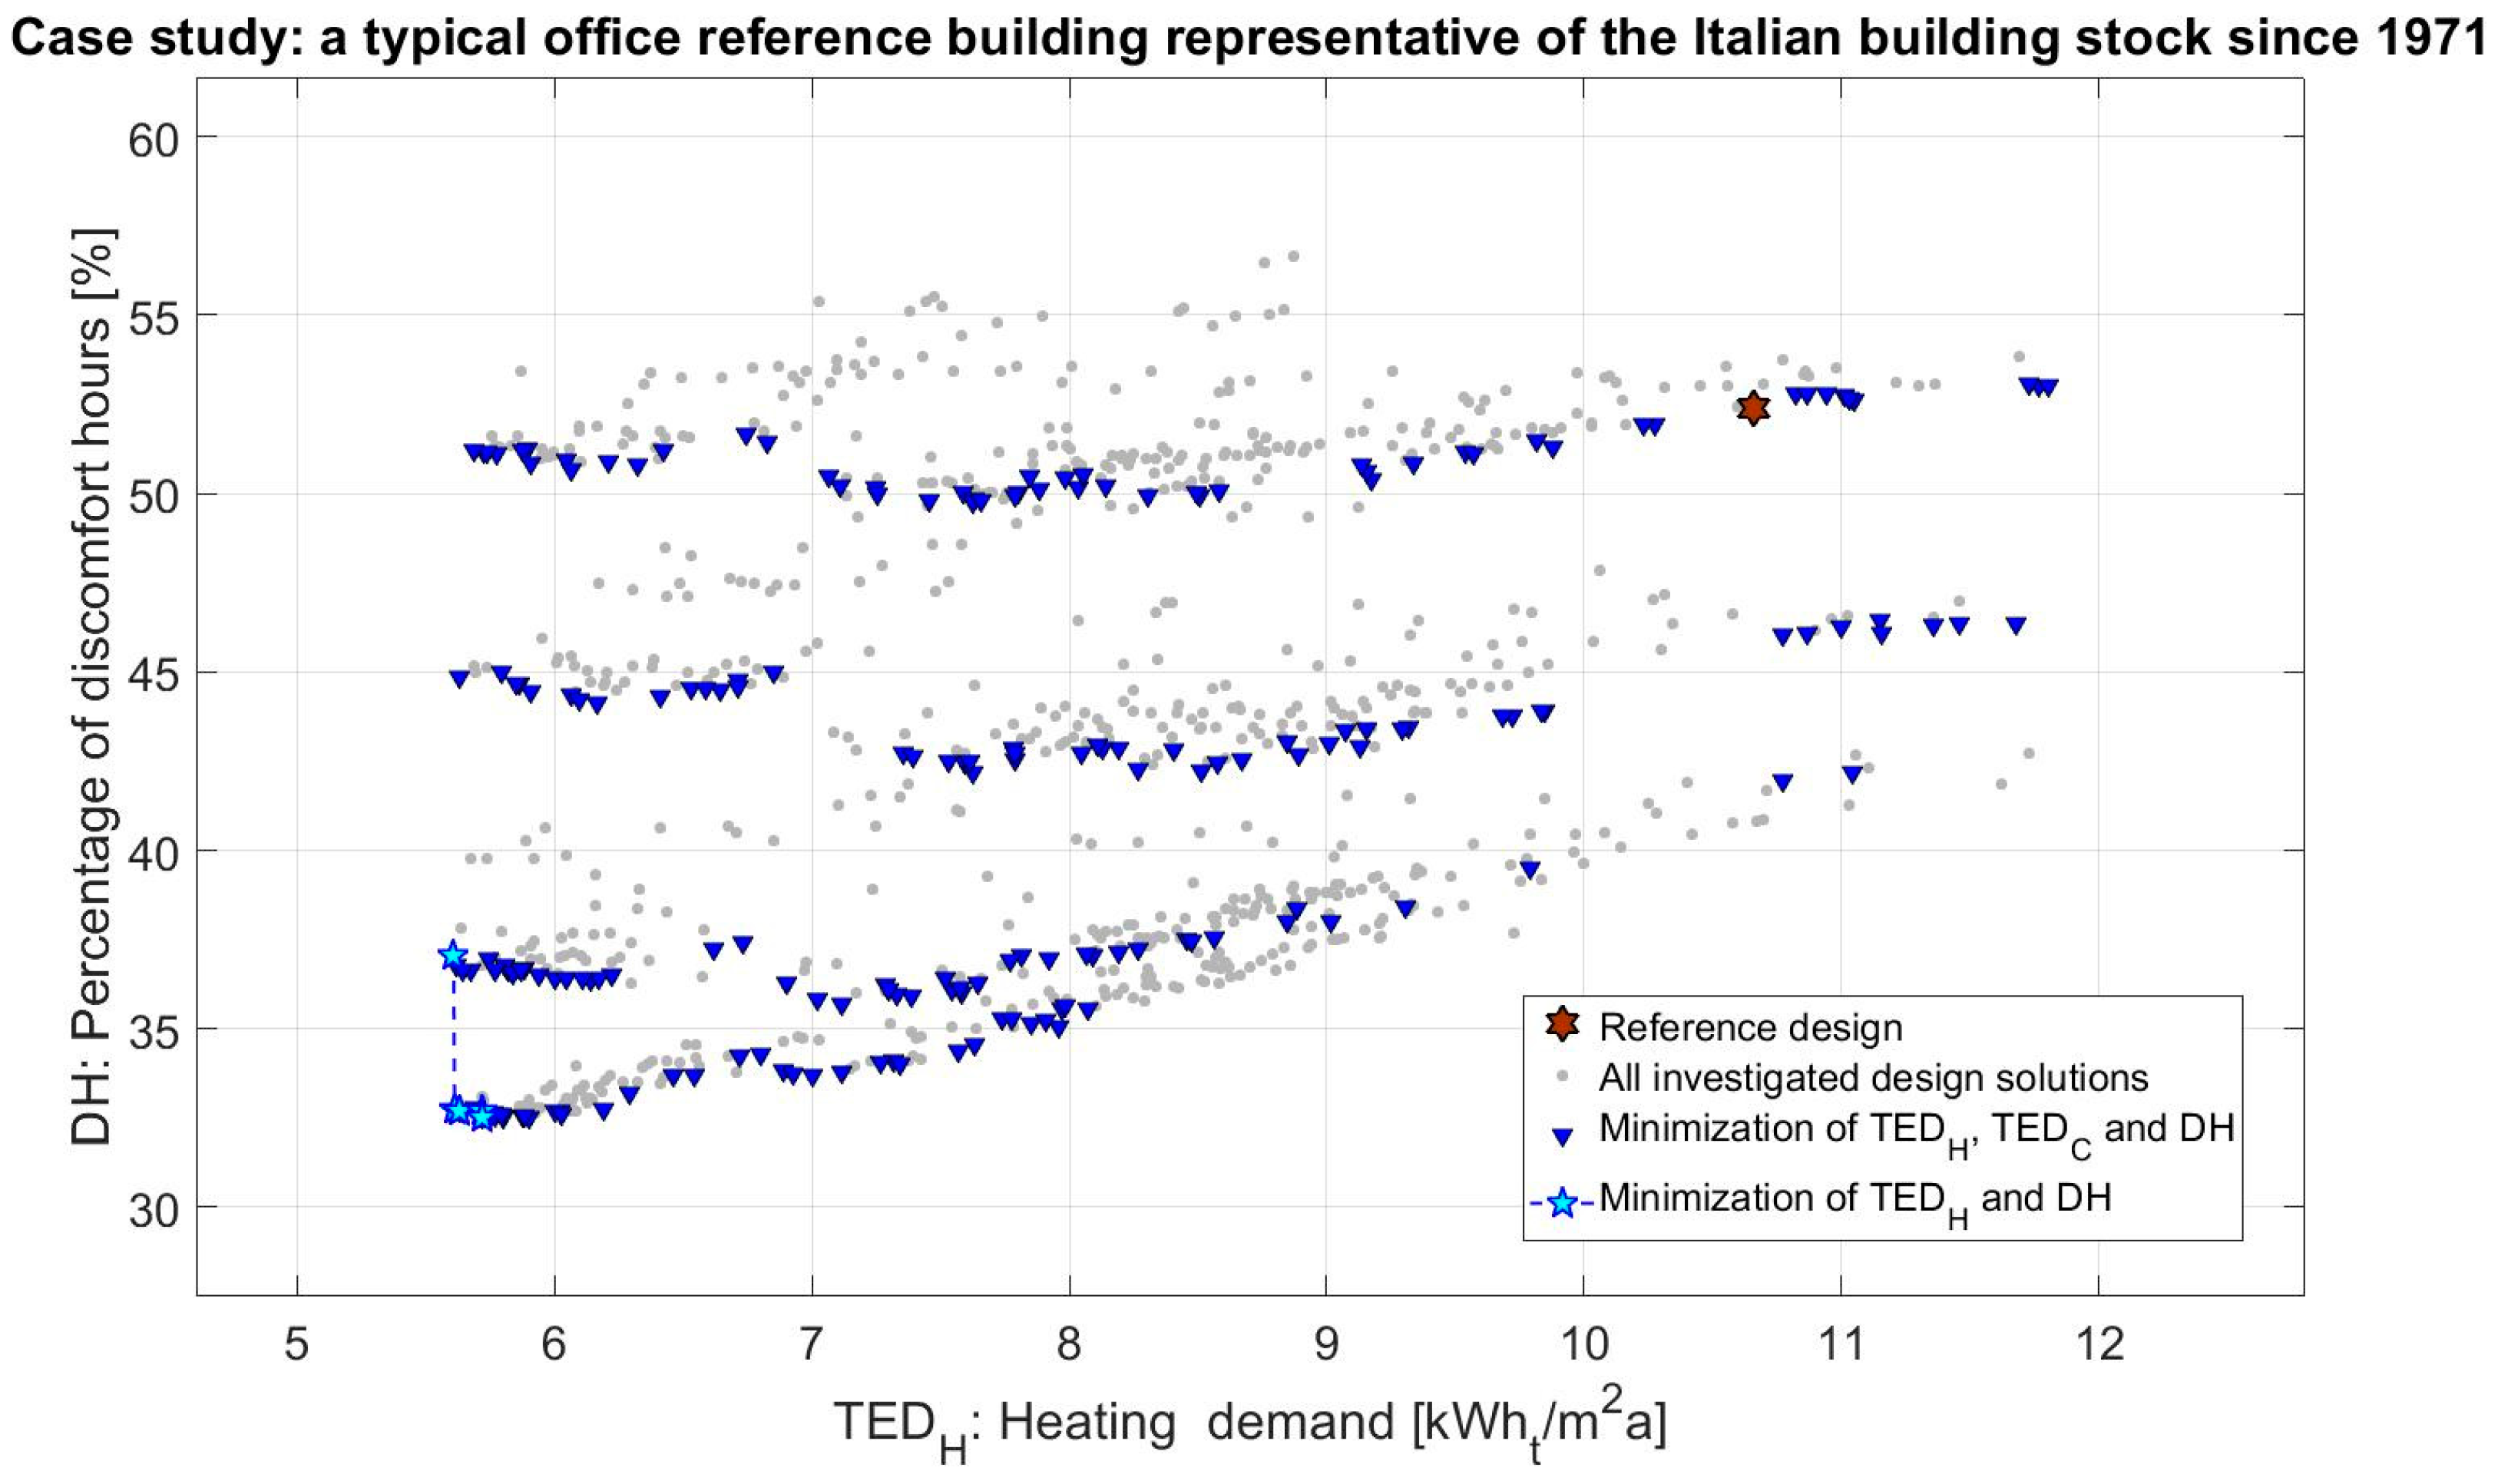
Figure 9 outlines the non-dominated solutions that minimize TED
heat and DH (2D front).
Therefore,
Figure 6 represents all non-dominated solutions, which for clarity reasons, are better represented in
Figure 7,
Figure 8 and
Figure 9. It is noticed (see
Figure 9) that DH tends to increase with TED
heat. In this regard, DH refers to the whole year, also to the intermediate seasons (which have a high impact), and therefore it can increase or decrease with the heating demand (TED
heat). For instance, when the thickness of the thermal insulation layers decreases, clearly TED
heat increases and it is very likely that also DH increases. Indeed, discomfort hours tend to increase in the heating and intermediate seasons (indoor air temperature and surface radiant temperatures tend to decrease when the envelope thermal resistance decreases) and can increase during the cooling season because of the indoor overheating effect. When the first effect is predominant, DH increases with the heating demand.
To have a general outline of the GA outcomes, the attention is focused on the solutions that produce the mono-objective minimization of TEDheat, TEDcool and DH, respectively. These represent the “extreme” solutions of the Pareto fronts and allow understanding of how the Pareto non-dominated solutions vary depending on the weight given to each objective function.
The solution that minimizes TEDheat provides the following energy efficiency measures:
installation of a 0.12 m-thick external thermal insulation layer on the vertical walls;
installation of a 0.10 m-thick external thermal insulation layer on the roof;
installation of plasters with particular radiative properties, i.e., thermal emissivity (e) and solar absorptance (a). For the roof the provided values of e and a are 0.1 and 0.75, respectively, while for the vertical walls optimal values of e and a are 0.8 and 0.1, respectively;
installation of triple-glazed windows with argon filling and low-e coatings in replacement of the existing ones;
installation of external low reflection—medium transmittance shading system.
The set-point temperatures for space heating and cooling should be set equal to 19 °C and to 25 °C, respectively. This combination of retrofit measures produces the following outcomes:
TEDheat passes from 10.7 kWh/m2a (BB, baseline building) to 5.6 kWh/m2a;
TEDcool increases from 62.2 kWh/m2a (BB) to 74.5 kWh/m2a;
DH passes from 52.4%(BB) to 37.1%.
The adoption of a high insulated envelope strongly reduces TEDheat and DH but causes an increase of TEDcool of around 20% because of the indoor overheating effect.
The solution that minimizes TEDcool provides the following energy efficiency measures:
installation of a 0.05 m-thick external thermal insulation layer on the roof, while for the vertical walls no additional insulation is provided;
installation of plasters with e equal to 0.8 and a equal to 0.1 for both roof and vertical walls; therefore, the use of cool plasters is recommended;
installation of tinted double-glazed windows with argon filling and low-e coating coatings in replacement of the existing ones;
installation of an external medium reflection—medium transmittance shading system.
In this case, the set-point temperatures for space heating and cooling should be higher than the previous ones, more precisely they should be set equal to 21 °C and to 27 °C, respectively. This combination of retrofit measures produces the following outcomes:
TEDheat slightly increases from 10.7 kWh/m2a (BB) to 11.8 kWh/m2a;
TEDcool decreases from 62.2 kWh/m2a (BB) to 32.1 kWh/m2a;
DH passes from 52.4%(BB) to 53.0%.
Thus, the retrofit solution minimizing TEDcool does not exert significant effects on the other two objective functions, differently from the previous solution. However, this solution will be cut off during the 2nd optimization stage because it causes an increase of DH compared to the baseline.
Finally, the solution that minimizes DH provides the following energy efficiency measures:
installation of a 0.12 m-thick external thermal insulation layer on both the vertical walls and the roof;
installation of plasters with particular values of e and a. For the vertical walls the optimal values of e and a are 0.9 and 0.9, respectively, while for the roof the optimal values of e and a are 0.1 and 0.5, respectively;
installation of triple-glazed windows with argon-filling and low-e coating in replacement of the existing ones;
installation of an internal low reflection—high transmittance shading system;
In this final case, the set-point temperatures for space heating and cooling should be set equal to 19 °C and to 24 °C, respectively. This combination of retrofit measures produces the following outcomes:
TEDheat strongly decreases from 10.7 kWh/m2a (BB) to 5.7 kWh/m2a;
TEDcool increases from 62.2 kWh/m2a (BB) to 83.7 kWh/m2a;
DH passes from 52.4% (BB) to 32.5%.
Finally, this solution is very similar to the one minimizing TEDheat. The installation of high-thick insulation layers and triple-glazed windows allow reduction of TEDheat and, obviously, DH, while TEDcool increases of around 35% mainly because of summer overheating.
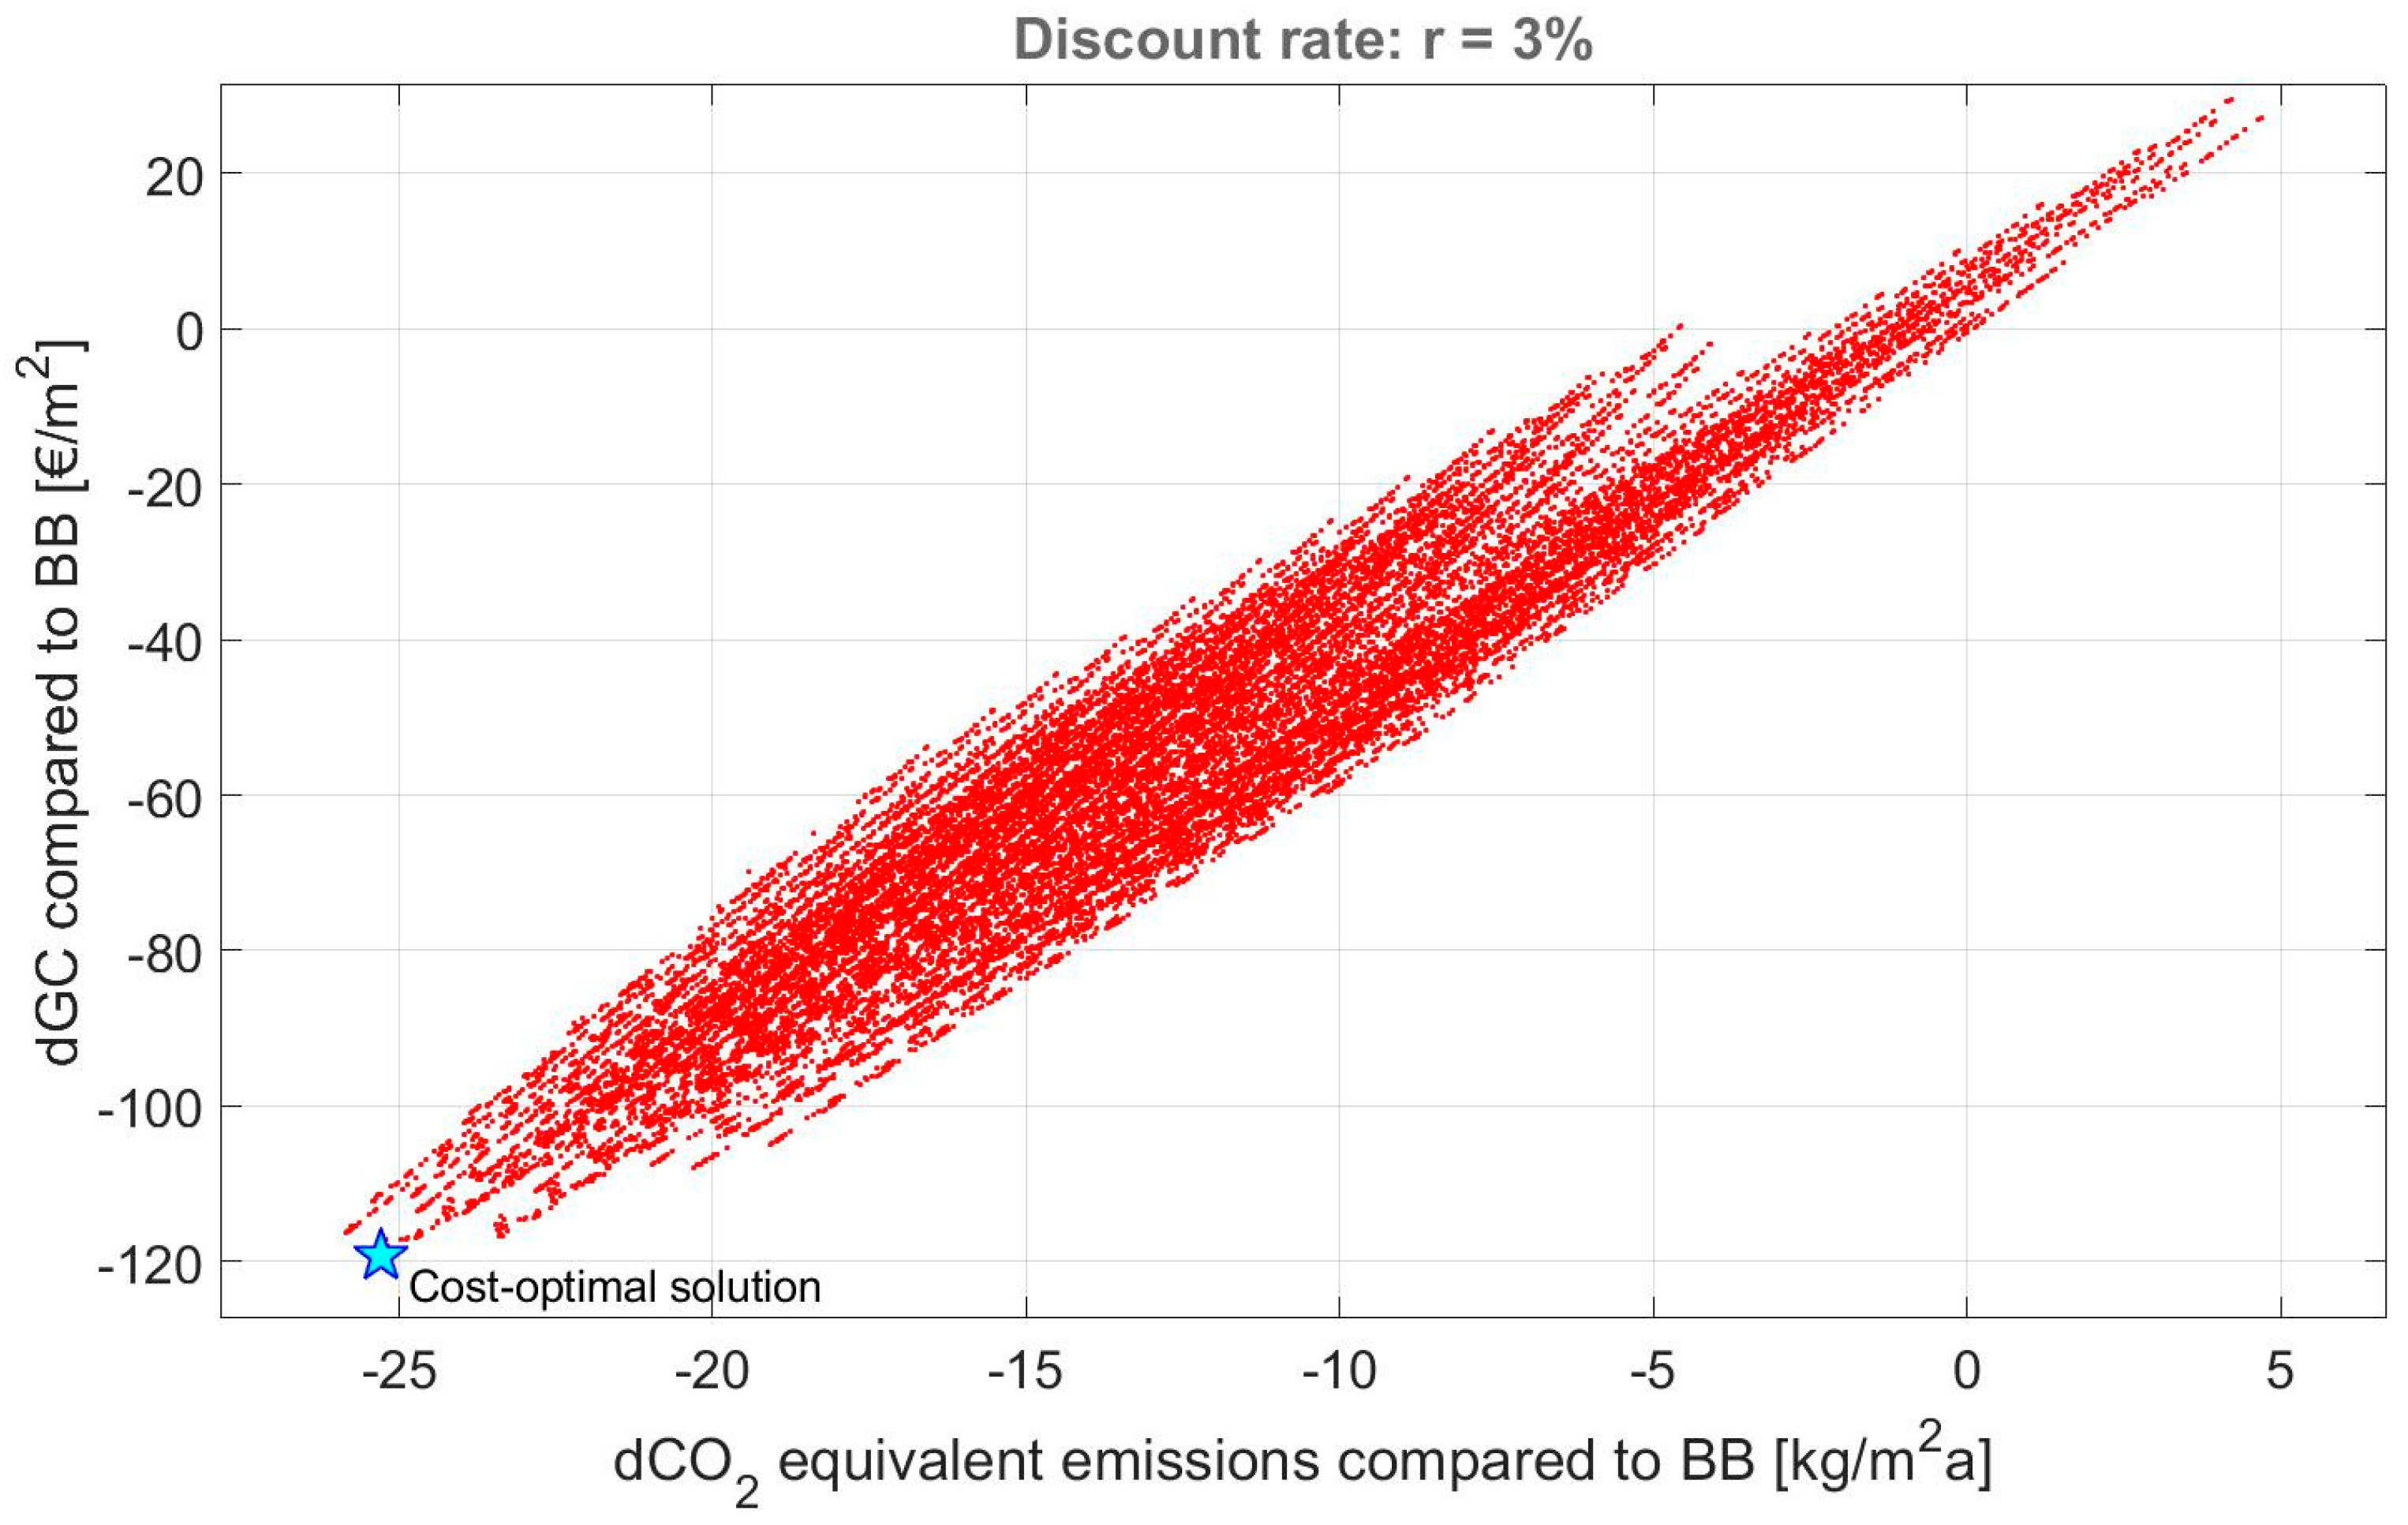
The achieved Pareto non-dominated solutions are 224, most of which implies a significant improvement of occupants’ thermal comfort compared to BB. Only twelve Pareto solutions cause an increase of DH compared to BB, and thus they are excluded in the 2nd methodology stage. This latter is implemented by conducting the smart exhaustive sampling. Thus, also the replacement of primary energy systems is considered, and globally 32,802 different energy retrofit scenarios are investigated by assessing GC and GHG emissions (see
Figure 10). Specifically, the differences in global cost (dGC) and GHG emissions (dCO
2-eq) compared to the baseline are evaluated to obtain more representative results.
For a discount rate (r) equal to 3%, the resulting cost-optimal solution provides the following energy retrofit measures:
installation of a 0.12 m-thick external thermal insulation layer on roof and vertical walls;
installation of plasters with particular radiative properties, i.e., thermal emissivity (e) and solar absorptance (a). For the roof the optimal values of e and a are 0.7 and 0.1, respectively, while for the vertical walls optimal values of e and a are 0.8 and 0.1, respectively. Therefore, the optimization procedure recommends the use of cool plasters;
installation of tinted double-glazed windows with argon-filling and low-e coating ones in replacement of the existing ones;
installation of the reversible electric heat pump for both space heating and cooling;
installation of PV monocrystalline panels covering the 100% of the usable roof area.
Finally, the set-point temperatures for heating and for cooling should be set equal to 20 °C and to 27 °C respectively. It should be noticed that the combination among envelope thermal insulation, cool plasters, tinted windows and high-efficiency primary systems is highly synergic and produces simultaneously reductions of:
TEDheat which passes from 10.7 kWh/m2a (BB) to 8.5 kWh/m2a;
TEDcool which passes from 62.2 kWh/m2a (BB) to 36.8 kWh/m2a;
discomfort hours: DH passes from 52.4% (BB) to 49.9%;
global cost: dGC = −119.3 €/m2;
GHG emissions: dCO2-eq = −25.3 kg/m2a;
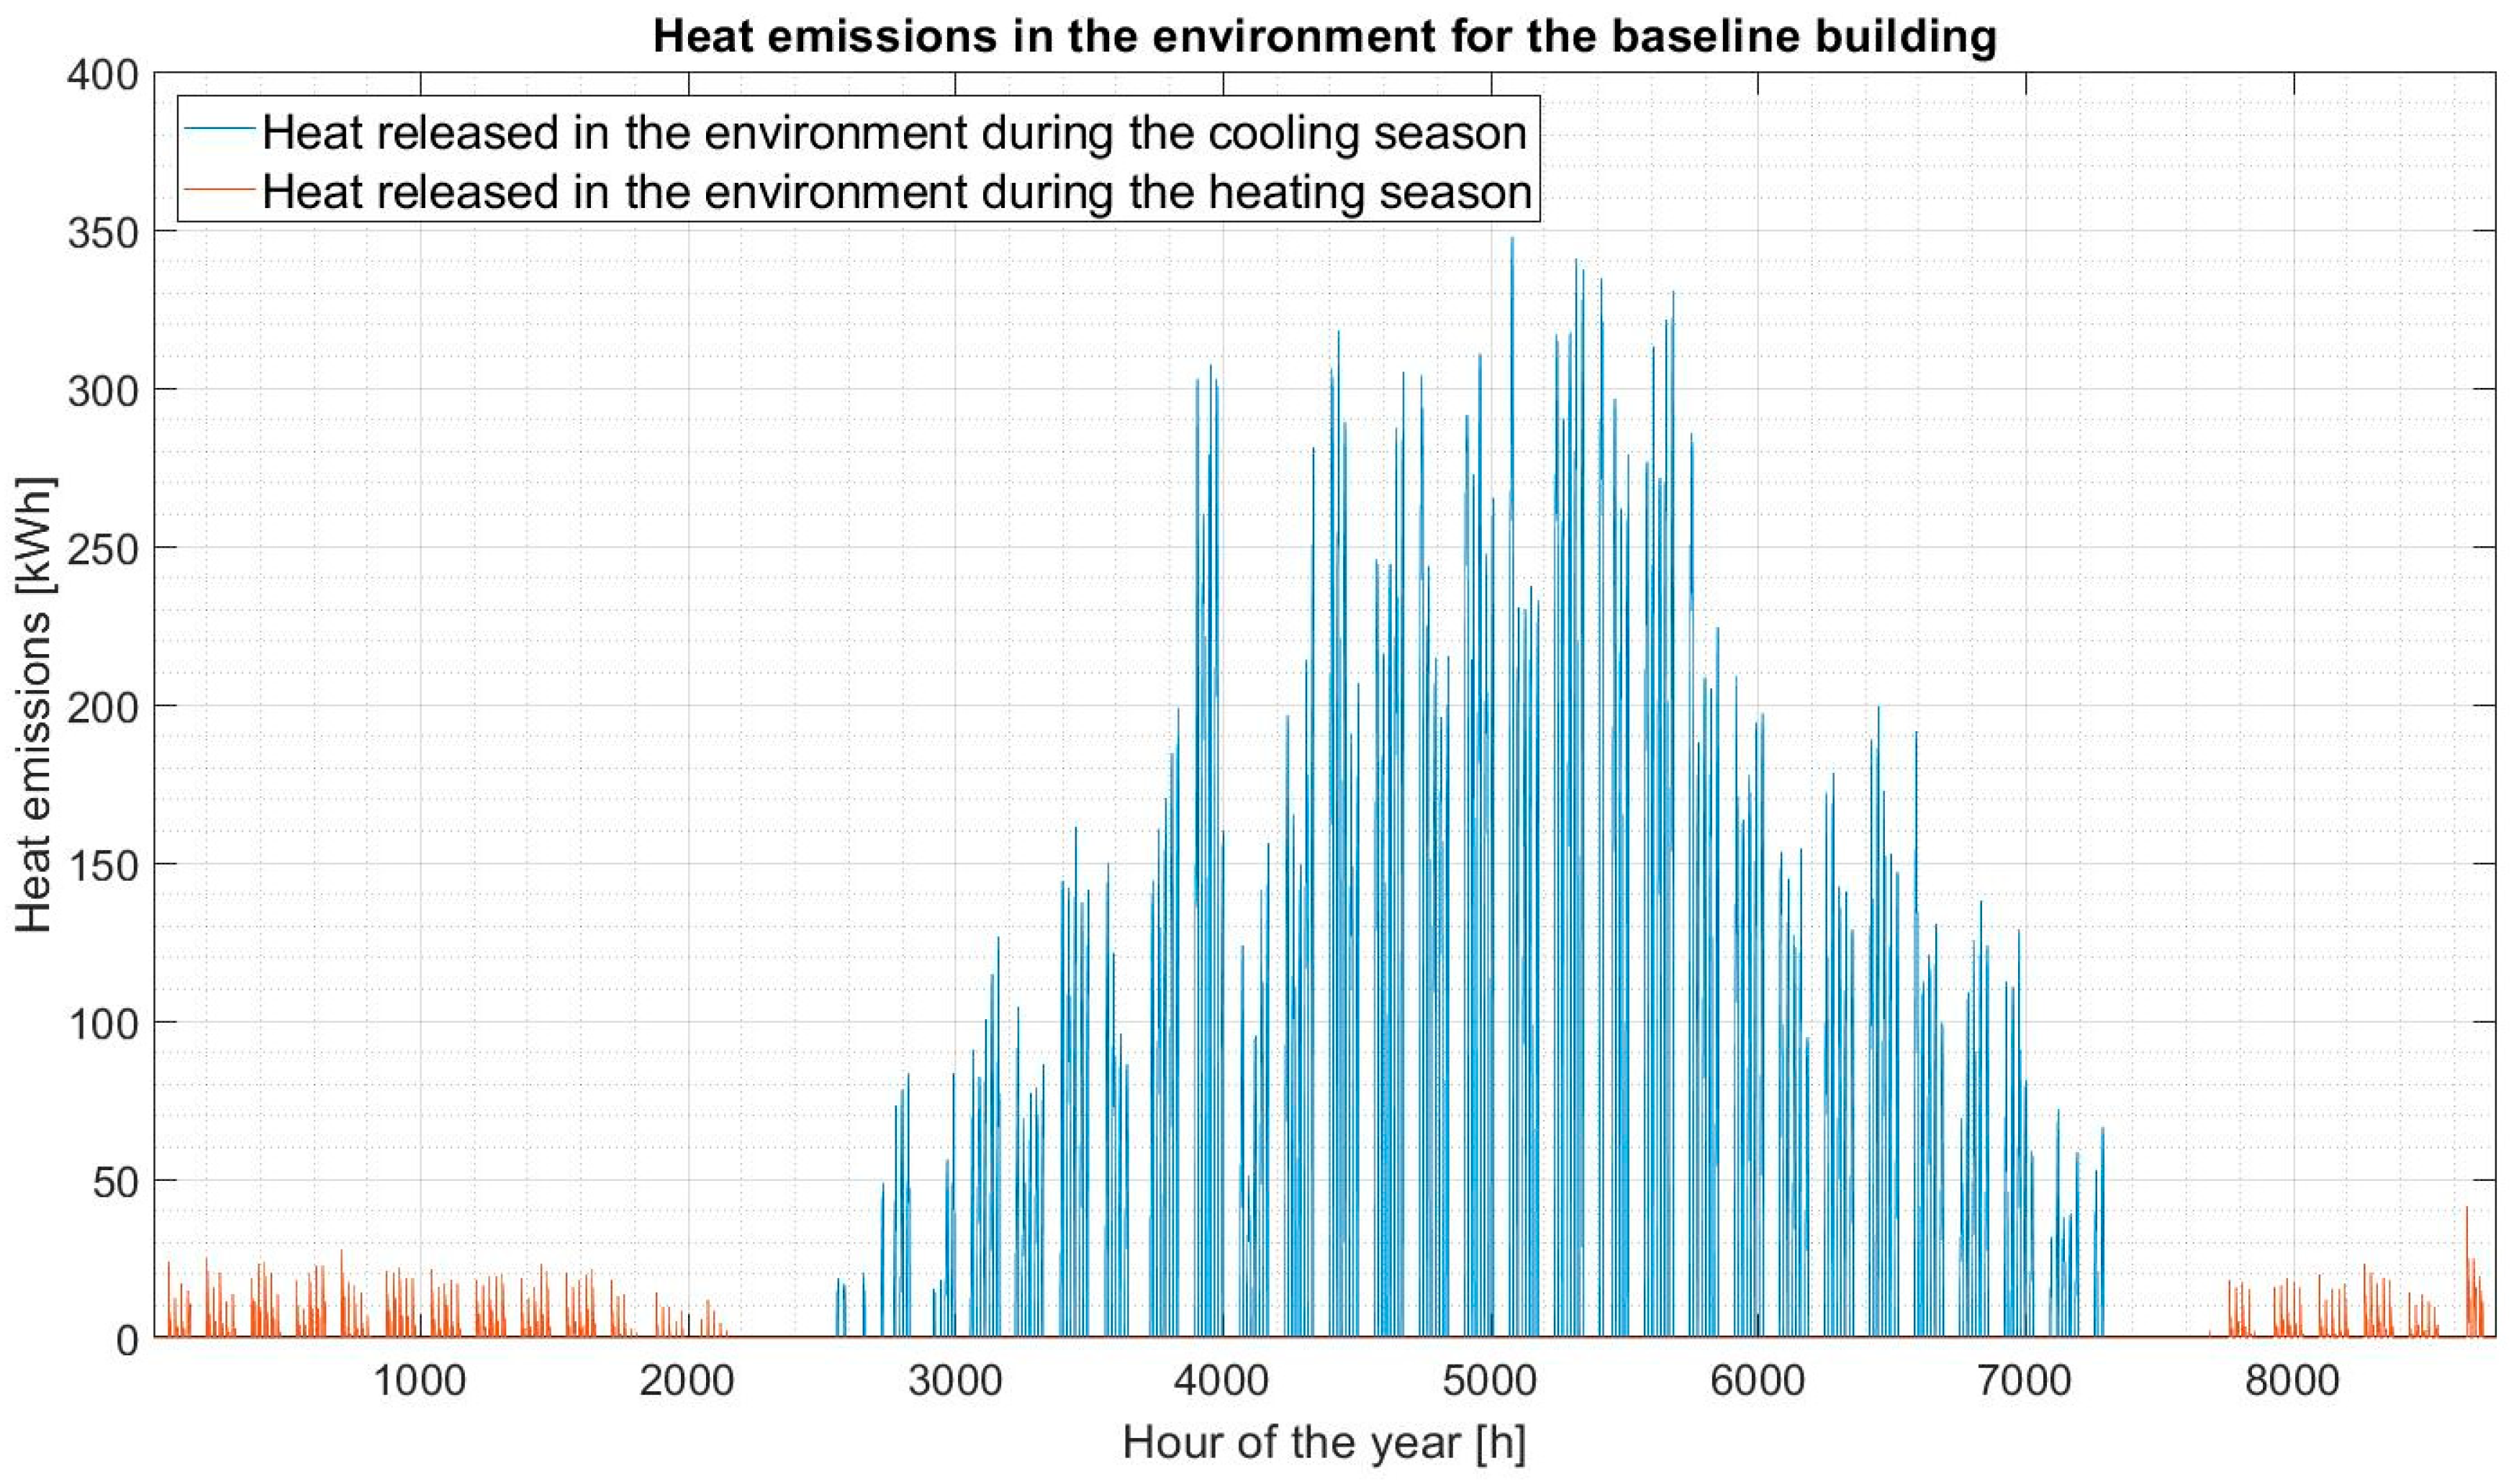
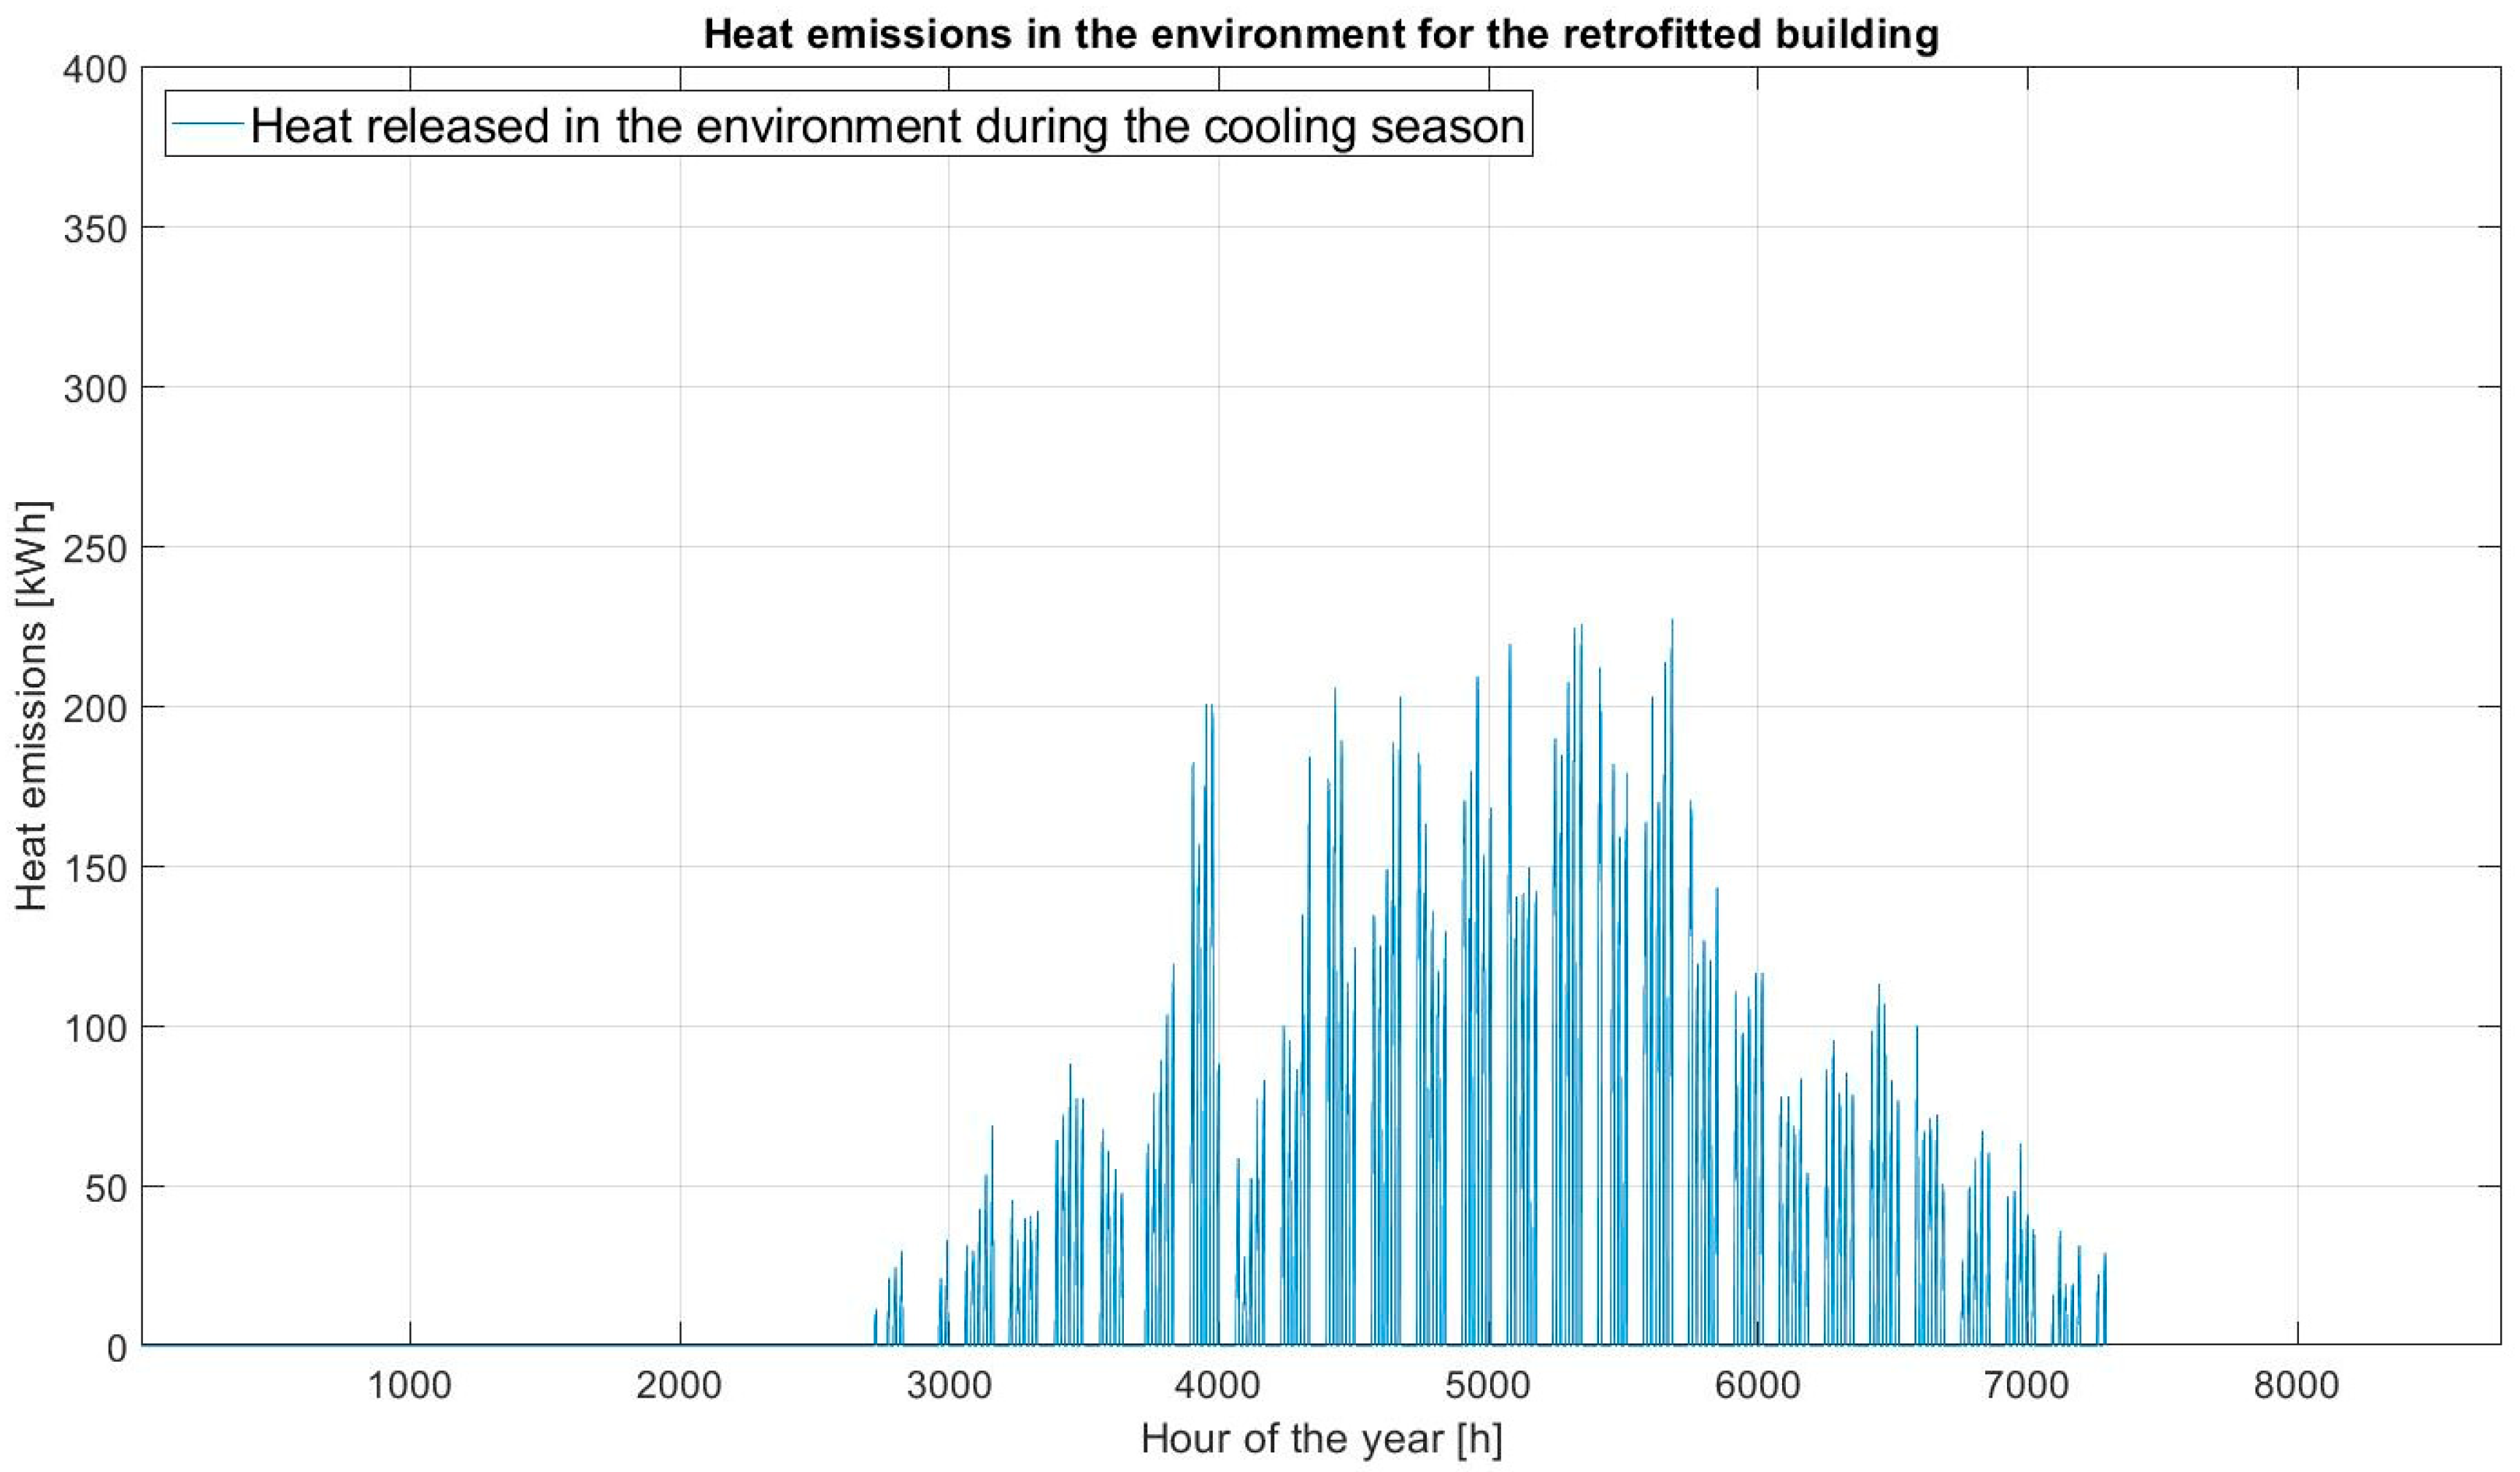
annual heat emissions into the external environment, which pass from 195 MWh (BB) to 105 MWh (in percentile terms, this means that the reduction is around 46%).
Regarding this last result, it is fundamental to highlight that the beneficial effect on heat emissions due to the installation of the air-source electric heat pump (which “removes” heat from the external environment) is not considered in order to avoid the overestimation of the goodness of the cost-optimal solution found in terms of urban overheating mitigation too. Hourly heat emissions into the external environment for the cost-optimal solution are reported in
Figure 11.
It is highlighted that the achieved constrained cost-optimal solution produces a drastic reduction of GHG emissions. Indeed, as shown in
Figure 10, the employed macro-economic approach for GC assessment implies that the solution minimizing GC is very close to the one that minimizes CO
2-eq emissions, thereby ensuring a very satisfying trade-off between the private and the public perspectives. Therefore, the application of the methodology at large scale can produce a significant reduction of building environmental impact, giving a strong support to the mitigation of climate change and urban overheating.
The robustness of the solution is examined by assessing the cost-optimal solution for other two values of the discount rate r (i.e., 1% and 5%). Specifically, when the discount rate is varied the cost-optimal solution remains the aforementioned one. Clearly, only the value of dGC changes and it is equal to −153.2 €/m2 for r = 1% and to −93.2 €/m2 for r = 5%.
Other different models of comfort and criteria for evaluating hygrothermal conditions in civil buildings, with reference to both cities and urban areas, can be used, as inferred by Paolini et al. [
44] recently. Specifically, the authors performed a deep investigation of effects of local climate conditions, that, in cities, can be more significant in summertime (i.e., higher cooling loads) and less critical in wintertime (given the urban heat island effect) compared to rural zones. In this case, conditions of local climate (e.g., city, urban canyon, cooler backcountry or coastline) must be considered and the standard weather files cannot be considered as sufficient. Analogously, also improvement and variation of comfort models can be thought and considered. For instance, solar radiation entering into the building through fenestration can strongly affect human comfort, and this particular role was deeply studied by Arens et al. [
45] who developed a new model for understanding the impacts of radiation on the energy balance of human body. According to the authors, the so-called “SolarCal”, besides an improvement of comfort models, can help in choosing the most suitable kind of windows and fenestrations for a building, to improve its indoor thermal comfort conditions. However, in this study we used DH—which is based on Fanger theory [
46]—because it is a well-accredited comfort index (used in several previous works, e.g., from Asadi et al. [
20], Delgarm at al. [
21], Ascione at al. [
38,
39] and Mauro et al. [
42]) and provides an objective function to be minimized, which is fundamental for the implementation of the optimization procedure. Nevertheless, future optimization studies will be addressed to a more detailed characterization of thermal comfort. Another critical aspect concerning comfort is the risk of overheating during heatwaves in summertime. This risk can be significant for the considered case study, given the cooling-dominated climate as well the use destination (office buildings present high internal heat gains). Clearly, the proposed methodology cannot foresee extreme meteorological events because energy simulations are based on typical and average weather data files. However, the main aim of the multi-objective optimization is to design building energy refurbishments suitable for improving comfort, costs and energy demands, by reducing, at the same time, also the heat emission into the urban environment. Therefore, in the optimization algorithm, one objective function is the minimization of thermal discomfort, by considering all occupied hours of the year and, particularly, of the cooling season. Indeed, even if the building is fully equipped with air-conditioning systems (so that comfort conditions are allowed also during the cooling peaks, in the hottest hours of the summer period), the run period of the HVAC system is not 24 h/day, and thus it is recommended the refurbishment configuration that improves thermal conditions also during the off-periods of the cooling plant. In this way, by considering both energy demands and thermal comfort (for all the occupied hours), we can consider, in the same methodology and retrofit configuration, both passive and active energy conservation measures. This allows minimization of the risk of indoor overheating during heatwaves in summertime.
5. Conclusions
The paper proposes an optimization methodology for building energy design/retrofit based on two main objective functions, and thus the reduction of global costs and GHG emissions, to perfectly conjugate the two involved perspectives: the private one (minimization of financial expenditure) and the public one (minimization of pollution and environmental impacts of buildings).
The optimization process is structured in two consequent stages. The first one consists of the implementation of a genetic algorithm by means of the coupling of MATLAB® and EnergyPlus, while during the second stage a smart exhaustive sampling is conducted entirely in MATLAB®, thereby ensuring feasible computational times even when around 30,000 retrofit scenarios are investigated. As a case study, a typical office reference building representative of the Italian building stock since 1971 is investigated. The cost-optimal solution provided by the application of the proposed methodology to this case study permits a strong reduction in the GHG emissions, which change from 78.8 kg/m2a to 53.5 kg/m2a, as well as the global cost, which decreases by around 119 €/m2 (assuming a discount rate equal to 3%).
The importance of the application of the proposed optimization methodology is that the reduction of the CO2-eq emissions can enable the different countries to respect the limits imposed by the international agreements on polluting emissions for fighting climate change, while the minimization of the GC makes the adoption of proper energy efficiency measures more appealing to building owners, letting them play also an important role for the community.
Finally, the applied methodology enables the reaching of more than satisfying results not only in fighting climate change under a macroscopic approach, but also in contrasting the urban overheating by adopting a local-limited approach.


 ,
, 


