Article

The Relationships between Climate Variability and Crop Yield in a Mountainous Environment: A Case Study in Lamjung District, Nepal

Department of Natural Resources, Graduate School of Global Environmental Studies, Kyoto University, Yoshida Honmachi, Sakyo-ku, Kyoto 606-8501, Japan
*
Author to whom correspondence should be addressed.
Climate 2016, 4(1), 13; https://doi.org/10.3390/cli4010013
Submission received: 2 December 2015 / Revised: 22 February 2016 / Accepted: 23 February 2016 / Published: 2 March 2016
(This article belongs to the Special Issue Climate Change on Crops, Foods and Diets)

Abstract

:
Several studies have concluded that mountainous countries such as Nepal are more vulnerable to climate change; thus, a changing climate should have a significant impact on crop yields. This work aims to explore the impact of climate change on major crop yields in the mountainous parts of Nepal and to determine their relationships based on a regression model between historical climatic data and yield data for food crops. The study starts with an analysis of the last 30 years of climatic data from Lamjung district. Mann-Kendall and Sen’s Slope methods have been used for the trend analysis and quantification. The results showed an increase in temperature of approximately 0.02 °C to 0.07 °C per year in different seasons and a mixed trend in precipitation. Although there was no significant impact of the climate variables on the yields of all crops, the regression analysis revealed negative relationships between maize yield and summer precipitation and between wheat yield and winter minimum temperature, and a positive relationship between millet yield and summer maximum temperature.

1. Introduction

In the mountainous country of Nepal, more than 60% of the population is dependent on agriculture, which contributes 35% of the gross domestic product [1]. Based on this statistic, it is clear that growth and development in the agricultural sector has a direct contribution on the national economy and livelihood of the people. Several crops can be cultivated in Nepal; however, five major crops, i.e., rice, maize, wheat, millet and barley, dominate the agricultural sector [2]. These crops represent more than 90% of the total grain production and cultivated area in Nepal [2]. Rice and millet are the major summer crops, maize is a spring/summer crop, and wheat and barley are the winter crops (Appendix 1). Among them, rice and maize are the primary crops that contribute more than half of the total food grain production of Nepal and are grown from the lowlands in the Terai (70 meters above sea level) through high hills (2830 meters above sea level) [3]. Thus, the study of the various impacts of climate changes on these crop yields is urgently required for planning the future food availability in the country.
According to 5th assessment report of the Intergovernmental Panel on Climate Change [4], compared to the 20th century, the average annual temperature will rise by more than 2 °C in most of the South Asia by the mid of 21st century, and by the late of 21st century, the temperature increases will exceed 3 °C and as much as 6 °C in high altitudes under a high-emission scenario. Similarly, under a low-emission scenario, the average temperature will rise by less than 2 °C in the 21st century, but at higher altitudes, the temperatures will rise by as much as 3 °C. It is anticipated that the increasing rate of the average temperature in the Himalaya will be greater than the global average. The increasing temperatures may affect the timing and quantity of precipitation, which would consequently change the water availability [5].
Several studies have shown that the rate of temperature increase is higher at higher altitudes [6,7,8]. Changing temperatures and erratic rainfall pattern are affecting crop production in Nepal [9]. Similarly, the loss of local crops and domestic animals, changes in cropping patterns, scarcity of water due to the drying up of water resources, and increasing incidences of diseases and pests have also been observed [10,11]. Due to its heterogeneous topography, there is a high risk of natural disasters, such as glacier lake outburst floods (GLOFs), avalanches, landslides, etc., in the higher altitudes and floods in the lower region. Hence, mountainous countries such as Nepal are more vulnerable to climate change [12].
There is ample evidence to link the increase in extreme weather events, such as droughts and floods, with agricultural production. Due to the winter drought in 2008/2009, there was a huge loss in agricultural production in Nepal [13,14]. Because of the erratic monsoon weather conditions in India during 2009, the production of the main crops decreased, resulting in food crises in neighboring countries [15]. Wassmann [16] also argued that small household farmers, especially in marginalized regions of Asia, experience most of the negative effects of climate change because agriculture is adversely impacted in this region [17].
In Nepal, a majority of the area is covered by hills, high mountains and lowland areas; therefore, there is a huge variation in weather. Similar changes can have different consequences at different altitudes. As the temperature increases, the higher mountainous areas may benefit, whereas lowland areas may suffer badly. Some studies have shown that the impact of global warming in the mountainous area could have a positive impact for some vegetables and crops, such as tomato, cauliflower, wheat, maize, and rice [5,18]. However, the decreasing winter precipitation may have an adverse impact on winter crops, which need more water or irrigation facilities.
Shrestha [19] said that the growth and development of plants, outbreaks of pests and diseases, and water availability could be affected by changes in the temperature and precipitation patterns, thereby eventually affecting crop yields. Climate change will have a significant impact on agriculture, primarily through its effect on crop yields [20,21]. Most of these studies seeking to understand the physical effects of climatic variables on crop yield were conducted through crop simulation models. However, small changes in the climatic variables, specifically in temperature, are often excluded [22]. Therefore, regression models based on historical yield data and climate data are relatively accurate for the prediction of changes in the yield due to climate change [23,24,25].
Based on the climate change vulnerability, overall risk exposure and sensitivity data provided by the Nepal Government, Lamjung district, one of the 75 districts of Nepal, was selected. Lamjung is ranked as high risk in terms of climate change impacts [26]. According to the report, the risk of flash floods, landslides, and GLOFs in Lamjung is also very high. Therefore, climate changes will also likely have a significant impact on the crop yield in this district; thus, a detailed study is required for this region. Hence, this study focuses on understanding how the climate is changing and discusses its impact on crop yields in a mountainous region of Nepal. The objectives of this study, therefore, include time series analysis of precipitation, temperature and yield of selected crops. Similarly, to explore the impact of climate change on crop yield, the relationship between yield and climatic variables are also analyzed through a regression model of climate and crop yield anomalies.

2. Study Area

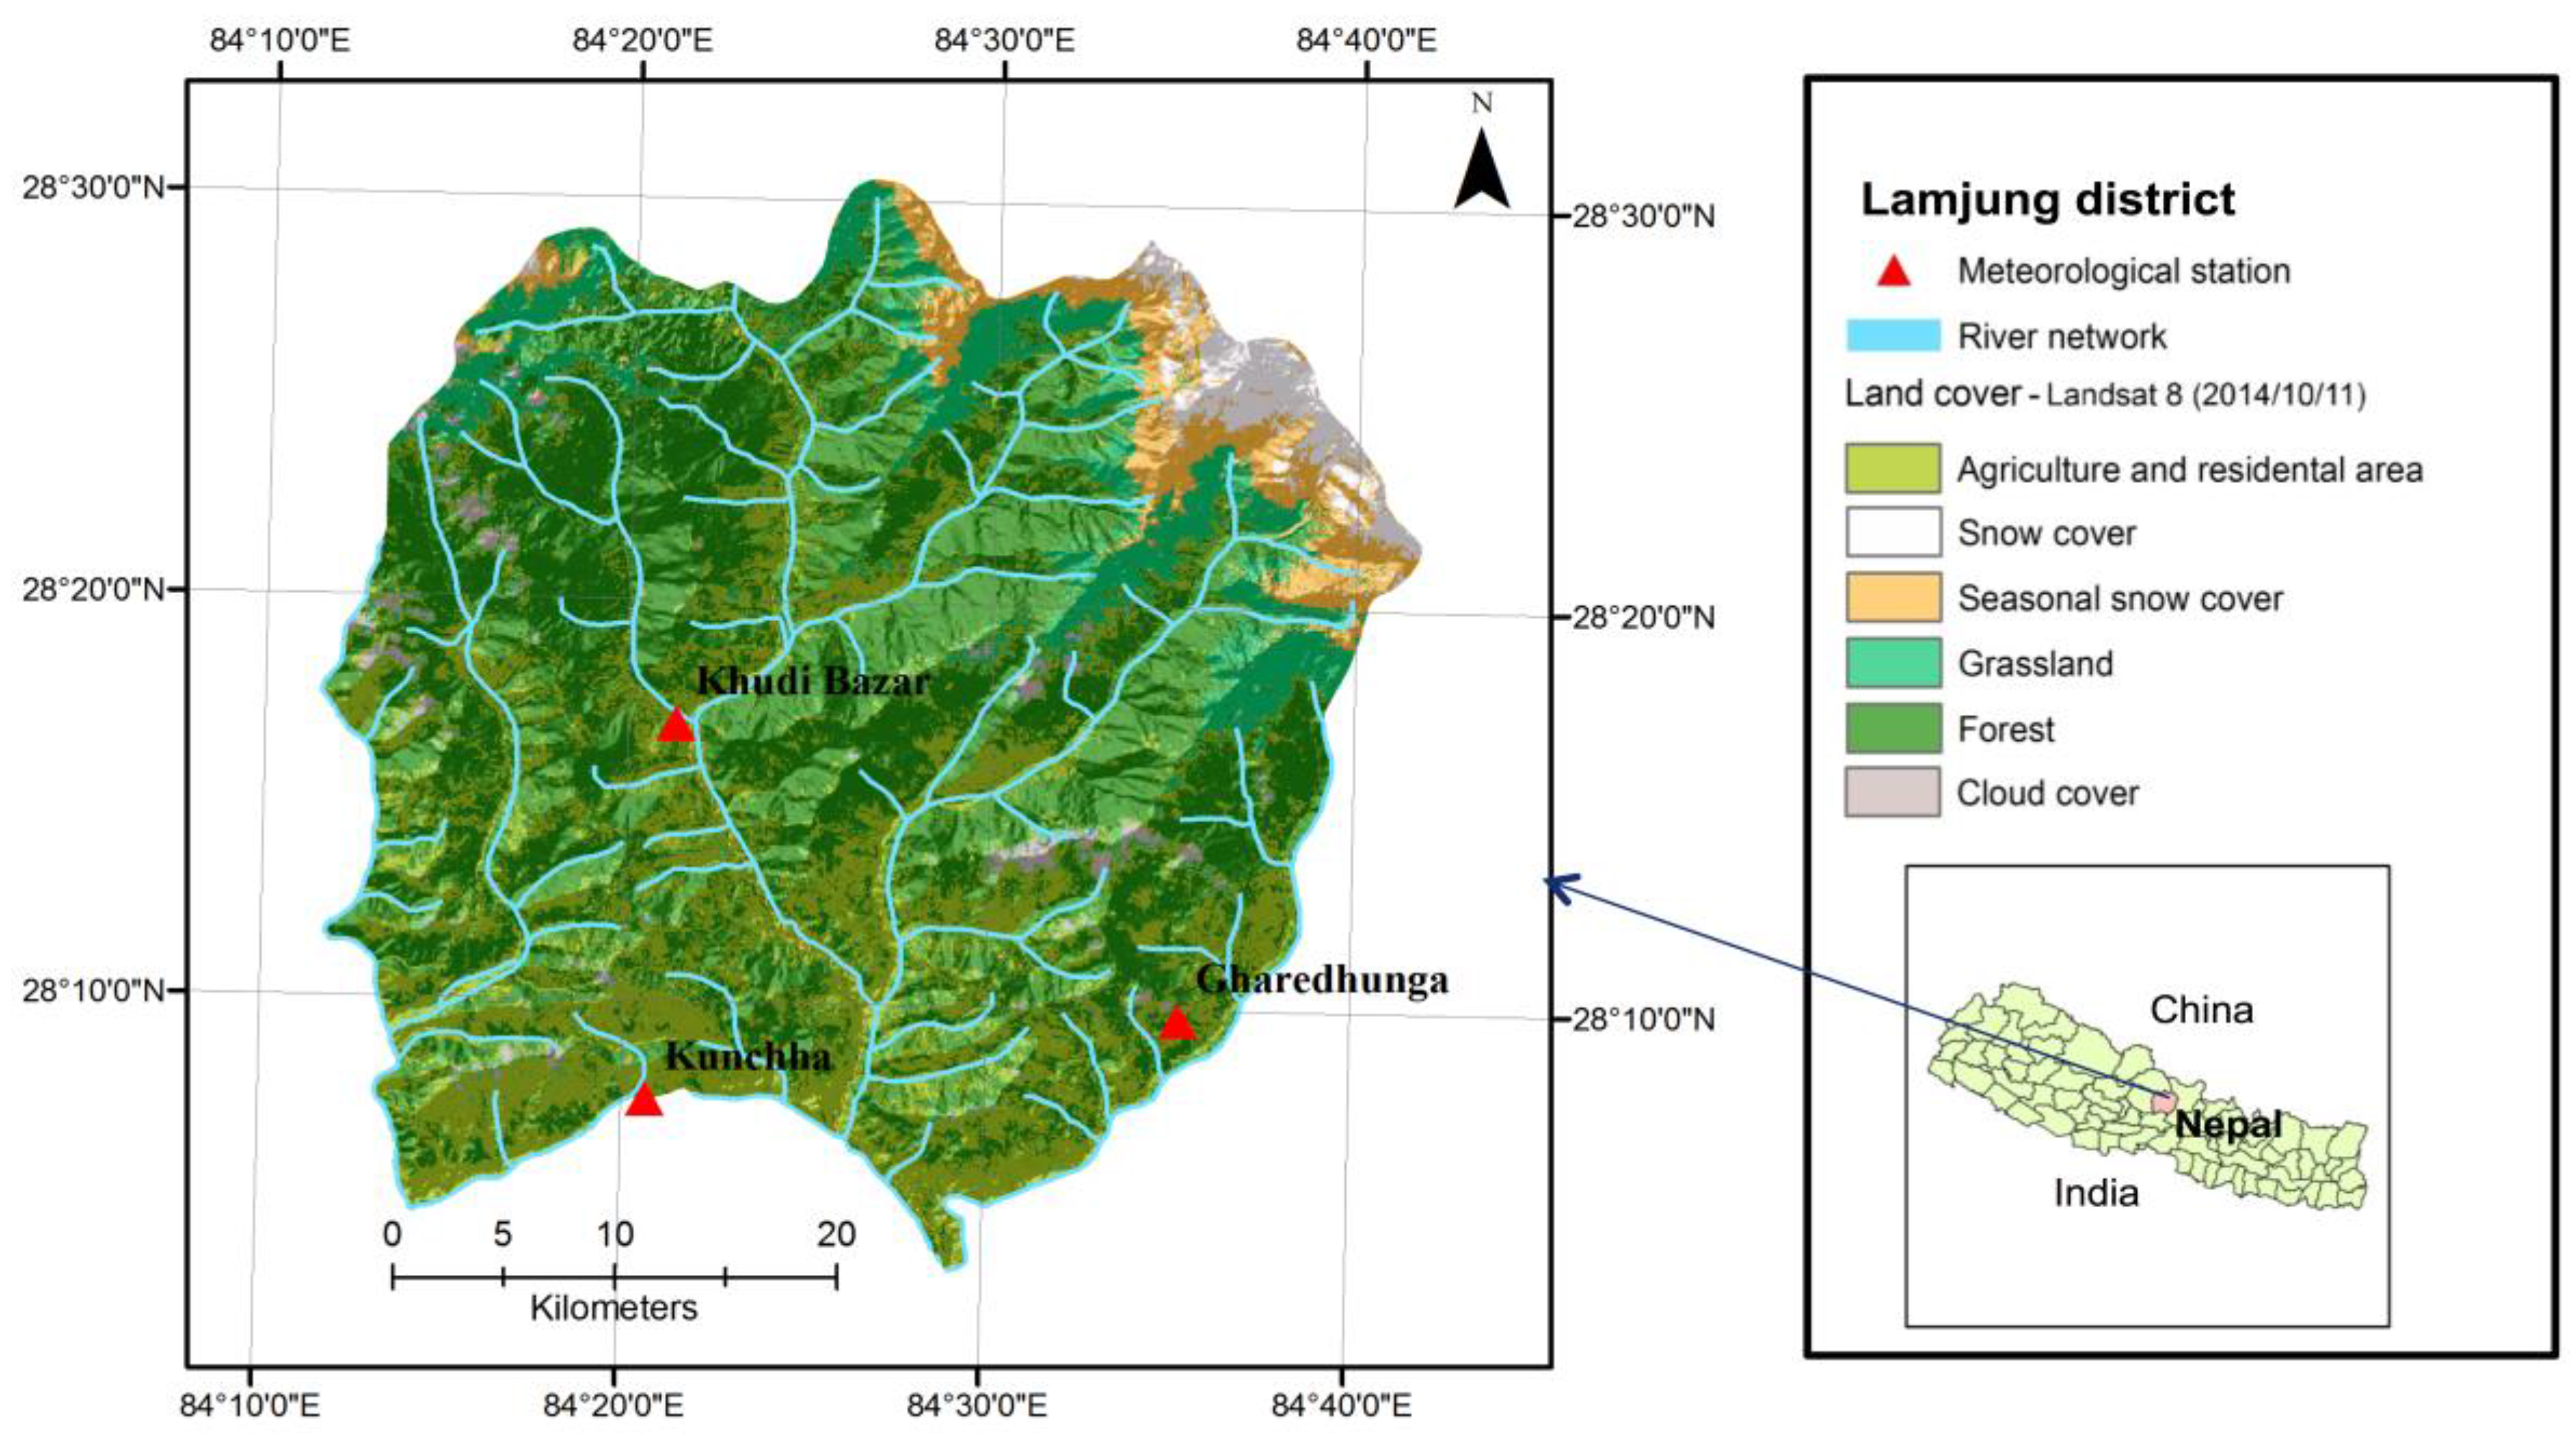
Lamjung district is located in the western mountainous region of Nepal (Figure 1). It is situated between 27°55’N and 28°25’N latitude and 85°00’E and 85°50’E longitude, and its elevation varies from 596 meters to 7893 meters above sea level. It has an area of 1692 km2 and a population of 167,724.
Due to the heterogeneous topography and elevation variations, the temperature and precipitation varies seasonally and spatially. The summer (June–August) maximum temperature in the lower part of the district can reach 40 °C or higher, whereas the minimum temperature during winter is below freezing in most of the area. The distribution of precipitation also depends on the spatial location and time of the year. The monsoon contributes approximately 80% of the annual precipitation during the summer season, and westerly winds deliver winter (December–February) precipitation. Precipitation is in the form of rain in the lower-elevation regions and falls as snow in the higher-elevation regions, though there is no clear separation line due to the seasonal variations in temperature. During the other two seasons, autumn (September–November) and spring (March–May), the region receives occasional precipitation. These precipitation events are often in the form of hailstorms or snowstorms. It is reported that there is less snowfall during winter, and heavy and unpredictable snow or hail in early spring [5]. Most importantly, Lamjung district is one of the most vulnerable districts (due to climate change) among the 75 districts in Nepal [26]. Over the last two decades, long-term dry spells and unpredictable rainfall were observed several times in Lamjung district [27].
Broadly, five types of land cover patterns are found in Lamjung. The land cover map developed from Landsat images taken in 2014 is presented in Figure 1.

3. Data and Method

3.1. Data

The research primarily depends on datasets that were obtained from several government departments and local agencies. Similarly, key informant interviews (KIIs) were conducted with local people and relevant government and non-governmental organizations regarding climate change and impacts on crop yield in Lamjung.

3.1.1. Climatic Datasets

Data from one meteorological and two rainfall stations are available in Lamjung. The meteorological station records the daily maximum temperature, minimum temperature, and accumulated precipitation; the rainfall stations also record daily-accumulated precipitation. All the data were available from 1980 to 2012. These datasets were obtained from the Department of Hydrology and Meteorology of the Government of Nepal. The summary of the climatic datasets is depicted in Table 1.

3.1.2. Agricultural Datasets

Five major crops—rice, maize, millet, wheat and barley—were selected for this study because these crops contribute more than 80% of the total grain production in Lamjung. These data were obtained from the Ministry of Agricultural Development, Nepal. They collected the data from the District Agriculture Development Office Lamjung, Nepal. The crop cultivation, growth and harvesting periods presented in Table 2 were provided by the [28].

3.1.3. Key Informant Interviews

The field survey in Lamjung was conducted through KIIs. Each KII was designed to collect qualitative information on the community`s perception of climate change and experience of extreme weather events, such as erratic rainfall, floods, droughts, landslides, and so on. It was conducted with a selected representative from the Nepal Agriculture Research Council (NARC), District Agriculture Development Offices, Ministry of Agricultural Development, Department of Hydrology and Meteorology, non-governmental organizations, local leaders, women’s groups, and farmer groups.

3.2. Trend Analysis

The seasonal and annual trends were analyzed for the following climate variables:
  • Temperature (seasonal and annual maximum and minimum at Khudi station).
  • Precipitation (seasonal and annual accumulated quantities at Gharedhunga, Khudi, and Kunchha stations).
  • Yield of rice, maize, millet, wheat and barley.
The existence of positive or negative trends among all the considered variables was determined using nonparametric trend test methods. The Mann–Kendall trend test is a nonparametric rank-based procedure, robust against the influence of extremes. In particular, this technique can be adopted in cases with non-normally distributed time series data, that is, data containing outliers and nonlinear trends [29,30]. A Mann-Kendall test with a 90% confidence limit was used as a monotonic trend test. In the testing process, the null hypothesis (H0) is that there is no trend in the population from which the dataset is drawn. The alternate hypothesis (H1) is that there is a trend in the population. The H0 will be rejected if p ≤ 0.1.
Similarly, the trend was quantified using Sen’s slope method. Sen’s slope is another index to quantify the trend using the nonparametric procedure developed by Sen [31]. The slope is computed using Equation (1).
Q i = x j x k j k  for  i = 1 , 2 , 3 , … , N
where xj and xk are data values at time j and k (j > k), respectively. The median of these N values of Qi is Sen’s estimator of slope. If N is odd, then Sen’s estimator is computed by Qmed = Q (N + 1)/2, and if N is even, the Sen’s estimator is computed by Qmed = [QN/2+ Q (N + 2)/2]/2. Finally, Qmed is tested by a two-sided test at a 100% (1 – α) confidence interval, and the true slope is obtained.

3.3. Climate-Crop Yield Relationship

Correlation coefficient and multivariate regression analyses have been performed to determine the climate-crop yield relationship using the Statistical Package for Social Sciences (SPSS). The Pearson’s correlation coefficient was used to measure the strength of the association between crop yield and climatic variability. This produced a linear association. The range of correlation coefficients is −1 to +1. The complete dependency between two variables is expressed by either −1 or +1, and 0 represents the complete independency of the variables. The calculation of the correlation coefficient is performed using Equation (2), in which x represents the independent variable and y represents the dependent variable.
r = Σ ( x x ) ( y y ) Σ ( x x ) 2   ( y y ) 2 ]
Multivariate regression analysis of climate anomalies and crop yield anomalies has been performed to confirm the percentage of the response variable variation from the predictor variable that is explained by a linear model in Equation (3):
ΔY = constant+(α × ΔPpt) + (β × ΔTempmin) + (γ × ΔTempmax)
where ΔY is the observed change in the yield due to temperature and precipitation in the same season as crop growth and α, β, and γ are coefficients of the precipitation, minimum temperature and maximum temperature during the season, respectively. Similarly, Δppt, ΔTempmin, ΔTempmax are the observed changes in precipitation and minimum and maximum temperatures of the seasons, respectively, during the study period.

4. Results and Analysis

The seasonal and annual trend analysis of accumulated precipitation and seasonal and annual maximum and minimum temperatures have been analyzed using Sen’s Slope and Man-Kendall methods. Similarly, trend analysis of the crop yield and the relationship with the climatic variables has been performed. Regression analysis was carried out between annual crop yield anomalies and climate anomalies. The detrended time series data for seasonal maximum temperature, seasonal minimum temperature and seasonal precipitation for respective crop cultivation seasons were considered the explanatory variables, and detrended crop yield was considered the dependent variable.

4.1. Precipitation Trend

The total annual precipitation from 1980 to 2012 for three stations was analyzed using the Mann–Kendall and Sen’s slope tests. The total annual precipitation at the Kunchha and Gharedhunga stations increased by 10.48 mm/year and 4.42 mm/year, respectively, whereas at the Khudi station, it decreased by 3.47 mm/year (Figure 2). Table 3 depicts the Sen’s slope value of seasonal precipitation for all three stations in Lamjung. The result is somewhat similar to the results obtained in the Kaligandai basin, the basin next to Lamjung [5]. Additionally, several other studies have revealed that the precipitation trend in Nepal varies due to the interaction of heterogeneous topography with the monsoon and westerly wind systems [32].
Precipitation exhibited an increasing trend during summer at all three stations, a decreasing trend during winter, and mixed trends during the spring and autumn. The negative trend results in December precipitation were significant (p < 0.1), reflecting the changes in the winter precipitation (see Figure 3).

4.2. Temperature Trend

The minimum and maximum values of the seasonal and annual temperatures of Khudi station have been analyzed in this study. The widely used nonparametric method (Man–Kendall test) was adopted to determine the significance of the trend, and it was quantified using Sen’s slope. The overall results are presented in Table 4. The maximum annual temperature increased by 0.02 °C·year−1, whereas the minimum annual temperature increased by 0.07 °C·year−1 between 1980 and 2012. Although both the minimum and maximum temperatures increased, the increasing rate of the minimum temperature was more than three times faster than that of the maximum temperature. The slope of the rate and the value of the change in seasonal and annual maximum and minimum temperatures are shown in Figure 4 and Figure 5, and in Table 4. According to Shrestha [33], the maximum air temperature has increased since 1978, based on an analysis of 49 stations across Nepal from 1971 to 1994. Similarly, Practical Action Nepal [32] found an increasing trend in maximum air temperature across almost the whole country.

4.3. Crop Yield Trends

The yield trend of summer and winter crops, i.e., maize, wheat and barley, showed that the yield of these crops has changed significantly over time (p < 0.05). However, the yield has fluctuated over time. Wheat had the highest regression coefficient versus time. The yield of wheat increased 26.83 kg/ha every year. In contrast, barley decreased (−1.20 kg/ha) every year. Similarly, maize yield increased (p < 0.05) 16 kg/ha every year, whereas rice and millet yield increased 4.71 kg/ha and 0.26 kg/ha every year, but these changes were not significant (p > 0.05) with respect to the time variable. Figure 6 shows the trends and Table 5 indicates the Sen’s slope value of the crop yields in Lamjung.
The pattern of the crop yield in Lamjung appears to be very similar to the pattern throughout the whole country. Pant [34] revealed that the yield of rice, maize and wheat increased by 1.18%, 2.36% and 3.39%, respectively, from 1990 to 2010 all over the country. Similarly, Joshi [35] detected a significant increasing trend for rice, maize and wheat. Hence, the yields of the major crops are increasing in Nepal. In addition to climate change, several influential factors, such as introduction of new seeds and agriculture technology, better irrigation, and better crop management practices, might be responsible for the increased crop yield. Therefore, we have tried to determine the climate-yield relationship and yield variation due to climate change in the following section through correlation and multivariate regression analysis.

4.4. Climate-Crop Yield Relationship

To determine the relationship between climatic variability and major crop yields (kg/ha), a correlation analysis was performed. The results reveal that there was a strong and positive relationship between the climatic variability and the yield of millet and wheat, whereas there were no or negligible relationships between climatic variability and the yields of rice, maize and barley. While testing the effects of seasonal minimum and maximum temperatures, a significant relationship was observed in the yield of millet. There was a strong correlation between millet and the seasonal maximum temperature (r = +0.734), and a normal correlation with minimum temperature (r = +0.336). The yield of millet increases with increasing maximum and minimum temperatures. There was no significant effect of precipitation on the yield of millet (r = +0.069). Similarly, the coefficient of maximum temperature was +0.4023, indicating a positive relationship between the annual maximum temperature and the yield of wheat. The coefficients for minimum temperature and precipitation were +0.2539 and −0.033, respectively. The correlations between the climatic variables and the crop yields are depicted in Figure A1a–e.

4.5. Changes in Yield Due to Climate Trends

To test whether there is a direct relationship between climatic variables and crop yields in Lamjung, a multi-linear regression analysis between anomalies of mean yields for maize, rice, wheat, barley and millet, and precipitation and air temperature during the current climatic conditions (1980 to 2012) was performed. The anomalies of each climatic variable and crop yield were computed using the first-difference time-series, i.e., the difference in values from one year to the next. Figure 7a shows the summer crop yield anomalies, and Figure 7b depicts the winter crop yield anomalies.
A multivariate regression model was used to confirm the impact of climate change on crop yield. The anomalies in climate variables and crop yields can be used to estimate the quantitative relationships between climate change and crop yield. The non-climate influences, such as introduction of agro-technology, better seeds, better crop management practices, use of fertilizer, etc., were omitted when computing the respective anomalies. Linear relationships between detrended crop yield, i.e., yield anomalies in Lamjung, and anomalies in climate variables, such as air temperature and precipitation, were developed to determine the crop yield change due to changes in climate variables during the study period. These relationships were derived as follows:
ΔY = constant + (α × ΔPpt) + (β × ΔTempmin) + (γ × ΔTempmax)
where, ΔY is the observed change in the yield due to temperature and precipitation in the same season as crop growth, and α, β, and γ are the coefficients of precipitation, minimum temperature and maximum temperature in that season, respectively. Similarly, Δppt, ΔTempmin, and ΔTempmax are the observed changes in precipitation and minimum and maximum temperatures of the season, respectively, during the study period.
The multi-linear regression analysis results are shown in Table 6 for rice, maize, wheat, barley and millet. The results suggest that the model is able to describe the variations in the yields of food crops ranging from 37% (0.372) in the case of millet to only 7.8% (0.078) in the case of rice (see Table 6). Though the regression results show very few significant relationships between yield and climate variables, these coefficients can be used to assess the real effects of climate variables in the changes in the food crop yields considered in this study. In addition, the sign of the coefficients indicates the direction of change in the yield versus climate variable changes [36]. In the case of maize yield, climate variables account for only 34.7% of the yield changes, whereas 65.3% of the variation in maize yield is explained by other influential factors, such as better seeds, better crop management practices and introduction of new agro-technology. Similarly, the regression analysis indicates an R-squared value of 0.249, implying that the impact of climate variables accounts for only 24.9% of the wheat yield changes, while 75.1% of the variation in wheat yield is explained by other factors, such as the use of fertilizers, etc. Additionally, only 37.2% of the variations in millet yield are controlled by the climatic variables.
Precipitation in winter was an important factor that can increase yield potential for wheat and barley. Extreme temperatures had adverse effects on the yield, as increases and decreases in the maximum and minimum temperatures have negative impacts. Similarly, summer precipitation had a positive impact on rice, while maize and millet showed negative effects. Therefore, increasing maximum temperature has positive impacts on all summer crops, and decreases in temperature have negative impacts. Increases in temperature up to 2 °C will help to increase the crop production in Nepal [9]. Therefore, the average increase in temperature during the period from 1980 to 2012 of less than 2 °C must have been favorable to the growth and yield of crops.

4.6. Key Informant Interviews

As described in section 3, the KII was employed as one of the methods in this study to collect qualitative data regarding climate change and crop production in Lamjung. The results summarized in this section are based on the responses provided by 16 key informants (two informants from each organization/group). They were the representatives of NARC, District Agriculture Development Offices, Ministry of Agriculture, Department of Hydrology and Meteorology, non-governmental organizations, local leaders, women groups, and farmers groups.

4.6.1. Changes in Temperature

The perception of global warming has been reported based on their experience. The respondents mentioned that both summer and winter seasons are warmer at present and were not as warm 20 years ago. Similarly, the emergence of mosquitoes and pests at the altitude of 2016 MSL (Ghalegaun of Lamjung—a village of nearly 500 households located in the central part of Lamjung) was noted during the survey. The local people accept it as a consequence of the increased temperature.

4.6.2. Changes in Rainfall Pattern, Snowfall and Water Availability

The key informants were asked to provide information on changes in precipitation and water availability compared with the last 20 years. They reported that the precipitation pattern has changed and that they are experiencing untimely and heavy rainfall, winter drought, and other phenomena more frequently than before. In particular, summer rainfall is more intense in comparison to earlier years, and they mentioned that previously there used to be heavy snowfall almost every winter and that the local people in the middle-elevation hill areas used to harvest the snow for use as household water, but now the amount of precipitation has decreased and falls mostly as rain.

4.6.3. Changes in Crop Production

Different opinions were provided by the key informants regarding crop production changes over the last 20 years. Some reported that production has increased significantly in comparison to earlier years, whereas most of them are experiencing more pests and frequent droughts in the middle-elevation hills and floods in the lower regions. Several informants happily explained that they are now able to cultivate some vegetables, such as tomato, chilies and cauliflower, in the middle-elevation hills that were not possible to grow previously.
In summary, a changing trend in climatic variables has been found. Similarly, the timing, intensity and frequency of snowfall and rainfall have also changed over the last 20 years. In the high region of Lamjung, people previously had observed a consistent snow cover during the winter, and the greatest snow accumulation often occurred during January–February. However, currently, the snowfall pattern has changed, and heavy snowfall occurs in the late autumn or early spring, no-snow conditions prevail during winter, and the persistence of the snow has also decreased [5,27]. The duration of summer has increased during this period, and the number of chill days has decreased. Similarly, the occurrence of existing pests and the emergence of new pests and diseases have been observed over the last 20 years. These experiences agree with the results obtained from several studies in the region [37].

5. Discussion

The increasing trend of global warming is more evident in the mountainous areas than in the plains. Climate change is also likely to change the monsoon precipitation patterns in ways that could affect the current agricultural production of Nepal. After analyzing the data from the Lamjung district and conducting KIIs, this study found that there is a changing trend in the climatic variables. Additionally, the intensity and frequency of snowfall and rainfall have decreased in the higher altitudes over the last 20 years. The duration of summer has increased during this period, and the number of cold days has decreased. Similarly, the occurrence of existing pests and the emergence of new pests and diseases have been observed over the same period. These experiences agree with the results obtained from several studies in the region, as discussed in earlier sections.
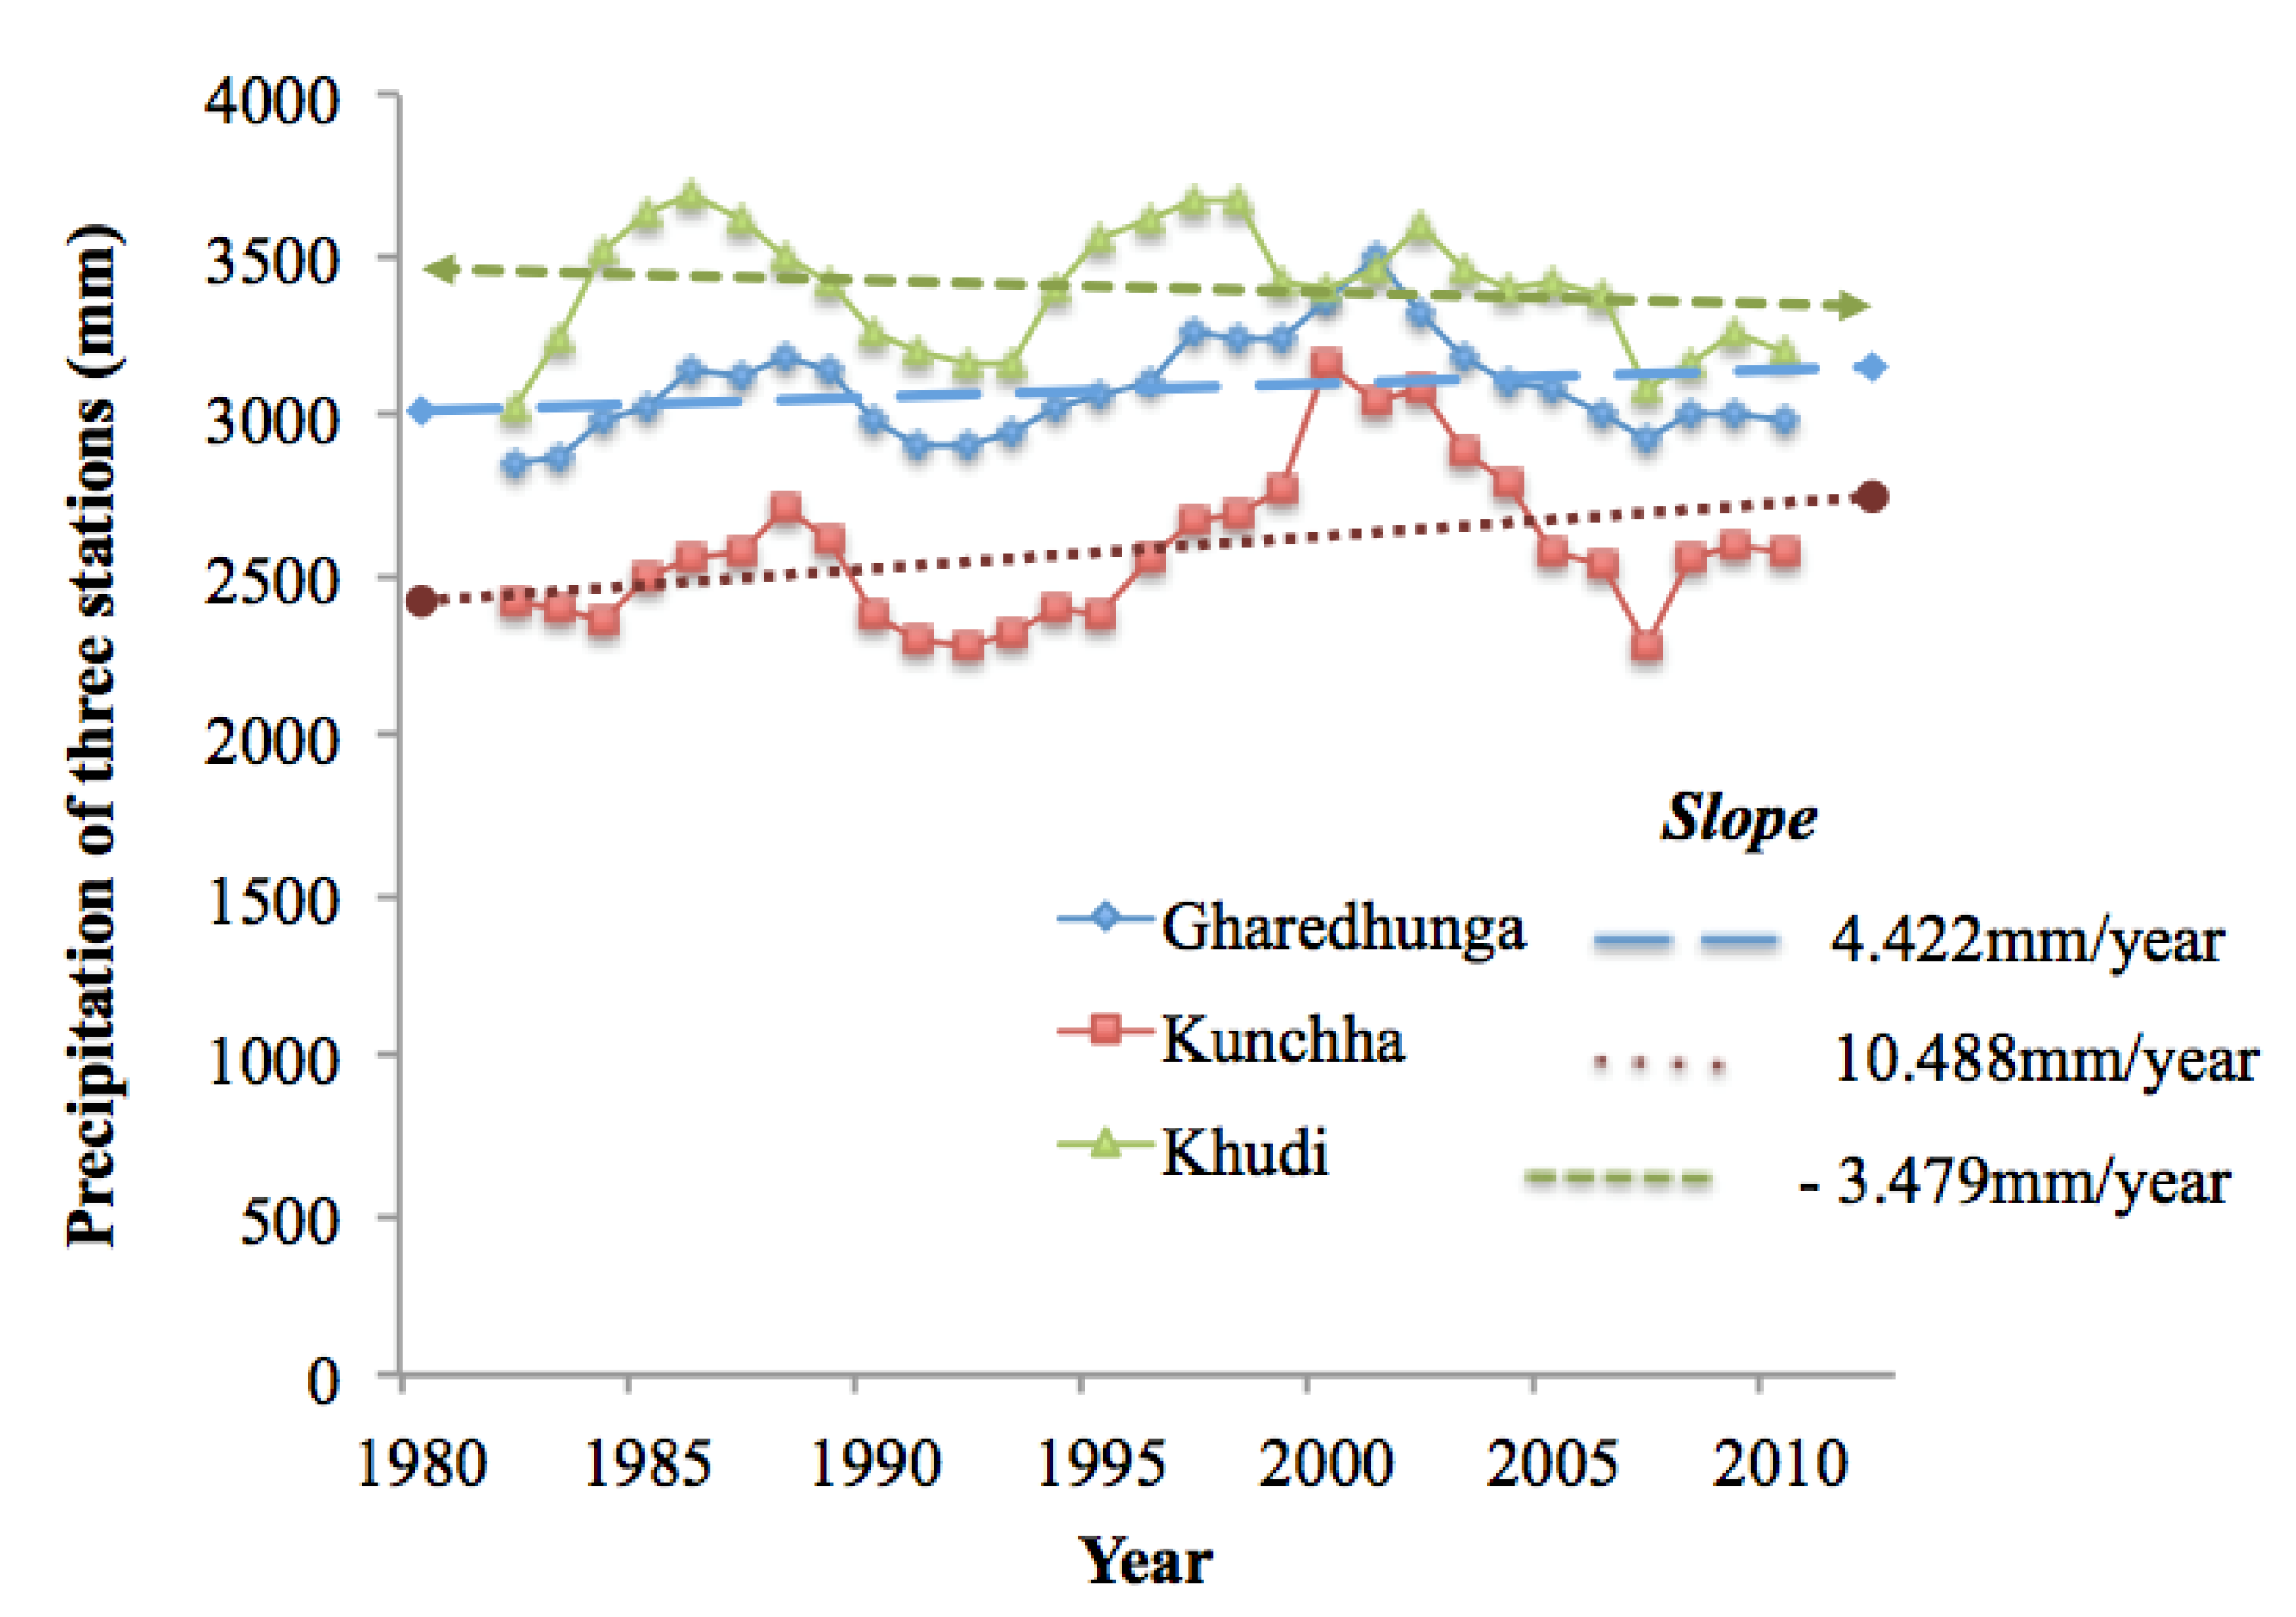
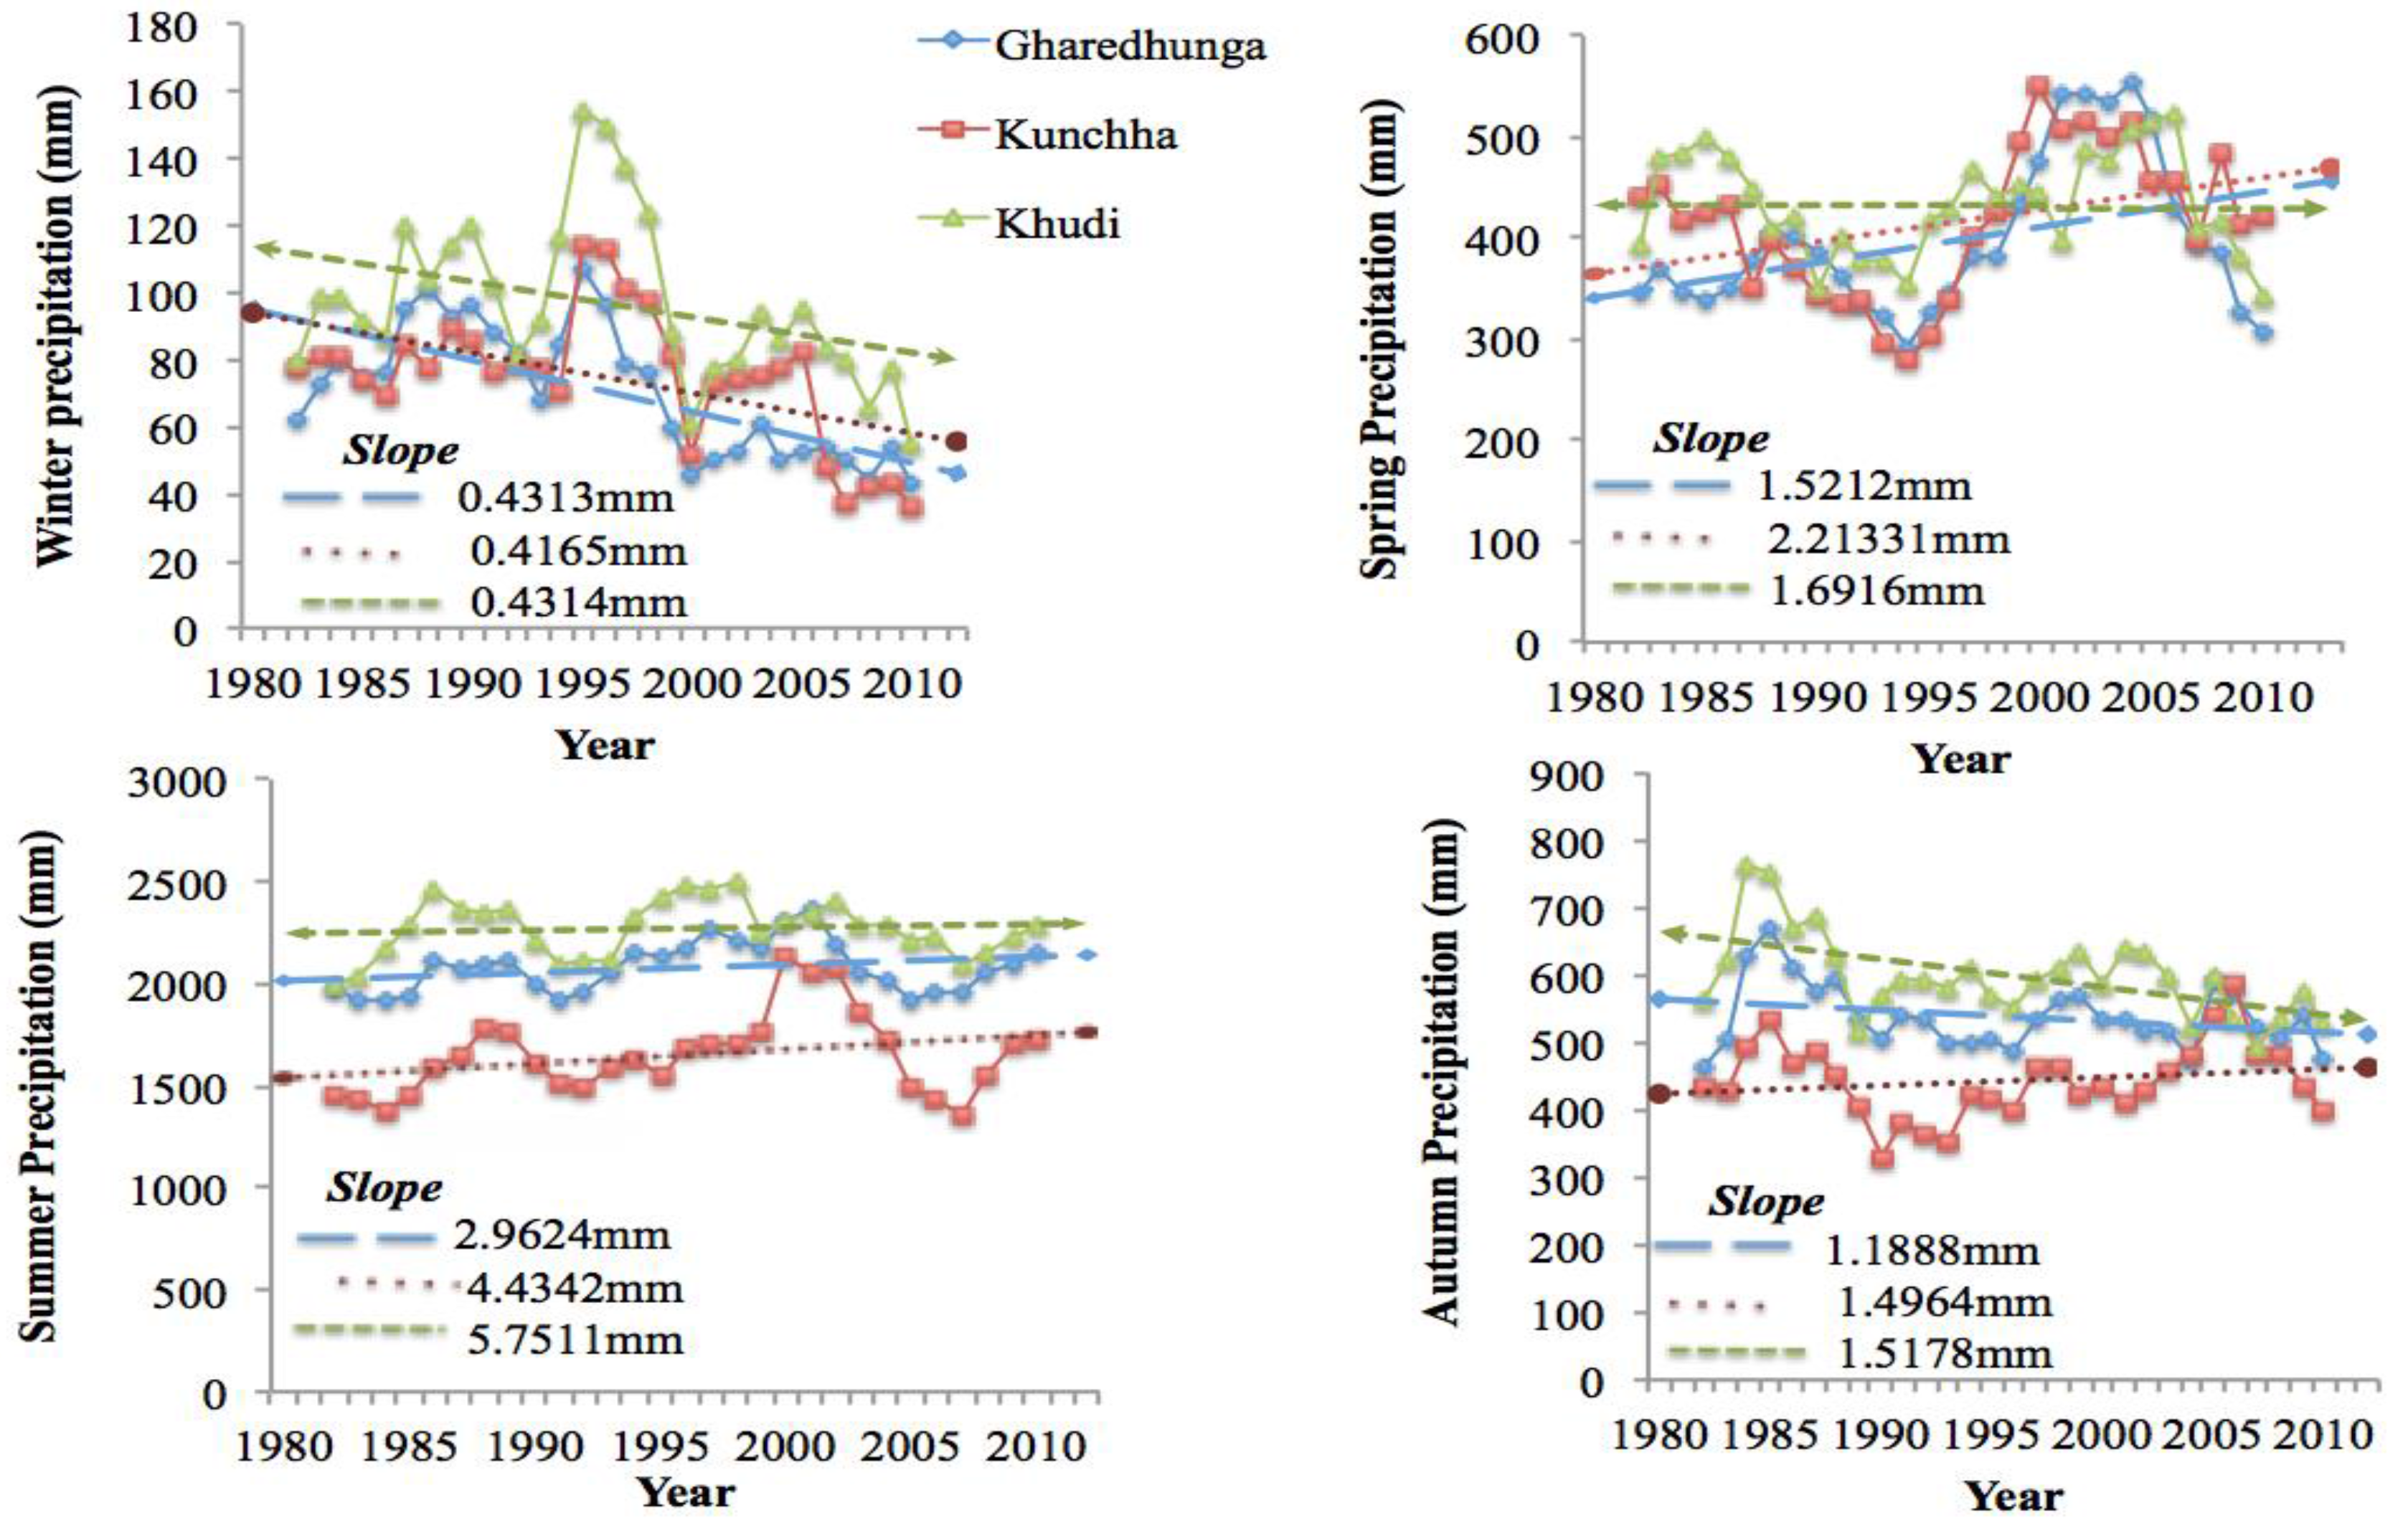
The seasonal precipitation at various stations exhibited variation in trends. The precipitation in Lamjung is concentrated in the summer, with almost 80% of the annual precipitation falling then. The decreasing trend in winter precipitation and the increasing trend in summer precipitation indicate that precipitation in summer is becoming more intense. This could have a negative impact on crops due to water-induced disasters, such as floods and landslides, which eventually affect the crop yields. The total annual precipitation has increased at the Kunchha and Gharedhunga stations, but decreased at the Khudi station. In summary, the annual summer precipitation increased and the winter precipitation decreased in Lamjung. Joshi [
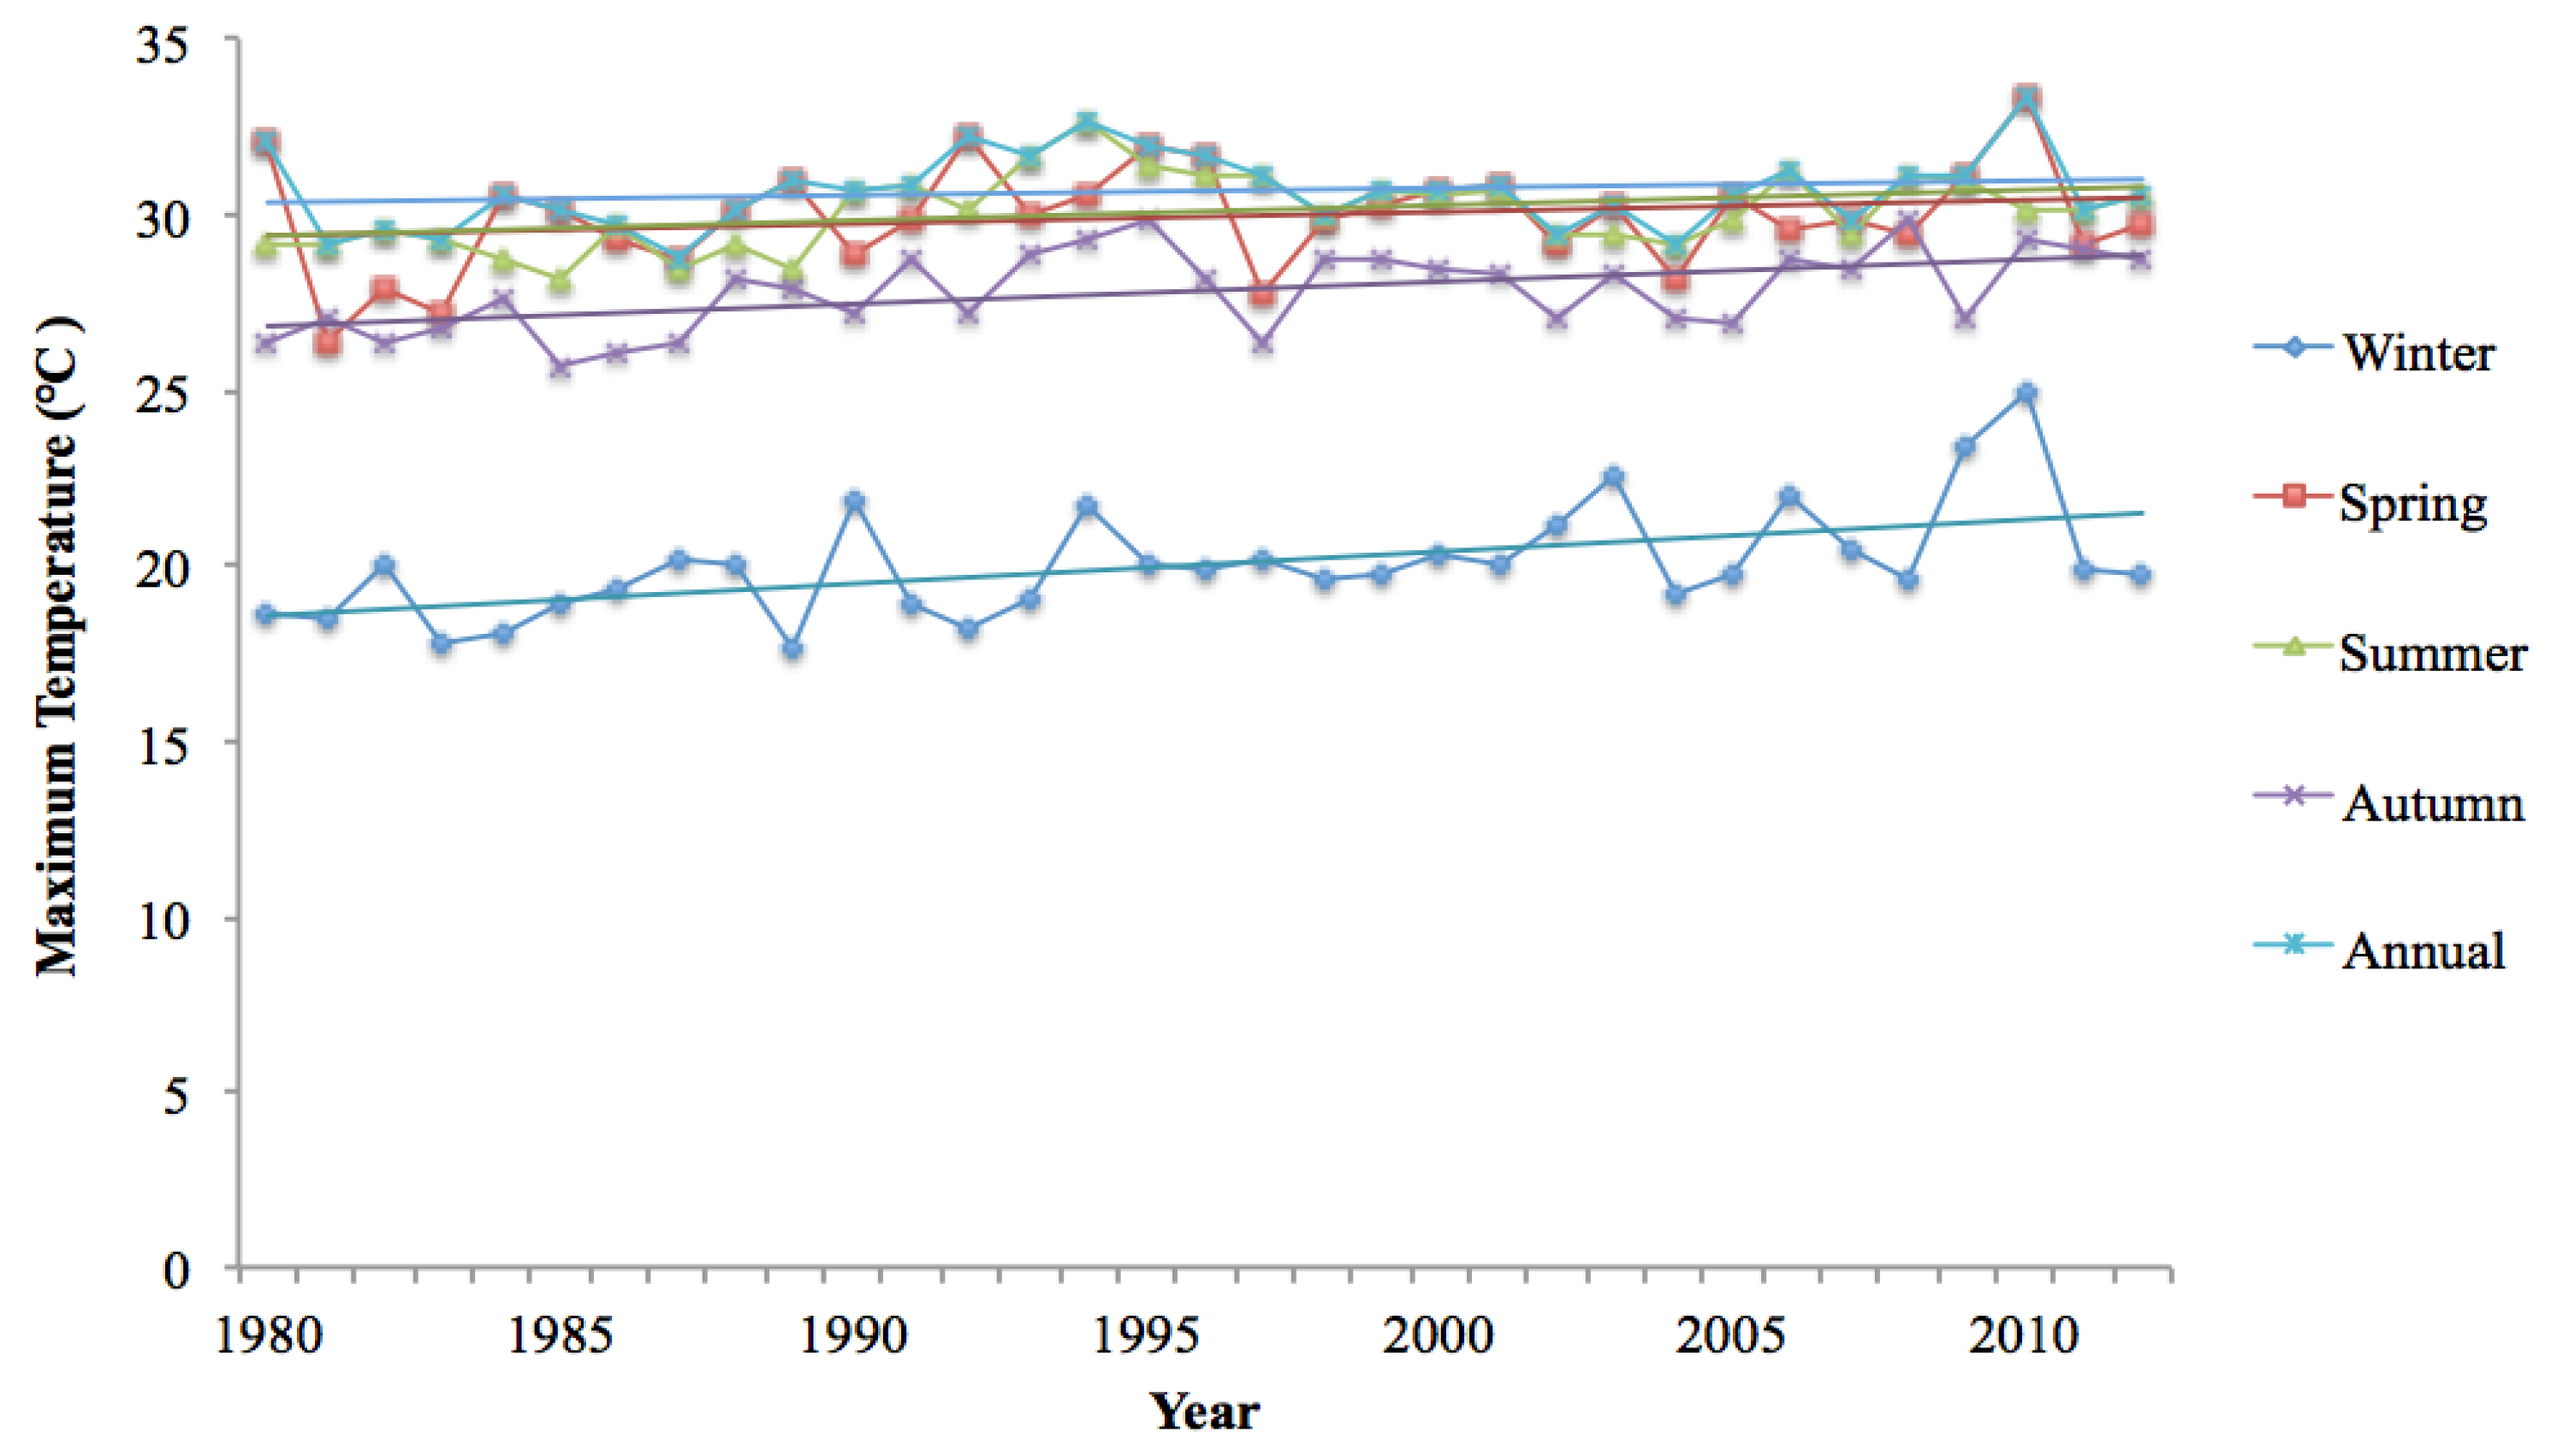
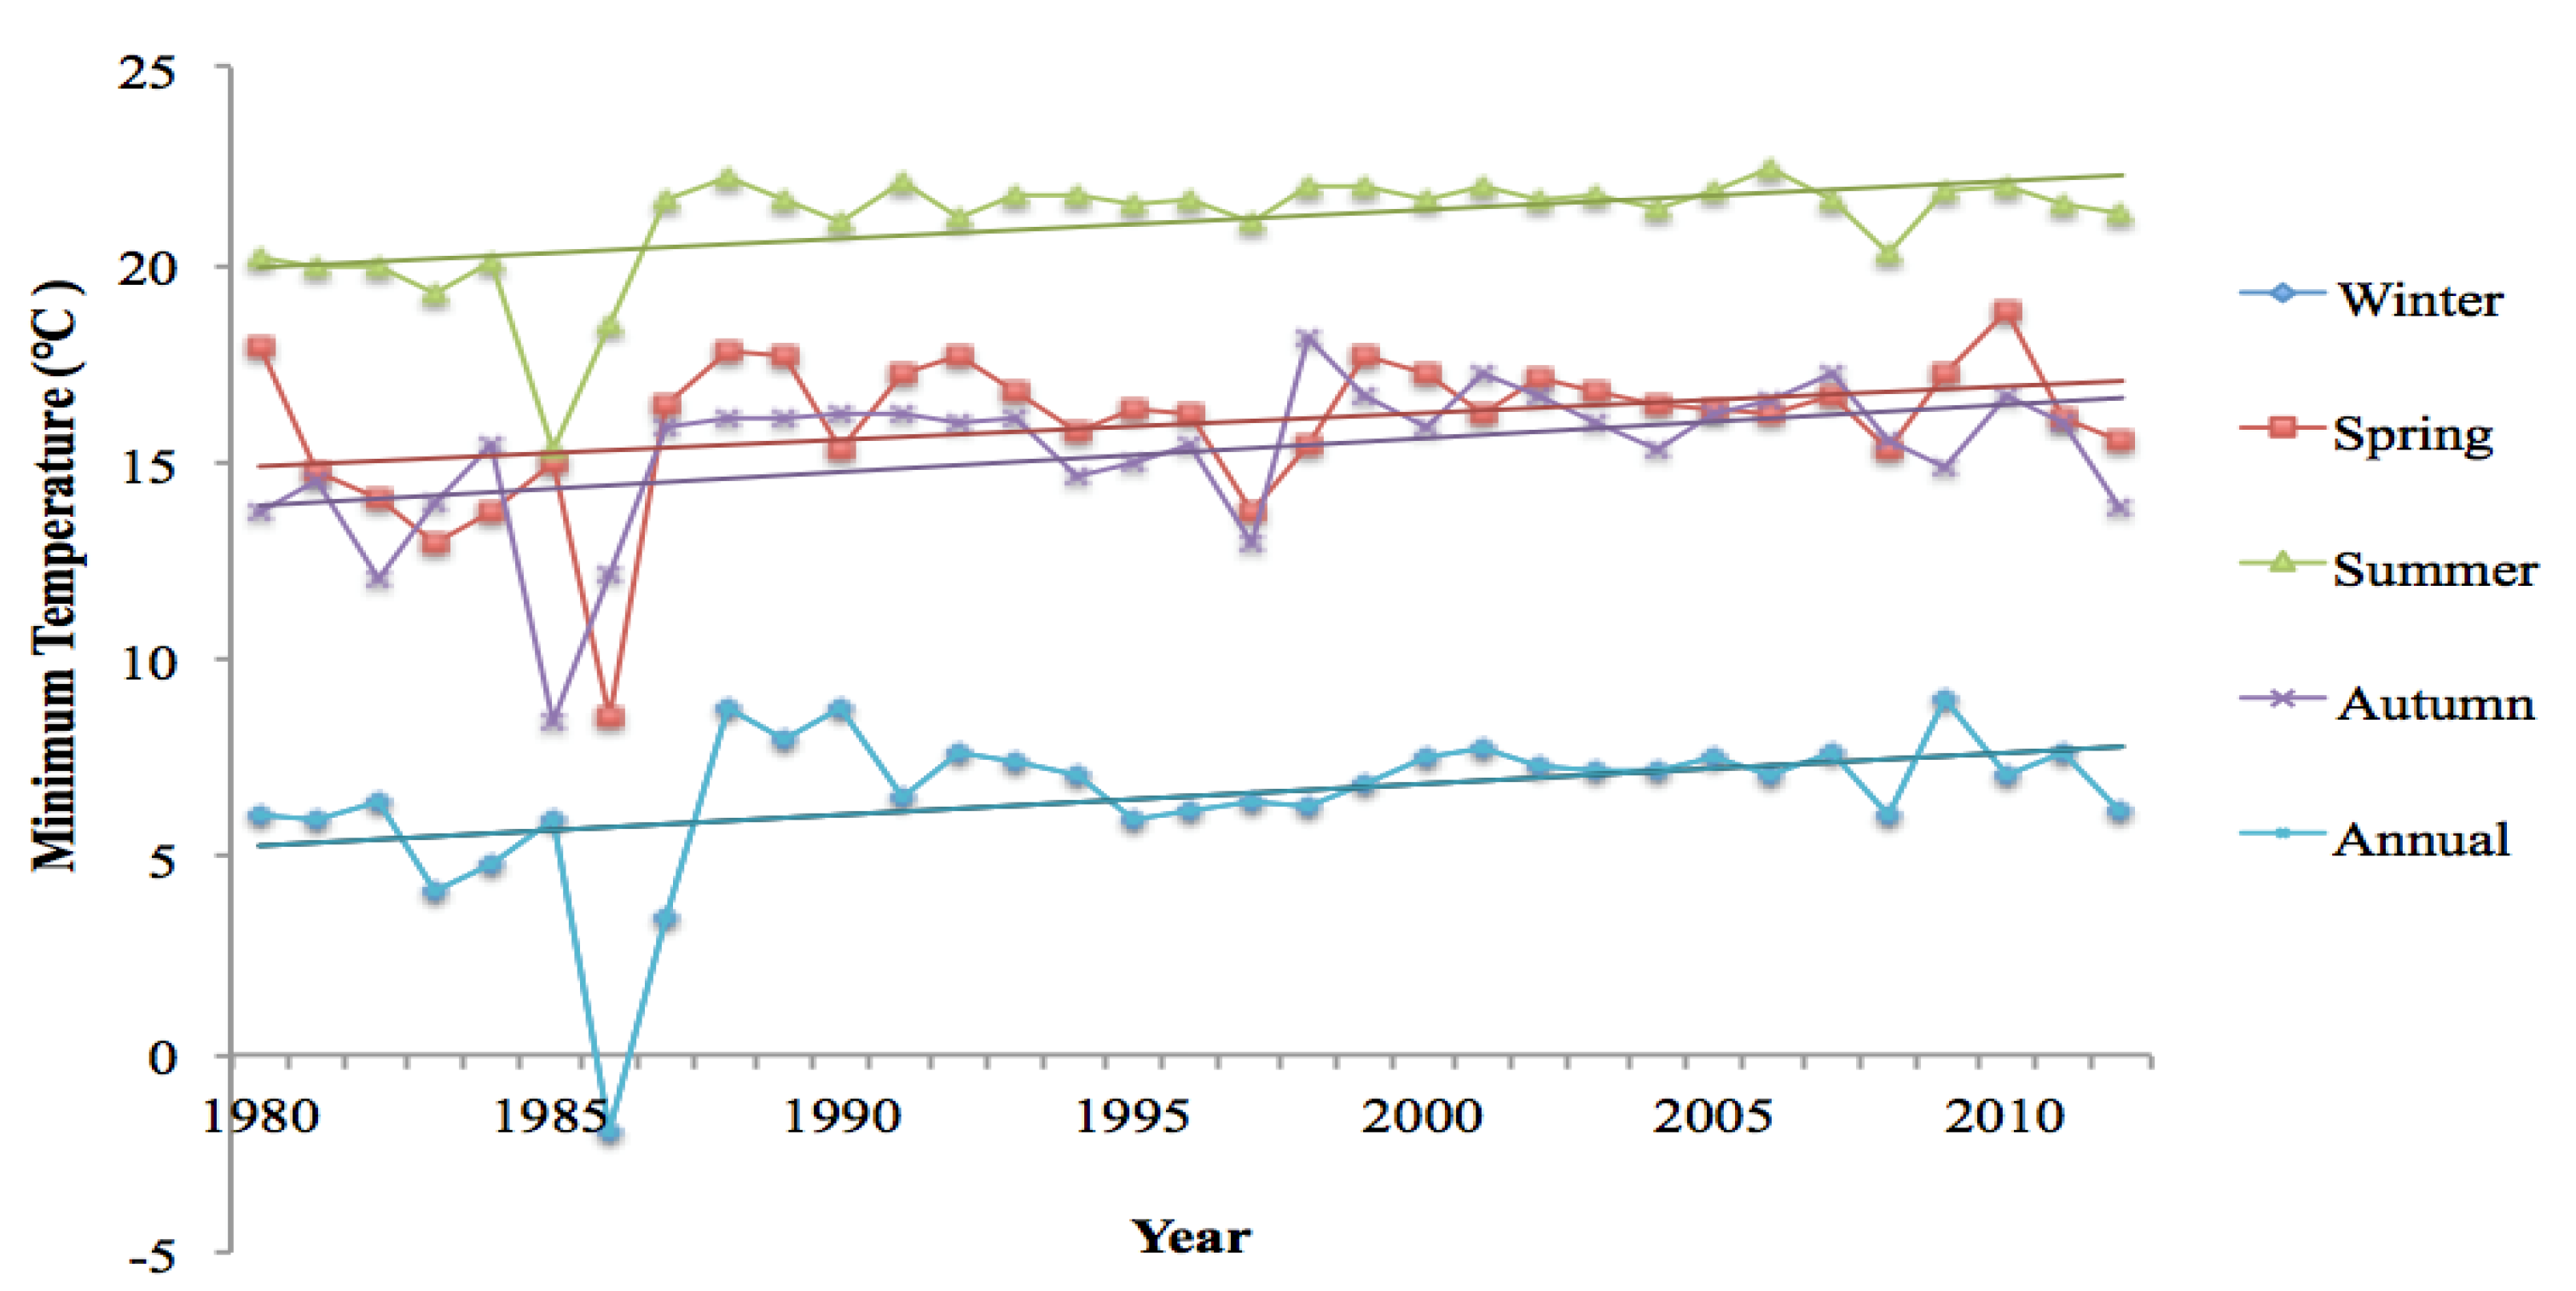
35] also revealed the same trends across Nepal, where summer precipitation increased and winter precipitation decreased from 1978 to 2008. The temperature data recorded at the Khudi station revealed that the maximum annual temperature and minimum annual temperature increased by 0.02 °C·year−1 and 0.07 °C·year−1, respectively, between 1980 and 2012.
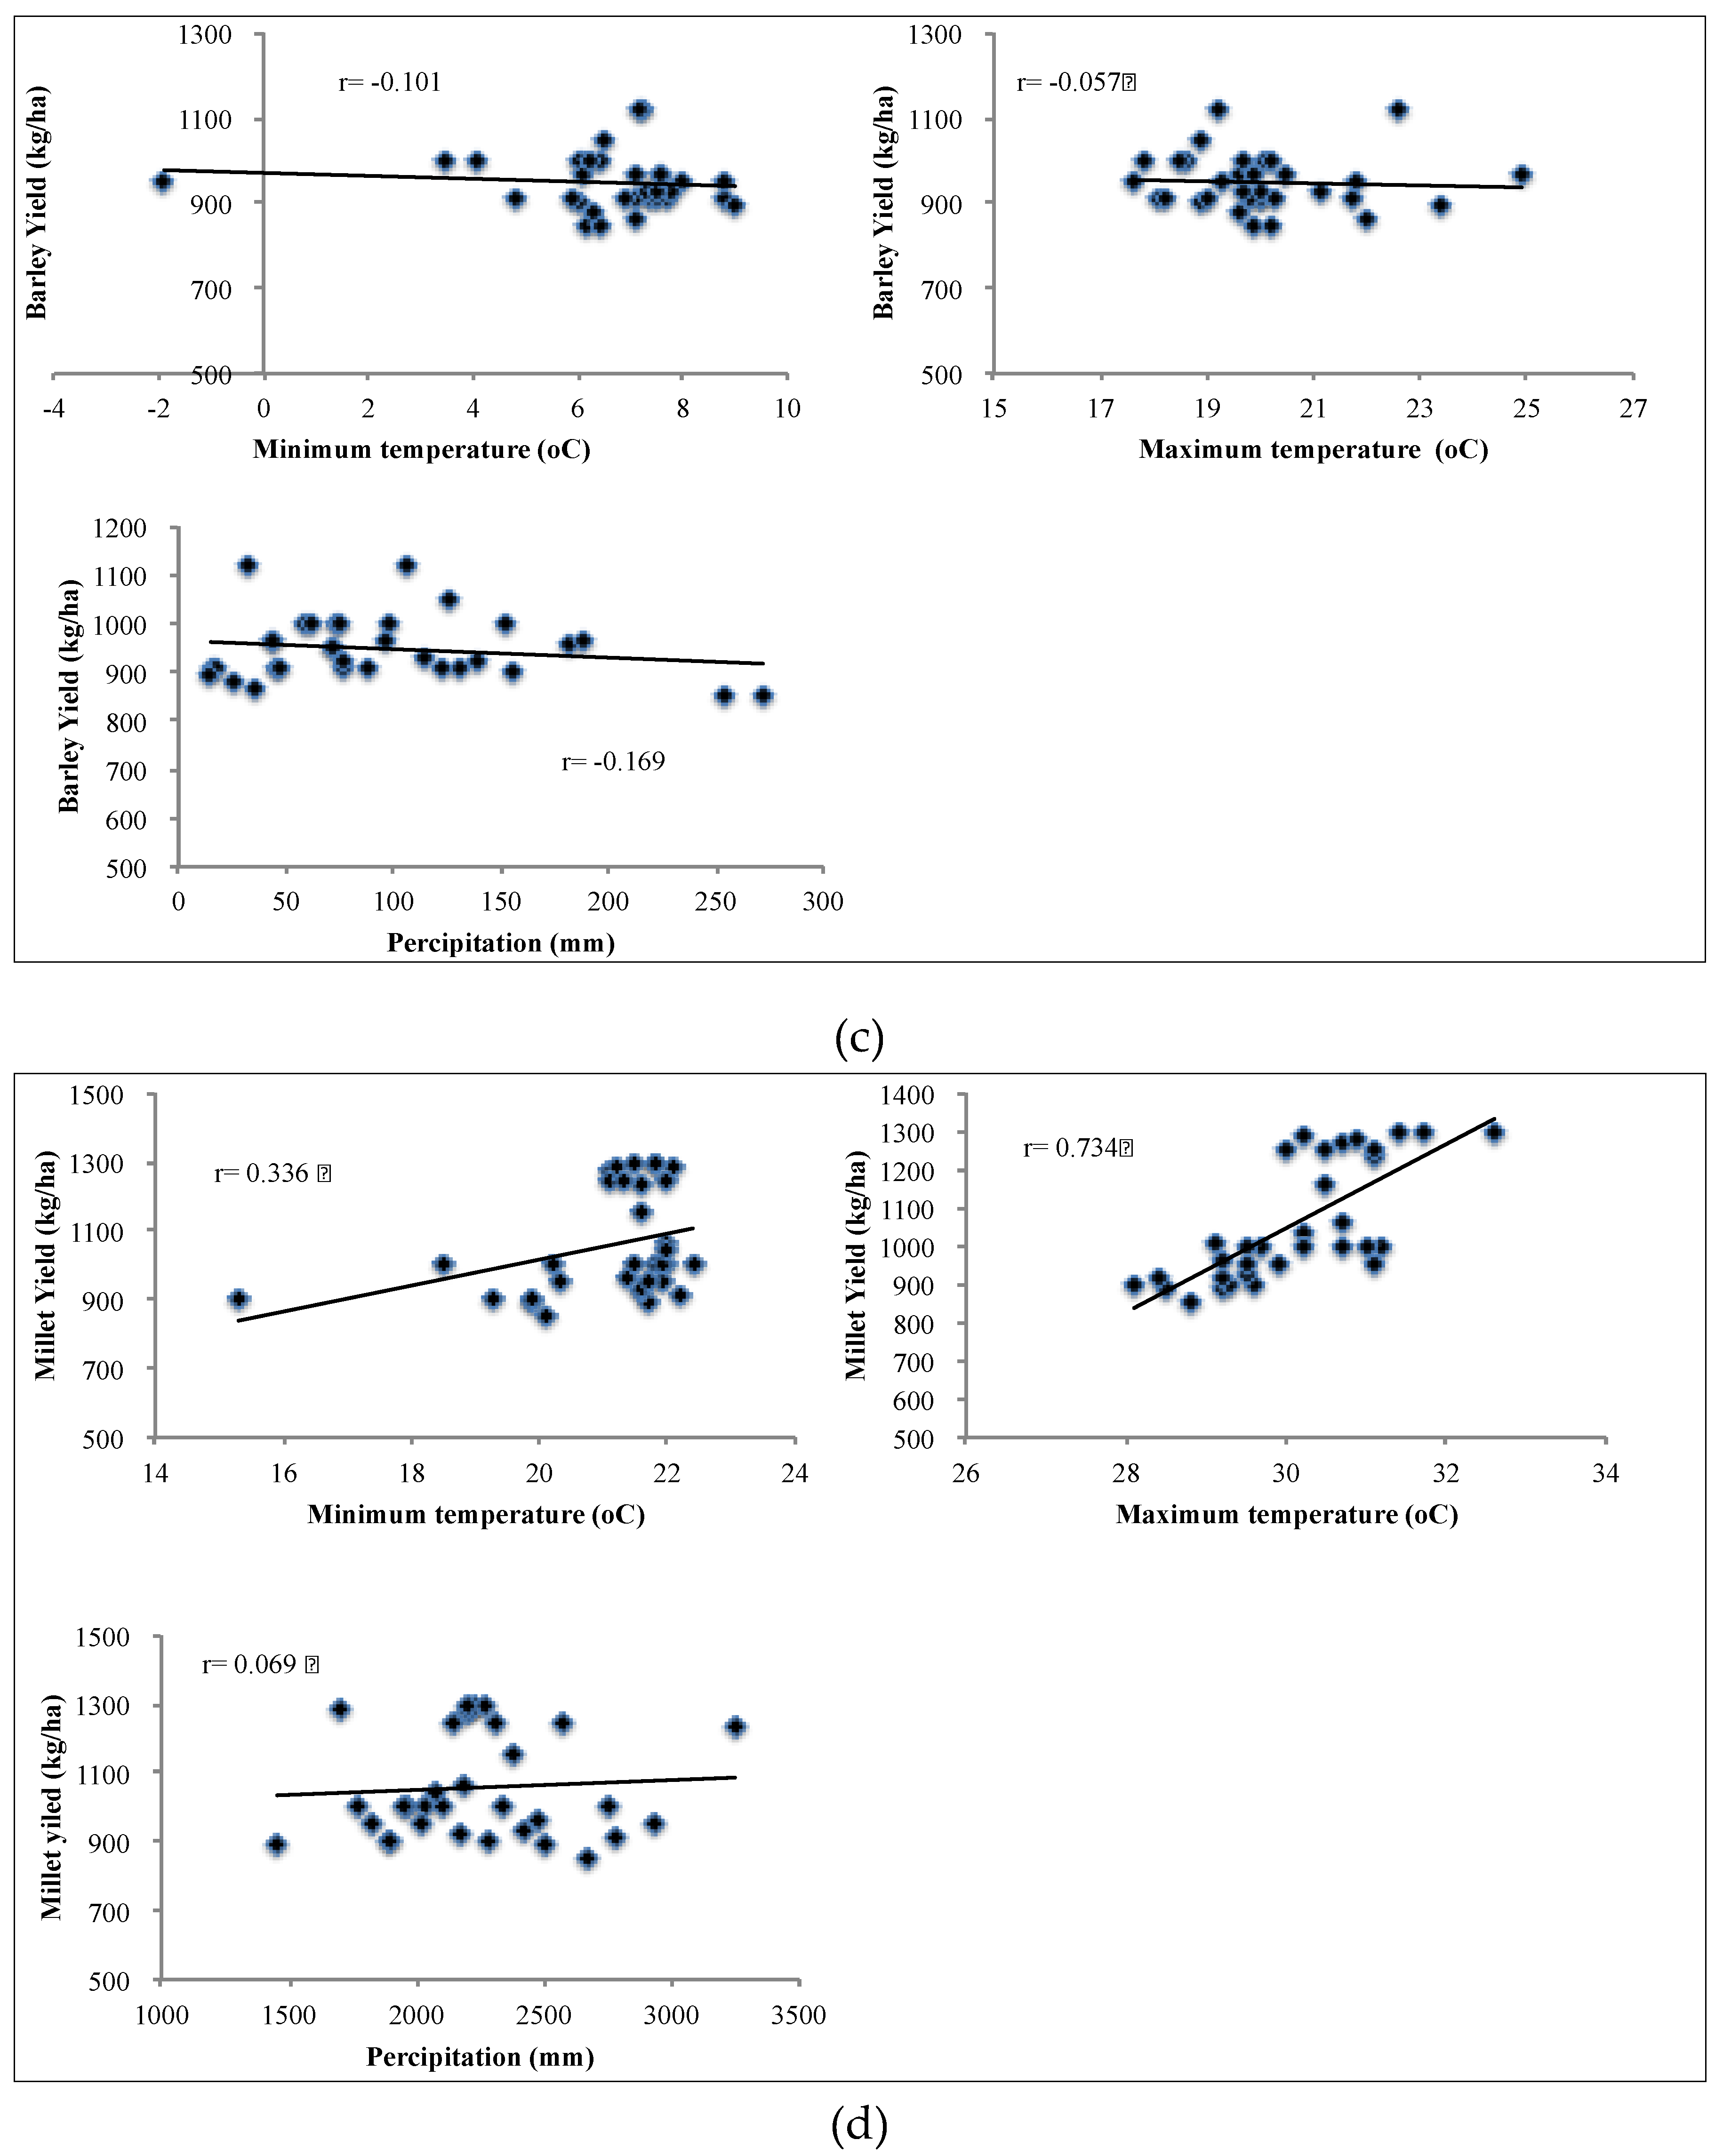
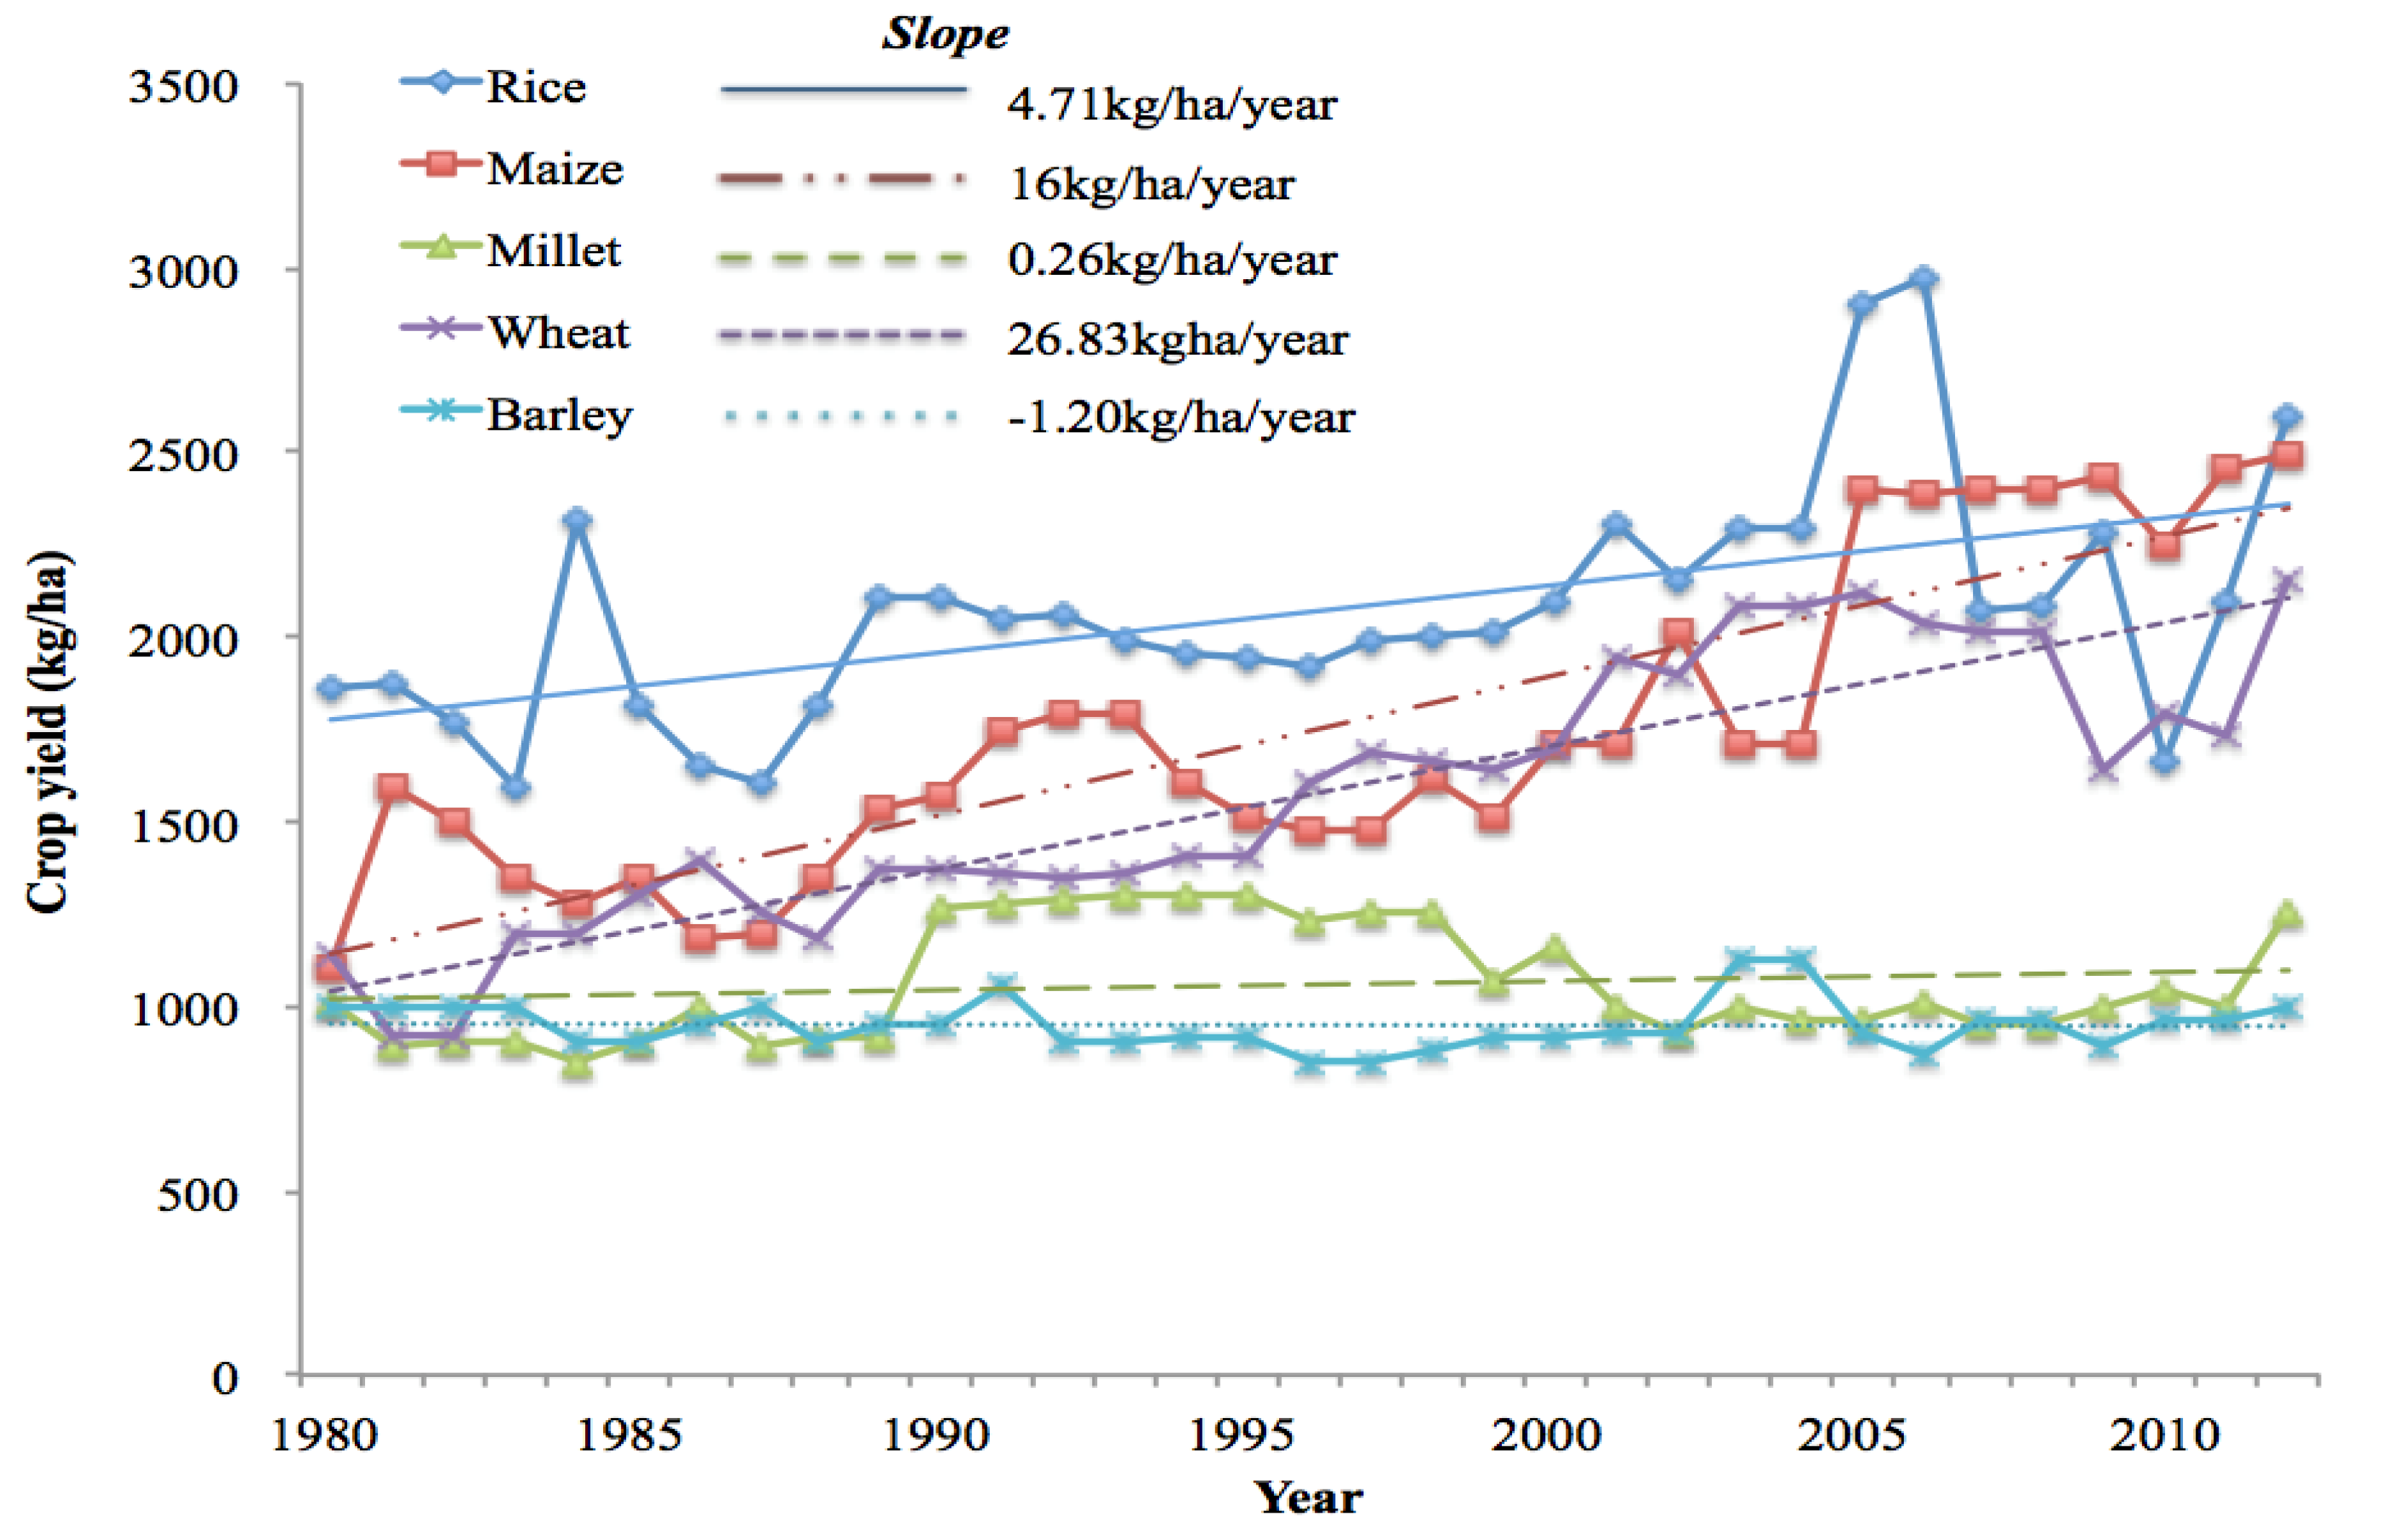
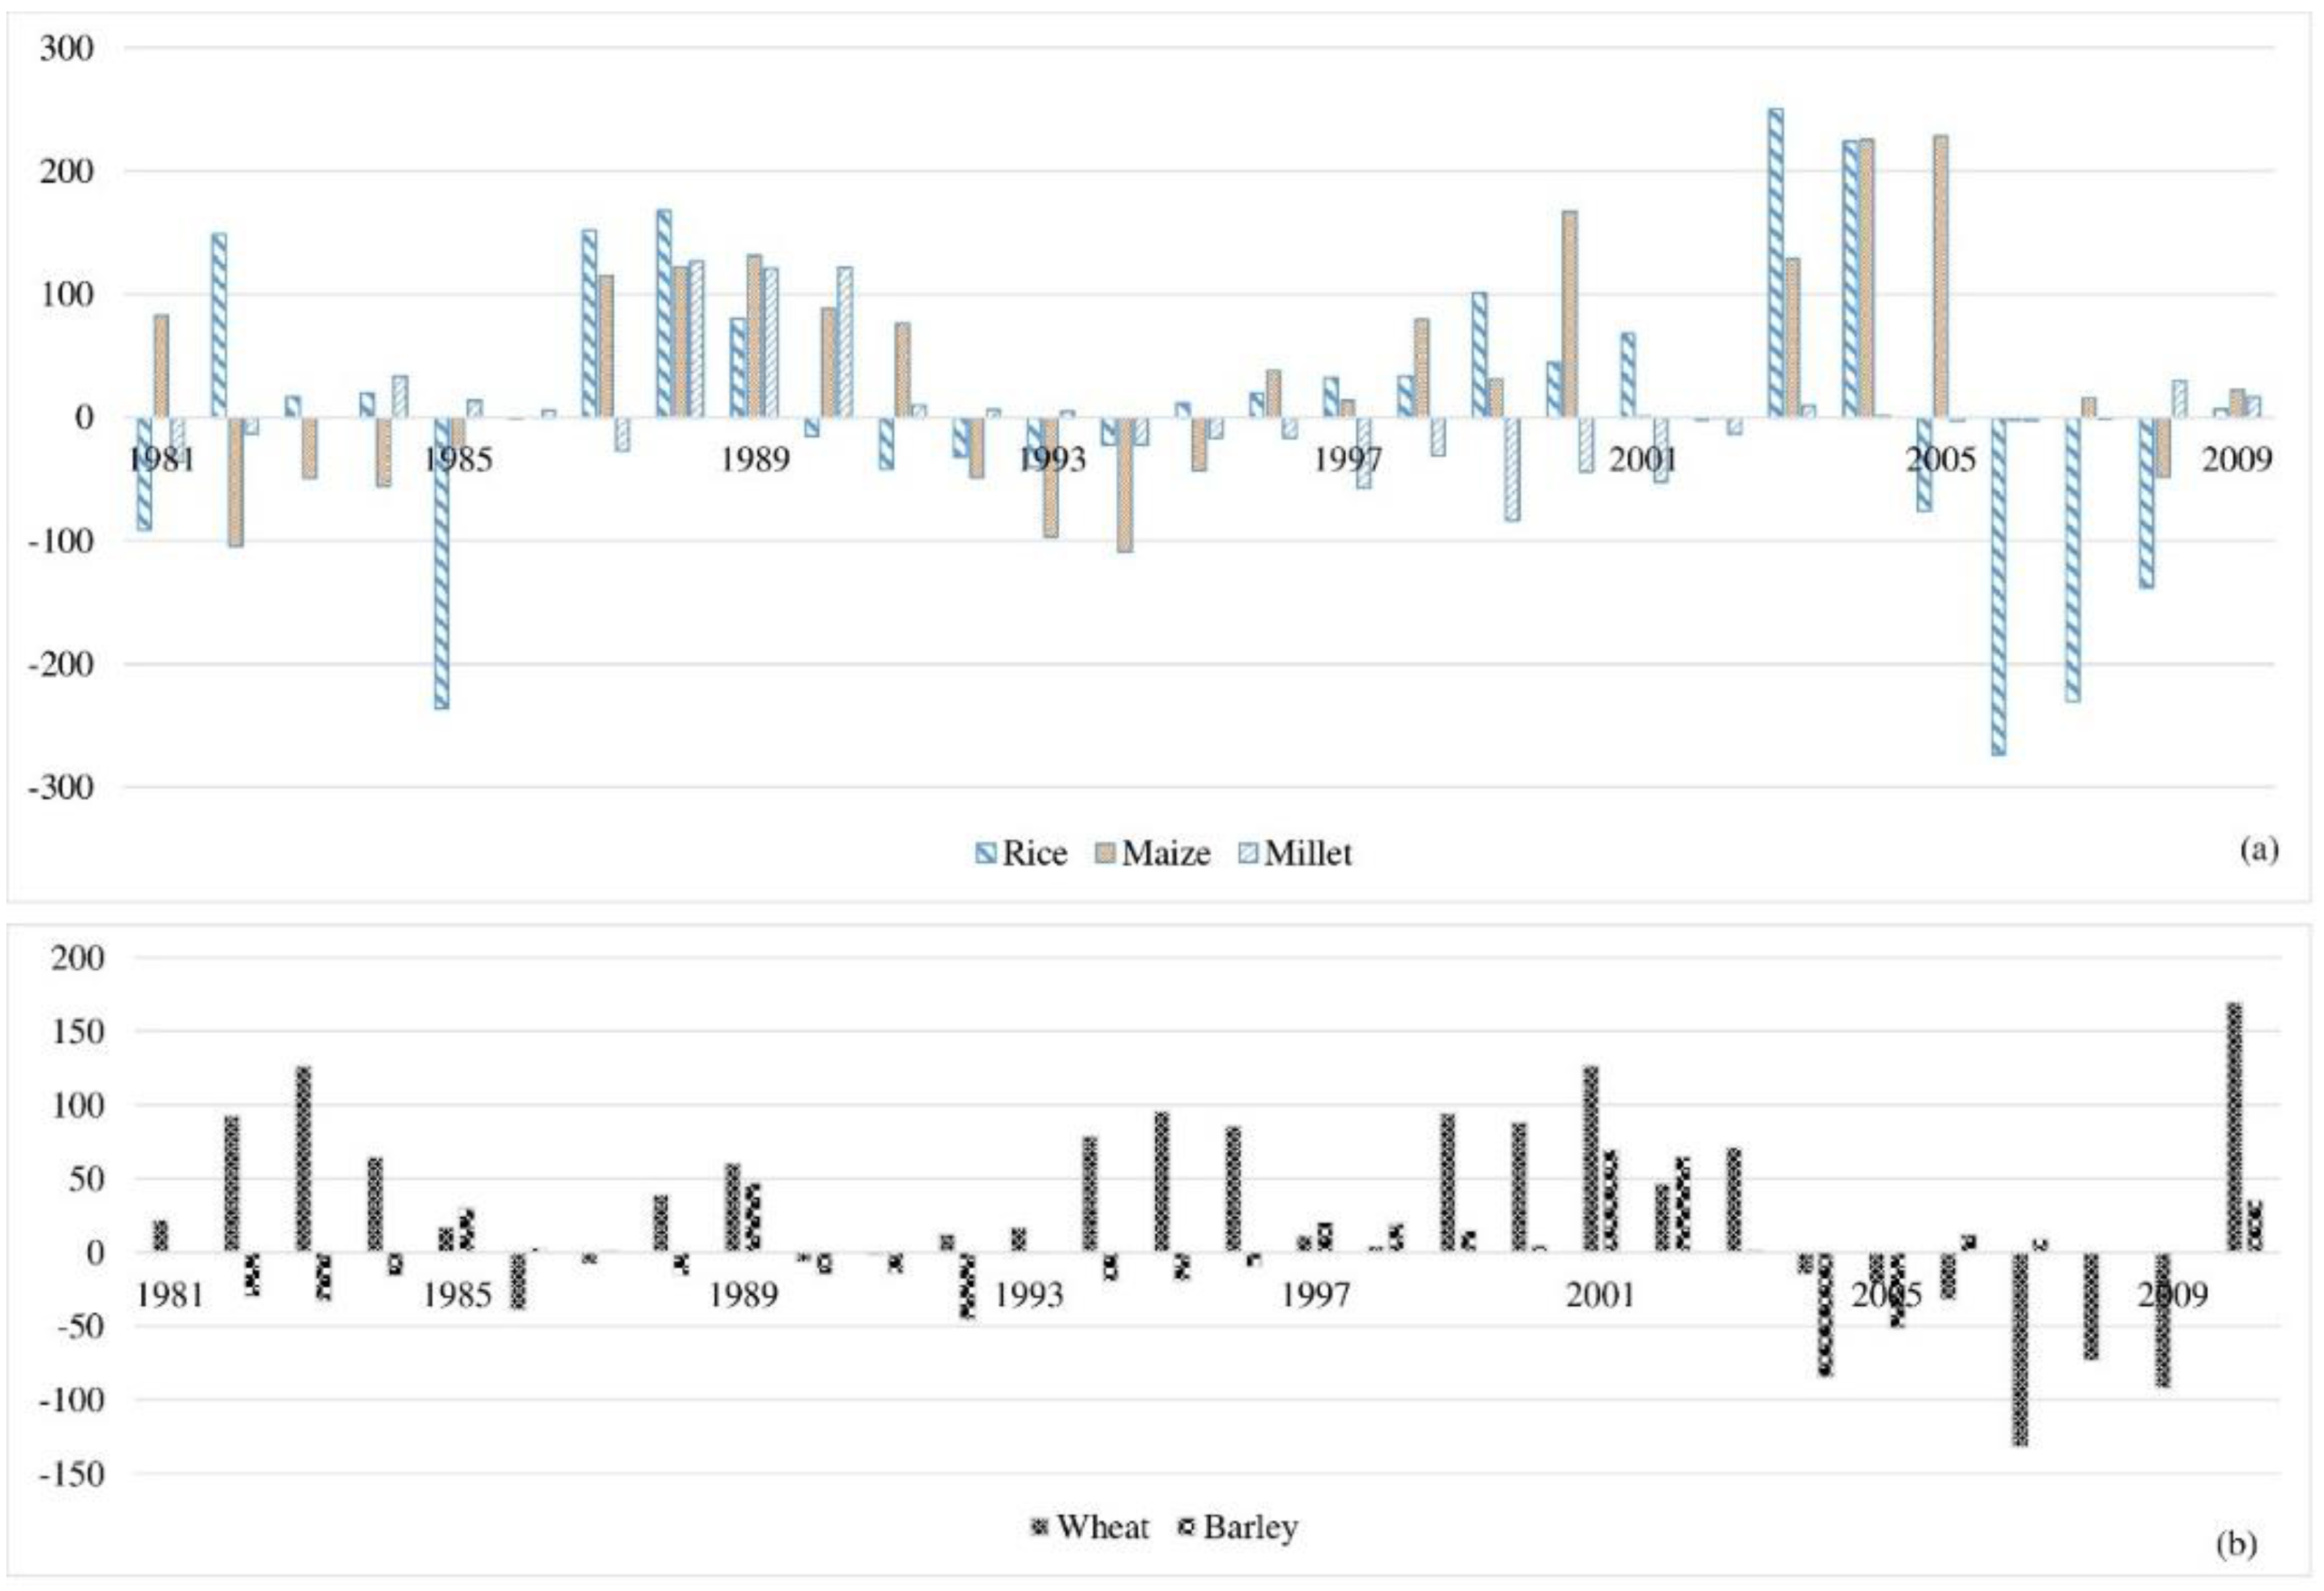
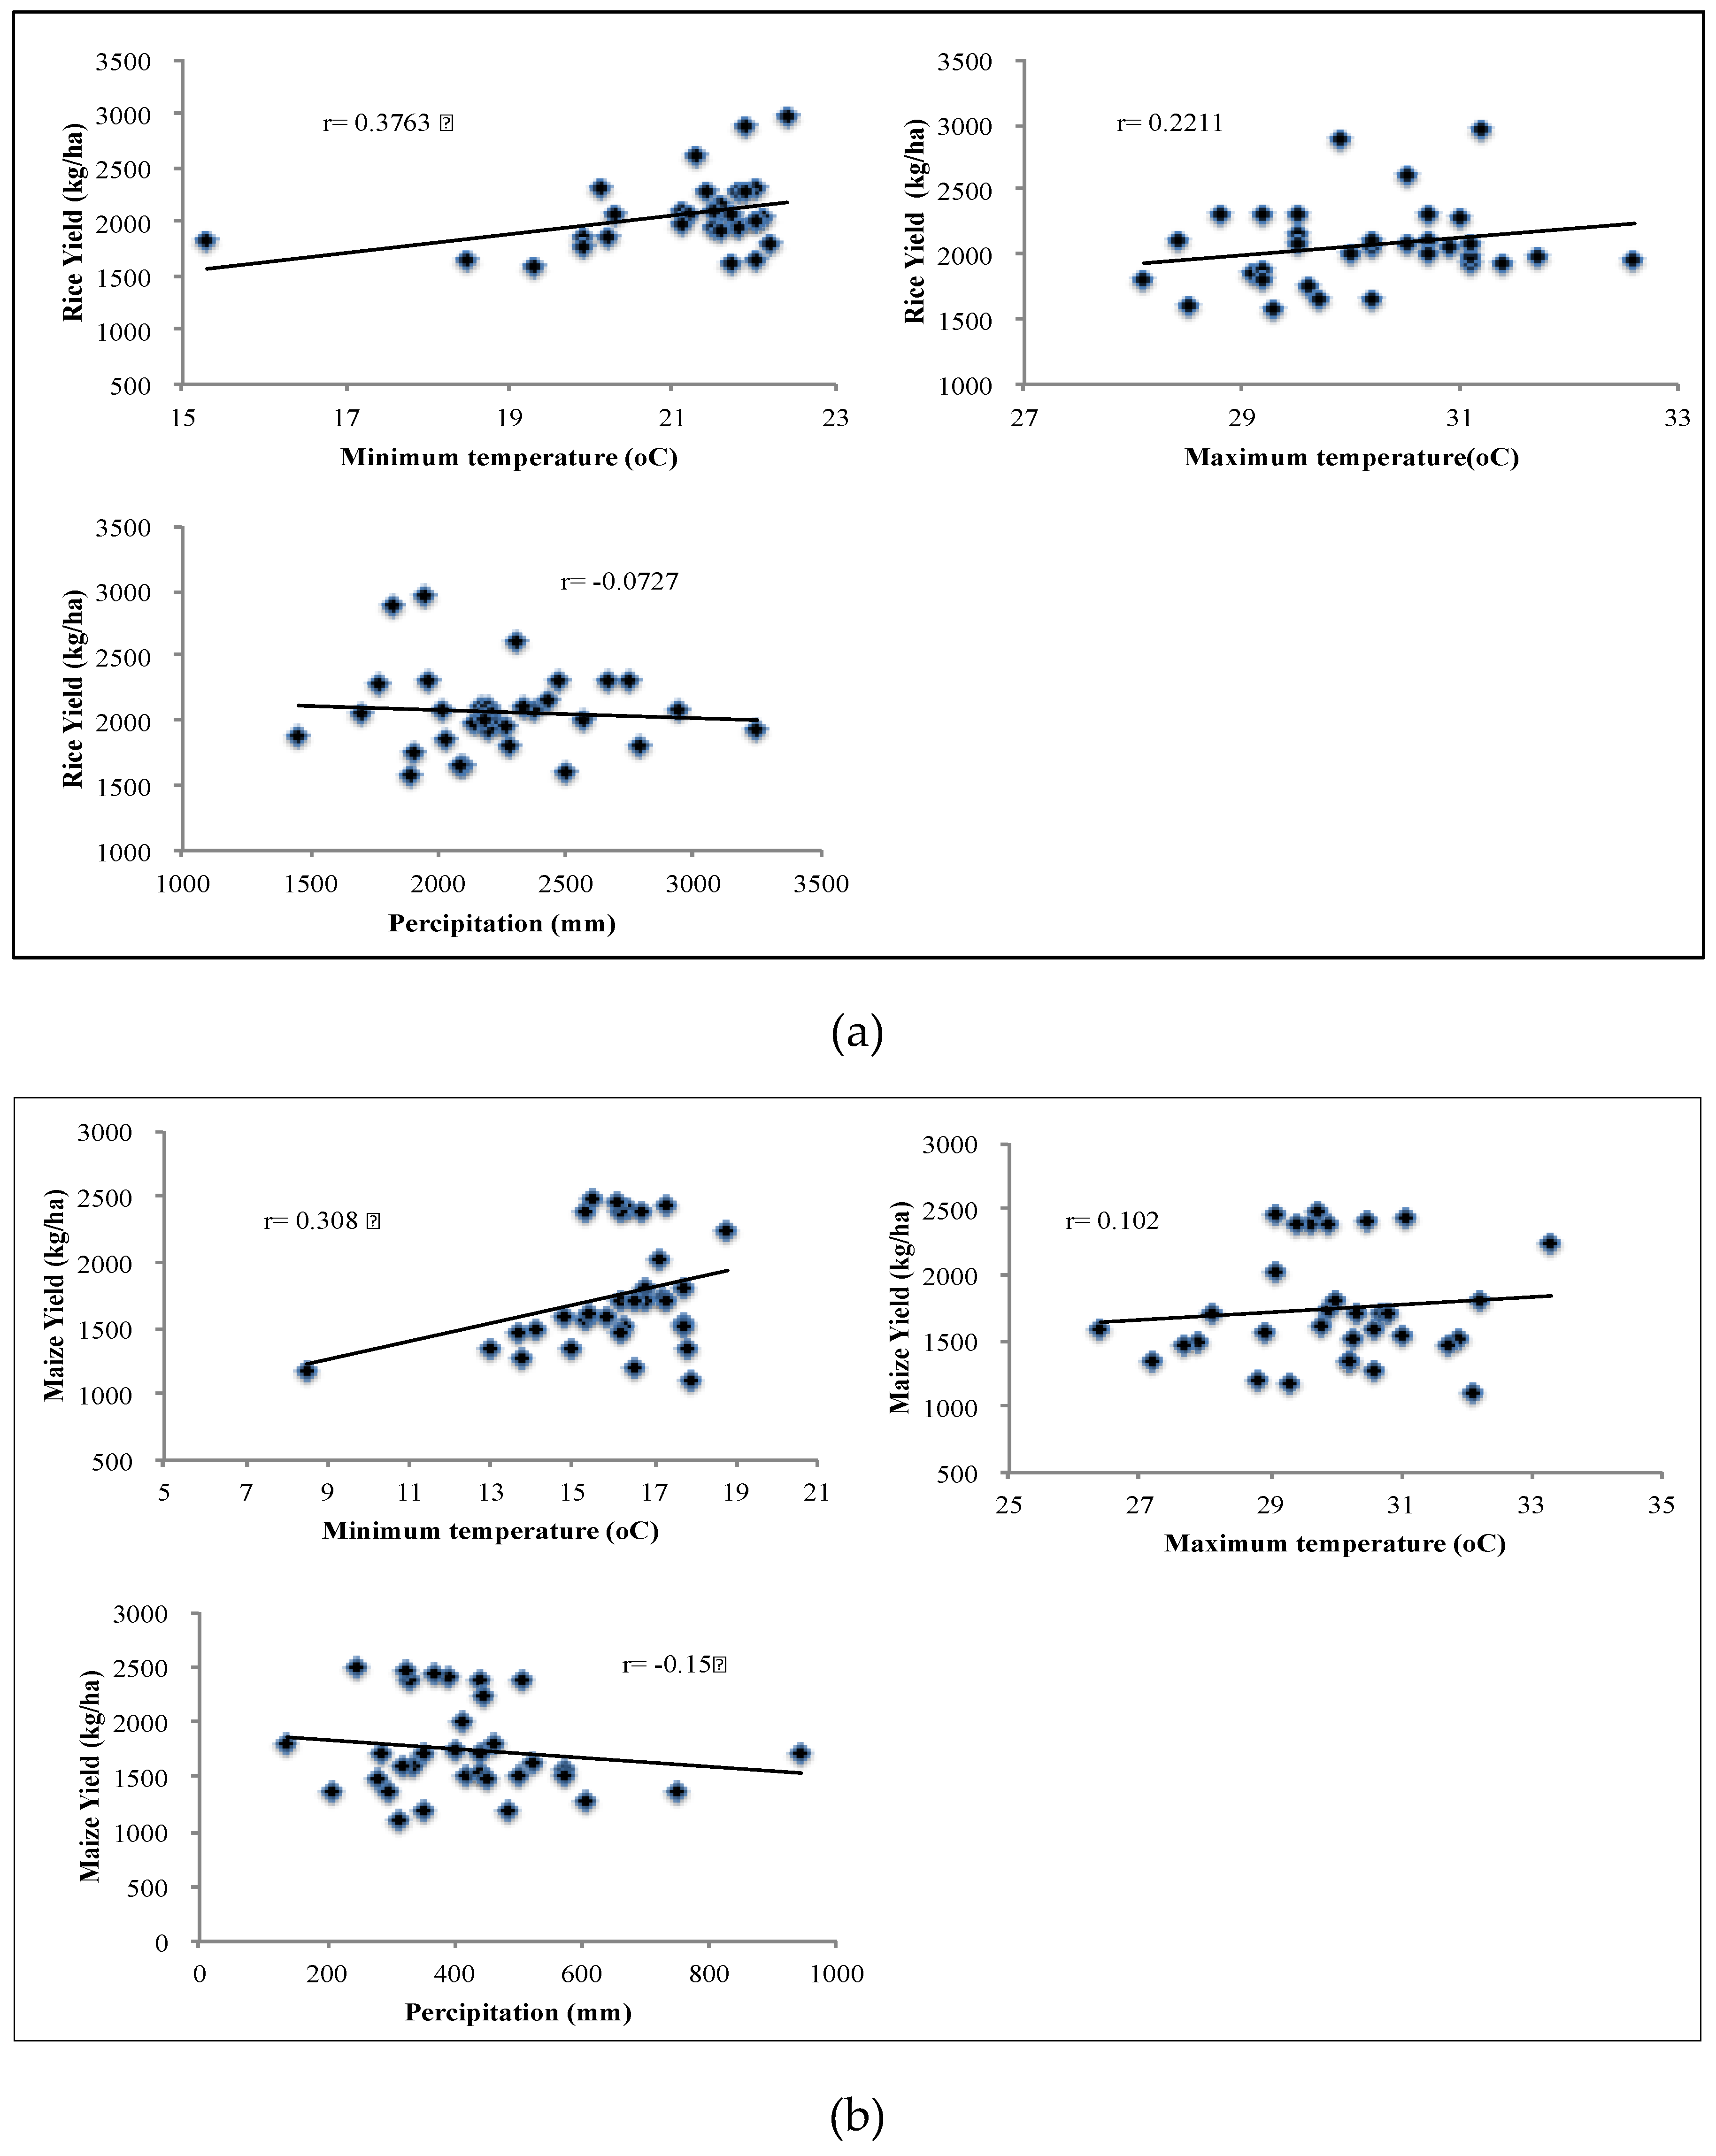
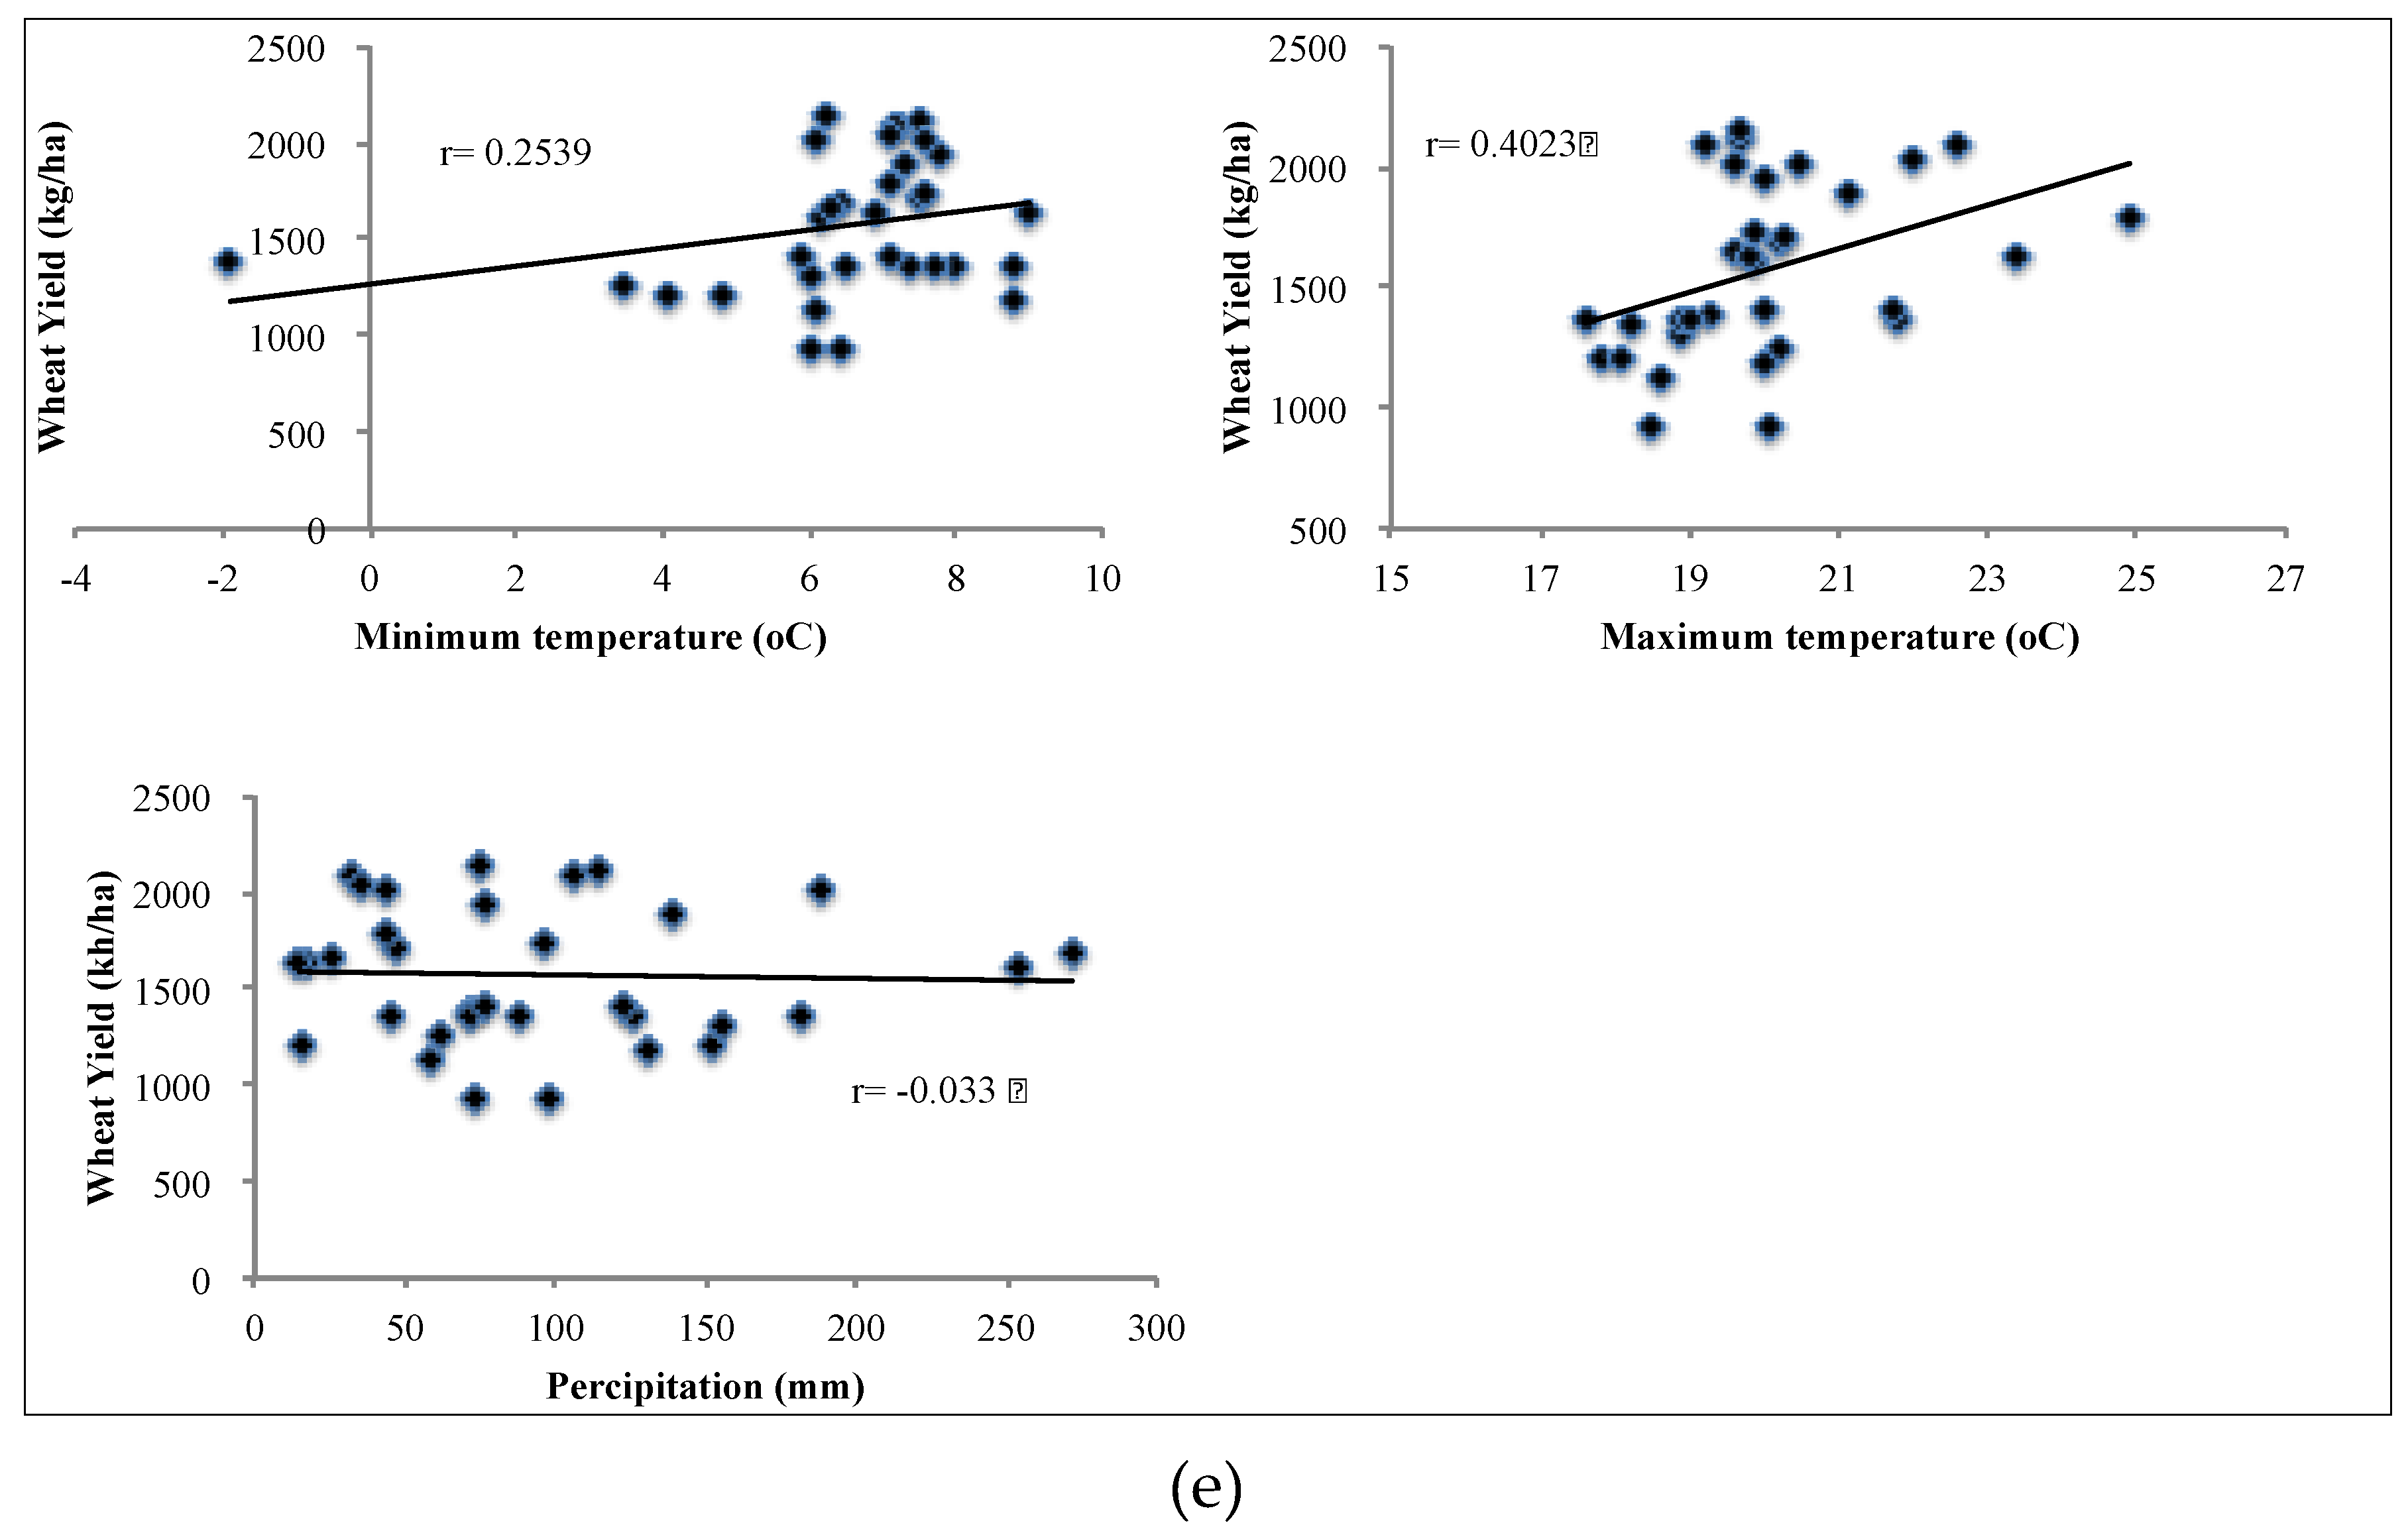
The five crops studied here are grown in two seasons, with no autumn or spring crops in Lamjung. The yields of rice, maize and wheat increased by 4.71 kg/ha/year, 16 kg/ha/year and 26.83 kg/ha/year, respectively, but the increases fluctuated over the years. Similarly, the yield of millet increased steadily, whereas the yield of barley decreased. These two crops are the major food crops in the mountainous region of Nepal. The growth yield of barley was suppressed by the increased minimum and maximum temperatures and decreased precipitation. However, the increased summer temperature contributed positively to maize yield.

6. Conclusions

This study concludes that climate variables have differential impacts on the yield growth of different crops. However, winter crops are adversely affected by the current climate trends. The yield of barley, one of the staple foods in the mountainous region of Nepal, is decreasing due to increased temperatures and decreased precipitation. On the other hand, though temperature is increasing in summer, the increases in precipitation have contributed positively to the yield growth of summer crops. Thus, it is recommended that any programs that are working to minimize the adverse impact of climate change on food crops production should first consider the crop, such as barley and millet, that is being most affected by the higher temperatures relative to the other food crops. Moreover, these two crops are important staple foods in Nepal, especially in the mountainous and hill regions that are also exposed to higher degrees of vulnerability to climate change.
The results of this research can be used by organizations and researchers to assess the current climate variability and fluctuations and their impact on food crops. The main shortcoming of this study is the examination of the entire district as one unit, despite the huge diversity existing within it. Therefore, further investigation with better spatial and temporal resolution is highly recommended to better understand the patterns and consequences of extreme weather affecting agriculture in mountainous regions.

Acknowledgments

The first author would like to express her sincere gratitude to the Government of Japan and GSS Program (Inter-Graduate School Program for Sustainable Development and Survivability Studies) for providing MEXT scholarship and research grant for this research. The authors also wish to thank and acknowledge the Climate change adaptation and mapping (CCAM) group Nepal for helping with data collection; and Department of Hydrology and Meteorology; and Ministry of Agricultural Development Nepal for providing the raw data for this research.

Author Contributions

Shobha Poudel collected and analyzed the data, conducted Key Informants Interviews (KIIs), and prepared the manuscript. Rajib Shaw has contributed in data analysis and manuscript finalization.

Conflicts of Interest

The authors declare no conflict of interest.

Appendix 1

Crop Calendar for major crops in Nepal.
JanuaryFebruaryMarchAprilMayJuneJulyAugustSeptemberOctoberNovemberDecemberSeason
Mountain (Rainfed)
Mai-PMai-P Mai-HMai-HMai-H Summer
Mil-PMil-P Mil-HMil-H Summer
Whe-HWhe-H Whe-PWhe-PWinter
Bar-HBar-H Bar-PBar-pWinter
Hills (Partial Irrigation/Rainfed)
Rice-TPRice-TP Rice-HRice-H Summer
Mai-PMai-P Mai-HMai-H Summer
Mil-PMil-P Mil-HMil-H Summer
Whe-HWhe-HWhe-H Whe-PWhe-PWhe-PWinter
Bar-HBar-H Bar-PBar-PBar-pWinter
Hill (Irrigated)
Rice-TPRice-TP Rice-HRice-H Spring
Mai-PMai-P Mai-HMai-H Spring
Whe-HWhe-HWhe-H Whe-PWhe-PWhe-PWinter
Terai (Rainfed)
Rice-TPRice-TP Rice-HRice-HRice-H Summer
Mai-PMai-P Mai-HMai-H Summer
Whe-HWhe-H Whe-PWhe-P Winter
Terai (Irrigated)
Rice-TPRice-TP Rice-HRice-HSummer
Mai-PMai-P Mai-HMai-H Spring
Rice-TPRice-TP Rice-HRice-H Spring
Mai-HMai-H Mai-PMai-P Winter
Mai-Maize, Whe-Wheat, Mil-Millet, Bar-Barley, P-Plantation, TP-Transplantation, H-Harvesting. Source: Food and Agriculture Organization & World Food Programme (2007), http://www.lanra.uga.edu/potato/asia/nepal.htm. Climate 04 00013 i001 Plantation/Transplantation  Climate 04 00013 i002 Crop growing phase  Climate 04 00013 i003 Harvesting

Appendix 2

Figure A1. Correlation of rice, maize, millet, barley and wheat with maximum temperature, minimum temperature and corresponding seasonal accumulated precipitation. (a) Correlation of rice with maximum temperature, minimum temperature and precipitation. (b) Correlation of maize with maximum temperature, minimum temperature and precipitation. (c) Correlation of barley with maximum temperature, minimum temperature and precipitation. (d) Correlation of millet with maximum temperature, minimum temperature and precipitation. (e) Correlation of wheat with maximum temperature, minimum temperature and precipitation.
Climate 04 00013 g008aClimate 04 00013 g008bClimate 04 00013 g008c

References

  1. Central Bureau of Statistics (CBS). Statistical Information on Nepalese Agriculture; Central Bureau of Statistics: Kathmandu, Nepal, 2013.
  2. Gumma, M.K.; Gauchan, D.; Nelson, A.; Pandey, S.; Rala, A. Temporal changes in rice-growing area and their impact on livelihood over a decade: A case study of Nepal. Agric. Ecosyst. Environ. 2011, 142, 382–392. [Google Scholar] [CrossRef]
  3. Ministry of Agricultural Cooperation (MOAC) and World Food Program. Summer Crop Nepal (WFP). Crop and Food Security Update. Available online: http://documents.wfp.org/stellent/groups/public/documents/ena/wfp219805.pdf?iframe (accessed on 2 December 2015).
  4. IPCC. Climate Change 2014: Impacts, Adaptation, and Vulnerability. Part A: Global and Sectoral Aspects. In Contribution of Working Group II to the Fifth Assessment Report of the Intergovernmental Panel on Climate Change; Field, C.B., Barros, V.R., Eds.; Cambridge University Press: New York, NY, USA, 2014; pp. 1–32. [Google Scholar]
  5. Mishra, B.; Babel, M.S.; Tripathi, N.K. Analysis of climatic variability and snow cover in the Kaligandaki River Basin, Himalaya, Nepal. Theor. Appl. Climatol. 2014, 116, 681–694. [Google Scholar] [CrossRef]
  6. Immerzeel, W.W. Historical trends and future predictions of climate variability in the Brahmaputra basin. Int. J. Climatol. 2008, 5, 243–254. [Google Scholar] [CrossRef]
  7. Chaulagain, N.P. Impacts of climate change on water resources of Nepal: The physical and socio-economic dimensions. In Presented at IOP Conference Series: Earth and Environmental Science, Copenhagen, Denmark, March 2009.
  8. Baidya, S.K.; Shrestha, M.L.; Sheikh, M.M. Trends in daily climatic extremes of temperature and precipitation in Nepal. J. Hydrol. Meteorol. 2008, 5, 38–53. [Google Scholar]
  9. Malla, G. Climate change and its impact on Nepalese agriculture. J. Agric. Environ. 2008, 9, 62–71. [Google Scholar] [CrossRef]
  10. Regmi, B.R.; Adhikari, A. Human Development Report 2007: Climate Change and Human Development–Risk and Vulnerability in a Warming World (Country Case Study-Nepal). Available online: http://hdr.undp.org/sites/default/files/regmi_bimal_and_adhikari_anu_nepal.pdf (accessed on 2 December 2015).
  11. Panthi, J.; Aryal, S.; Dahal, P.; Bhandari, P.; Krakauer, N.Y.; Pandey, V.P. Livelihood vulnerability approach to assessing climate change impacts on mixed agro-livestock smallholders around the Gandaki River Basin in Nepal. Reg. Environ. Chang. 2015, 7, 1–12. [Google Scholar] [CrossRef]
  12. Verisk Maplecroft: Advisory Services. Available online: http://maplecroft.com/about/news/ccvi.html (accessed on 2 December 2015).
  13. Mishra, B.; Tripathi, N.K. Winter Agricultural Drought Detection Using MODIS Imagery: A Case Study of Nepal. In Proceeding of the 3rd International Conference on GIT for Natural Disaster Management, Chiang Mai, Thailand, 19–20 October 2010.
  14. Sheikh, M.M.; Manzoor, N.; Ashraf, J.; Adnan, M.; Collins, D.; Hameed, S.; Manton, M.J.; Ahmed, A.U.; Baidya, S.K.; Borgaonkar, H.P.; et al. Trends in extreme daily rainfall and temperature indices over South Asia. Int. J. Climatol. 2014, 35, 1625–1637. [Google Scholar] [CrossRef]
  15. World Bank. South Asia Economic Updates: Moving Up, Looking East. Available online: http://www.worldbank.org/en/news/feature/2010/06/07/south-asia-economic-update-2010-moving-up-looking-east (accessed on 7 June 2010).
  16. Wassmann, R.; Jagadish, S.V.K.; Sumfleth, K.; Pathak, H.; Howell, G.; Ismail, A.; Heuer, S. Regional vulnerability of climate change impacts on Asian rice production and scope for adaptation. Adv. Agron. 2009, 102, 91–133. [Google Scholar]
  17. Poudel, S.; Shaw, R. Demographic changes, Economic changes and Livelihood changes in the Hindu Kush Himalaya region. In Mountain Hazards and Disaster Risk Reduction; Shaw, R., Nibanupudi, H.K., Eds.; Springer: Tokyo, Japan, 2015; pp. 105–123. [Google Scholar]
  18. Dahal, N. Perceptions of Climate Change in the Himalaya; Tiempo Climate Change Bulletin: Stockholm, Sweden, 2005. [Google Scholar]
  19. Shrestha, S.L.; Maharjan, K.L.; Joshi, N.P. Relationship between climate variables and yields of food crops in Nepal: Cases of Makwanpur and Ilam Districts. J. Int. Dev. Coop. 2012, 18, 37–54. [Google Scholar]
  20. Wang, J.X.; Huang, J.K.; Jun, Y. Overview of impacts of climate change and adaptation in China's agriculture. J. Int. Agric. 2014, 13, 1–17. [Google Scholar] [CrossRef]
  21. Alexandrov, V.A.; Gerrit, H. Climate variation and crop production in Georgia, USA, during the twentieth century. Clim. Res. 2001, 17, 33–43. [Google Scholar] [CrossRef]
  22. Schlenker, W.; Roberts, M.J. Estimating the Impact of Climate Change on crop Yields: The Importance of Non-Linear Temperature Effects (NBER Working Paper 13799); National Bureau of Economic Research: Cambridge, MA, USA, 2008. [Google Scholar]
  23. Lobell, D.B.; Field, C.B. Global scale climate-crop yield relationships and the impacts of recent warming. Environ. Res. Lett. 2007, 2, 1–7. [Google Scholar] [CrossRef]
  24. Lobell, D.B.; Ortiz-Monasterio, J.I.; Asner, G.P.; Matson, P.A.; Naylor, R.L.; Falcon, W.P. Analysis of wheat yield and climatic trends in Mexico. Field Crops Res. 2005, 94, 250–256. [Google Scholar] [CrossRef]
  25. Boubacar, I. The Effects of Drought on Crop Yield and Yield Variability in Sahel. Available online: http://citeseerx.ist.psu.edu/viewdoc/download?doi=10.1.1.625.4709&rep=rep1&type=pdf (accessed on 6 February 2010).
  26. Ministry of Environment. National Climate Change Vulnerability Mapping of Nepal; National Adaptation Program of Action (NAPA): Kathmandu, Nepal, 2010.
  27. Koirala, M.; Bhatta, R. Communities Challenging Climate Change; Community Radio Support Center (CRSC) /Nepal Forum of Environmental Journalists (NEFEJ): Patan, Nepal, 2010. [Google Scholar]
  28. Ministry of Agricultural Development. Statistical Information on Nepalese Agriculture (MOAD) 2013/2014 (2070/2071). Available online: http://www.moad.gov.np/uploads/files/Year%20book%202014.pdf (accessed on 2 December 2015).
  29. Karpouzos, D.; Kavalieratou, S.; Babajimopoulos, C. Trend analysis of precipitation data in Pieria region (Greece). Eur. Water 2010, 30, 31–40. [Google Scholar]
  30. Partal, T.; Kahya, E. Trend analysis in Turkish precipitation data. Hydrol. Process. 2006, 20, 2011–2026. [Google Scholar] [CrossRef]
  31. Sen, P.K. Estimates of the regression coefficient based on Kendall's tau. J. Am. Stat. Assoc. 1968, 63, 1379–1389. [Google Scholar] [CrossRef]
  32. Practical Action. Temporal and Spatial Variability of Climate Change over Nepal (1976–2005). Available online: http://practicalaction.org/file/region_nepal/ClimateChange1976–2005.pdf (accessed on 2 December 2015).
  33. Shrestha, A.B.; Wake, C.P.; Mayewski, P.A.; Dibb, J.E. Maxiumum temperature trends in the Himalaya and the vicinity: An analysis based on temperature records for Nepal for the period 1971–94. J. Clim. 1999, 12, 2775–2786. [Google Scholar] [CrossRef]
  34. Pant, K.P. Climate change and food security. J. Agric. Environ. 2012, 13, 9–19. [Google Scholar]
  35. Joshi, N.P.; Maharjan, K.L.; Luni, P. Effect of climate variables on yield of major food-crops in Nepal: A time-series analysis. J. Contem. India Stud. 2011, 1, 19–26. [Google Scholar]
  36. Nicholls, N. Increased Australian wheat yield due to recent climate trends. Nature 1997, 387, 484–485. [Google Scholar] [CrossRef]
  37. Maharjan, K.L.; Joshi, N.P.; Piya, L. Sources of climate change, its impact, and mitigation issues in Nepal. In Proceeding of International Conference on Climate Change, Livelihoods, and Food Security, Jaipur, India, 9–10 June 2009.
Figure 1. Land cover map of Lamjung district, developed from Landsat 8 images.
Climate 04 00013 g001
Figure 2. Annual precipitation trends at the Gharedhunga, Kunchha and Khudi stations from 1980 to 2012.
Climate 04 00013 g002
Figure 3. Seasonal precipitation trends at Gharedhunga, Kunchha and Khudi stations from 1980 to 2012.
Climate 04 00013 g003
Figure 4. Seasonal and annual maximum temperature trends at the Khudi station from 1980 to 2012.
Climate 04 00013 g004
Figure 5. Seasonal and annual minimum temperature trends at the Khudi station from 1980 to 2012.
Climate 04 00013 g005
Figure 6. Crop yield trends for rice, maize, millet, wheat and barley from 1980 to 2012.
Climate 04 00013 g006
Figure 7. (a) Anomalies in the summer crops yield; (b) Anomalies in the winter crops yield.
Climate 04 00013 g007
Table 1. Considered climatic data.
StationElevation (m)Latitude (N) and Longitude (E)Climate VariablesDuration (Monthly)
Gharedhunga1120(28°28’, 84°35’)Precipitation (mm)1980–2012
Khudi855(28°15’, 84°55’)Precipitation (mm) and temperature (°C)
Kunchha823(28°12’, 84°34’)Precipitation (mm)
Source: Department of Hydrology and Meteorology 2014, Nepal.
Table 2. Considered crops and cropping period.
CropCultivation PeriodFrequencyData Available
RiceFrom June to NovemberAnnual1970–2013
April to August
MaizeFrom May to August
WheatFrom November to March
MilletFrom July to December
BarleyFrom November to March
Table 3. Sen’s slope values for seasonal and annual precipitation at the three stations.
Station/SeasonGharedhungaKunchhaKhudi
Sen’s slope (mm)p-valueSignificanceSen’s slope (mm)p-valueSignificanceSen’s slope (mm)p-valueSignificanceAlpha value
Winter0.43130.0004Yes0.41650.0120Yes0.43140.0221Yes0.1
Spring1.52120.0914Yes2.13321.2755No1.69160.8807No0.1
Summer2.96240.0717Yes4.43420.0557Yes5.75110.9701No0.1
Autumn1.18880.2227No1.49640.4092No1.51780.0181Yes0.1
Annual4.4220.288No10.4880.063Yes−3.4790.565No0.1
Table 4. Sen’s slope values for the seasonal and annual temperatures of the Khudi station.
Temperature/SeasonMaximum TemperatureMinimum TemperatureAlpha Value
p-valueSen’s slope (°C)Significancep-valueSen’s slope (°C)Significance
Winter0.0040.079Yes0.0530.051Yes0.1
Spring0.2120.039No0.1190.057No0.1
Summer0.0820.039Yes0.0240.04Yes0.1
Autumn0.0100.06Yes0.0360.055Yes0.1
Annual0.1330.02No0.00010.07Yes0.1
Table 5. Quantification of the crop yield trend with Sen’s slope value.
Cropsp-ValueSen’s Slope (kg/ha)SignificanceAlpha Value
Rice0.2974.71No0.05
Maize0.00316Yes0.05
Millet0.7610.26No0.05
Wheat0.000126.83Yes0.05
Barley0.029−1.20Yes0.05
Table 6. Multivariate regression analyses of detrended crop yields.
CropPpt_STmax_STmin_SPpt_WTmax_WTmin_WR2
RiceCoeff.1.17922.0−21.7---0.078
p-value0.1860.7350.596---
MaizeCoeff.−0.2717.212.1---0.347
p-value0.0030.6690.632---
MilletCoeff.−0.0176.0−10.8---0.372
p-value0.8110.0010.421---
WheatCoeff.---0.39−6.5−29.10.249
p-value---0.1870.6130.014
BarleyCoeff.---0.027−2.19−9.680.11
p-value---0.860.7510.116
Coeff. = coefficient, S = summer, W = winter, Tmax = maximum temperature, Tmin = minimum temperature, Ppt = precipitation.

