Article

CMIP5 Projected Changes in the Annual Cycle of Indian Monsoon Rainfall

by
Pravat Jena
1,†,
Sarita Azad
1,*,† and
Madhavan Nair Rajeevan
2,†
1
Indian Institute of Technology Mandi, Mandi, Himachal Pradesh 75001, India
2
Indian Institute of Tropical Meteorology, Dr Homi Bhabha Road, Pashan, Pune, Maharashtra 411008, India
*
Author to whom correspondence should be addressed.
These authors contributed equally to this work.
Climate 2016, 4(1), 14; https://doi.org/10.3390/cli4010014
Submission received: 25 September 2015 / Revised: 13 December 2015 / Accepted: 23 December 2015 / Published: 2 March 2016
(This article belongs to the Special Issue Climate Change and Development in South Asia)

Abstract

:
The annual cycle of Indian monsoon rainfall plays a critical role in the agricultural as well as the industrial sector. Thus, it is necessary to evaluate the behaviour of the monsoon annual cycle in a warming climate. There are several studies on the variability and uncertainty of the Indian monsoon. This study, examines the impact of climate change on the annual cycle of monsoon rainfall in India from 1871–2100 by applying 20 model simulations designed by the World Climate Research Programme (WCRP) coupled with the model inter-comparison Project 5 (CMIP5). It is found that the models MPI-ESM-LR, INM-CM4 and MRI-CGCM3 best capture the spatial patterns of the monsoon rainfall peak month (MRPM) of the winter monsoon compared to observations, whereas HadGEM2-AO and MIROC-ESM-CHEM best capture the MRPM of the summer monsoon. The MIROC, MIROC-ESM, and MIROC-ESM-CHEM models best capture the average rainfall intensity as well as the MRPM of all-India rainfall. This paper examines the future spatial distribution of the MRPM for meteorological sub-divisions of India, that can have crucial implications for water resources and management. Although the future projections as per the CMIP5 models indicate no changes in the MRPM of the all-India rainfall, a reduction in average intensity can be expected. The projections indicate a shift in the MRPM in some meteorological sub-divisions, particularly with regard to the summer monsoon but no significant change has been projected for the winter monsoon. For example, the summer monsoon MRPM is projected to move from July to August in northern and central India.

1. Introduction

India’s climate is highly influenced by the monsoon, and its peak month has a direct bearing on the food grain production in the country. The two fundamental elements of the Indian monsoon are: the Southwest summer monsoon (June to September) over North, central part and southwest coast of India; and the Northeast winter monsoon (October to December) over southern peninsular India. For the country as whole, the mean monthly rainfall is highest during July (286.5 mm), which accounts for around 24.2 per cent of yearly precipitation (1182.8 mm) [1]. India gets about 78 per cent of its total rainfall during the summer monsoon season, while the Northeast winter monsoon season contributes about 12 per cent of the aggregate rainfall and the rest, pre monsoon (March to May) and winter rain (January to February) contribute [1]. Variability in the onset and withdrawal dates and rainfall amounts during the monsoon season impacts water resources, power generation, farming, which in turn impacts the financial and biological systems of the country.
The El Nino/Southern Oscillation (ENSO) and equatorial Indian Ocean climate anomalies are the main factors that influence the inter-annual variability of the Indian summer monsoon [2,3]. Apart from problems arising from the changing patterns of climate variability, there are additional worries about future changes in climate. Human activities since the Industrial Revolution have wrought unprecedented changes in the composition of the earth’s atmosphere and consequently the earth’s delicate climate system. There is unequivocal evidence, that average surface temperatures have risen over the last 10 decades due to anthropogenic activity. Changes have also been observed in some other components of the climate system including: snow cover, precipitation, sea ice and extremes of weather. These changes, however, have shown significant regional variations. The Indian summer monsoon could also prove susceptible to these factors along with other regional manifestations of global warming.
Many studies have been undertaken [4,5,6,7,8] to study the Indian monsoon rainfall variability in a warming climate. It has been found that all models simulate a stronger seasonal mean monsoon rainfall in the future as compared to the historic period under the strongest warming scenario of RCP 8.5. The temporal trends and variations in the Indian summer monsoon were analysed by means of a fine spatial resolution. The Northeast and the Southwest coast of India experience the highest average annual Indian summer monsoon (ISM) precipitation, they have the earliest onset date of the ISM and greatest amount of inter-annual variation in ISM precipitation [9]. In contrast, Northwest India has experienced the lowest amounts of annual ISM precipitation and the highest number of severe drought years [6]. The development of seasonal and inter-annual climate forecasting for monsoon variability has also been a subject of study [10]. In addition, the trends of extreme weather events, related to the monsoon, have also been analysed [11,12,13,14]. The expanding pattern of extreme rainfall events in the most recent five decades could be directly linked with the rise in sea surface temperatures (SST) and the surface latent heat flux over the tropical Indian ocean. Kulkarni et al. [15] have studied the annual cycle of Indian monsoon. They reported that 19 of the 22 models, accurately simulate the course of the annual cycle and these projections suggest an increase in the magnitude of rainfall. Sathiyamoorthy and Joshi [16] have concentrated on changes in meteorological parameters over the Indian monsoon region when CO2 levels are double that of the prevailing levels. The CO2 doubling model simulations suggest that the precipitation rate over the Indian monsoon area is likely to increase over the whole year, except for the spring season. For the late spring rainstorm season, the greatest precipitation increment (>3 mm day−1) is seen over the head of the Bay of Bengal and nearby districts. Seth et al. [17] have analysed the annual cycle of precipitation in monsoon regions. They have concluded that the monsoons in the northern hemisphere exhibit peak rainfall and poleward extension in July and August. More recently, Pascale et al. [18] have studied the projected changes in rainfall seasonality and have shown that the centroid of rainfall in India falls in August instead of July. This delay is mainly due to simulated reductions in precipitation in the early monsoon season. According to them, most of the Indian region contributes to the negative May–July rainfall anomaly over India. Most of the models are not able to anticipate delays over western Indian coastal regions, but rainfall delay over the rest of India is well predicted by these models. Additionally, the time-space structure of the monsoon rainfall annual cycle is analysed by Lin et al. [19].
Feng et al. [20] have designed a new metric for estimating the rainfall seasonality. It is based on the probabilistic approach towards rainfall fractions. The circular static moments can be estimated by applying this method. It describes the annual distribution of rainfall and, in particular, the centroid of the annual precipitation, which can be considered as the peak month of the wet season. Using this metric, Feng et al. [20] analysed precipitation data over 60 years in the tropical regions of the globe, beginning from 1930, which revealed significant variations in the timing, intensity and span of rainfall. Moreover, Pascale et al. [18] studied the seasonality of precipitation of observational datasets and CMIP5 from 1950–2005 using the same method. In this paper we apply this method for arriving at 21st century projections for the annual cycle of precipitation in the Indian subcontinent. We compare the spatial distribution of the monsoon rainfall peak month as per the observations and historical model simulations in order to identify the models that best capture the characteristics of the annual cycle. The best-performing models are further analysed to arrive at the likely future changes in the annual cycle across 30 meteorological subdivisions of India (the hilly regions have not been included).
The structure of this paper is as follows: Section 2 describes the coupled climate models, experiments and observations. In Section 3, results are presented in three steps. These are: (3.1) analysis of observed data (1871–2005); (3.2) selection of best models out of 20 models over historical period (1871–2005); (3.3) model predictions, with conclusions in Section 4.

2. Data and Methods

2.1. Data

We employed multi-model ensemble simulations from the WCRP CMIP5 dataset [21], which are obtained from two experiments. One is the historical run (1871–2005); and the other the RCP 8.5 from 2006 to 2100. Then, monthly historical simulations were analysed and compared with observed data from 1871 to 2005. The observed data was obtained from the Indian Institute of Tropical Meteorology (IITM) [21]. The future changes are analysed in 21st century (RCP 8.5, 2006–2100) projected simulations. The basic information relating to the CMIP5 models in the present study, including the horizontal and vertical resolutions are given in Table 1 [22]. For the present analysis, we have considered 20 CMIP5 models (given in Table 1) which have shown basic skill for simulating the observed features of Indian monsoon circulation and rainfall [23]. Model output data for three RCP scenarios (RCPs 2.6, 4.5 and 8.5) is now available. We have used the RCP 8.5 scenario for the present study. RCP 8.5 is the pathway for which radiative forcing reaches 8.5 W/m2 by 2100 [22]. Both the historical simulations and 20th century simulations of RCP 8.5 have been used to study the hydroclimatic trends during the monsoon season. The historical simulation period of the CMIP5 models is from 1851 to 2010, but we examined the data for the period 1871–2005 for which the observed rainfall data is available. Thus, the analysis periods from the CMIP5 and India Meteorological Department (s) data sets are similar. The detailed documentation of CMIP5 models can be found at: http://www.earthsystemgrid.org/search?Type=Simulation%2bMetadata.
We analysed simulated rainfall data obtained from the 20 models that participated in the CMIP5. The details of the models considered are summarised in Table 1.
The data for the 20 models is available in 3D array in which each dimension corresponds to: longitude; latitude; time (month) wherein each point represents the precipitation data of a longitude -latitude box at that particular time. The Indian meteorological department (IMD) divides the country into 36 meteorological sub-divisions based on data from 306 well-distributed rain-gauge stations. We excluded island sub-divisions and hilly areas and considered 30 sub-divisions in the mainland for our analysis. The longitude-latitude for each sub-division is used to extract the model data for the corresponding sub-division. The all-India mean is calculated as the area weighted average of these sub-divisions.

2.2. Methods

The following indicators of the rainfall properties have been used for studying the annual cycle and are explained by Equations (1)–(3).
(i)
Annual rainfall: Given the monthly precipitation sequence rm,k (month m, year k). The total annual rainfall during year k is defined as [17,19]
R k = m = 1 12 r m , k
where R is annual rainfall and r is the monthly precipitation in mm.
(ii)
Monthly fraction: The monthly precipitation fraction for a month m is defined as [17,19]
p m , k = r m , k R k
where p is the monthly precipitation in mm.
(iii)
Centroid [17]: This is an integral measure of the timing of the wet season and is related to the time of the year around which most of the annual rainfall is distributed. An index of the timing is directly derived from the Equation (1). Moreover, the centroid is defined in circular statistics as argument of the complex number zk, where k represents year (i imaginary unit).
z k = m = 1 12 p m , k exp { i 2 π m 12 } ,   c k = arg ( z k )
where p is the monthly precipitation in mm.
The MRPM is found by taking the month which had the maximum rainfall between 1871 and 2005 directly from the data and from centroid method. Initially, we have calculated the MRPM for all-India rainfall for the observed as well as models. Subsequently, the MRPM for all the 30 meteorological sub-divisions is calculated for both data sets.

3. Results and Discussion

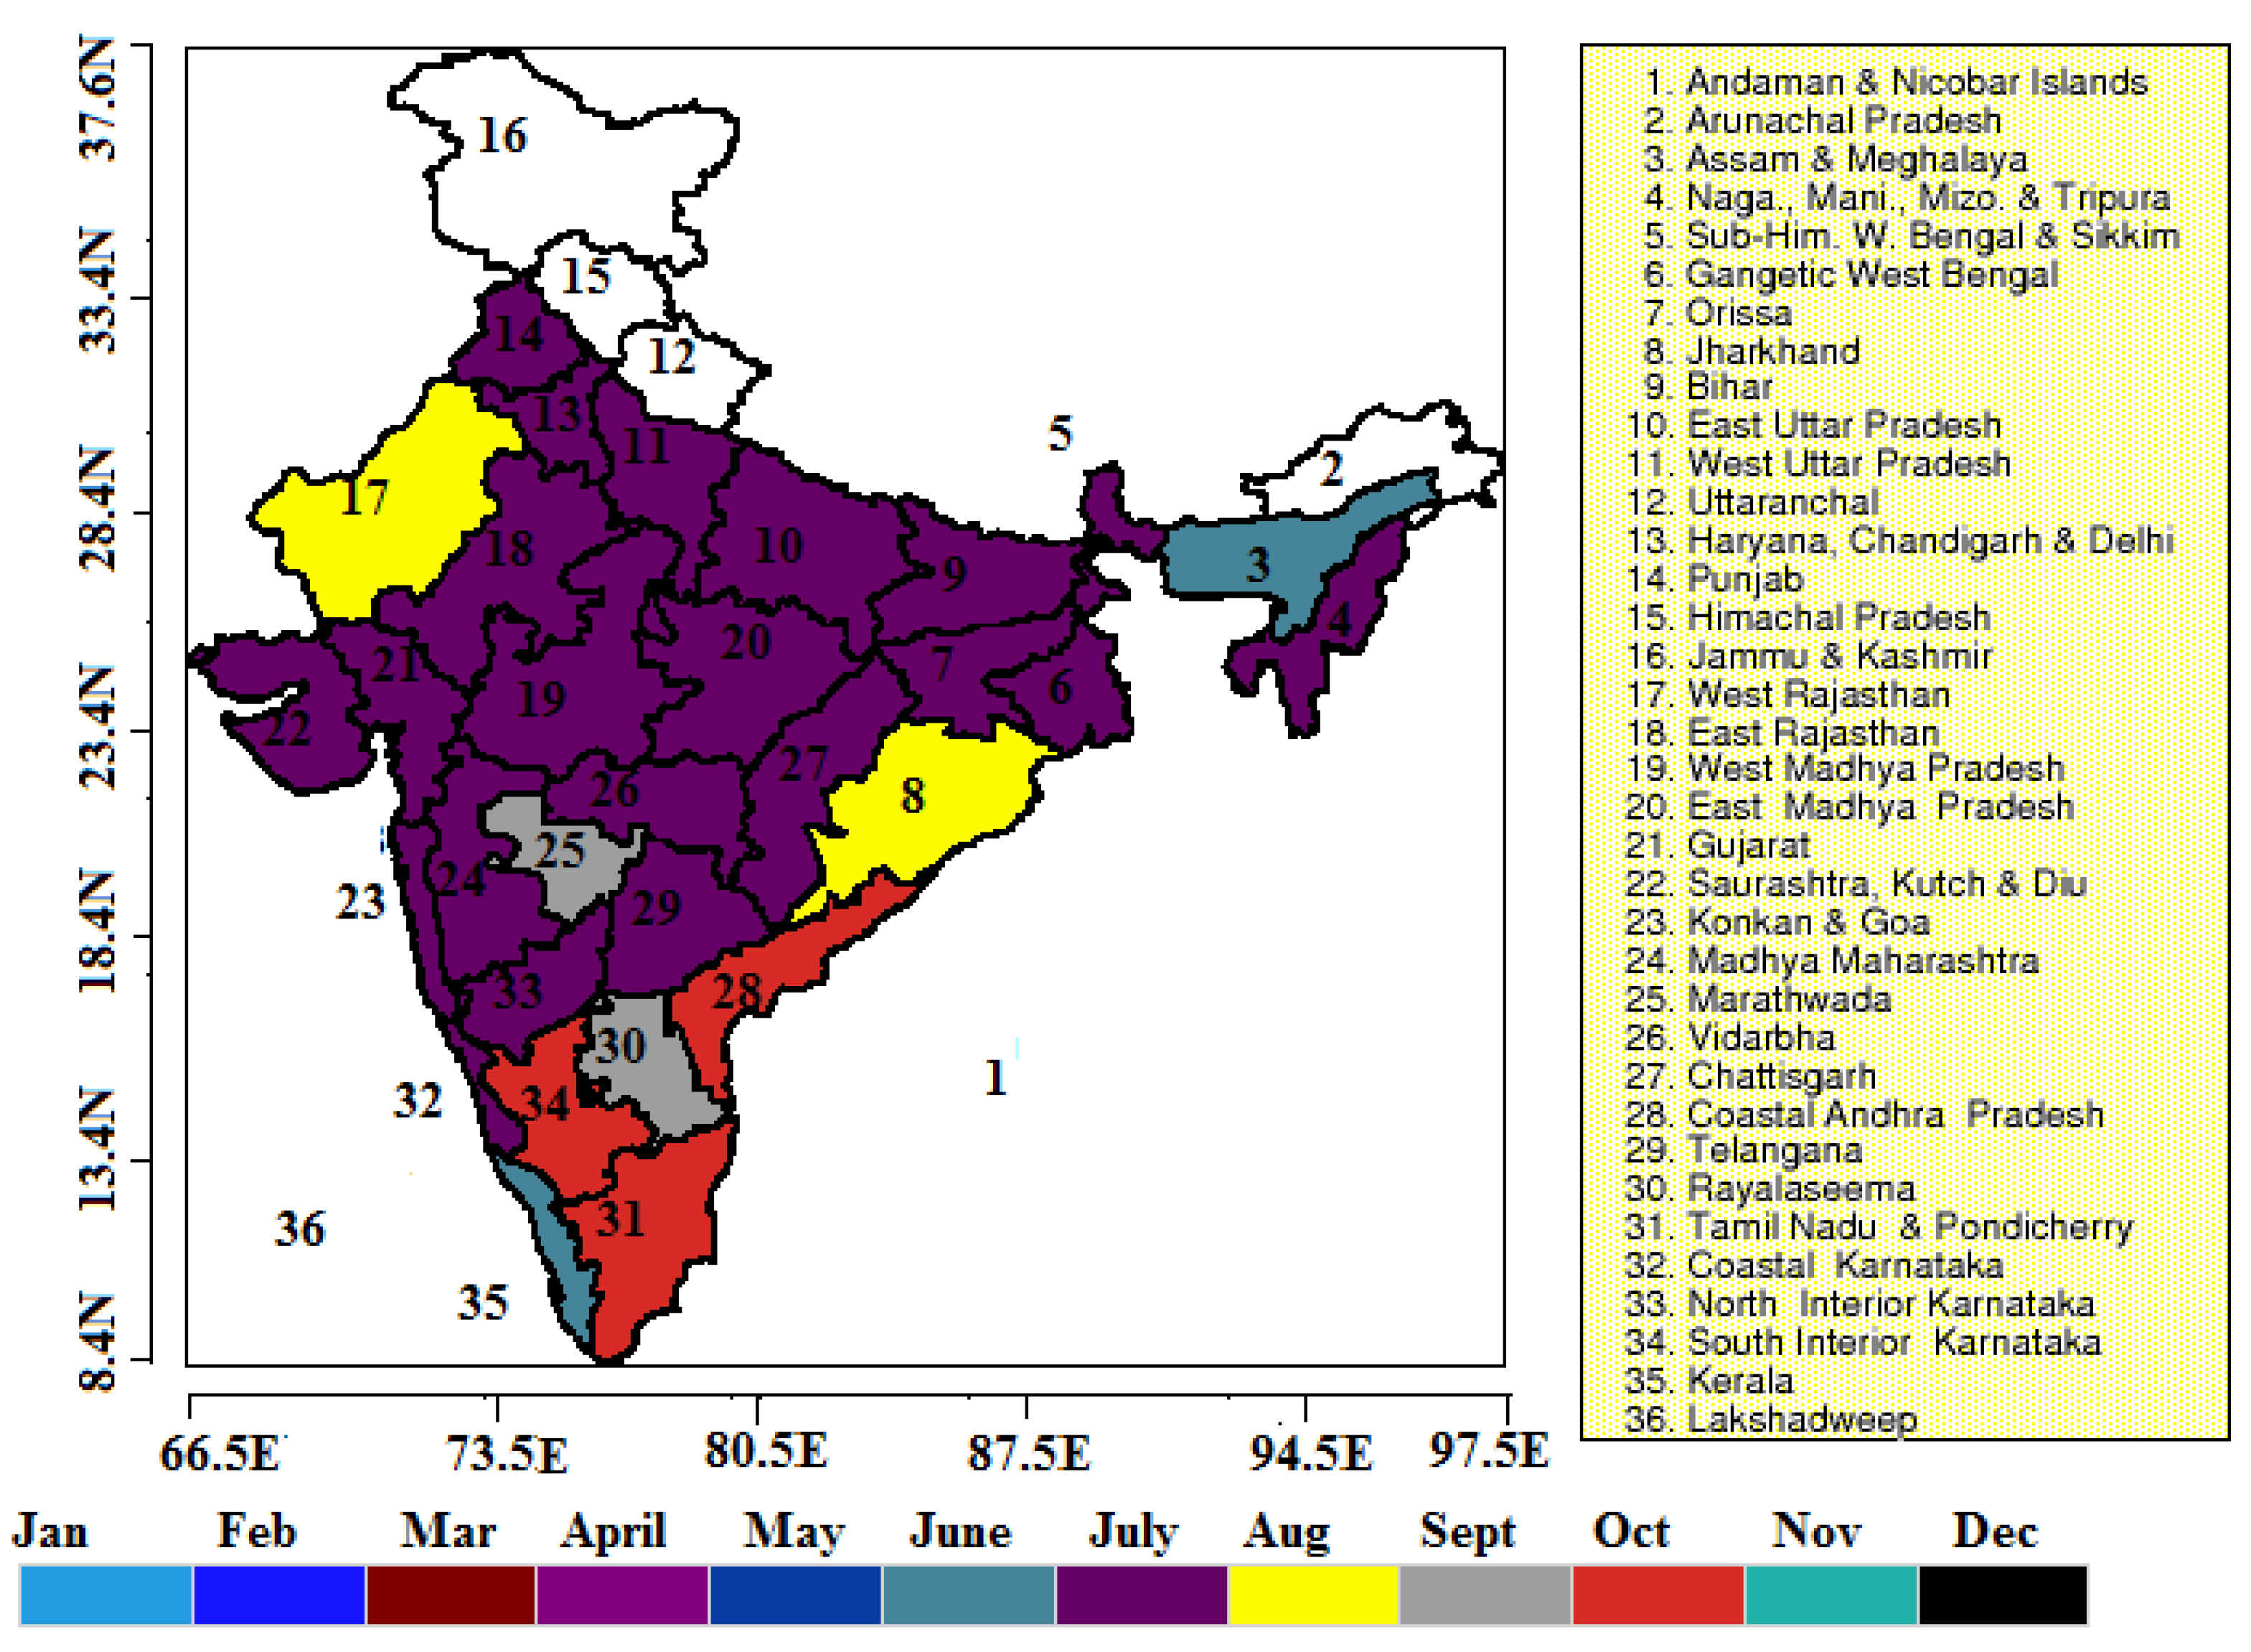
3.1. Observations of the 20th Century (1871–2005)

The MRPM for all-India rainfall is calculated using the centroid method, and found to be in month of July. The MRPM for 30 sub-divisions have been calculated and shown in Figure 1. It can be observed from the Figure 1 that the MRPM for Kerala is June, the month which marks the beginning of the monsoon season in India. The correct prediction of monsoon onset over Kerala is crucial for farmers to enable them to formulate their crop strategy [24]. The MRPM for coastal Andhra Pradesh, Tamil Nadu, and south interior Karnataka, is October and; for Rayalseema, it is September and the MRPM for the rest of the country is shown in Figure 1.

3.2. Simulation of Models.

The MRPM of different models is estimated using the centroid method. Of the 20 models analysed, 11 models showed that the MRPM falls in July, while 9 models showed that the MRPM falls in August for all-India. The model names and their MPRM are given in Table 2. Moreover, the MRPM of historical and projected data are also calculated for each meteorological subdivision for all models. The results are discussed in Section 3.3.3 and Section 3.4.

3.3. Selecting the Best Model

Of the 20 CMIP5 models, we have selected the best models based on MRPM count, average intensity and spatial distribution.

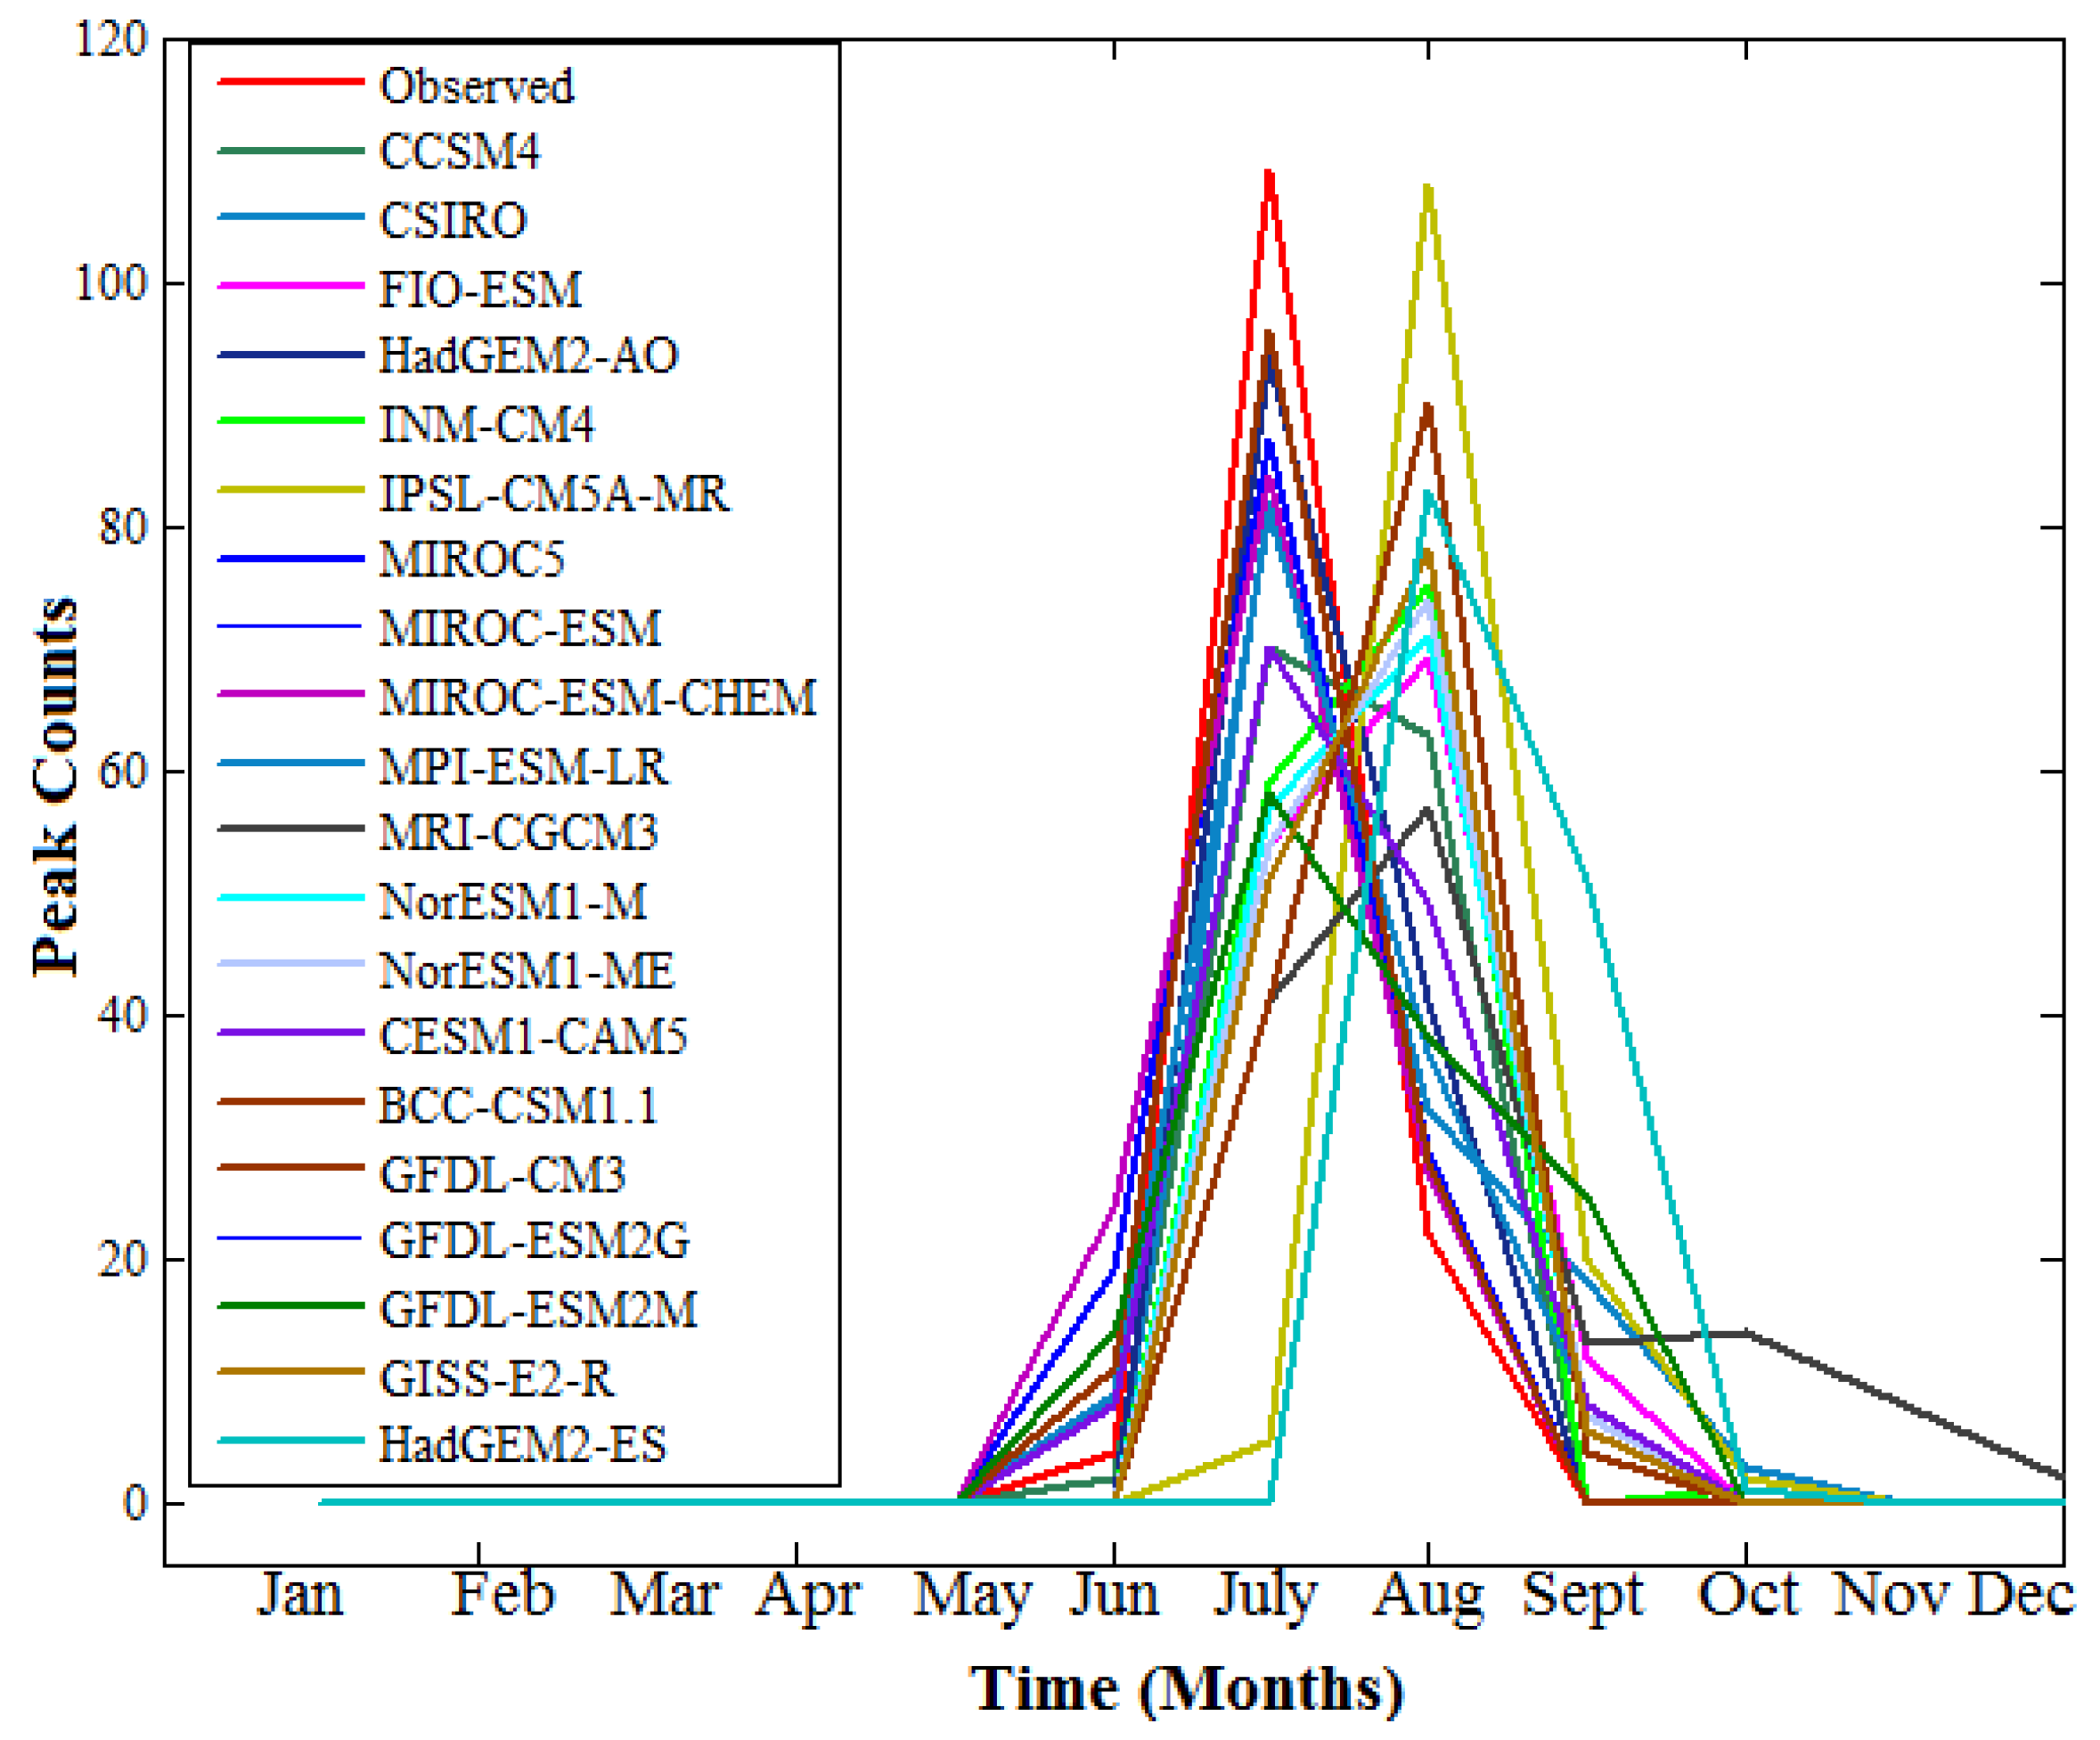
3.3.1. On the Basis of MRPM Count

With the specific end of identifying the models that best fit for the observed data, the MRPM count from 1871 to 2005 is calculated, which indicates the number of times MRPM is repeated over the time period.The peak count for observation dataset and 20 models are shown in Figure 2. It is observed from Figure 2 that almost all the models simulate the course of the annual cycle quite well with maximum precipitation during June to September (JJAS) period; however, only nine out of the 20 models capture the peak count. The result shows that the MRPM count for all-India observed is 109 over 135 years. We conclude that the models, namely, CSIRO, FIO-ESM, HadGEM2-AO, MIROC5, MIROC-ESM, MIROC-ESM-CHEM, MPI-ESM-LR, BCC-CSM1.1 and HadGEM2-ES best approximate with observations as per MRPM count.

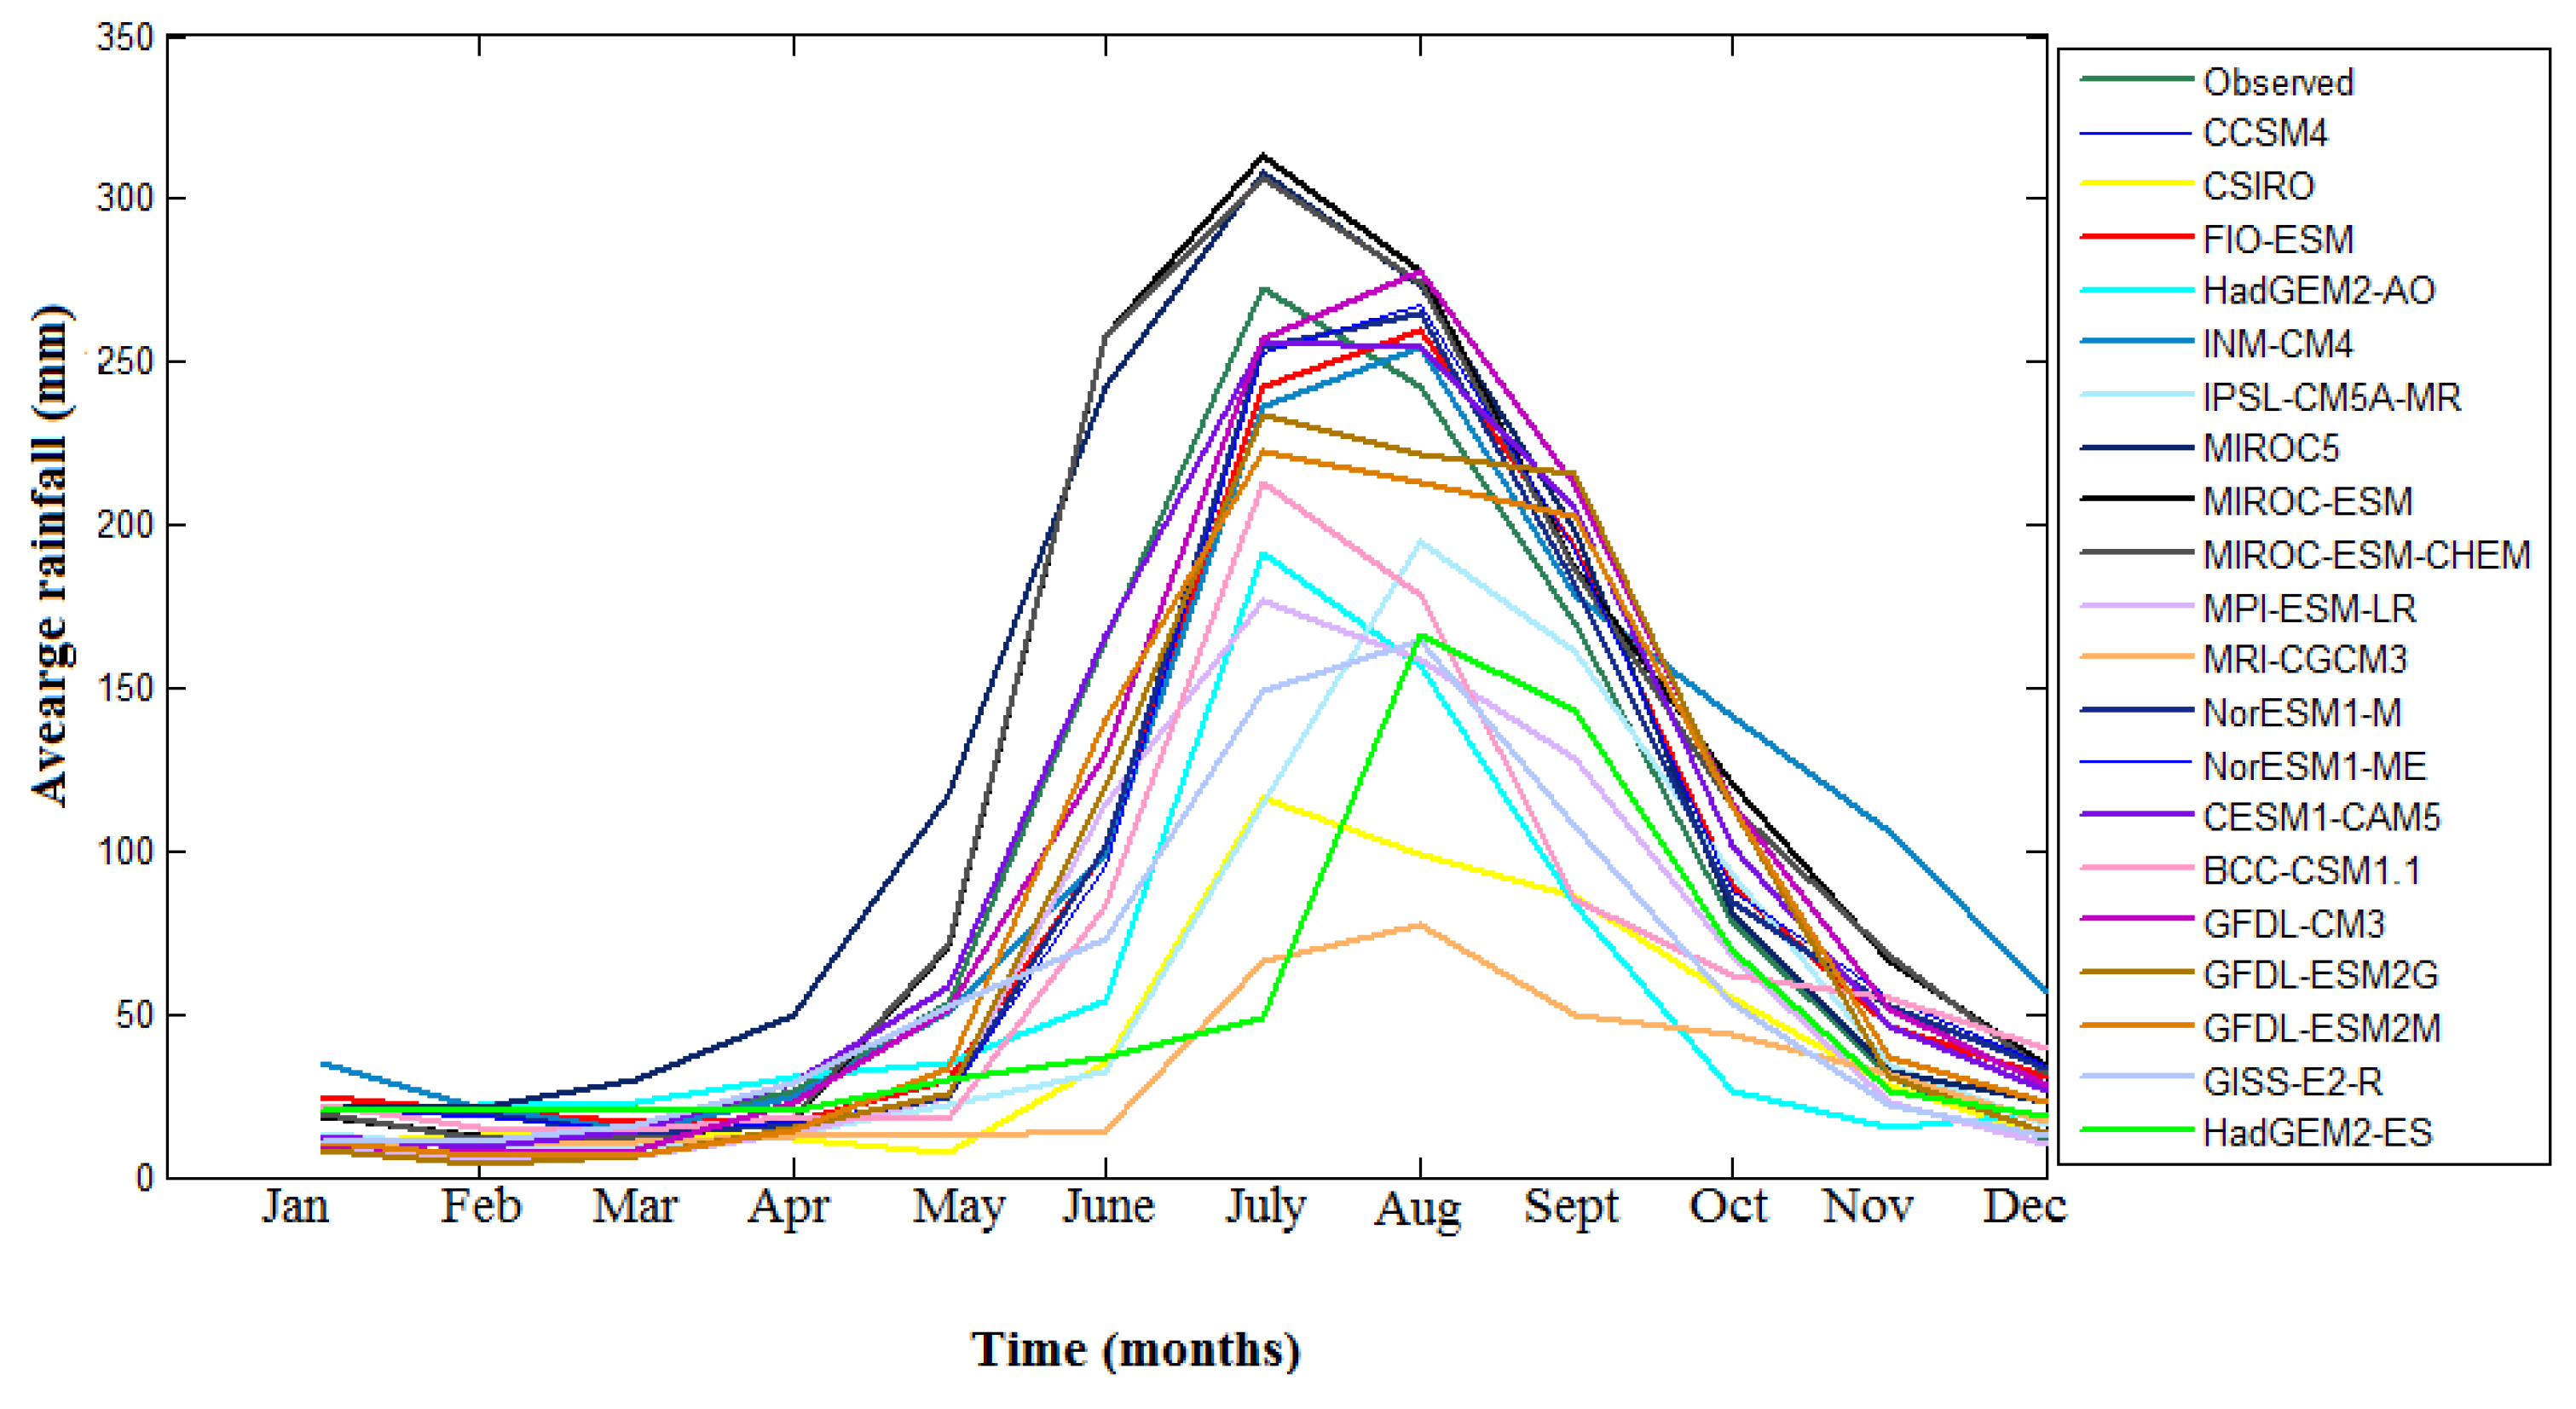
3.3.2. On the Basis of Average Intensity

Furthermore, the average intensity of all-India rainfall has been calculated from 1871 to 2005. The average intensity of rainfall for the observed and 20 models over the year is shown in Figure 3. It is observed from the Figure 3 that seven out of 20 models capture the rainfall intensity approximate to observations. Few others show large differences in magnitude. The rainfall intensity of the models, CCSM4, MIROC5, MIROC-ESM, MIROC-ESM-CHEM, GFDL-CM3, GFDL-ESM2G, and GFDL-ESM2M is closer to the observation rainfall intensity than other models. These observations are consistent with results reported in Menon et al. [5].
Based on these parameters, it is seen that some models work better in both cases. These are MIROC-ESM, MIROC-5, and MIROC-ESM-CHEM. Thus, these models are considered for the projection of the meteorological subdivisions. Besides this, the models HadGEM2-AO, BCC-CSM1.1, CCSM4 and CESM1-CAM5 capture the peak count well, but fail to capture the magnitude of rainfall. Similarly, the model MPI-ESM-LR captures the rainfall intensity but fails in other cases .

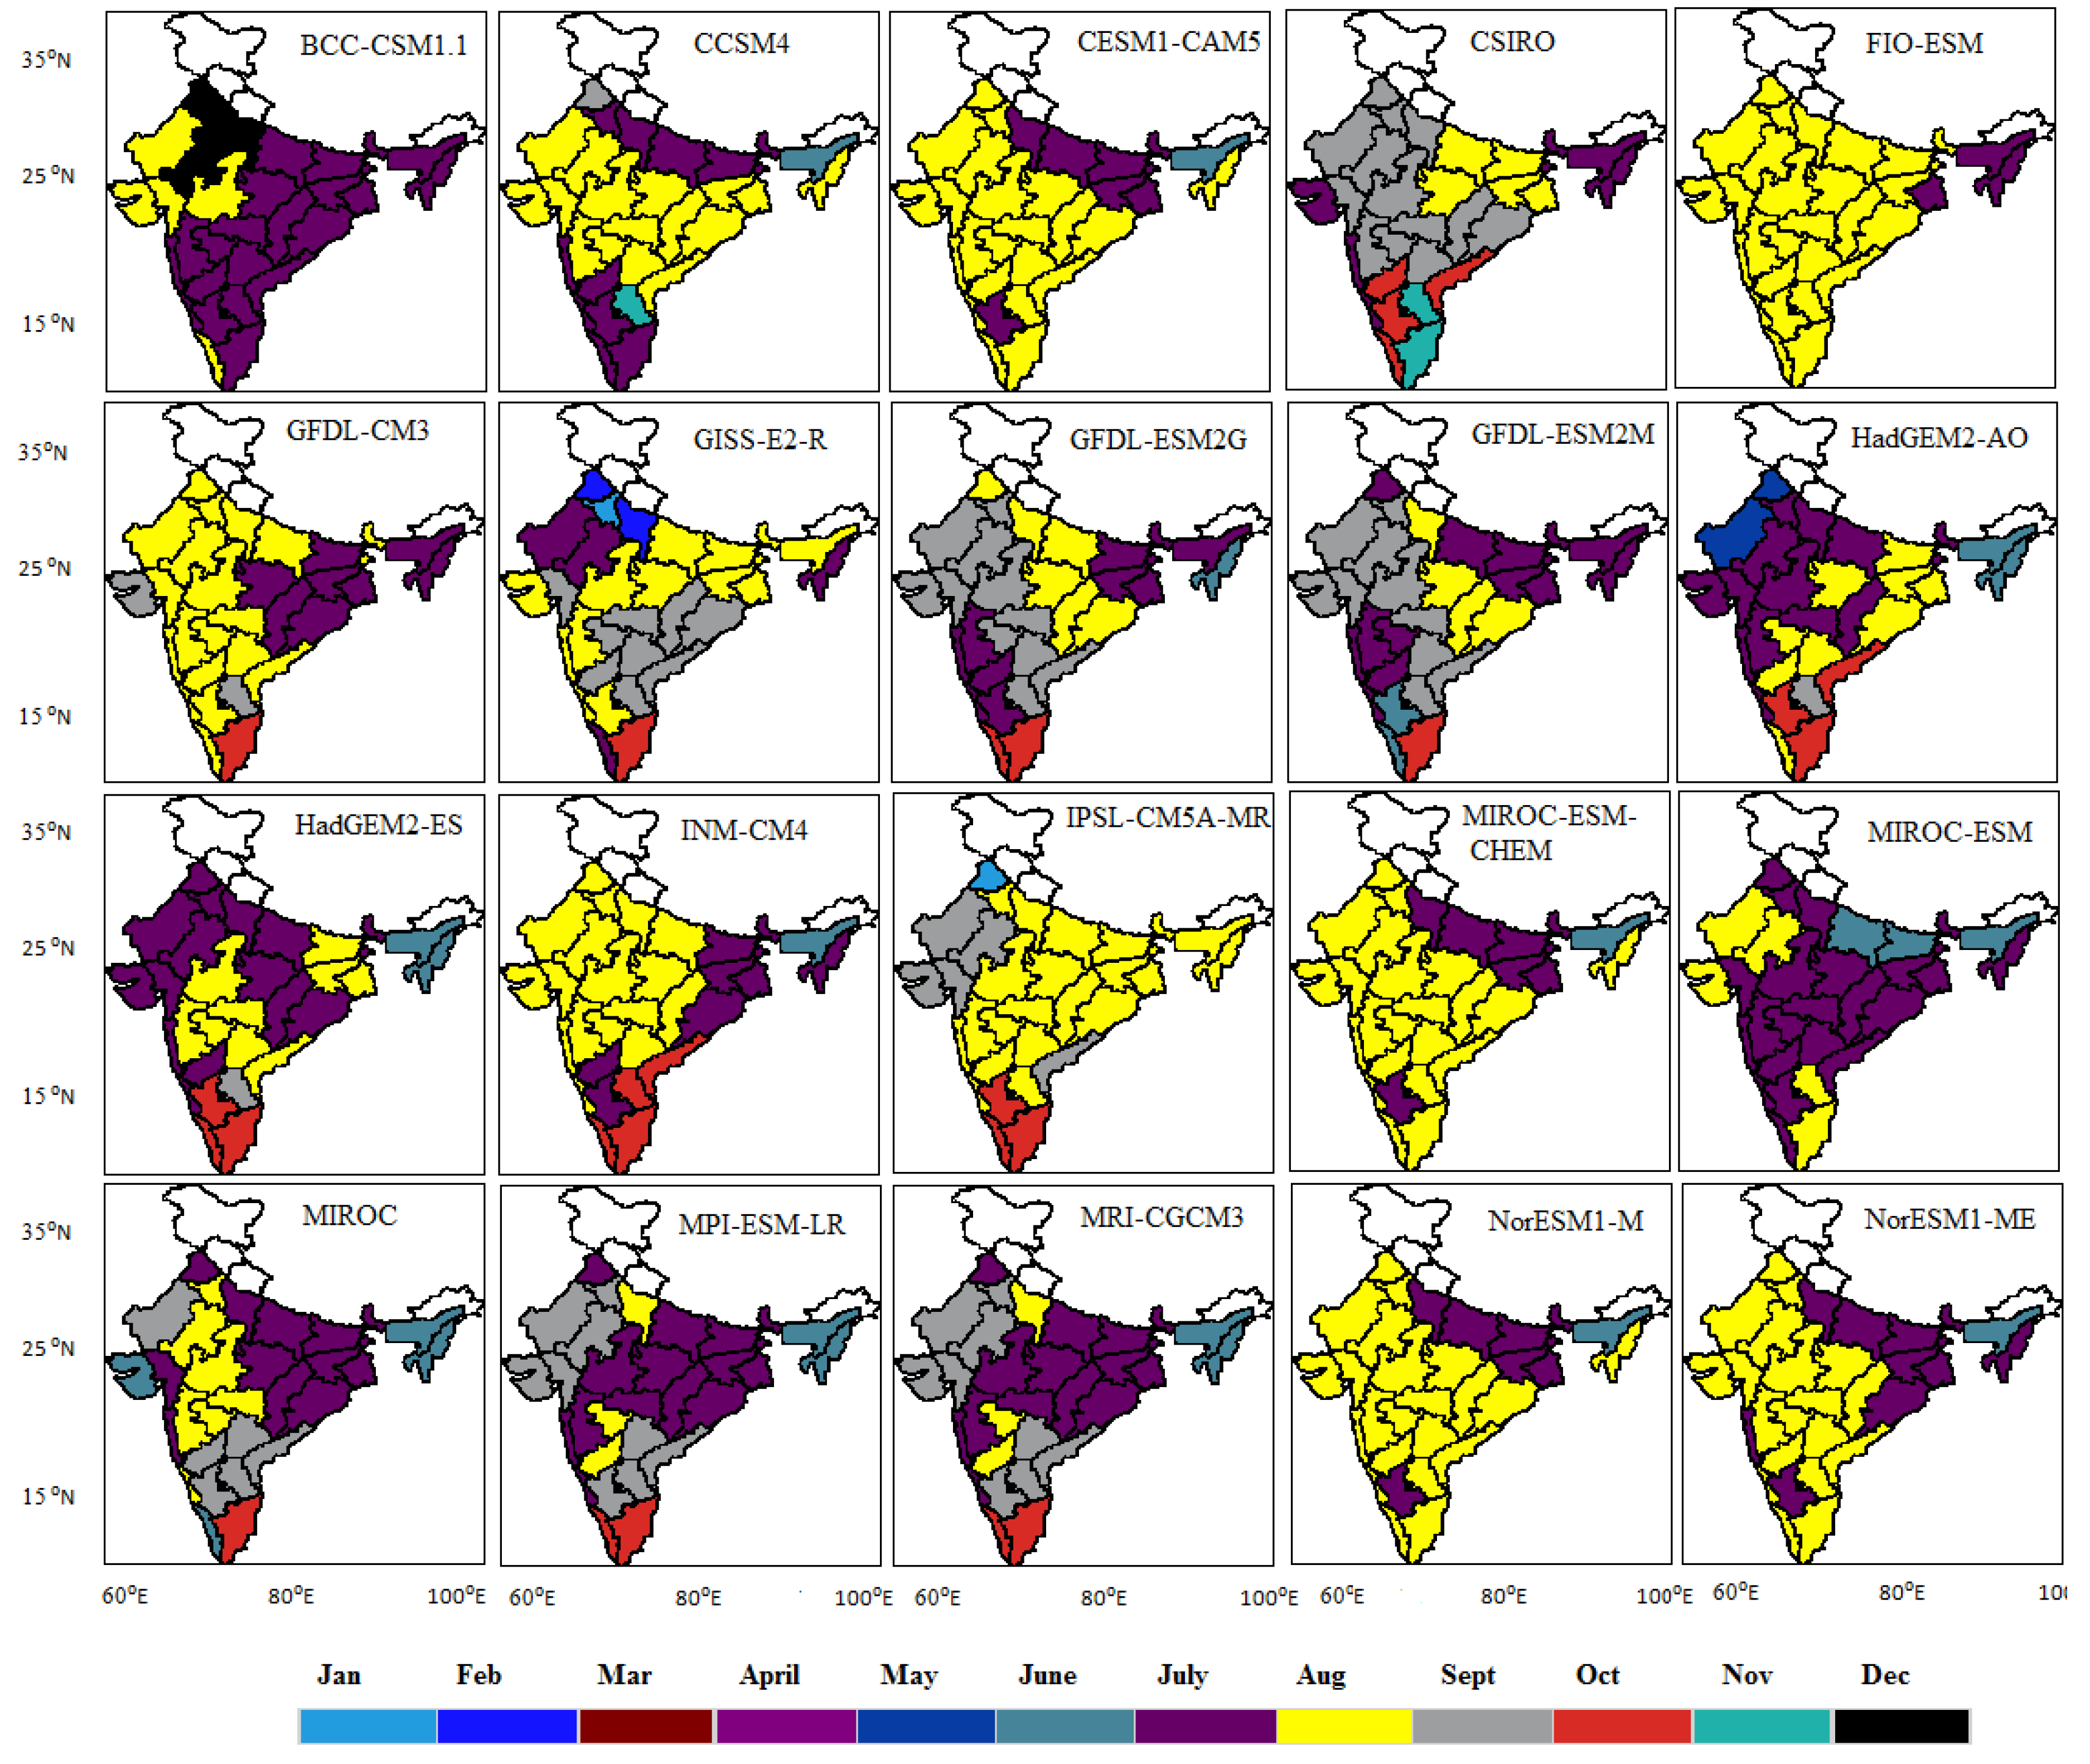
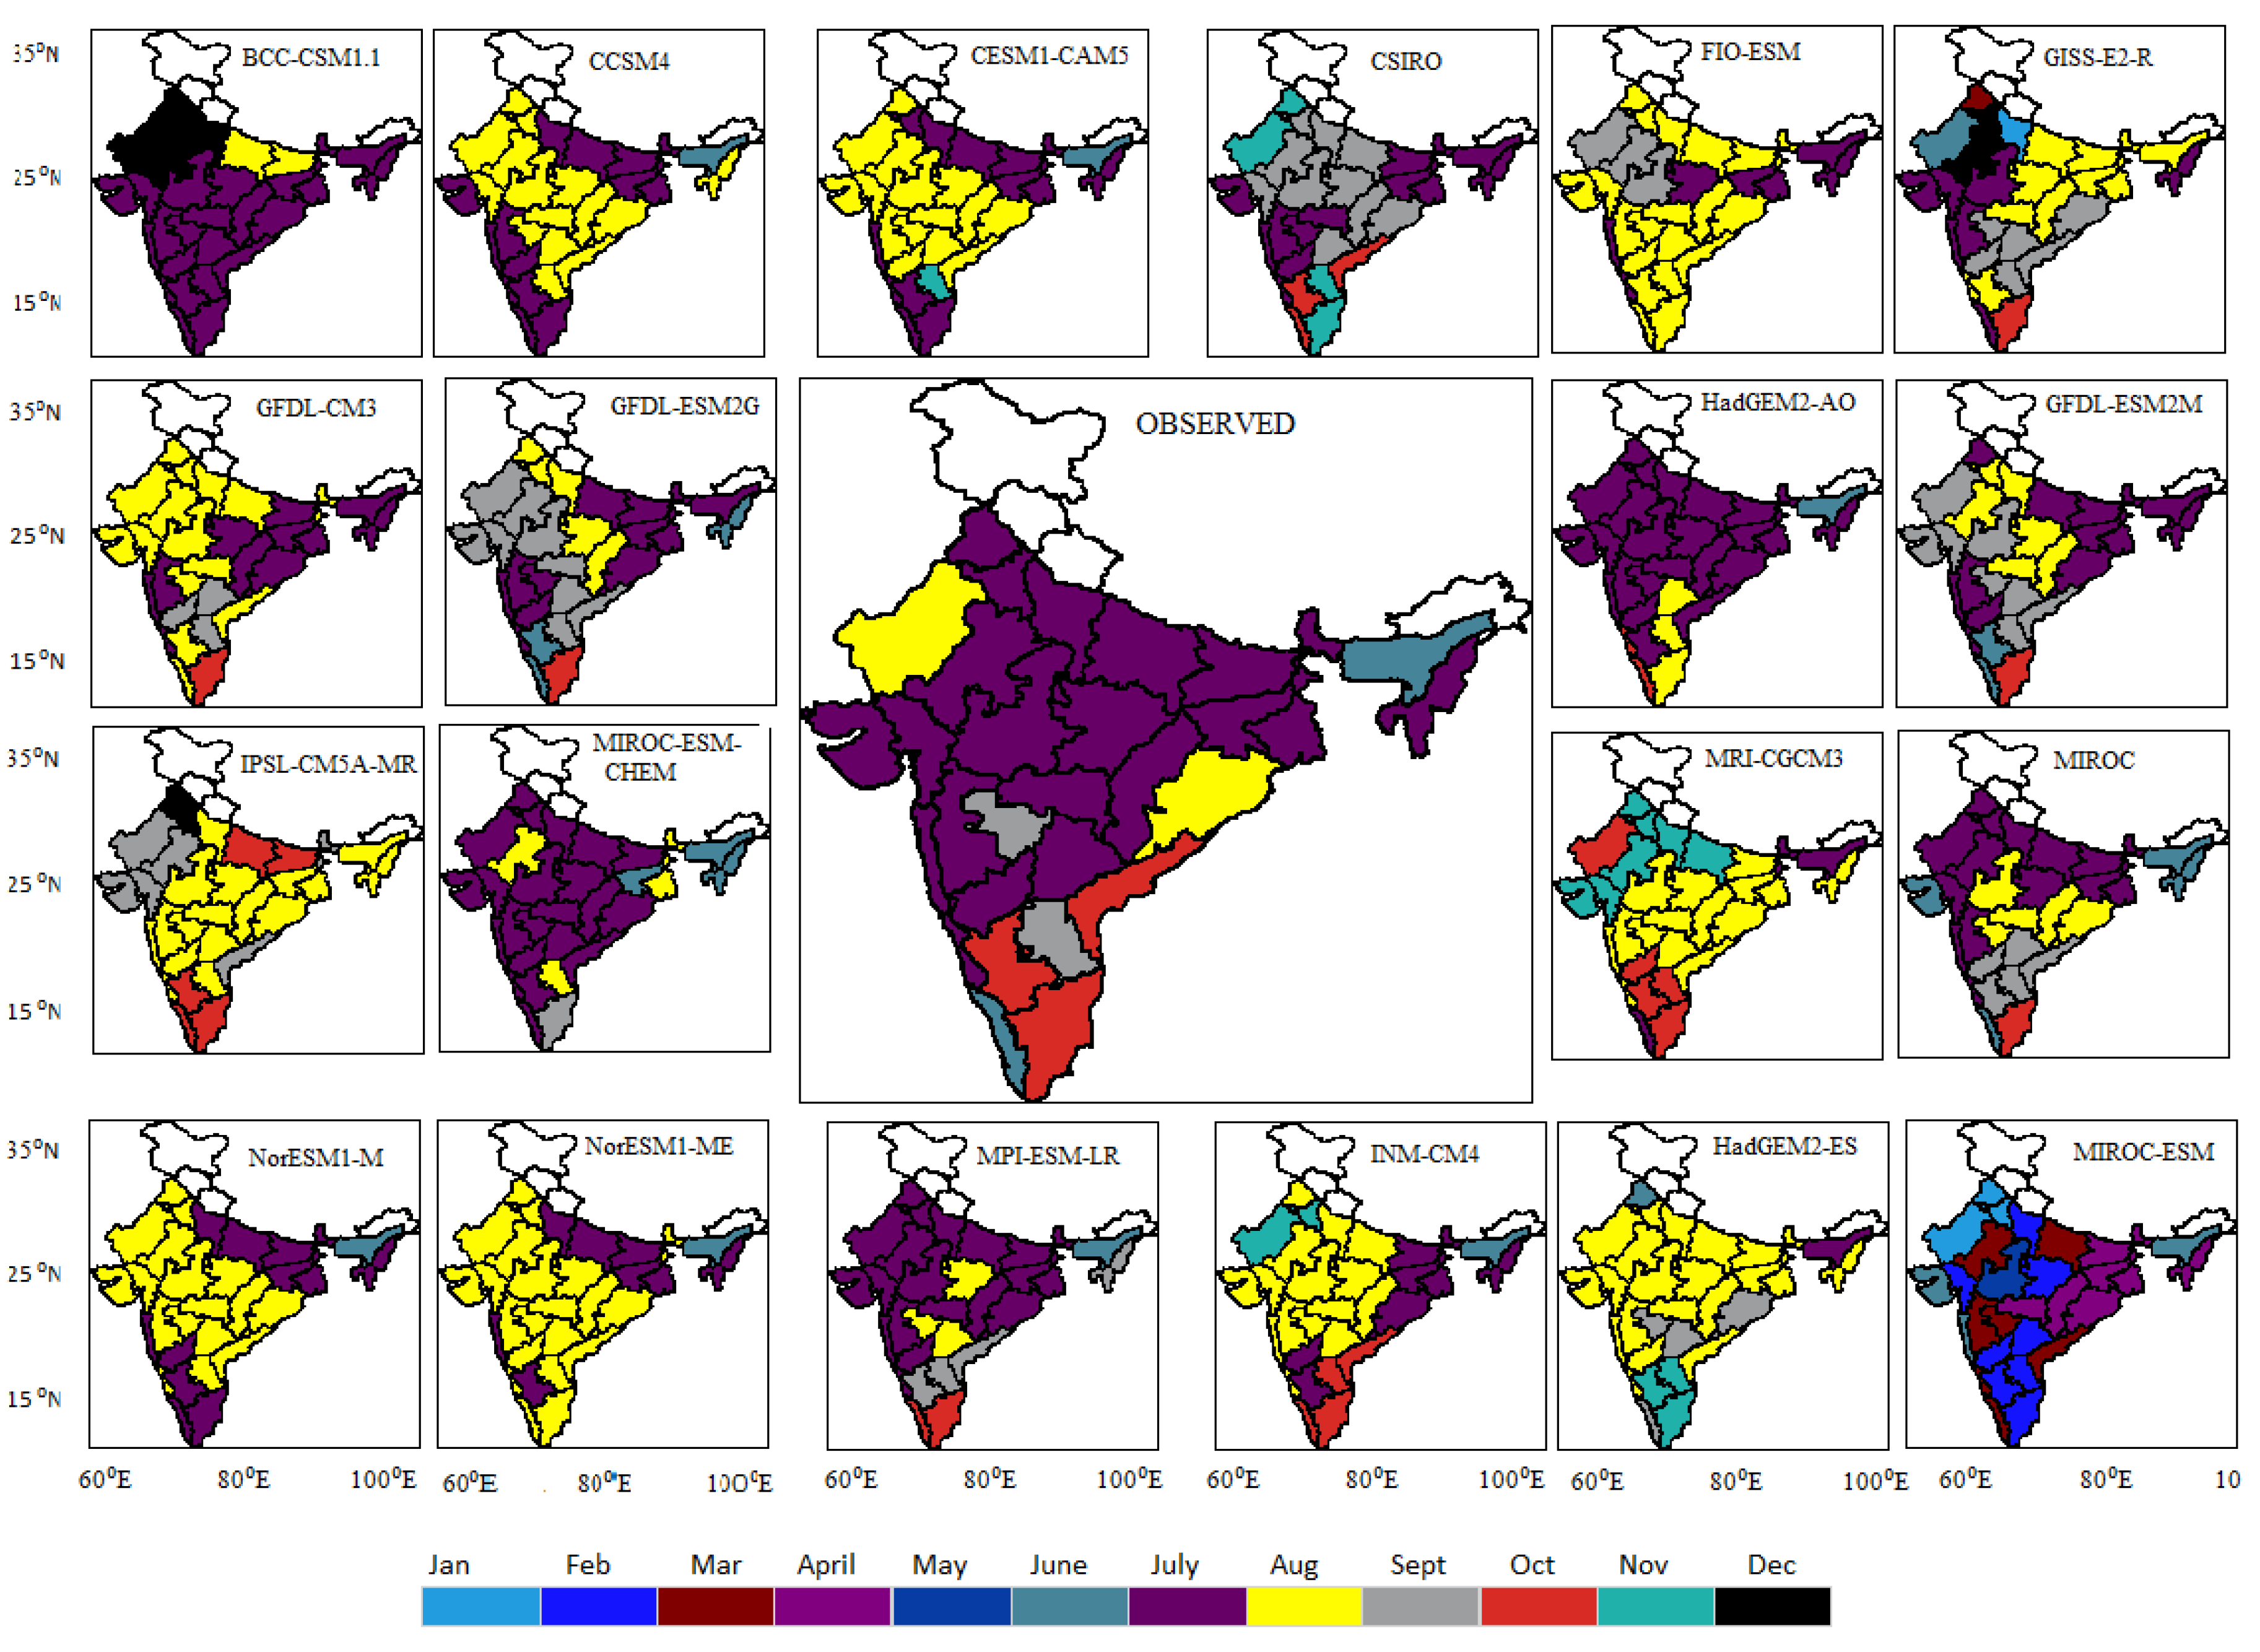
3.3.3. On the Basis of Spatial Patterns

To analyse the similarities in the observed and model geographical distribution, the MRPM of 30 sub-divisions of 20 models is calculated and shown in Figure 4 for the time period 1871–2005. It can be observed from Figure 4 that there is no particular model among 20 CMIP5 that can capture the spatial distribution of MRPM. Some of the models capture the behaviour of the summer monsoon while others depict the winter monsoons well. The models which capture the winter monsoon do not cover the whole winter monsoon area (as depicted in observed map). Moreover, It is seen that the models MRI-CGCM3, MPI-ESM-LR and INM-CM4 together capture the winter monsoon with the exception of Kerala.
It can be observed that models like HadGEM2-AO and MIROC-ESM-CHEM capture the summer monsoon well, with two exceptions, i.e. Orissa and West Rajasthan. From Figure 4, the model HadGEM2-AO captures most of the summer monsoon area with small deviations in Orissa, West Rajasthan, Telangana, Marathwada, while model MIROC-ESM-CHEM captures the summer monsoon with small deviations in Orissa, East Rajasthan, Jharkhand, Bihar, Telangana, Marathwada, Nagaland and Manipur. So HadGEM2-AO and MIROC-ESM-CHEM can be considered the best models for the summer monsoon.
We know that the summer monsoon enters India through Kerala, which is most important for agriculture, but only one model GFDL-ESM2M is able to capture the behaviour of the summer monsoon in the Kerala region accurately.
Considering all three parameters, only five models are able to capture the behavior of the annual cycle of monsoon rainfall. The selected models are MIROC5, MIROC-ESM, MIROC-ESM-CHEM, HadGEM2-AO and MPI-ESM-LR. These models are considered for the projection of the annual cycle.

3.4. Best Model Predictions (2006–2100)

We have studied the changes that will take place in the future using projected data (2006–2100). The MRPM of all-India of the projected data of 20 CMIP5 models are given in Table 2. Out of five best models, which are close to the observations, only one model namely, MPI-ESM-LR shows MRPM of all-India is likely to shift from August to July; whereas others are predicting July as MRPM. Our results reveal that the projected MRPM count for models MIROC-ESM and MIROC5 will not change for all-India, whereas MIROC-ESM-CHEM projects reduction in the MRPM count by the end of the 21st century. Also, models like, MIROC-ESM, MIROC5 and MIROC-ESM-CHEM project a reduction in the average intensity of all-India annual cycle by the end of the 21st century.
The spatial distribution of the MRPM of projected data (2006–2100) for all of the 20 models is shown in Figure 5. It is observed that there is no significant changes in projection of the winter monsoon, with the one exception of south interior Karnataka where the MRPM is likely to be in September instead of October. Certain changes are expected in future projections for the summer monsoon. For example, as per the projection of the model HadGEM2-AO, the peak month of rainfall for eastern Uttar Pradesh, eastern Madhya Pradesh, Bihar, and Jharkhand is likely to shift from July to August; whereas the peak months for Nagaland and Manipur are likely to shift from July to June.

4. Conclusions

The possible impact of global warming on the Indian monsoon peak month is of critical importance for agricultural production. In the present paper, we have selected the CMIP5 models whose outputs are the best fits for the observed data. By comparing the model performance with observations, we found that only a few models are able to capture MRPM and rainfall intensity more realistically. Similarly, on comparing the simulated Indian mean monsoon rainfall by CMIP5 during the historical run, the projected future changes of Indian rainfall are summarised.
The models MIRO-ESM, MIROC5, MIROC-ESM-CHEM, HadGEM2-AO and MPI-ESM-LR project no changes in the MRPM of the all-India rainfall, whereas a reduction in the all-India average rainfall has been observed. However, significant changes are projected in various meteorological subdivisions of India in terms of MRPM shifting to earlier or later months.
It has been observed from the results that there is no ideal model which captures best the behaviour of the Indian monsoon. We found that some of the models are able to capture the behaviour of the winter monsoon accurately while others are more suitable for determining the summer monsoon behaviour.
From this study, we conclude that, for the historic time period 1871–2005, models like INM-CM4, MRI-CGCM3 and MPI-ESM-LR are best for capturing the behaviour of the winter monsoon and models like HadGEM2-AO and MIROC-ESM-CHEM best depict the behaviour of the summer monsoon. Moreover, HadGEM2-AO captures the same while covering larger meteorological subdivisions in comparison to the model MIROC-ESM-CHEM.
These models are further taken for a future projection for the time period 2006–2100. From the study of these projections, we conclude that there are no significant changes expected in the winter monsoon, except that the MRPM of South Karnataka is likely to change to September from October. However, some noticeable changes are observed in the summer monsoon. The MRPM of most of subdivisions is likely to change to August from July according to the models HadGEM2-AO and MIROC-ESM-CHEM projection simulation.
The model MIROC-ESM-CHEM projection simulation projects reduction in MRPM count and reduction in average intensity of all-India summer monsoon by the end of 21st century.
In addition, there are three models which capture the onset of the monsoon in the Kerala region. These are MIROC, GFDL-ESM2G, and GFDL-ESM2M. The projections of MIROC and GFDL-ESM2M do not predict any change in the MRPM of Kerala, whereas some changes have been observed in model GFDL-ESM2G, and it is seen that MRPM is likely to shift to October from June, which does not seem plausible as Kerala is the first region to experience the onset of the monsoon.

Acknowledgments

The authors are grateful to Roddam Narasimha (FRS) from the Jawaharlal Nehru Centre for Advanced Scientific Research, Bangalore for all the useful discussions and suggestions on the manuscript. The authors are very greatful to Ministry of Earth Science, New Delhi for providing the necessary data for this study.

Author Contributions

Sarita Azad conceived the idea of the paper and wrote the initial draft. Pravat Jena performed all the simulations. All authors have contributed equally in improvement of the paper.

Conflicts of Interest

The authors declare no conflict of interest.

References

  1. Jena, P.; Azad, S.; Rajeevan, M. Statistical selection of the optimum models in the CMIP5 dataset for climate change projections of Indian monsoon rainfall. Climate 2015, 3, 858–875. [Google Scholar] [CrossRef]
  2. Fisher, E.M.; Knutti, R. Anthropogenic contribution to global occurrence of heavy-precipitation and high-temp extremes. Nat. Clim. Chang. 2015, 5, 560–564. [Google Scholar] [CrossRef]
  3. Azad, S.; Rajeevan, M. Possible shift in the ENSO-Indian monsoon rainfall relationship under future global warming. Nat. Sci. Rep. 2016, 6. [Google Scholar] [CrossRef]
  4. Ashok, K.; Guam, Z.; Yamagata, T. Impact of the Indian Ocean dipole on the relationship between the Indian monsoon rainfall and ENSO. Geogr. Res. Lett. 2001, 28, 4499–4502. [Google Scholar] [CrossRef]
  5. Menon, A.; Levermann, A.; Schewe, J.; Lehmann, J.; Frieler, K. Consistent increase in Indian monsoon rainfall and its variability across CMIP-5 models. Earth Syst. Dyn. 2013, 4, 287–300. [Google Scholar] [CrossRef]
  6. Kumar, K.K. Impact of Climate Change on India’s Monsoonal Climate and Development of High Resolution Climate Change Scenarios for India; Indian Institute of Tropical Meteorology: Pune, India, 2009. [Google Scholar]
  7. Kumar, K.R.; Sahai, A.K.; Kumar, K.K.; Patwardhan, S.K.; Mishra, P.K.; Revadekar, J.V.; Kamala, K.; Pant, G.B. High-resolution climate change scenarios for India for the 21st century. Curr. Sci. 2006, 90, 334–345. [Google Scholar]
  8. Sharmila, S.; Joseph, S.; Sahai, A.K.; Abhilash, S.; Chattopadhyay, R. Future projection of Indian summer monsoon variability under climate change scenario: An assessment from CMIP5 climate models. Glob. Planet. Chang. 2015, 124, 62–78. [Google Scholar] [CrossRef]
  9. Duncan, J.M.A.; Dash, J.; Atkinson, P.M. Analysing temporal trends in the Indian summer monsoon and its variability at a fine spatial resolution. Clim. Chang. 2013, 117, 119–131. [Google Scholar] [CrossRef]
  10. Harrison, M. The development of seasonal and inter-annual climate forecasting. Clim. Chang. 2005, 70, 201–220. [Google Scholar] [CrossRef]
  11. Rajendran, K.; Sajani, S.; Jayasankar, C.B.; Kitoh, A. How dependent is climate change projection of Indian summer monsoon rainfall and extreme events on model resolution? Curr. Sci. 2013, 104, 1409–1418. [Google Scholar]
  12. Revadekar, J.V.; Patwardhan, S.K.; Kumar, K.R. Characteristic features of precipitation extremes over India in the warming scenarios. Adv. Meteorol. 2011, 28, 4499–4502. [Google Scholar] [CrossRef]
  13. Goswami, B.N.; Venugopal, V.; Sengupta, D.; Madhusoodanan, M.S.; Xavier, P.K. Increasing trend of extreme rain events over India in a warming environment. Science 2006, 314, 1442–1445. [Google Scholar] [CrossRef] [PubMed]
  14. Rajeevan, M.; Bhate, J.; Jaswal, A.K. Analysis of variability and trends of extreme rainfall events over India using 104 years of gridded daily rainfall data. Geophys. Res. Lett. 2008, 35. [Google Scholar] [CrossRef]
  15. Kulkarni, A.; Kripalani, R.H.; Sabde, S.S. Examining Indian Monsoon Variability in Coupled Climate Model Simulations and Projections; Research Report No. RR-125; Indian Institute of Tropical Meteorology: Pune, India, 2010. [Google Scholar]
  16. Sathiyamoorthy, V.; Joshi, P.C. Impact of increased CO2 on rainfall over Indian monsoon region in IPCC-AR4 CGCM simulations. In Proceedings of the ISPRS Ahmedabad 2009 Workshop: Impact of Climate Change on Agriculture, Ahmedabad, India, 17–18 December 2010.
  17. Seth, A.; Rauscher, S.A.; Biasutti, M.; Giannini, A.; Camargo, S.J.; Rojas, M. CMIP5 projected changes in the annual cycle of precipitation in monsoon regions. J. Clim. 2013, 26, 7328–7351. [Google Scholar] [CrossRef]
  18. Pascale, S.; Lucarini, V.; Feng, X.; Porporato, A.; Hasson, S. Projected changes of rainfall seasonality and dry spells in a high concentration pathway 21st century scenario. Clim. Dyn. 2015. [Google Scholar] [CrossRef]
  19. Lin, H.; Wang, B. The time-space structure of the Asian-Pacific summer monsoon: A fast annual cycle view. J. Clim. 2002, 15, 2001–2019. [Google Scholar] [CrossRef]
  20. Feng, X.; Porporato, I.; Rodriguez-Iturbe, I. Changes in rainfall seasonality in the tropics. Nat. Clim. Chang. 2013, 3, 811–815. [Google Scholar] [CrossRef]
  21. Parthasarathy, B.; Munot, A.A.; Kothawale, D.R. Monthly and Seasonal Rainfall Series for All-India Homogeneous Regions and Meteorological Subdivisions: 1871–1994; Indian Institute of Tropical Meteorology: Pune, India, 1995. [Google Scholar]
  22. Taylor, K.E.; Stouffer, R.J.; Meehl, G.A. An Overview of CMIP5 and the experiment design. Bull. Am. Meteorol. Soc. 2012, 93, 485–498. [Google Scholar] [CrossRef]
  23. Sperber, K.R.; Annamalai, H.; Kang, I.S.; Kitoh, A.; Moise, A.; Turner, A.; Wang, B.; Zhou, T. The Asian summer monsoon: An intercomparison of CMIP5 vs. CMIP3 simulations of the late 20th century. Clim. Dyn. 2013, 41, 2711–2744. [Google Scholar] [CrossRef]
  24. Pai, D.S.; Rajeevan, M. Indian summer monsoon onset: Variability and prediction. J. Earth Syst. Sci. 2009, 118, 123–135. [Google Scholar] [CrossRef]
Figure 1. Observed MRPM across meteorological sub-divisions during 1871–2005.
Climate 04 00014 g001
Figure 2. MRPM count for all-India observed and models for all months over the time period 1871–2005.
Climate 04 00014 g002
Figure 3. Average intensity of all-India observed and models over the time period 1871–2005.
Climate 04 00014 g003
Figure 4. Historical MRPM Indian meteorological sub-divisions of the 20 models.
Climate 04 00014 g004
Figure 5. Projected MRPM of Indian meteorological sub-division of the 20 models.
Climate 04 00014 g005
Table 1. Details of the coupled model inter-comparison project 5 (CMIP5) models considered for the study.
S.noModel (Long° × Lat°)Modeling Centre (Group)
1.CCSM4 (1.25 × 0.9424)National Center for Atmospheric Research, U.S.A (NOAA)
2.CSIRO-Mk3.6.0 (1.8750 × 1.8497)Commonwealth Scientific & Industrial Research Organization in collaboration with Queensland Climate Change Center of Excellence
3.FIO-ESM (2.815 × 2.7673)The First Institute of Oceanography, SOA, China
4.HadGEM2-AO (1.8750 × 1.25)UKMO (United Kingdom Meteorological Office)Hadley Centre.
5.INM-CM4 (2 × 1.50)Institute for Numerical Mathematics, Russia
6.IPSL-CM5A-MR (2.5 × 1.2676)Institute Pierre-Simon Laplace, France
7.MIROC5 (1.4063 × 1.389)Japan Agency for Marine-Earth Science and Technology, Atmosphere and Ocean Research Institute, and National Institute for Environmental Studies, Japan
8.MIROC-ESM (2.8125 × 2.7673)Japan Agency for Marine-Earth Science and Technology, Atmosphere and Ocean Research Institute, and National Institute for Environmental Studies, Japan
9.MIROC-ESM-CHEM (2.8125 × 2.7673)Japan Agency for Marine-Earth Science and Technology, Atmosphere and Ocean Research Institute, and National Institute for Environmental Studies, Japan
10.MPI-ESM-LR (1.25 × 0.9424)Max Planck Institute for Meteorology, Germany
11.MRI-CGCM3 (1.125 × 1.1121)Meteorological Research Institute, Japan
12.NorESM1-M (2.5 × 1.8947)Norwegian Climate Centre, Norway
13.NorESM1-ME (2.5 × 1.8947)Norwegian Climate Centre, Norway
14.CESM1-CAM5 (1.25 × 0.9424)Community Earth System Model Contributors, NCAR (National Centre of Atomsperic Research) USA
15.BCC-CSM-1.1 (2.8125 × 2.7673)Beijing Climate Center, China Meteorological Administration
16.GFDL-CM3 (2.5 × 2)NOAA Geophysical Fluid Dynamics Laboratory
17.GFDL-ESM2G (2.5 × 1.5169)NOAA Geophysical Fluid Dynamics Laboratory
18.GFDL-ESM2M (2.5 × 1.5169)NOAA Geophysical Fluid Dynamics Laboratory
19.GISS-E2-R (2.5 × 2)NASA Goddard Institute for Space Studies
20.HadGEM2-ES (1.8750 × 1.25)Met Office Hadley Centre
Table 2. Monsoon rainfall peak month (MRPM) of historical and projection data of models for all-India.
ModelsHistorical (Peak Month)Projection (Peak Month)
CCSM4JulyJuly
CSIROJulyAugust
FIO-ESMAugustAugust
HadGEM2-AOJulyJuly
INM-CM4AugustAugust
IPSL-CM5A-MRJulyAugust
MIROC5JulyJuly
MIROC-ESM-JulyJuly
MIROC-ESM-CHEMJulyJuly
MPI-ESM-LRAugustJuly
MRI-CGCM3AugustAugust
NorESM1-MAugustAugust
NorESM1-MEAugustJuly
CESM1-CAM5JulyAugust
BCC-CSM1.1JulyJuly
GFDL-CM3AugustAugust
GFDL-ESM2GJulyJuly
GFDL-ESM2MJulyJuly
GISS-E2-RAugustAugust
HadGEM2-ESAugustJuly

