Article

Application of an Online-Coupled Regional Climate Model, WRF-CAM5, over East Asia for Examination of Ice Nucleation Schemes: Part I. Comprehensive Model Evaluation and Trend Analysis for 2006 and 2011

1
Department of Marine, Earth, and Atmospheric Sciences, North Carolina State University , 2800 Faucette Drive, Raleigh, NC 27695, USA
2
Collaborative Innovation Center for Regional Environmental Quality, Beijing 100084, China
3
Atmospheric Sciences and Global Change Division, Pacific Northwest National Laboratory, Richland, WA 99354, USA
4
Center for Earth System Science, Tsinghua University, Beijing 100084, China
5
The School of Environment, Tsinghua University, Beijing 100084, China
*
Author to whom correspondence should be addressed.
Climate 2015, 3(3), 627-667; https://doi.org/10.3390/cli3030627
Submission received: 21 May 2015 / Revised: 21 July 2015 / Accepted: 24 July 2015 / Published: 18 August 2015

Abstract

:
Online-coupled climate and chemistry models are necessary to realistically represent the interactions between climate variables and chemical species and accurately simulate aerosol direct and indirect effects on cloud, precipitation, and radiation. In this Part I of a two-part paper, simulations from the Weather Research and Forecasting model coupled with the physics package of Community Atmosphere Model (WRF-CAM5) are conducted with the default heterogeneous ice nucleation parameterization over East Asia for two full years: 2006 and 2011. A comprehensive model evaluation is performed using satellite and surface observations. The model shows an overall acceptable performance for major meteorological variables at the surface and in the boundary layer, as well as column variables (e.g., precipitation, cloud fraction, precipitating water vapor, downward longwave and shortwave radiation). Moderate to large biases exist for cloud condensation nuclei over oceanic areas, cloud variables (e.g., cloud droplet number concentration, cloud liquid and ice water paths, cloud optical depth, longwave and shortwave cloud forcing). These biases indicate a need to improve the model treatments for cloud processes, especially cloud droplets and ice nucleation, as well as to reduce uncertainty in the satellite retrievals. The model simulates well the column abundances of chemical species except for column SO2 but relatively poor for surface concentrations of several species such as CO, NO2, SO2, PM2.5, and PM10. Several reasons could contribute to the underestimation of major chemical species in East Asia including underestimations of anthropogenic emissions and natural dust emissions, uncertainties in the spatial and vertical distributions of the anthropogenic emissions, as well as biases in meteorological, radiative, and cloud predictions. Despite moderate to large biases in the chemical predictions, the model performance is generally consistent with or even better than that reported for East Asia with only a few exceptions. The model generally reproduces the observed seasonal variations and the difference between 2006 and 2011 for most variables or chemical species. Overall, these results demonstrate promising skills of WRF-CAM5 for long-term simulations at a regional scale and suggest several areas of potential improvements.

1. Introduction

Online-coupled climate/meteorology-chemistry models are essential tools for simulating the real atmosphere in which gases, aerosols, and cloud interact through many physical and chemical processes that influence air pollution, weather, and climate ([1,2]). A number of online-coupled models on regional and global scales have been developed since the mid-90s. Detailed reviews of recently developed online-coupled models can be found in several review papers (e.g., [1,2,3,4]). Current online-coupled models differ largely in their treatments of the impacts of aerosols on the formation of various types of clouds including warm, ice, mixed-phase, and convective clouds. While most models represent aerosol activation for cloud droplet formation in warm and mixed-phase clouds, very few models account for the impacts of aerosols on the formation of cumulus and ice clouds. Differences in aerosol-cloud interaction treatments contribute to the largest uncertainties in predicting aerosol indirect effects by online-coupled models.
To facilitate the use of regional models as testbed for physics parameterizations used in global models, a new online-coupled climate and chemistry model, i.e., the Weather Research and Forecasting model coupled with chemistry (WRF/Chem) ([5]) with the physics suite of Community Atmospheric Model version 5 (referred to as WRF-CAM5) ([6,7]) has been recently developed. WRF-CAM5 is based on WRF/Chem version 3.5 released as of April 2013 and CAM version 5.0 released as of June 2010. WRF-CAM5, with the CAM5 physics suite (i.e., aerosol, cloud, deep and shallow convections, and turbulence) as described in Neale et al. [8] and Liu et al. [9] has been used to estimate the radiative forcing and climatic impacts of aerosols (e.g., [6]). WRF-CAM5 offers several heterogeneous ice nucleation parameterizations (INPs) for mixed-phase cloud regimes including the default INP based on Meyers et al. [10] and three new INPs based on Niemand et al. [11], Phillips et al. [12], and DeMott et al. [13] that were recently incorporated into WRF-CAM5 and evaluated using observations of a supercell storm case over Oklahoma in Central U.S. WRF-CAM5 with different heterogeneous INPs predict quite different cloud ice, snow, and liquid water and they are highly sensitive to the dependent variables such as the surface areas of dust particles, which may lead to large uncertainty in simulating dust effects on clouds and radiative forcing. As a newly developed online-coupled model, there has been very limited evaluation of WRF-CAM5 for its capability in simulating climate, air pollutants, and various climate-chemistry feedback mechanisms.
In this study, WRF-CAM5 with two INPs: the Meyers et al. [10] (M92) and the Niemand et al. [11] (N12) INPs is applied to East Asia for two full years: 2006 and 2011. A comprehensive model evaluation is first conducted using available observations from various surface networks and satellites, and the results using the two INPs are then intercompared and analyzed. Since WRF-CAM5 is a newly developed model, a comprehensive evaluation of its meteorological and chemical predictions is necessary to assess its skills in reproducing available observations because the model’s skills may affect the evaluation and comparison of ice nucleation schemes within WRF-CAM5. As Part I of a two-part study, this paper describes the selected years, model setup, and evaluation of baseline simulations for the two selected years using the M92 INP. Part II describes the sensitivity simulations using the N12 INP for both years and the intercomparison between results using M92 and N12. The objectives of this study are to evaluate the performance of WRF-CAM5 in simulating climate, air pollutants, and their interactions in 2006 and 2011, as well as the differences between 2006 and 2011, and to examine the sensitivity of model predictions to model representations of heterogeneous ice nucleation processes for mixed-phase clouds.

2. Simulation Episodes, Model Configurations, and Evaluation Protocols

2.1. Modeling Episode and Setup

During the past decades, East Asia, especially China, experienced a rapid economic increase in conjunction with urbanization, leading to increased emissions and severe air pollutions. For example, the emissions of SO2 and NOx over China have increased by 60% and 80%, respectively, from 2000 to 2006. The drastic growth of energy and natural resources consumption leads to dramatically increased exposure to major trace gases and aerosols and subsequently significant air quality degradation. Hao et al. [14] reported that 207 out of 522 cities with air quality monitoring sites in China were severely polluted and in non-attainment zones. Due to the high anthropogenic emissions and natural emissions of mineral dust as well as the long range transport of primary and secondary pollutants, East Asia provides a supreme testbed for studying aerosol-cloud interactions and ice nucleation in mixed-phase clouds as well as for evaluating the model performance of WRF-CAM5 under a variety of atmospheric conditions ranging from coastal/desert to heavily-polluted conditions.
In this work, WRF-CAM5 simulations over East Asia are performed at a horizontal grid resolution of 36-km and a vertical resolution of 23 layers from 1000 hP to 100 hP for two full years: 2006 and 2011. An emission reduction target of 10% reduction of SO2 emission from 2005 to 2010 was proposed in the Chinese 11th (2006–2010) Five-Year Plan (FYP11). Based on the proposed emission reduction targets in the Chinese 12th (2011–2015) Five-Year Plan (FYP12), the total emissions of SO2 and NOx are projected to be reduced by 8% and 10% from 2010 to 2015, respectively. As the first year of the FYP11, 2006 is considered as the year with the highest SO2 emissions during 2000 to 2011. The selection of 2006 and 2011 permits an examination of the impacts of proposed emission changes on air quality from 2006 to 2011 due to the emission control policies during FYP11 and FYP12. In addition, according to NOAA’s Climate Prediction Center (CPC), two separate cool-phase La Niña events were observed in 2011, resulting in relatively colder winter and spring compared to 2006. However, a warmer summer was reported in 2011. Due to the impact of the La Niña events, the global precipitation over land in 2011 is the second highest since 1900, behind 2010. The precipitation anomalies vary across East Asia, with northwestern China wetter and northeastern China drier in 2011. Such differences in meteorology may have impacts on air quality. In this study, the model’s responses to the emission reductions and the changes in meteorology from 2006 to 2011 are examined.
Table 1 summarizes the major physics and chemistry options used in this study. The major physics options include the Rapid Radiative Transfer Model for Global Climate Models (GCMs) (RRTMG) longwave and shortwave radiation schemes ([15,16]), the Community NCEP, Oregon State University, Air Force, and Hydrologic Research Lab-NWS Land Surface Model (NOAH) ([17]), the Monin-Obukhov surface layer scheme ([18,19]), the University of Washington boundary layer scheme from CAM5 ([20]), the Zhang-Macfarlane cumulus scheme ([21]) with the modifications from Song and Zhang ([22]), the Morrison two-moment cloud microphysics scheme ([23]), and the Fast Tropospheric Ultraviolet-Visible (FTUV) photolysis scheme ([24,25]). For aerosol activation to form cloud droplets, the default AR-G02 parameterization of Abdul-Razzak and Ghan ([26]) is used to simulate the impact of aerosols on the formation of warm, mixed-phase, and convective clouds. The primary ice crystal nucleation treatment is based on the scheme developed by Liu et al. [27] (L07), which simulates homogeneous ice nucleation, heterogeneous deposition nucleation, immersion freezing, and contact freezing in mixed-phase and cirrus clouds. Immersion freezing is based on the formulation of Bigg ([28]), contact freezing follows the parameterization of Young ([29]), and heterogeneous deposition/condensation nucleation is based on M92. While M92 is used in the baseline simulations, N12 is used in the sensitivity simulations to be described in the Part II paper. The gas-phase and aqueous-phase chemistry is baesd on the Carbon-Bond mechanism version Z (CBMZ) ([30]) and the simple aqueous-phase chemical mechanism of Barth et al. ([31]), respectively. A 3-mode (i.e., Aitken, accumulation, and coarse modes) modal aerosol module (MAM3) is used to predict aerosol number and mass concentrations of major aerosol species, including black carbon (BC), mineral dust, sulfate (SO42−), ammonium (NH4+), sea salt, and primary and secondary organic aerosols (POA and SOA, respectively).
The meteorological initial and boundary conditions are from the National Centers for Environmental Prediction/Final (NCEP/FNLs) Reanalysis Meteorological data. The chemical initial conditions are from the Community Multiscale Air Quality (CMAQ) modeling system, and the chemical boundary conditions are from the Goddard Earth Observing System Atmospheric Chemistry Transport Model (GEOS-Chem). The simulations with the M92 and N12 INPs are conducted for 2006 and 2011 with two weeks for spin up. An additional simulation with the N12 INP but without dust emissions is performed. The results for the five full years are evaluated and analyzed in this and the companion papers.
Table 1. Model configurations and inputs used in this study.
AttributeModel Configuration
ModelWRF-CAM5
Simulation period18 December 2005 to 31 December 2006 (spinup from 18–31 December 2005)
18 December 2010 to 31 December 2011 (spinup from 18–31 December 2005)
DomainEast Asia
Horizontal resolution36 km (164 × 97)
Vertical resolution23 layers from 1000 mb to 100 mb, with 8 layers in PBL
Shortwave radiationThe Rapid Radiative Transfer Method for GCMs (RRTMG) ([15,16])
Longwave radiationRRTMG ([15,16])
Land surfaceCommunity NCEP, Oregon State University, Air Force, and Hydrologic Research Lab-NWS Land Surface Model (NOAH) ([17])
Surface layerMonin-Obukhov ([18,19])
PBLUW boundary layer scheme from CAM5 ([20])
CumulusZhang-MaCfarlane ([21]) with modifications from Song and Zhang ([22])
MicrophysicsMorrison two-moment scheme ([23])
Aerosol activationAbdul-Razzak and Ghan ([25])
Ice nucleationLiu et al. ([27])
Heterogeneous ice nucleationMeyers ([10]) in the base simulation Niemand ([11]) in the sensitivity simulation
Gas-phase chemistryCarbon-Bond mechanism version Z (CBMZ) ([30])
PhotolysisFast Tropospheric Ultraviolet-Visible (FTUV) ([24])
Aerosol moduleA modal aerosol model with three lognormal modes (MAM3) ([9])
Aqueous-phase chemistryBarth et al. ([31])
Meteorological IC and BCNCEP-FNL reanalysis data; re-initialization every 5 days
Chemical ICCommunity Multiscale Air Quality (CMAQ) modeling system ([32])
Chemical BCThe Goddard Earth Observing System Atmospheric Chemistry Transport Model (GEOS-Chem)
Anthropogenic emissionsMulti-resolution Emission Inventory for China (MEIC) and the Intercontinental Chemical Transport Experiment-Phase B (INTEX-B) for the rest of the domain ([33])
Biogenic emissionsModel of Emissions of Gases and Aerosols from Nature (MEGAN) version 2 ([34])
Dust emissionsZender et al. ([35]) implemented by Wang et al. ([36])
Sea-salt emissionsGong et al. ([37])

2.2. Observational Datasets and Evaluation Metrics

Observational data are taken from surface observations for meteorological variables and gas and aerosol concentrations, and from satellites for meteorological, radiative, aerosol, and cloud variables (Table 2). The meteorological data for surface temperature at 2 meters (T2), air pressure (P), wind speeds at 10 meters (WS10), water vapor mixing rations at 2 meters (Q2), and daily precipitation are available at 900 sites over East Asia from the National Climatic Data Center (NCDC). Several datasets are used to evaluate surface chemical concentration predictions including SO2, NO2, and PM10 derived based on air pollution index (API) over mainland China from the Ministry of Environmental Protection of China (MEP), PM10, PM2.5, SO2, NO2, CO, and O3 over Hong Kong, China from the Environmental Protection Department (EPD) of Hong Kong, NO, NO2, CO, SO2, O3, and PM10 over Japan from the National Institute of Environmental Studies, Japan (NIES), PM10, PM2.5, SO2, NO, NO2, CO, and O3 over Taiwan from the Taiwan Air Quality Monitoring Network (AQMN), and PM10, CO, NO2, O3, and SO2 over South Korea from Air Korea. Observations of PM2.5 and its composition (i.e., SO42−, NO3, NH4+, elemental carbon (EC), and organic carbon (OC)) at a rural site (Miyun (MY)) and a suburban site (Tsinghua University (THU)) in Beijing, China described in Duan et al. ([38]) are also used in the model evaluation. While some datasets have high accuracy (e.g., the accuracy of chemical data from Hong Kong is within ±10% ([39]), some datasets contain large uncertainties, e.g., the concentrations derived based on API are uncertain.
Observational data are also taken from several satellites or satellite-based analysis data for meteorological and chemical column evaluations, including precipitation from the Global Precipitation Climatology Project (GPCP); precipitable water vapor (PWV), cloud fraction (CF), cloud liquid water path (LWP), cloud ice water path (IWP), cloud optical depths (COT), cloud condensation nuclei (CCN) (over ocean), cloud droplet number concentration (CDNC), and aerosol optical depth (AOD) from the Moderate Resolution Imaging Spectroradiometer (MODIS); downward shortwave radiation at surface (SWD), downward longwave radiation at surface (LWD), shortwave cloud forcing (SWCF), and shortwave cloud forcing (LWCF) from the Clouds and the Earth’s Radiant Energy System (CERES); tropospheric ozone residual (TOR) from the Ozone Monitoring Instrument (OMI); column CO mass abundance from the Measurements of Pollution in the Troposphere (MOPITT); and column mass abundances of NO2, SO2, and HCHO from the Scanning Imaging Absorption Spectrometer for Atmospheric Chartography (SCIAMACHY). Terra satellite passes the equator at 10:30 a.m. local time, which corresponds to 0000-0500 UTC when the Terra orbits cross the East Asia domain. Therefore, the simulated monthly mean for all the variables related to MODIS are calculated as the average of model output values during 0000-0500 UTC. Similar to surface network data, uncertainties also exist for satellite-derived data, in particular, CDNC, LWP, IWP, and COT, as discussed in literature (e.g., [40,41]).
Following Zhang et al. ([42]), a number of statistical measures are calculated to assess the domain-wide model performance, such as correlation coefficient (R), normalized mean bias (NMB), normalized mean error (NME), mean bias (MB), mean absolute gross error (MAGE), root mean square error (RMSE), and fractional bias (FB), fractional gross error (FGE), and Index of Agreement (IOA). To minimize the impact of boundary conditions on model evaluation, observations and model outputs within the lateral boundaries defined by the five grid cells on each side of the domain are excluded in calculating the performance statistics. Scatter plots are made for the comparison of observed and simulated surface concentrations of major pollutants at each surface network, including MEP (mainland China), NIES (Japan), AQMN (Taiwan), EPD (Hong Kong), and AirKorea (South Korea). The site-specific comparison of observed and simulated mass concentrations of PM2.5 and its components is performed at MY and THU sites in Beijing, China.
Table 2. Surface and satellite observations used in the model evaluation.
Database*TypeSitesVariables/SpeciesData Frequency
NCDCMeteorologyDomain-widePrecip (mm∙day−1)Daily
T2 (°C)Every 6
RH (%)
Q2 (kg∙kg−1)
WS10 (m∙s−1)
CERESMeteorologyDomain-wideSWD (W∙m−2)Monthly
GLW (W∙m−2)
SWCF (W∙m−2)
LWCF (W∙m−2)
GCPCMeteorologyDomain-widePrecip (mm∙day−1)Monthly
OMIColumnDomain-wideTOR (Dobson Unit)(DU)Monthly
SCIAMACHYColumnDomain-wideSO2(DU)Monthly
NO2 (1015 molecules∙cm−2) HCHO(1015 molecules∙cm−2)
MOPITTColumnDomain-wideCO (1017 molecules∙cm−2)Monthly
MODIS/TERRAColumnDomain-wideCDNC (cm−3)Monthly
AOD
COT
LWP (g∙m−2)
IWP (g∙m−2)
PWV (cm)
CCN (# cm−2) (ocean)
MEPChemistryMainland ChinaSO2, NO2, PM10Daily
NIESChemistryJapanCO, NO, NO2, O3, SO2, and PM10Monthly
AQMNChemistryTaiwanCO, NO, NO2, O3, SO2, PM2.5 and PM10Hourly
EPDChemistryHong KongCO, NO2, O3, SO2, PM2.5 and PM10Hourly
AirKoreaChemistrySouth KoreaCO, NO2, O3, SO2, and PM10Monthly
BeijingChemistryTHU (Beijing)PM2.5, SO42−, NO3, Na+, Cl, and NH4+Weekly
Miyun (Beijing)
EANETChemistryMainland China, Japan, and South KoreaNO, NO2, O3, SO2, PM2.5 , PM10, and SO42−Monthly
* NCDC—National Climate Data Center; CERES—Clouds and the Earth’s Radiant Energy System; GPCP—Global Precipitation Climatology Project; OMI—Ozone Monitoring Instrument; SCIAMACHY—Scanning Imaging Absorption Spectrometer for Atmospheric Chartography; MOPITT—Measurements of Pollution in the Troposphere; MODIS—Moderate Resolution Imaging Spectroradiometer; MEP—Ministry of Environmental Protection of China (http://datacenter.mep.gov.cn/); NIES—National Institute of Environmental Studies, Japan (http://www.nies.go.jp/igreen/index.html); AQMN—Taiwan Air Quality Monitoring Network (http://taqm.epa.gov.tw/taqm/en/default.aspx); EPD—Environmental Protection Department of Hong Kong (http://epic.epd.gov.hk/), AirKorea—air quality data from South Korea (http://www.airkorea.or.kr/), THU—PM data from Tsinghua University, Beijing, China ([38]); EANET—the Acid Deposition Monitoring Network in East Asia (http://www.eanet.asia/).

3. Evaluation of Baseline Simulations

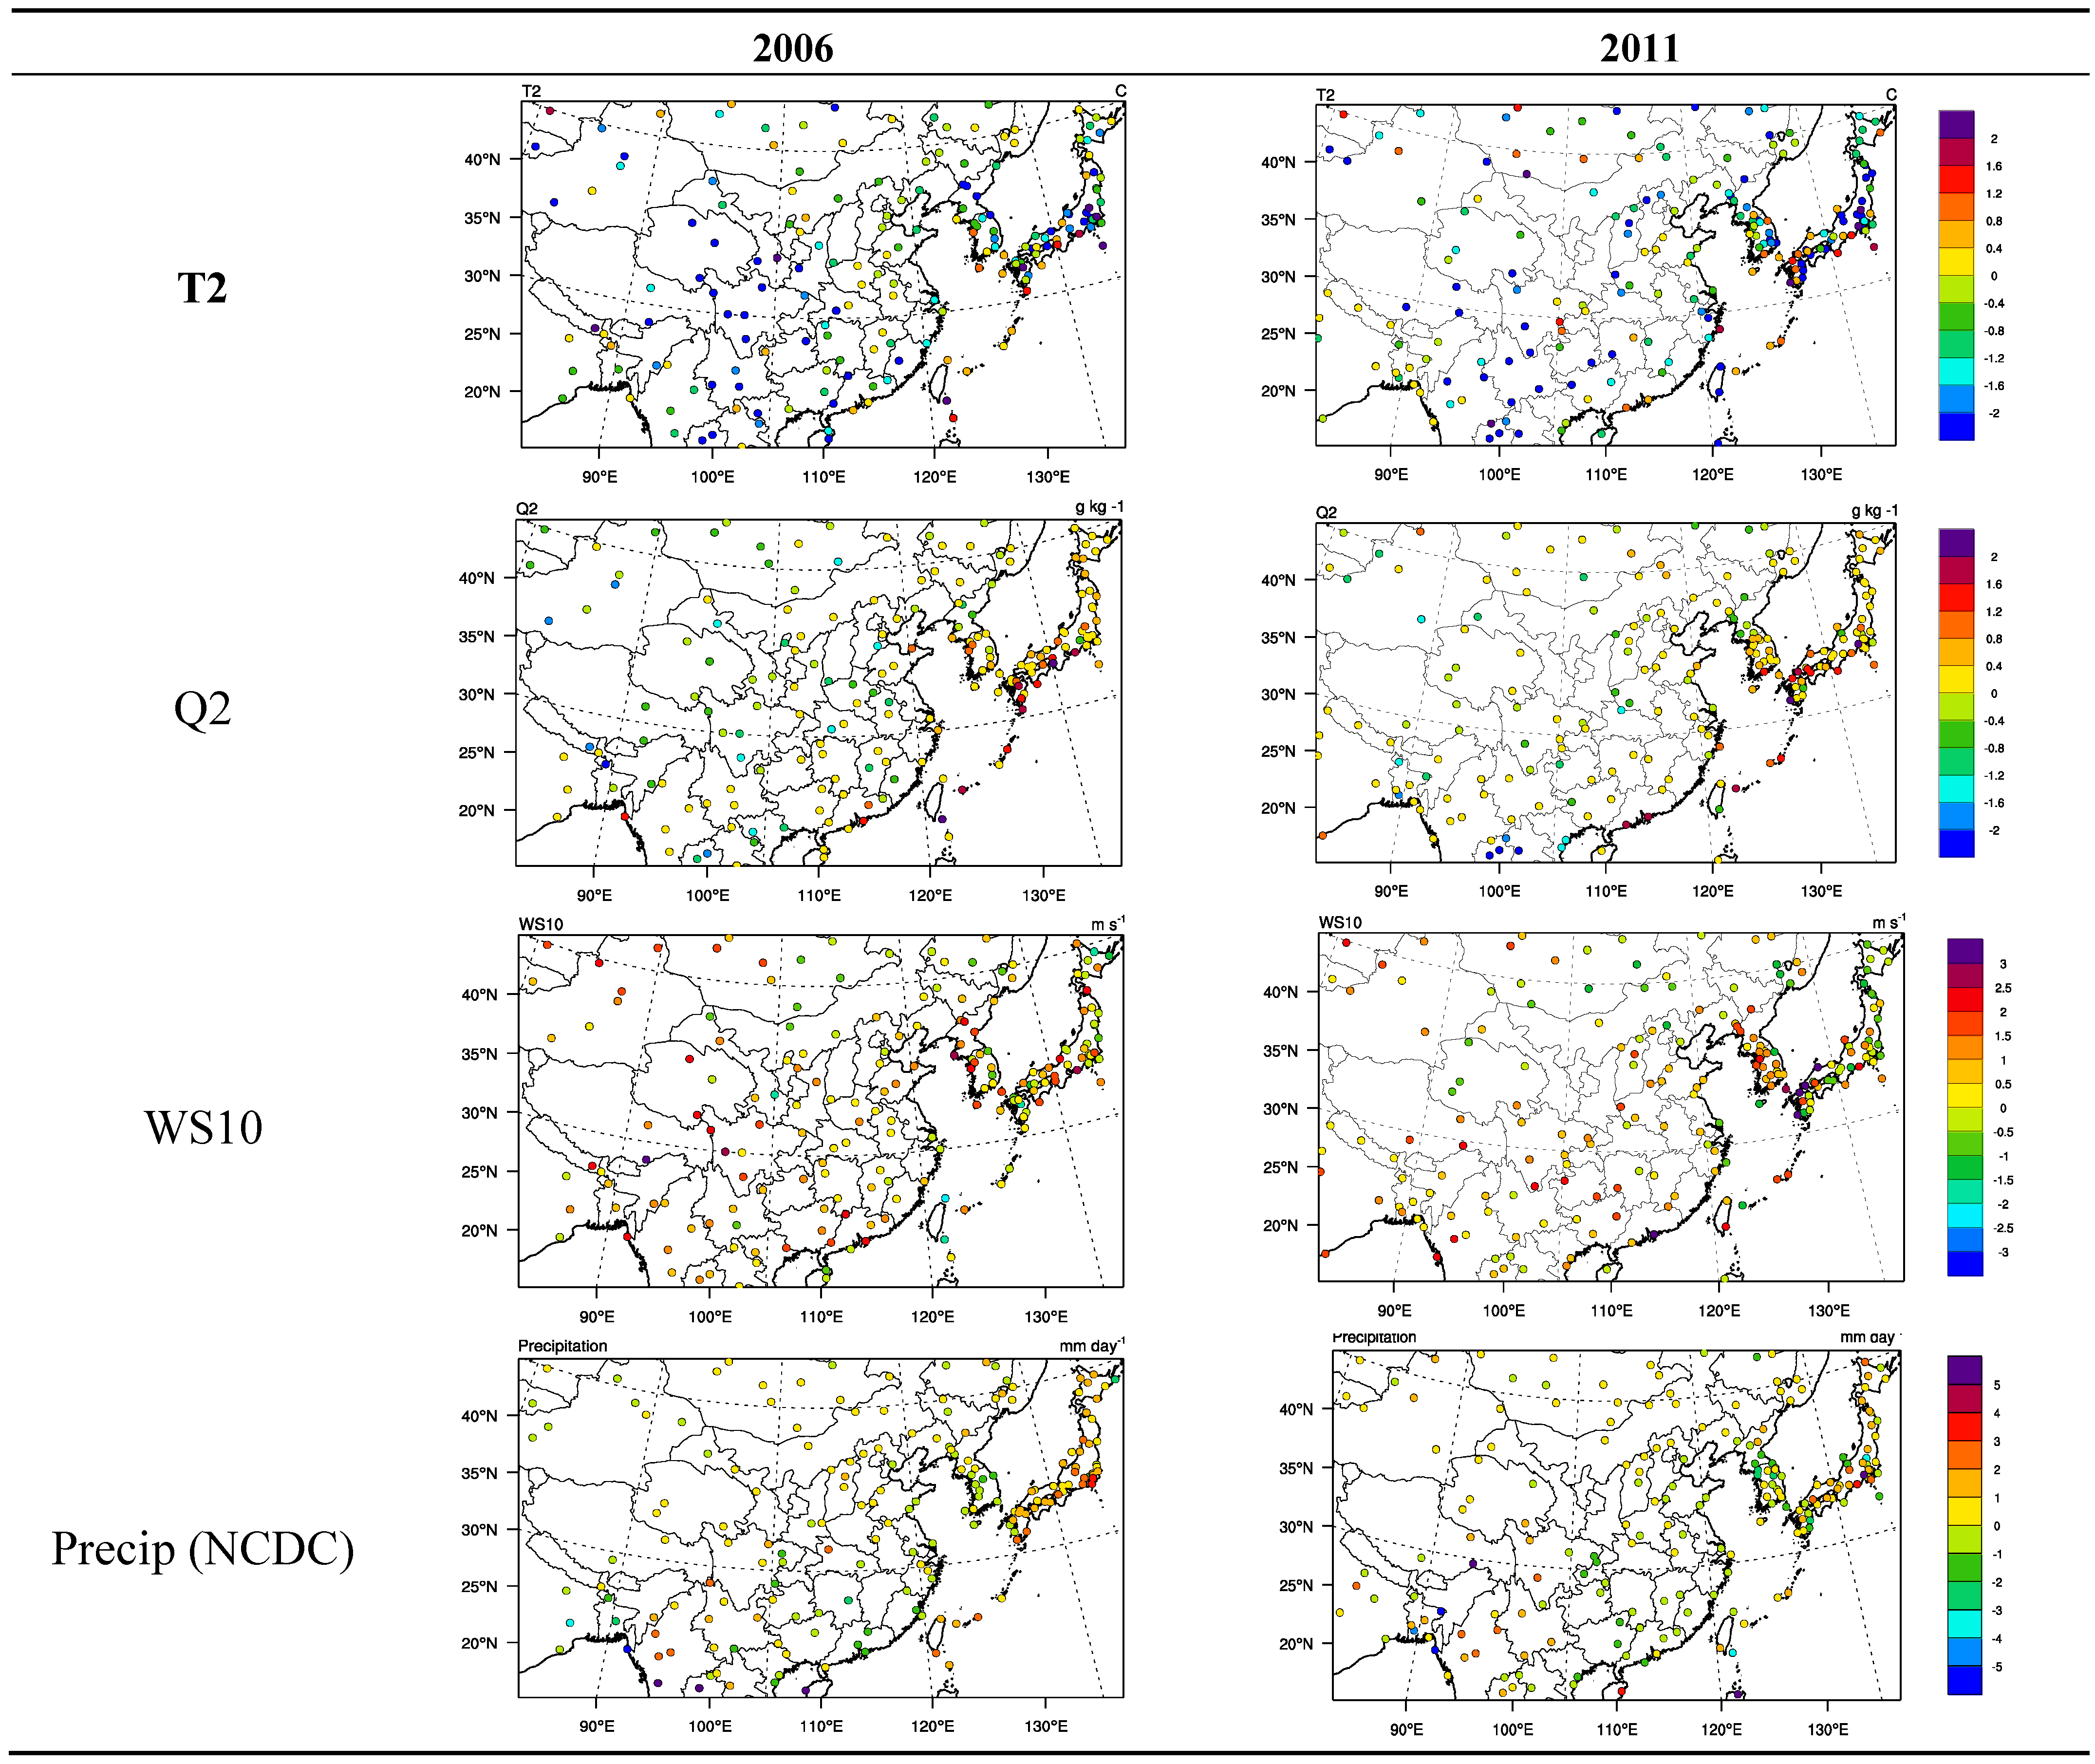
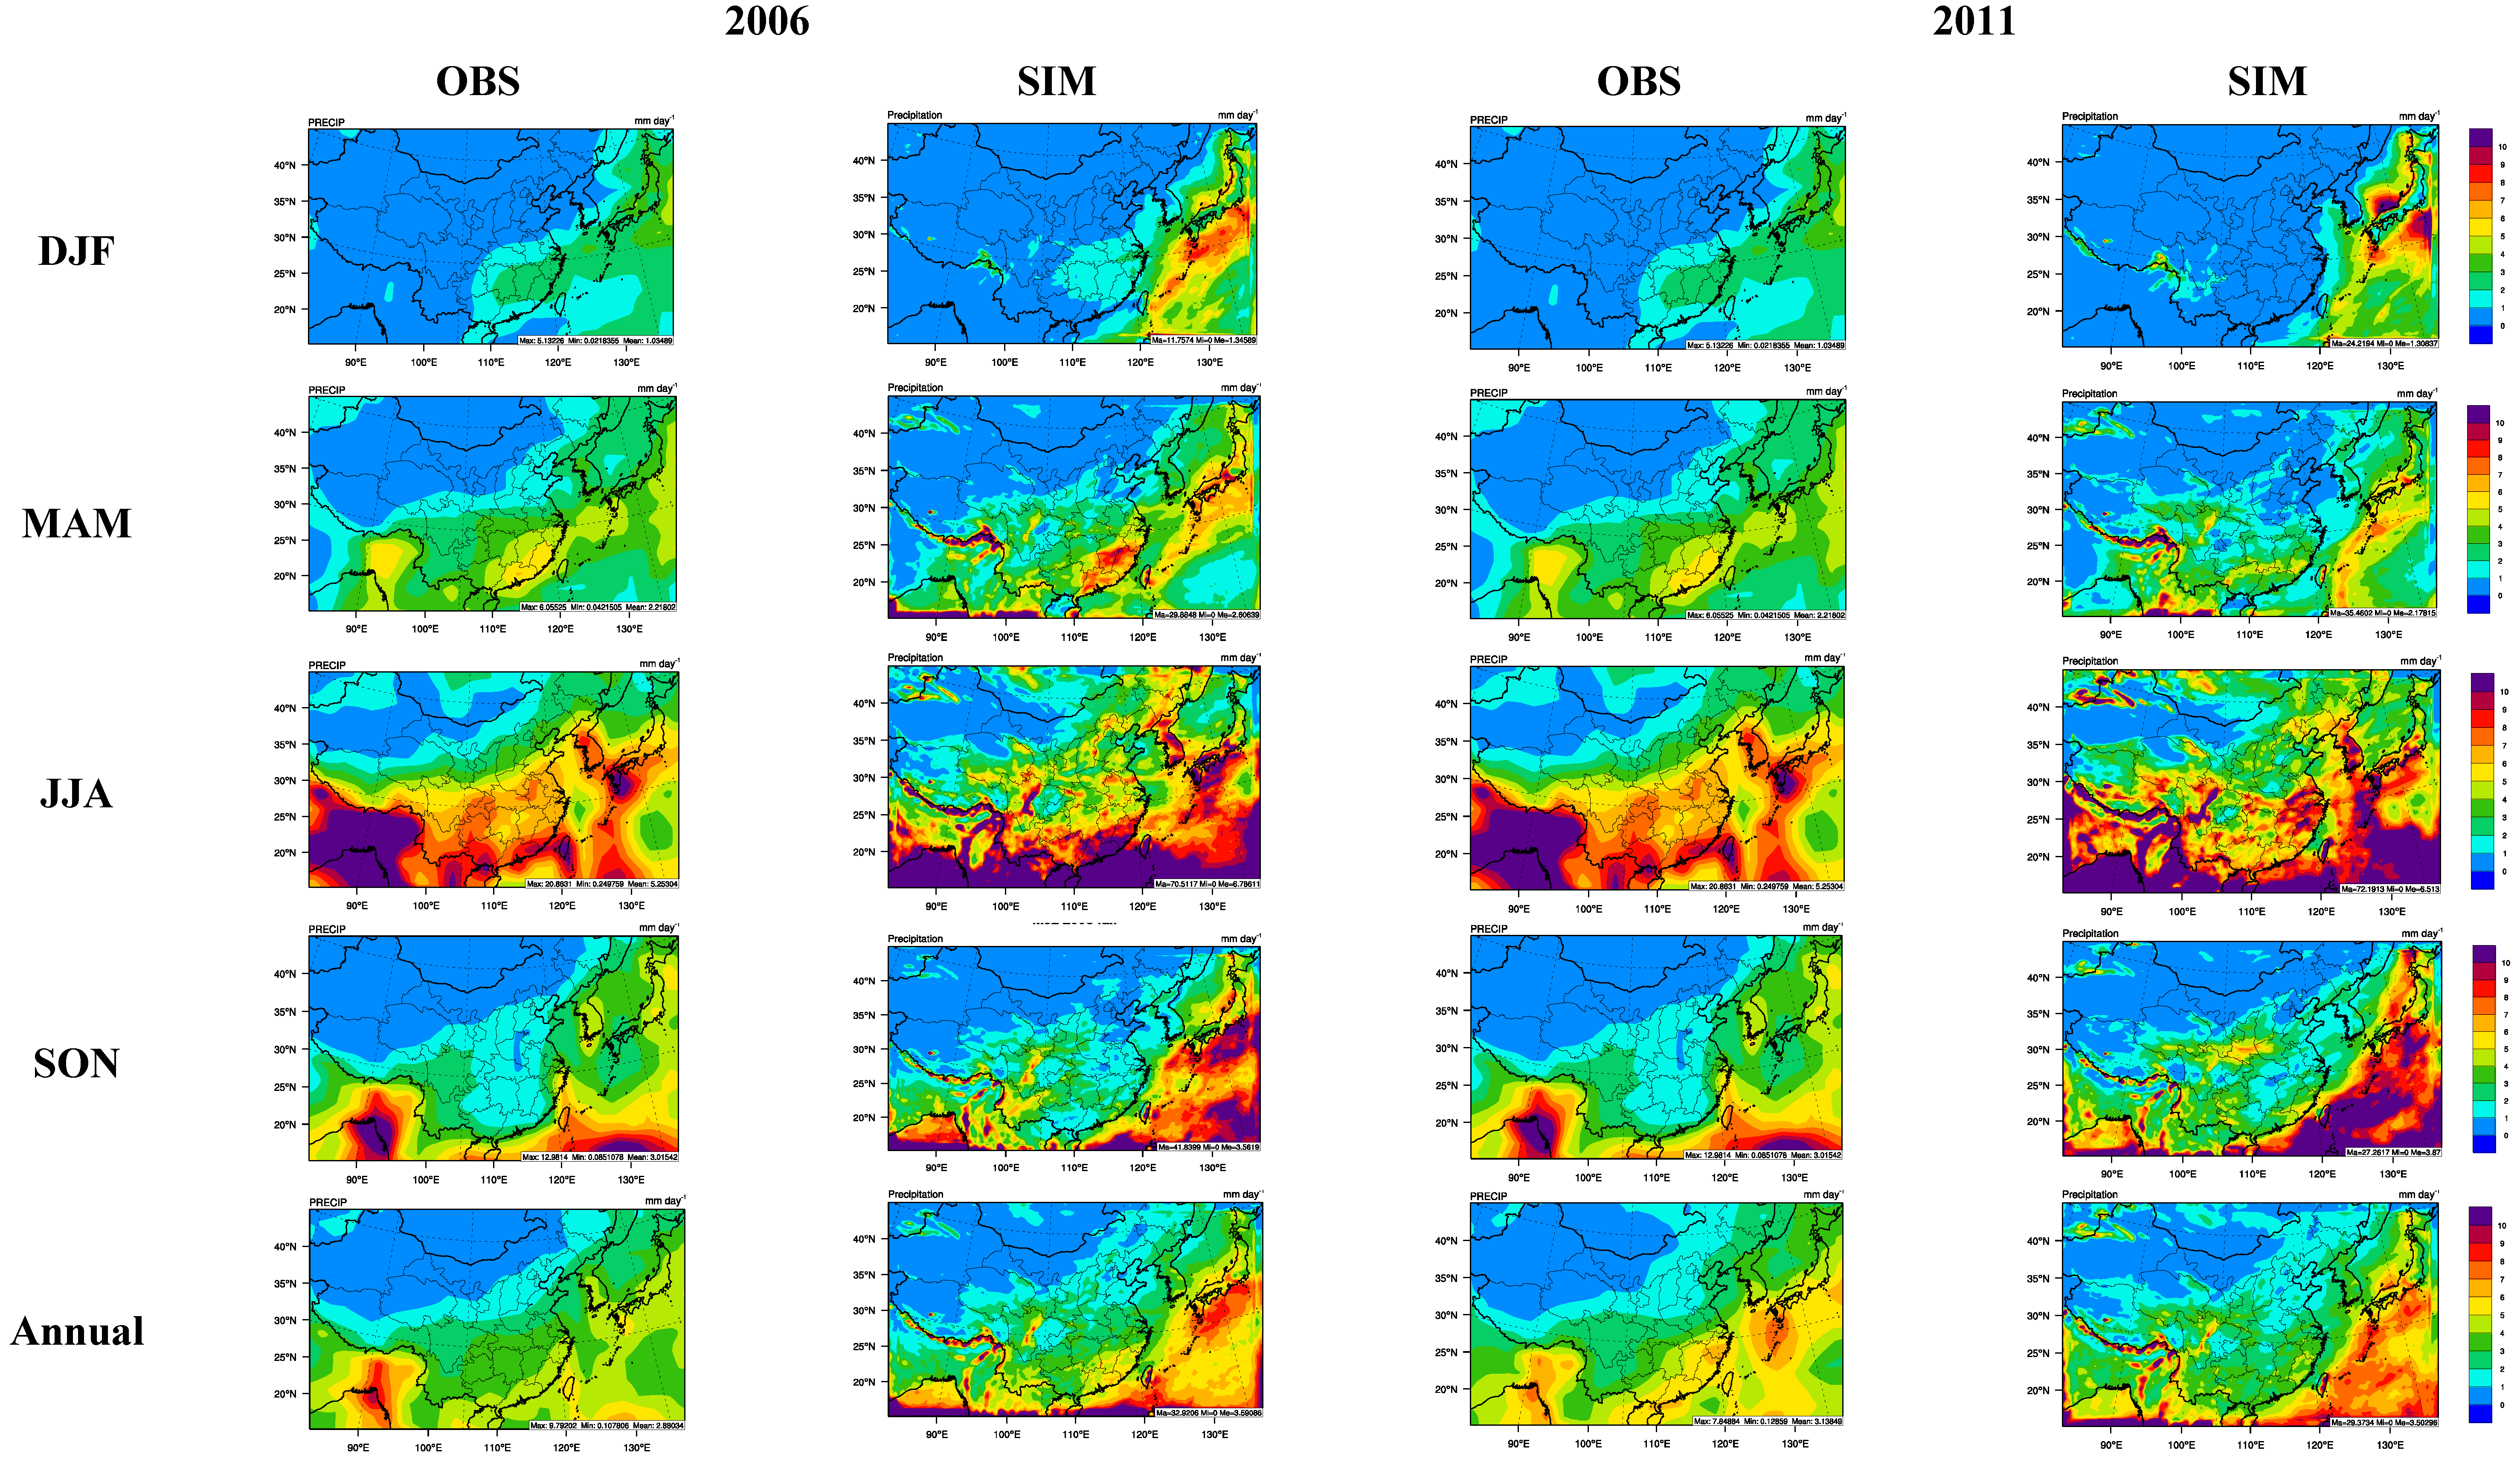
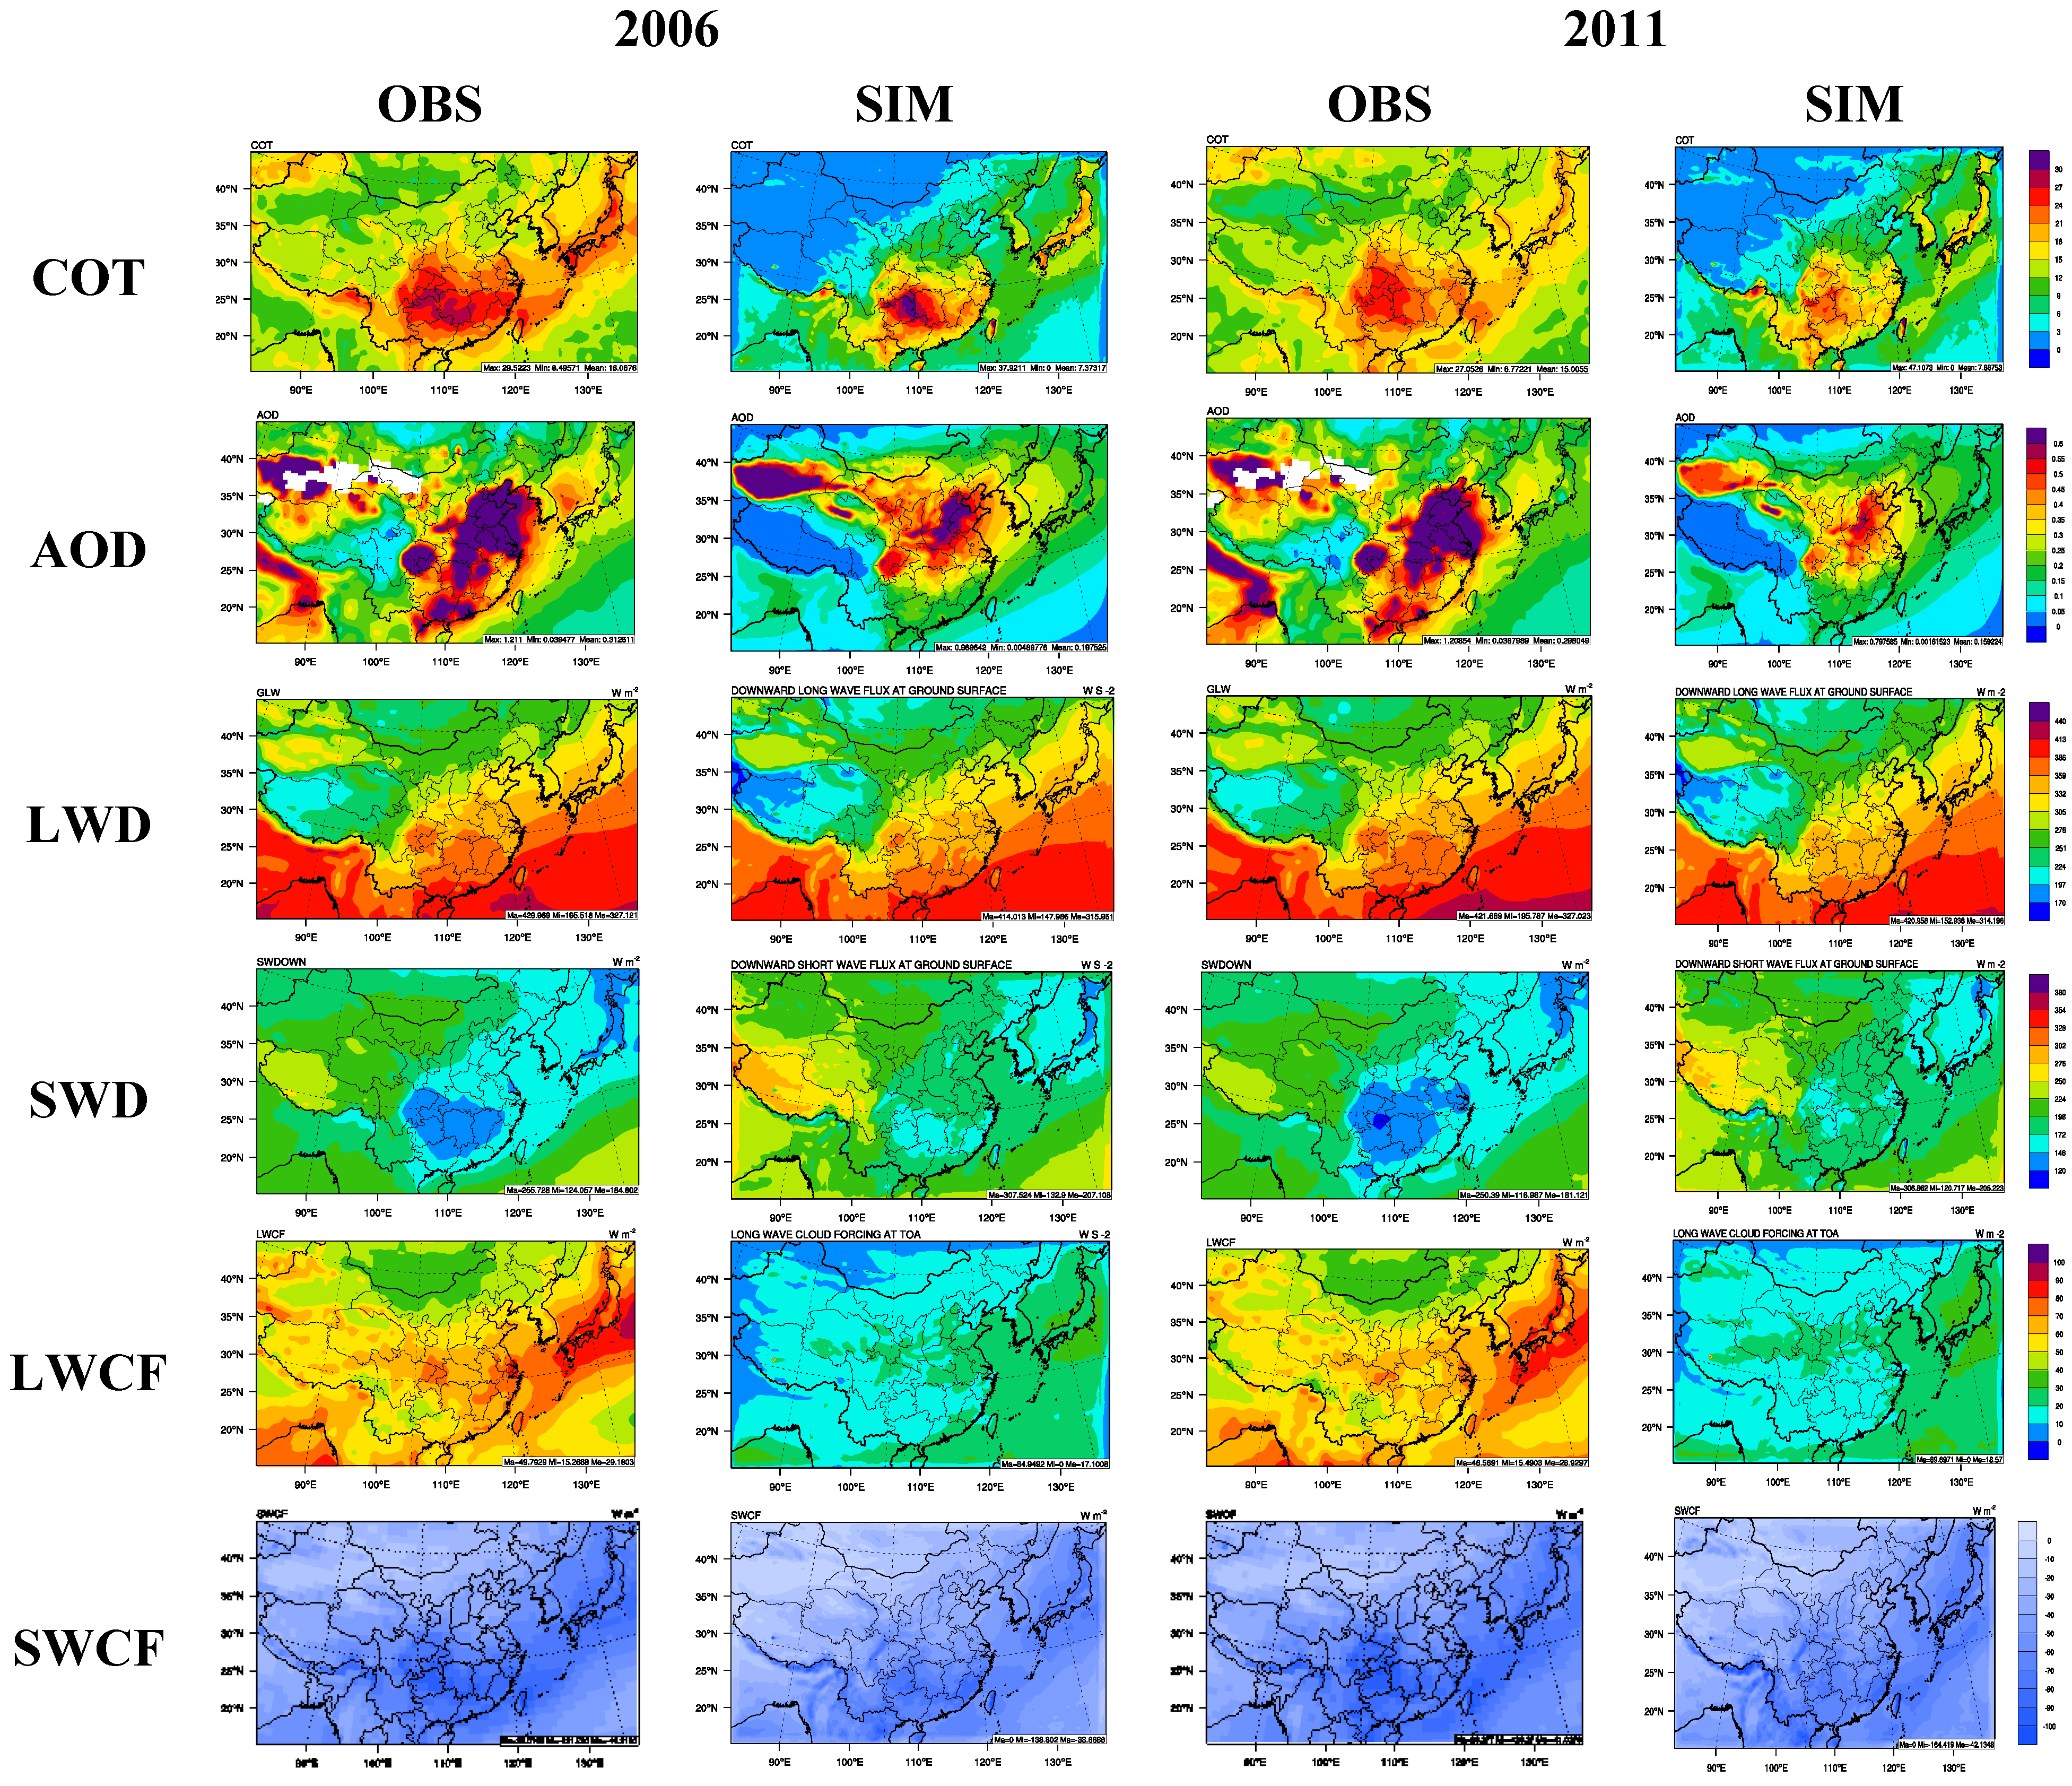
3.1. Meteorological Predictions

Table 3 and Table S1 summarize the annual mean model performance statistics of the meteorological, radiative, and cloud predictions from the 2006 and 2011 baseline WRF-CAM5 simulations, respectively. Figure 1 shows the spatial distributions of annual mean MBs of T2, Q2, WS10, and precipitation against NCDC dataset for both years. The model performs well in predicting P, T2, Q2, and WS10 for both years with annual mean MBs of −13.9 and −13.4 hPa for P, −0.9 and −1.1 °C for T2, 0.03 and 0.1 g∙kg−1 for Q2, 0.3 and 0.4 m∙s−1 for WS10, respectively. The corresponding annual mean MAGEs are 22.2 and 21.8 hPa, 1.9 and 2.0 °C, 0.8 and 0.8 g∙kg−1, 1.0 and 1.0 m∙s−1, respectively, and the corresponding annual mean RMSEs are 35.9 and 35.3 hPa, 2.7 and 2.7 °C, 1.2 and 1.1 g∙kg−1, 1.3 and 1.3 m∙s−1, respectively. The values of annual mean IOA are 0.7 for WS10 and 1 for P, T2, and Q2 in both years. The model reproduces the observed seasonal variations for P, T2, and Q2. For WS10, the observed domain-wide mean WS10 is the highest in spring, followed by winter, fall, and summer, the simulated domain-wide mean WS10 is the highest in winter, followed by spring, fall, and summer.
The largest discrepancy between the observed and simulated T2 occurs in summer with seasonal mean MBs of −1.3 °C in 2006 and −1.4 °C in 2011. Consistent with Ma et al. ([43]) and Zhang et al. ([44]), large cold bias occurs in the Tibet Plateau, where the Mt. Himalayas covered with thick snow is located (see Figure 1). The large cold bias indicates the limited capability of WRF-CAM5 in reproducing observed snow cover and its rate of melting. Large biases (both warm and cold biases) in T2 also occur over Japan, South and North Korea. WS10 is slightly underpredicted in summer in 2006 and overpredicted in other seasons in 2006 and in all seasons in 2011. The overpredictions in WS10 may be responsible for the underpredictions of the chemical concentrations, which will be discussed in Section 3.2. Despite overpredictions, WS10 predictions in this work have much lower biases comparing to most other WRF/Chem applications which reported MBs of 1.3–2.6 m∙s−1 over East Asia for 2001 ([45]), 2006 ([46]), and 2010 ([47]), and 0.03–1.2 m∙s−1 for 2010 over North America ([48]), and 1.0–1.4 m∙s−1 for 2010 over Europe ([48]). This is because the Monin-Obukhov surface layer scheme ([18,19]) can represent surface roughness and topographical features well, which leads to better representation of surface drag in the Bretherton and Park ([20]) PBL scheme used in this work than that used in the YSU PBL scheme used in most previous WRF/Chem applications.
Emery et al. ([49]) proposed threshold values for satisfactory performance for several meteorological variables: MB within ±0.5 °C, MAGE of ≤ 2.0 °C, and IOA of ≥ 0.8 for T2, MB within ±1.0 g∙kg−1, MAGE of ≤ 2.0 g∙kg−1, and IOA of ≥ 0.6 for Q2, and MB within ± 0.5 m∙s−1, RMSE of 2.0 m∙s−1 and IOA of ≥ 0.6 for WS10. Note that such criteria were developed based on the meteorological simulations with the four dimensional data assimilation (FDDA). In this work, FDDA is not used to allow the meteorology-chemistry feedbacks to be investigated. Instead, T2, Q2, and WS10 are re-initialized every five days as a compromise to allow the simulation of feedbacks while periodically constraining the simulation with re-initialized meteorological conditions based on observations. As a result, the model agreement with observations is not expected to be comparable with simulations that use FDDA. The annual mean MBs of T2 are larger than the suggested threshold values by Emery et al. ([49]) but they are comparable or even better than the performance using MM5 (e.g., [44,50]) and WRF (e.g., [47,48,51,52]), and hence deemed acceptable. The annual mean values of MAGEs, IOAs, and RMSEs of T2, Q2, and WS10 are also within the suggested threshold values.
Figure 1. Spatial distribution of annual mean MBs of T2, Q2, WS10, and precipitation against NCDC dataset for the 2006 and 2011 WRF-CAM5 simulations with M92.
Climate 03 00627 g001
Precipitation is overpredicted against both surface observations from NCDC and the merged satellite and rain gauge data from GPCP, with annual-mean NMBs of 13.6% and 9.0%, for 2006 and annual-mean NMBs of 11.1% and 2.5% for 2011. In 2006, the largest overpredictions of precipitation occur in fall against NCDC, with an NMB of 23.8%, and in winter against GPCP, with an NMB of 35.1%. In 2011, the largest overpredictions of precipitation occur in winter against NCDC, with an NMB of 28.1%, and in fall against GPCP, with an NMB of 20.9%. Those biases are either consistent or better than other applications of WRF, WRF/Chem, or WRF-CAM5 over East Asia reported in the literature (e.g., [45,53,54,55]). The moderate overpredictions in some seasons against NCDC and GPCP in both years may be due to several possible reasons including neglecting the impact of effect of clouds on radiation through the changes of droplet and ice effective radii ([56]) and overpredictions of convective precipitation intensity by the cumulus parameterization. The model captures well the observed seasonal variations in both NCDC and GPCP data.
As shown in Figure 2, the model generally captures the observed spatial distributions of precipitation from GPCP in all seasons in both years. In 2006, precipitation is slightly to moderately overpredicted in all seasons, particularly over oceanic areas, resulting in a large annual mean overprediction over western Pacific. In 2011, a large overprediction also occurs over western Pacific in all seasonal and annual means, although the domain-wide mean precipitation is slightly or moderately underpredicted in summer and spring. Precipitation is moderately overpredicted over Taiwan and Japan in all seasons in both years, leading to the underpredictions of concentrations of gaseous and PM species which will be discussed in Section 3.2. The GPCP merged dataset contains precipitation estimates from satellite and rain gauge observations. It gives comparable precipitation to NCDC data in terms of domain-wide mean and spatial distributions (see Figure 2 and Table 3 and Table S1), but its coarse horizontal resolution of 2.5° × 2.5° cannot capture the considerable spatial variability at a finer grid resolution, especially in southeastern China, Japan, and over oceanic areas. Comparing to 2006 NCDC, 2006 GPCP gives higher precipitation in summer and fall but lower precipitation over land in winter and spring, leading to a slightly higher observed annual mean precipitation. GPCP gives higher precipitation in all seasons in 2011 than does NCDC, especially over oceanic regions. The observed seasonal variation for precipitation is the same for NCDC and GPCP in 2011, but somewhat different in 2006. The inconsistencies in magnitudes and seasonality between NCDC and GPCP indicate uncertainties in observations that also contribute in part to the model performance evaluation.
Table 3. Performance statistics for meteorological predictions for 2006 WRF-CAM5 baseline simulation with M92.
VariableData SourceNumberMean Obs.Sim.Mean Sim.RNMB (%)NME (%)MBMAGERMSEFBFGEIOA
P (mb)NCDC6946939.7M92925.80.96−1.52.4−13.922.235.9−0.020.031.0
T2 (°C)NCDC1052413.8M9212.90.98−714−0.91.92.70.92−0.931.0
Q2 (g∙kg−1)NCDC69458.0M928.00.980.4110.030.81.20.000.131.0
WS10 (m∙s−1)NCDC80103.1M923.40.5411320.31.01.30.100.290.7
Precip (mm∙day−1)NCDC101312.7M923.00.6814620.41.73.1--0.8
GPCP159082.9M923.10.769370.31.01.5−0.020.400.9
CCN (cm−2)MODIS49170.8M920.50.78−33.840.9−0.30.30.7−0.20.3
CDNC (cm−3)9111143.0M92101.00.63−29.336.2−41.951.765.2−0.40.5
CF133980.6M920.60.81−12.017.2−0.10.10.1−0.20.2
PWV (cm)133982.2M922.20.99−0.96.30.00.10.20.050.1
LWP (g∙m−2)13398110.3M9248.00.87−56.556.6−62.362.465.6−1.01.0
IWP (g∙m−2)13398245.1M929.50.01−96.196.1−235.6235.6243.9−1.81.8
AOD130700.3M920.20.70−35.743.6−0.10.10.2−0.50.6
COT1339816.3M928.20.84−50.050.3−8.28.28.9−0.80.8
GLW (W∙m−2)CERES13398324.6M92317.40.99−2.22.6−7.28.412.0−0.030.03
SWD (W∙m−2)13398183.4M92204.90.9111.711.821.521.625.00.10.1
SWCF (W∙m−2)13398−51.7M92−42.00.90−18.721.2−9.710.913.3−0.30.3
LWCF (W∙m−2)1339829.1M9218.50.68−36.436.5−10.610.611.6−0.50.5
Number: number of observations; Sim: simulation; Obs: observation; NMB: normalized mean bias; NME: normalized mean error; MB: mean bias; MAGE: mean error; RMSE: root mean square error; FB: fractional bias; FGE: fractional gross error; IOA: index of agreement.
Figure 2. Spatial distributions of simulated seasonal-average precipitation for the 2006 and 2011 simulations with M92 against the GPCP data.
Climate 03 00627 g002
Figure 3. Spatial distributions of annual mean observed and simulated CCN, CDNC, CF, PWV, CWP, and IWP for the 2006 and 2011 simulations with M92.
Climate 03 00627 g003
Figure 3 and Figure 4 compare observed and simulated annual mean spatial distributions of radiation and cloud related variables for both years. The simulated CCN at a supersaturation (S) of 0.5% (CCN0.5) are evaluated against MODIS observations over oceanic area (note that no CCN data are available over land areas). Moderate underpredictions of CCN occur for all months and seasons in 2006 and 2011, especially in winter, with annual mean NMBs of −33.8% in 2006, and annual mean NMBs of −32.2% in 2011 (Table 3 and Table S1 and Figure 3). The model does not reproduce the seasonal variation of the CCN over oceanic area. The underpredictions in CCN are due to possible underpredictions of sea salt over coastal areas and uncertainties in the CCN retrievals. CDNC in warm clouds is moderately underpredicted in both years against the MODIS-derived CDNC by Bennartz ([40]). The annual mean MB and NMB are −41.9 cm−3 and −29.3% in 2006, respectively. The annual mean MB and NMB are −42.6 cm−3 and −30.4% in 2011, respectively. The model generally reproduces the seasonal variation of CDNC for both years. As shown in Figure 3, the largest underpredictions in CDNC occur over mainland China, Japan, and North and South Korea. CDNC depends strongly on several parameters such as CCN, updraft velocity, mass accommodation, and supersaturation in the AR-G02 parameterization. The underpredictions of CDNC are caused by possible underpredictions over land and moderate underpredictions over oceanic areas for CCN as well as possible underestimate in the fraction of activated particles by the AR-G02 parameterization due to the simplified calculation of maximum supersaturation and other assumptions and approximations used in the AR-G02 parameterization ([51]) and the omission of CCN from insoluble particles such as mineral dust and black carbon through an absorption mechanism ([55,57]). The derived CDNC is based on MODIS retrievals of cloud properties such as cloud effective radius (CER), LWP, and COT, all of which are subject to uncertainties. As indicated by Bennartz ([40]), the errors in CDNC can be up to 260%, especially for regions with low CF (<0.1) (e.g., northwestern China, see Figure 3). The large uncertainties in derived CDNC may affect the evaluation of the simulated CDNC.
Figure 4. Spatial distributions of annual mean observed and simulated COT, AOD, LWD, SWD, LWCF, and SWCF for the 2006 and 2011 simulations with M92.
Climate 03 00627 g004
The simulated annual-mean CF agrees well with the MODIS data in terms of domain-wide mean with NMBs of −12.0% in 2006 and −5.7% in 2011. The spatial distributions of annual mean CF are overall consistent with observations except for northwestern China where underpredictions occur (Figure 3). Relatively large discrepancies of the spatial distribution of simulated CF against MODIS occur in winter and spring in 2006 and 2011, particularly over northern China (Figures not shown). Such discrepancies may be due to the underpredictions of water and possible underpredictions of CCN over northern China in dry seasons (i.e., winter and spring). The simulated and observed PWV is overall consistent in terms of both magnitudes and spatial distributions for both 2006 and 2011. Large uncertainties exist in the predictions in LWP, IWP, and COT. LWP is significantly underpredicted over the most of the domain, particularly over Tibet Plateau and Mongolia Plateau, in all seasons and annually (see Table 3 and Table S1, and Figure 3), with annual mean NMBs of −56.5% and −49.8%in 2006 and 2011, respectively. The largest underprediction occurs in fall in 2006 and in winter in 2011; the best model performance occurs in summer for both years. Such underpredictions may be due to the model’s limitations in simulating cloud properties, aerosol-cloud interactions, as well as inaccuracies in satellite-derived LWP, which is highly uncertain ([41]). For example, uncertainties exist in the parameterizations for cloud microphysics and aerosol-cloud interactions used in the model simulations. Zhang et al. ([51,53]) compared two aerosol activation parameterizations and reported that the AR-G02 parameterization used in this work has a tendency to underpredict aerosol activation fraction and thus CDNC, CWP, and COT due to several limitations of the AR-G02 parameterization. The large uncertainties in the satellite retrieval of LWP may also affect the evaluation of the simulated LWP. Both observed and simulated LWP show the highest values in summer in 2006 and the highest values in summer and the second highest values in fall in 2011.
Comparisons with observations indicate that IWP is significantly underpredicted over most of the domain, with annual mean NMBs of −96.1% and −95.7% in 2006 and 2011, respectively. This is due mainly to the uncertainties in predicting cloud ice nuclei (IN) formation and growth and related variables such as cloud ice number concentrations and ice mixing ratio by the parameterizations for cloud microphysics and aerosol-cloud interactions, as well as uncertainties associated with satellite-derived IWP. Another possible reason lies in the underpredictions in the concentrations of aerosols aloft that can serve as IN (note that Table 4, Table 5, Tables S2 and S3 show underpredictions of surface concentrations of PM2.5 and PM10), While both the derived and simulated IWP show the highest domain-wide mean in summer, the second highest mean occurs in fall for the satellite-derived IWP but in spring in the simulated IWP. The significant underpredictions of LWP and IWP also indicate a need of improvement for the model treatments for cloud droplet and ice nucleation. Comparing against the MODIS observations, COT is moderately to significantly underpredicted over the entire domain, with annual mean NMBs of −50.0% and −44.0%in 2006and 2011, respectively. The best performance for COT in summer in 2006 and 2011 coincides with the best performance for LWP because they are closely related. While the model reproduces the seasonal variation of COT in 2011, it gives somewhat different seasonal variation from the observations in 2006. The significant underprediction of COT is due not only to underpredictions of LWP, IWP, and CDNC, but also other reasons, e.g., the calculation of COT does not include contributions from graupel.
The MODIS-derived AOD peaks in spring due to the highest PM concentrations, followed by summer, fall, and winter in 2006 and 2011. The satellite-derived high AOD values in spring and summer in both years are attributed to several factors such as stagnant synoptic meteorological conditions, secondary aerosol formation, growth of hydrophilic aerosols due to enhanced relative humidity, and smoke aerosols from regional biomass burning ([58]). Comparing with MODIS data, moderate underpredictions of AOD occur in all seasons with annual mean NMBs of −35.7% and f −45.2% in 2006 and 2011, respectively. The model reproduces the observed seasonal variations of AOD, with the highest in spring, followed by summer, fall, and winter. As shown in Figure 4, while the model generally captures the spatial distributions of AOD in northern domain. AOD is significantly underpredicted over the southern domain in both years, where dust concentrations are low and PM2.5 concentrations are significantly underpredicted (except for Hong Kong) (which will be discussed in Section 3.2).
LWD and SWD agree well with observations in terms of spatial distributions and magnitudes over the entire domain for all seasons in both years (Figure 4 and Table 3 and Table S1), with annual mean NMBs of −2.2% and 11.7% and R of 1.0 and 0.9 in 2006, and annual mean NMBs of −2.8% and 12.7% and R of 1.0 and 0.9 in 2011. The model generally reproduces the seasonal variation of LWD and SWD in both years. The small underpredictions of LWD and moderate overpredictions of SWD may be due likely to the underpredictions of aerosol direct radiative forcing (indicated by underpredictions of PM and AOD) and underpredictions of cloud radiative forcing (indicated by underpredictions of LWP, IWP, and COT).
The model biases in prediction of clouds parameters such as LWP, IWP, COT, and CF, directly affect the radiative forcing at top-of-atmosphere, aqueous-phase chemistry, and wet scavenging. As shown in Figure 4 and Table 3 and Table S1, LWCF is moderately-to-significantly underpredicted over the entire domain, with annual mean NMBs of −36.4% and −30.9% in 2006 and 2011, respectively. The largest underprediction occurs in winter in both years. Despite the underpredictions, the model reproduces the observed seasonal variations of LWCF, with the highest in summer, followed by spring, fall, and winter. The model is capable of capturing the spatial distributions and seasonal variations of SWCF, but underpredicts its magnitudes. The domain-wide annual mean MB and NMB are −9.7 W∙m−2 and −18.7%, respectively, in 2006. The domain-wide annual mean MB and NMB are −8.4 W∙m−2 and −15.5%, respectively, in 2011. Moderate underpredictions of SWCF occur in both years over the entire winter and spring, especially over the southern domain and oceanic areas, leading to moderate undepredictions in annual mean SWCF (Figure 4). The moderate underpredictions of LWCF and SWCF may be due to the uncertainties associated with the predictions of cloud properties such as CDNC, CF, cloud albedo, and incoming radiation at the top-of-the atmosphere. The biases in meteorological, radiative, and cloud variable predictions will in turn affect gas-phase chemistry and secondary aerosol formation, as discussed below.

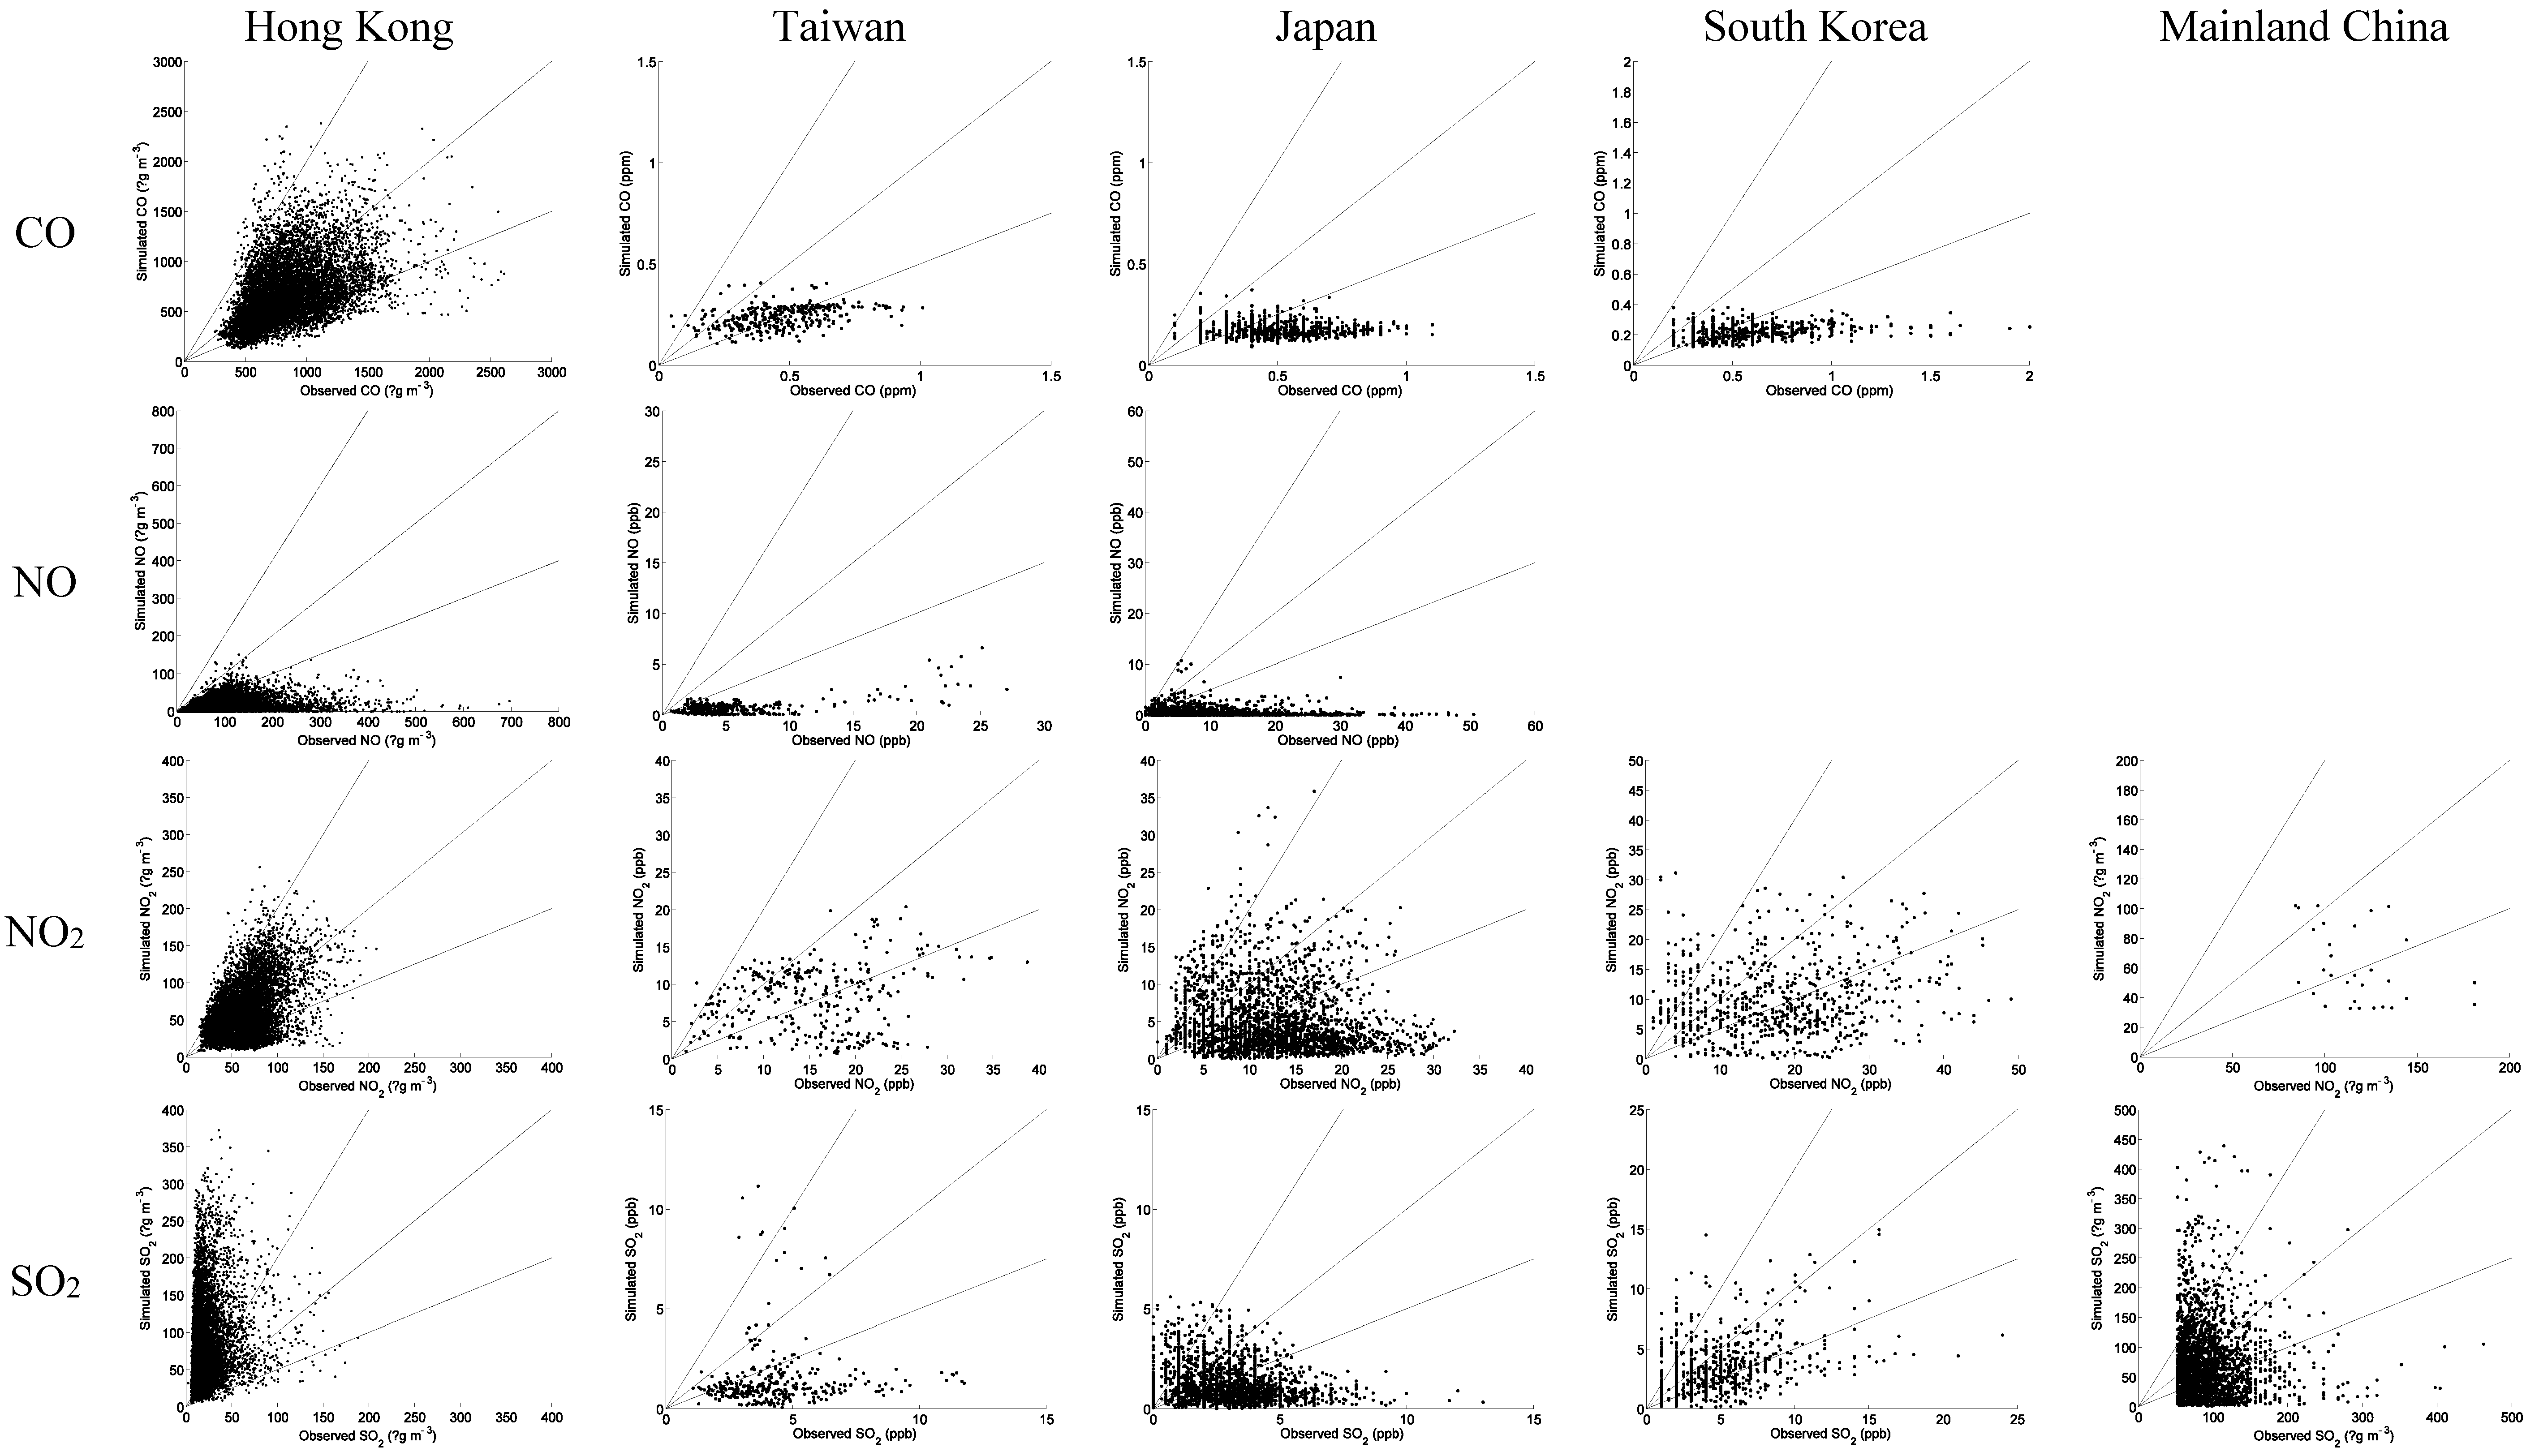
3.2. Chemical Predictions

The annual mean performance statistics for surface chemical concentrations and column mass for 2006 and 2011 are given in Table 4, Table 5 and Table S2. Figure 5 compares the simulated and observed surface mixing ratios (or concentrations) of CO, NO, NO2, SO2, and O3, and concentrations of PM2.5 and PM10 from various datasets in Hong Kong, Taiwan, Japan, South Korea, and mainland China for 2006. The results in 2011 are similar to those in 2006, thus not shown. The mixing ratios of CO and NO2 at the Hong Kong sites are slightly-to-moderately underpredicted, with annual mean NMBs of −17.8% and −2.4% in 2006, and annual mean NMBs of −26.9% and −13.3% in 2011, respectively. The mixing ratios of NO at the Hong Kong sites are significantly underpredicted, with annual mean NMBs of −86.8% and −83.1% in 2006 and 2011, respectively. The possible reasons for underpredictions in NO and CO include underpredictions in their emissions, overpredictions in WS10, and overestimations of planetary boundary layer (PBL) height. The mixing ratios of O3 at the Hong Kong sites are moderately overpredicted due likely to insufficient of titration by NO, with annual mean NMBs of 22.4%, and 33.9% in 2006 and 2011, respectively. The mixing ratios of SO2, and mass concentrations of PM2.5, and PM10 in Hong Kong are moderately to significantly overpredicted, with annual mean NMBs of 265%, 154%, and 79% in 2006, and 478%, 85.5%, and 31.3%, in 2011, respectively. The overpredictions of PM2.5 and PM10 are clearly caused by the significant overprediction of SO2, which is due likely to the overestimation of SO2 emissions in the MEIC used and overpredictions in precipitation in the Hong Kong area (see Figure 2), which may lead to the overpredictions of SO42− and NH4+. Another possible reason for overpredictions of PM2.5 and PM10 may be the overestimation of emissions of dust particles that are transported from nearby mega cities, such as Guangzhou and Shenzhen. As shown in Figure 5, most simulated values of CO, NO2, and O3 at the Hong Kong sites are within a factor of two of the observations, with relatively higher R values of 0.41, 0.46, and 0.52, respectively. However, most simulated values of NO, SO2, PM2.5, and PM10 are beyond a factor of two of the observations, with low R values of 0.3, 0.19, 0.31, and 0.3, respectively. At the Hong Kong sites, the model reproduces the seasonal variations of CO in both years and those of PM2.5 and PM10 in 2006, but fails to reproduce the seasonal variations of NO, NO2, SO2, and O3 in both years.
At the Taiwan sites, the mixing ratios of O3 are moderately overpredicted with annual mean NMBs of 18.9% and 16.6% in 2006 and 2011, respectively. The concentrations of all other species are moderately to significantly underpredicted, with annual mean NMBs of −48.0% and −41.1% for CO, −86.7% and −79.6% for NO, −47% and −36.4% for NO2, −66.0% and −62.2% for SO2, −49.7% and −49.5% for PM2.5, and −65.8% and −62.7% for PM10 in 2006 and 2011, respectively. The significant underpredictions for CO, NOx, SO2, PM2.5, and PM10 are associated with the underestimations for anthropogenic emissions and the overpredictions for WS10 (Figure not shown) and precipitation in this region (see Figure 2). Moderate underpredictions of cloud amounts and significant underpredictions of LWP (Table 3 and Table S1) might affect the aqueous-phase chemistry in cloud, which is a major source for SO42−. The significant underpredictions for NO and NO2, and moderate overpredictions for O3 indicate possible underestimations in NOx emissions, leading to insufficient NOx for titration of O3. The concentrations of SO2, PM2.5, and PM10 are largely overpredicted in Hong Kong but underpredicted in Taiwan, indicating some problems in the spatial distributions of the emissions of SO2 and primary PM in the MEIC emission inventory. As shown in Figure 5, at the Taiwan sites, most simulated values are within a factor of two of the observations for CO and O3 with R values of 0.39 and 0.33, but fall beyond a factor of two of the observations for NO, NO2, SO2, PM2.5, and PM10 with R values of 0.66, 0.2, 0.05, 0.22, and 0.25, respectively. At the Taiwan sites, the model reproduces the seasonal variations of O3 and PM10 in 2006, and those of CO, O3, PM2.5, and PM10 in 2010.
In Japan, the mixing ratios of CO are significantly underpredicted, with annual mean NMBs of −63.7% and −55.4% in 2006 and 2011, respectively. The mixing ratios of NO and NO2 are also significantly underpredicted, with annual means of −93.7% and −89.0% for NO and annual means of −59.0% and −46.1%, for NO2 in 2006 and 2011, respectively. The large underpredictions may be caused by underestimations of anthropogenic CO and NOx emissions, overpredictions of WS10, and overestimations of PBL height (PBLH). The underpredictions in NOx mixing ratios may have resulted in insufficient titration of O3 by NO. The mixing ratios of SO2 are also significantly underpredicted with annual mean NMBs of −56.9% and −41.4% in 2006 and 2011, respectively. Similar to the results at the Taiwan sites, only the annual mean mixing ratio of O3 is overpredicted in Japan, with NMBs of 11% and 14.9%, respectively.
Table 4. Performance statistics for surface chemical concentrations and column mass abundance of gaseous species for 2006.
VariableData SourceNumberMean Obs.Mean Sim.RNMB (%)NME (%)MBMAGERMSEFBFGE
CO (µg·m−3)HK8760855.7703.60.41−17.833.8−152.1289.0380.7−0.230.37
CO (ppm)TW3240.50.20.39−48.050.1−0.20.20.3−0.570.62
JP13900.50.20.03−63.764.1−0.30.30.4−0.870.88
SK7310.60.20.28−62.062.3−0.40.40.4−0.820.83
Col. CO (1018 molec.·cm−2)MOPPIT133982.02.00.940.37.50.010.20.20.000.08
NO (µg·m−3)HK8758103.513.80.30−86.686.7−89.789.8109.2−1.571.57
NO (ppb)TW3245.80.80.66−86.786.7−5.05.06.6−1.471.47
JP26707.80.5−0.02−93.794.3−7.37.410.3−1.551.63
NO2 (µg·m−3)CH40125.816.00.04−87.387.3−109.8109.8118.3−1.591.59
HK876062.160.60.46−2.441.3−1.525.733.2−0.090.43
NO2 (ppb)TW32415.28.10.20−47.052.7−7.28.010.2−0.570.69
JP267012.25.0−0.07−59.070.5−7.28.610.6−0.81.00
SK73217.49.80.16−43.360.7−7.510.613.0−0.490.80
Col. NO2 (1015 molec.·cm−2)SCIAMACHY133982.32.50.917.634.20.20.81.80.070.36
SO2 (µg·m−3)CH2600101.567.1−0.12−33.966.9−34.467.988.9−0.560.82
HK876021.879.90.19265.8273.058.059.678.61.031.07
SO2 (ppb)TW3244.31.50.05−66.474.1−2.93.23.8−1.051.10
JP26122.71.2−0.18−56.972.8−1.62.02.6−0.660.99
SK7325.03.60.32−28.352.5−1.42.63.5−0.310.63
Col. SO2 (DU)SCIAMACHY133980.20.30.8762.9103.50.10.20.4−0.150.72
Col. HCHO (1015 molec.·cm−2)SCIAMACHY133985.36.10.8315.026.10.00.81.90.060.25
O3 (µg·m−3)HK876035.843.80.5222.487.58.031.346.0−0.350.95
O3 (ppb)TW32431.337.20.3318.928.65.98.910.90.180.26
JP235531.635.20.4811.123.33.57.49.20.130.23
SK73225.536.00.4440.952.910.413.516.30.340.45
TOR (DU)OMI1339830.733.60.959.59.72.93.03.40.090.09
PM2.5 (µg·m−3)HK875740.8103.40.31153.6167.262.768.2111.80.640.77
TW32431.715.90.22−49.752.7−15.816.720.9−0.620.66
PM10 (µg·m−3)CH103098.697.80.09−0.858.0−0.857.274.5−0.120.60
HK876058.7105.10.3079.0104.746.461.5103.60.330.60
TW32457.619.70.25−65.866.1−37.938.144.1−0.950.96
JP271923.413.3−0.01−42.952.9−10.012.415.1−0.560.67
SK78947.930.20.27−37.046.0−17.722.026.5−0.500.58
Number: number of observations; Sim: simulation; Obs: observation; NMB: normalized mean bias; NME: normalized mean error; MB: mean bias; MAGE: mean error; RMSE: root mean square error; FB: fractional bias; FGE: fractional gross error; IOA: index of agreement.
Table 5. Performance statistics for surface chemical concentrations of gaseous species for 2006 against EANET.
VariableRegionNumberMean Obs.Mean Sim.RNMB (%)NME (%)MBMAGERMSEFBFGE
NO (ppb)CH243.00.40.53−86.886.9−2.62.63.5−1.231.23
JP123.71.3−0.43−66.266.2−2.42.42.5−0.990.99
NO2 (ppb)CH2417.64.30.61−75.475.4−13.313.314.7−1.371.37
JP123.71.3−0.43−66.266.2−2.42.42.5−0.990.99
SO2 (ppb)CH4811.06.30.41−42.254.7−4.66.08.3−0.660.82
JP1060.60.40.62−29.859.3−0.20.40.5−0.760.98
SK362.50.10.75−96.996.9−2.42.42.6−1.881.88
O3 (ppb)JP11841.734.90.26−16.232.4−6.813.516.1−0.140.38
SK3637.130.00.17−19.128.2−7.110.513.1−0.200.31
PM2.5 (µg m−3)JP2411.74.40.07−62.062.0−7.27.28.7−0.870.87
SO4 (µg m−3)JP1204.32.3−0.05−47.863.8−2.02.83.7−0.460.82
SK357.71.6−0.36−79.679.6−6.16.17.7−1.21.2
PM10 (µg m−3)CH4871.041.30.53−41.856.0−29.739.750.3−0.680.71
JP11721.713.10.25−39.951.9−8.711.314.1−0.520.68
SK3650.09.50.03−81.081.0−40.540.543.3−1.351.35
EANET: Acid Deposition Monitoring Network in East Asia. Number: number of observations. Sim: simulation. Obs: observation. NMB: normalized mean bias. NME: normalized mean error. MB: mean bias. MAGE: mean error. RMSE: root mean square error. FB: fractional bias. FGE: fractional gross error; IOA: index of agreement.
Figure 5. Simulated and observed surface mixing ratios of CO, NO, NO2, SO2, and mass concentrations of PM2.5 and PM10 for the 2006 simulation with M92.
Climate 03 00627 g005aClimate 03 00627 g005b
The concentrations of PM10 are significantly underpredicted, with annual mean NMBs of −42.9% and −35.0% in 2006 and 2011, respectively. The largest underpredictions occur in summer, followed by fall, winter, and spring in both years. The smallest underprediction of PM10 in spring among all seasons reflects the impact of the long-range transport of dust particles from China. The significant undeprediction of PM10 in summer, on the other hand, may be due to several reasons including the overprediction of wet deposition resulted from overpredicted precipitation, and the underestimation of anthropogenic emissions of primary aerosol particles and precursor gases for secondary aerosols. As shown in Figure 5, at the Japan sites, most simulated O3 mixing ratios are within a factor of two of the observations with R of 0.48. Most simulated values for other species are beyond a factor of two of the observations with R values of 0.03, −0.02, −0.07, −0.18, and −0.01 for CO, NO, NO2, SO2, and PM10, respectively. The negative R values may indicate inconsistent or even opposite spatial distributions and/or temporal variations of the simulated concentrations of those species, due likely to spatial and temporal variations in emissions and the large biases in simulated meteorological fields over Japan as shown in Figure 1. At the Japan sites, the model reproduces the seasonal variations of O3 but fails to reproduce those of CO, NO, NO2, SO2, and PM10 in both years.
Similar to the statistical results for Japan and Taiwan sites, the mixing ratios of CO, NO2, and SO2 in South Korea are moderately to significantly underpredicted, with annual mean NMBs of −62.0%, −43.3%, and −28.3% in 2006, and −51.9%, −37.2%, and −21.6% in 2011, respectively. The mixing ratios of surface O3 in South Korea are moderately overpredicted in spring, fall, and winter with NMBs of 14.5%, 41.8%, and 27.1% in 2006 and 10.0%, 37.9%, and 12.2% in 2011, and significantly overpredicted in summer, with NMBs of 83.2% in 2006, and 68.7% in 2011, respectively. The mass concentrations of PM10 are moderately underpredicted, with annual mean NMBs of −37.0% and −31.7% in 2006 and 2011, respectively. The moderate to significant underpredictions of the mixing ratios of CO, NO2, and SO2, and mass concentrations of PM10 are possibly due to the underestimation of the emissions of these species, overpredictions in WS10 (see Table 3 and Table S1), and the overpredictions of precipitation over South Korea (see Figure 2). As shown in Figure 5, at the South Korea sites, most simulated O3 values are within a factor of two of the observations with an R value of 0.44. Most simulated values for CO, NO2, SO2, and PM10 are beyond a factor of two of the observations with R values of 0.28, 0.16, 0.32, and 0.27, respectively. The model reproduces the seasonal variations of O3 and PM10 in 2011, but does not capture well the seasonal variations of other species in 2011 and all species in 2006.
The API-derived NO2 concentrations are significantly underpredicted with annual mean NMBs of −87.3% in 2006 and −48.0% in 2011. The API-derived SO2 concentrations are moderately overpredicted in summer and moderately to significantly underpredicted in other seasons in 2006. They are moderately overpredicted in spring and summer and moderately to significantly underpredicted in fall and winter in 2011. The overpredictions and underpredictions in SO2 concentrations compensate, leading to annual mean NMBs of −33.9% in 2006 and −18.2% in 2011. The API-derived PM10 concentrations are overall well produced with annual mean NMBs of −0.8% and −3.6% in 2006 and 2011, respectively. In 2006, PM10 is well simulated in summer and fall, but moderately underpredicted in winter and ovepredicted in spring. In 2011, PM10 is moderately overpredicted in spring and underpredicted in other seasons.
The performance of PM10 in this work is consistent or even better than those from WRF/Chem applications over East Asia reported in the literature ([53,59]). As shown in Figure 5, over mainland China, many simulated values of NO2, SO2, and PM10 are beyond a factor of observations with R values of 0.04, −0.12, and 0.09 for NO2, SO2, and PM10, respectively. The model fails to reproduce the seasonal variation of those species over mainland China. The simulated spatial distributions of PM10 in Figure 6 show that the major dust source regions in East Asia are located in northwestern and northern China, and southern Mongolia, which is consistent with previous studies ([60,61]). In the dust season (spring), large amounts of dust particles are generated in these regions and transported to eastern China, southeastern China, South Korea, and Japan. The model overpredicts the particle concentrations in northern China, especially over the dust source regions in northwestern China, but underpredicts those in southern China, leading to a very low R value (i.e., 0.09 in 2006 and 0.2 in 2011) for PM10. The overpredictions of the concentrations of coarse aerosol particles in northern China might be associated with the overestimations of dust emissions in dust source regions, while the underpredictions of the concentrations of PM10 in southern China might be due to the underestimation of anthropogenic emissions for primary particles and the precursor gaseous species for secondary aerosols, as well as the overprediction of precipitation (see Figure 2) (which may lead to overpredictions of wet deposition of chemical species in this region). Figure 7 compares annual mean concentrations of PM2.5 and its major components such as SO42−, NH4+, Cl, and Na+ at the THU and MY sites in Beijing, China. Although WRF-CAM5 uses a relatively simple aerosol module that is based on the modal approach and does not simulate nitrate, the simulated mass concentrations of PM2.5 and SO42− agree well with the observations at both sites, indicating a good skill of WRF-CAM5 in simulating site-specific PM2.5 and SO42−. However, the concentrations of Na+ and Cl at both sites are significantly underpredicted because anthropogenic sources predominate at both sites, and the anthropogenic emissions of Na+ and Cl are not included in the emission file.
As shown in Table 5 and Table S3, the concentrations of NO, NO2, SO2, O3, SO42−, PM2.5, and PM10 are underpredicted at all EANET sites in mainland China, Japan, South Korea including urban, rural and remote sites, which is consistent with surface evaluation using data from other surface networks. The underpredictions in NOx and SO2 may be caused by underestimations in their total emissions and/or vertical allocations of the total emissions, as well as strong cloud lofting. The underpredictions in SO42− concentrations may be caused by several reasons such as the underpredictions of SO2 and the overprediction of precipitation. The underpredictions in PM2.5 and PM10 may result from the underestimations of emissions of their gaseous precursors and primary PM species such as black carbon, organic carbon, and mineral dust. Unlike Hong Kong where the underpredictions of NOx level lead to the overpredictions in O3 due to insufficient titration, the underestimations of NOx emissions at the EANET sites may contribute to the moderate underpredictions of O3 concentrations, because most of the EANET sites are located at rural and remote sites where O3 chemistry is NOx-limited as shown in Liu et al. ([62]). At some urban sites where O3 chemistry is VOC-limited or both NOx- and VOC-limited, underestimations of VOC emissions may also contribute to the underpredictions of O3.
Figure 6. Simulated PM10 concentrations overlaid with API-derived observations for 2006 and 2011 simulations with M92. The observational data are denoted as dots.
Climate 03 00627 g006
Figure 7. Simulated and observed surface concentrations of PM2.5 and PM2.5 composition at THU and MY sites in Beijing, China for the 2006 simulation with M92. WRF-CAM5 does not simulate NO3.
Climate 03 00627 g007
Figure 8 compares the spatial distributions of annual mean simulated column mass abundance with satellite observations. The simulated column CO is comparable with observations from MOPITT in terms of spatial distributions and magnitudes for both years with annual mean NMBs of 0.3% in 2006 and −1.8% in 2011 (Table 4 and Table S2). Moderate underpredictions occur in spring, and slight or moderate overpredictions occur in other seasons. While the satellite-derived CO column abundances show the highest in spring, followed by winter, fall, and summer, the simulated CO column abundances show the highest in winter, followed by spring, fall, and summer for both years. CO is a slowly reacting gas in the atmosphere with a sink reaction of CO + OH and the secondary formation through the oxidation of volatile organic carbons (VOCs). Its fate is mainly affected by emissions, transport, and deposition processes. Great biomass burning activities, which are large contributors to CO emissions, over South and Southeast Asia in spring were reported ([63]). The CO emissions from biomass burning in spring over Southeast Asia may lead to a relatively high background CO concentrations over East Asia that WRF-CAM5 cannot reproduce because it does not represent such biomass burning emissions, leading to moderate underpredictions in column CO abundances in spring. Column abundances of NO2 agree well with observations against SCIAMACHY in terms of spatial distributions, magnitudes, and seasonal variations, with small underpredictions in spring, and small to moderate overpredictions in other seasons. The annual mean NMBs are 7.6% in 2006 and 0.4% in 2011. The good performance of the column abundances of NO2 but the significant underpredictions of surface mixing ratios of NO and NO2 suggest some uncertainties in the vertical distribution of NOx emissions used in the model.
Column SO2 is moderately to significantly overpredicted in all seasons in 2006 with NMBs of 18.7% to 137%. In 2011, column SO2 is moderately overpredicted in fall and winter and underpredicted in spring and summer. The annual mean NMBs of column SO2 are 62.9% in 2006 and −14.5% in 2011. As shown in Figure 8, significant overpredictions of column SO2 occur in North China Plain, indicating significant overpredictions of anthropogenic emissions of SO2 and/or possible uncertainties in the vertical allocation of SO2 emissions, namely, more SO2 emissions should have been allocated to surface layer rather than upper layers. Another possible reason for overpredictions in SO2 aloft is the inefficient conversion into sulfate by cloud chemistry. While the SO2 column abundance is overpredicted for all seasons in 2006 and fall and winter 2011, the mixing ratios of SO2 at surface are significantly underpredicted, indicating the uncertainties in the vertical distribution of SO2 emissions. This also indicates vigorous cloud lofting. Overpredictions in precipitation shown in Table 3 and Table S1 also contribute to the underpredictions in surface SO2 concentrations in both years. While the model fails to reproduce the observed seasonal variations of the column SO2 abundances, there are a large fraction of missing values and the reported overall error in the SO2 retrievals is 45%–80% for annual averages over polluted regions ([64]), the relatively poor data quality and inaccuracies in the retrieval algorithms for SO2 would affect the evaluation of column SO2. The situation is somewhat different in 2011. As shown in Table S2, SO2 is moderately to significantly underpredicted at the surface (except for Hong Kong) and also aloft in 2011. In such a case, possible reasons for underpredicted surface and aloft SO2 include overpredicted precipitation, underestimation in total SO2 emissions, and uncertainties in the SO2 retrieval.
In 2006, the column HCHO is slightly to moderately overpredicted with an annual mean NMB of 15.0%. In 2011, the column HCHO is slightly underpredicted in spring and winter and slightly overpredicted in summer and fall, leading to an annual mean NMB of −0.3%. The satellite-derived HCHO column abundances show the highest in summer, followed by spring, fall, and winter, the simulation shows the highest in summer, followed by fall, spring, and winter for both years. As shown in Figure 8, the overpredictions occur mainly in central China, Napel, northeastern India, and northern Burma, Thailand, Laos, and Vietnam. Possible reasons for such overpredictions may include uncertainties in HCHO emissions, biogenic emissions that can produce secondary HCHO, and satellite retrievals. In particular, De Smedt et al. ([65]) reported the errors in HCHO retrievals of (0.5–2.0)× 1015 molecules∙cm−2 are on the same order of magnitudes or even larger than the MBs in the simulated HCHO column for both years.
Figure 8. Spatial distributions of annual mean observed and simulated column CO, NO2, SO2, HCHO, and TOR for the 2006 and 2011 simulations with M92.
Climate 03 00627 g008
The simulated TOR agrees well with observed TOR with annual mean NMBs of TOR are 9.5% in 2006 and 7.9% in 2011. TOR is slightly underpredicted for summer and overpredicted for other seasons. The largest overprediction occurs in winter with an NMB of 26.5%, and an MB of 6.7 DU in 2006 and an NMB of 24.0%, and an MB of 6.2 DU in 2011. The satellite derived O3 column abundances show the highest in summer, followed by spring, fall, and winter, where the simulated column abundances show the highest in spring, followed by summer, winter, and fall in both years. The model performs better in predicting column TOR than surface O3 concentration, indicating that TOR predictions largely depend on O3 from upper atmosphere.

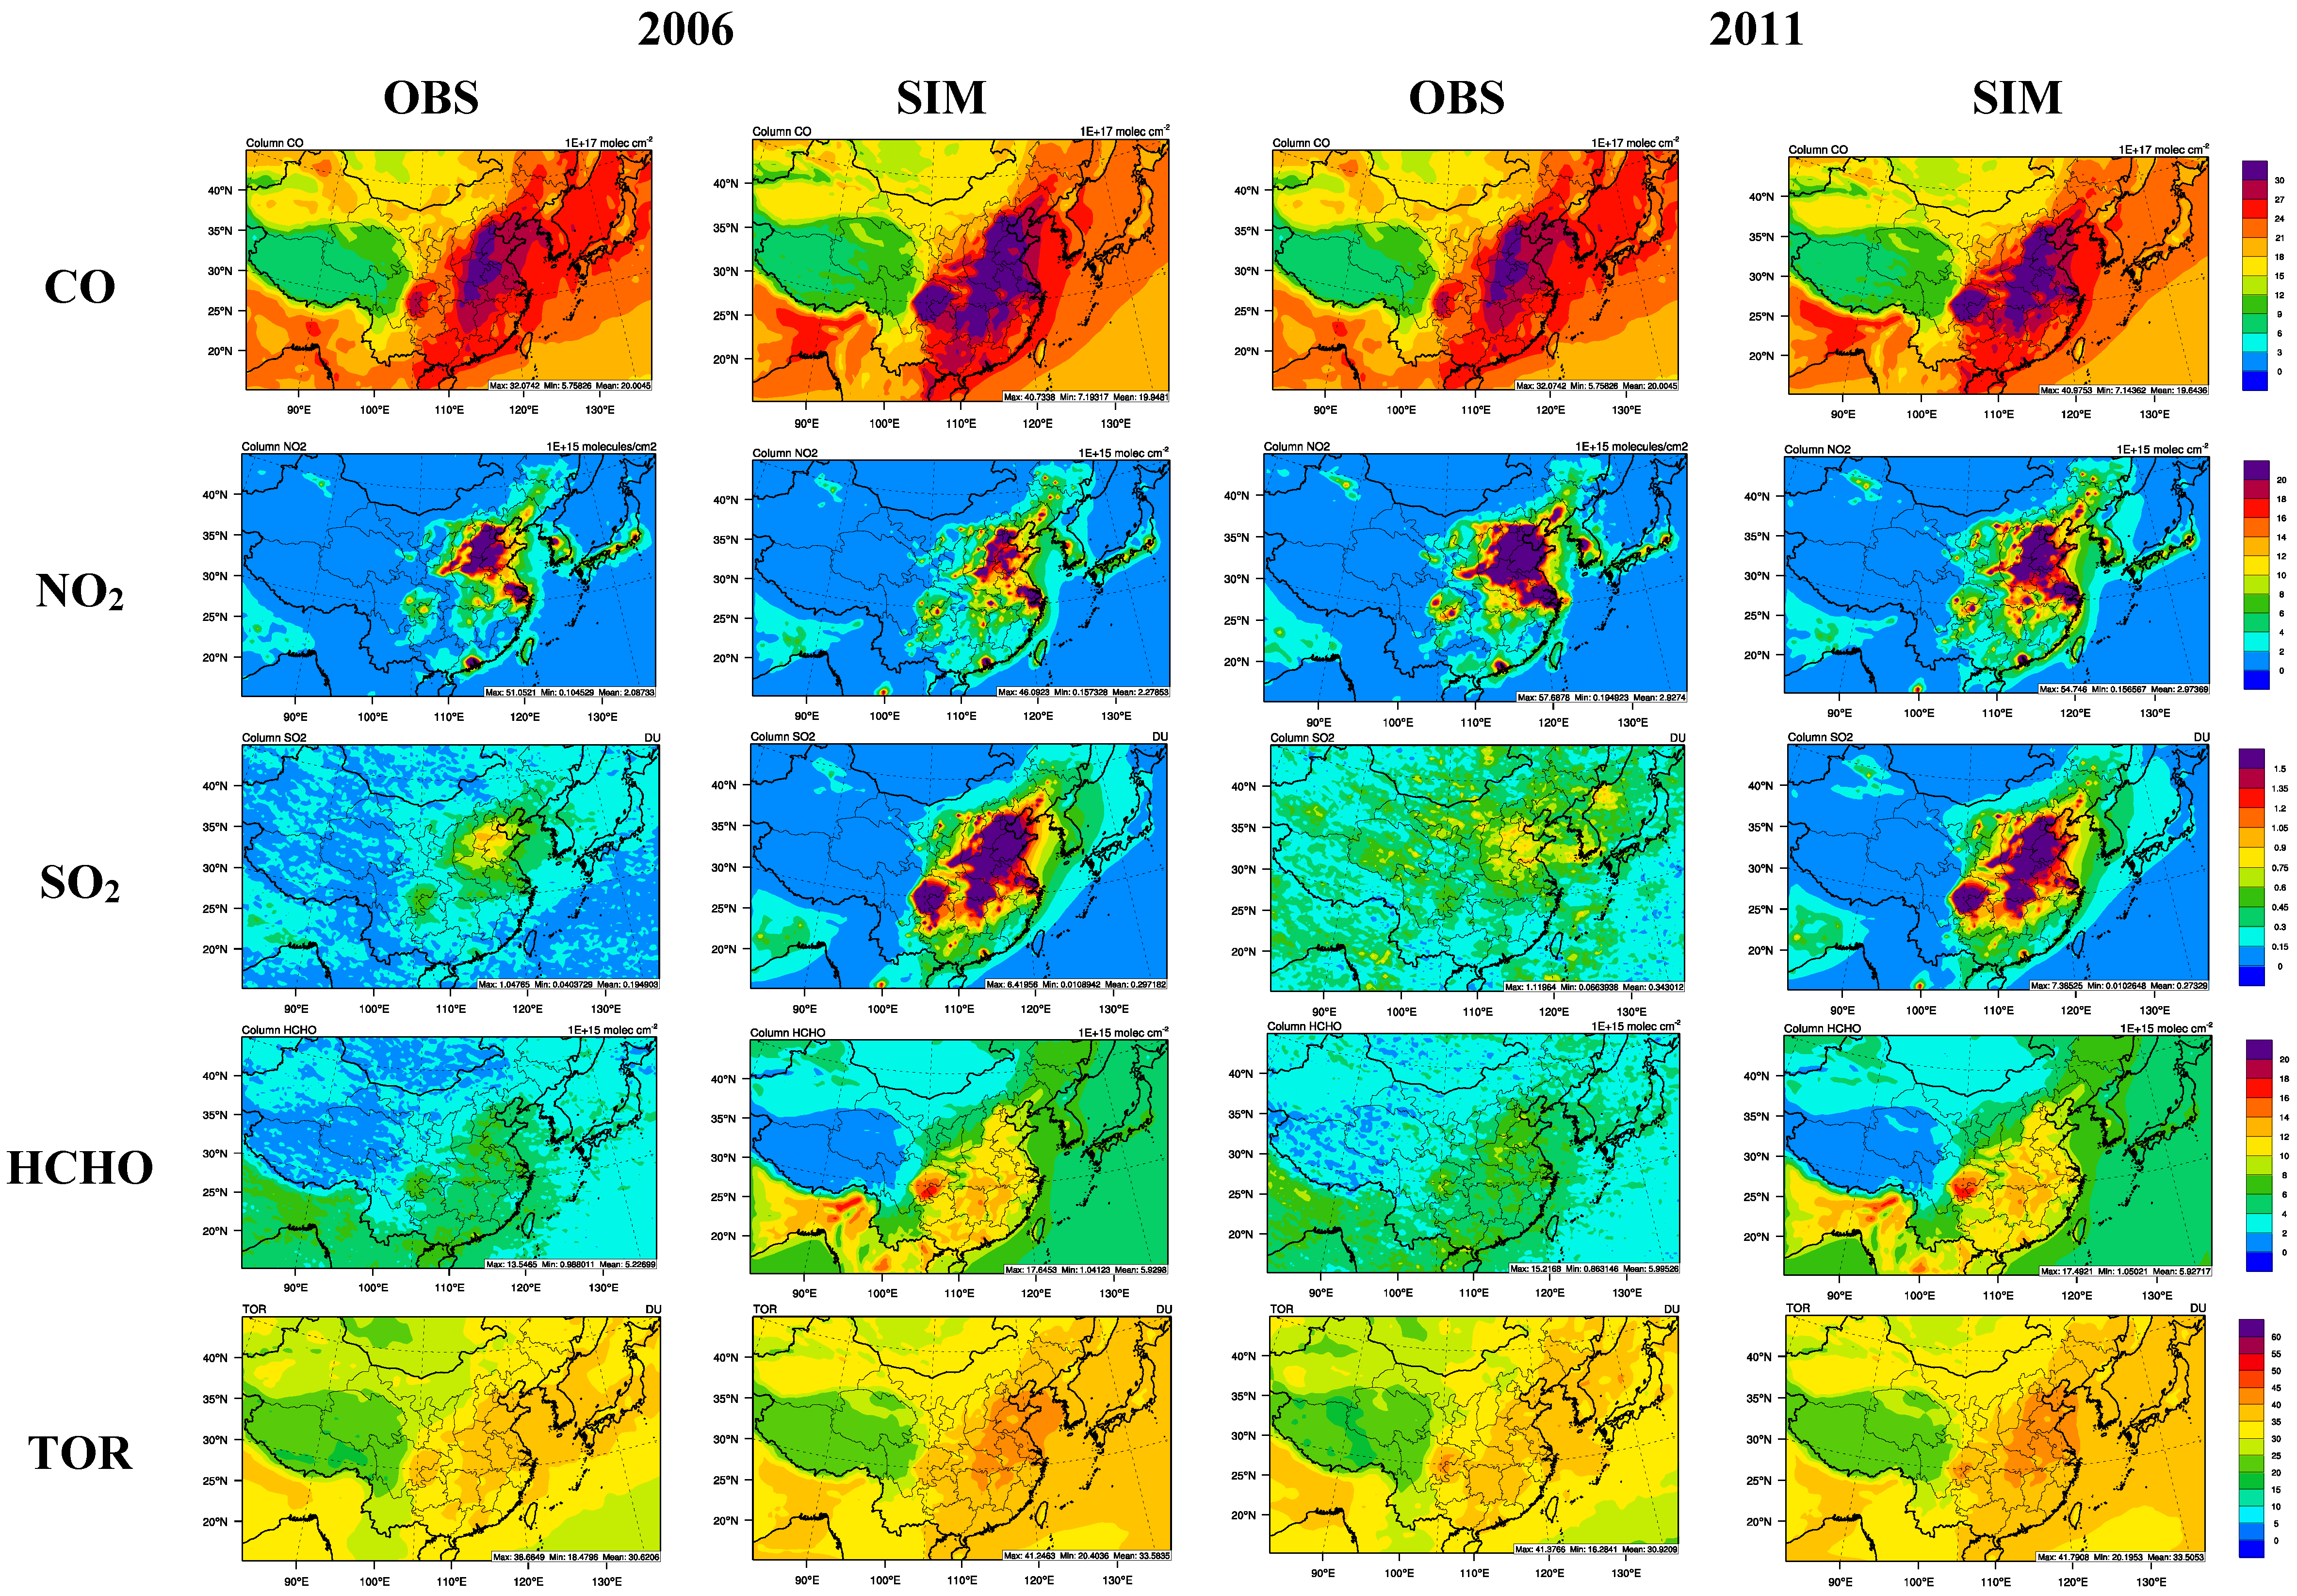
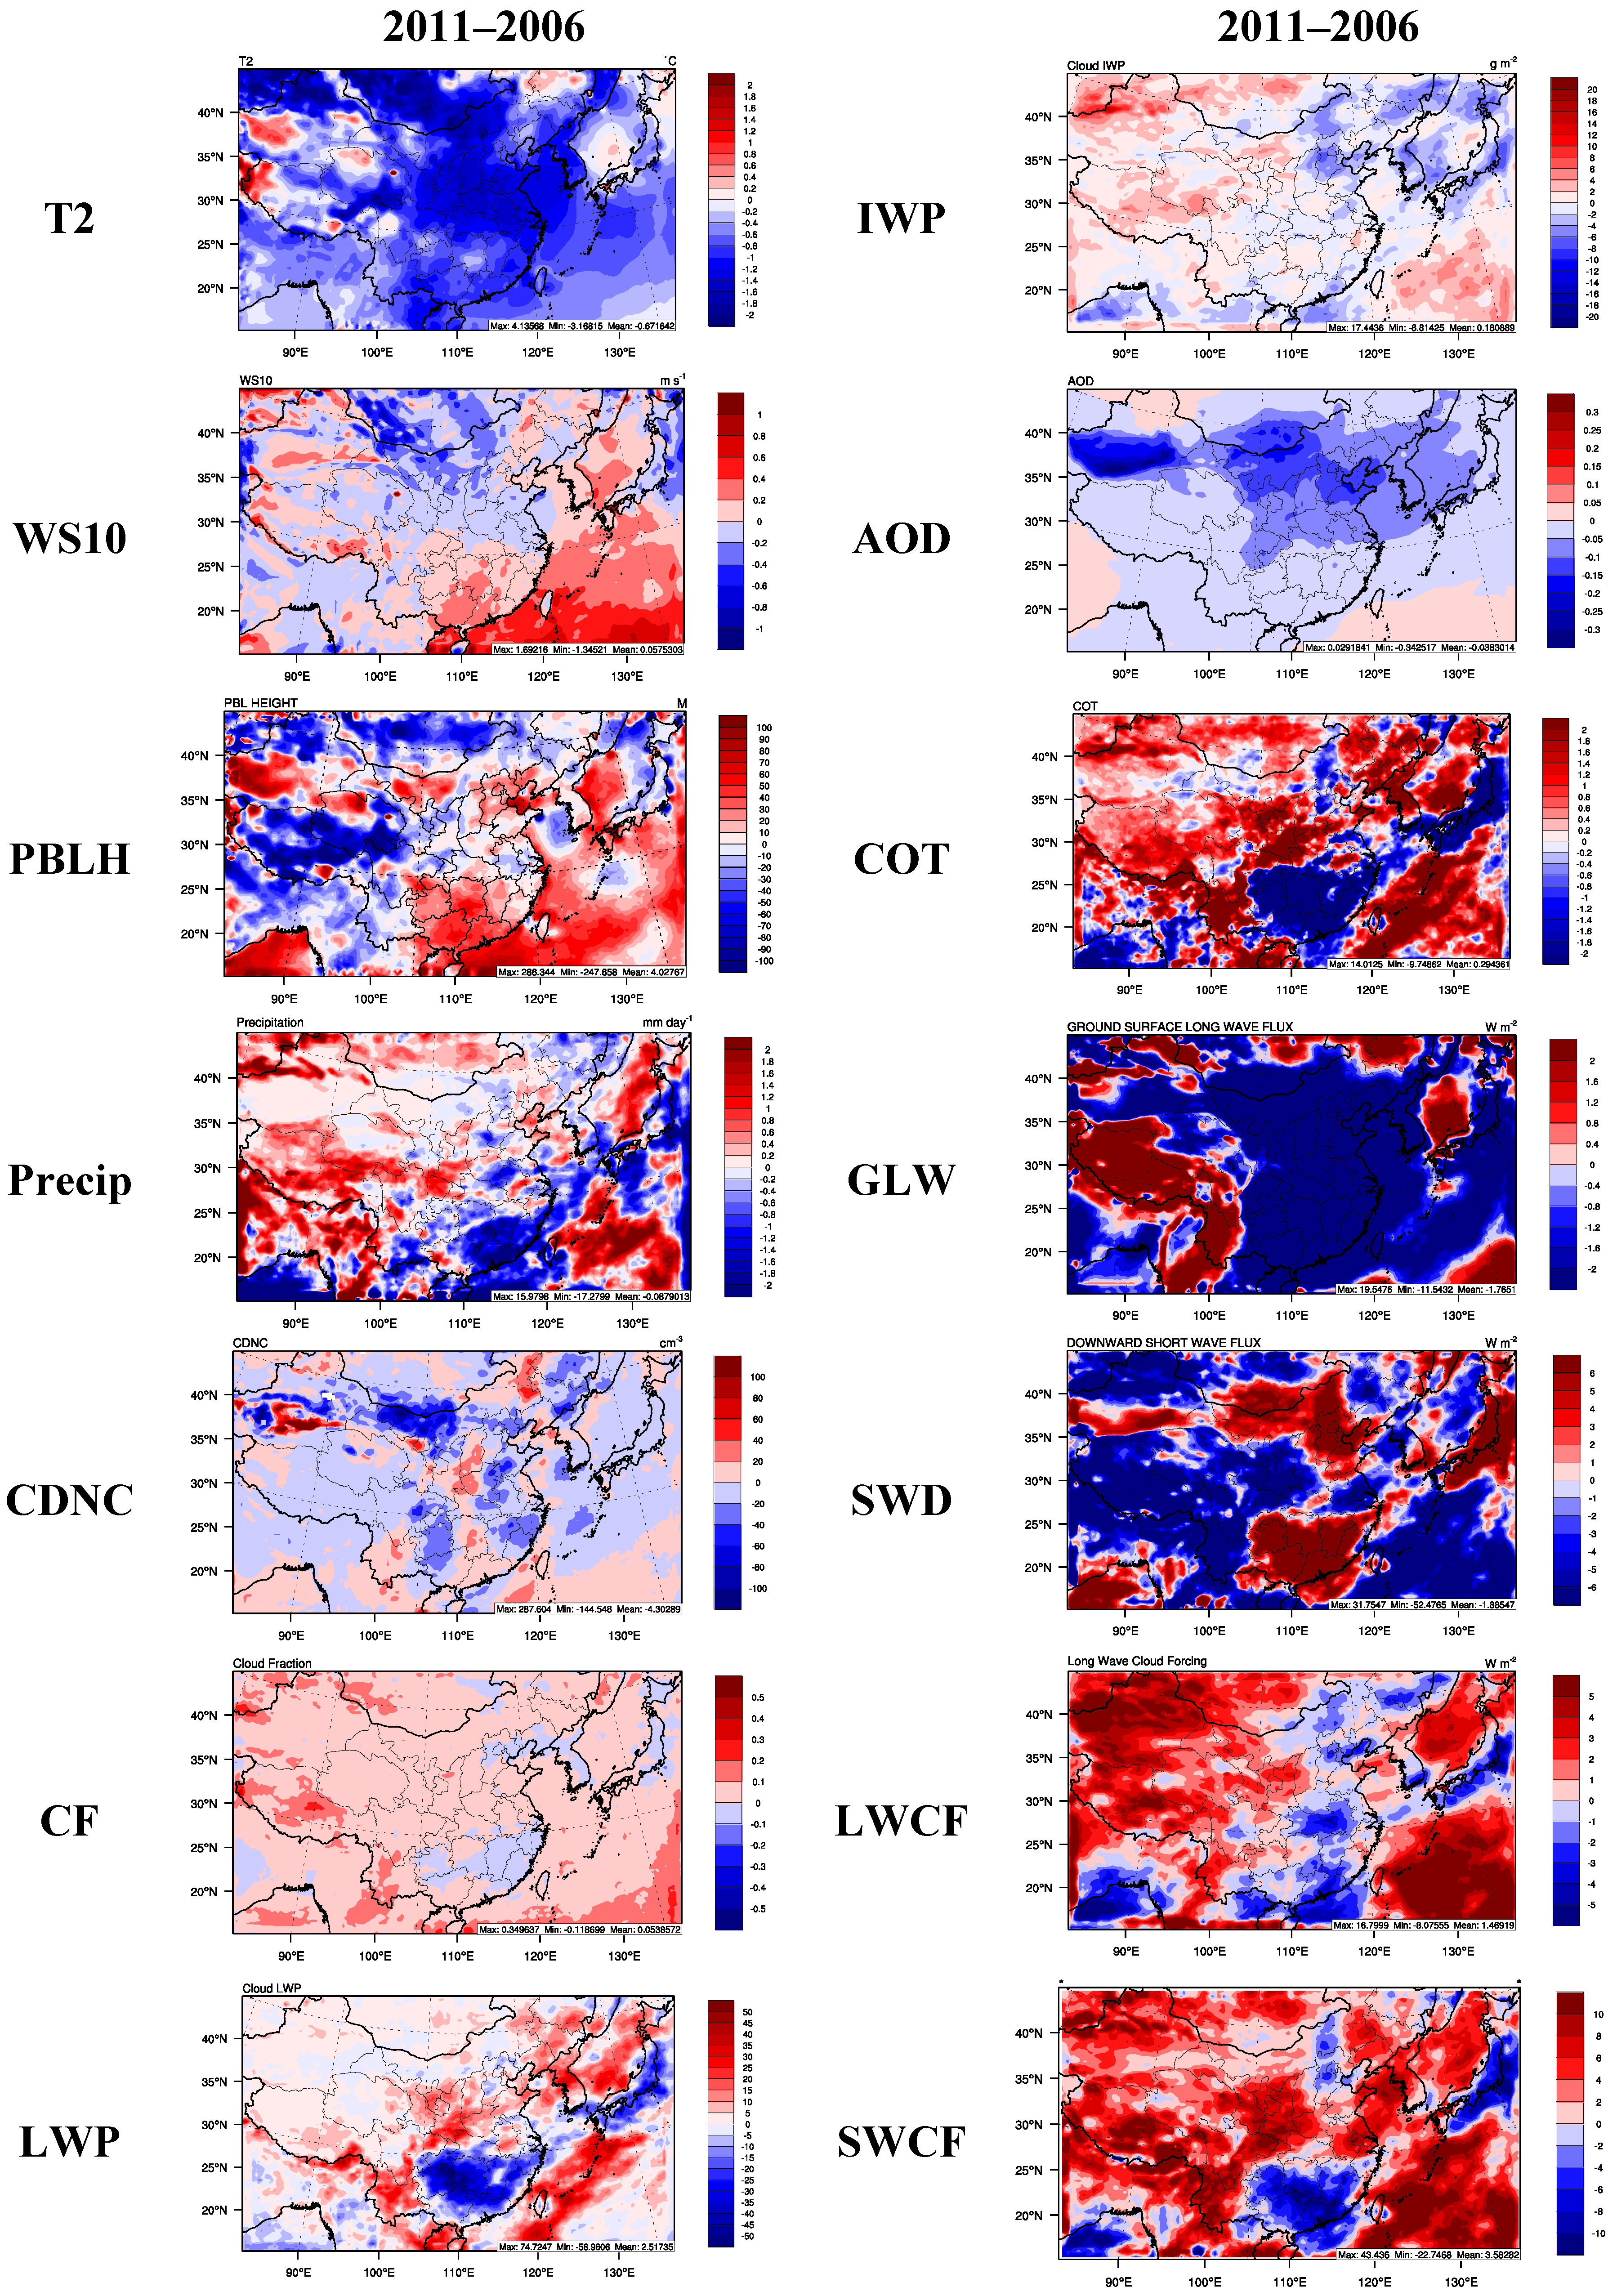
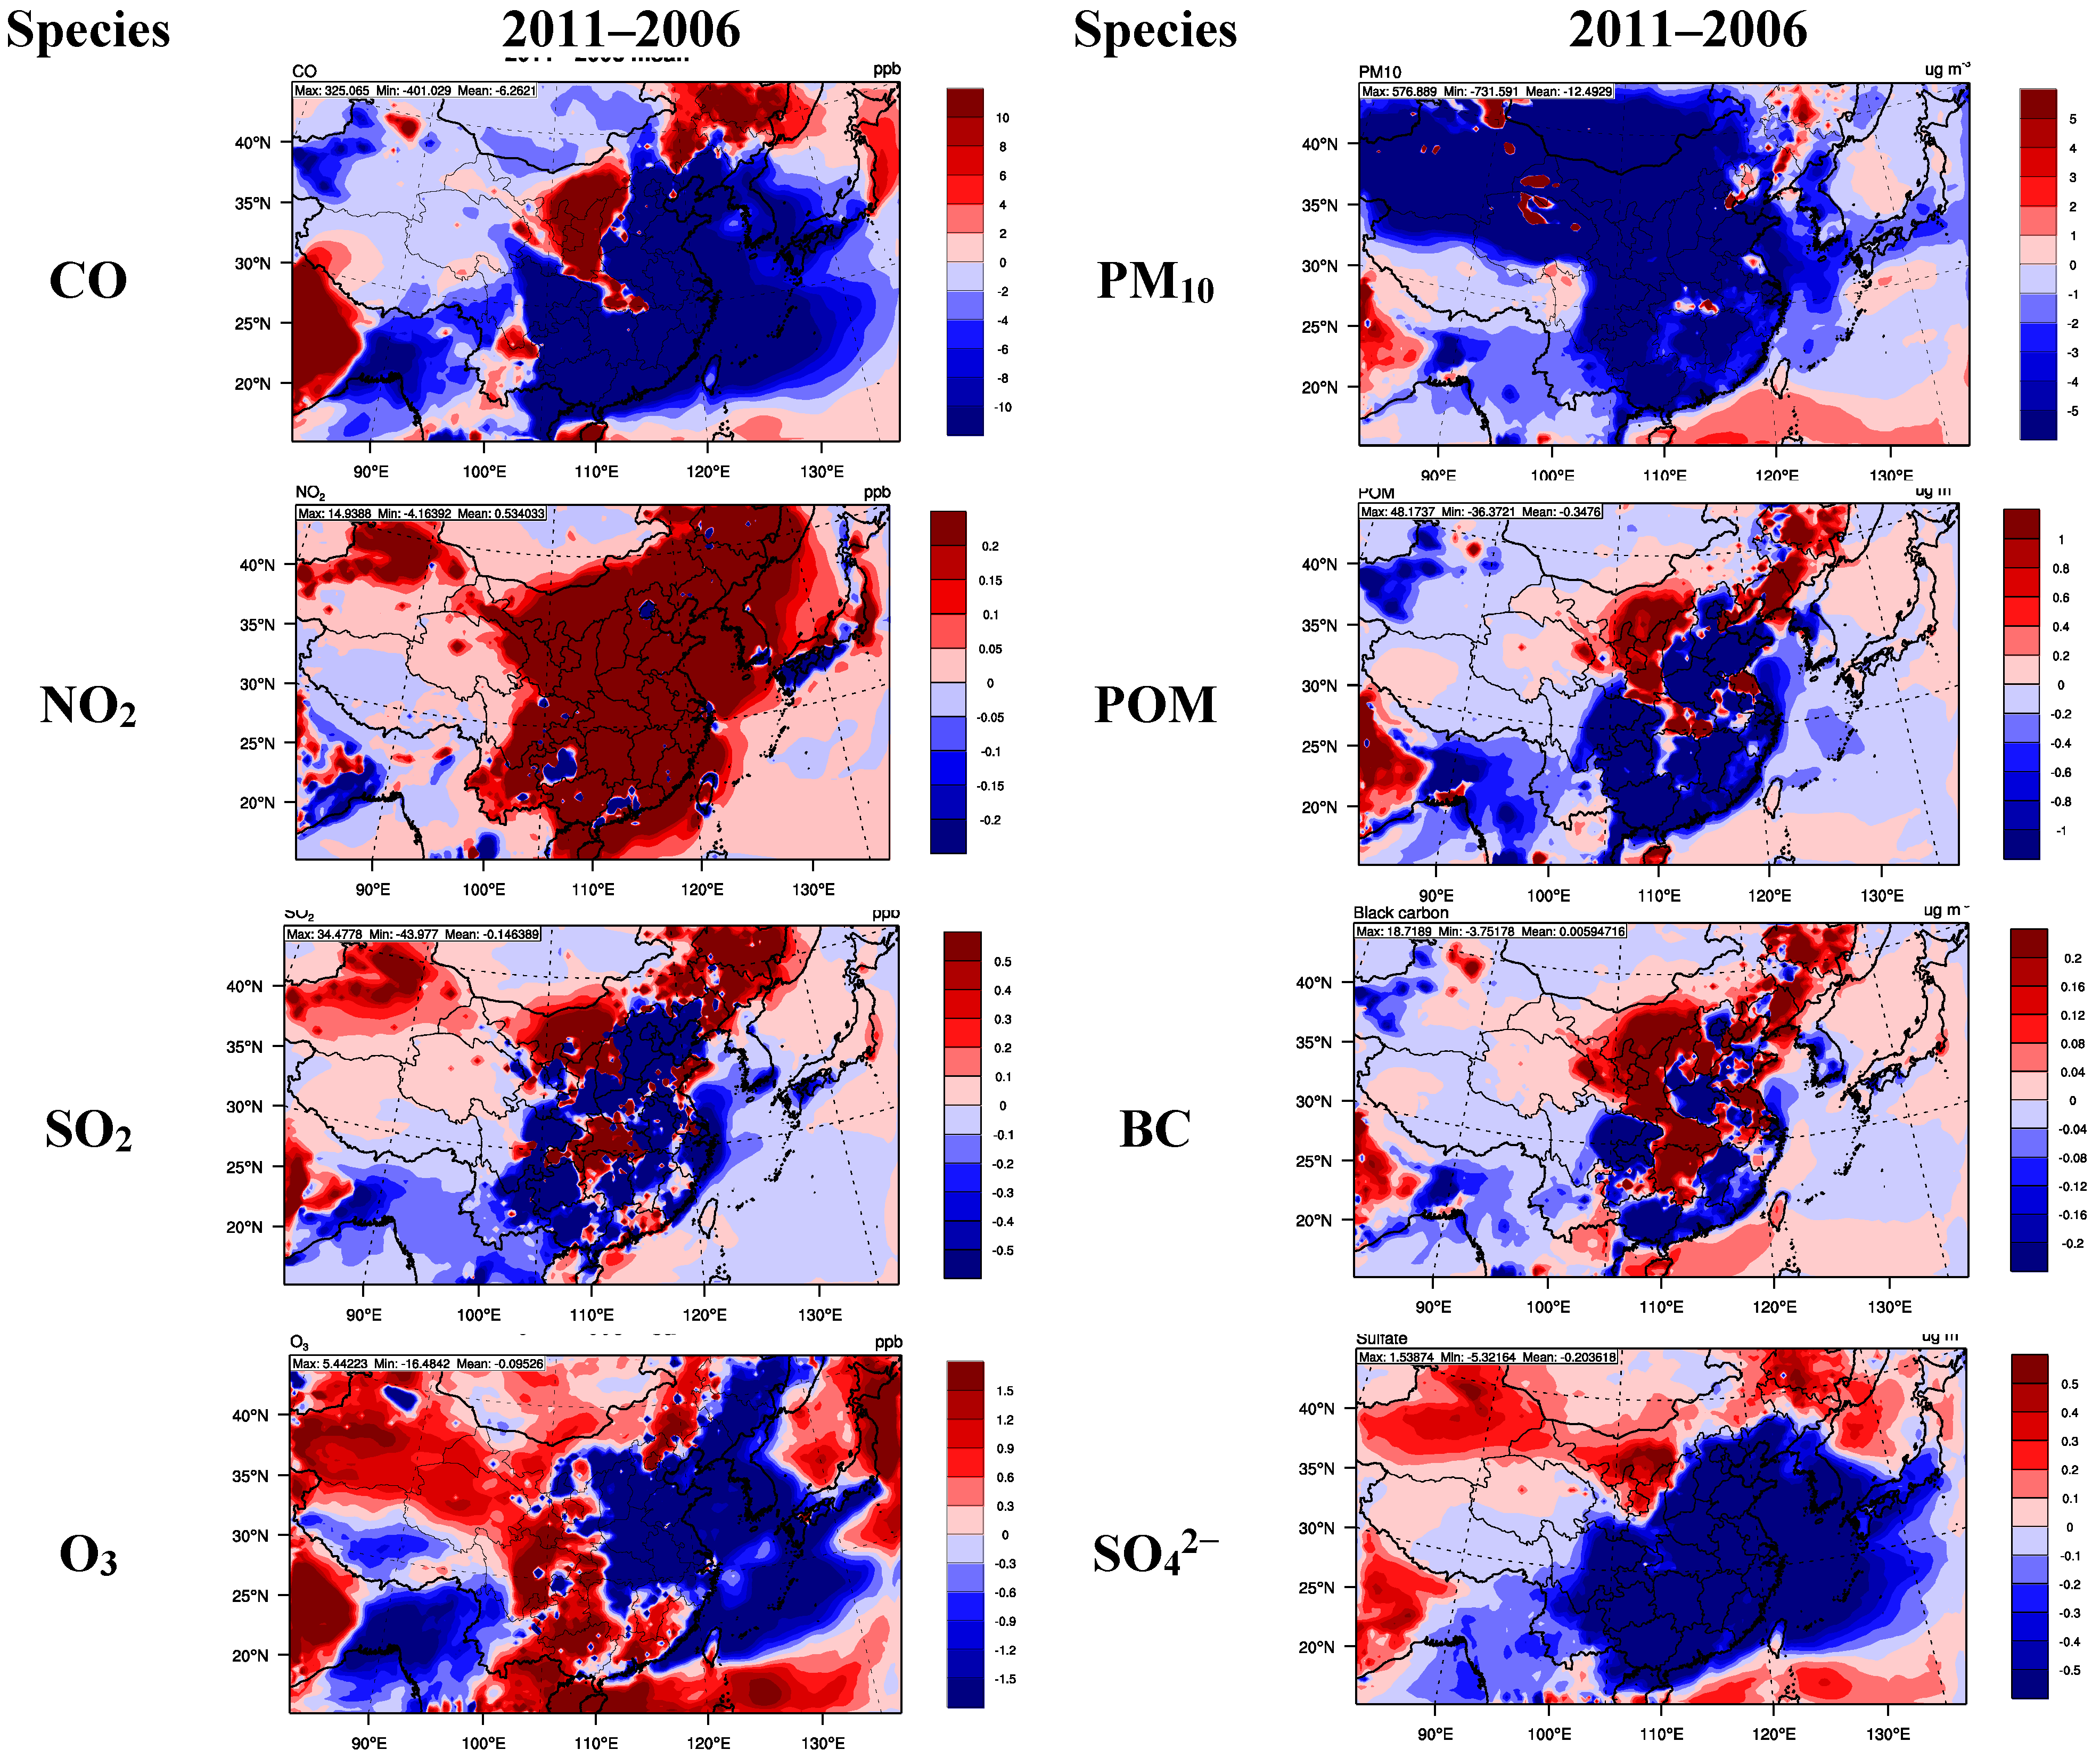
4. Model Responses to Changes in Emissions and Meteorology in 2011 Relative to 2006

As shown in Figure S1 in the supplementary material, moderate decreases occur for the emissions of major species such as CO, SO2, HCHO, and PM species from 2006 to 2011 over central and southern China. The annual mean percentage differences in emissions between 2011 and 2006 are −23.2%, -14.7%, and −32.6% for CO, SO2, and HCHO, respectively. Those for PM species including primary OC, BC, SO42−, other inorganic fine PM, and coarse PM are −32.2%, −24.2%, −10.0%, −26.7%, and −24.7%, respectively. However, the emissions of NOx, toluene, and NH3 are higher in 2011 than in 2006, with annual mean percentage differences of 8.7%, 13.4%, and 13.6%, respectively. The changes in SO2 and NOx emissions are consistent with those reported in previous studies ([66,67]).
Table 6. Comparison of annual mean observed and simulated trends in meteorological variables and chemical species for 2006 and 2011.
Variable20062011Absolute Difference% Difference
Obs.Sim.Obs.Sim.Obs.Sim.Obs.Sim.
P 939.7925.8942.0928.62.32.80.20.3
T2 (°C)13.812.913.512.4−0.3−0.5−2.2−3.9
Q2 (g∙kg−1)7.957.987.988.040.030.40.060.8
WS10 (m∙s−1)3.093.433.043.41−0.05−0.02−0.9−0.6
Precip (NCDC) (mm∙day−1)2.732.62.9−0.1−0.1−3.7−3.3
Precip (GPCP) (mm∙day−1)2.93.13.13.20.20.16.93.2
CCN (cm−2)0.820.540.760.51−0.06−0.03−7.3−5.6
CDNC (cm−3)143101140.397.6−2.7−3.4−1.9−3.4
CF0.640.560.650.610.010.051.68.9
PWV (cm)2.252.232.142.18−0.11−0.05−4.9−2.2
LWP (g∙m−2)110.348101.150.7−9.22.7−8.35.6
IWP (g∙m−2)245.19.5222.99.6−22.20.1−9.11.1
AOD0.330.210.310.17−0.02−0.04−6.1−19.0
COT16.38.215.28.5−1.10.3−6.73.7
GLW (W∙m−2)324.6317.4324.4315.2−0.2−2.2−0.1−0.7
SWD (W∙m−2)183.4204.9179.7202.6−3.7−2.3−2.0−1.1
SWCF (W∙m−2)−51.7−42−54−45.6−2.3−3.64.48.6
LWCF (W∙m−2)29.118.528.819.9−0.31.4−1.07.6
Col. CO2.0072.0142.0151.9780.008−0.0360.4−1.8
Col. NO2 (1015 molecular∙cm−2)2.32.53.33.310.843.532.0
Col. SO2 (DU)0.200.330.350.300.15−0.0375.0−9.1
Col. HCHO (1015 molecular∙cm−2)5.36.16.16.00.8−0.0314.8−0.5
TOR (DU)30.733.631.133.50.4−0.11.3−0.3
PM1098.697.889.586.2−9.1−11.6−9.2−11.9
NO2 (µg∙m−3)125.816117.361.1−8.545.1−6.8281.9
SO2 (µg∙m−3)101.567.194.777.5−6.810.4−6.715.5
To examine the model’s capability in predicting the observed variation trends from 2006 to 2011, the observed and simulated annual mean trends for all meteorological variables, surface chemical concentrations, and column abundances that have domain-wide observations are calculated and summarized in Table 6. The spatial distributions of absolute differences in meteorological, radiative, and cloud variables as well as the concentrations of major chemical species are shown in Figure 9 and Figure 10, respectively. The observed and simulated annual mean pressure both increase slightly by 0.2% and 0.3%, respectively. The observed annual mean temperatures reported by NCDC decrease by 0.3 °C (or by −2.2%) in 2011 relative to 2006. Comparing to 2006, 2011 gives annual mean T2 lower by 0.5 °C (or by −3.9%) at the NCDC sites and lower by 0.7 °C (or by −5.4%) domain-wide based on WRF-CAM5 simulations, consistent with the observed climate records from NOAA’s CPC. The trends in observed and simulated WS10 are a small decrease, by −0.05 and −0.02 m s−1 (or by −0.9% and 0.6%), respectively. No observed PBLH data are available to assess its simulated trend. The simulated domain-wide mean PBLH in both 2006 and 2011 remains similar, with only an increase of 4 m (by 1%) in 2011. The trends in observed and simulated precipitation at the NCDC and GPCP sites are consistent, decreasing by 3.7% and 3.3%, respectively, for NCDC sites and increasing by 6.9% and 3.2%, respectively, for GPCP grid cells. The domain-wide mean simulated precipitation decreases by 2.8% in 2011 relative to 2006.
The MODIS-derived and simulated CCN over the oceanic areas show small decreases (by −7.3% and −5.6%, respectively) between 2011 and 2006, due to decreases of CCN over land areas. In responses to a small decrease in simulated CCN over land areas in 2011, simulated CDNC decreases slightly (by −3.4%), which is consistent with the trend in the MODIS-derived CDNC (by −1.9%). The trends in MODIS-derived and simulated CF are consistent, both show small increases (by 1.6% and 8.9%) despite a larger increase by the simulation than the observation due to a much larger decrease in simulated T and a larger increase in simulated Q throughout the atmosphere (as reflected in the observed and simulated trends in T2 and Q2 near surface, note that no observed T and Q vertical profiles are available to evaluate simulated T and Q in upper layers). The observed and simulated PWV show a small decrease (by −4.9% and −2.2%, respectively) in 2011. The observed LWP and IWP decrease slightly (by 8.3% and 9.1%, respectively), whereas the simulated LWP and IWP increase slightly (by 5.6% and 1% domain-wide, respectively), due in part to the increased CF from the simulation that is much larger than observed CF. As shown in Figure 9, the increases in LWP occur in most areas except for southern China and Japan, and the increases in IWP occur over the western part of the domain and also oceanic areas. The observed and simulated AOD decrease in 2011 by 6.1 and 19%, respectively. The observed COT decreases slightly (by 6.7%), whereas the simulated COT increases slightly (by 3.7%), also partly because the increased CF from the simulation is much larger than observed CF. The increases in COT occur in most areas except for southern China and Japan, which is consistent with the spatial distributions of CWP. The observed LWD and SWD show a small decrease (by 0.2 W∙m−2 (or 0.1%) and 3.7 W∙m−2 (or 2.0%), respectively). The simulated LWD and SWD also show a small decrease (by 2.2 W∙m−2 (or 0.7%) and 2.3 W∙m−2 (or 1.1%), respectively). The observed and simulated SWCF increase slightly (by 4.4% and 8.6%) in 2011. The slight increase in observed SWCF is inconsistent with the observed slight decreases of COT, LWP, and IWP (see Figure 3 and Figure 4). Such inconsistencies indicate possible uncertainties in the satellite-derived products. On the other hand, the simulated SWCF increases coincide with the simulated increases of COT, which are closely related to the increases in simulated LWP and to a lesser extent the increases in simulated IWP (see Figure 3 and Figure 4). The observed LWCF decreases slightly (by 1%) in 2011 whereas the simulated LWCF increases slightly (by 7.6%). The increases in LWCF occur in most of the domain except for Japan, and southern and northeastern China.
The observed column CO abundance increases by 0.4% whereas the simulated column CO decreases by 1.8%. Despite moderate decreases in CO emissions from 2006 to 2011, the simulated column CO abundances only decrease by 1.8% and surface CO mixing ratios decrease by 4.8% in most areas (see Figure 10). Moderate increases in NOx emissions from 2006 to 2011 result in moderate increases in both column NO2 abundances (by 32.0%, Table 6) and surface NO2 mixing ratios (by 23.8%, Figure 10), such increases are consistent with the increase of 43.5% in the observed column NO2 abundance. Slight to moderate decreases in simulated SO2 column abundances (by 9.1%) and surface mixing ratios (by 2.5%) from 2006 to 2011 correspond to the decreases in SO2 emissions in 2011. However, such changes are inconsistent with the observed SO2 column abundances, which increase by 75%. Given large uncertainties in the satellite-derived SO2 column abundance, it is not clear if such a large increase is true, as it is inconsistent with 15% reduction in SO2 emissions. The observed HCHO column abundance increases by 14.8%, but the simulated one decreases by −0.5%. The observed TOR increases by 1.3%, but the simulated one decreases by −0.3%. Although the changes in the TOR and surface O3 mixing ratios are small, they result from the compensation of large decreases in most eastern part of the domain and large decreases in the remaining areas. Moderate decreases (by 9.2% and 11.9%, respectively) in observed and simulated surface PM10 mass concentrations in major cities in mainland China from 2006 to 2011 are found due to the moderate reductions of emissions of primary anthropogenic aerosol and precursor gas species (i.e., SO2) that lead to lower concentrations of primary and secondary aerosol such as POM and SO42− in most areas in eastern China, South and North Korea, and western Pacific (see Figure 10).
Figure 9. Annual mean absolute differences in meteorological, radiative, and cloud variables between 2011 and 2006.
Climate 03 00627 g009
Figure 10. Annual mean absolute changes of mixing ratios of surface CO, NO2, SO2, O3, and mass concentrations of surface PM10, POM, BC, and SO42− between 2011 and 2006.
Climate 03 00627 g010

5. Summary and Conclusions

The WRF-CAM5 simulations are conducted over East Asia for 2006 and 2011. Simulations results are evaluated against satellite data, merged satellite and rain gauge data, and surface network data. The simulated near-surface meteorological fields such as P, T2, Q2, and WS10 for both years agree well with the observations. The mean bias, mean absolute gross error, and index of agreement of Q2 and the mean bias, root mean square error, and index of agreement of WS10 are within the benchmark proposed by Emery et al. ([49]). The WS10 predictions outperform those reported in the literature. The annual mean MBs of T2 are larger than the suggested threshold values because of no use of FDDA but they are comparable or even better than the reported performance of mesoscale meteorological models, they are deemed acceptable. The annual-mean precipitation for both years is well predicted with annual-mean NMBs of 13.6% against NCDC and 9.0% against GPCP in 2006, and annual-mean NMBs of 11.1% against NCDC and 2.5% against GPCP in 2011. The precipitation performance is either consistent or better than the WRF performance reported in the literature. The moderate overpredictions are attributed to the neglecting of the effect of clouds on radiation through the changes of droplet and ice effective radii and/or the overpredictions of convective precipitation intensity by the cumulus parameterization. The model reproduces the observed seasonal variations for P, T2, Q2, and precipitation.
The simulated annual-mean CF, PWV, LWD, and SWD generally agree well observations in terms of both magnitudes and spatial distributions. The small underpredictions of LWD and overpredictions of SWD may be due likely to the underpredictions of aerosol direct radiative forcing and underpredictions of cloud radiative forcing. Moderate underpredictions occur in CCN due to possible underpredictions of sea salt concentrations and uncertainties in the CCN retrievals. Moderately underpredictions of CDNC also occur in both years, due to possible underpredictions of PM and thus CCN over land and oceanic areas as well as possible underestimated fraction of activated particles by the AR-G02 parameterization. Large uncertainties exist in the predictions of LWP, IWP, and COT due to the model’s limitations in simulating dynamics and thermodynamics for accurate predictions of cloud properties, the uncertainties of ice nucleation parameterizations in partitioning total water path into LWP and IWP, as well as inaccuracies in satellite-derived products. LWP, IWP, and COT are significantly underpredicted over the most of the domain with annual mean NMBs of −56.5%, −96.1%, and −50.0% in 2006, and annual mean NMBs of −49.8%, −95.7%, and −44.0% in 2011, respectively. Moderate underpredictions of AOD occur with annual mean NMBs of −35.7% in 2006 and −45.2% in 2011. The underpredictions of LWP, IWP, and COT result in moderate to significant underpredictions in LWCF and SWCF. The model generally reproduces the observed seasonal variations of CDNC, AOD, LWD, SWD, LWCF, and SWCF for both years, however, it either fails (e.g., the CCN over oceanic area) or partially fails (e.g., IWP, LWP, and COT) to reproduce the observed seasonal variations for several variables.
The biases in meteorological, radiative, and cloud variable predictions affect chemical predictions by affecting several processes such as gas-phase photochemistry, secondary aerosol formation, transport, and wet scavenging. Moderate to significant underpredictions of CO, NO2, SO2, and aerosol particles are found over Taiwan, Japan, and South Korea due to the possible underestimations of emissions of these species, the overprediction of precipitation, wind speed, and PBL height over these regions. The mixing ratios of SO2 and mass concentrations of PM2.5, and PM10 in Hong Kong are moderately to significantly overpredicted due likely to the overestimation of SO2 and dust emissions, and overpredictions in precipitation. The mixing ratios of O3 at the Hong Kong, Taiwan, Japan, and South Korea sites are moderately overpredicted due likely to insufficient of titration by NO. The concentrations of SO2, PM2.5, and PM10 are largely overpredicted in Hong Kong but underpredicted in Taiwan, indicating some problems in the spatial distributions of the emissions of SO2 and primary PM. The API-derived NO2 concentrations are significantly underpredicted with annual mean NMBs of −87.3% in 2006 and −48.0% in 2011. The API-derived SO2 concentrations are moderately overpredicted in some seasons (e.g., summer in 2006 and spring and summer in 2011) but underpredictions in other seasons, leading to annual mean NMBs of −33.9% in 2006 and −18.2% in 2011. The API-derived PM10 concentrations are overall well produced. The evaluation of the simulated mass concentrations of PM2.5 and SO42− at the two sites in Beijing, China agrees well with the observations but poorly for Na+ and Cl because the anthropogenic emissions of Na+ and Cl are not included in the emission file used in the model simulations. The model reproduces the seasonal variations for CO in both years and for PM2.5 and PM10 in 2006 the Hong Kong sites, for O3 and PM10 in 2006 and for CO, O3, PM2.5, and PM10 in 2010 at the Taiwan sites, for O3 in both years at the Japan sites, and O3 and PM10 in 2011 at the South Korean sites. Despite moderate to large biases for some species, the performance of chemical predictions is generally consistent with or even better than that reported for East Asia with a few exceptions (e.g., significant overpredictions in the concentrations of SO2, PM2.5, and PM10 in Hong Kong sites).
The simulated column CO is comparable with observations from MOPITT in terms of spatial distributions and magnitudes for both years. However, moderate underpredictions occur in column CO abundances in spring, due likely to the inaccurate representation of CO emissions from biomass burning over Southeast Asia. Column abundances of NO2 agree well with observations in terms of spatial distributions and magnitudes. Column SO2 is significantly overpredicted in 2006 but moderately underpredicted in 2011. The inconsistent performance between the column abundances and surface concentrations of NO2 and SO2 suggests some uncertainties in the vertical distribution of NOx and SO2 emissions used in the model. The column HCHO is slightly to moderately overpredicted. The simulated TOR agrees well with observed TOR. The model reproduces well the seasonal variations of NO2 column abundances and marginally well for those of the column abundances of HCHO, CO, and O3 but fails to reproduce those of the column abundance of SO2 due to large uncertainties in the emissions of SO2 and poor quality of satellite-derived column abundance of SO2.
Comparing to the emissions in 2006, the emissions of major species such as CO, SO2, HCHO, xylene, and PM species decrease but those of NOx, toluene, and NH3 increase in 2011. Comparing to the annual mean meteorology in 2006, the 2011 simulations give lower T2, higher WS10, higher precipitation over most of the domain. They also give lower Q2 and higher PBLH over eastern part of domain but higher Q2 and lower PBLH over the western part of the domain. The model is capable of reproducing the observed variation trends from 2006 to 2011 for most variables except for LWP, IWP, COT, LWCF, column abundances of CO, SO2, HCHO, TOR, and surface concentrations of NO2 and SO2. The predicted concentrations/mixing ratios of chemical species (i.e., CO, NO2, SO2, O3, PM2.5, and PM10) are sensitive to the changes in emissions and meteorology.
This study has several limitations. First, air quality observations over mainland are limited and there are insufficient data to accurately evaluate the NO2, SO2, O3, and PM2.5 predictions. On the other hand, the satellite data are useful for model evaluation as it bridges some gaps in the absence of available surface observations, however, large uncertainties are associated with satellite retrievals, in particular, for CDNC, LWP, IWP, COT, and column abundances of SO2 and HCHO. In addition, no observations are available to evaluate the number concentrations of ice nuclei and cloud ice crystals. Second, the anthropogenic and natural dust emissions used in this study are possibly underestimated. On the other hand, the dependence on aerosols including dust particles for IN and cloud simulations requires more accurate predictions of aerosol in climate models. The model evaluations show that WRF-CAM5 moderately-to-significantly underpredicts the concentrations of PM10 over East Asia, especially over southern China, Taiwan, Japan, and South Korea due to the underestimates in emissions of primary PM and gaseous precursors for secondary PM, inaccurate dust emissions, as well as omission of nitrate formation, one of the most important secondary aerosol components. The underpredictions of aerosol concentrations can result in underpredictions in CDNC and IN number concentrations, which in turn contribute in part to the underpredictions of LWP, IWP, and COT. Third, the inherent assumptions and limitations of the MAM3 approach lead to the limited capability of resolving the abrupt size transition between the interstitial and activated aerosol fractions as indicated in Zhang et al. ([68]). Finally, the grid resolution used in this study might be too coarse to represent the spatial distributions of emissions, and subgrid scale processes such as turbulence mixing and cumulus cloud formation, contributing in part to the model biases reported in this work.

Supplementary Files

Supplementary File 1

Acknowledgments

This research was supported by the U.S. Department of Energy Office of Science Biological and Environmental Research as part of the Global and Regional Climate Modeling programs (DE-SC0006695 at NCSU and KP1703000 at PNNL) and China’s National Basic Research Program (2010CB951803 at NCSU). Observations in mainland China, Taiwan, Hong Kong, Japan, and South Korea as well as satellite data were downloaded from their respective websites. We thank Ralf Bennartz, Vanderbilt University, and the University of Wisconsin—Madison, for providing the CNDC data derived from MODIS. Simulations were performed on Kraken/Stampede, provided as an Extreme Science and Engineering Discovery Environment (XSEDE) digital service by the Texas Advanced Computing Center (TACC), supported by National Science Foundation grant number OCI-1053575, and Hopper at the National Energy Research Scientific Computing Center (NERSC), supported by the Office of Science of the U.S. Department of Energy under Contract No. DE-AC-0205CH11231. The Pacific Northwest National Laboratory is operated for DOE by Battelle Memorial Institute under contract DE-AC05-76RL01830.

Author Contributions

Ying Chen performed all model simulations and evaluation, data processing, and plotting, and contributed to some writing of the paper. Yang Zhang designed the study, and wrote large portions of the paper. Jiwen Fan and Ruby Leung provided WRF-CAM5, contributed to simulation designs, and provided constructive reviews of the manuscript. Qiang Zhang and Kebin He provided the emissions and some chemical observations over China.

Conflicts of Interest

The authors declare no conflict of interest.

References

  1. Zhang, Y. Online coupled meteorology and chemistry models: History, current status, and outlook. Atmos. Chem. Phys. 2008, 8, 2895–2932. [Google Scholar] [CrossRef]
  2. Grell, G.A.; Baklanov, A. Integrated modelling for forecasting weather and air quality: A call for fully coupled approaches. Atmos. Environ. 2011, 45, 6845–6851. [Google Scholar] [CrossRef]
  3. Kukkonen, J.; Olsson, T.; Schultz, D.M.; Baklanov, A.; Klein, T.; Miranda, A.I.; Monteiro, A.; Hirtl, M.; Tarvainen, V.; Boy, M.; et al. A review of operational, regional- scale, chemical weather forecasting models in Europe. Atmos. Chem. Phys. 2012, 12, 1–87. [Google Scholar] [CrossRef] [Green Version]
  4. Baklanov, A.; Schlünzen, K.; Suppan, P.; Baldasano, J.; Brunner, D.; Aksoyoglu, S.; Carmichael, G.; Douros, J.; Flemming, J.; Forkel, R.; et al. Online coupled regional meteorology-chemistry models in Europe: Current status and prospects. Atmos. Chem. Phys. 2014, 14, 317–398. [Google Scholar]
  5. Grell, G.A.; Peckham, S.E.; Schmitz, R.; McKeen, S.A.; Frost, G.; Skamarock, W.C.; Eder, B. Fully coupled “online” chemistry within the WRF model. Atmos. Environ. 2005, 39, 6957–6975. [Google Scholar] [CrossRef]
  6. Ma, P.-L.; Rasch, P.J.; Fast, J.D.; Easter, R.C.; Gustafson, W.I., Jr.; Liu, X.; Ghan, S.J.; Singh, B. Assessing the CAM5 physics suite in the WRF-Chem model: Implementation, resolution sensitivity, and a first evaluation for a regional case study. Geosci. Model Dev. 2014, 7, 755–778. [Google Scholar] [CrossRef]
  7. Lim, K.-S.; Fan, J.-W.; Leung, L.R.; Ma, P.-L.; Singh, B.; Zhao, C.; Zhang, Y.; Zhang, G.; Song, X.-L. Investigation of aerosol indirect effects using a cumulus microphysics parameterization with in a regional climate model. J. Geophys. Res. 2014, 116, D02204. [Google Scholar] [CrossRef]
  8. Neale, R.B.; Chen, C.-C.; Gettelman, A.; Lauritzen, P.H.; Park, S.; Williamson, D.L.; Conley, A.J.; Garcia, R.; Kinnison, D.; Lamarque, J.-F.; et al. Description of the NCAR Community Atmosphere Model (CAM5), Technical Report NCAR/TN-486+STR; National Center for Atmospheric Research: Boulder, CO, USA, 2010; p. 268. [Google Scholar]
  9. Liu, X.; Easter, R.C.; Ghan, S.J.; Zaveri, R.; Rasch, P.; Shi, X.; Lamarque, J.-F.; Gettelman, A.; Morrison, H.; Vitt, F.; et al. Toward a minimal representation of aerosols in climate models: Description and evaluation in the Community Atmosphere Model CAM5. Geosci. Model Dev. 2012, 5, 709–739. [Google Scholar] [CrossRef]
  10. Meyers, M.P.; DeMott, P.J.; Cotton, W.R. New primary ice-nucleation parameterizations in an explicit cloud model. J. Appl. Meteorol. 1992, 31, 708–721. [Google Scholar] [CrossRef]
  11. Niemand, M.; Mohler, O.; Vogel, B.; Vogel, H.; Hoose, C.; Connolly, P.; Klein, H.; Bingemer, H.; DeMott, P.; Skrotzki, J.; Leisner, T. A particle-surface-area-based parameterization of immersion freezing on desert dust particles. J. Atmos. Sci. 2012, 69, 3077–3092. [Google Scholar] [CrossRef]
  12. Phillips, V.T.J.; Demott, P.J.; Andronache, C.; Pratt, K.A.; Prather, K.A.; Subramanian, R.; Twohy, C. Improvements to an empirical parameterization of heterogeneous ice nucleation and its comparison with observations. J. Atmos. Sci. 2013, 70, 378–409. [Google Scholar] [CrossRef]
  13. DeMott, P.J.; Prenni, A.J.; McMeeking, G.R.; Sullivan, R.C.; Petters, M.D.; Tobo, Y.; Niemand, M.; Möhler, O.; Snider, J.R.; Sever, G.; et al. Integrating laboratory and field data to quantify the immersion freezing ice nucleation activity of mineral dust particles. Atmos. Chem. Phys. 2015, 15, 393–409. [Google Scholar] [CrossRef]
  14. Hao, J.-M.; He, K.-B.; Duan, L.; Li, J.-H.; Wang, L.-T. Air pollution and its control in China. Front. Environ. Sci. Eng. 2007, 1, 129–142. [Google Scholar] [CrossRef]
  15. Mlawer, E.J.; Taubman, S.J.; Brown, P.D.; Iacono, M.J.; Clough, S.A. Radiative transfer for inhomogeneous atmospheres: RRTM, a validated correlated-k model for the longwave. J. Geophys. Res. 1997, 102, 16663–16682. [Google Scholar] [CrossRef]
  16. Iacono, M.J.; Delamere, J.S.; Mlawer, E.J.; Shephard, M.W.; Clough, S.A.; Collins, W.D. Radiative forcing by long-lived greenhouse gases: Calculations with the AER radiative transfer models. J. Geophys. Res. 2008, 113, D13103. [Google Scholar] [CrossRef]
  17. Tewari, M.; Chen, F.; Wang, W.; Dudhia, J.; LeMone, M.A.; Mitchell, K.; Ek, M.; Gayno, G.; Wegiel, J.; Cuenca, R.H. Implementation and verification of the unified NOAH land surface model in the WRF model. In Proceedings of the 20th Conference on Weather Analysis and Forecasting/16th Conference on Numerical Weather Prediction, Seattle, WA, USA, 12–16 January 2004.
  18. Monin, A.S.; Obukhov, A.M. Basic laws of turbulent mixing in the surface layer of the atmosphere. Akademiya Nauk SSSR 1954, 151, 163–187. [Google Scholar]
  19. Janjic, Z.I. Nonsingular Implementation of the Mellor-Yamada Level 2.5 Scheme in the NCEP Meso Model, NCEP Off. Note; National Center for Environmental Prediction: College Park, MD, USA, 2002. [Google Scholar]
  20. Bretherton, C.S.; Park, S. A new moist turbulence parameterization in the community atmosphere model. J. Clim. 2009, 22, 3422–3448. [Google Scholar] [CrossRef]
  21. Zhang, G.J.; McFarlane, N.A. Sensitivity of climate simulations to the parameterization of cumulus convection in the Canadian Climate Centre general circulation model. Atmos. Ocean 1995, 33, 407–446. [Google Scholar] [CrossRef]
  22. Song, X.; Zhang, G.J. Microphysics parameterization for convective clouds in a global climate model: Description and single-column model tests. J. Geophys. Res. 2011, 116, D02201. [Google Scholar] [CrossRef]
  23. Morrison, H.; Gettelman, A. A new two-moment bulk stratiform cloud microphysics scheme in the Community Atmosphere Model, Version 3 (CAM3). Part I: Description and numerical tests. J. Clim. 2008, 21, 3642–3659. [Google Scholar] [CrossRef]
  24. Madronich, S. Photodissociation in the atmosphere: 1. Actinic flux and the effect of ground reflections and clouds. J. Geophys. Res. 1987, 92, 9740–9752. [Google Scholar] [CrossRef]
  25. Tie, X.; Madronich, S.; Walters, S.; Zhang, R.; Racsh, P.; Collins, W. Effect of clouds on photolysis and oxidants in the troposphere. J. Geophys. Res. 2003. [Google Scholar] [CrossRef]
  26. Abdul-Razzak, H.; Ghan, S.J. A parameterization of aerosol activation 3, Sectional representation. J. Geophys. Res. 2002, 107, D34026. [Google Scholar] [CrossRef]
  27. Liu, X.H.; Penner, J.E.; Das, B.; Bergmann, D.; Rodriguez, J.M.; Strahan, S.; Wang, M.; Feng, Y. Uncertainties in global aerosol simulations: Assessment using three meteorological datasets. J. Geophys. Res. 2007, 112, D11212. [Google Scholar] [CrossRef]
  28. Bigg, E.K. The formation of atmospheric ice crystals by the freezing of droplets. Q. J. R. Meteorol. Soc. 1953, 79, 510–519. [Google Scholar] [CrossRef]
  29. Young, K.C. The role of contact nucleation in ice phase initiation. J. Atmos. Sci. 1974, 31, 768–776. [Google Scholar] [CrossRef]
  30. Zaveri, R.A.; Peters, L.K. A new lumped structure photochemical mechanism for large-scale applications. J. Geophys. Res. 1999, 104, 30387–30415. [Google Scholar] [CrossRef]
  31. Barth, M.C.; Rasch, P.J.; Kiehl, J.T.; Benkovitz, C.M.; Schwartz, S.E. Sulfur chemistry in the National Center for Atmospheric Research Community Climate Model: Description, evaluation, features, and sensitivity to aqueous chemistry. J. Geophys. Res. 2000, 105, 1387–1415. [Google Scholar] [CrossRef]
  32. Binkowski, F.S.; Roselle, S.J. Models-3 Community Multiscale Air Quality (CMAQ) model aerosol component, 1, Model description. J. Geophys. Res. 2003. [Google Scholar] [CrossRef]
  33. Zhang, Q.; Streets, D.G.; Carmichael, G.R.; He, K.B.; Huo, H.; Kannari, A.; Klimont, Z.; Park, I.S.; Reddy, S.; Fu, J.S.; et al. Asian emissions in 2006 for the NASA INTEX-B mission. Atmos. Chem. Phys. 2009, 9, 5131–5153. [Google Scholar] [CrossRef]
  34. Guenther, A.; Karl, T.; Harley, P.; Wiedinmyer, C.; Palmer, P.I.; Geron, C. Estimates of global terrestrial isoprene emissions using MEGAN (Model of Emissions of Gases and Aerosols from Nature). Atmos. Chem. Phys. 2006, 6, 3181–3210. [Google Scholar] [CrossRef]
  35. Zender, C.S.; Bian, H.; Newman, D. Mineral dust entrainment and deposition (DEAD) model: Description and 1990s dust climatology. J. Geophys. Res. 2003, 108, D144416. [Google Scholar] [CrossRef]
  36. Wang, K.; Zhang, Y.; Nenes, A.; Fountoukis, C. Implementation of dust emission and chemistry into the Community Multiscale Air Quality modeling system and initial application to an Asia dust storm episode. Atmos. Chem. Phys. 2012, 12, 10209–10237. [Google Scholar] [CrossRef]
  37. Gong, S.L.; Barrie, L.A.; Lazare, M. Canadian Aerosol Module (CAM): A size-segregated simulation of atmospheric aerosol processes for climate and air quality models: 2. Global sea-salt aerosol and its budgets. J. Geophys. Res. 2002, 107, D244779. [Google Scholar] [CrossRef]
  38. Duan, F.; He, K.; Ma, Y.; Yang, F.; Yu, X.; Cadle, S.; Chan, T.; Mulawa, P.A. Concentration and chemical characteristic of PM2.5 in Beijing, China: 2001–2002. Sci. Total Environ. 2006, 335, 264–275. [Google Scholar] [CrossRef] [PubMed]
  39. Environmental Protection Department (EPD). Hong Kong. The 2006 Hong Kong Air Quality Status Report, EPD/TR 01/07; Environmental Protection Department: Hong Kong, China, 2006. [Google Scholar]
  40. Bennartz, R. Global assessment of marine boundary layer cloud droplet number concentration from satellite. J. Geophys. Res. 2007, 112, D02201. [Google Scholar]
  41. Seethala, C.; Horváth, Á. Global assessment of AMSR-E and MODIS cloud liquid water path retrievals in warm oceanic clouds. J. Geophys. Res. 2010, 115, D13202. [Google Scholar] [CrossRef]
  42. Zhang, Y.; Chen, Y.-C.; Sarwar, G.; Schere, K. Impact of gas-phase mechanisms on Weather Research Forecasting Model with Chemistry (WRF/Chem) predictions: Mechanism implementation and comparative evaluation. J. Geophys. Res. 2012, 117. [Google Scholar] [CrossRef]
  43. Ma, L.-J.; Zhang, T.-J.; Li, Q.-X.; Frauenfeld, O.W.; Qin, D. Evaluation of ERA-40, NCEP-1, and NCEP-2 reanalysis air temperatures with ground-based measurements in China. J. Geophys. Res. 2008, 113, D15115. [Google Scholar] [CrossRef]
  44. Zhang, Y.; Chen, S.-H.; Chen, Y.-S.; Wang, W.-X. Application of MM5 in China: Model evaluation, seasonal variations, and sensitivity to horizontal grid resolutions. Atmos. Environ. 2011, 45, 3454–3465. [Google Scholar] [CrossRef]
  45. Cai, C.-J.; Zhang, X.; Wang, K.; Zhang, Y.; Wang, L.-T.; Zhang, Q.; Duan, F.-K.; He, K.-B. Incorporation of new particle formation and early growth treatments into WRF/Chem and its application over East Asia: Model improvement, evaluation, and the nucleation-aerosol-cloud-meteorology interactions. Atmos. Environ. 2015. [Google Scholar] [CrossRef]
  46. Jiang, F.; Liu, Q.; Huang, X.X.; Wang, T.J.; Zhuang, B.L.; Xie, M. Regional modeling of secondary organic aerosol over China using WRF/Chem. J. Aerosol. Sci. 2012, 43, 57–73. [Google Scholar] [CrossRef]
  47. Liao, J.B.; Wang, T.J.; Wang, X.M.; Xie, M.; Jiang, Z.Q.; Huang, X.X.; Zhu, J.L. Impacts of different urban canopy schemes in WRF/Chem on regional climate and air quality in Yangtze River Delta. China Atmos. Res. 2014, 145, 226–243. [Google Scholar] [CrossRef]
  48. Brunner, D.; Savage, N.; Jorba, O.; Ederd, B.; Giordanoa, L.; Badiac, A.; Balzarinie, A.; Baróf, R.; Bianconig, R.; Chemel, C.; et al. Evaluation of the meteorological performance of coupled chemistry-meteorology models in the context of AQMEII phase 2. Atmos. Environ. 2014. [Google Scholar] [CrossRef]
  49. Emery, C.; Tai, E.; Yarwood, G. Enhanced Meteorological Modeling and Performance Evaluation for Two Texas Ozone Episodes, Final Report, The Texas Natural Resource Conservation Commission, 12118 Park 35 Circle Austin, Texas 78753. Available online: http://www.tceq.state.tx.us/assets/public/implementation/air/am/contracts/reports/mm/EnhancedMetModelingAndPerformanceEvaluation.pdf (accessed on 28 May 2014).
  50. Wang, K.; Zhang, Y.; Jang, C.J.; Phillips, S.; Wang, B.-Y. Modeling study of intercontinental air pollution transport over the trans-pacific region in 2001 using the community multiscale air quality modeling system. J. Geophys. Res. 2009, 114, D04307. [Google Scholar]
  51. Zhang, Y.; Karamchandani, P.; Glotfelty, T.; Streets, D.G.; Grell, G.; Nenes, A.; Yu, F.-Q.; Bennartz, R. Development and initial application of the global-through-urban weather research and forecasting model with chemistry (GU-WRF/Chem). J. Geophys. Res. 2012, 117, D20206. [Google Scholar] [CrossRef]
  52. Zhang, Y.; Sartelet, K.; Wu, S.-Y.; Seigneur, C. Application of WRF/Chem-MADRID and WRF/Polyphemus in Europe, Part I: Model description and evaluation of meteorological predictions. Atmos. Chem. Phys. 2013, 13, 6807–6843. [Google Scholar] [CrossRef]
  53. Wang, L.T.; Zhang, Y.; Wang, K.; Zheng, B.; Zhang, Q. Application of online Weather Research Forecasting Model with Chemistry (WRF/Chem) over the north China: Sensitivity study, comparative evaluation and policy implications. Atmos. Environ. 2015. [Google Scholar] [CrossRef]
  54. Liu, X.-Y.; Zhang, Y.; Zhang, Q.; He, K.-B. Application of online-coupled WRF/Chem-MADRID in East Asia: Model evaluation and climatic effects of anthropogenic aerosols. Atmos. Environ. 2015. [Google Scholar] [CrossRef]
  55. Zhang, Y.; Zhang, X.; Wang, K.; He, J.; Leung, L.R.; Fan, J.-W.; Nenes, A. Incorporating an advanced aerosol activation parameterization into WRF-CAM5: Model evaluation and parameterization intercomparison. J. Geophys. Res. 2015. [Google Scholar] [CrossRef]
  56. Alapaty, K.; Herwehe, J.A.; Otte, T.L.; Nolte, C.G.; Bullock, O.R.; Mallard, M.S.; Kain, J.S.; Dudhia, J. Introducing subgrid-scale cloud feedbacks to radiation for regional meteorological and climate modeling. Geophys. Res. Lett. 2012, 39, L24809. [Google Scholar] [CrossRef]
  57. Gantt, B.; He, J.; Zhang, X.; Zhang, Y.; Nenes, A. Incorporation of advanced aerosol activation treatments into CESM/CAM5: Model evaluation and impacts on aerosol indirect forcing. Atmos. Chem. Phys. 2014, 14, 7485–7497. [Google Scholar] [CrossRef]
  58. Kim, S.; Yoon, S.; Kim, J.; Kim, S. Seasonal and monthly variations of columnar aerosol optical properties over East Asia determined from multi-year MODIS, LIDAR, and AERONET Sun/sky radiometer measurements. Atmos. Environ. 2007, 41, 1634–1651. [Google Scholar] [CrossRef]
  59. Gao, Y.; Zhao, C.; Liu, X.H.; Zhang, M.G.; Leung, L.R. WRF-Chem simulations of aerosols and anthropogenic aerosol radiative forcing in East Asia. Atmos. Environ. 2014, 92, 250–266. [Google Scholar] [CrossRef]
  60. Gong, S.L. A parameterization of sea-salt aerosol source function for sub- and super- micron particles. Glob. Biogeochem. Cycles 2003, 17. [Google Scholar] [CrossRef]
  61. Zhang, X.Y.; Gong, S.L.; Shen, Z.X.; Mei, F.M.; Xi, X.X.; Liu, L.C.; Zhou, Z.J.; Wang, D.; Wang, Y.Q.; Cheng, Y. Characterization of soil dust aerosol in China and its transport and distribution during 2001 ACE-Asia: 1. Network observations. J. Geophys. Res. 2003, 108. [Google Scholar] [CrossRef]
  62. Liu, X.-H.; Zhang, Y.; Xing, J.; Zhang, Q.; Wang, K.; Streets, D.G.; Jang, C.J.; Wang, W.-X.; Hao, J.-M. Understanding of Regional Air Pollution over China using CMAQ: Part II. Process Analysis and Ozone Sensitivity to Precursor Emissions. Atmos. Environ. 2010, 44, 3719–3727. [Google Scholar] [CrossRef]
  63. Streets, D.G.; Yarber, K.F.; Woo, J.-H.; Carmichael, G.R. Biomass burning in Asia: Annual and seasonal estimates and atmospheric emissions. Glob. Biogeochem. Cycles 2003, 17, 1099. [Google Scholar] [CrossRef]
  64. Lee, C.; Martin, R.V.; van Donkelaar, A.; O’Byrne, G.; Krotkov, N.; Richter, A.; Huey, L.G.; Holloway, J.S. Retrieval of vertical columns of sulfur dioxide from SCIAMACHY and OMI: Air mass factor algorithm development, validation, and error analysis. J. Geophys. Res. 2009, 114, D22303. [Google Scholar] [CrossRef]
  65. De Smedt, I.; Müller, J.-F.; Stavrakou, T.; van der, R.J.; Eskes, A.H.J.; van Roozendael, M. Twelve years of global observations of formaldehyde in the troposphere using GOME and SCIAMACHY sensors. Atmos. Chem. Phys. 2008, 8, 4947–4963. [Google Scholar] [CrossRef]
  66. Shi, Y.; Xia, Y.; Lu, B.; Liu, N.; Zhang, L.; Li, S.; Li, W. Emission inventory and trends of NOx for China, 2000–2020. J. Zhejiang Univ. Sci. A (Appl. Phys. Eng.) 2014, 15, 454–464. [Google Scholar] [CrossRef]
  67. Wang, Y.; Zhang, Q.Q.; He, K.; Zhang, Q.; Chai, L. Sulfate-nitrate-ammonium aerosols over China: Response to 2000–2015 emission changes of sulfur dioxide, nitrogen oxides, and ammonia. Atmos. Chem. Phys. 2013, 13, 2635–2652. [Google Scholar] [CrossRef]
  68. Zhang, Y.; Easter, R.C.; Ghan, S.J.; Abdul-Razzak, H. Impact of aerosol size representation on modeling aerosol-cloud interactions. J. Geophys. Res. 2002. [Google Scholar] [CrossRef]

