Variabilities in Rainfall Onset, Cessation and Length of Rainy Season for the Various Agro-Ecological Zones of Ghana

 ,
,
Abstract
:1. Introduction
2. Study Area and Data Source
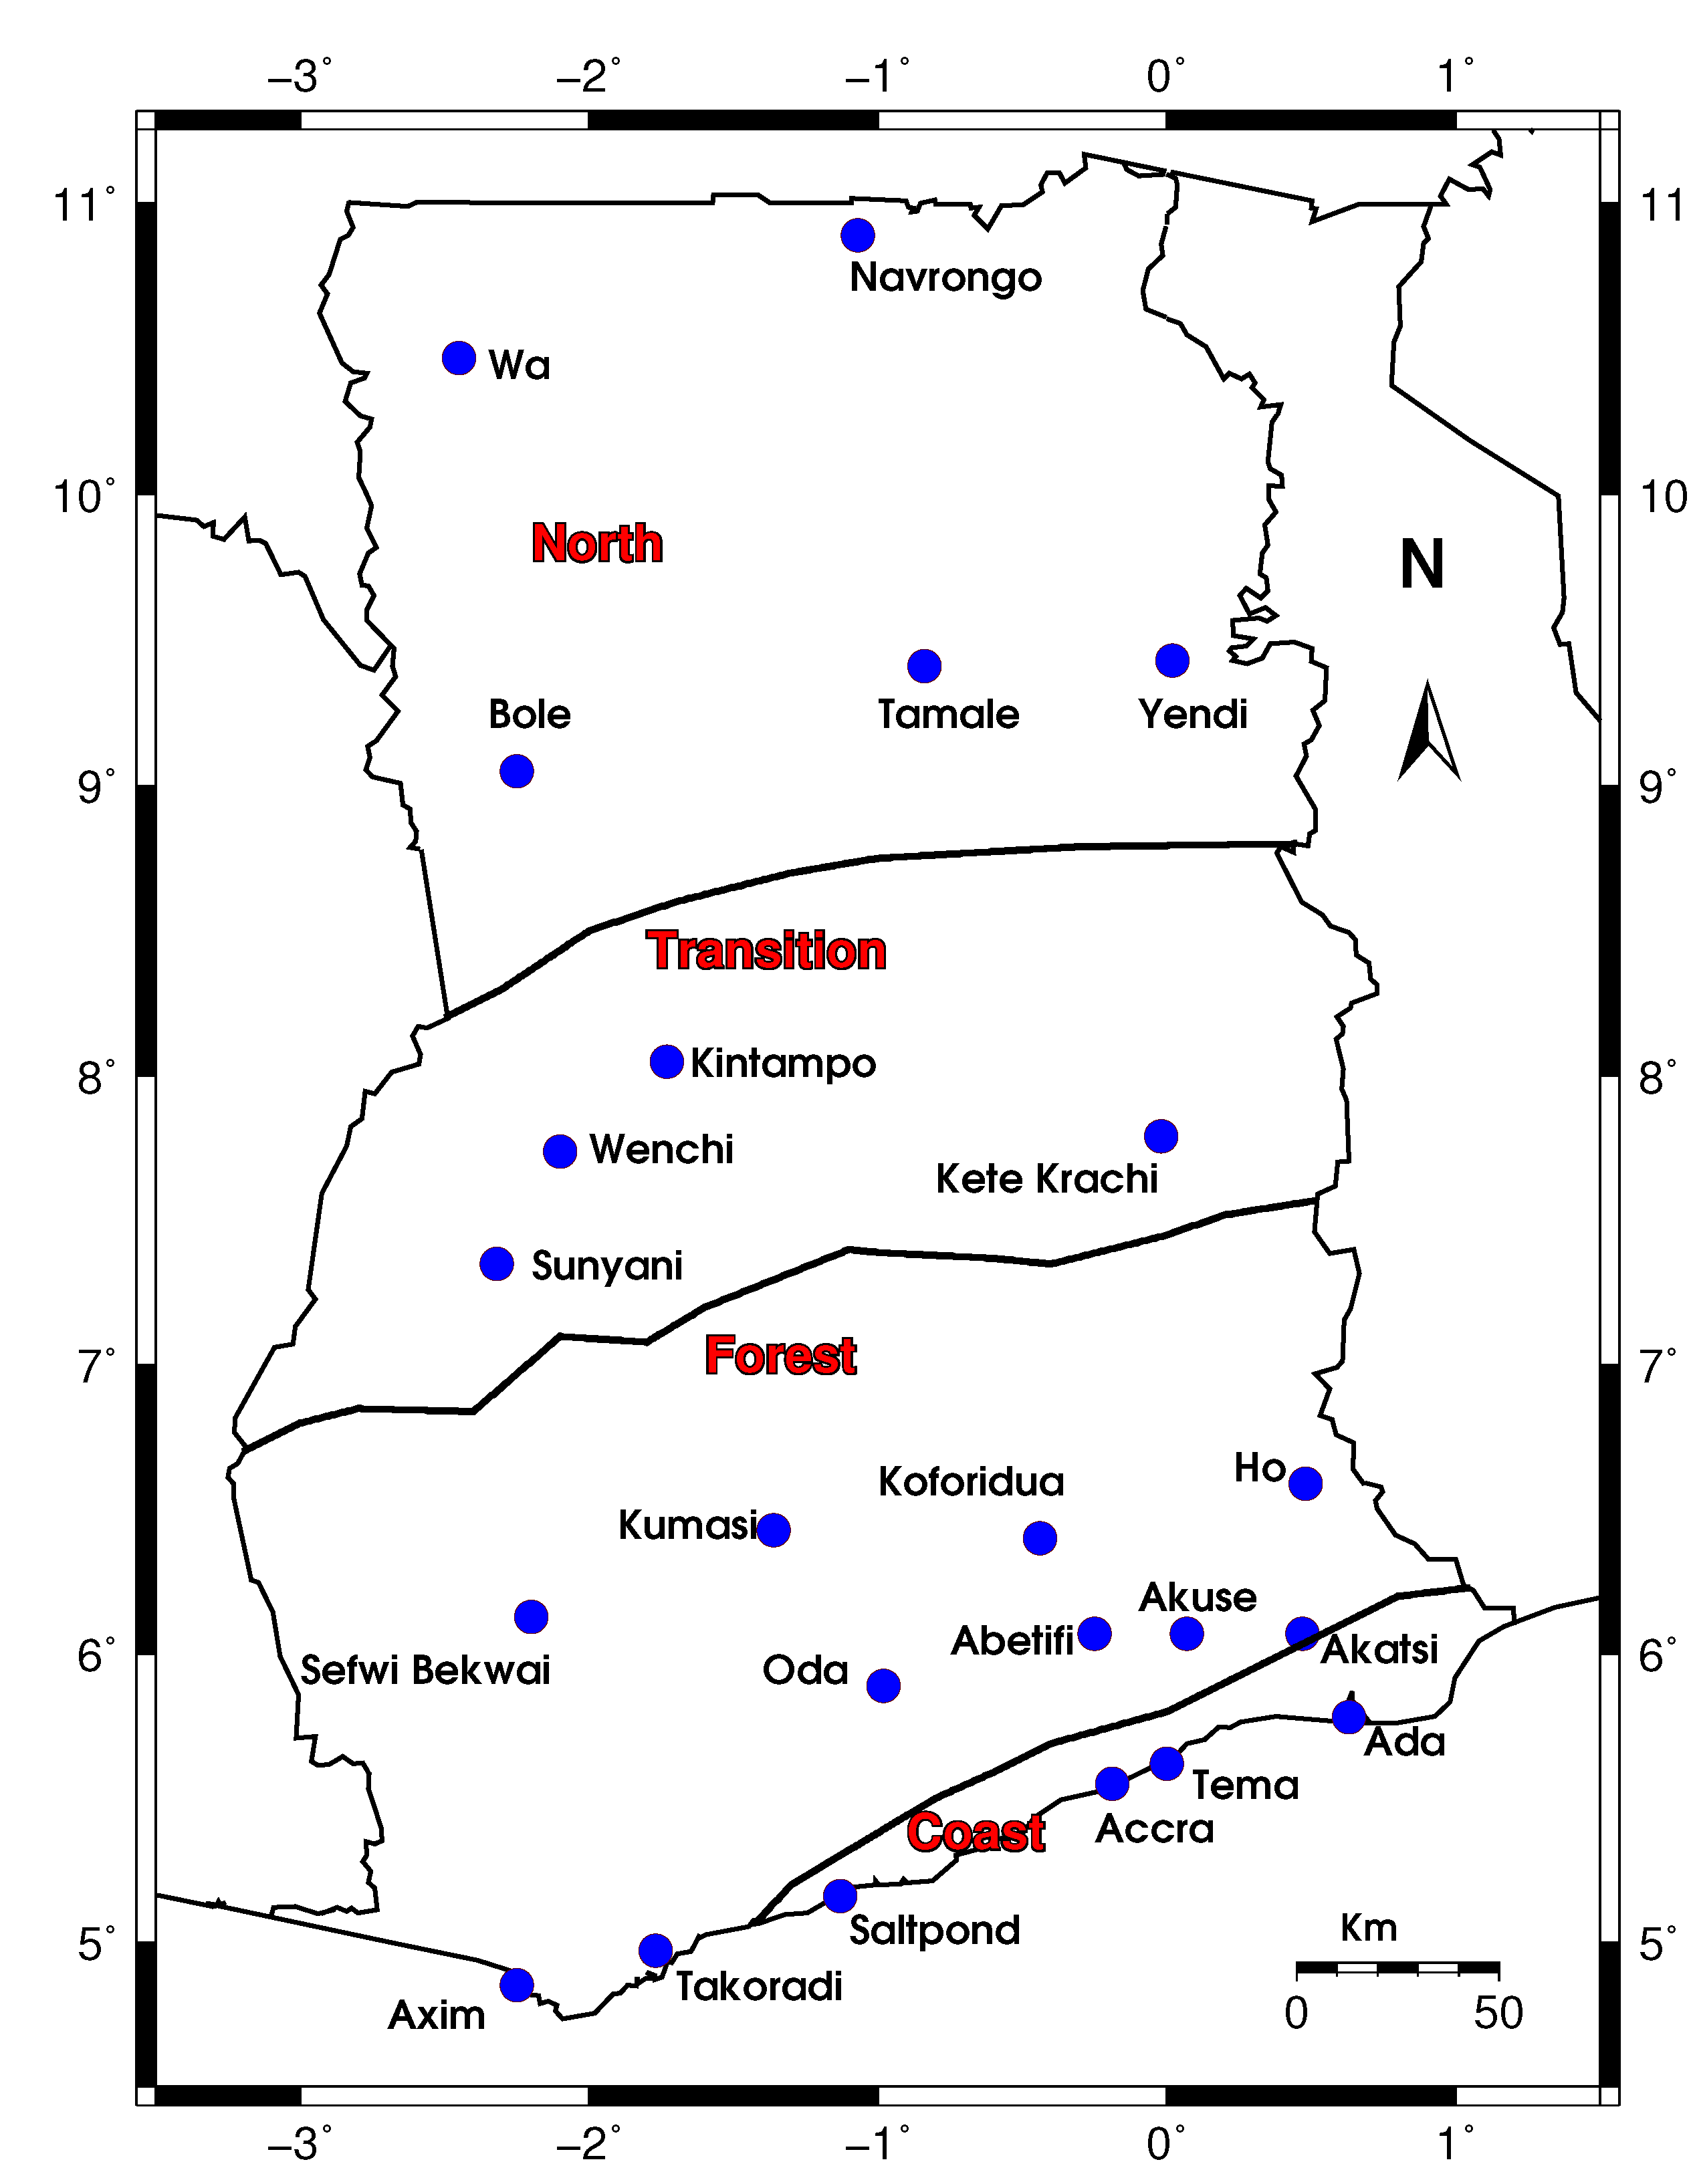
2.1. The Study Area
2.2. Data Source
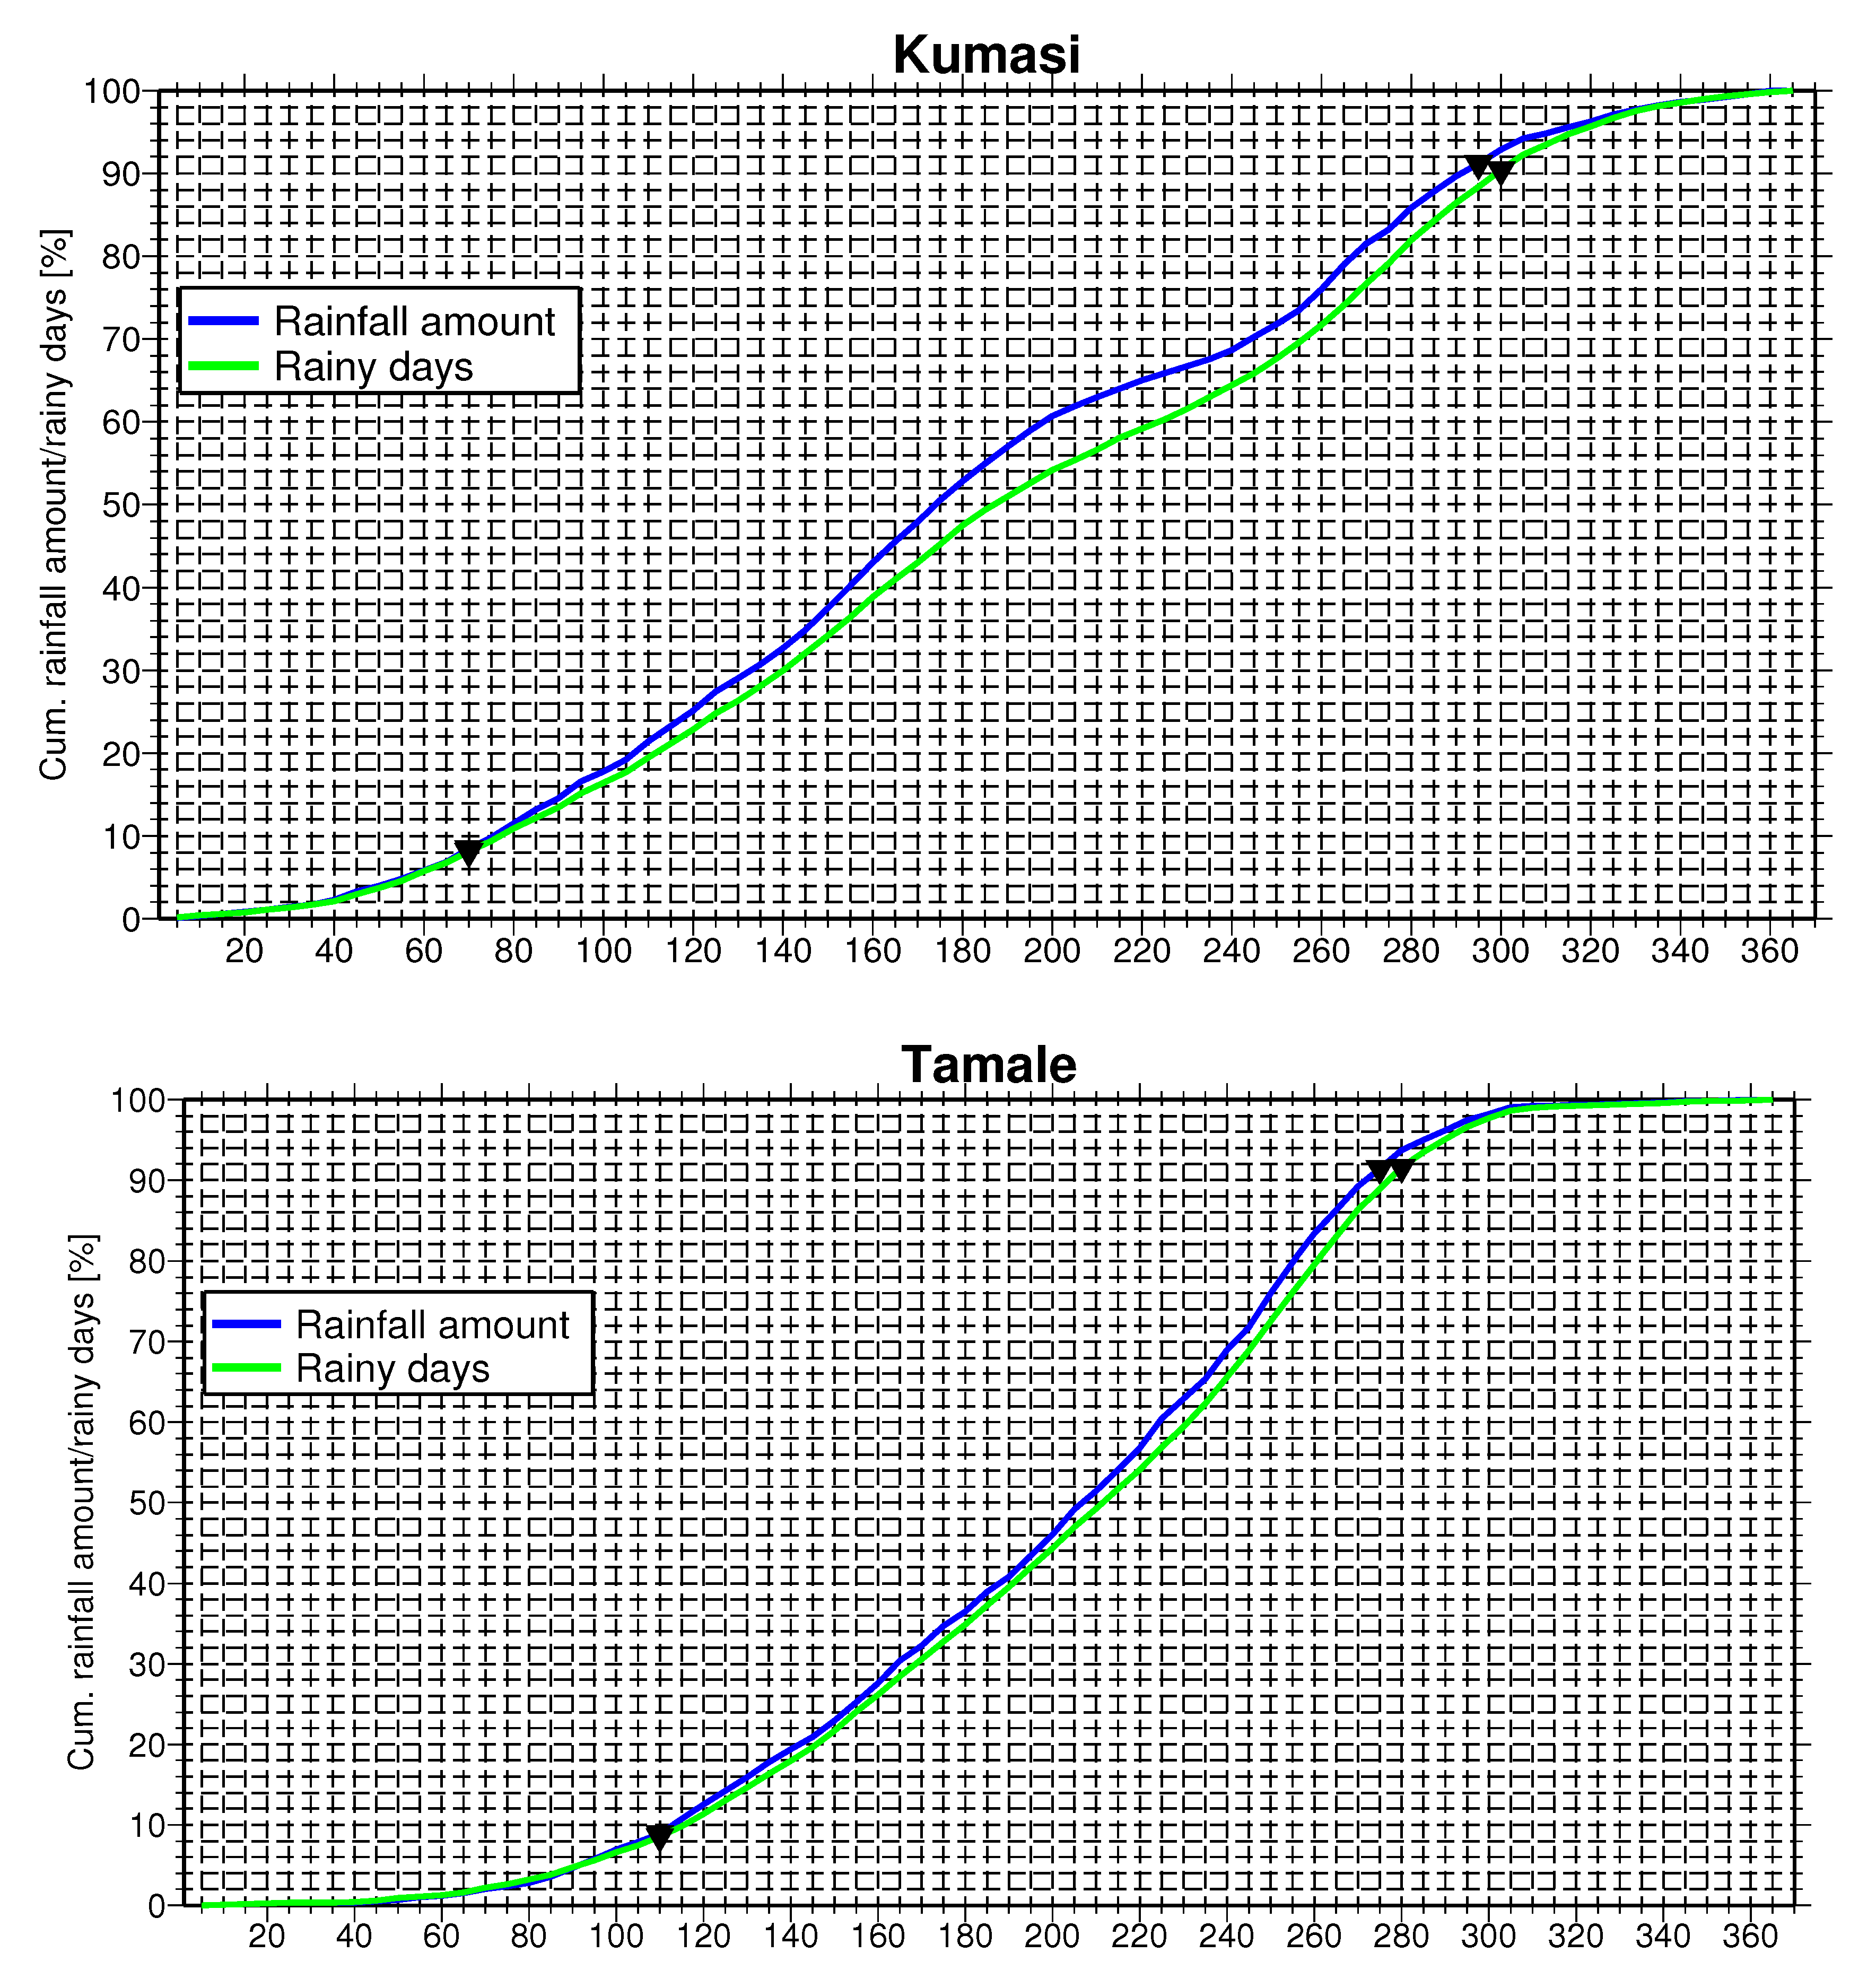
3. Methodology
4. Results and Discussion
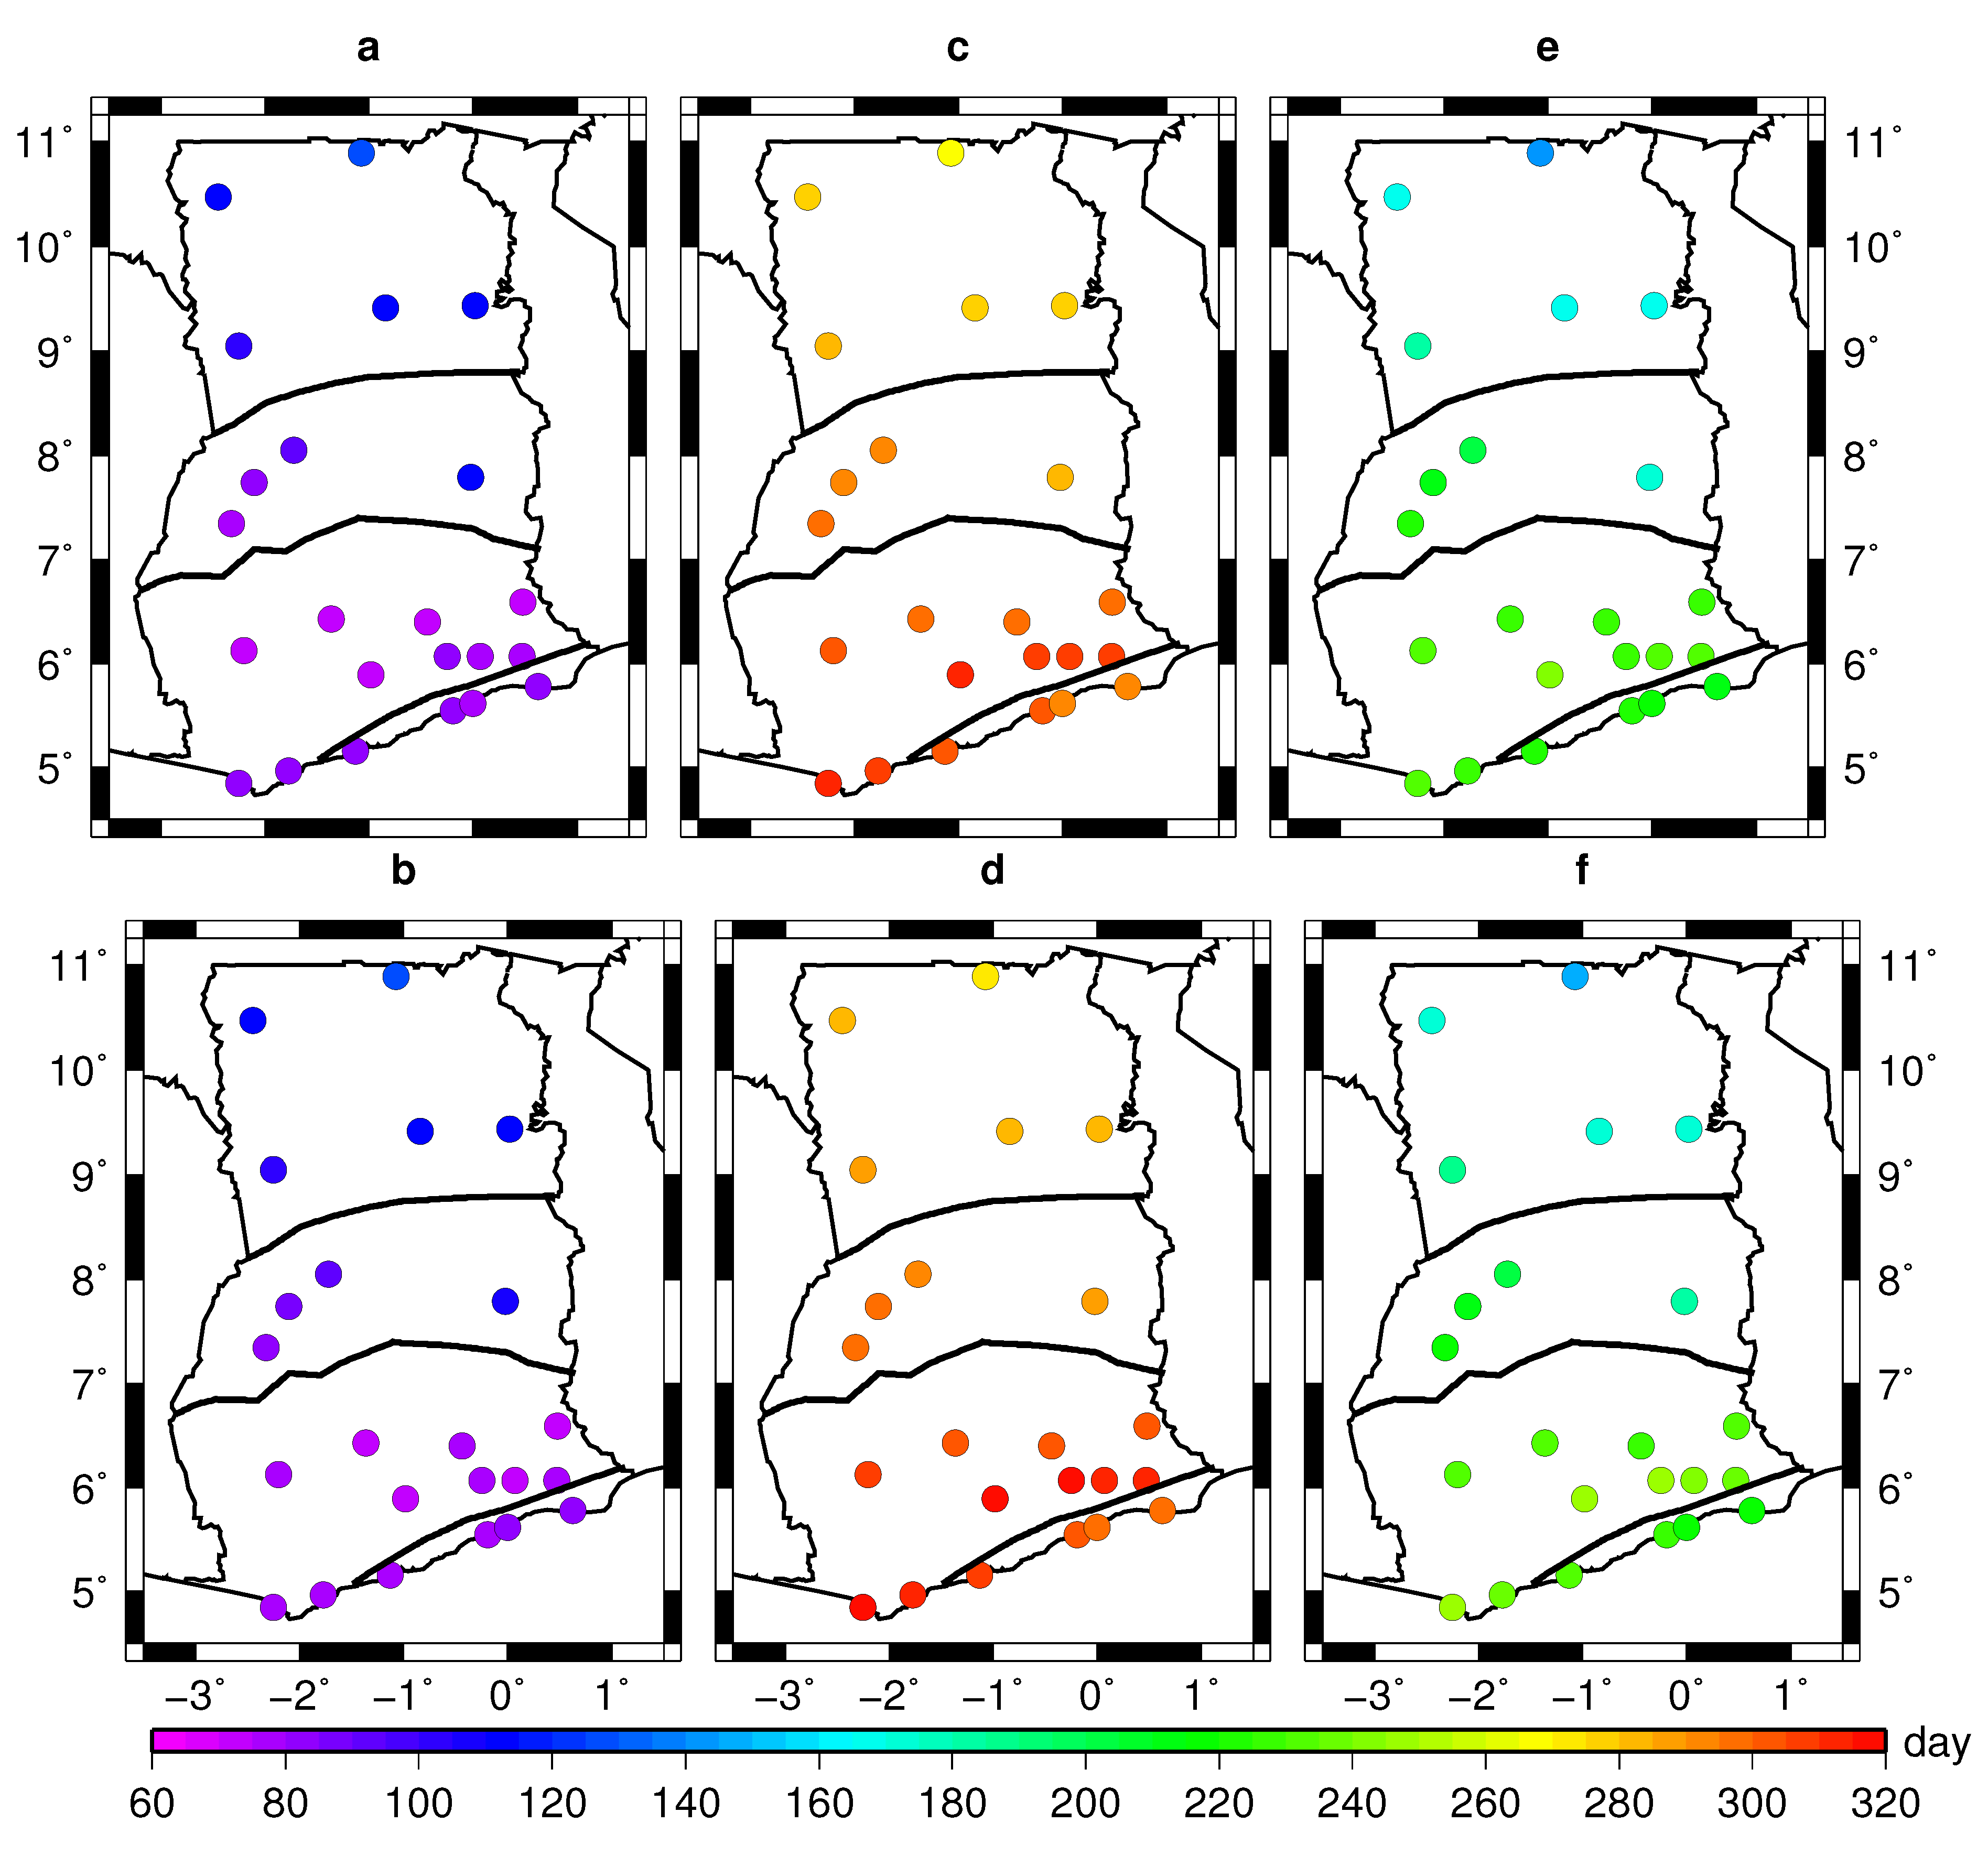
4.1. Onset, Cessation and Length of Rainy Season Climatology


| Station | Onset (Rainy Days) Days | Date | Onset (Rainfall Amount) Days | Date |
|---|---|---|---|---|
| Sunyani | 80 ± 5 | 21 March | 75 ± 5 | 16 March |
| Abetifi | 75 ± 5 | 16 March | 70 ± 5 | 11 March |
| Akuse | 70 ± 5 | 11 March | 75 ± 5 | 21 March |
| Axim | 75 ± 7 | 16 March | 80 ± 7 | 21 March |
| Ho | 70 ± 5 | 11 March | 70 ± 5 | 11 March |
| Koforidua | 75 ± 5 | 16 March | 80 ± 5 | 21 March |
| Kumasi | 70 ± 5 | 11 March | 70 ± 5 | 11 March |
| Akim-Oda | 70 ± 5 | 11 March | 70 ± 5 | 11 March |
| Sefwi Bekwai | 75 ± 5 | 16 March | 70 ± 5 | 11 March |
| Takoradi | 75 ± 7 | 16 March | 80 ± 7 | 21 March |
| Accra | 75 ± 7 | 16 March | 80 ± 7 | 21 March |
| Ada | 80 ± 7 | 21 March | 80 ± 7 | 21 March |
| Salt pond | 75 ± 7 | 16 March | 80 ± 7 | 21 March |
| Akatsi | 75 ± 5 | 16 March | 75 ± 5 | 16 March |
| Bole | 100 ± 5 | 10 April | 100 ± 5 | 10 April |
| Kete-Krachi | 105 ± 5 | 15 April | 110 ± 5 | 20 April |
| Navrongo | 125 ± 5 | 5 May | 125 ± 5 | 5 May |
| Wa | 110 ± 5 | 20 April | 110 ± 5 | 20 April |
| Wenchi | 85 ± 5 | 26 March | 80 ± 5 | 21 March |
| Yendi | 110 ± 5 | 20 April | 110 ± 5 | 20 April |
| Kintampo | 90 ± 5 | 31 March | 90 ± 5 | 31 March |
| Tema | 80 ± 7 | 21 March | 75 ± 7 | 16 March |
| Tamale | 110 ± 5 | 20 April | 110 ± 5 | 20 April |
| Station | Cessation (Rainy Days) Days | Date | Length | Cessation (Rainfall Amount) Day | Date | Length |
|---|---|---|---|---|---|---|
| Sunyani | 295 ± 5 | 22 October | 215 | 295 ± 5 | 22 October | 220 |
| Abetifi | 300 ± 5 | 27 October | 225 | 295 ± 5 | 22 October | 225 |
| Akuse | 310 ± 5 | 6 November | 240 | 305 ± 5 | 1 November | 230 |
| Axim | 320 ± 7 | 16 November | 245 | 310 ± 7 | 6 November | 230 |
| Ho | 300 ± 5 | 27 October | 230 | 295 ± 5 | 22 October | 225 |
| Koforidua | 320 ± 5 | 16 November | 245 | 305 ± 5 | 1 November | 225 |
| Kumasi | 300 ± 5 | 27 October | 230 | 295 ± 5 | 22 October | 225 |
| Akim-Oda | 315 ± 5 | 11 November | 245 | 310 ± 5 | 6 November | 240 |
| Sefwi Bekwai | 305 ± 5 | 1 November | 230 | 300 ± 5 | 27 October | 230 |
| Takoradi | 310 ± 7 | 6 November | 235 | 305 ± 7 | 1 November | 225 |
| Accra | 300 ± 7 | 27 October | 225 | 300 ± 7 | 27 October | 220 |
| Ada | 295 ± 7 | 22 October | 215 | 290 ± 7 | 17 October | 210 |
| Salt pond | 305 ± 7 | 1 November | 230 | 300 ± 7 | 27 October | 220 |
| Akatsi | 310 ± 5 | 6 November | 235 | 305 ± 5 | 1 November | 230 |
| Bole | 285 ± 5 | 12 October | 185 | 280 ± 5 | 7 October | 180 |
| Kete-Krachi | 285 ± 5 | 12 October | 180 | 280 ± 5 | 7 October | 170 |
| Navrongo | 270 ± 5 | 27 September | 145 | 265 ± 5 | 22 September | 140 |
| Wa | 280 ± 5 | 7 October | 170 | 275 ± 5 | 2 October | 165 |
| Wenchi | 295 ± 5 | 22 October | 210 | 290 ± 5 | 17 October | 210 |
| Yendi | 280 ± 5 | 7 October | 170 | 275 ± 5 | 2 October | 165 |
| Kintampo | 290 ± 5 | 17 October | 200 | 290 ± 5 | 17 October | 200 |
| Tema | 295 ± 7 | 22 October | 215 | 290 ± 7 | 17 October | 215 |
| Tamale | 280 ± 5 | 7 October | 170 | 275 ± 5 | 2 October | 165 |
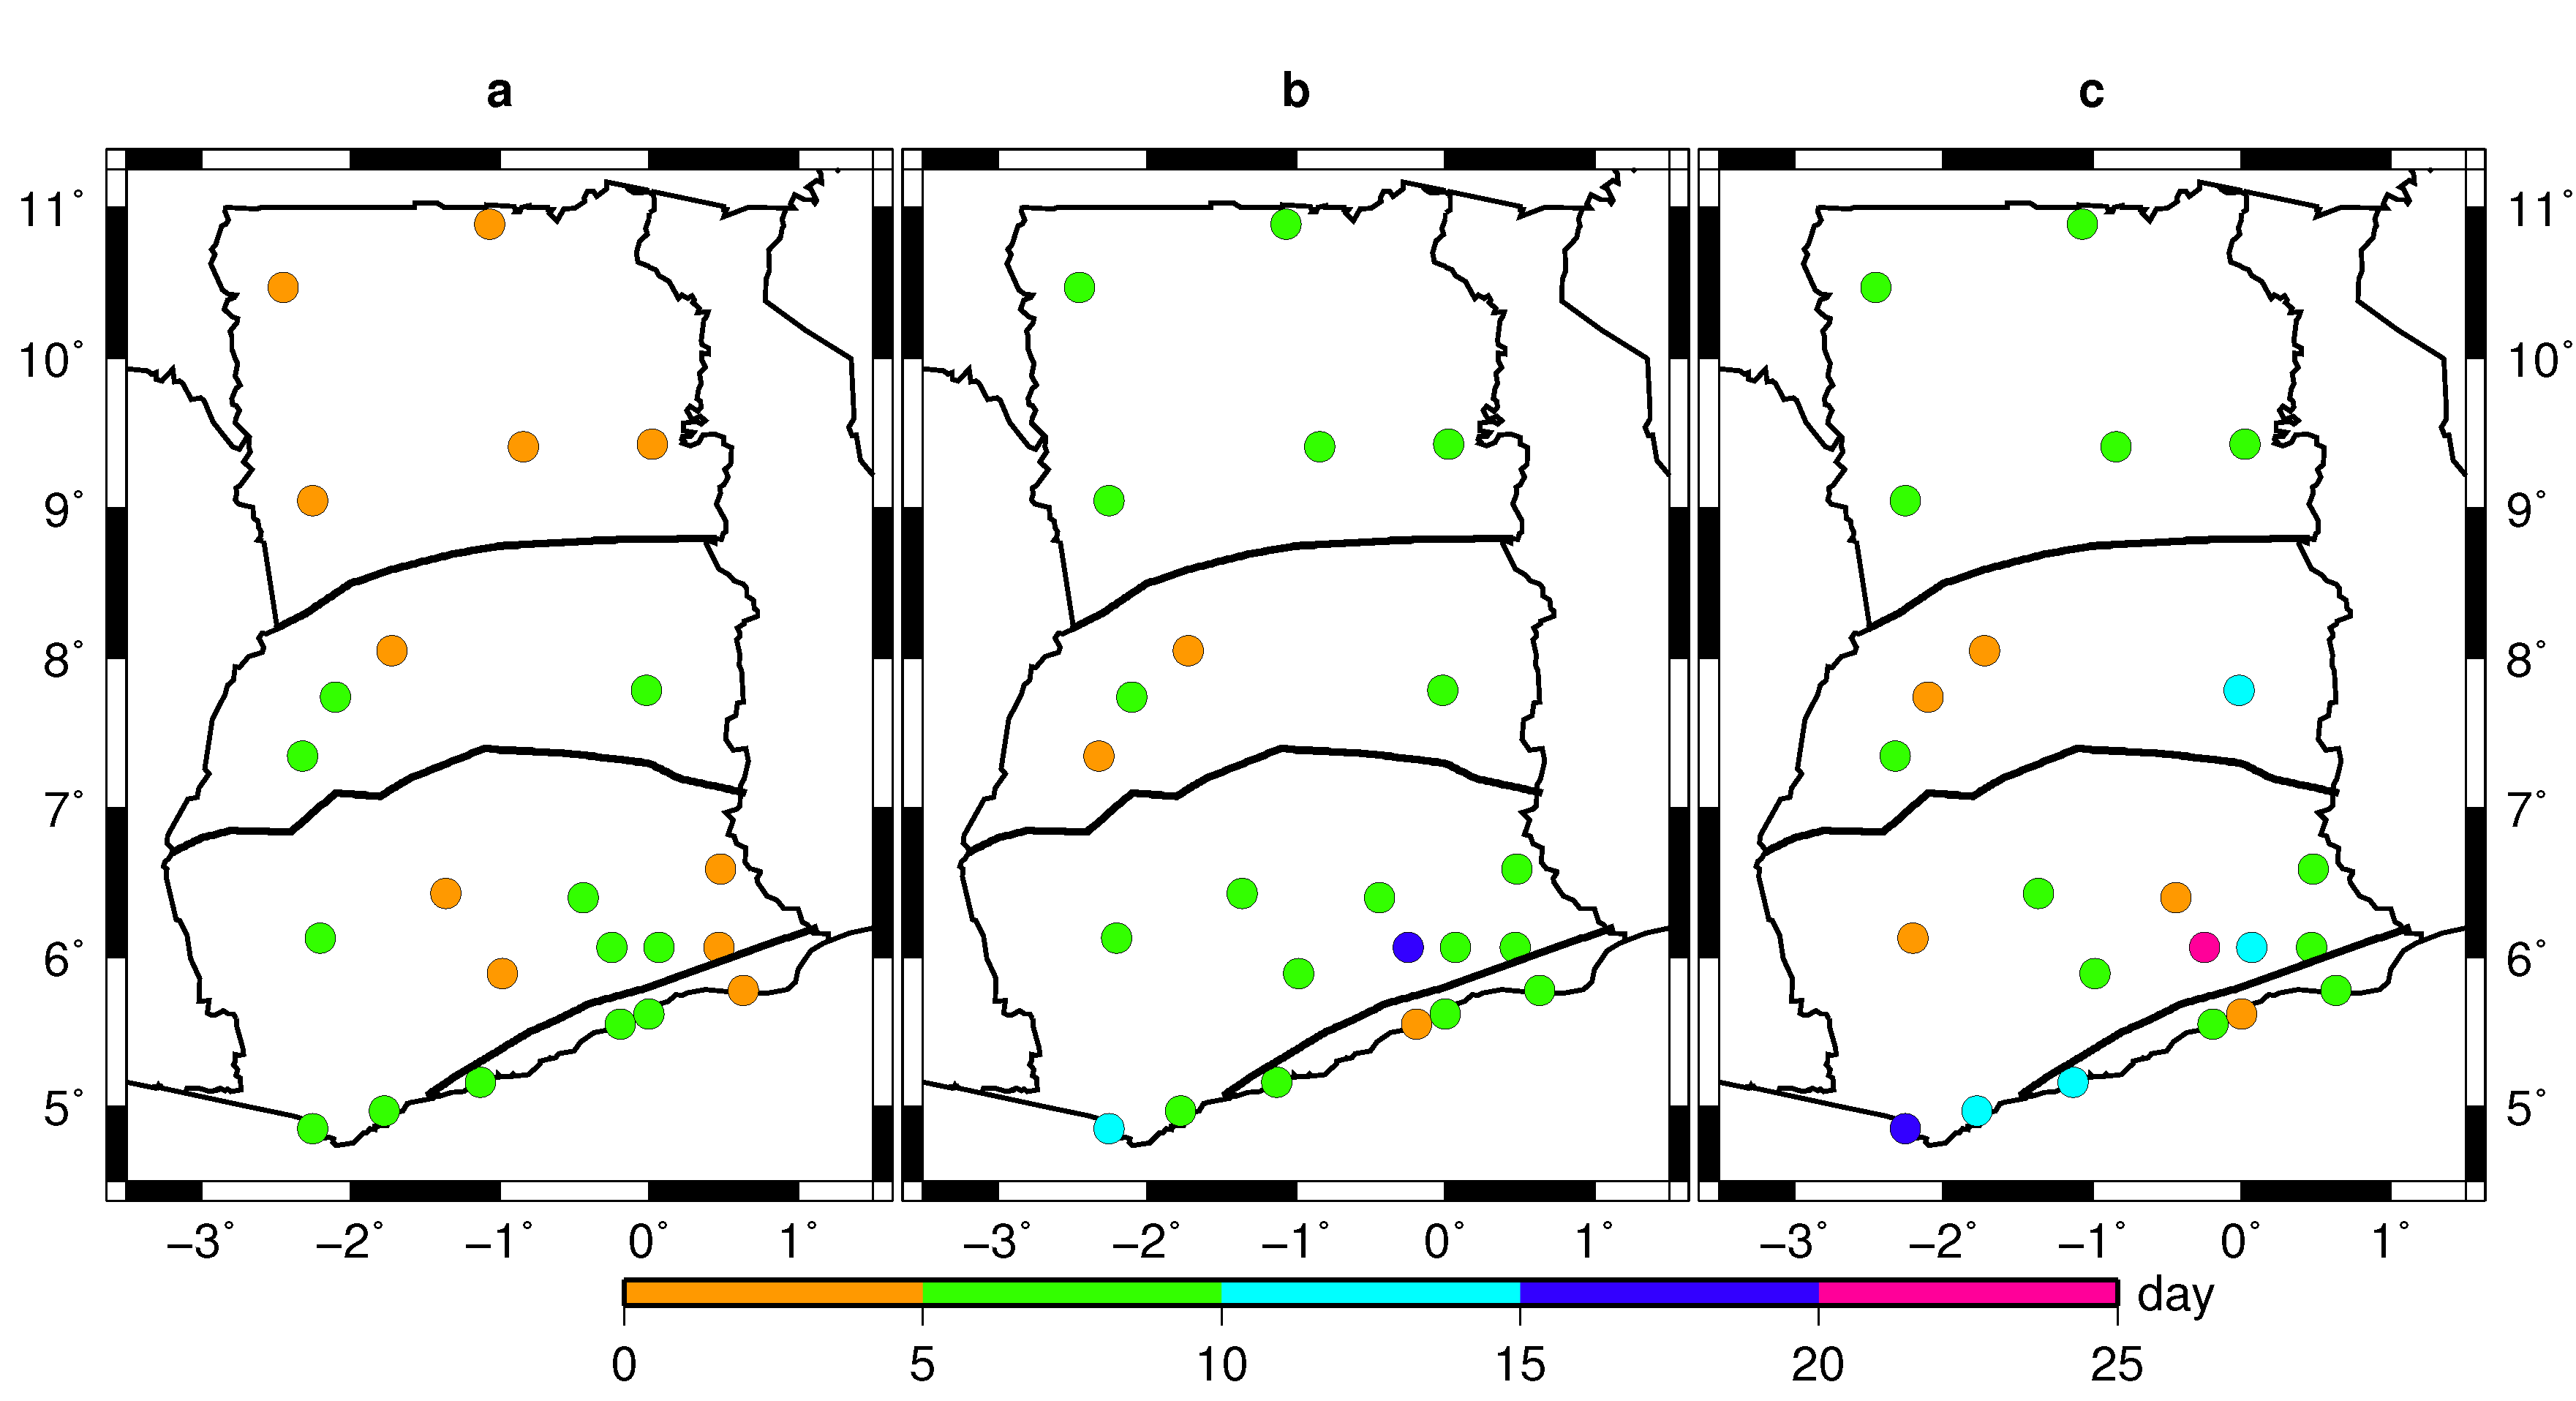
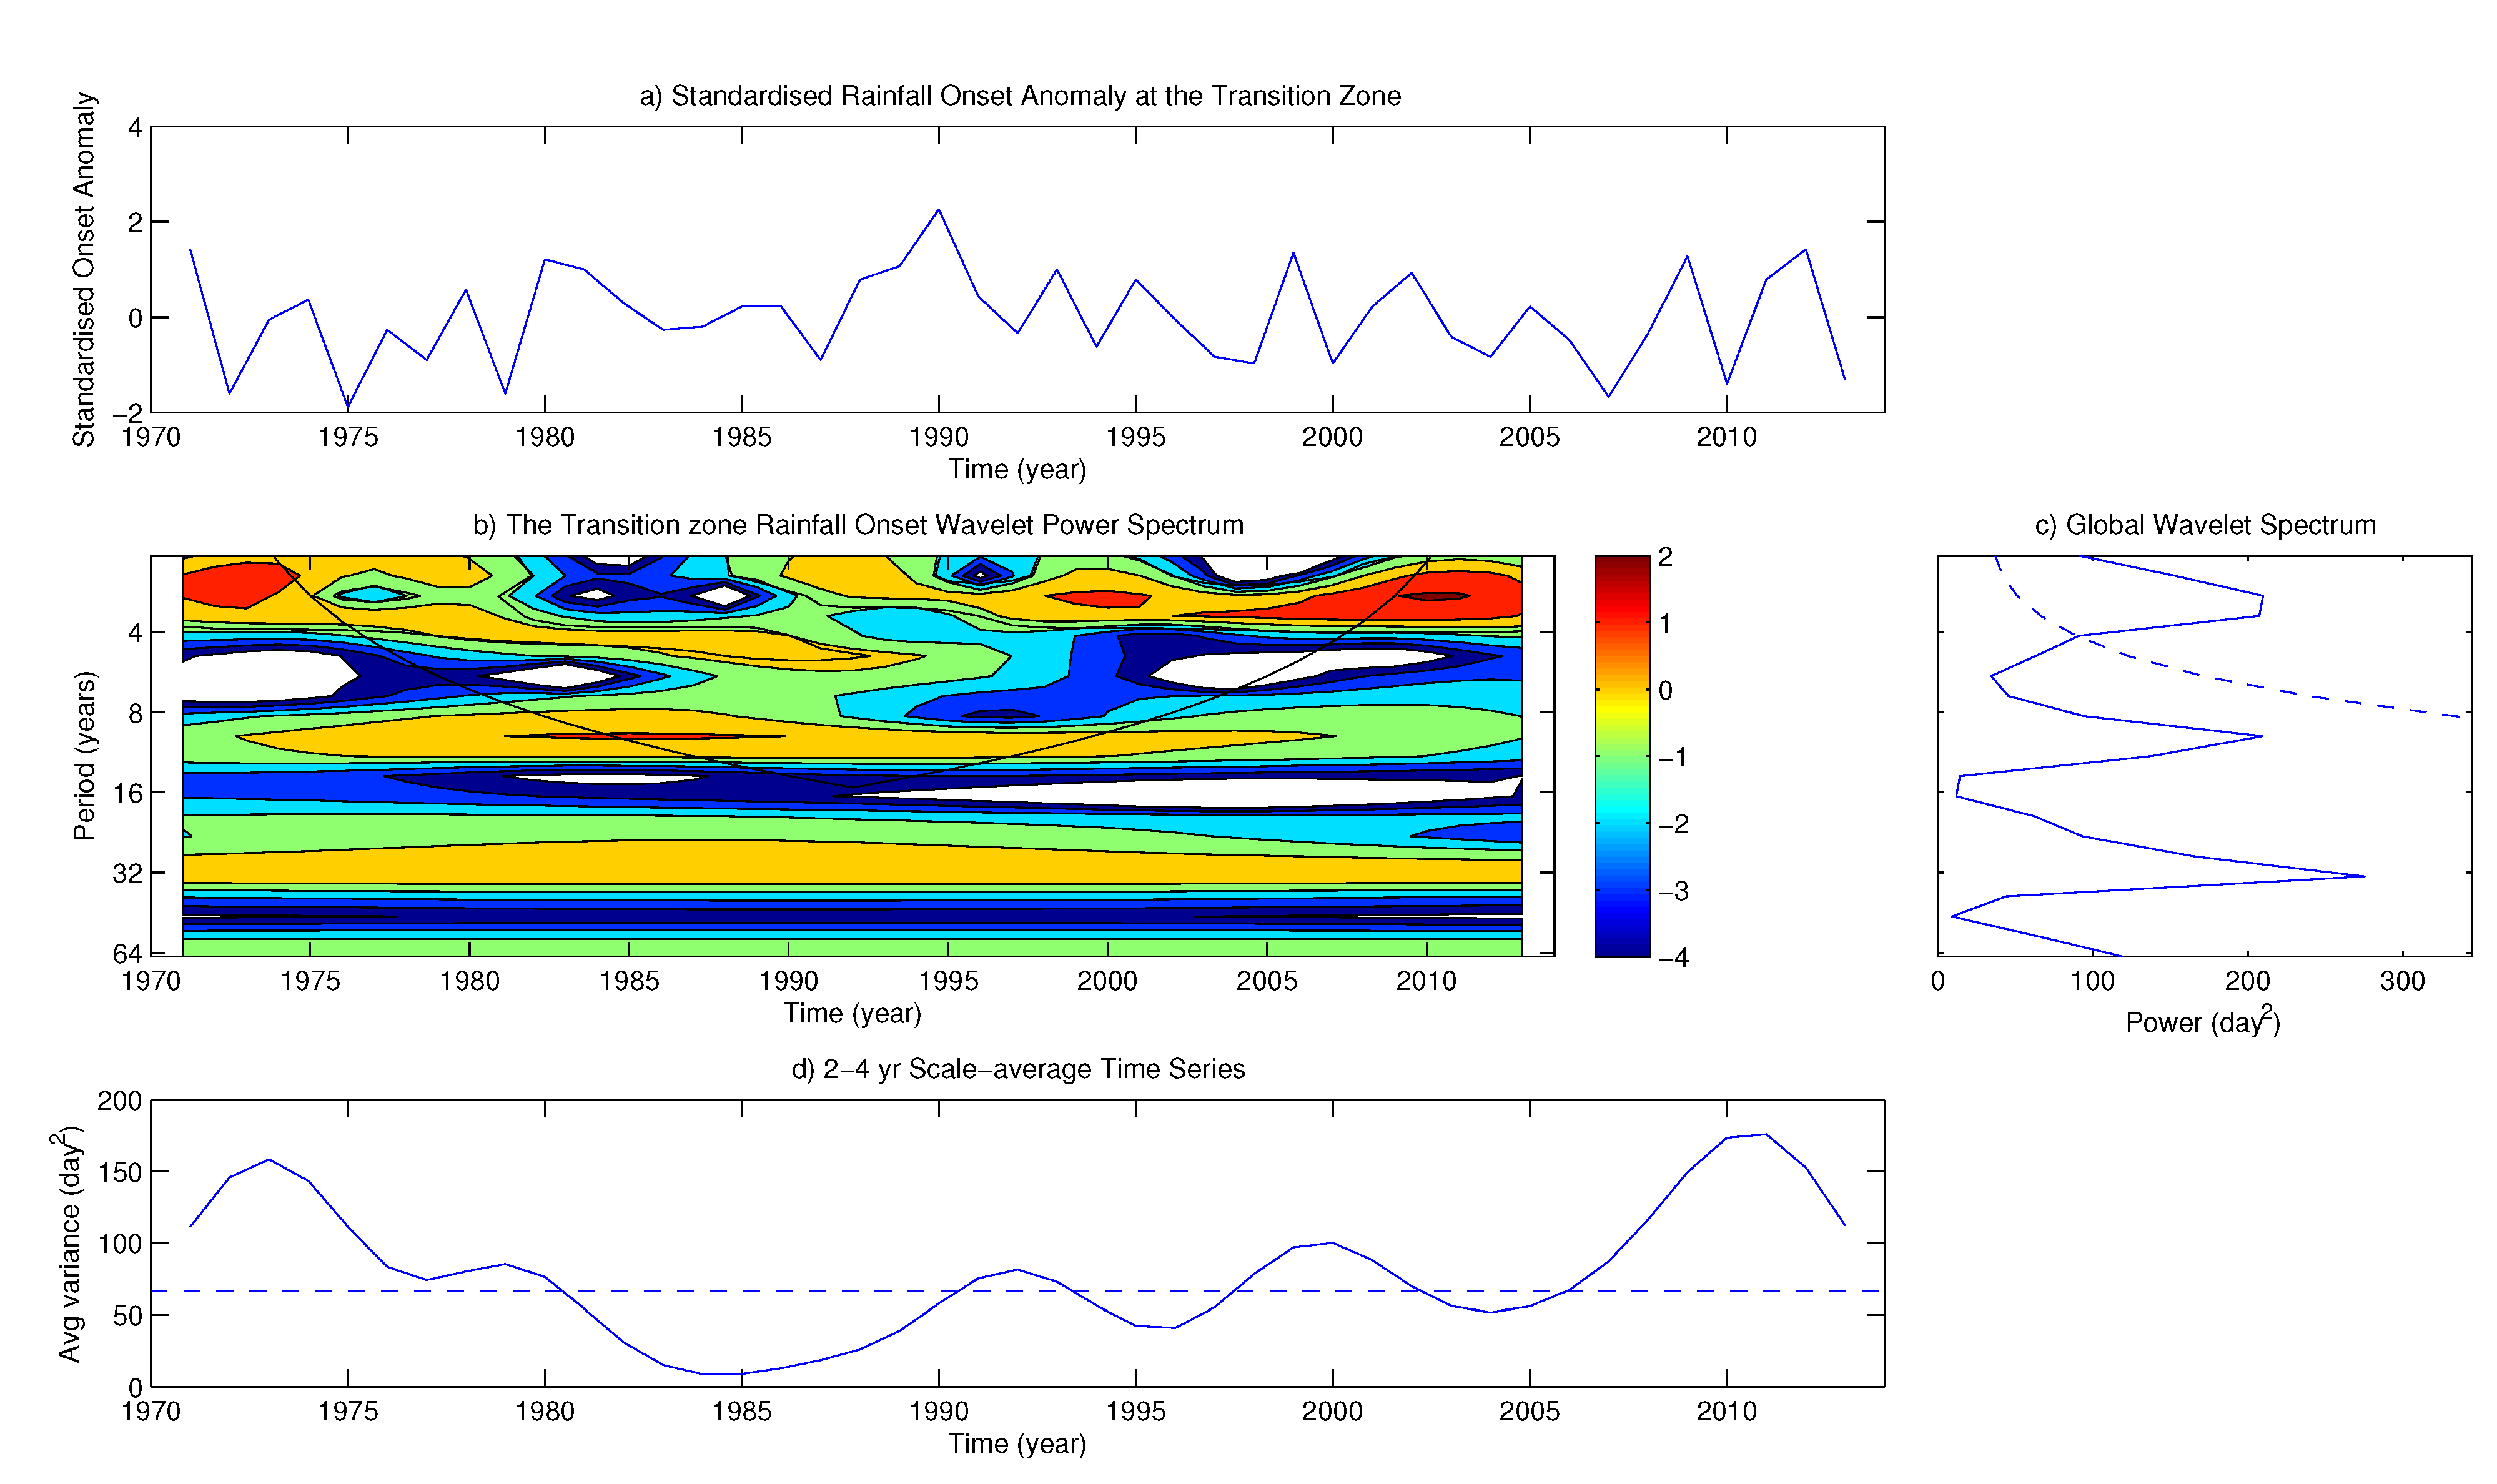
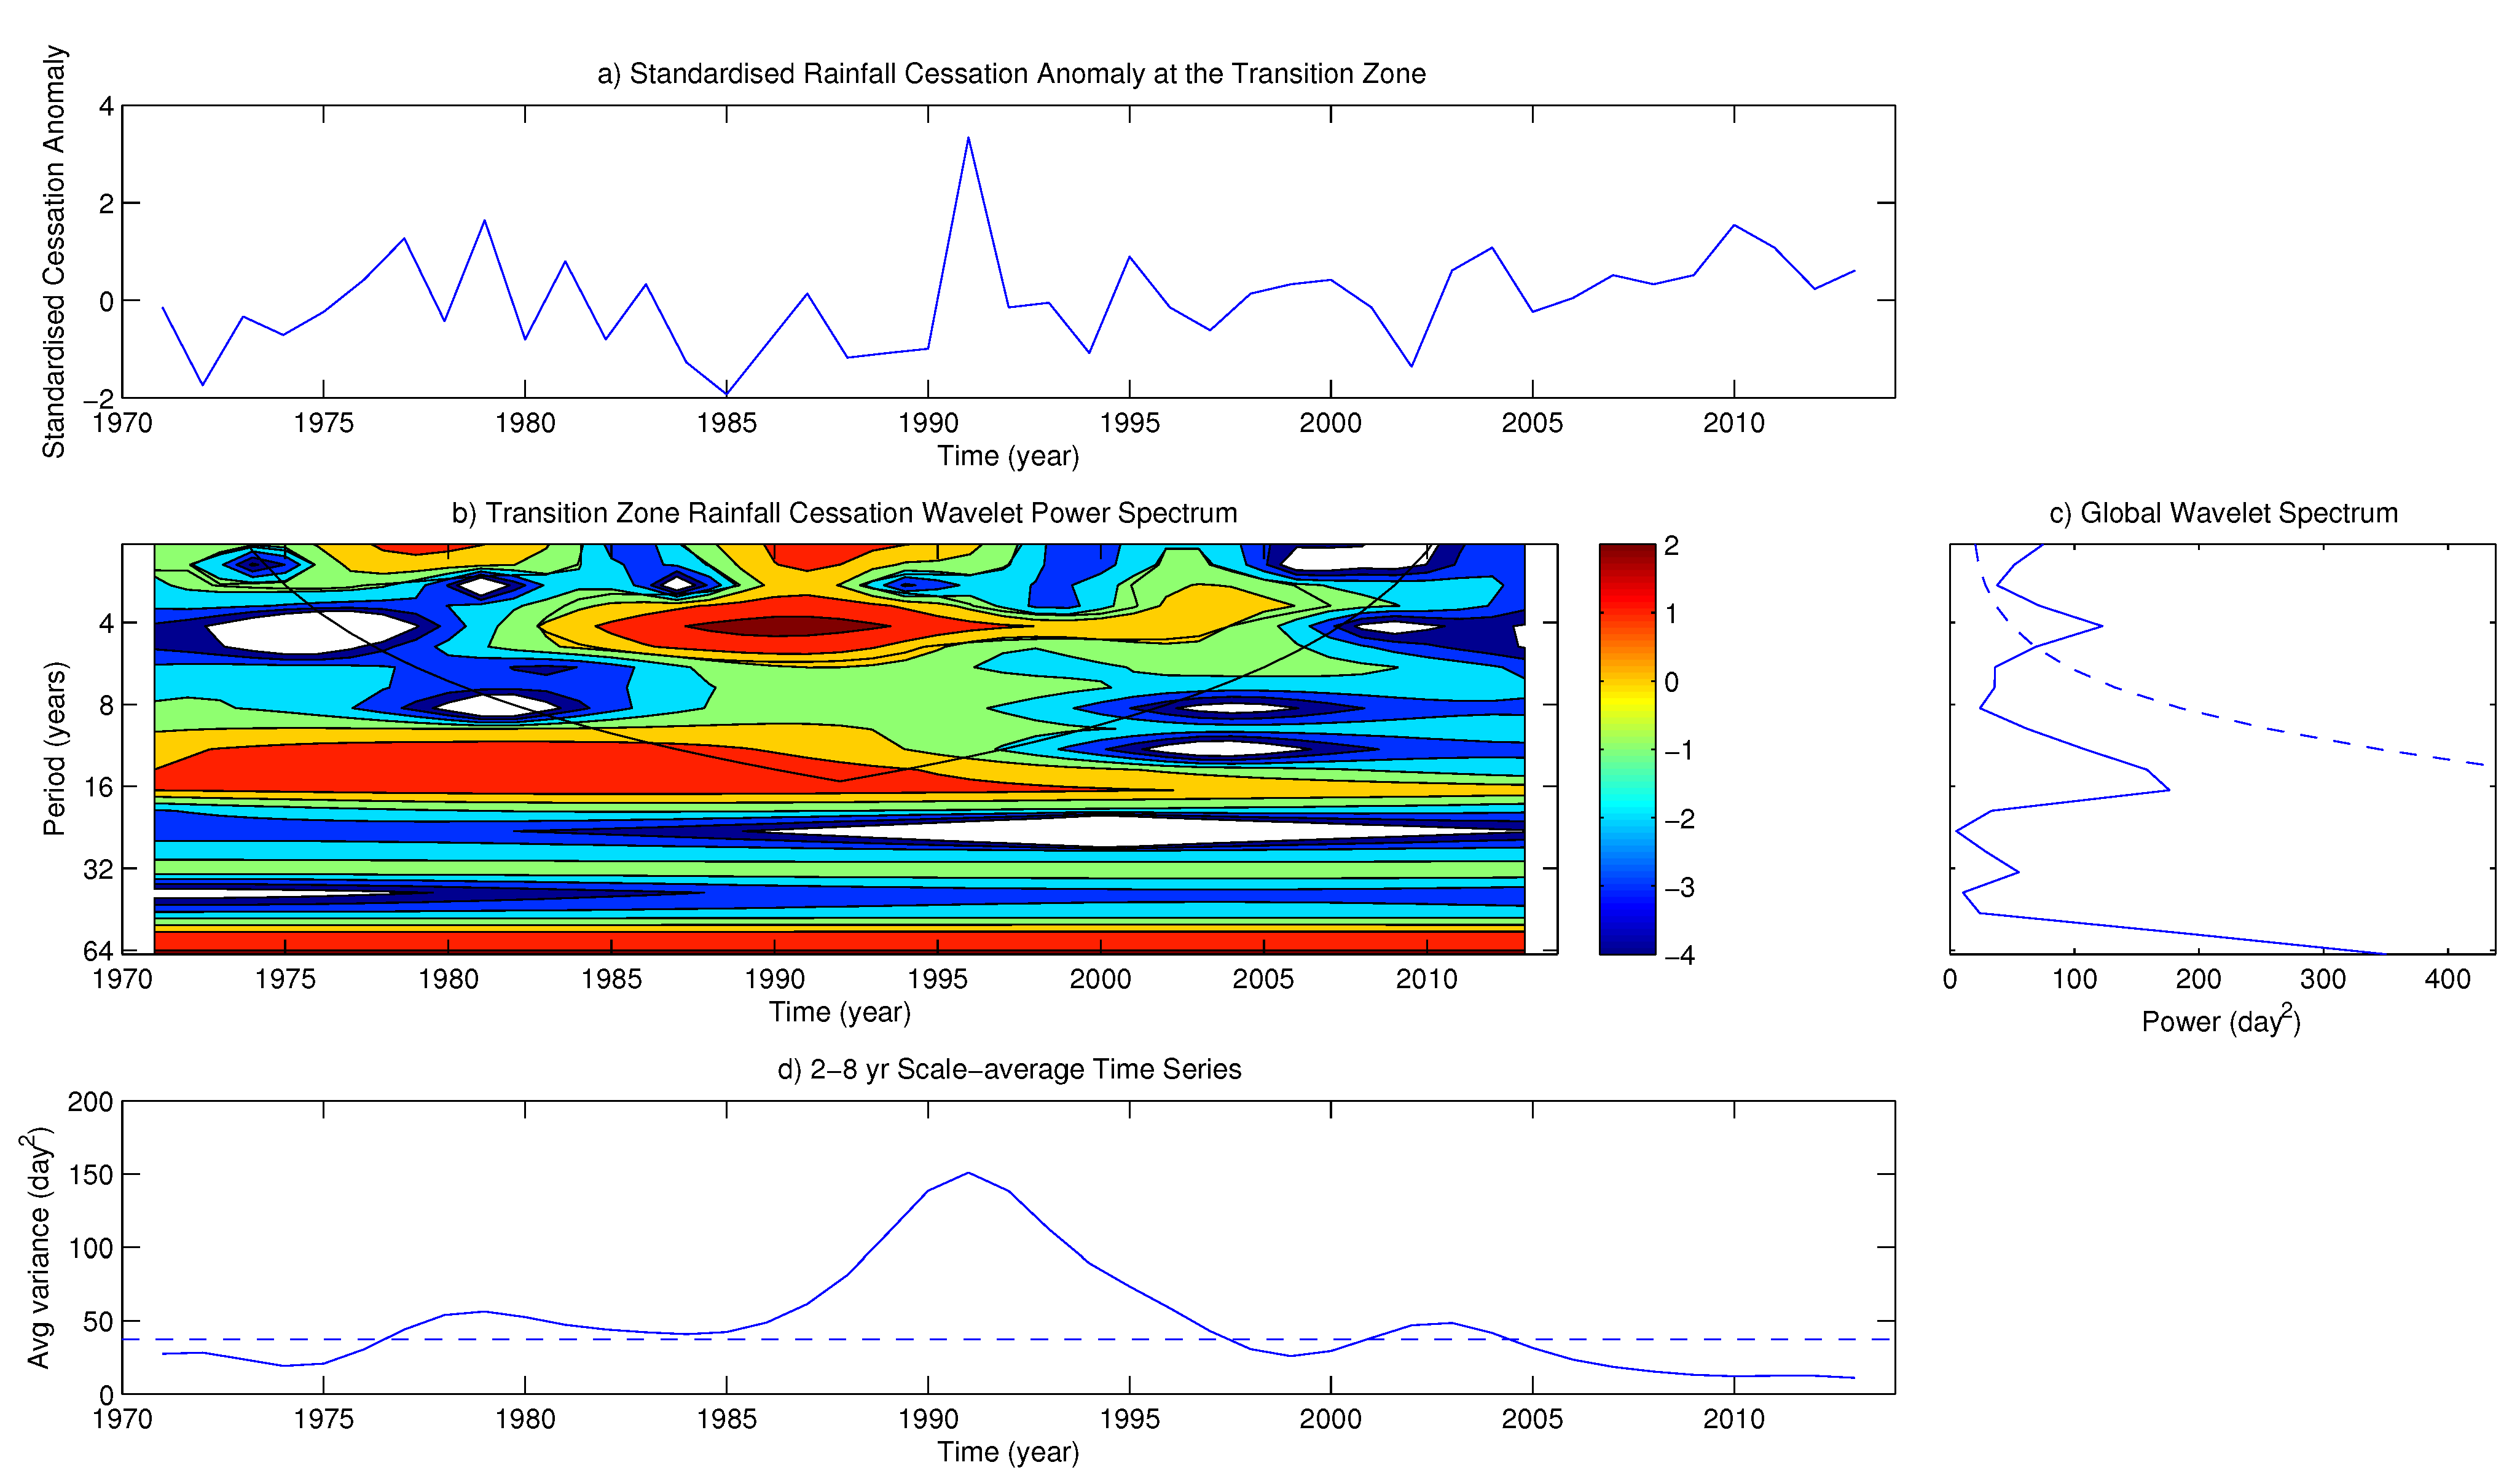
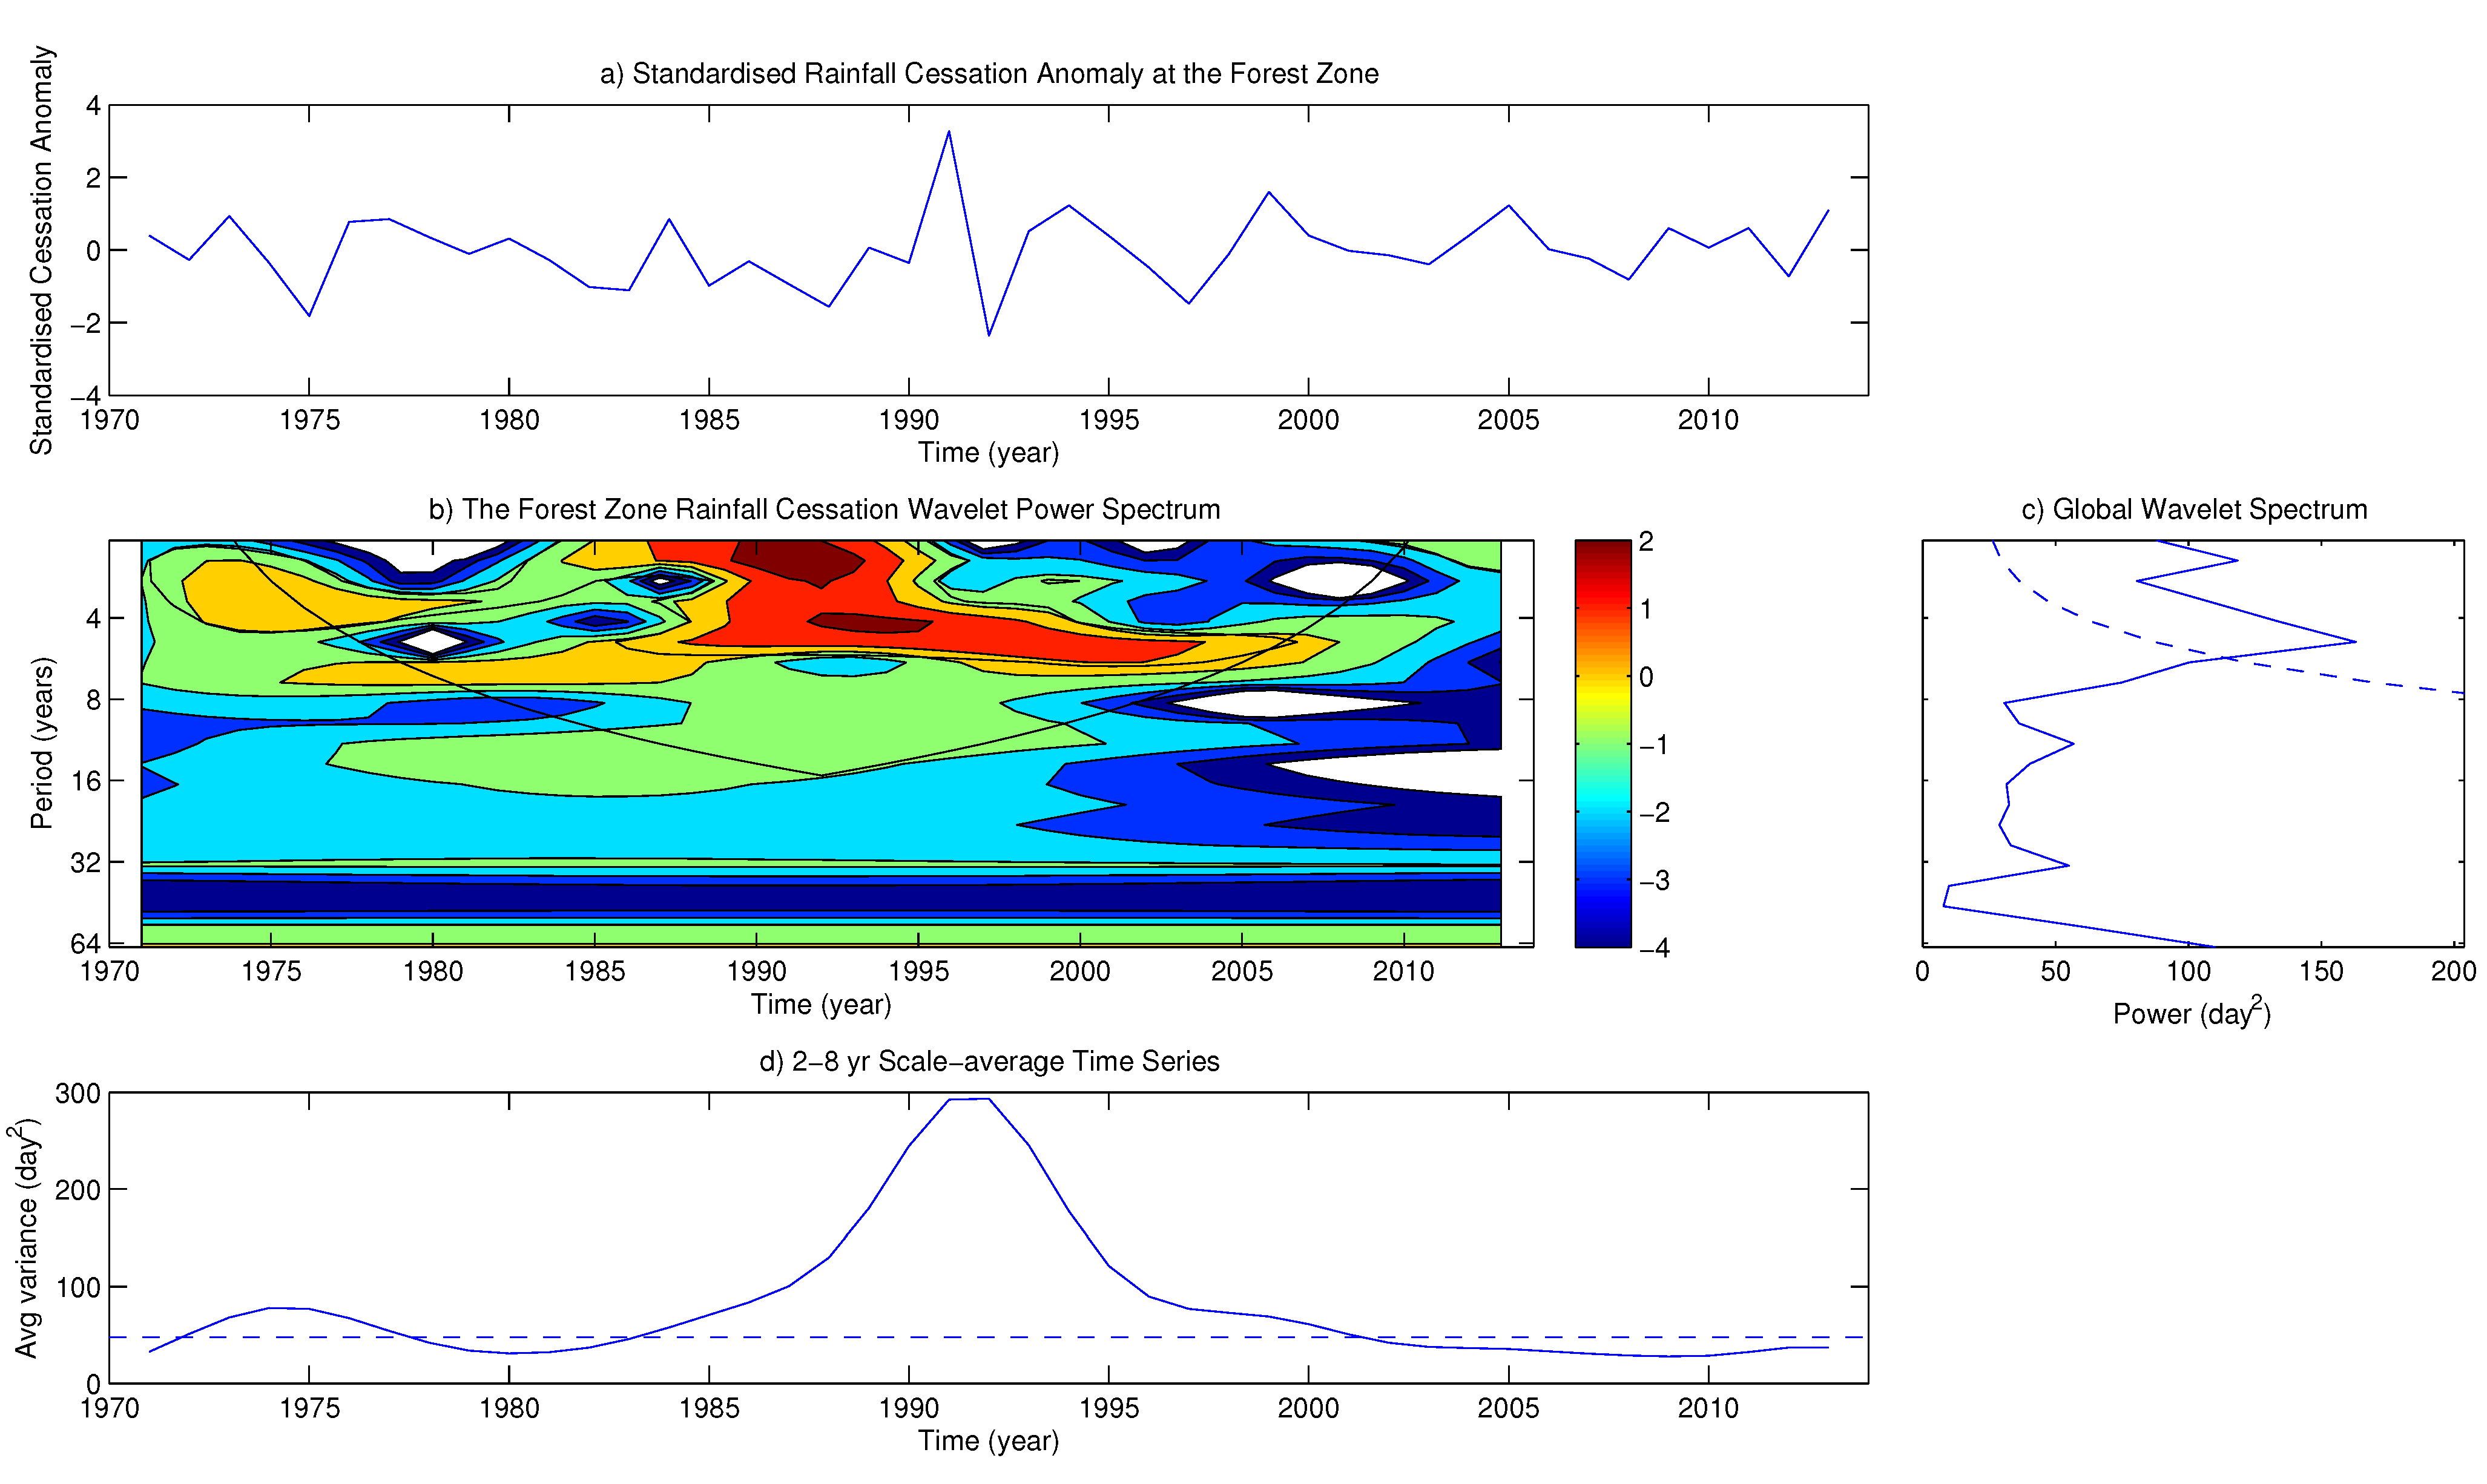
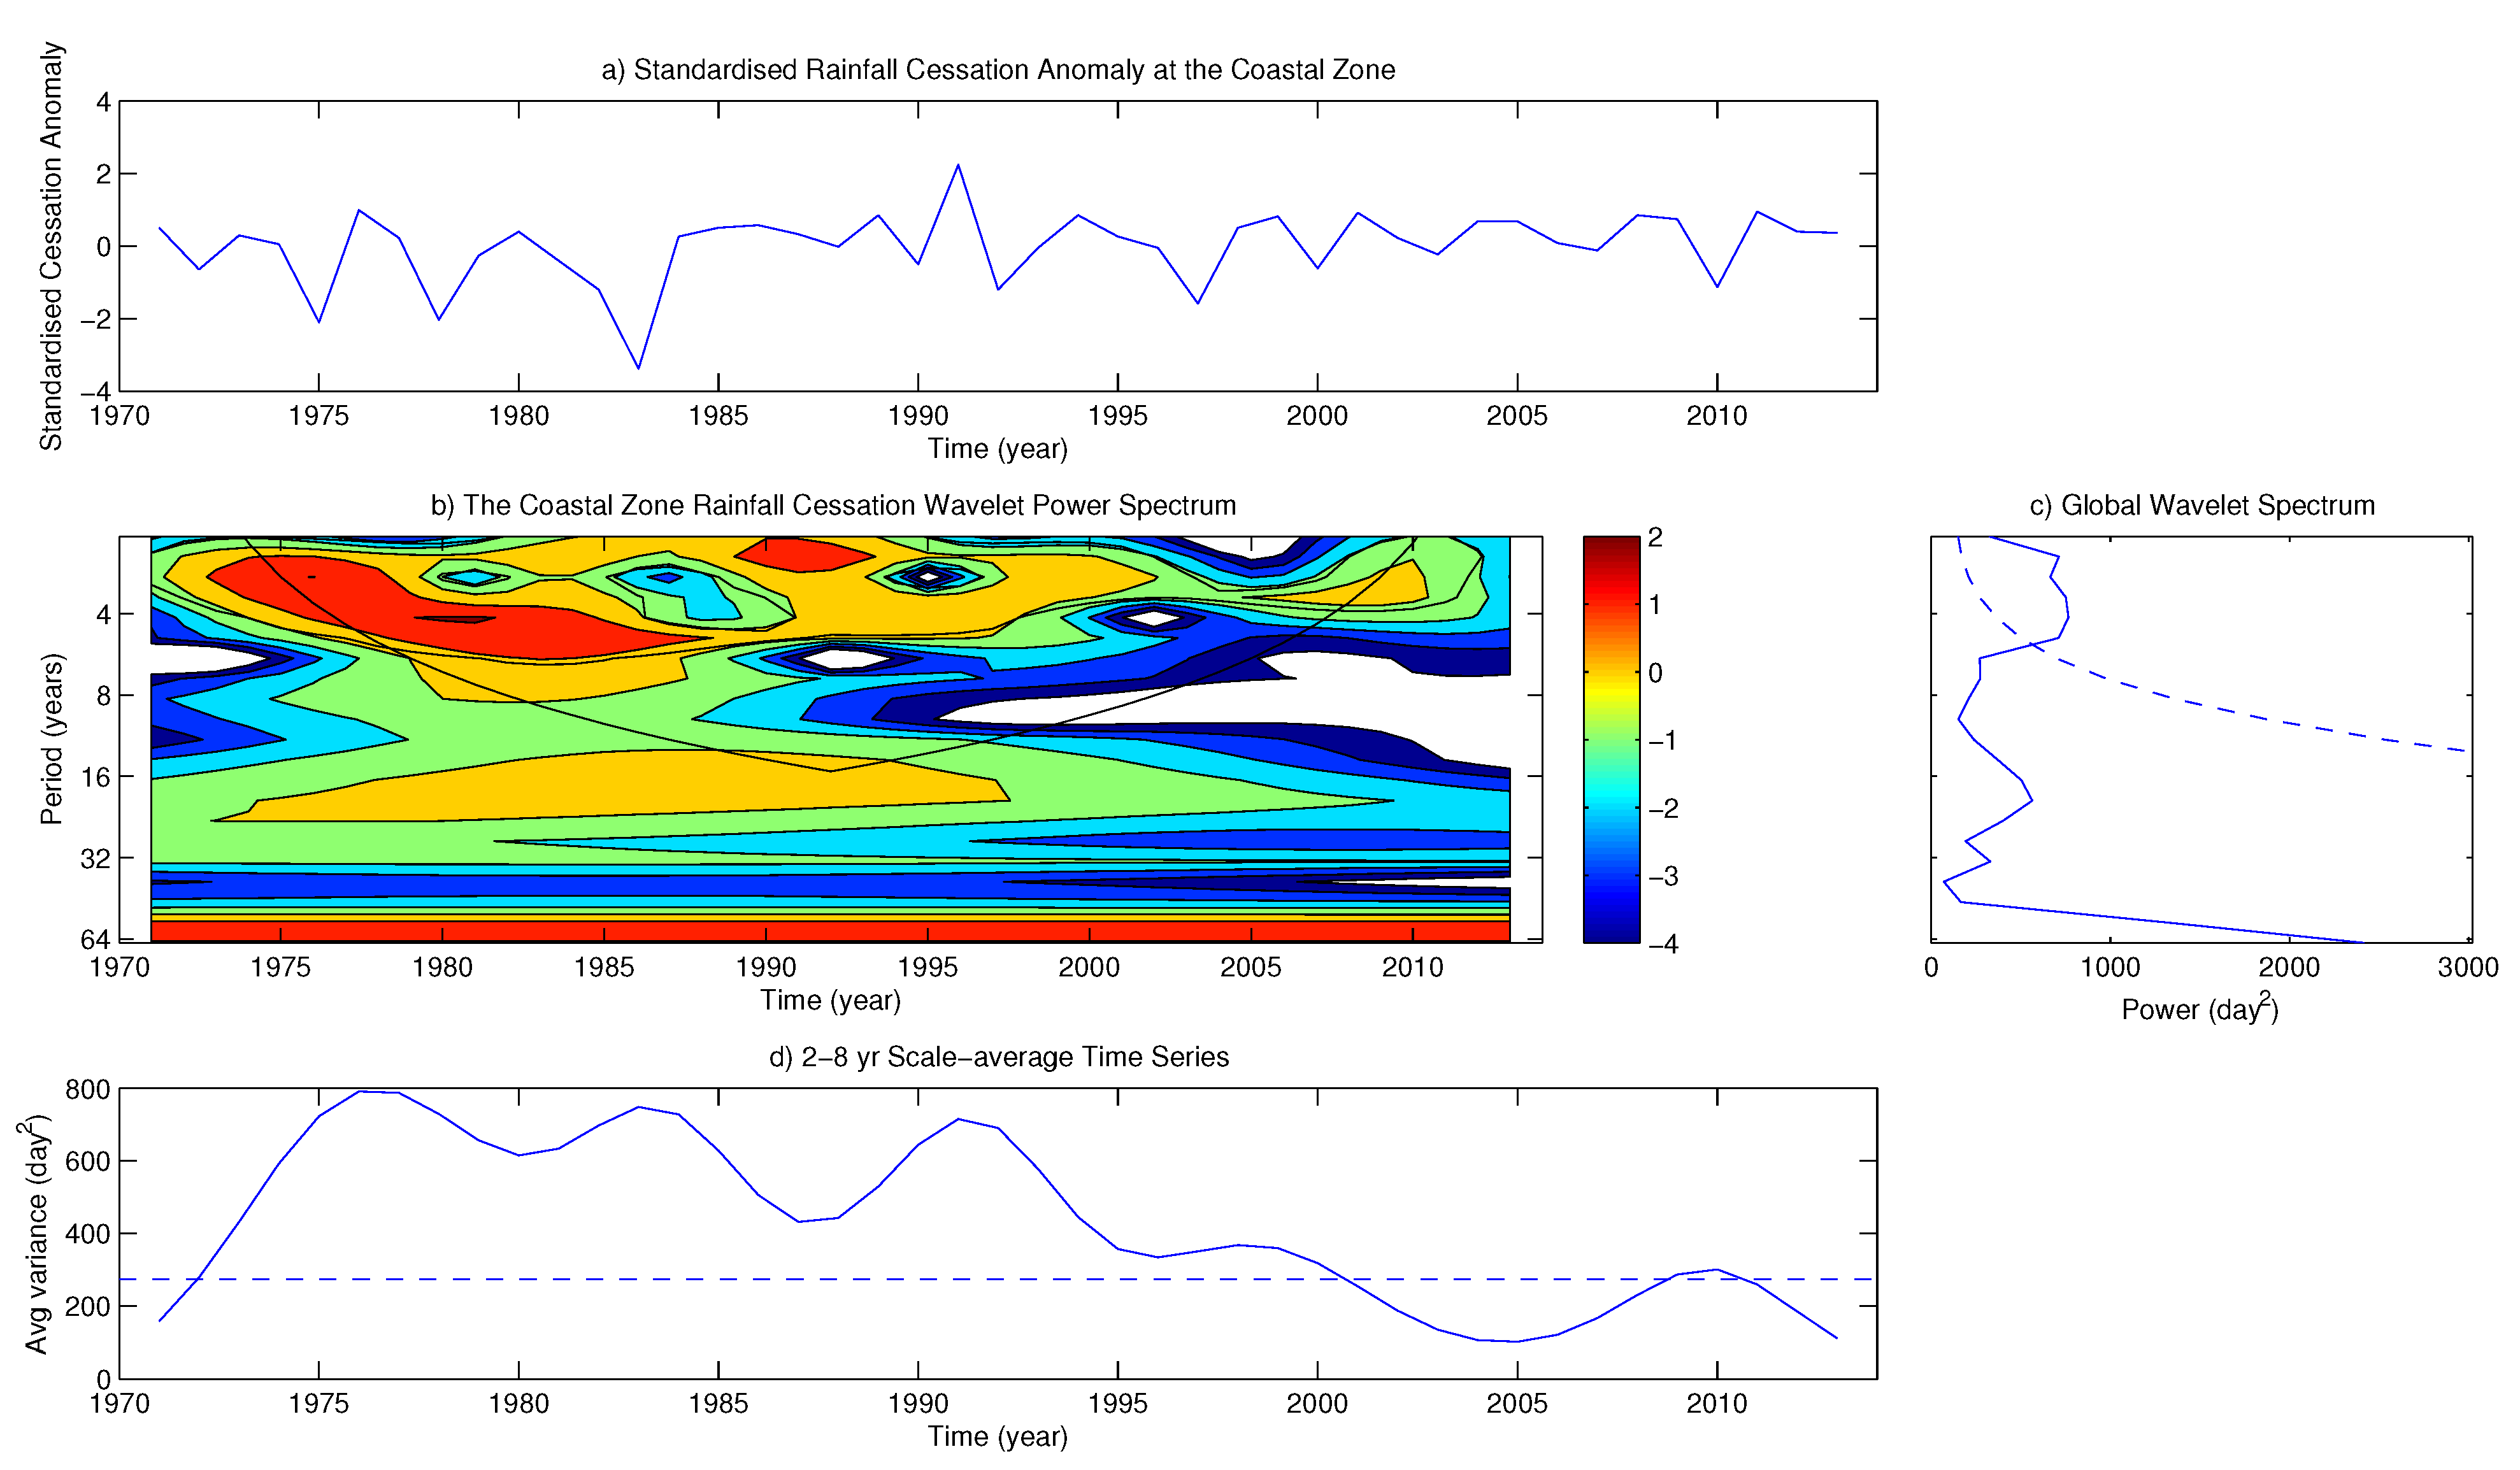
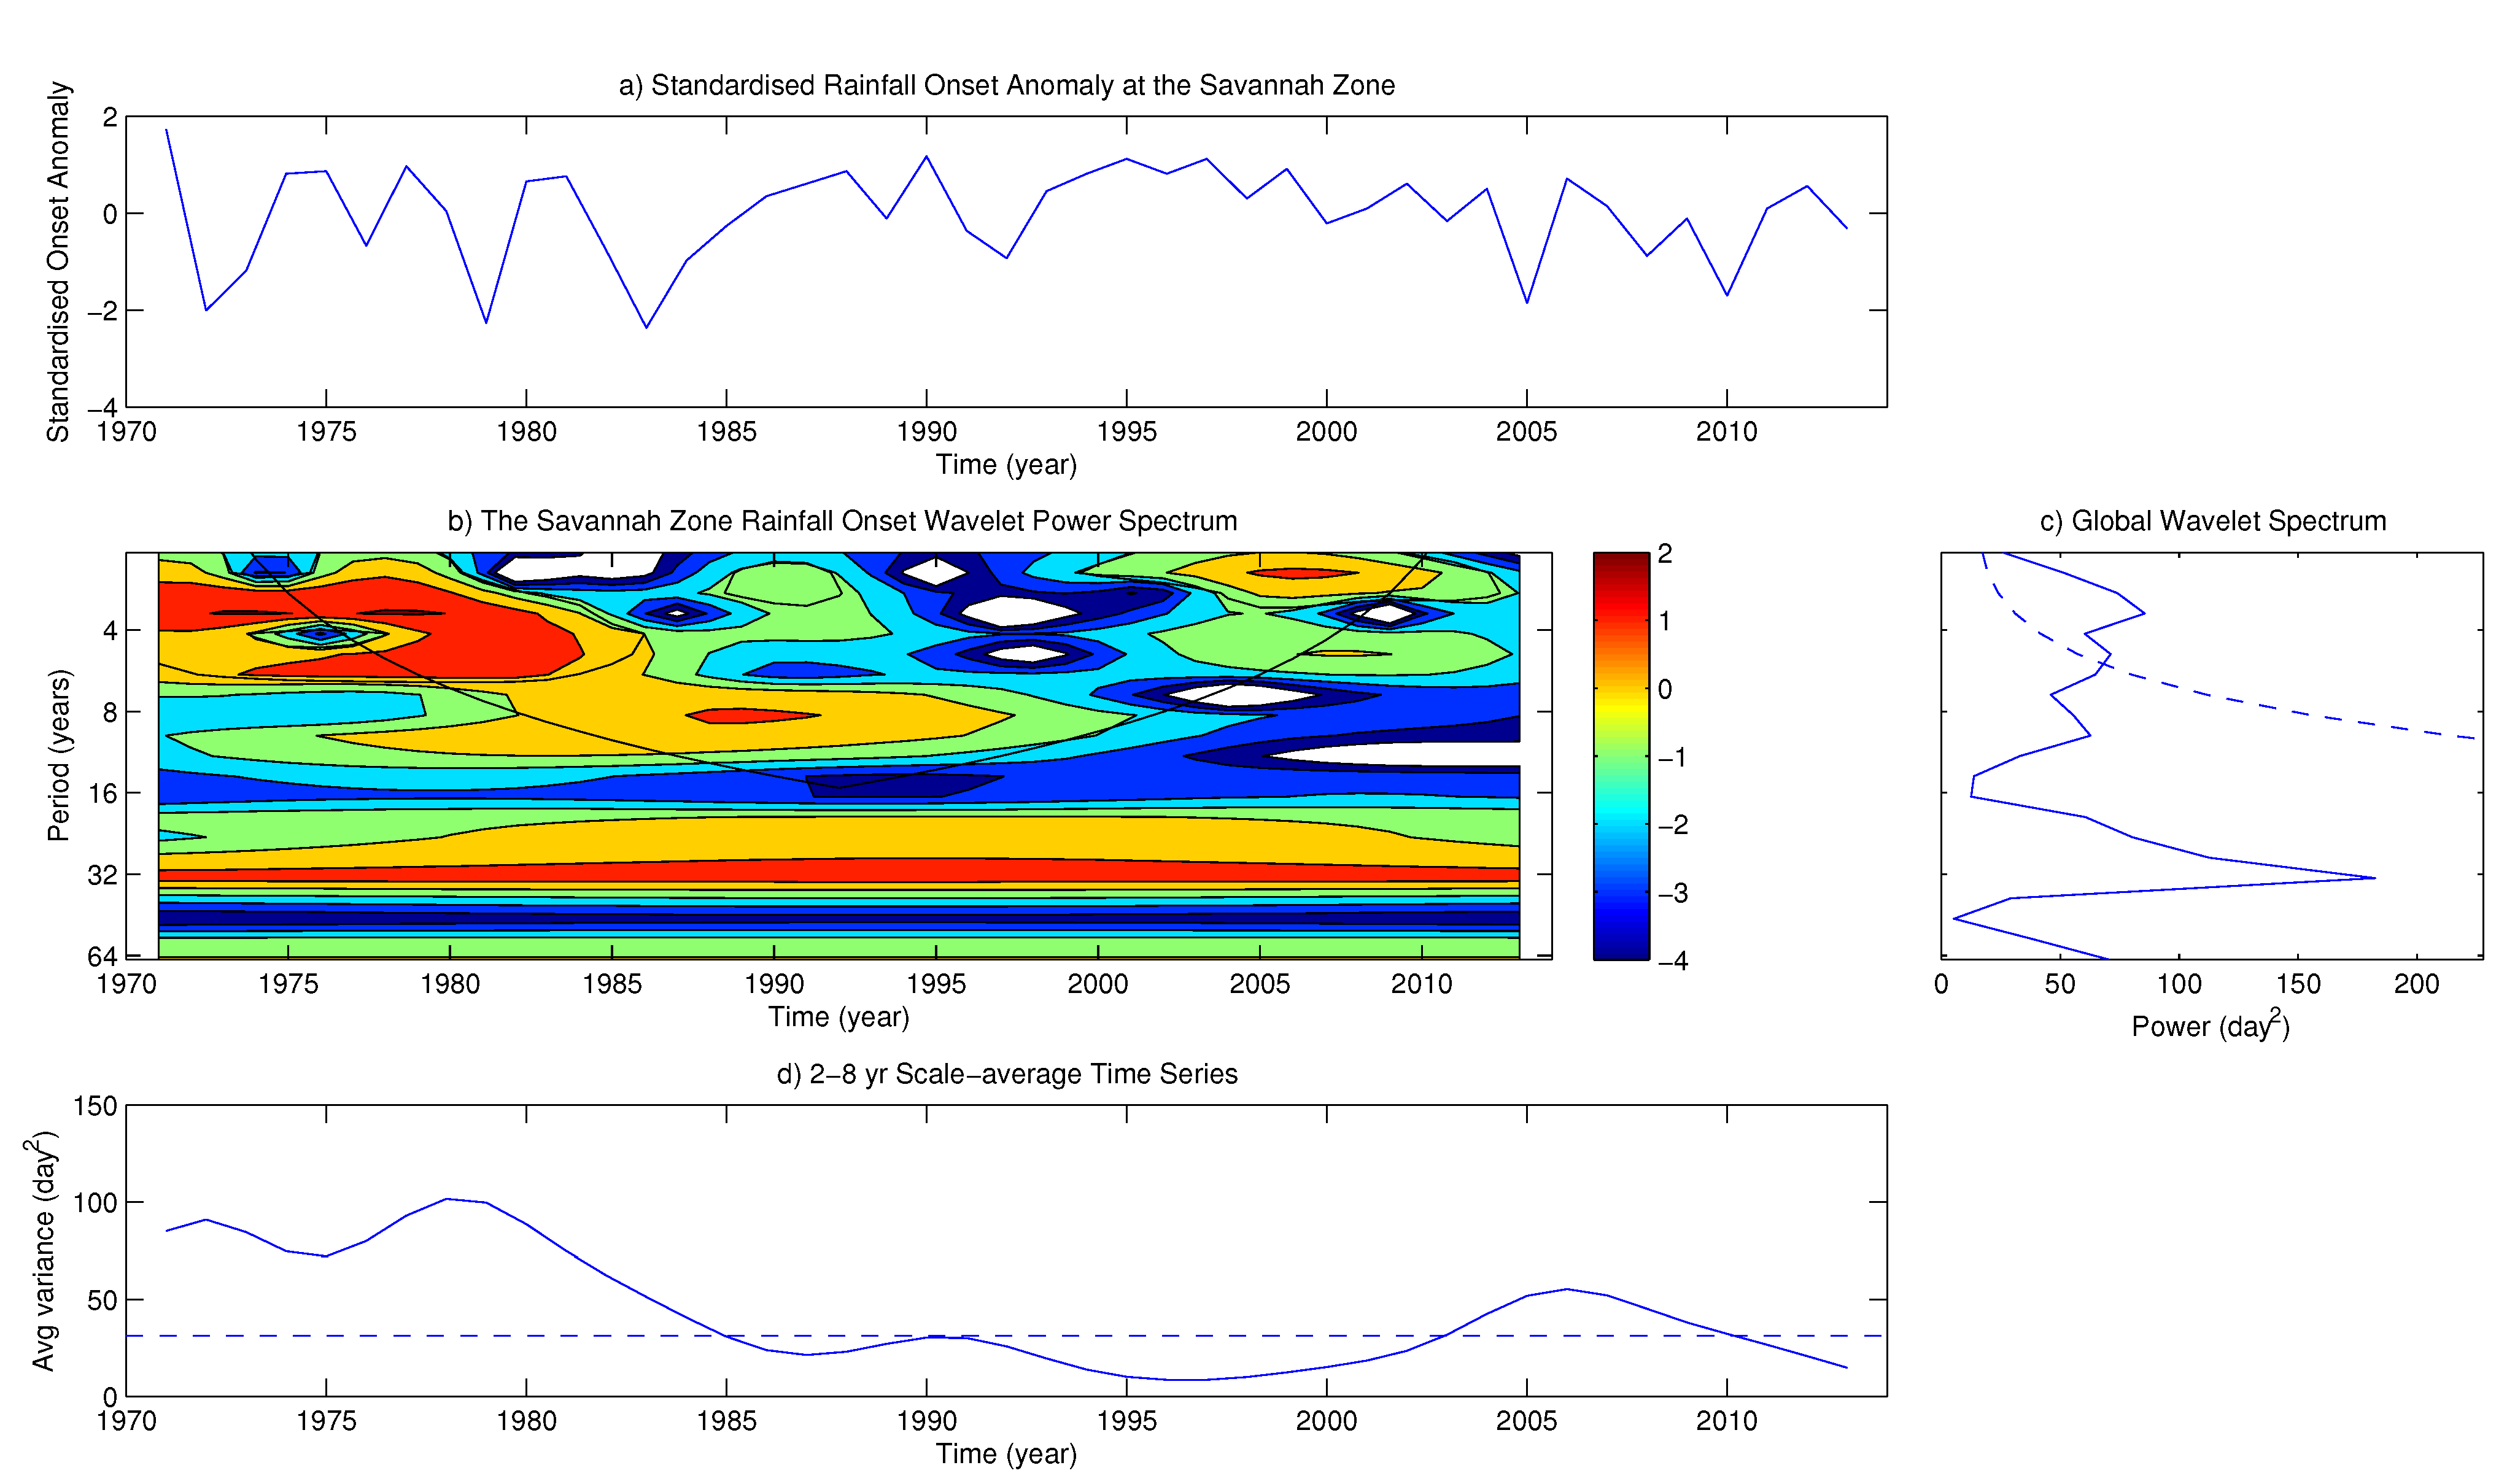
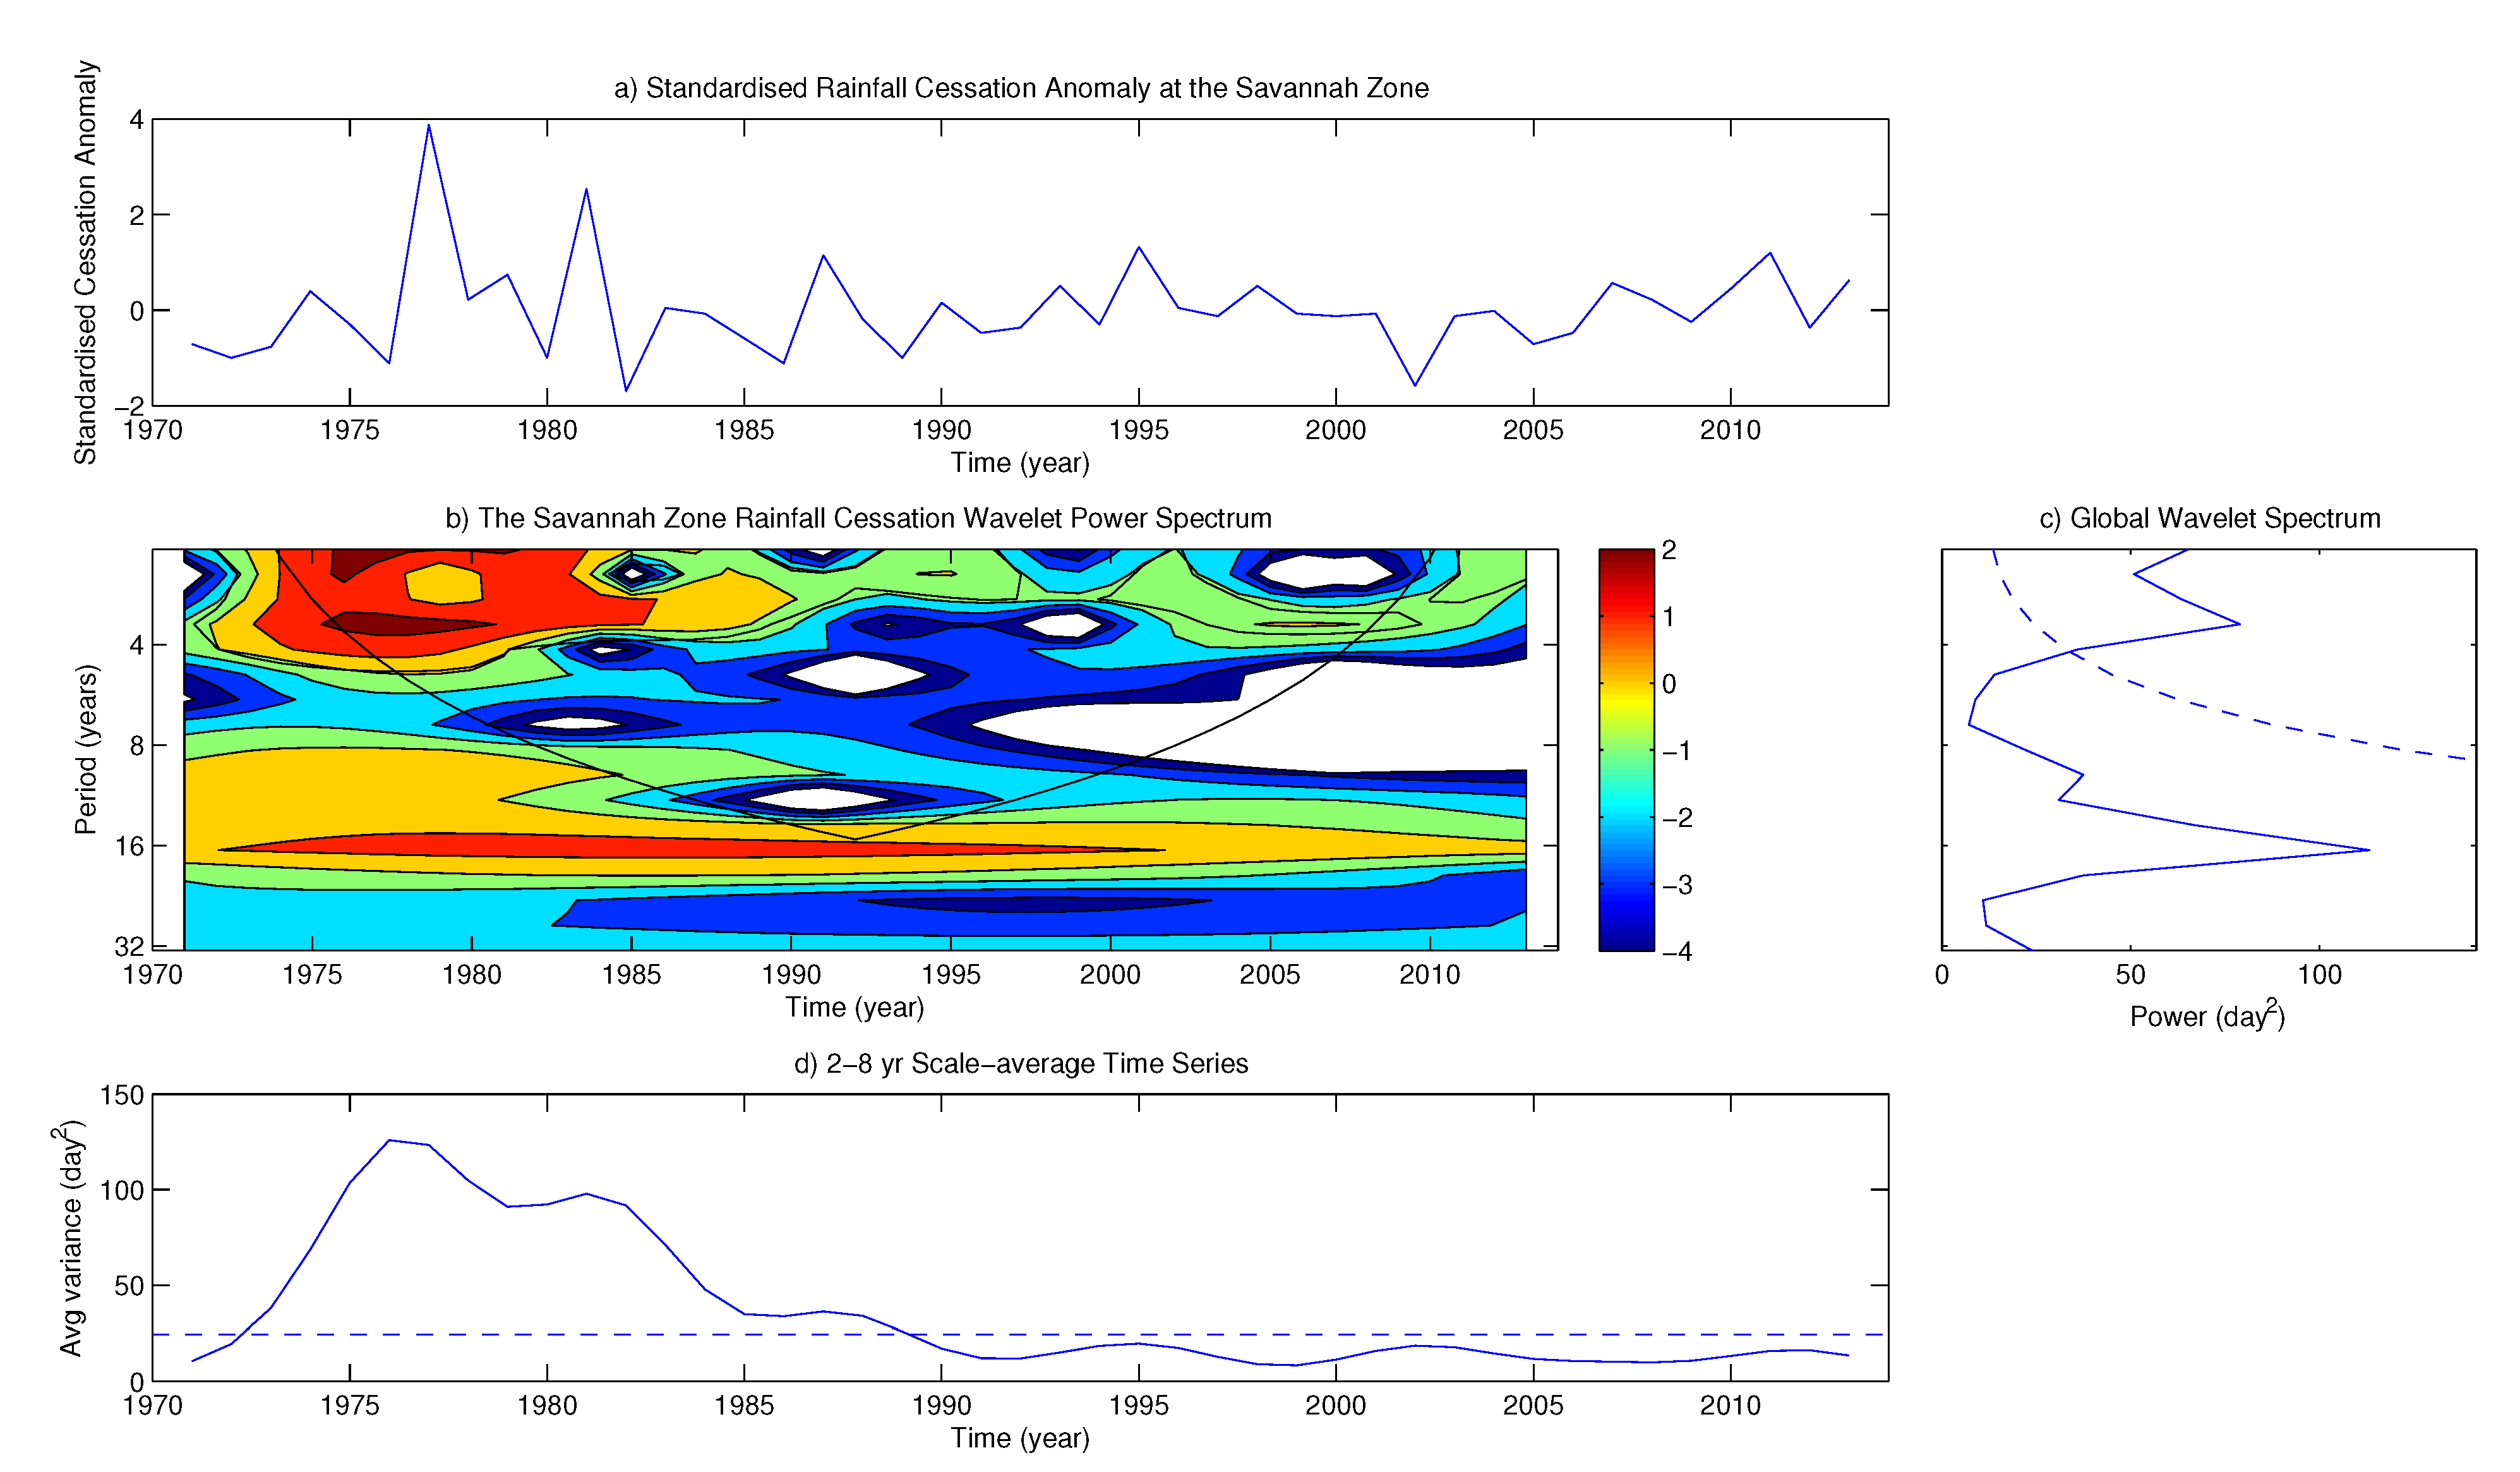
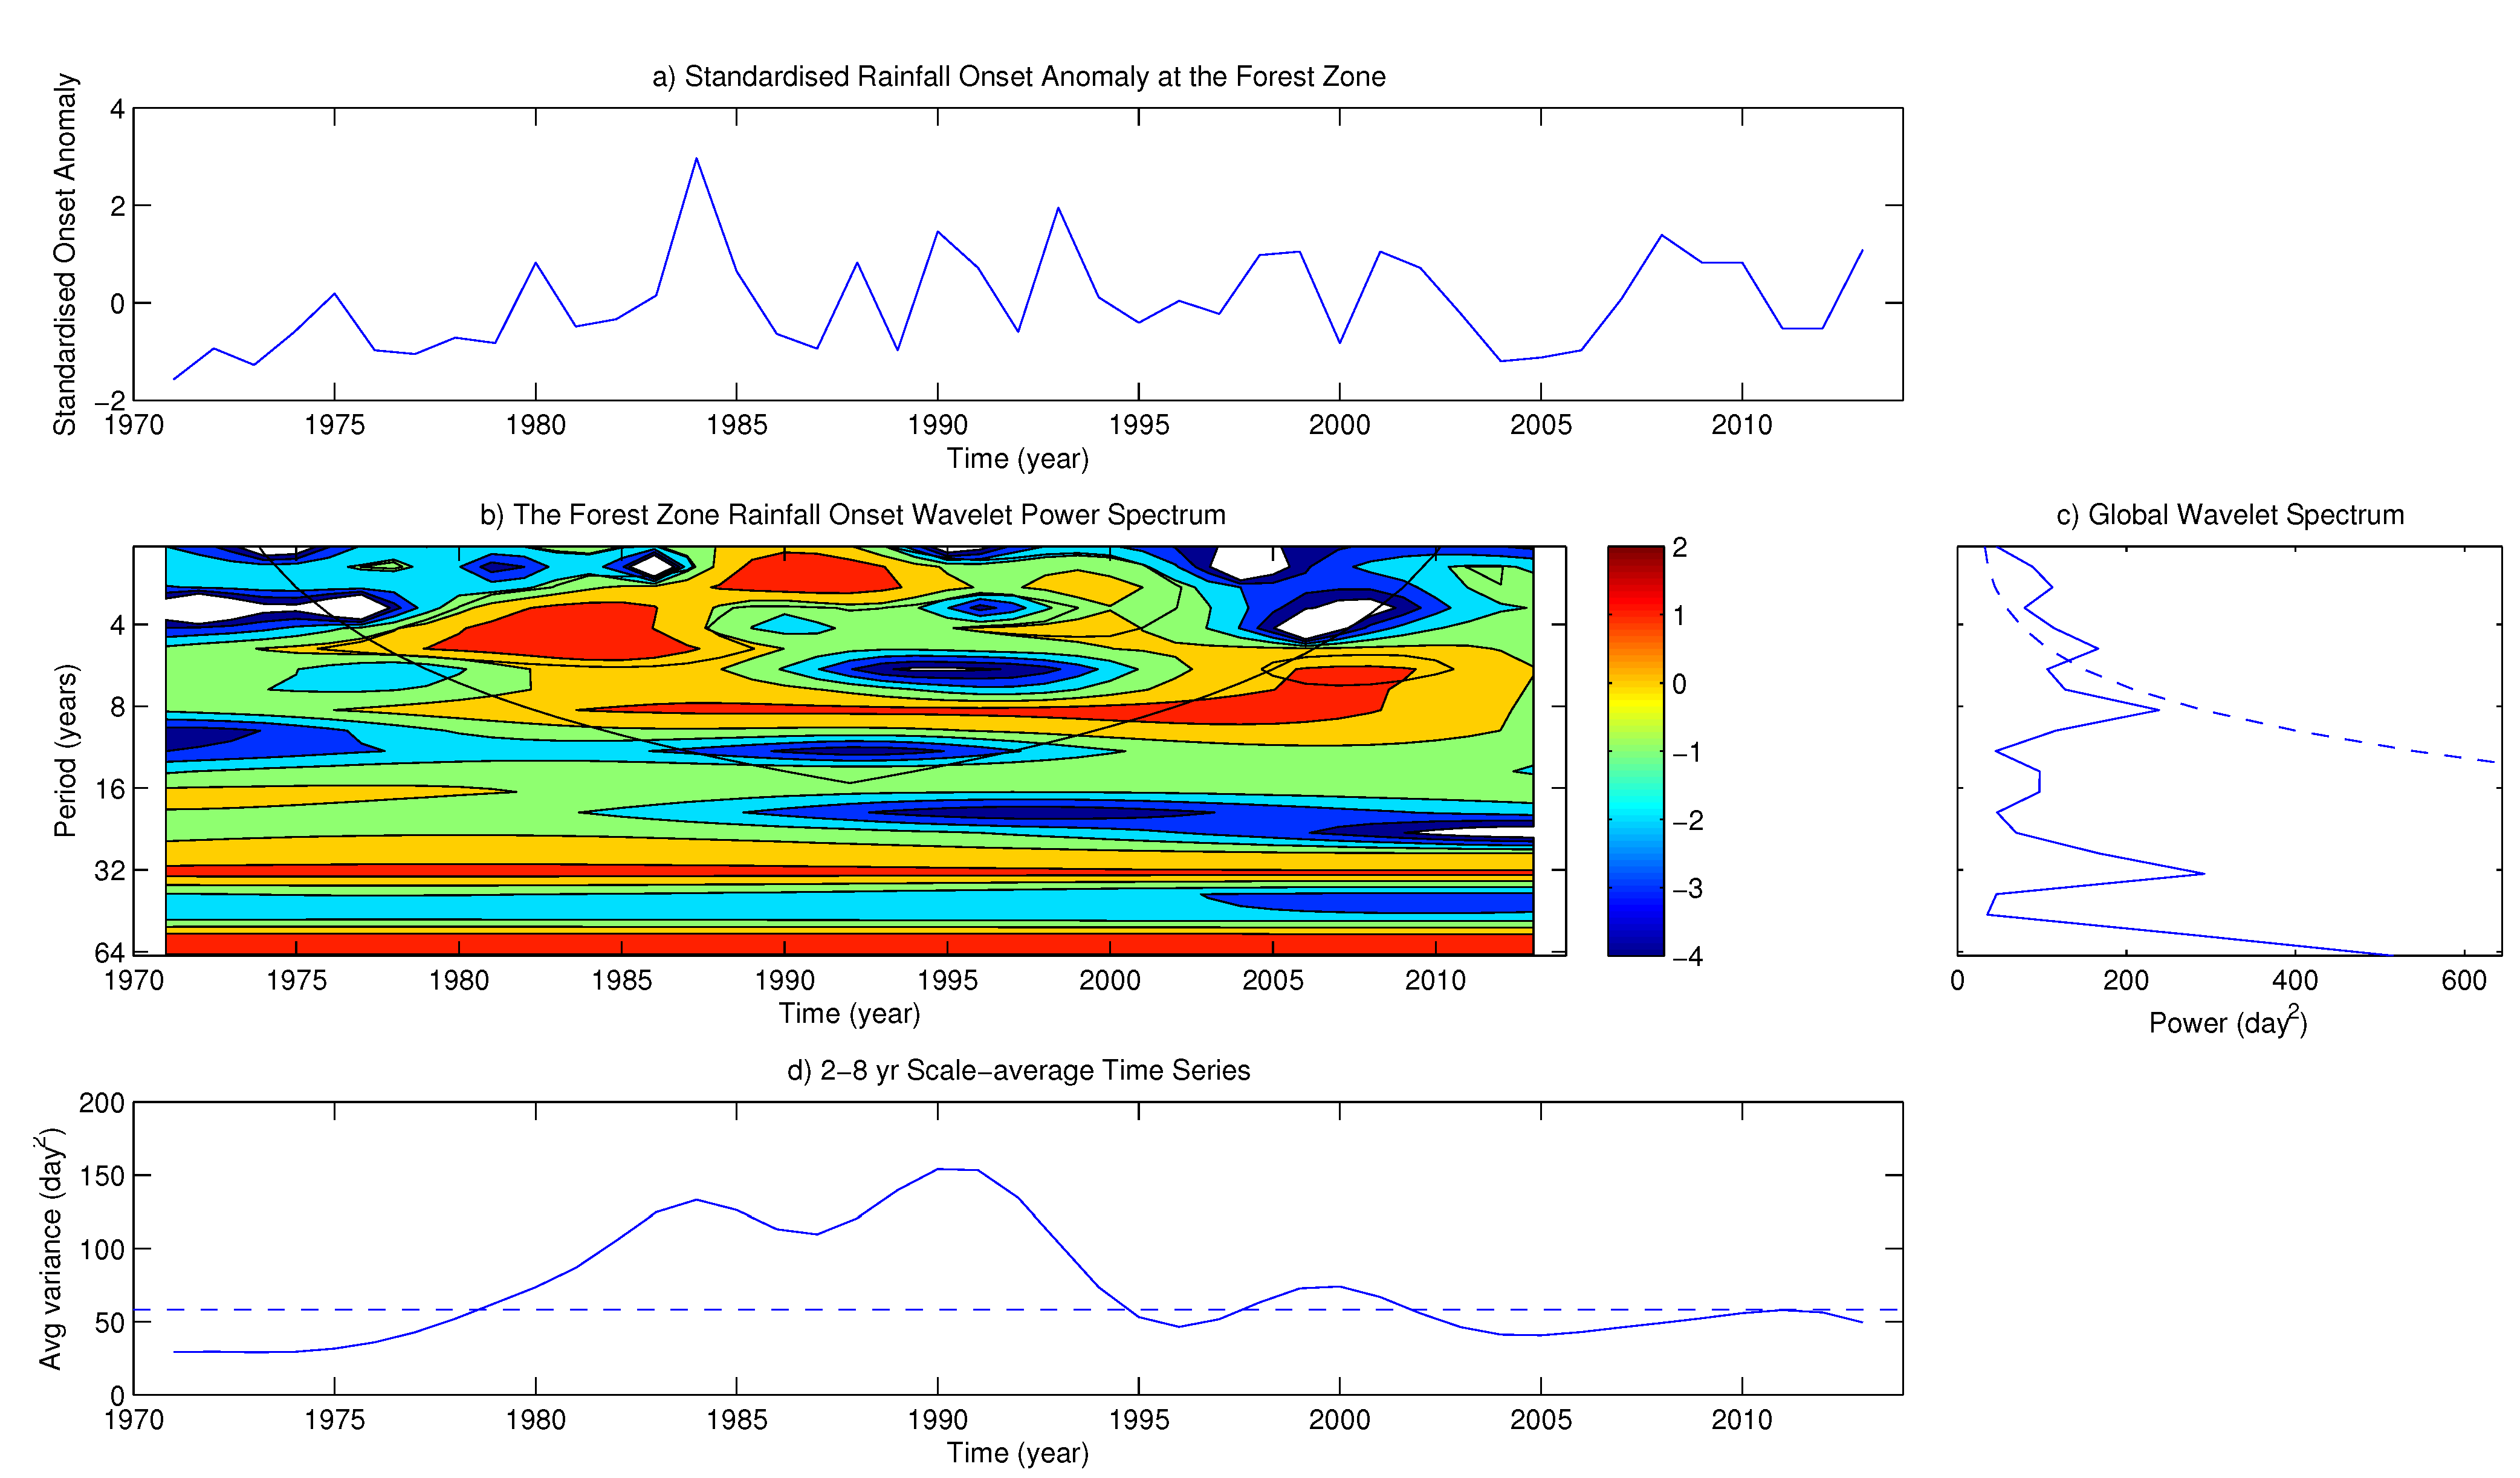
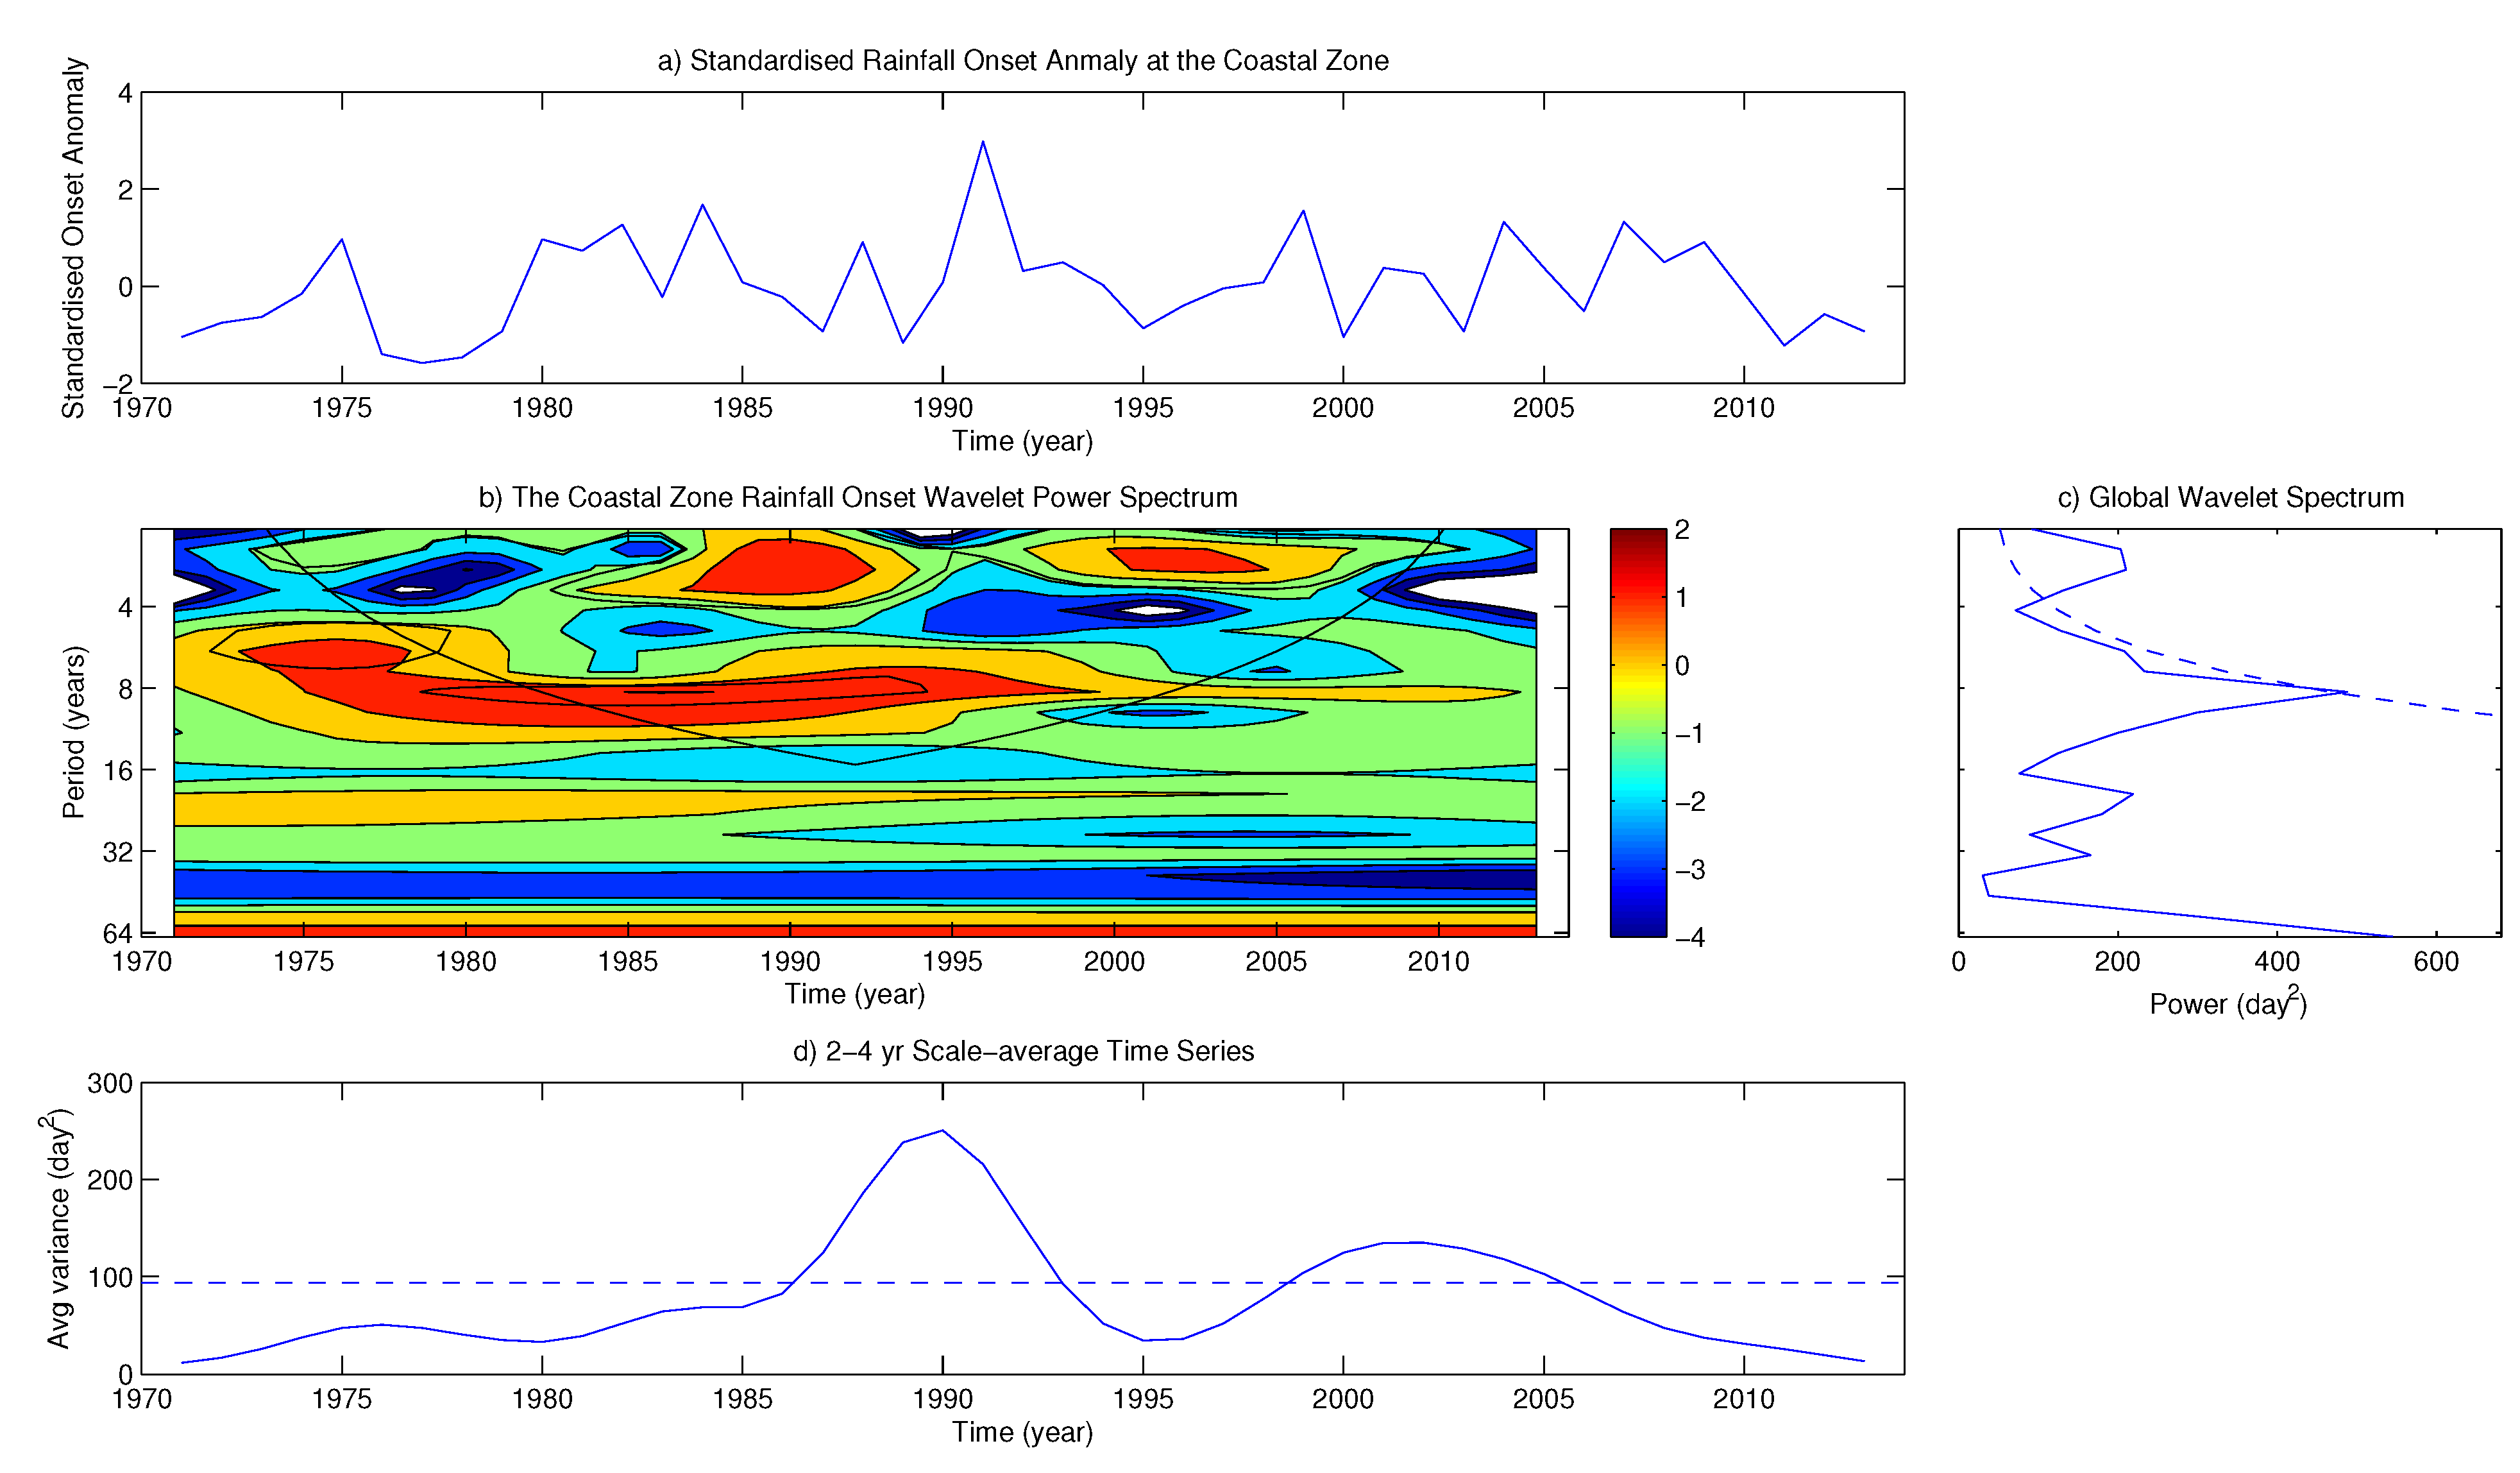
4.2. Variability of Onset and Cessation Dates


5. Conclusions
Acknowledgments
Author Contributions
Conflicts of Interest
References
- Ati, O.; Stigter, C.; Oladipo, E. A comparison of methods to determine the onset of the growing season in northern Nigeria. Int. J. Climatol. 2002, 22, 731–742. [Google Scholar] [CrossRef]
- Cooper, P.; Dimes, J.; Rao, K.; Shapiro, B.; Shiferaw, B.; Twomlow, S. Coping better with current climatic variability in the rain-fed farming systems of sub-Saharan Africa: An essential first step in adapting to future climate change? Agric. Ecosyst. Environ. 2008, 126, 24–35. [Google Scholar] [CrossRef]
- Laux, P.; Wagner, S.; Wagner, A.; Jacobeit, J.; Bardossy, A.; Kunstmann, H. Modelling daily precipitation features in the Volta Basin of West Africa. Int. J. Climatol. 2009, 29, 937–954. [Google Scholar] [CrossRef]
- Lacombe, G.; MacCartney, M.; Forkuor, G. Dry climate in Ghana over the period 1960–2005: evidence from resampling-based Man-Kendall test at local and regional levels. Hydrol. Sci. J. 2012, 57, 1594–1602. [Google Scholar] [CrossRef]
- Jackson, I. Climate, Water and Agriculture in the Tropics; Longman: London, UK, 1989. [Google Scholar]
- Camberlin, P.; Diop, M. Application of daily rainfall principal component analysis to the assessment of the rainy season characteristics in Senegal. Clim. Res. 2003, 23, 159–169. [Google Scholar] [CrossRef]
- Tompkins, A.M.; Ermert, V. A regional-scale, high resolution dynamic malaria model that accounts for population density, climate and surface hydrology. Malar. J. 2013, 12. [Google Scholar] [CrossRef] [PubMed]
- Beer, T.; Greenhut, G.; Tandoh, S. Relations between the Z criterion for the subtropical high, Hadley cell parameters and the rainfall in Northern Ghana. Mon. Weather Rev. 1977, 105, 849–855. [Google Scholar] [CrossRef]
- Omotosho, J. Onset of thunderstorms and precipitation over northern Nigeria. Int. J. Climatol. 1990, 10, 849–860. [Google Scholar]
- Omotosho, J. Long-range prediction of the onset and end of the rainy season in the West African Sahel. Int. J. Climatol. 1992, 12, 369–382. [Google Scholar] [CrossRef]
- Omotosho, J.; Balogun, A.; Ogunjobi, K. Predicting monthly and seasonal rainfall, onset and cessation of the rainy season in West Africa using only surface data. Int. J. Climatol. 2000, 20, 865–880. [Google Scholar] [CrossRef]
- Cocheme, J.; Cocheme, P. An Agroclimatology Survey of a Semiarid Area in Africa South of the Sahara; Secretariat of the World Meteorological Organization: Geneva, Switzerland, 1967. [Google Scholar]
- Benoit, P. The start of the growing season in Northern Nigeria. Agric. Meteorol. 1977, 18, 91–99. [Google Scholar] [CrossRef]
- Ilesanmi, O. An empirical formulation of the onset, advance and retreat of rainfall in Nigeria. J. Trop. Geogr. 1972, 34, 17–24. [Google Scholar]
- Olaniran, O.J. The onset of the rains and the start of the growing season in Nigeria. Niger. Geogr. J. 1983, 26, 81–88. [Google Scholar]
- Olaniran, O. The start and end of the growing season in the Niger River Basin Development Authority Area of Nigeria. Malays. J. Trop. Geogr. 1984, 9, 49–58. [Google Scholar]
- Adejuwon, J.; Balogun, E.; Adejuwon, S. On the annual and seasonal patterns of rainfall fluctuations in sub-saharan West Africa. Int. J. Climatol. 1990, 10, 839–848. [Google Scholar] [CrossRef]
- Odekunle, T. Determining rainfall onset and retreat dates in Nigeria. J. Hum. Ecol. 2004, 16, 239–247. [Google Scholar]
- Odekunle, T. Determining rainy season onset and retreat over Nigeria from precipitation amount and number of rainy days. Theor. Appl. Climatol. 2006, 83, 193–201. [Google Scholar] [CrossRef]
- Sivakumar, M. Predicting rainy season potential from the onset of rains in Southern Sahelian and Sudanian climatic zones of West Africa. Agric. For. Meteorol. 1988, 42, 295–305. [Google Scholar] [CrossRef]
- Omotosho, J. Synoptic meteorology: Pathway to seasonal rainfall prediction for sustainable agriculture and effective water resources management in West Africa but Nigeria in particular. J. Niger. Meteorol. Soc. 2002, 3, 81–89. [Google Scholar]
- Chiduza, C. Analysis of rainfall data and their implication on crop production: A case study of northern Sebungwe. Zimbab. J. Agric. Res. 1995, 33, 175–189. [Google Scholar]
- Odekunle, T. Rainfall and the length of the growing season in Nigeria. Int. J. Climatol. 2004, 24, 467–479. [Google Scholar] [CrossRef]
- Raes, D.; Sithole, A.; Makarau, A.; Milford, J. Evaluation of first planting dates recommended by criteria currently used in Zimbabwe. Agric. For. Meteorol. 2004, 125, 177–185. [Google Scholar] [CrossRef]
- Sultan, B.; Janicot, S. The West African Monsoon Dynamics Part II: Preonset and onset of the summer monsoon. J. Clim. 2003, 16, 3407–3427. [Google Scholar] [CrossRef]
- Sultan, B.; Janicot, S.; Diedhiou, A. The West African monsoon dynamics Part I: Documentation of intraseasonal variability. J. Clim. 2003, 16, 3389–3406. [Google Scholar] [CrossRef]
- Mounier, F.; Janicot, S.; Kiladis, G.N. The West African monsoon dynamics Part III: The Quasi-Biweekly zonal dipole. J. Clim. 2008, 21, 1911–1928. [Google Scholar] [CrossRef]
- Biederlack, L.; Rivers, J. Comprehensive Food Security & Vulnerability Analysis (CFSVA): Ghana; United Nations World Food Programme: Rome, Italy, 2009. [Google Scholar]
- Owusu, K.; Waylen, P.R. The changing rainy season climatology of mid-Ghana. Theor. Appl. Climatol. 2013, 112, 419–430. [Google Scholar] [CrossRef]
- Manzanas, R.; Amekudzi, L.; Preko, K.; Herrera, S.; Gutierrez, J. A comparison of methods to determine the onset of the growing season in Nigeria. Clim. Chang. 2014, 124, 805–819. [Google Scholar] [CrossRef]
- Mengistu Tsidu, G. High-Resolution monthly rainfall database for Ethiopia: Homogenization, Reconstruction and Gridding. J. Clim. 2012, 25, 8422–8443. [Google Scholar] [CrossRef]
- Lucio, P.S.; Conde, F.C.; Ramos, A.M. A bayesian approach for recovering and homogenizing meteorological time series. ICSHMO 2006, 8, 1545–1553. [Google Scholar]
- Chen, F.W.; Liu, C.-W. Estimation of the spatial rainfall distribution using inverse distance weighting (IWD) in the middle of Taiwan. Paddy Water Environ. 2012, 10, 209–222. [Google Scholar] [CrossRef]
- Laux, P.; Kunstmann, H.; Bardossy, A. Predicting the regional onset of the rainy season in West Africa. Int. J. Climatol. 2008, 28, 329–342. [Google Scholar] [CrossRef]
- Ndomba, P. Development of rainfall curves for crops planting dates: A case study of Pangani River Basin in Tanzania. Nile Basin Water Sci. Eng. J. 2010, 3, 13–27. [Google Scholar]
- Santos, C.A.G.; Galvao, C.O.; Suzuki, K.; Trigo, R.M. Matsuyama city rainfall data analysis using wavelet transform. Ann. J. Hydraulic. Eng. JSCE 2001, 45, 211–216. [Google Scholar] [CrossRef]
- Nicholson, S.E.; Grist, J.P. A conceptual model for understanding rainfall variability in the West African Sahel on interannual and interdecadal timescales. Int. J. Climatol. 2001, 21, 1733–1757. [Google Scholar] [CrossRef]
- Sylla, M.B.; Giorgi, F.; Ruti, P.M.; Calmanti, S.; Dell Aquila, A. The impact of deep convection on the West Africa summer monsoon climate: A regional climate model sensitivity study. Quart. J. Roy. Meteor. Soc. 2011, 137, 1417–1430. [Google Scholar] [CrossRef]
- Houze, R.A., Jr. Orographic effects on precipitating clouds. Rev. Geophys. 2012, 50, 1–47. [Google Scholar] [CrossRef]
- Hall, N.M.J.; Peyrille, P. Dynamics of the West Africa monsoon. J. Phys. IV Fr. 2006, 139, 81–99. [Google Scholar] [CrossRef]
© 2015 by the authors; licensee MDPI, Basel, Switzerland. This article is an open access article distributed under the terms and conditions of the Creative Commons Attribution license (http://creativecommons.org/licenses/by/4.0/).
Share and Cite
Amekudzi, L.K.; Yamba, E.I.; Preko, K.; Asare, E.O.; Aryee, J.; Baidu, M.; Codjoe, S.N.A. Variabilities in Rainfall Onset, Cessation and Length of Rainy Season for the Various Agro-Ecological Zones of Ghana. Climate 2015, 3, 416-434. https://doi.org/10.3390/cli3020416
Amekudzi LK, Yamba EI, Preko K, Asare EO, Aryee J, Baidu M, Codjoe SNA. Variabilities in Rainfall Onset, Cessation and Length of Rainy Season for the Various Agro-Ecological Zones of Ghana. Climate. 2015; 3(2):416-434. https://doi.org/10.3390/cli3020416
Chicago/Turabian StyleAmekudzi, Leonard K., Edmund I. Yamba, Kwasi Preko, Ernest O. Asare, Jeffrey Aryee, Michael Baidu, and Samuel N. A. Codjoe. 2015. "Variabilities in Rainfall Onset, Cessation and Length of Rainy Season for the Various Agro-Ecological Zones of Ghana" Climate 3, no. 2: 416-434. https://doi.org/10.3390/cli3020416
APA StyleAmekudzi, L. K., Yamba, E. I., Preko, K., Asare, E. O., Aryee, J., Baidu, M., & Codjoe, S. N. A. (2015). Variabilities in Rainfall Onset, Cessation and Length of Rainy Season for the Various Agro-Ecological Zones of Ghana. Climate, 3(2), 416-434. https://doi.org/10.3390/cli3020416