Article

An Early Documented Late-Spring Heatwave in Iberia Under Pre-Industrial Climatic Conditions

by
Maite deCastro
1,
José González-Cao
1,
Nicolás G. deCastro
1,
María Cruz Gallego
2,3,
José M. Vaquero
2,3,*,
Ricardo M. Trigo
4,5 and
Moncho Gómez-Gesteira
1
1
Centro de Investigación Mariña, Universidade de Vigo, Environmental Physics Laboratory (EphysLab), Campus da Auga, 32004 Ourense, Spain
2
Departamento de Física, Universidad de Extremadura, 06006 Badajoz, Spain
3
Instituto Universitario de Investigación del Agua, Cambio Climático y Sostenibilidad (IACYS), Universidad de Extremadura, 06006 Badajoz, Spain
4
Instituto Dom Luiz (IDL), Universidade de Lisboa, 1749-016 Lisbon, Portugal
5
Departamento de Meteorologia, Universidade Federal do Rio de Janeiro, Rio de Janeiro 21941-916, Brazil
*
Author to whom correspondence should be addressed.
Climate 2026, 14(9), 174; https://doi.org/10.3390/cli14090174
Submission received: 29 June 2026 / Revised: 16 August 2026 / Accepted: 21 August 2026 / Published: 26 August 2026
(This article belongs to the Special Issue The Importance of Long Climate Records (Second Edition))

Abstract

Early instrumental meteorological observations are essential for identifying and characterizing extreme climate events prior to the modern observational era, particularly in regions where historical data are scarce. This study documents a remarkable late-spring heatwave using newly recovered daily temperature observations from Ferrol (northwestern Spain) for the period 1792–1795, retrieved from the Historical Archive of the Royal Institute and Observatory of the Spanish Navy. Despite the temporal limitations of this early dataset, its daily resolution enables a detailed analysis of short-term climatic variability and extreme temperature events. The analysis reveals an extraordinary warm episode in late May 1795, characterized by sustained positive temperature anomalies that stand out clearly against the surrounding days. Comparison with the modern climate indicates that the event was exceptional even by present-day standards, with mean temperatures approximately 2 °C above the current 95th percentile. To assess the spatial extent of the heatwave, we compared the Ferrol data with contemporaneous instrumental records from Madrid, Barcelona, and Cádiz. All three locations exhibit synchronous, pronounced positive anomalies, demonstrating that the 1795 event was a large-scale phenomenon affecting most of the Iberian Peninsula. This study highlights the critical value of historical data rescue for contextualizing modern climate extremes and extending our understanding of regional climate variability.

1. Introduction

Climate change and the increasing occurrence of extreme events are among the most pressing environmental challenges of our time [1,2,3,4,5]. The increasing availability of instrumental observations has made recent changes in climate and extreme events increasingly well documented and detectable [6,7,8,9,10], yet these records cover only a small fraction of the climate variability experienced over longer timescales. Understanding climate variability and extreme events prior to the modern observational era is essential for placing present-day climate in a long-term context, thereby allowing a more accurate assessment of the impacts of climate change [11,12,13]. While instrumental records from the 20th and 21st centuries often provide detailed and high-quality information on recent heatwaves and temperature extremes, their limited temporal extent restricts our ability to assess the full range of natural climate variability and the occurrence of rare or unusual extremes. Early instrumental weather observations from the 18th and 19th centuries provide a unique opportunity to bridge the gap between predominantly descriptive documentary evidence from earlier periods and the systematic instrumental measurements that became available later. Unlike purely qualitative sources, instrumental data allows a more objective characterization and comparison of extreme events using quantitative and reproducible criteria. While documentary evidence provides valuable qualitative descriptions of such events, early instrumental data are essential for quantifying their magnitude, persistence, and temporal structure.
For this reason, the recovery and analysis of early instrumental meteorological observations remain a key challenge for historical climatology, particularly for the study of pre-twentieth-century climate extremes [14]. Over recent decades, substantial progress has been made in rescuing early instrumental records from Europe and other regions (e.g., Canada, South Africa, Japan), enabling the documentation of past climate conditions and extreme events [15,16,17,18]. However, the spatial and temporal distribution of these records remains highly uneven.
Within this context, despite significant progress in the recovery of early Portuguese meteorological measurements [19,20] and Spanish datasets [17,21], the Iberian Peninsula exhibits pronounced spatial and temporal gaps in early instrumental coverage. Long or relatively continuous early series are restricted to a small number of locations, including Barcelona, Madrid, Cádiz–San Fernando, Gibraltar and Valencia. Outside these sites, early instrumental observations are often short, fragmentary, or poorly documented. This is particularly evident in northwestern Iberia, which remains one of the least represented regions in terms of pre-19th-century instrumental meteorological observations. This scarcity is particularly relevant for the study of temperature extremes, given the strong climatic variability experienced across the Iberian Peninsula during the final phase of the Little Ice Age (ca. 1300–1800) [22,23]. This period was characterized by strong interannual variability, cold winters and frequent hydroclimatic anomalies, but also by episodic warm extremes documented in historical sources [20,24,25,26,27].
Against this background, an important institutional hub for early meteorological observations in Spain was the Royal Observatory of the Spanish Navy (ROA, Real Instituto y Observatorio de la Armada), located in Cádiz–San Fernando. Since the late 18th century, the ROA has generated some of the longest and most consistent instrumental meteorological series in southern Europe [28,29,30,31,32]. Beyond the Cádiz–San Fernando site, the ROA archive preserves meteorological observations from other naval and astronomical observatories across Spain, many of which remain only partially studied. Among these, Ferrol (northwestern Spain) represents a valuable yet still understudied case. An important naval base in the late 18th century, Ferrol hosted an astronomical observatory primarily devoted to navigation and geodesy, where meteorological observations were systematically recorded as ancillary data to astronomical work. Domínguez-Castro et al. [17] first reported a short series of meteorological observations from Ferrol for 1788, highlighting the potential of this site for extending early instrumental climate information in northwestern Iberia.
Building on this earlier effort, the present study presents newly recovered daily instrumental temperature observations from Ferrol for the period 1792–1795, retrieved from original manuscript sources preserved in the Archive and Library of the Royal Institute and Observatory of the Spanish Navy (AHROA in Cádiz–San Fernando). Although the temporal coverage of the dataset is limited and uneven, the year 1795 provides a nearly continuous sequence of daily midday temperature measurements, offering a rare opportunity to examine short-term temperature variability and extreme warm events under pre-industrial conditions.
The primary objective of this study is to document and openly disseminate these newly recovered instrumental observations and to assess their capacity to reveal extreme temperature events [33,34]. In particular, the Ferrol dataset allows the identification and characterization of an exceptionally warm late-spring episode occurring in May 1795. By combining the Ferrol observations with independent contemporaneous instrumental data from Madrid, Barcelona and Cádiz, this study evaluates the spatial coherence of the event across the Iberian Peninsula. The concurrent signal identified in the independent records from Berlin and Central England further suggests that the event was not confined to Iberian Peninsula but had a broader European extent. Furthermore, recent studies have highlighted that heatwaves occurring in late spring and early summer are becoming increasingly relevant in Western Europe, including the Iberian Peninsula, as the seasonal timing of extreme heat is shifting and events in May and June are beginning to resemble the characteristics of traditional midsummer heatwaves [35,36]. This highlights how targeted data-rescue efforts can provide robust evidence of historical climate extremes and contribute to a more complete understanding of the temperature variability beyond the modern observational period.

2. Material and Methods

2.1. Historical Instrumental Temperature Observations

2.1.1. Ferrol Observations (1792–1795)

Daily instrumental temperature observations from Ferrol were recovered from original manuscript sources preserved in the Archive and Library of the Royal Institute and Observatory of the Spanish Navy (AHROA). These records were produced in the context of astronomical observations carried out at the Ferrol observatory (~43.48, −8.21 WGS84 EPSG:4326) during the late 18th century, where meteorological measurements were usually recorded as ancillary information, typically at midday.
Four different documentary sources were identified, partially overlapping in time and differing in continuity. Together, they span the period 1792–1795, although with substantial gaps in the earlier years.
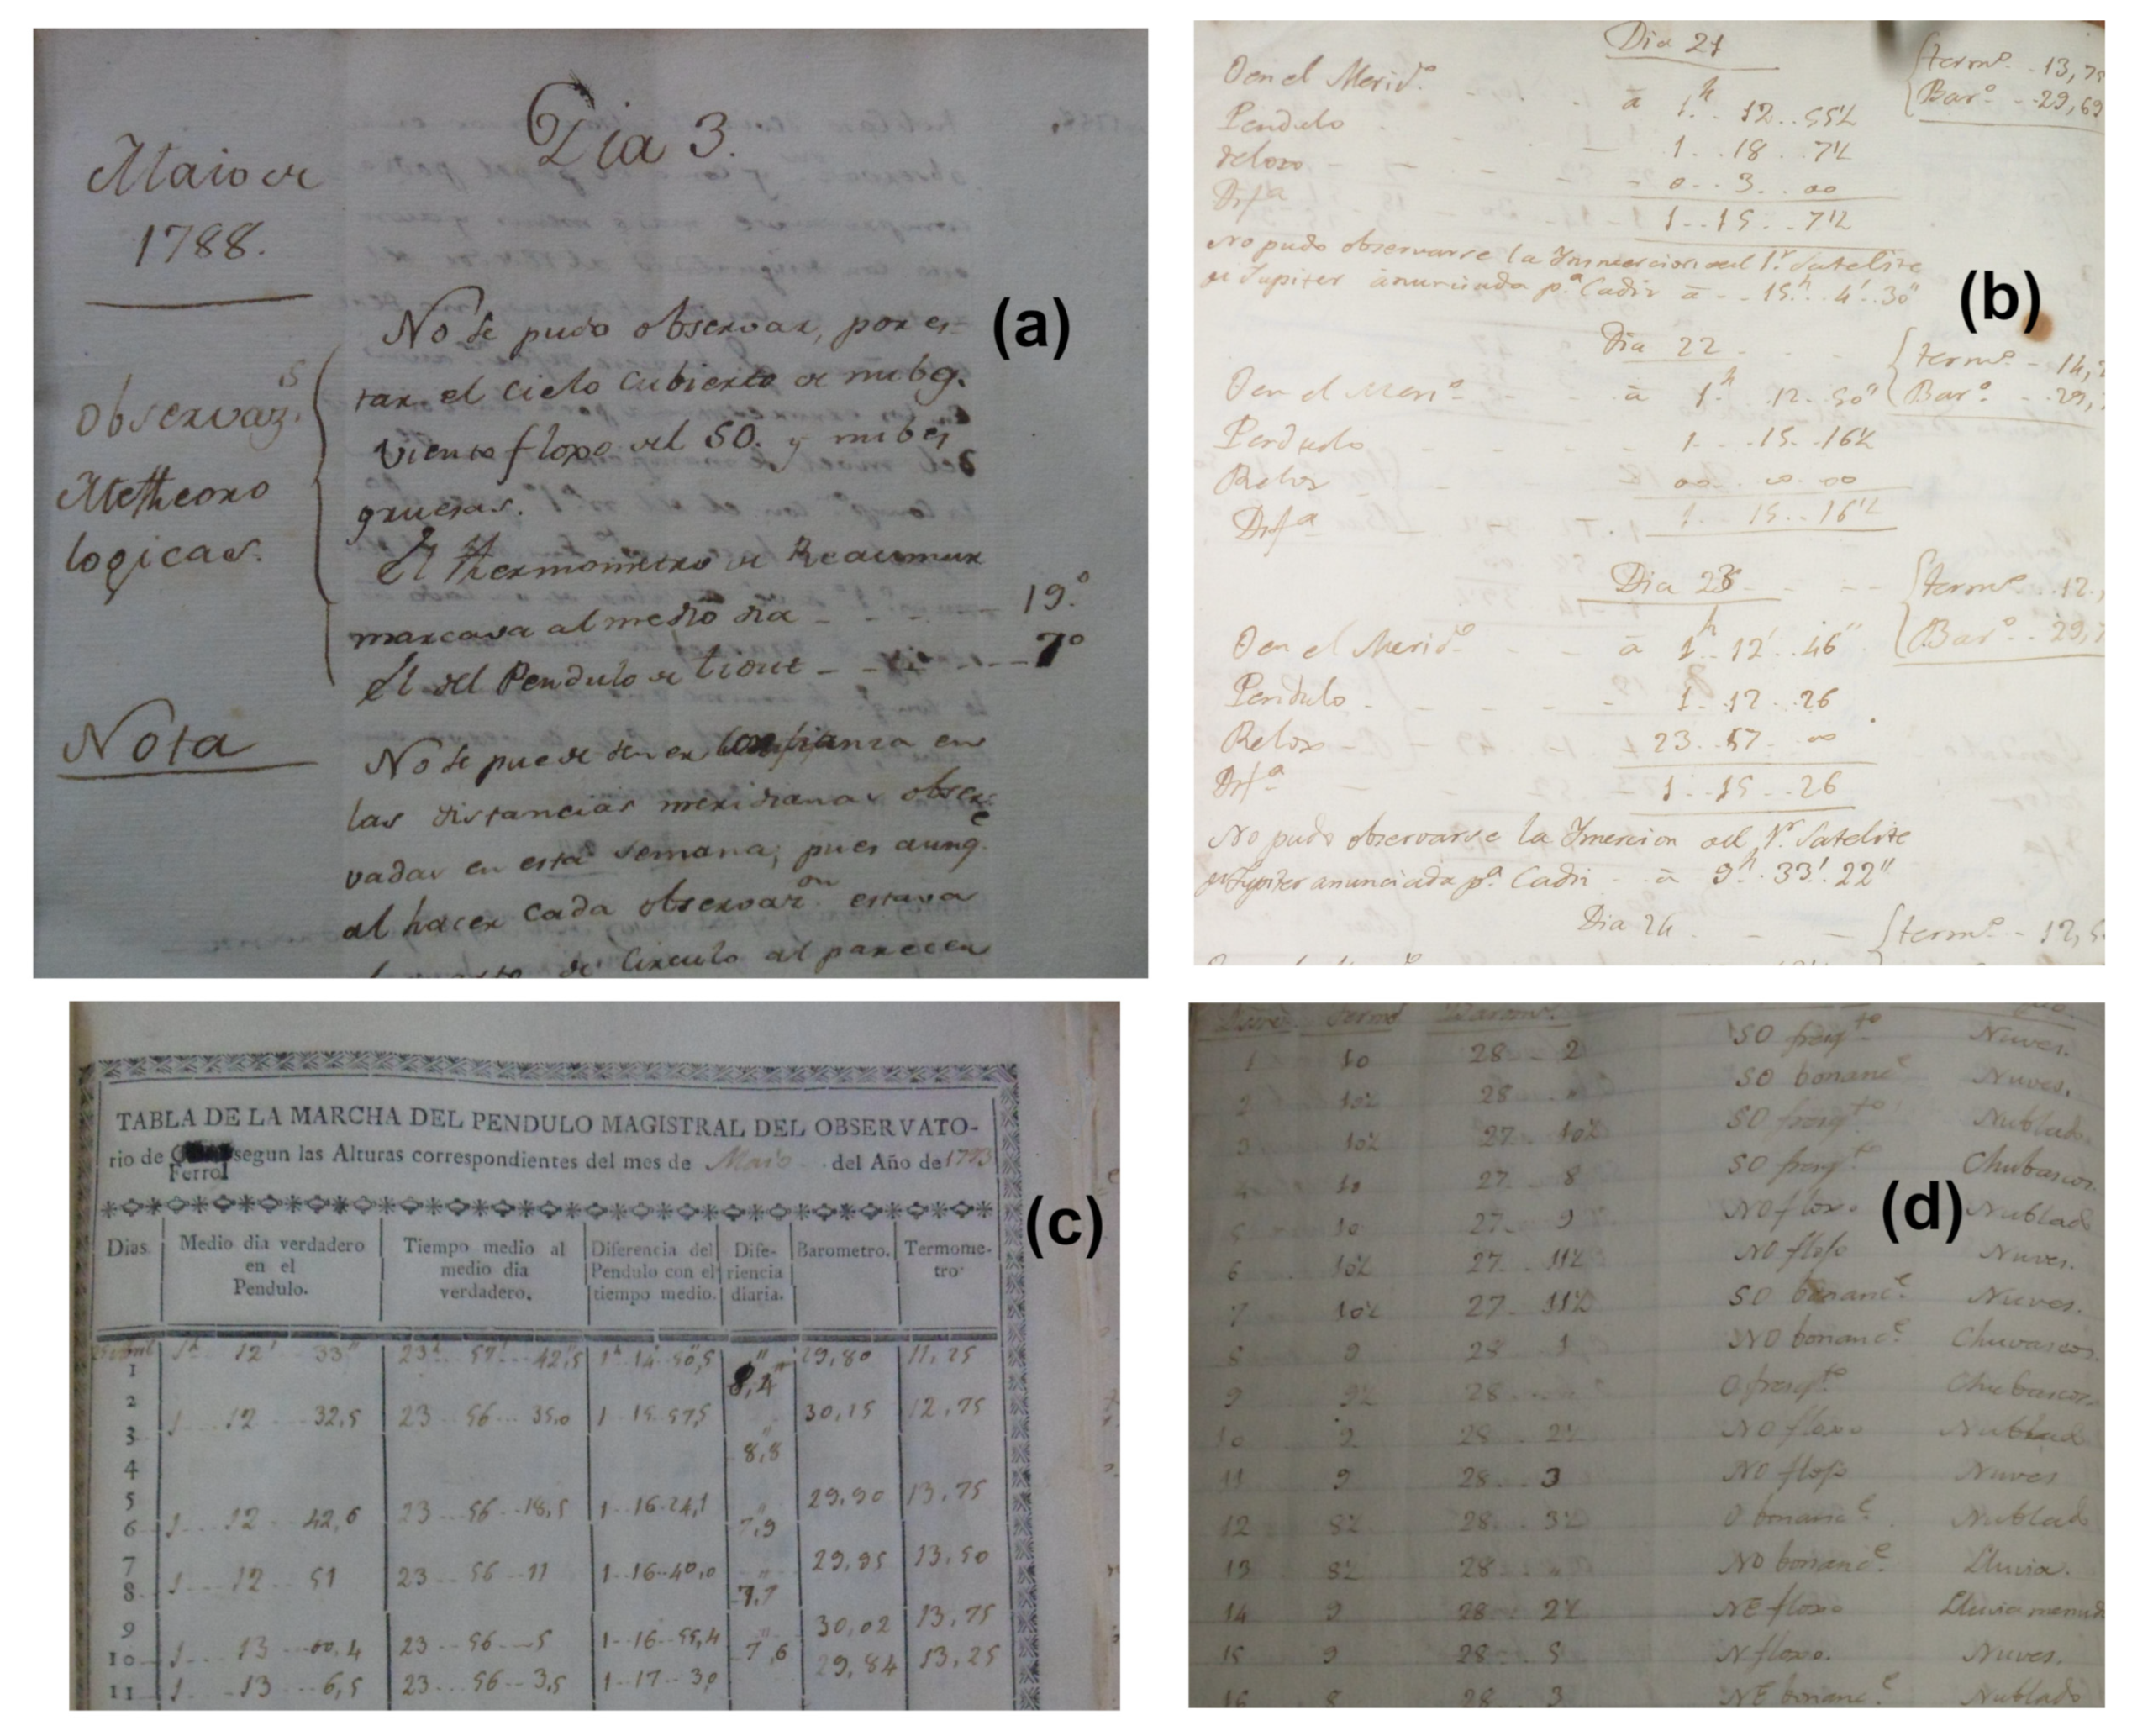
Sources 1 and 2 correspond to astronomical logbooks (“Diario de las Observaciones Astronómicas hechas en este Observatorio del Ferrol” and “Diario de las observaciones hechas en este Observatorio”), in which meteorological readings were recorded sporadically, generally limited to a single midday temperature value. Source 1 spans November 1792–July 1793 and contains 57.3% missing data, whereas Source 2 spans November 1792–December 1793 with 41.5% missing data.
Source 3 (“Marcha del Péndulo Magistral de este Observatorio”) contains temperature and pressure data recorded to monitor the behaviour of the observatory pendulum and provides observations between July 1792 and July 1793, with 71.8% of missing data. Although temporally restricted, this source offers additional independent temperature information for the early part of the study period.
Source 4 consists of a set of meteorological tables containing one midday temperature observation per day from 1 January 1794 to 31 December 1795, with only 16.8% of missing data. This is the only source in which meteorological observations were not ancilliary to astronomical purposes and represents the most homogeneous and internally consistent dataset recovered for Ferrol.
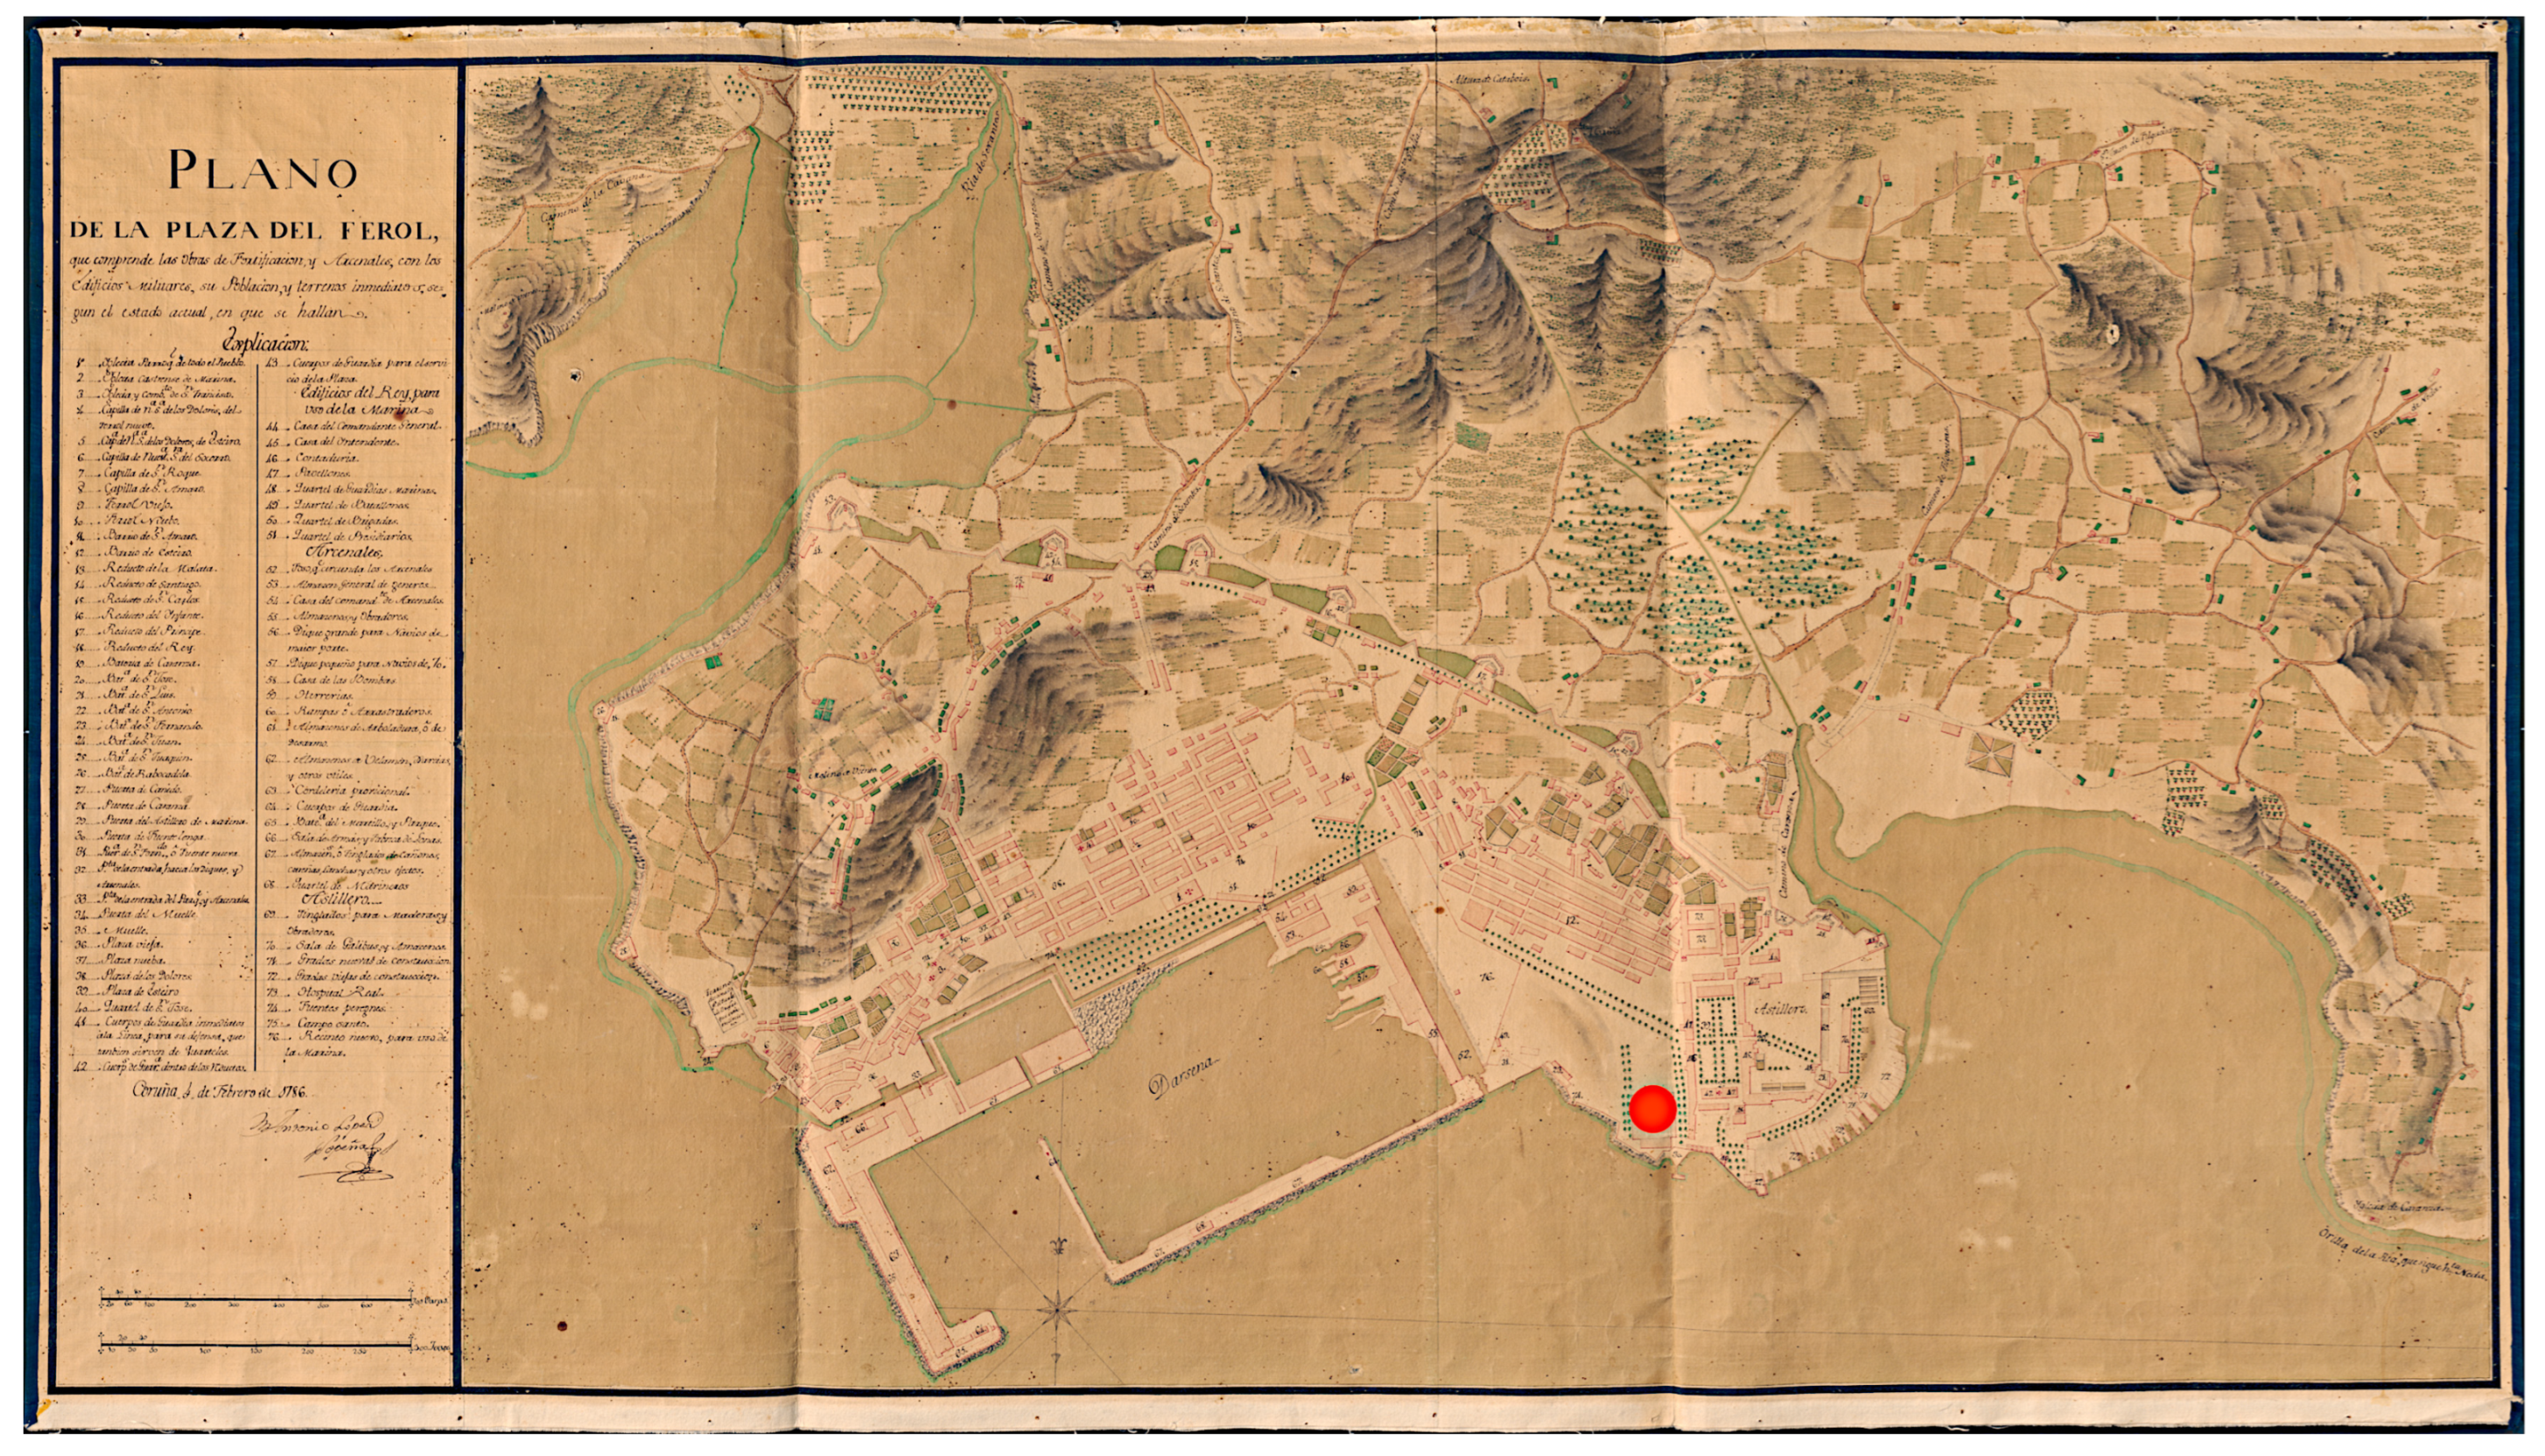
Figure 1 shows an old map of the “Arsenal de Ferrol” in 1722. The red dot indicates the approximate location of the Astronomical Observatory. Also Figure 2 shows images of sources 1 (a), 2, (b), 3 (c) and 4 (d).
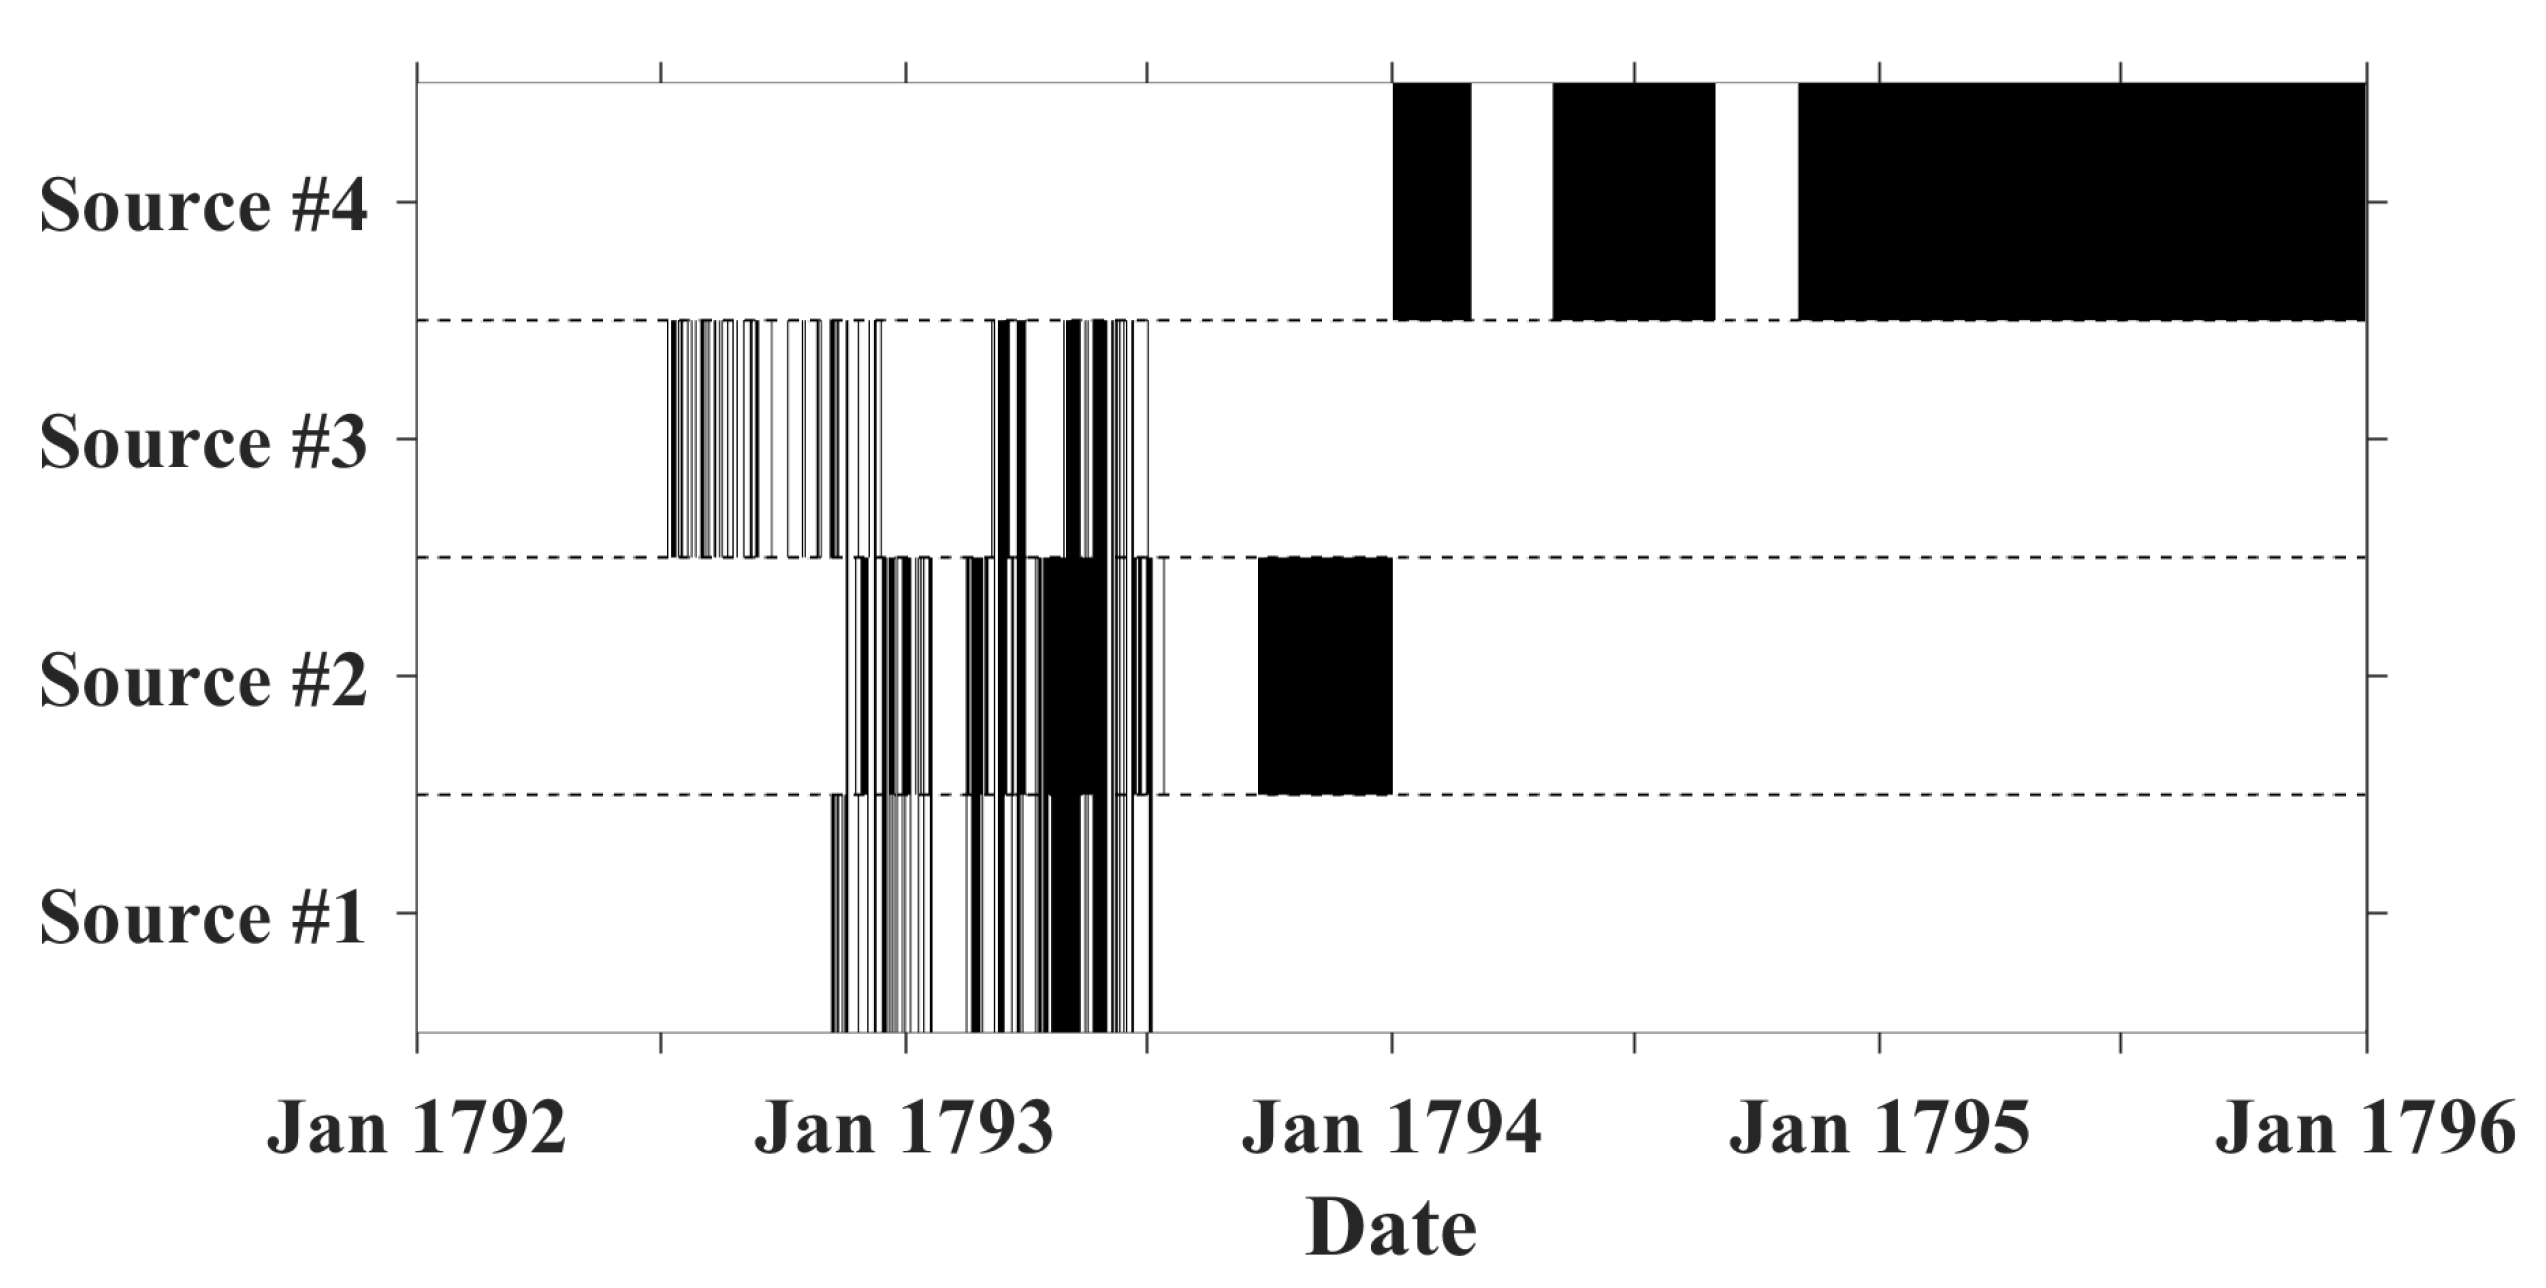
As illustrated in Figure 3, the temporal distribution of the available observations shows marked variability in data coverage across the study period. Source 4 provides an almost complete daily record for 1795, together with substantial coverage for 1794. In contrast, Sources 1, 2 and 3 jointly provide the bulk of the observations for 1793, while 1792 remains clearly underrepresented. For this reason, 1795 constitutes the primary year for the analysis of short-term thermal variability and extreme events because it provides the most complete observational record. The years 1792–1794 are also included, as they contain relevant information on thermal variability and extreme events, although with more limited data coverage, thereby providing additional temporal context for the analysis.

2.1.2. Instrumental Uncertainty and Observational Context

The interpretation of late-18th-century instrumental temperature observations is inherently affected by biases and uncertainties related to instrumentation, exposure and observational practices. For the Ferrol records, detailed metadata concerning thermometer type, calibration procedures, shielding and precise exposure (indoor versus outdoor) are not available.
Contemporary annotations indicate that temperature was measured using a spirit thermometer graduated on the Réaumur scale, which was commonly employed in Spain during the late 18th century [17]. They were converted to degrees Celsius (°C) using the standard linear conversion (°C = 1.25 × °Ré) to facilitate comparison with modern datasets.
Spirit thermometers based on alcohol, when calibrated at melting ice and boiling water temperatures, are known to exhibit non-linear behaviour at higher temperatures, potentially leading to negative biases, indicating an underestimation of the true value under warm conditions of up to −3 °C. Conversely, positive biases (+0.9 °C) are typically observed at low temperatures for this type of thermometer [37,38]. These effects appear to be less pronounced in alcohol thermometers calibrated using human body temperature as the upper fixed point [39,40]. In addition, the absence of information regarding radiation shielding implies that some contribution from solar heating cannot be excluded, particularly during late spring and summer. For example, Prohom et al. [41] showed that, relative to the classic Stevenson screen, the bias in summer maximum temperatures depends heavily on the presence and type of thermometer shielding. This effect ranges from +0.5 °C for wall-mounted configurations to −1.04 °C for open exposures, with negative values denoting that maximum temperatures are systematically lower within Stevenson screens. This highlights the potential existence of a negative bias in measurements taken during the warmer seasons, contrasted with an eminently positive bias during the cooler periods of the year.
Furthermore, regarding measurement uncertainty, the lack of detailed historical metadata concerning both the thermometer characteristics and its specific exposure configuration precludes a robust quantitative estimation of this variance. Consequently, these temperature values must be interpreted with caution, particularly when analyzing long-term climate trends or seasonal extremes.
In this study, emphasis is therefore placed on the identification of persistent temperature anomalies and their temporal continuity, rather than on the precise absolute magnitude of individual measurements. Furthermore, the interpretation of exceptional events is supported by the assessment of spatial coherence across independent observational sites. This combination of temporal persistence and regional consistency is considered more robust than isolated daily values and allows meaningful interpretation despite the limitations inherent to early instrumental data [12,37]. Whenever possible, interpretation is therefore based on relative anomalies, persistence and cross-site coherence rather than on absolute temperature values.

2.2. Comparative Temperature Data from the Iberian Peninsula

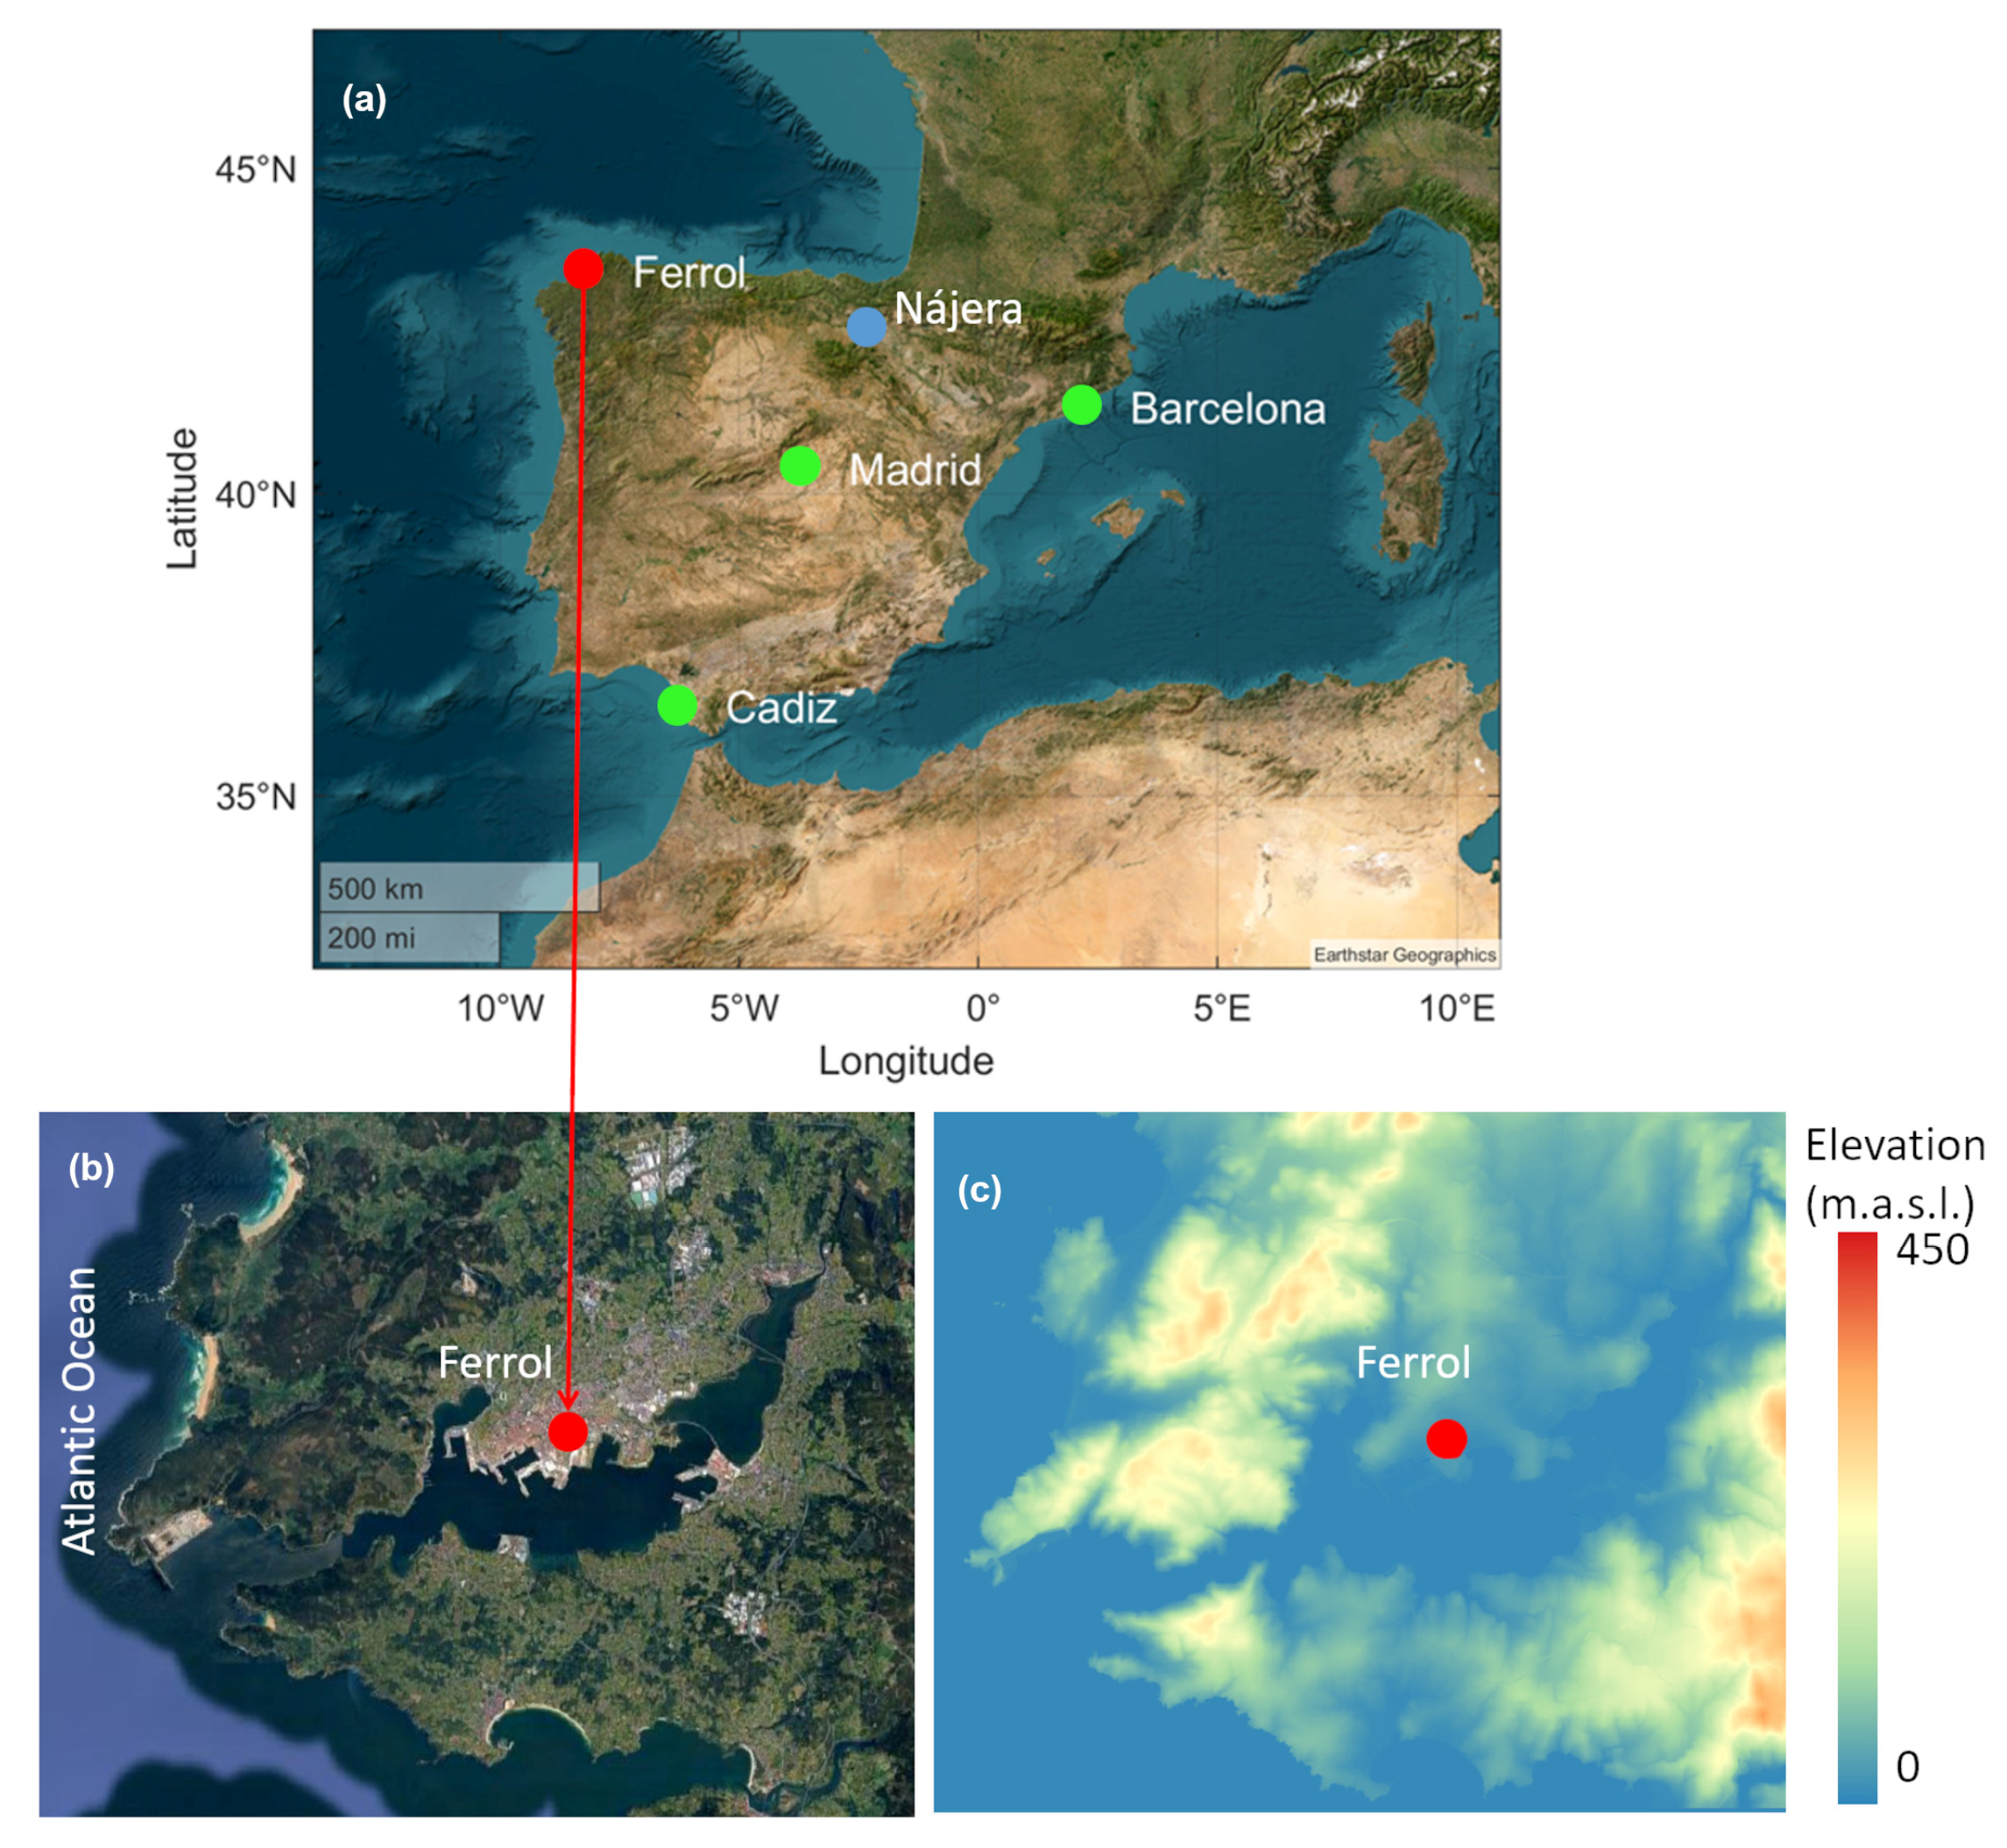
To assess whether the exceptionally warm late-spring episode identified in Ferrol reflects a local anomaly or a broader-scale phenomenon, contemporaneous instrumental temperature data from other Iberian locations were also examined and used as an independent reference. These include Madrid (40.41, −3.68; WGS84—EPSG: 4326, 657 m.a.s.l.), Barcelona (41.39, 2.19; WGS84—EPSG: 4326; 5 m.a.s.l.) and Cádiz (36.52, −6.28; WGS84—EPSG: 4326; 12 m.a.s.l.), which host some of the longest early instrumental temperature series in the Iberian Peninsula. Altogether, these sites represent contrasting geographic and climatic settings. Ferrol is located in the northwestern part of the Iberian Peninsula on the Atlantic coast, in a low-relief area with elevations ranging from 0 to 100 m (Figure 4b,c). Cádiz is situated along the southwestern Atlantic coast of the Iberian Peninsula, Madrid represents an inland site on the central plateau, and Barcelona is located on the northeastern Mediterranean coast. Together, these sites encompass a range of geographical and climatic settings across Spain. The geographic distribution of the four locations considered in this study is shown in Figure 4a. The spatial distribution highlights the broad geographic extent used to assess the regional coherence of the late-May 1795 warm event.
Daily midday temperature data for Madrid were extracted from the Diario de Madrid for May and the first half of June during the period 1790–1799 (https://hemerotecadigital.bne.es/hd/es/advanced (accessed on 15 August 2026)). These data, originally observed at the Royal Botanical Garden of Madrid, were digitized specifically for this study but are not newly recovered records.
Temperature observations for Barcelona were obtained from the instrumental series recorded by Francisco Salvá y Campillo and published in the Diario de Barcelona (https://arca.bnc.cat/arcabib_pro/publicaciones/numeros_por_mes.do?idPublicacion=384 (accessed on 20 August 2026)) for the period 1793–1799. These data, measured at 14:00 local time, have been previously recovered and analyzed in detail by other authors. The daily series used in the current study does not present any gap, allowing for a reliable estimation of late-18th-century temperatures [41].
Daily temperature data for Cádiz were extracted from manuscript AH1076 preserved at the AHROA, covering the period 1789–1795. Although these records have been documented in previous studies, they provide an additional coastal reference for southern Iberia during late May 1795.
To complement the instrumental records, qualitative documentary evidence was gathered from two historical sources. First, the personal diaries of Gaspar Melchor de Jovellanos provide contemporary descriptions of unusually warm weather in Nájera (see Figure 4a) between 21 and 24 May 1795 [42,43]. Details are shown in Appendix A. Second, the final folio of Source 4 explicitly records ‘extraordinary heat’ in Ferrol during late spring, detailing its specific impacts on public health and regional agriculture (see Appendix B). These qualitative observations reinforce the instrumental records and offer further insight into the social perception and lived experience of the heatwave at the time, underscoring its historical significance.
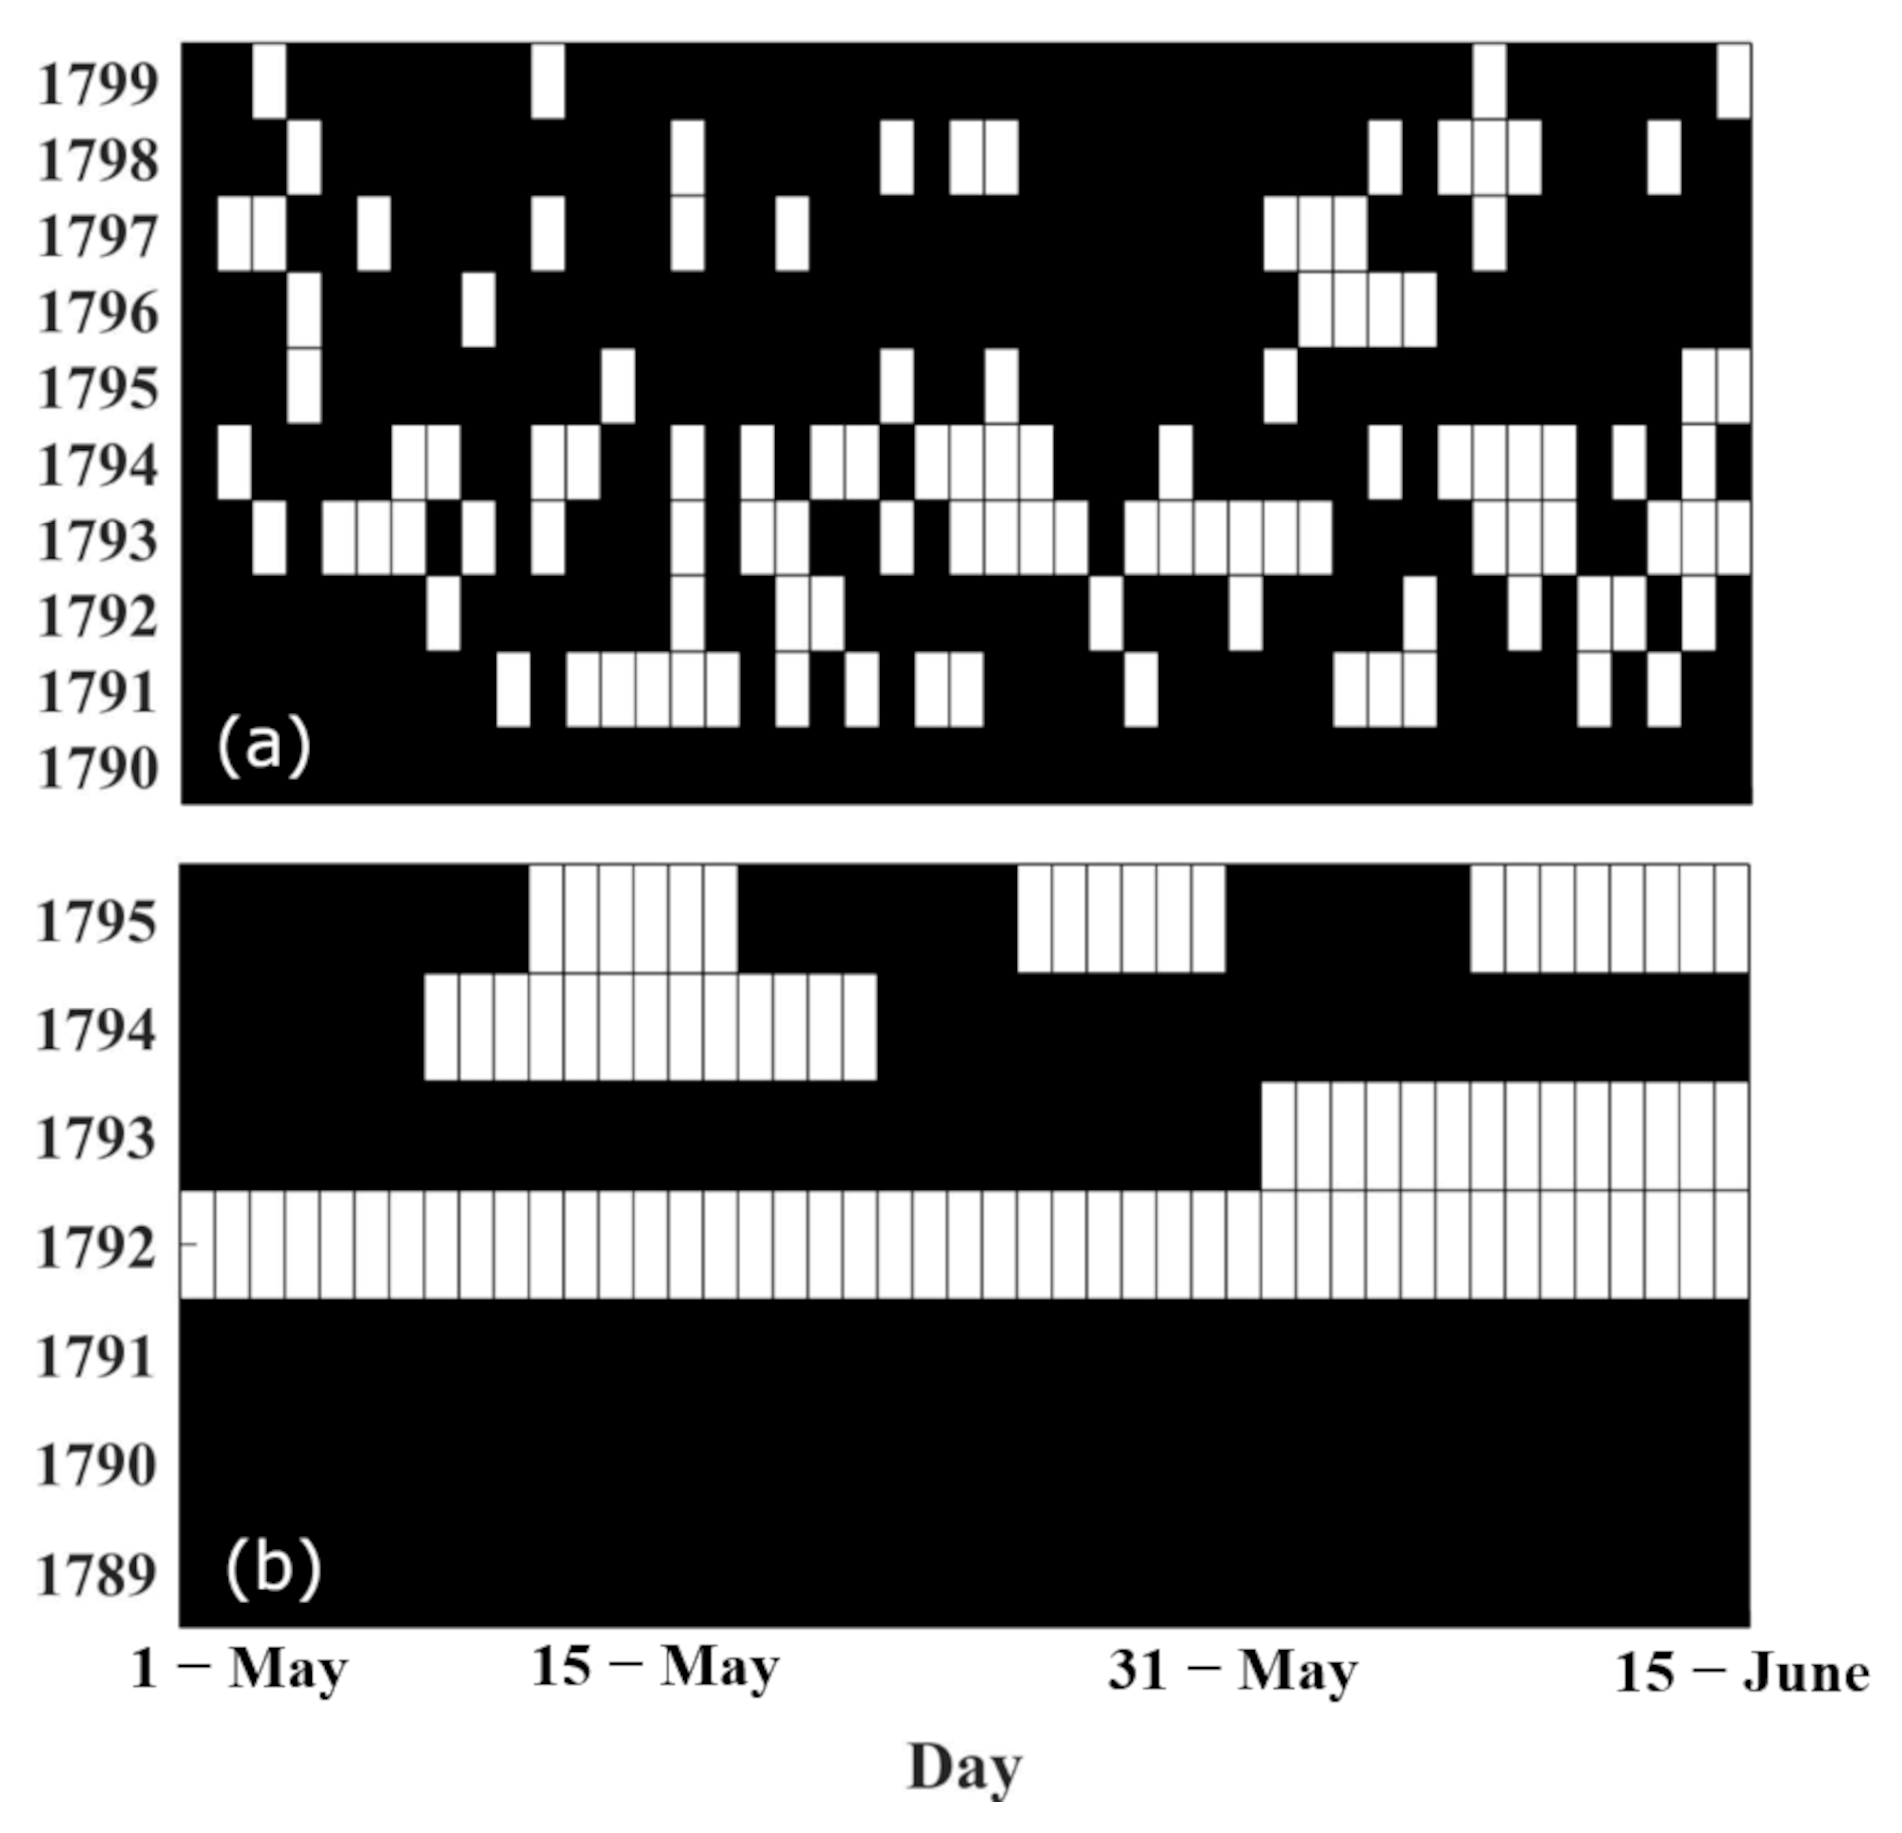
Figure 5 presents the temporal coverage of the instrumental temperature records available for May and the first half of June at the Iberian sites considered in this study. Black markers denote days with recorded observations, while blank intervals represent missing data. The comparison highlights differences in data completeness between the Madrid (1790–1799) and Cádiz (1789–1795) series. By contrast, the Barcelona daily temperature record is continuous and free of gaps, providing a reliable basis for reconstructing and analyzing late-eighteenth-century temperature conditions [41].

2.3. Modern Reference Data and Percentile Thresholds

To place the historical observations in a contemporary context, present-day temperature data from the Ferrol meteorological station (43.49, −8.252; WGS84—EPSG: 4326; 37 m.a.s.l.) were obtained from the MeteoGalicia network (https://www.meteogalicia.gal/web/home). Ten-minute temperature measurements covering the period 2000–2024 were used to construct a modern diagnostic reference dataset. To ensure consistency with the historical records, a “midday temperature” was defined as the average temperature recorded between 12:00 and 13:00 UTC. This interval closely approximates the timing of the historical midday measurements and provides a suitable proxy for daily maximum temperature in this coastal region.
Although the modern reference data are derived from a present-day MeteoGalicia station and the historical observations were recorded at the astronomical observatory of the naval base, the two sites are located within the same urban coastal environment of Ferrol and are separated by a distance of approximately 3.5 km.
For each calendar day of the year, the 5th, 50th, and 95th percentiles of midday temperature (hereafter T5, T50, and T95, respectively) were calculated from the modern dataset. To reduce short-term variability and ensure a robust estimation of the climatological thresholds, a ±14-day moving window was applied. Potential extreme temperature events were subsequently identified as days on which midday temperature exceeded the T95 threshold (warm extremes) or fell below the T5 threshold (cold extremes). In this study, the modern dataset is used exclusively as a diagnostic reference for percentile-based thresholds, and the analysis focuses on relative exceedances and temporal persistence rather than on absolute temperature values.

2.4. Identification of Extreme Warm Events and Analytical Approach

There is no universally accepted definition of a heatwave, and existing definitions vary depending on region, season and application [44]. In this study, a commonly used percentile-based criterion is applied retrospectively as an operational diagnostic tool. Specifically, a heatwave is defined as a period of at least three consecutive days during which midday temperatures exceed the present-day 95th percentile (T95) for the corresponding calendar day following a commonly used percentile-based diagnostic approach [45].
This definition is not intended to imply direct physical or societal equivalence between historical and modern heatwaves. Rather, it provides a consistent and transparent framework for identifying unusual heat episodes in early instrumental records and for facilitating comparison with present-day conditions. This approach is widely used in studies of weather and climate extremes and provides a consistent diagnostic framework for identifying rare heat events in both historical and modern datasets [46]. The analytical framework focuses on identifying periods of persistent exceedance of modern percentile thresholds in the Ferrol record.

3. Results

3.1. Midday Temperature Variability in Ferrol During 1792–1795

The newly recovered instrumental temperature observations from Ferrol allow an assessment of midday temperature variability during the period 1792–1795, although with markedly uneven temporal coverage. As described in Section 2, only the year 1795 provides an almost continuous daily record, while earlier years contain substantial gaps used primarily for contextual purposes. Figure 3 (Section 2) shows the distribution of available observations across the study period and highlights the dominant contribution of 1795. Within this framework, the analysis of thermal variability focuses on identifying periods of persistent temperature anomalies rather than on constructing climatological averages.
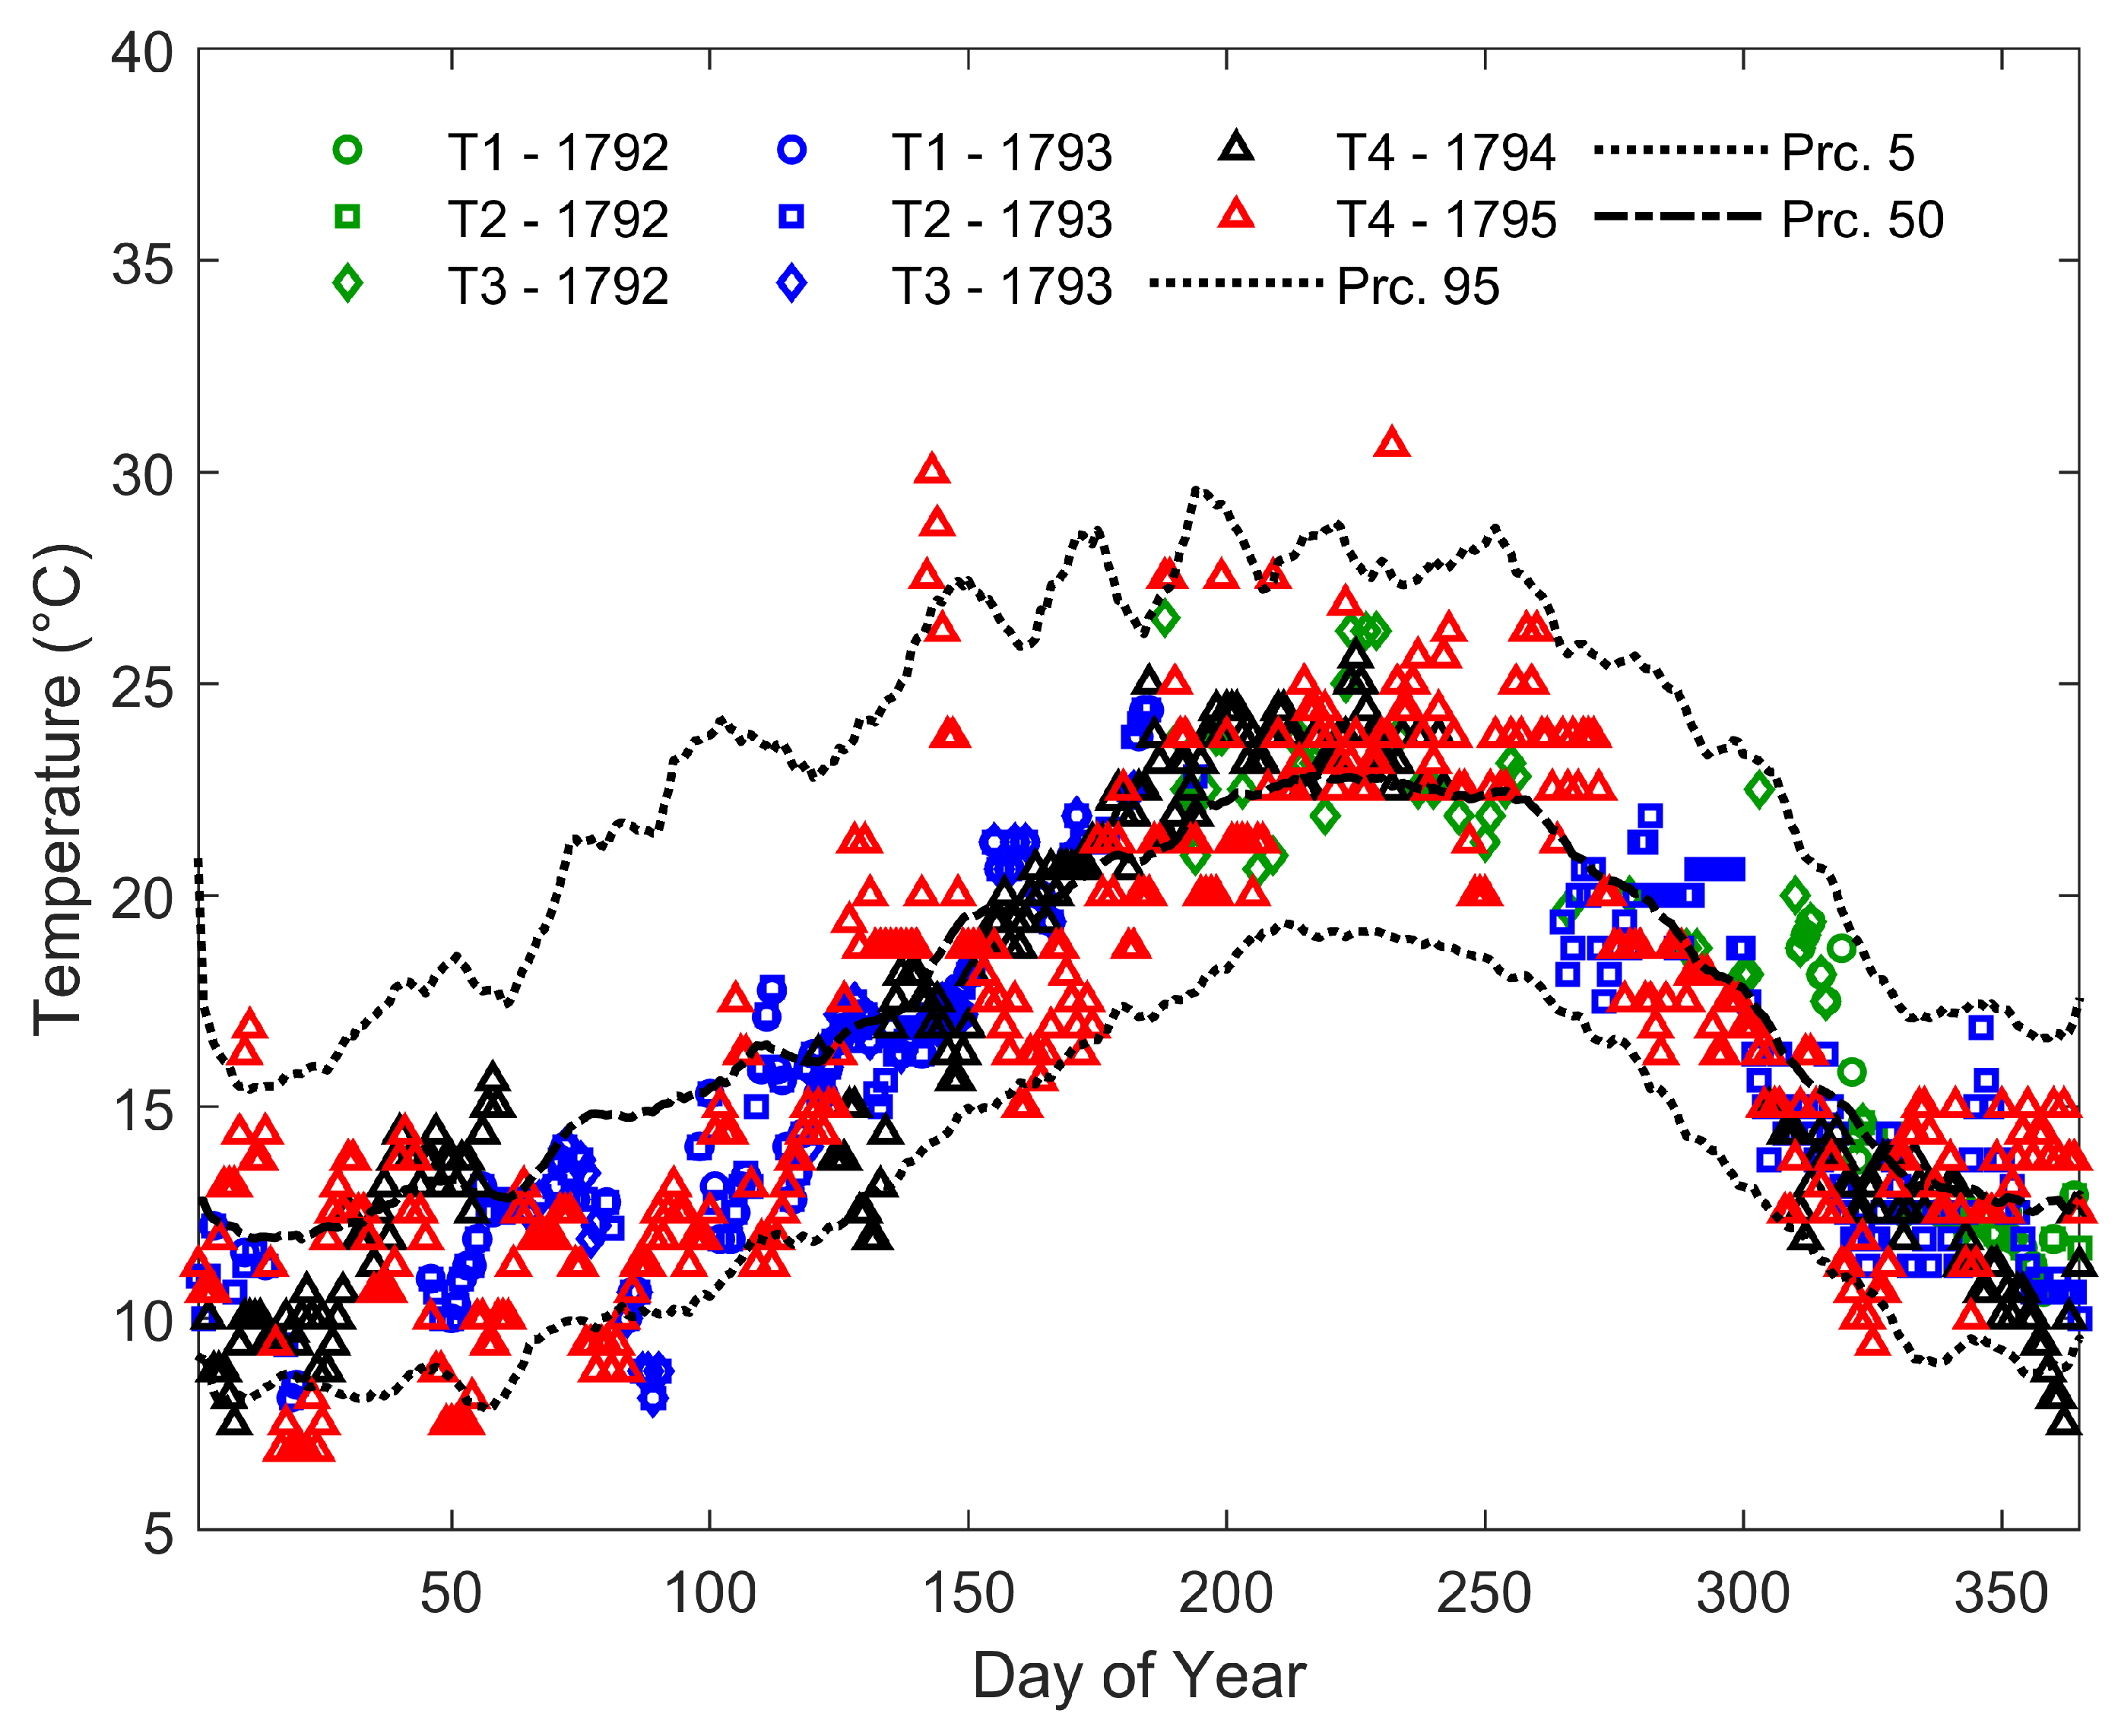
To place the historical observations in a modern context, midday temperatures recorded in the period 1792–1795 were compared with present-day percentile thresholds (T5, T50 and T95) derived from the 2000–2024 MeteoGalicia dataset. This comparison is shown in Figure 6.
Most midday temperatures recorded in the period 1792–1795 fall within the modern interpercentile range (T5–T95): ~94%. However, as shown in Figure 6, several excursions beyond the climatological thresholds are evident. Most of these correspond to temperatures below the T5 threshold (approximately 50 days), whereas exceedances of the T95 threshold are considerably less frequent (approximately 9 days). Figure 6 further indicates that all warm-extreme events (i.e., temperatures above T95) are associated with records from source T4, while no such exceedances are observed in data derived from sources T1, T2, or T3.
Given their greater potential societal impacts, including risks to human health and resource availability, the following analysis focuses on temperatures exceeding the T95 threshold, while excursions below T5 are not considered further.
Several exceedances above the 95th percentile were identified in the 1795 temperature record, occurring in January, May, July, and August. The most remarkable event took place in late May, when temperatures exceeded the threshold on three consecutive days (22–24 May), reaching a maximum anomaly of 3.1 °C above the percentile-based threshold distribution. This episode satisfies the operational heatwave definition (Section 2.4), meeting both the intensity and persistence criteria. An anomaly of similar magnitude (3.1 °C) was recorded in August 1795; however, it was restricted to a single day and therefore did not fulfil the persistence criterion required for heatwave classification. The remaining exceedances identified in January and July were also short-lived and failed to meet the persistence requirement. No other period within the available record exhibited consecutive exceedances of comparable duration and magnitude. During the late-May event, the mean midday temperature reached 28.8 °C, approximately 2.0 °C above the present-day 95th percentile climatological threshold (26.3–27.0 °C for the corresponding calendar days). In contrast, temperatures during the two-week periods preceding and following the event averaged ~19 °C, consistent with the regional historical climatology (see explicitly vol. II, p. 72, in reference [47]). Relative to this baseline, the event corresponds to an absolute anomaly of approximately +9 °C.
The persistence of elevated temperatures over several consecutive days, rather than an isolated extreme value, supports the interpretation of this episode as an exceptional warm event rather than an artefact of individual measurements. This interpretation is further reinforced by the independent assessment of spatial coherence presented below.

3.2. Regional Coherence of the May 1795 Heatwave

Heatwaves are typically associated with large-scale atmospheric conditions and rarely remain confined to a single location. To evaluate whether the late-May 1795 heatwave identified in Ferrol was a local anomaly or part of a broader-scale event, contemporaneous instrumental temperature records from Madrid, Barcelona and Cádiz were examined.
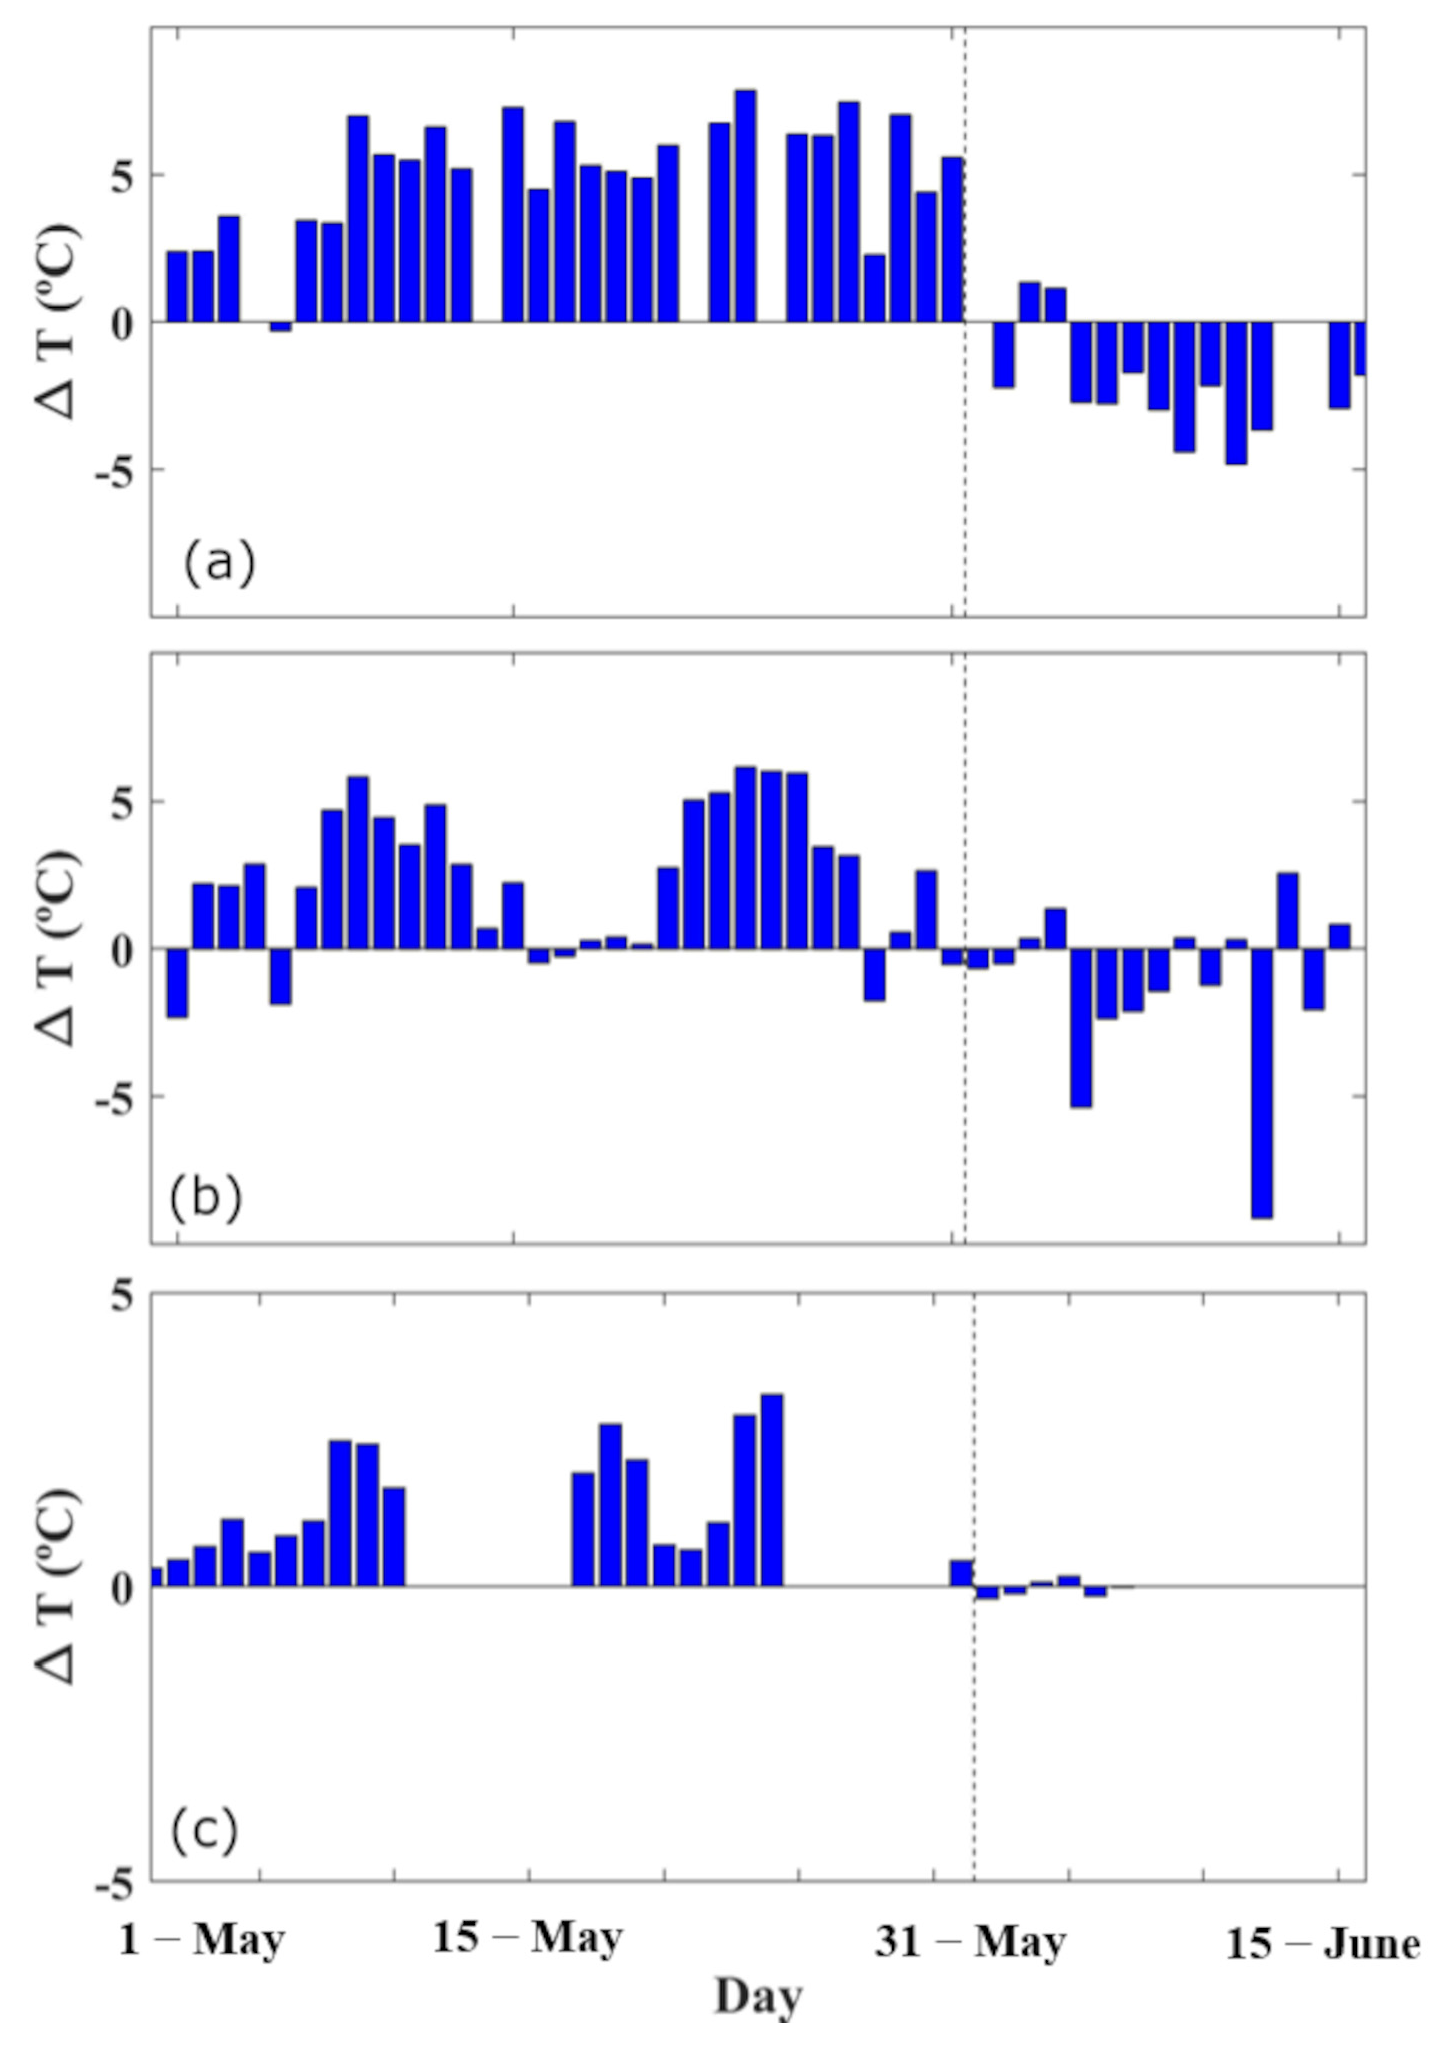
Figure 7 shows daily temperature anomalies for Madrid, Barcelona and Cádiz during May and the first half of June 1795, calculated relative to their respective late-18th-century reference periods (1790–1799 for Madrid, 1793–1799 for Barcelona and 1789–1795 for Cádiz). The use of independent observational sources and distinct local practices at each site reduces the likelihood that the observed synchronicity arises from shared instrumental or methodological artefacts.
In Madrid, a pronounced positive anomaly is observed during late May, with a peak of approximately +7.9 °C on 23 May. Similarly, Barcelona exhibits a marked positive anomaly during the same period, with a maximum of around +6.0 °C on 23 May. In both cases, temperatures return to near- or below-average values during early June.
Although the Cádiz record is less complete, available observations also indicate positive temperature anomalies during 23–24 May, with mean values of approximately +3 °C relative to the local reference period. These results, taken together, demonstrate that the heat anomaly identified in Ferrol coincided with unusually high temperatures across geographically distinct regions of Spain.
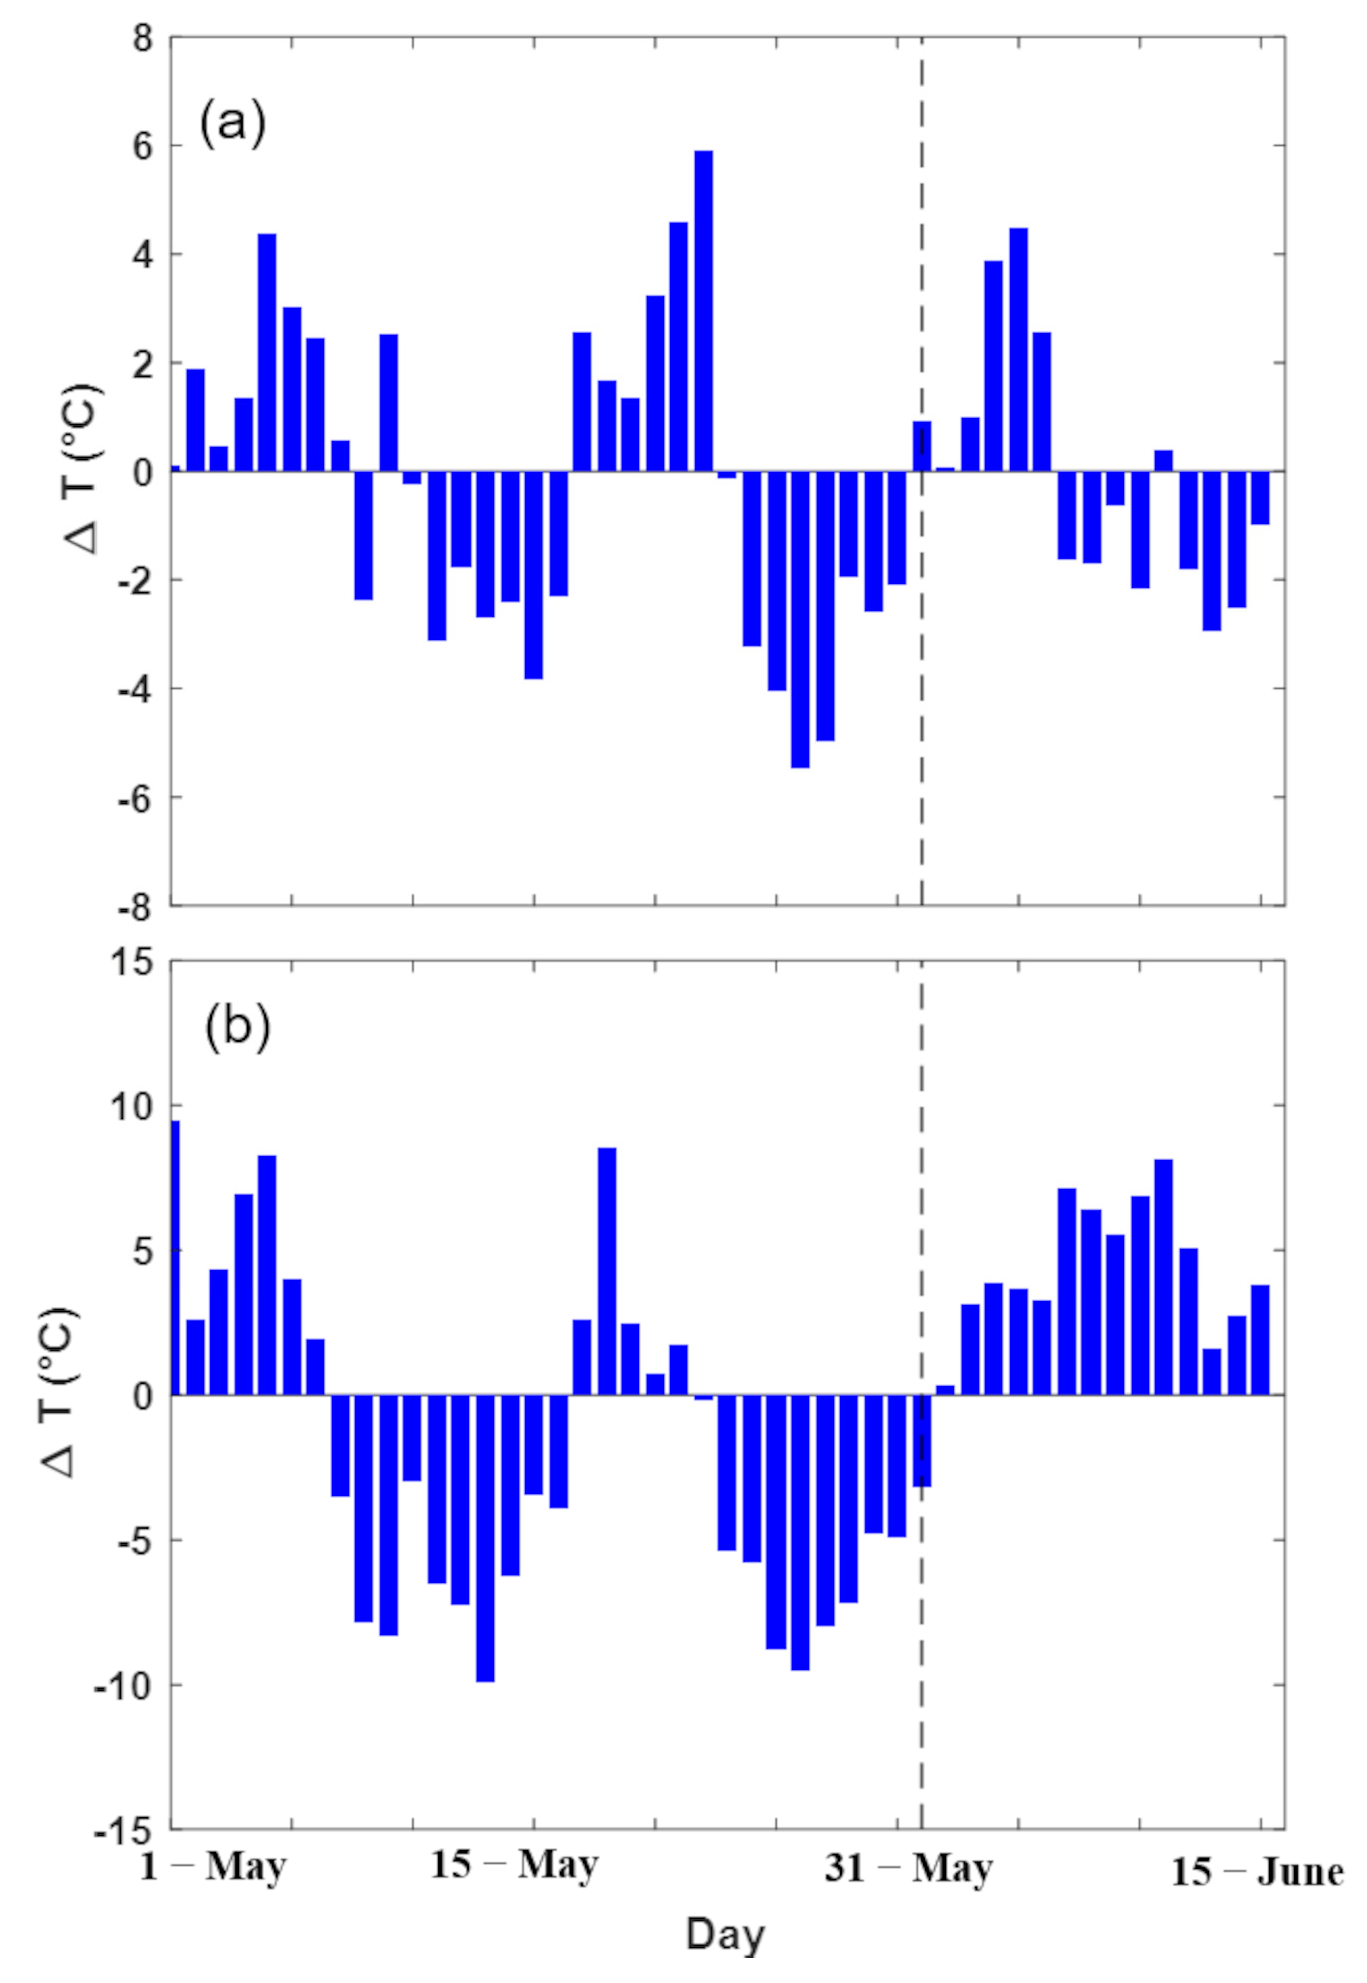
Figure 8 presents the daily temperature anomalies for the Central England Temperature (CET) record [48,49,50,51] and the Berlin series [52], following the same methodology as in Figure 7. For both records, anomalies were calculated relative to the 1789–1799 reference period. The CET record exhibits a maximum positive anomaly of approximately 6 °C on 23 May 1795, whereas the Berlin series reaches a peak anomaly of about 8 °C on 19 May 1795. In the CET record, the maximum anomaly is preceded by persistently positive anomalies beginning on 17 May, indicating a prolonged warm episode. In contrast, the Berlin peak is comparatively short-lived, with substantially smaller positive anomalies (0.7–2.6 °C) recorded from one day before to three days after the maximum.
The temporal synchronicity and spatial consistency of the anomalies provide strong evidence that the late-May 1795 heatwave was a large-scale event affecting a substantial portion of the peninsula, rather than a localized or purely instrumental feature.

4. Discussion

The recovery of early instrumental meteorological observations remains a fundamental challenge for historical climatology, particularly in regions where systematic measurements were scarce prior to the mid-19th century. In this context, the newly recovered temperature observations from Ferrol (northwestern Spain), spanning the period 1792–1795, represent a significant contribution to the extension of instrumental climate records in a historically underrepresented region of the Iberian Peninsula. By making the complete dataset openly available through a public repository [53], this study facilitates transparency, reproducibility and future integration of early instrumental observations into regional and continental-scale analyses of climate extremes.
Although the recovered Ferrol dataset is limited in duration and uneven in temporal coverage, it constitutes the only known instrumental temperature record for this Atlantic region during the late 18th century. The recovery, digitization and documentation of these observations therefore fill an important spatial gap in early instrumental coverage and provide a new reference point for climate studies in northwestern Iberia.
The scientific value of the Ferrol record lies in its capacity to document observed temperature variability and short-lived extreme events during periods of dense observational coverage. In particular, the year 1795 stands out as the only year with an almost continuous daily series of midday temperature measurements, offering a rare opportunity to examine high-frequency temperature behaviour under pre-industrial conditions.
Within this framework, the Ferrol dataset enables the identification of a late-spring heatwave occurring between 22 and 24 May 1795. During these three consecutive days, midday temperatures exceeded the present-day 95th percentile threshold, fulfilling a commonly used operational criterion for heatwave identification [46]. The persistence of exceedance over multiple days distinguishes this episode from isolated extreme values and supports its interpretation as a genuine heatwave rather than an artefact of individual measurements.
The magnitude of the May 1795 heatwave event is particularly noteworthy. Average midday temperatures during the episode exceeded the modern threshold by approximately 2.5 °C and were associated with local anomalies approaching +9 °C relative to surrounding conditions, consistent with historical estimates for late spring temperatures in the region [47]. Furthermore, the exceptional nature of this historical event becomes evident when contextualized within the contemporary climate framework; during the 2000–2025 period, the midday temperature threshold of 30 °C was exceeded in May with a frequency of only ~1.3%. This underscores that even under recent accelerated warming, events of this magnitude remain highly anomalous for late spring.
A key element reinforcing the robustness of the event is its spatial coherence across the Iberian Peninsula. Independent instrumental records from Madrid, Barcelona and Cádiz reveal pronounced positive temperature anomalies occurring synchronously with the Ferrol episode. The temporal alignment of peak anomalies on 23 May 1795 across geographically distant locations strongly suggests the influence of large-scale atmospheric conditions, consistent with the synoptic nature of heatwaves documented in modern climatology [44]. This regional coherence provides a critical line of evidence supporting the interpretation of the event, particularly in the context of early instrumental data with limited metadata.
Also, the comparison with the Central England Temperature (CET) [48,49,50,51] and Berlin [52] records indicates that the late May 1795 warm episode extended beyond the Iberian Peninsula. Differences in the timing and persistence of the temperature anomalies among the three records suggest regional variability in the evolution of the event, although its occurrence over a broad area points to the influence of large-scale atmospheric circulation.
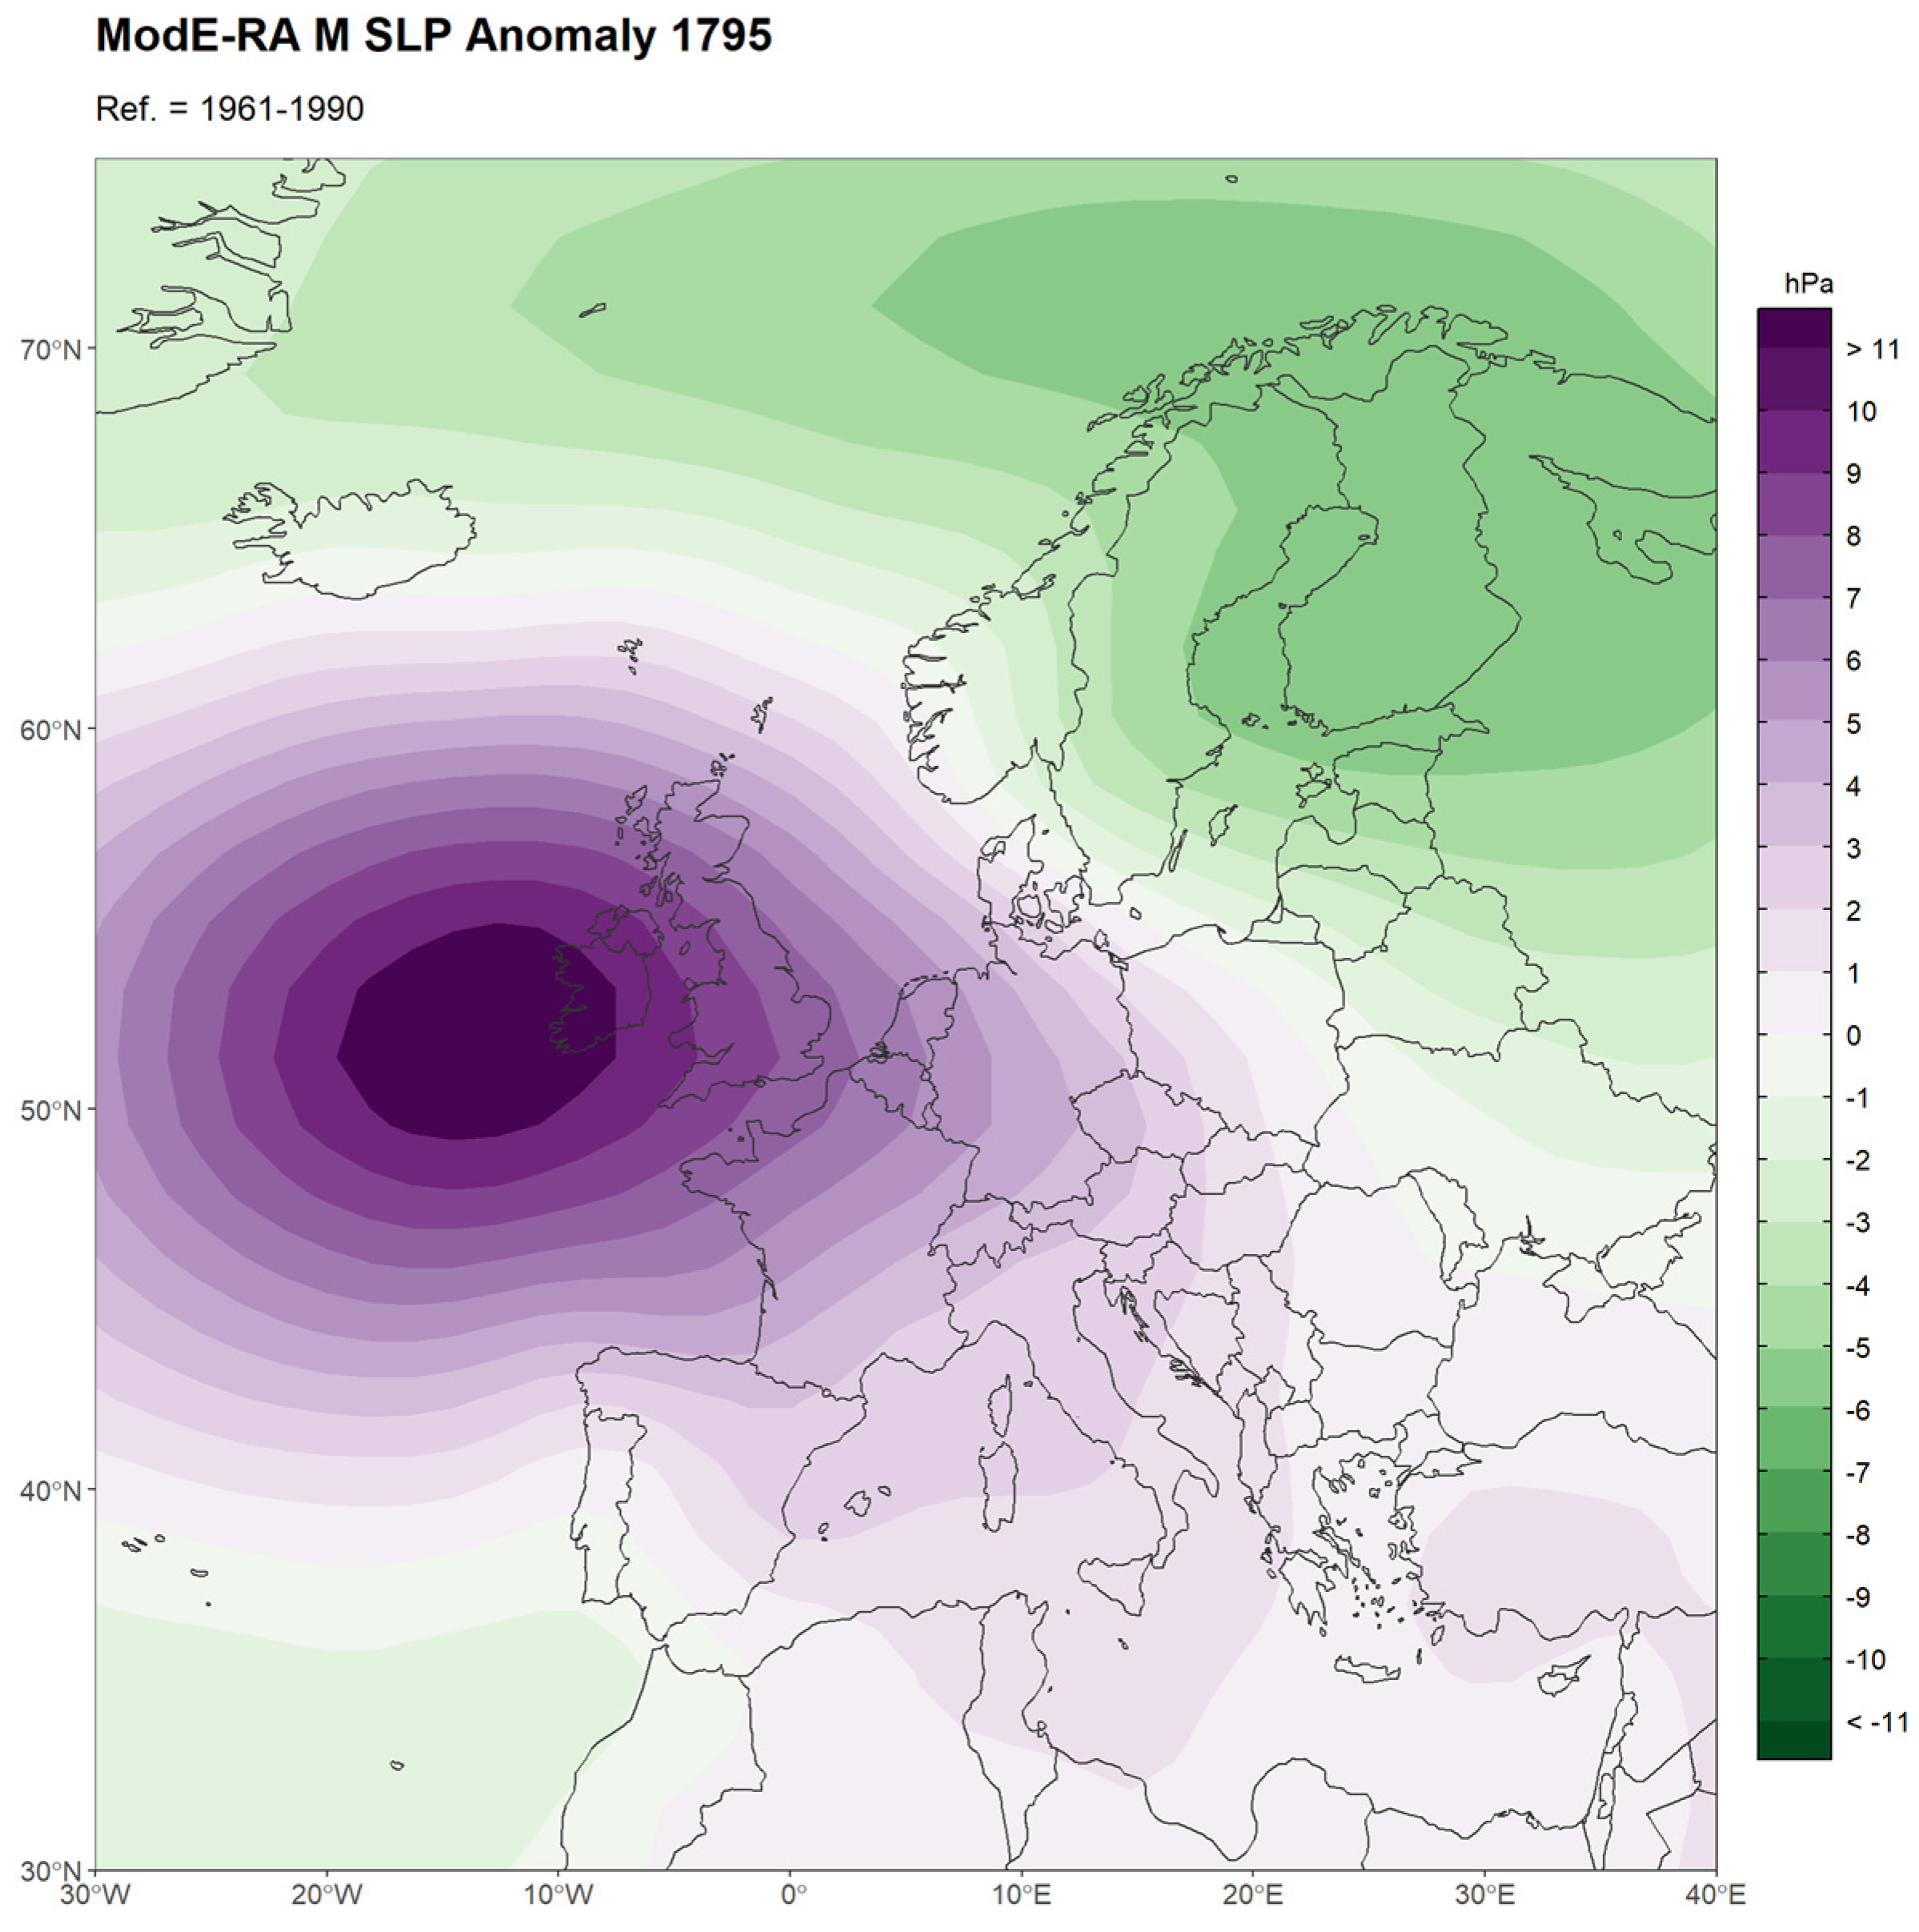
Consistent with this interpretation, the monthly paleoreanalysis [54] indicates a pronounced positive sea level pressure anomaly over the northeastern Atlantic during May 1795 (Figure 9), suggesting persistent anticyclonic conditions. Unfortunately, we cannot use the 20CR reanalysis with daily resolution in this case due to the early date of this event. When the 20CR reanalysis is extended further back in time, it will be a valuable tool for better understanding this heatwave [55,56,57,58].
Beyond the instrumental records, contemporary documentary evidence further corroborates the exceptional nature of this heatwave. The personal diaries of Gaspar Melchor de Jovellanos [59]—a key figure of the Spanish Enlightenment—contain multiple entries between 21 and 24 May 1795, describing unusually oppressive weather in Nájera and its surroundings (notably, his entry for 23 May—coinciding exactly with the peak anomalies recorded in the Ferrol instrumental series—vividly underscores the severity of the episode, stating that ‘everyone fears the heat’ [in Spanish: “todos temen el calor”]). Moreover, the final folio of Source 4 (see Appendix B) explicitly describes “extraordinary heat” during late spring in Ferrol, noting its notable effects on public health and agriculture. While the document does not quantify impacts, it reports that the catarrhal fevers affecting infants earlier in the year (January to March) progressed into more dangerous putrid fevers during May, coinciding with the unusual heat. These qualitative observations reinforce the instrumental records and offer further insight into the social perception and lived experience of the heatwave at the time, underscoring its historical significance.
Late spring heatwaves such as the one identified in May 1795 are of particular interest because they represent a category of extremes that has received comparatively less attention in the literature than midsummer heatwaves. Previous studies have shown that early-season heatwaves can have a disproportionate impact on human health, as populations are typically less acclimatized at this time of year, even when absolute temperatures are lower than those reached during peak summer events [60,61,62,63,64]. In addition, recent research has highlighted a progressive expansion of the summer season in the Iberian Peninsula under contemporary warming, with heatwave-like conditions increasingly occurring in late May and June and exhibiting characteristics traditionally associated with July–August heatwaves [41,42]. Within this context, the identification of a late-spring heatwave under pre-industrial climatic conditions provides a valuable historical benchmark for understanding the timing and nature of extreme heat episodes beyond the modern observational period. This historical perspective does not imply equivalence between past and present drivers of heat extremes but rather highlights the relevance of timing and persistence in shaping extreme heat impacts.
Taken together, this study demonstrates how the recovery and open dissemination of early instrumental data can substantially enhance our understanding of historical climate variability and extremes. Even short and imperfect records, when interpreted cautiously and supported by independent spatial evidence, can reveal robust signals of exceptional climatic events. The Ferrol dataset (1792–1795) thus represents both a valuable addition to the historical climate archive of the Iberian Peninsula and a clear example of the scientific potential of targeted data-rescue efforts in underrepresented regions. Historical case studies such as this one provide valuable benchmarks for understanding the full range of extreme heat variability and for placing modern and future climate extremes within a broader temporal perspective.

5. Conclusions

This study reports newly recovered instrumental temperature observations from Ferrol (northwestern Spain) for the period 1792–1795, derived from original archival sources preserved at the Royal Institute and Observatory of the Spanish Navy. Although the temporal coverage of the record is limited and uneven, the year 1795 provides a nearly continuous daily series of midday temperature measurements, enabling the analysis of short-term temperature variability under pre-industrial climatic conditions.
Using a retrospective percentile-based diagnostic framework, the Ferrol observations reveal an exceptionally warm episode occurring between 22 and 24 May 1795. During this period, midday temperatures exceeded the present-day 95th percentile for three consecutive days, fulfilling commonly used criteria for heatwave identification. Comparison with the modern observational record (2000–2024) underscores the remarkable character of this event. Daily maximum temperatures of 30 °C or higher in May were recorded on only 1.3% of the analyzed days, suggesting that the temperatures documented in this study correspond to conditions that remain highly unusual in the contemporary climate of the region.
Independent contemporaneous instrumental records from Madrid, Barcelona and Cádiz exhibit synchronous positive temperature anomalies during the same interval, demonstrating that the late-May 1795 heatwave was not a localized phenomenon but affected a substantial portion of the Iberian Peninsula. This regional coherence provides robust support for the interpretation of the event despite the uncertainties inherent to late-18th-century instrumentation and observational practices.
By documenting a spring heatwave under pre-industrial conditions, this study provides new empirical evidence of the occurrence of extreme heat episodes in historical periods characterized by generally cooler background temperatures. The openly available Ferrol dataset offers a concrete basis for future comparative analyses of historical and modern temperature extremes and contributes to a more complete characterization of extreme heat variability beyond the modern observational era. In this context, the present case study also provides a historical perspective that helps contextualize the growing relevance of early-season heatwaves in the Iberian Peninsula observed in recent decades.

Author Contributions

Conceptualization, M.d., J.M.V., M.C.G. and M.G.-G.; methodology, M.d. and M.G.-G.; software, N.G.d. and M.G.-G.; validation, N.G.d.; formal analysis, M.d., J.G.-C., J.M.V., M.C.G. and R.M.T.; investigation, J.M.V. and M.C.G.; resources, J.G.-C.; data curation, N.G.d.; writing—original draft preparation, M.d.; writing—review and editing, M.d., J.G.-C., N.G.d., J.M.V., M.C.G. and R.M.T.; visualization, M.d. and M.G.-G.; supervision, M.G.-G. All authors have read and agreed to the published version of the manuscript.

Funding

This research has been partially supported by Galicia, Consellería de Cultura, Educación e Universidade, under Project ED431C 2025/37 “Programa de Consolidación e Restructuración de Unidades de Investigación Competitivas” and by the Economy and Infrastructure Counselling of the Junta of Extremadura through Grant GR24049 (co-financed by the European Regional Development Fund).

Data Availability Statement

All data used in this study are freely available at 10.5281/zenodo.15827666. The main characteristics of these databases are described in Section 2.1.

Acknowledgments

The authors gratefully acknowledge the support of José María González-Alastrué and Pablo González-Alastrué, whose efforts in digitizing and organizing the Barcelona temperature data made a significant contribution to this research. Additionally, we would like to acknowledge funding from the Xunta de Galicia under grant no. ED431C 2021/44 (Grupos de Referencia Competitiva). The authors used ChatGPT-5.2 in an earlier version of this article to improve language and readability. After using this tool/service, the authors reviewed and edited the content as needed and take full responsibility for the content of the publication.

Conflicts of Interest

The authors declare no conflicts of interest.

Appendix A

The following entries by Gaspar Melchor de Jovellanos in his Diario describe unusually hot weather conditions in Nájera and the surrounding areas between 21 and 24 May 1795 ([42,43]):
21 May 1795. Thursday. Nájera. “Sol, gran calor” (Sun, great heat).
22 May 1795. Friday. Nájera. “Antes de la seis en pie; mañana clara y con anuncio de gran calor” (Up before six; clear morning and signs of great heat).
23 May 1795. Saturday. “[…] oigo las cuatro y salto de la cama; anuncia un día de gran calor. […] Entra Acevedo a las cuatro y cuarto; todos temen el calor. […] Llegada a San Millán […] a las nueve y media. […] Cena; conversación; sobremesa de materias económicas. A la cama; calor” ([…] I hear the clock strike four and jump out of bed; the day promises great heat. […] Acevedo comes in at a quarter past four; everyone fears the heat. […] Arrival at San Millán […] at half past nine. […] Dinner; conversation; after-dinner talk on economic matters. Off to bed; heat).
24 May 1795. Sunday. San Millán. “[…] A cenar y a acostar; calor” ([…] Dinner and to bed; heat).

Appendix B

Original Spanish text and English translation of the final folio of Source 4 (described in Section 2.1.1) summarize the weather conditions during 1795 and their effects on public health and agricultural production. Temperatures are reported in degrees Réaumur (°Ré), a common scale used in historical meteorological records.
Original Ancient Spanish
Desde Enero hasta Mayo reinaron los vientos del 1° y 3° cuadrantes, los de 3° frescos y los del 1° bonancibles; desde Mayo hasta Septiembre fueron los nordestes fresquitos los que más predominaron, y desde Septiembre hasta Diciembre los sudoestes fueron los que más soplaron.
Desde Enero hasta Abril fueron las lluvias bastante benignas respecto a la estación pero desde Abril hasta el fin del año han sido bastante continuadas con poca alternativa de buen tiempo, siendo algunas de ellas muy tempestuosas.
El mayor frío se sintió los días 17, 19, 20, 21 y 22 de Enero, señalando el termómetro 5½ grados sobre el hielo; la mayor calor se experimentó el 23 de Mayo y 20 de Agosto, señalando el termómetro en el primer caso 24 y en el segundo 24½ sobre cero.
Como en este año no se presentaron los tiempos con la mayor ventaja respecto a las estaciones, influyeron bastante en la salud y en las producciones del campo: desde Enero hasta Marzo las enfermedades reinantes fueron fiebres catarrales, pasando a pútridas de mala consecuencia por el mes de Mayo en que sucedió la calor extraordinaria que se dijo arriba; en todo el verano siguieron las mismas fiebres solo que cambiaron el carácter de pútridas en biliares y tabardillas, advirtiendo que los niños en esta estación adolecieran de diarreas y disenterías algunas de malas condición, y en el otoño atacó esta enfermedad a niños y a grandes: en el invierno volvieron a reinar las fiebres catarrales y reumáticas pero de buena calidad.
Las siembras en el campo se hicieron con bastante oportunidad pero las cosechas fueron interrumpidas por las lluvias y vientos que, o abatieron lo que debía cogerse o impedía llegase a madurecer en su tiempo, lo que motivó una cosecha escasa, y alguna de mala calidad, como los vinos.
Modern English translation
From January to May, winds from the first and third quadrants predominated—those from the third were fresh, while those from the first were mild. Between May and September, light northeasterly winds were dominant. From September to December, southwesterly winds were the most frequent.
Rainfall from January to April was moderate for the season. However, from April until the end of the year, rain was frequent and persistent, with few intervals of fair weather. Some storms were particularly severe.
The coldest days occurred on 17, 19, 20, 21, and 22 January, when the thermometer registered 5½ °Ré above freezing (approximately 6.9 °C). The hottest days were 23 May and 20 August, with temperatures reaching 24 and 24½ °Ré (equivalent to 30 and 30.6 °C), respectively.
Given that weather conditions were generally unfavourable for the seasons, they had a significant impact on both public health and agricultural yields. From January to March, catarrhal fevers were predominant, progressing to more dangerous putrid fevers around May, coinciding with the unusual heat. These persisted through the summer, evolving into bilious and tabardillo fevers. Notably, children suffered from diarrhea and dysentery during this season, some cases being severe. In autumn, these ailments affected both children and adults. In winter, catarrhal and rheumatic fevers returned, though typically in milder forms.
Sowing was conducted at the appropriate times, but harvests were hindered by rain and wind, which either damaged the crops or prevented proper ripening. This led to a poor and, in some cases, low-quality harvest, especially affecting wine production.

References

  1. Fischer, E.M.; Bador, M.; Huser, R.; Kendon, E.J.; Robinson, A.; Sippel, S. Record-breaking extremes in a warming climate. Nat. Rev. Earth Environ. 2025, 6, 456–470. [Google Scholar] [CrossRef] [Scilit]
  2. Swain, D.L.; Prein, A.F.; Abatzoglou, J.T.; Albano, C.M.; Brunner, M.; Diffenbaugh, N.S.; Singh, D.; Skinner, C.B.; Touma, D. Hydroclimate volatility on a warming Earth. Nat. Rev. Earth Environ. 2025, 6, 35–50. [Google Scholar] [CrossRef] [Scilit]
  3. Fowler, H.J.; Lenderink, G.; Prein, A.F.; Westra, S.; Allan, R.P.; Ban, N.; Barbero, R.; Berg, P.; Blenkinsop, S.; Do, H.X.; et al. Anthropogenic intensification of short-duration rainfall extremes. Nat. Rev. Earth Environ. 2021, 2, 107–122. [Google Scholar] [CrossRef] [Scilit]
  4. Intergovernmental Panel on Climate Change (IPCC). “Weather and Climate Extreme Events in a Changing Climate” Chapter. In Climate Change 2021—The Physical Science Basis: Working Group I Contribution to the Sixth Assessment Report of the Intergovernmental Panel on Climate Change, 1513–1766; Cambridge University Press: Cambridge, UK, 2023. [Google Scholar] [CrossRef] [Scilit]
  5. Zscheischler, J.; Westra, S.; Van Den Hurk, B.J.J.M.; Seneviratne, S.I.; Ward, P.J.; Pitman, A.; AghaKouchak, A.; Bresch, D.N.; Leonard, M.; Wahl, T.; et al. Future climate risk from compound events. Nat. Clim. Change 2018, 8, 469–477. [Google Scholar] [CrossRef] [Scilit]
  6. Morice, C.P.; Kennedy, J.J.; Rayner, N.A.; Winn, J.P.; Hogan, E.; Killick, R.E.; Dunn, R.J.H.; Osborn, T.J.; Jones, P.D.; Simpson, I.R. An updated assessment of near-surface temperature change from 1850: The HadCRUT5 data set. J. Geophys. Res. Atmos. 2021, 126, e2019JD032361. [Google Scholar] [CrossRef] [Scilit]
  7. Dunn, R.J.H.; Alexander, L.V.; Donat, M.G.; Zhang, X.; Bador, M.; Herold, N.; Lippmann, T.; Allan, R.; Aguilar, E.; Barry, A.A.; et al. Development of an updated global land in situ-based data set of temperature and precipitation extremes: HadEX3. J. Geophys. Res. Atmos. 2020, 125, e2019JD032263. [Google Scholar] [CrossRef] [Scilit]
  8. Hersbach, H.; Bell, B.; Berrisford, P.; Hirahara, S.; Horányi, A.; Muñoz-Sabater, J.; Nicolas, J.; Peubey, C.; Radu, R.; Schepers, D.; et al. The ERA5 global reanalysis. Q. J. R. Meteorol. Soc. 2020, 146, 1999–2049. [Google Scholar] [CrossRef] [Scilit]
  9. Donat, M.G.; Alexander, L.V.; Yang, H.; Durre, I.; Vose, R.; Caesar, J. Global land-based datasets for monitoring climatic extremes. Bull. Am. Meteorol. Soc. 2013, 94, 997–1006. [Google Scholar] [CrossRef] [Scilit]
  10. Alexander, L.V.; Zhang, X.; Peterson, T.C.; Caesar, J.; Gleason, B.; Klein Tank, A.M.G.; Haylock, M.; Collins, D.; Trewin, B.; Rahimzadeh, F.; et al. Global observed changes in daily climate extremes of temperature and precipitation. J. Geophys. Res. Atmos. 2006, 111, D05109. [Google Scholar] [CrossRef] [Scilit]
  11. Lamb, H.H. Climate: Present, Past and Future; Routledge: London, UK, 1972. [Google Scholar]
  12. Brönnimann, S. Climatic Changes Since 1700; Springer: Cham, Switzerland, 2015. [Google Scholar] [CrossRef] [Scilit]
  13. Pfister, C.; Wanner, H. Climate and Society in Europe: The Last Thousand Years; Haupt Verlag: Bern, Switzerland, 2021. [Google Scholar]
  14. Brönnimann, S.; Allan, R.; Ashcroft, L.; Baer, S.; Barriendos, M.; Brázdil, R.; Brugnara, Y.; Brunet, M.; Brunetti, M.; Chimani, B.; et al. Unlocking pre-1850 instrumental meteorological records: A global inventory. Bull. Am. Meteorol. Soc. 2019, 100, ES389–ES413. [Google Scholar] [CrossRef] [Scilit]
  15. Slonosky, V. The meteorological observations of Jean-François Gaultier, Quebec, Canada: 1742–1756. J. Clim. 2003, 16, 2232–2247. [Google Scholar] [CrossRef] [Scilit]
  16. Zaiki, M.; Können, G.P.; Tsukahara, T.; Jones, P.D.; Mikami, T.; Matsumoto, K. Recovery of nineteenth-century Tokyo/Osaka meteorological data in Japan. Int. J. Climatol. 2006, 26, 399–423. [Google Scholar] [CrossRef] [Scilit]
  17. Domínguez-Castro, F.; Vaquero, J.M.; Rodrigo, F.S.; Farrona, A.M.M.; Gallego, M.C.; García-Herrera, R.; Barriendos, M.; Sánchez-Lorenzo, A. Early Spanish meteorological records (1780–1850). Int. J. Climatol. 2014, 34, 593–603. [Google Scholar] [CrossRef] [Scilit]
  18. Picas, J.; Grab, S.; Allan, R. A 19th-century daily surface pressure series for the southwestern Cape region of South Africa: 1834–1899. Int. J. Climatol. 2019, 39, 1404–1414. [Google Scholar] [CrossRef] [Scilit]
  19. Morozova, A.L.; Valente, M.A. Homogenization of Portuguese long-term temperature data series: Lisbon, Coimbra and Porto. Earth Syst. Sci. Data 2012, 4, 187–213. [Google Scholar] [CrossRef] [Scilit]
  20. Bližnák, V.; Valente, M.A.; Bethke, J. Homogenization of time series from Portugal and its former colonies for the period from the late 19th to the early 21st century. Int. J. Climatol. 2015, 35, 2400–2418. [Google Scholar] [CrossRef] [Scilit]
  21. Vaquero, J.M.; Bravo-Paredes, N.; Obregón, M.A.; Carrasco, V.M.S.; Valente, M.A.; Trigo, R.M.; Domínguez-Castro, F.; Montero-Martín, J.; Vaquero-Martínez, J.; Antón, M.; et al. Recovery of early meteorological records from the Extremadura region (SW Iberia): The CliPastExtrem (v1.0) database. Geosci. Data J. 2022, 9, 207–220. [Google Scholar] [CrossRef] [Scilit]
  22. Alberola, R.A. Los Cambios Climáticos: La Pequeña Edad de Hielo en España; Cátedra: Barcelona, Spain, 2014. [Google Scholar]
  23. Oliva, M.; Ruiz-Fernández, J.; Barriendos, M.; Benito, G.; Cuadrat, J.M.; Domínguez-Castro, F.; García-Ruiz, J.M.; Giralt, S.; Gómez-Ortiz, A.; Hernández, A.; et al. The Little Ice Age in Iberian mountains. Earth-Sci. Rev. 2018, 177, 175–208. [Google Scholar] [CrossRef] [Scilit]
  24. Kington, J. The Weather of the 1780s over Europe; Cambridge University Press: Cambridge, UK, 1988. [Google Scholar] [CrossRef] [Scilit]
  25. Pfister, C.; Garnier, E.; Alcoforado, M.J.; Wheeler, D.; Luterbacher, J.; Nunes, M.F.; Taborda, J. The meteorological framework and the cultural memory of three severe winter storms in early eighteenth-century Europe. Clim. Change 2010, 101, 281–310. [Google Scholar] [CrossRef] [Scilit]
  26. Fragoso, M.; Marques, D.; Santos, J.A.; Alcoforado, M.J.; Amorim, I.; García, C.; Silva, L.; Nunes, M.F. Climatic extremes in Portugal in the 1780s based on documentary and instrumental records. Clim. Res. 2015, 66, 141–159. [Google Scholar] [CrossRef] [Scilit]
  27. Wheeler, D. Early instrumental weather data from Cádiz: A study of late eighteenth- and early nineteenth-century records. Int. J. Climatol. 1995, 15, 801–810. [Google Scholar] [CrossRef] [Scilit]
  28. Barriendos, M.; Martín-Vide, J.; Peña, J.C.; Rodríguez, R. Daily meteorological observations in Cádiz–San Fernando: Analysis of documentary sources and instrumental data content (1786–1996). Clim. Change 2002, 53, 151–170. [Google Scholar] [CrossRef] [Scilit]
  29. Gallego, D.; García-Herrera, R.; Calvo, N.; Ribera, P. A new meteorological record for Cádiz (Spain) 1806–1852: Implications for climatic reconstructions. J. Geophys. Res. Atmos. 2007, 112, D12108. [Google Scholar] [CrossRef] [Scilit]
  30. Rodrigo, F.S. Completing the early instrumental weather record from Cádiz (southern Spain): New data from 1799 to 1803. Clim. Change 2012, 111, 697–704. [Google Scholar] [CrossRef] [Scilit]
  31. Rodrigo, F.S. Early meteorological data in southern Spain during the Dalton Minimum. Int. J. Climatol. 2019, 39, 3593–3607. [Google Scholar] [CrossRef] [Scilit]
  32. Bravo-Paredes, N.; Gallego, M.C.; Trigo, R.M.; Vaquero, J.M. Earliest meteorological readings in San Fernando (Cádiz, Spain). Clim. Past 2023, 19, 1397–1408. [Google Scholar] [CrossRef] [Scilit]
  33. Brönnimann, S.; Annis, J.; Dann, W.; Ewen, T.; Grant, A.N.; Griesser, T.; Krähenmann, S.; Mohr, C.; Scherer, M.; Vogler, C.A. Guide for digitising manuscript climate data. Clim. Past 2006, 2, 137–144. [Google Scholar] [CrossRef] [Scilit]
  34. World Meteorological Organization. Guidelines on Best Practices for Climate Data Rescue; WMO-No. 1182; World Meteorological Organization: Geneva, Switzerland, 2024. [Google Scholar]
  35. Vautard, R.; Cattiaux, J.; Happé, T.; Singh, J.; Bonnet, R.; Cassou, C.; Coumou, D.; D’Andrea, F. Heat extremes in Western Europe increasing faster than simulated due to atmospheric circulation trends. Nat. Commun. 2023, 14, 6809. [Google Scholar] [CrossRef] [Scilit]
  36. Tejedor, E.; Benito, G.; Serrano-Notivoli, R.; González-Rouco, F.; Esper, J.; Büntgen, U. Recent heatwaves as a prelude to climate extremes in the western Mediterranean region. Clim. Atmos. Sci. 2024, 7, 218. [Google Scholar] [CrossRef] [Scilit]
  37. Camuffo, D.; Jones, P.D. Improved understanding of past climatic variability from early daily European instrumental sources. In Improved Understanding of Past Climatic Variability from Early Daily European Instrumental Sources; Camuffo, D., Jones, P.D., Eds.; Springer: Dordrecht, The Netherlands, 2002; pp. 1–8. [Google Scholar] [CrossRef] [Scilit]
  38. Camuffo, D.; Valle, A. A summer temperature bias in early alcohol thermometers. Clim. Change 2016, 138, 633–640. [Google Scholar] [CrossRef] [Scilit]
  39. Cammufo, D. Calibration and Instrumental Errors in Early Measurements of Air Temperature. Clim. Change 2002, 53, 297–329. [Google Scholar] [CrossRef] [Scilit]
  40. Wallis, E.J.; Osborn, T.J.; Taylor, M.; Jones, P.D.; Joshi, M.; Hawkins, E. Quantifying exposure biases in early instrumental land surface air temperature observations. Int. J. Climatol. 2024, 44, 1611–1635. [Google Scholar] [CrossRef] [Scilit]
  41. Prohom, M.; Barriendos, M.; Sánchez-Lorenzo, A. Reconstruction and homogenization of the longest instrumental precipitation series in the Iberian Peninsula (Barcelona, 1786–2014). Int. J. Climatol. 2016, 36, 3072–3087. [Google Scholar] [CrossRef] [Scilit]
  42. Jovellanos, G.M. Diario; Planeta: Madrid, Spain, 1992. [Google Scholar]
  43. Jovellanos, G.M. Obras Completa; 15 vols.; KRK Ediciones: Gijón, Spain, 2021. [Google Scholar]
  44. Barriopedro, D.; García-Herrera, R.; Ordóñez, C.; Miralles, D.G.; Salcedo-Sanz, S. Heat waves: Physical understanding and scientific challenges. Rev. Geophys. 2023, 61, e2022RG000780. [Google Scholar] [CrossRef] [Scilit]
  45. European Centre for Medium-Range Weather Forecasts (ECMWF). Heatwave Definition and Percentile-Based Indices. Available online: https://www.ecmwf.int/ (accessed on 15 January 2026).
  46. Perkins, S.E.; Alexander, L.V. On the measurement of heat waves. J. Clim. 2013, 26, 4500–4517. [Google Scholar] [CrossRef] [Scilit]
  47. López y Nobal. 1820. Available online: https://biblioteca.galiciana.gal/es/consulta/registro.do?id=3725 (accessed on 15 January 2026).
  48. Parker, D.E.; Legg, T.P.; Folland, C.K. A new daily Central England Temperature Series, 1772–1991. Int. J. Clim. 1992, 12, 317–342. [Google Scholar] [CrossRef] [Scilit]
  49. Manley, G. The mean temperature of Central England, 1698 to 1952. Q. J. R. Meteorol. Soc. 1953, 79, 242–261. [Google Scholar]
  50. Manley, G. Central England Temperatures: Monthly means 1659 to 1973. Q. J. R. Meteorol. Soc. 1974, 100, 389–405. [Google Scholar] [CrossRef] [Scilit]
  51. Parker, D.E.; Horton, E.B. Uncertainties in the Central England Temperature series since 1878 and some changes to the maximum and minimum series. Int. J. Climatol. 2005, 25, 1173–1188. [Google Scholar]
  52. Kadow, C.; Wentzel, B.; Jaekel, I.; Bahlo, M.; Cubasch, U. Berlin Climate Record—Daily Mean Temperature—Inner City—1766–1934 [Dataset]; PANGAEA: San Francisco, CA, USA, 2016. [Google Scholar] [CrossRef]
  53. Zenodo. Ferrol Instrumental Temperature Dataset (1792–1795); Zenodo: Geneva, Switzerland, 2025. [Google Scholar] [CrossRef]
  54. Warren, R.; Bartlome, N.E.; Wellinger, N.; Franke, J.; Hand, R.; Brönnimann, S.; Huhtamaa, H. ClimeApp: Data processing tool for monthly global climate data from the ModE-RApalaeo-reanalysis 1422 to 2008, C.E. Clim. Past 2024, 20, 2645–2662. [Google Scholar] [CrossRef] [Scilit]
  55. Slivinski, L.C.; Compo, G.P.; Whitaker, J.S.; Sardeshmukh, P.D.; Giese, B.S.; McColl, C.; Allan, R.; Yin, X.; Vose, R.; Titchner, H.; et al. Towards a more reliable historical reanalysis: Improvements for version 3 of the Twentieth Century Reanalysis system. Q. J. R. Meteorol. Soc. 2019, 145, 2876–2908. [Google Scholar] [CrossRef] [Scilit]
  56. Giese, B.S.; Seidel, H.F.; Compo, G.P.; Sardeshmukh, P.D. An ensemble of ocean reanalyses for 1815–2013 with sparse observational input. J. Geophys. Res. Oceans 2016, 121, 6891–6910. [Google Scholar] [CrossRef] [Scilit]
  57. Compo, G.P.; Whitaker, J.S.; Sardeshmukh, P.D.; Matsui, N.; Allan, R.J.; Yin, X.; Gleason, B.E.; Vose, R.S.; Rutledge, G.; Bessemoulin, P.; et al. The Twentieth Century Reanalysis Project. Q. J. R. Meteorol. Soc. 2011, 137, 1–28. [Google Scholar] [CrossRef] [Scilit]
  58. Compo, G.P.; Whitaker, J.S.; Sardeshmukh, P.D. Feasibility of a 100 year reanalysis using only surface pressure data. Bull. Am. Met. Soc. 2006, 87, 175–190. [Google Scholar] [CrossRef] [Scilit]
  59. Vaquero, J.M. Las observaciones meteorológicas de Jovellanos en el castillo de Bellver. Rev. Esp. Fís. 2023, 37, 22–27. Available online: https://www.divulgameteo.es/archivos/articulos/meteoroteca/Jovellanos-meteo-Bellver.pdf (accessed on 9 February 2026).
  60. Baccini, M.; Biggeri, A.; Accetta, G.; Kosatsky, T.; Katsouyanni, K.; Analitis, A.; Anderson, H.R.; Bisanti, L.; D’Ippoliti, D.; Danova, J.; et al. Heat effects on mortality in 15 European cities. Epidemiology 2008, 19, 711–719. [Google Scholar] [CrossRef] [Scilit]
  61. Lee, W.; Choi, H.M.; Lee, J.Y.; Kim, D.H.; Honda, Y.; Kim, H. Acclimatization across space and time in the effects of temperature on mortality: A time-series analysis. Environ. Health 2014, 13, 89. [Google Scholar] [CrossRef] [Scilit]
  62. Madaniyazi, L.; Ben Armstrong, B.; Chung, Y.; Ng, C.F.S.; Seposo, X.; Kim, Y.; Tobias, A.; Guo, Y.; Sera, F.; Honda, Y.; et al. Seasonal variation in mortality and the role of temperature: A multi-country multi-city study. Int. J. Epidemiol. 2022, 51, 122–133. [Google Scholar] [CrossRef] [Scilit]
  63. Alari, A.; Letellier, N.; Benmarhnia, T. Effect of different heat wave timing on cardiovascular and respiratory mortality in France. Sci. Total Environ. 2023, 892, 164543. [Google Scholar] [CrossRef] [Scilit]
  64. Ballester, J.; Quijal-Zamorano, M.; Robine, J.-M.; Herrmann, F.R.; Achebak, H. Heat-related mortality in Europe during 2023 and the role of adaptation. Nat. Med. 2024, 30, 3101–3105. [Google Scholar] [CrossRef] [Scilit]
Figure 1. Historical map (1722) of the Arsenal of Ferrol (Spain). The red dot indicates the approximate location of the Astronomical Observatory, providing spatial context for the study area (courtesy of INSTITUTO DE HISTORIA Y CULTURA NAVAL, Departamento de Archivos Navales, Archivo Histórico de la Armada-sede ‘Juan Sebastián de Elcano’).
Climate 14 00174 g001
Figure 2. Representative images of sources 1 (a), 2 (b), 3 (c), and 4 (d).
Climate 14 00174 g002
Figure 3. Temporal coverage of available midday temperature observations in Ferrol between 1792 and 1795, based on the four historical documentary sources that are described in this article. Coloured bars indicate the periods covered by each source, highlighting partial overlaps, discontinuities and the markedly higher data availability in 1795, the only year with near-continuous daily observations.
Climate 14 00174 g003
Figure 4. (a) Location of the meteorological data sources analyzed in this study. Instrumental observations were obtained from Ferrol (red circle) and from Madrid, Barcelona, and Cádiz (green circles). The blue circle marks Nájera, where complementary historical documentary evidence was used. (b) Aerial image of Ferrol on the Atlantic coast of northwestern Spain. (c) Topographic elevation map of the Ferrol area.
Climate 14 00174 g004
Figure 5. Availability of instrumental temperature records used for comparison during May and the first half of June at the different Iberian locations considered in this study. Black markers indicate days with available observations, while gaps correspond to missing data. The figure highlights differences in temporal completeness among (a) Madrid (1790–1799) and (b) Cádiz (1789–1795). The daily series for Barcelona used in the current study does not present any gap, allowing for a reliable estimation of late-18th-century temperatures [41].
Climate 14 00174 g005
Figure 6. Midday temperatures recorded in Ferrol during 1792 (green markers), 1793 (blue markers), 1794 (black markers), and 1795 (red markers). Dotted lines indicate the present-day 5th (Prc. 5) and 95th (Prc. 95) percentile thresholds derived from modern observations, while the dash–dotted line represents the median (Prc. 50).
Climate 14 00174 g006
Figure 7. Daily temperature anomalies (ΔT, °C) in Madrid (a), Barcelona (b) and Cádiz (c) during May and the first half of June 1795, calculated relative to the 1790–1799 reference period for Madrid, the 1793–1799 reference period for Barcelona and the 1789–1795 reference period in Cádiz. The dotted line marks the end of May.
Climate 14 00174 g007
Figure 8. Daily temperature anomalies (ΔT, °C) in Central England area (a) and Berlin (b) during May and the first half of June 1795, calculated relative to the 1789–1799 reference period. The dotted line marks the end of May.
Climate 14 00174 g008
Figure 9. Monthly SLP anomaly for the North Atlantic region obtained from paleoreanalysis for May 1795 [54].
Climate 14 00174 g009
Disclaimer/Publisher’s Note: The statements, opinions and data contained in all publications are solely those of the individual author(s) and contributor(s) and not of MDPI and/or the editor(s). MDPI and/or the editor(s) disclaim responsibility for any injury to people or property resulting from any ideas, methods, instructions or products referred to in the content.