Article

Spatio-Temporal Meteorological Drought Distribution in the Upper Cheliff Basin (Algeria) Using SPI and SPEI Indices

by
Mohamed-Sadek Messis
1,
Katarzyna Kubiak-Wójcicka
2,*,
Azeddine Mebarki
1 and
Abdelaaziz Merabti
3
1
Laboratory of Territorial Sciences, Natural Resources and the Environment (LASTERNE), Faculty of Earth Sciences, Geography and Territory Planning, Constantine 1-Frères Mentouri University, Constantine 25000, Algeria
2
Faculty of Earth Sciences and Spatial Management, Nicolaus Copernicus University, Lwowska 1, 87-100 Toruń, Poland
3
Laboratory of Preservation and Protection of Water Resources, Department of Water Sciences and Environment, University of Saad Dahlab Blida 1, Blida 9000, Algeria
*
Author to whom correspondence should be addressed.
Climate 2025, 13(6), 123; https://doi.org/10.3390/cli13060123
Submission received: 18 April 2025 / Revised: 21 May 2025 / Accepted: 6 June 2025 / Published: 10 June 2025
(This article belongs to the Special Issue Coping with Flooding and Drought)

Abstract

:
This study investigates the spatio-temporal distribution of meteorological drought in the upper Cheliff basin, Algeria, downstream of the Boughzoul dam, between September 1982 and August 2021. This research use two drought indices—the Standardised Precipitation Index (SPI) and the Standardised Precipitation and Evapotranspiration Index (SPEI)—to evaluate drought trends, frequency, duration, severity, and number of events across various time scales (1 year, 1 month, 3 months, 6 months, 9 months, and 12 months). The results identify five major drought periods (1983/84, 1993/94, 1987/88, 1999/2000–2001/2002, and 2020/21). Both the SPI and the SPEI capture the monthly variability of drought on various time scales, with different intensities. The SPEI identifies a higher number of drought events than the SPI, particularly on shorter time scales (1 and 3 months). However, at longer timescales (6, 9, and 12 months), the number of drought events detected by both indices converges. The correlation between SPI and SPEI (R ranging from 0.73 to 0.93) across the same time scales is notably high, though the lowest correlation was found in the western part of the catchment area. This suggests that for accurate meteorological drought identification in this region, particularly in its intensively irrigated agricultural areas, SPI and SPEI should be considered.

1. Introduction

Drought is a natural phenomenon that occurs in almost all climatic zones [1]. Drought occurs when there is a lack of rainfall or an area does not receive enough rainfall for a long period of time [2]. In addition to rainfall, droughts are influenced by other climatic factors such as high air temperatures, strong winds, and low relative humidity, which can significantly increase the severity of drought, which in turn leads to water shortages [3,4,5]. Defining drought is complicated by the fact that droughts are spatially and temporally variable, region-specific, occur with varying degrees of intensity, and generate direct or indirect negative impacts on ecological systems, economic activities, water resources, and human life [6,7,8,9,10]. Most often, drought is considered in four categories: meteorological drought, soil (agricultural) drought, hydrological drought, and socio-economic drought [2,11,12,13,14,15,16,17]. Given the complexity of drought, no uniform methodology for implementing drought research has yet been developed, although some drought indices are widely used [18,19].
More than 100 indices exist in the literature to characterize drought in meteorological, hydrological, agricultural, socio-economic categories or their combinations [16,20,21,22,23,24,25]. Most drought studies worldwide focus on monitoring and assessing meteorological droughts because it is considered to be the cause of all other forms of droughts [26,27]. In addition, they have a wide range of applications such as early drought warning, predictors of crop yield under climate change conditions and indicators for exploring the spatiotemporal characteristics of drought [28,29,30].
Therefore, drought analysis at the catchment scale allows the impact of drought on water resources to be predicted and mitigated through management plans [31,32]. Meteorological droughts in arid regions are particularly dangerous because these areas already have limited water resources [27]. According to the scenarios of the Intergovernmental Panel on Climate Change, the frequency, intensity and duration of droughts are likely to continue to increase in different regions of the world, including the Mediterranean basin [33,34].
Numerous studies worldwide have focused on assessing meteorological droughts. Myronidis et al. [35] compared 10 meteorological drought indices to examine the impact of drought on streamflow in the western United States. Simsek et al. [17] used the Standardized Precipitation Index (SPI) and Reconnaissance Drought Index (RDI) to analyze meteorological drought in the Black Sea region (Turkey). Kubiak-Wójcicka et al. [16] assessed meteorological drought trends in northern Poland based on the SPI. Liu et al. [4] used SPI and SPEI to investigate the spatio-temporal distribution of drought in Sichuan Province, China. Across the Mediterranean basin, Mathbout et al. [36], based on SPI and SPEI, evaluated spatio-temporal drought variability in Syria. Soydan Oksal [37] analyzed the influence of temperature and precipitation on drought assessment in the Marmara region (Turkey) using SPI and SPEI indices. Aschale et al. [38] used the ERA5-Land model, along with SPI and SPEI indices, to analyze meteorological drought trends in Sicily, southwestern Italy.
Drought studies conducted in Algeria focus on the analysis of the behaviour of many indices and their trends during specific study periods. The study by Bouguerra et al. [39] investigated the spatial and temporal variability of meteorological drought over northern Algeria based on the Standardized Precipitation Index (SPI) and Principal Component Analysis (PCA) combined with Atmospheric Circulation Indices. On the other hand, Habibi et al. [40] investigated the probability of drought occurrence using SPI and Markov Chains in the Cheliff–Zahrez River Basin, where they indicated that the probability of two consecutive drought years seems to be higher in the southern catchments. The results obtained indicate that drought varies significantly in the study area. Similar results were obtained in the study by Merabti et al. [41], who identified subregions with consistent differences that were related to the distance of the region from the Mediterranean Sea. The study of meteorological drought for the middle and upper Cheliff basin region for the period 1970–2009 conducted by Fellag et al. [42] showed that the study area shows irregularity and heterogeneity of drought due to high variability of precipitation, which can vary between sub-basins and from year to year. The upper Cheliff basin downstream of the Boughzoul dam area in north-western Algeria was selected for detailed analysis, which is located in the southern part of the Mediterranean Sea and is characterized by significant variability of precipitation during the year [43], which significantly influences the formation of water resources in the region.
To the best of the authors’ knowledge, understanding the spatial and temporal variability of drought, especially considering both precipitation and evapotranspiration, remains limited. The upper Cheliff River Basin area has never been subject to systematic drought studies using both indices SPI and SPEI, while revealing drought trends using the modified Mann–Kendall (MMK) test. Furthermore, no study conducted in the Cheliff area included meteorological drought analysis at different time scales (1, 3, 6, 9 and 12 months) using new, more up-to-date data. Considering these gaps, the aim of this study was to analyze the variability in meteorological drought intensity, frequency, severity and duration from 1982 to 2021 in the upper Cheliff River Basin. The new contribution of this study is to determine the spatiotemporal distribution of meteorological drought based on SPI and SPEI in semi-arid regions. Based on selected drought parameters, it was performed using the ERA5-Land reanalysis datasets complementary to observed data.
The implementation of this objective included the following activities:
(1) Calculation of SPI and SPEI at different time scales (1 year, 1 month, 3 months, 6 months, 9 months and 12 months) based on precipitation and evapotranspiration and the application of a Modified Mann–Kendall test (MMK trend test) and Sen Slope to determine drought trend;
(2) Calculation of drought intensity, drought frequency and another parameters such as duration and severity calculated by the run theory concept;
(3) Presentation of selected drought parameters in graphical form—mapping of spatial evolution of drought based on SPI and SPEI, to identify the drought hotspots in the upper Cheliff catchment;
(4) Analysis of the spatial distribution of the correlations between SPI and SPEI droughts using the Pearson correlation coefficient (R).
The choice of time scale allows for a complete assessment of drought conditions using the SPI, ranging from short-term droughts (1 to 6 months, applied to meteorological and agricultural drought) to longer-term hydrological droughts (6, 9 and 12 months), following the recommendations of the World Meteorological Office [44]. Like the SPI, the flexibility of the SPEI is checked over different time scales [45]. We limited the time scale to 12 months due to the size of the data obtained (39 years). Statistically, it is recommended to use series of at least 50 to 60 years for time scales longer than 12 months [46,47].

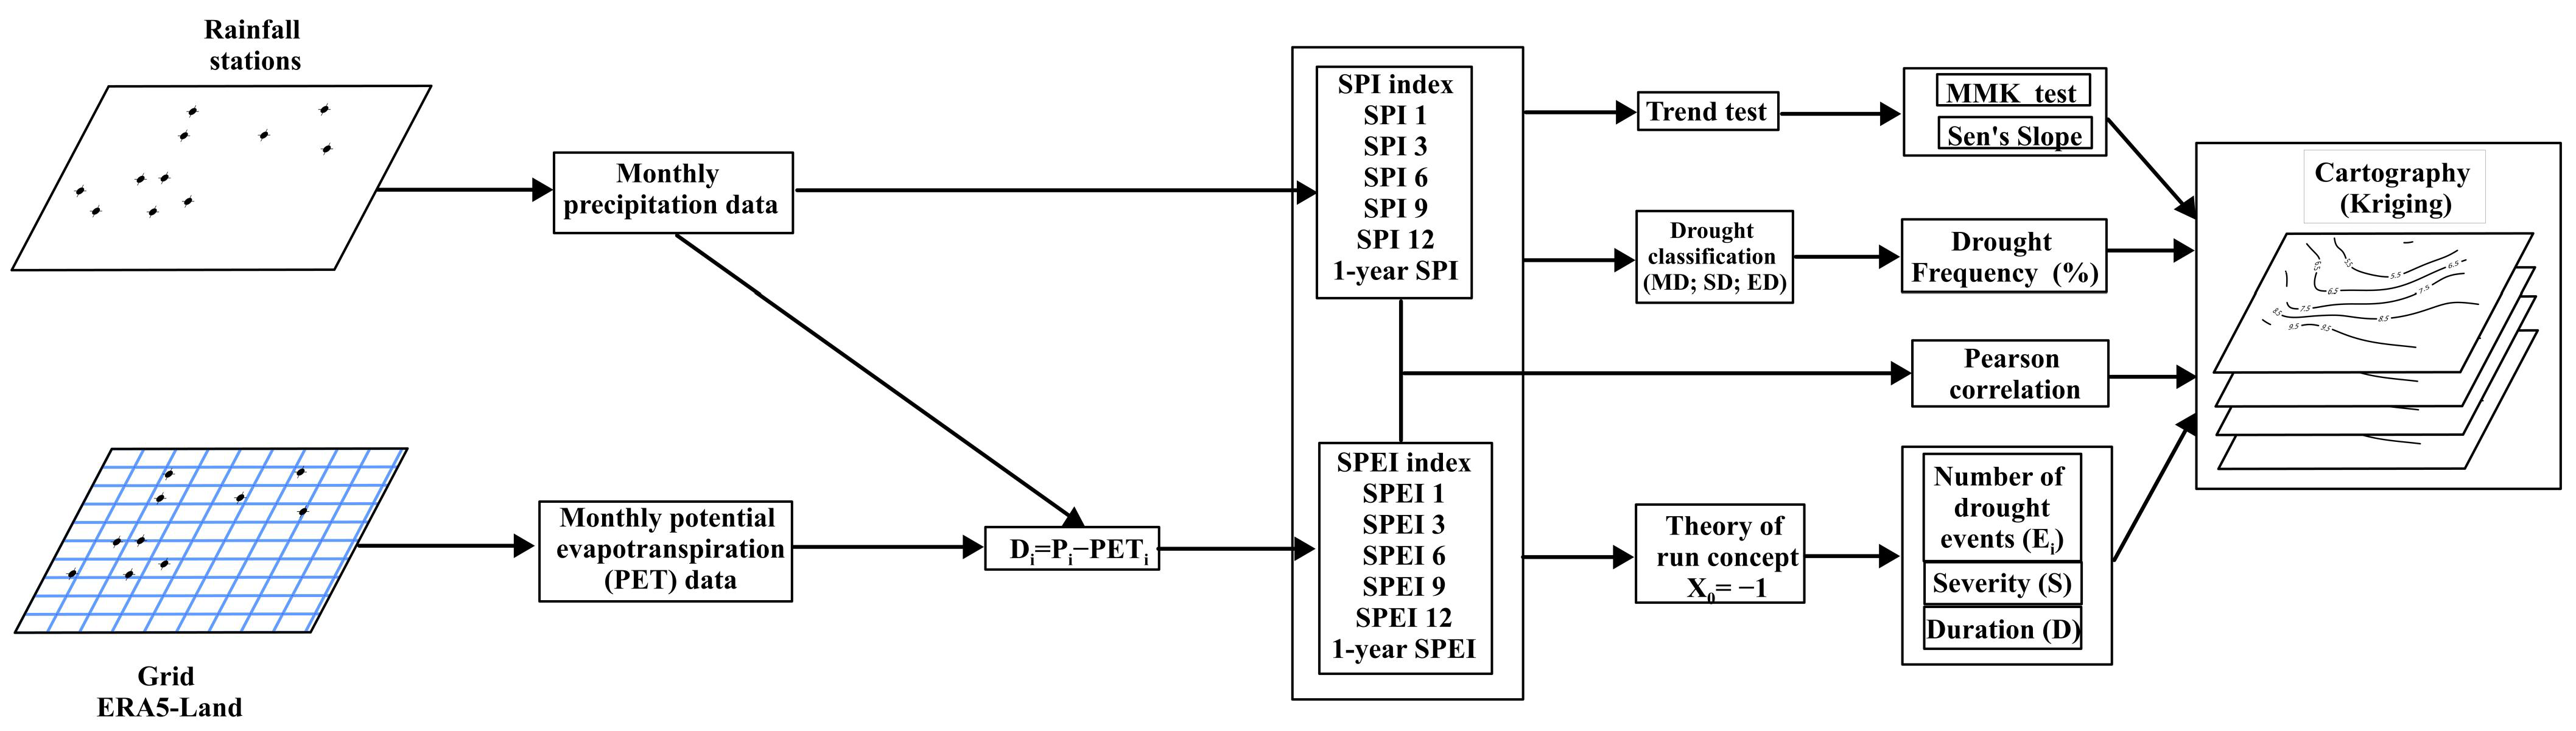
2. Materials and Methods
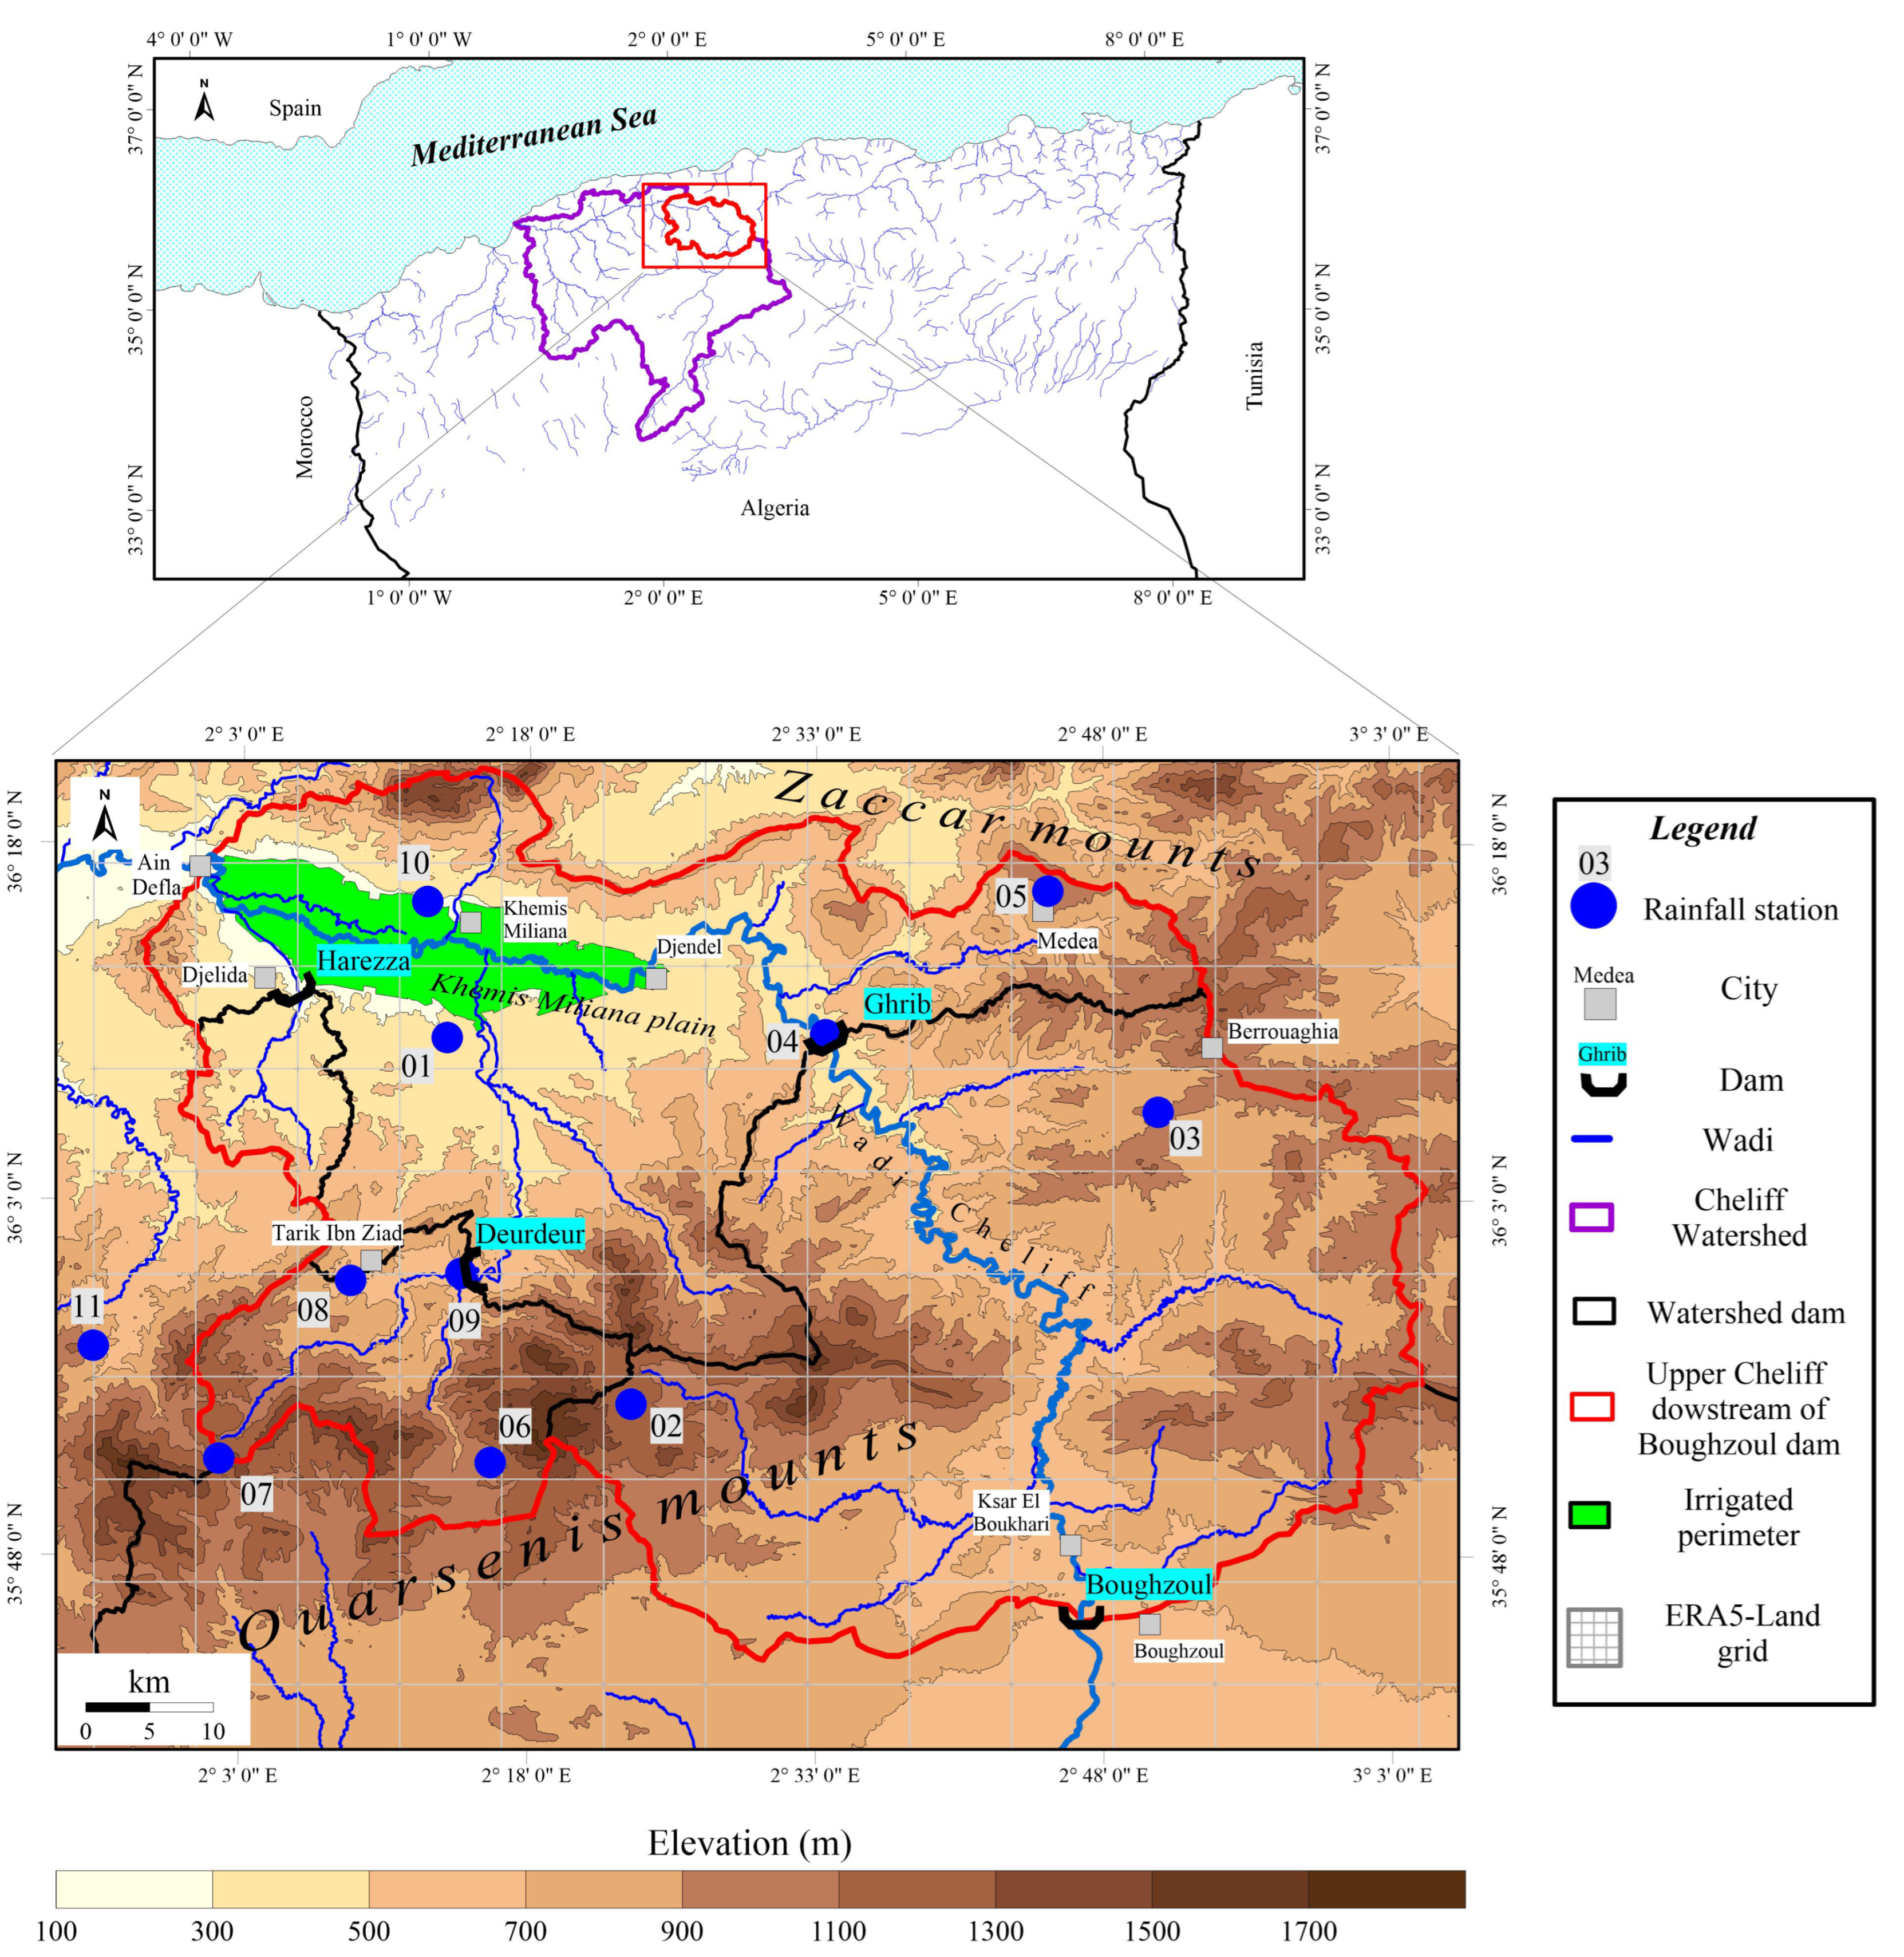
2.1. Study Area

The Cheliff watershed, the largest basin in northern Algeria (43,750 km2), is under the influence of a semi-arid climate [48]. The Cheliff wadi is the main river that rises from the Djbel Amour and flows for about 700 km before reaching the sea. In spite of its size, the runoff coefficient is equal to almost 8% of the average annual rainfall [49].
The Upper Cheliff located downstream of the Boughzoul dam (in the north-east of Cheliff basin) covers an area of 4777 km2, bounded by two mountain ranges, the Zaccar to the north and the Ouarsenis to the south. According to the digital elevation model (DEM) of north Algeria, with a resolution of 100 m, validated by Rezak et al. [50], the relief varies from 250 (Khemis Miliana plain) to over 1600 m (Ouarsenis mountains) (Figure 1).
The study area is characterized by wet, relatively cold winters and hot, dry summers [42]. The upper Cheliff is characterized by considerable variability in precipitation, from 250 in the south (Boughzoul dam) to 730 mm in the north (summits of Zaccar mounts). However, the rainfall quantile corresponding to a 5-year dry return period (Pf0.2) does not exceed 550 mm in the highest relief [43]. The average annual temperatures vary between 13 °C in the summits to 19 °C in the Harezza catchment area (Table 1). Evapotranspiration (PET) varies up to 1600 mm per year in the Khemis Miliana plain [51]. The agricultural water deficiency reached 1300 mm per year [52]. According to the National Statistics Office of Algeria [53], more than 700,000 people live in the upper Cheliff basin, 12.5% of whom live in rural areas. The catchment area is used for 41.76% as arable land (Table 2). The largest area used for agriculture is located mainly in the western part of the basin where an irrigation system has been operating since 1941. The irrigation system is actually supplied by three dams (Ghrib, Deurdeur and Harezza) with a capacity of 280, 115 and 75 Hm3, respectively [54]. The irrigation network covers an area of 20,300 ha.

2.2. Data

Monthly and annual precipitation data of 11 rainfall stations (Table 1) were used for drought analysis and modelling. These observed series, provided by the National Hydraulic Resources Agency (ANRH) and the National Institute of Field Crops (ITGC), cover a common period of 39 years (1982/83–2020/21). It should be noted that the hydrological year in this region runs from September to August (e.g., hydrological year September 1982–August 1983).
The monthly potential evapotranspiration data are used to estimate the simplified water balance (D = P − PET) in the calculation of the SPEI. Due to the lack of the observed data series in this region, the PET data are derived from the ERA5-Land models [56], available as a grid with spatial resolution of 0.1° (https://cds.climate.copernicus.eu/, 17 April 2025). The data for the 11 stations is extracted by selecting the data from the nearest grid node. According to many authors, ERA5-Land data are used in many drought studies in the world, particularly for dry areas [38,57,58].

2.3. Meteorological Drought Index

In order to take account of the complex nature of droughts, several indices are generally used, adapted as far as possible to the region under study [10,41]. To characterize the drought in the upper Cheliff, two meteorological drought indices were used. SPI and SPEI are two indices often used to assess the drought in the world. The choice of both indices has been made on the basis of ease of use and data availability. In this study, the calculation of two indices has been carried out in R software using SPEI Package v.1.8.1 [59] on different time scales (1 year, 1 month, 3 months, 6 months, 9 months and 12 months). To define the intensity of periods for each time scale, a drought classification system was introduced based on the SPI and SPEI. It was given by McKee et al. and Vicente-Serrano et al. [45,60]: extremely humid (EH ≥ 2); severely humid (SH: 1.5 to 1.99); moderately humid (MH: 1 to 1.49); close to normal (CN: −0.99 to 0.99); moderately dry (MD: −1.49 to −1); severely dry (SD: −1.99 to −1.5); extremely dry (ED ≤ −2). Pearson correlation coefficient (R) was used to determine the linear relationship between the time series of two indices at different time scales. This coefficient is calculated according to Equation (1).
R S P I i , S P E I i = ( X i X ¯ i ) ( Y i Y ¯ i ) σ X σ Y
where
  • X i and Y i are the SPI and SPEI at time scale i, respectively;
  • σ is the standard deviation of SPI and SPEI at time scale i;
  • X ¯ and Y ¯ are the mean of SPI and SPEI at time scale i.

2.3.1. Standardized Precipitation Index (SPI)

The Standardized Precipitation Index (SPI) was developed by McKee et al. [60]. It is frequently used in many parts of the world [16,38,61,62,63,64,65], including Algeria [41,42,48,66,67,68]. This index, recommended by the World Meteorological Office [69], has the advantage of quantifying the precipitation deficit or surplus on a given time scale (from monthly onwards) over a period of at least 30 years [60]. The calculation method is described in several research papers [47,60,62,66,70], by fitting a probability distribution function (gamma distribution) to the accumulated precipitation [47]. The calculation of the index is indicated in the following formula:
S P I i , j = f ( P i , j ) μ σ
where
  • f ( P i , j ) : transformed sum of precipitation for month i on time scale j;
  • μ: mean of normalized values of p;
  • σ: standard deviation of normalized values of p.

2.3.2. Standardized Precipitation Evapotranspiration Index (SPEI)

The SPEI is based on precipitation and temperature data, and has the advantage of combining a multiscalar character with the ability to include the effects of temperature variability on drought assessment [45]. This index allows the effect of evapotranspiration on the development of drought to be taken into account through a basic water balance calculation. It is one of the most widely used indices in the world [38,71,72,73,74]. Two parameters, precipitation (P) and potential evapotranspiration (PET), are taken into account in the calculation of the SPEI. The value ( D i , j = P i , j P E T i , j ) is adjusted to the log-logistic distribution in the index calculation programme. According to Beguería et al. [75], the recommended method to estimate the PET parameter is the FAO-56 Penman-Monteith equation [76]. The details of the calculation of SPEI are summarized in the paper of Vicente-Serrano et al. [45].

2.4. Identifying the Characteristics of Meteorological Drought Using Theory of Run Concept

The ‘Theory of run’ concept was introduced by Yevjevich [77]. Its aim is to detect the various statistical characteristics of drought, such as number of events, severity and duration. By giving a threshold X0, we can detect the various drought events on several time scales. A ‘sequence’ is explained, in the context of a time series of the drought parameter Xt, as any values above or below a given threshold X0, called ‘positives sequences’ [20] and ‘negatives sequences’ [78], respectively. A drought event (Ei) begins at a time (ti) when Xt < X0 and ends at a time (te) when Xt > X0. The X0 threshold is set to −1 or less for the study of drought events [60]. The severity (S) or ‘run-sum’ is defined as the accumulated water deficit (for example: rainfall or average monthly flow) during the drought. The ‘run-length’ or duration of the event (D) is defined as the period between the start of the event (ti) and the end of the event (te), expressed in months. Severity and duration are expressed by Equations (3) and (4), respectively.
S E = t i t e X t
D E   =   t e t i
In this study, the focus was on the spatial analyses of drought frequency, number of drought events, maximum and average drought severity, and maximum duration of one drought event at different time scales. The drought frequency is considered here as the ratio in % between the number of months of drought and the total number of months observed. A geostatistical method was used to map each analyzed parameter based on a kriging method [79], using Surfer (V.28) software [80]. After several attempts, the best proven variogram model is the linear model detected using the root mean square error (RMSE) [81].

2.5. Trend Analyses

The modified Mann–Kendall (MMK) test is one of the tests is developed by Hamed and Ramachandra Rao [82]. It used to check the stationarity of each index used at different time scales. The modified Mann–Kendall test (MMK), comparable to the original version (MK), was recommended by the World Meteorological Office [83]. The MMK test is more suitable for testing time series trends because of its ability to improve performance in certain situations, namely the presence of autocorrelation in the data [84]. It has often been used in recent studies of drought [38,41]. The significance is determined at a 95% confidence level. The Sen’s slope [85] is used to determine the magnitude and direction of the trend (down for negative values, up for positive values).
All methods used in this study are summarized in the scheme (Figure 2).

3. Results

3.1. The Course of Annual SPI and SPEI Values (1982/83–2020/21)

The analysis of annual SPI values indicates increasing trends for 10 of 11 meteorological stations, the exception being the Bordj El Amir AEK station, where a decreasing trend in precipitation was recorded in the analyzed period. This means that most of the precipitation stations in the analyzed catchment area recorded an increase in the SPI trend and probably a decrease in the intensity of meteorological drought (Figure 3). An increasing trend in SPEI was recorded at the Medea station, while at the remaining stations, presented in the Supplementary Materials (Figures S2 and S3), a decreasing trend was associated with an increase in the intensity of meteorological drought. The Bordj El Amir AEK station is noteworthy, where the strongest decreasing trends in SPI and SPEI were recorded, which may be due to the location of the station in the mountains and the relative proximity to the arid area. The strongest meteorological droughts were observed in 1982/83, 2020/21. Wet years were observed in 2003/04, 2018/19. As can be seen in Figure 3, both dry and wet periods tend to cluster in longer periods of years. There is a strong correlation between the SPI and SPEI indices over a 1-year period. It rises from west to east, from a low of 0.87 to a high of 0.95 (Figure S4).

3.2. The Monthly Variability of SPI and SPEI Values (1982/83–2020/21)

The analysis of monthly time series of two meteorological drought indices (SPI and SPEI) provides a more detailed study of drought levels over time. Figure 4 shows the course of monthly SPI and SPEI values in different time scales (1, 3, 6, 9 and 12 months) for the Derrag station from September 1982 to August 2021. It was found that SPI and SPEI values show fluctuations in both wet and dry periods even within the same year. The minimum SPI values are lower than SPEI values, which is especially visible in shorter time scales in dry periods. In the case of the 1-month time scale, the minimum SPI 1 value is −3.87, while the minimum SPEI 1 value is −2.42 (December 2015). In the 3-month time scale, the minimum SPI 3 value is −3.53, while SPEI 3 is −1.79. In the remaining time scales (6, 9 and 12 months), smaller discrepancies in the course of SPI and SPEI values are observed, and thus there is a better match between SPI and SPEI values. In turn, the maximum SPI values are lower than the maximum SPEI values at the same time in wet periods. Meteorological droughts in short time scales are more intense and characterized by a relatively short duration. Information about other stations is given in the Supplementary Materials (Figures S5–S14).

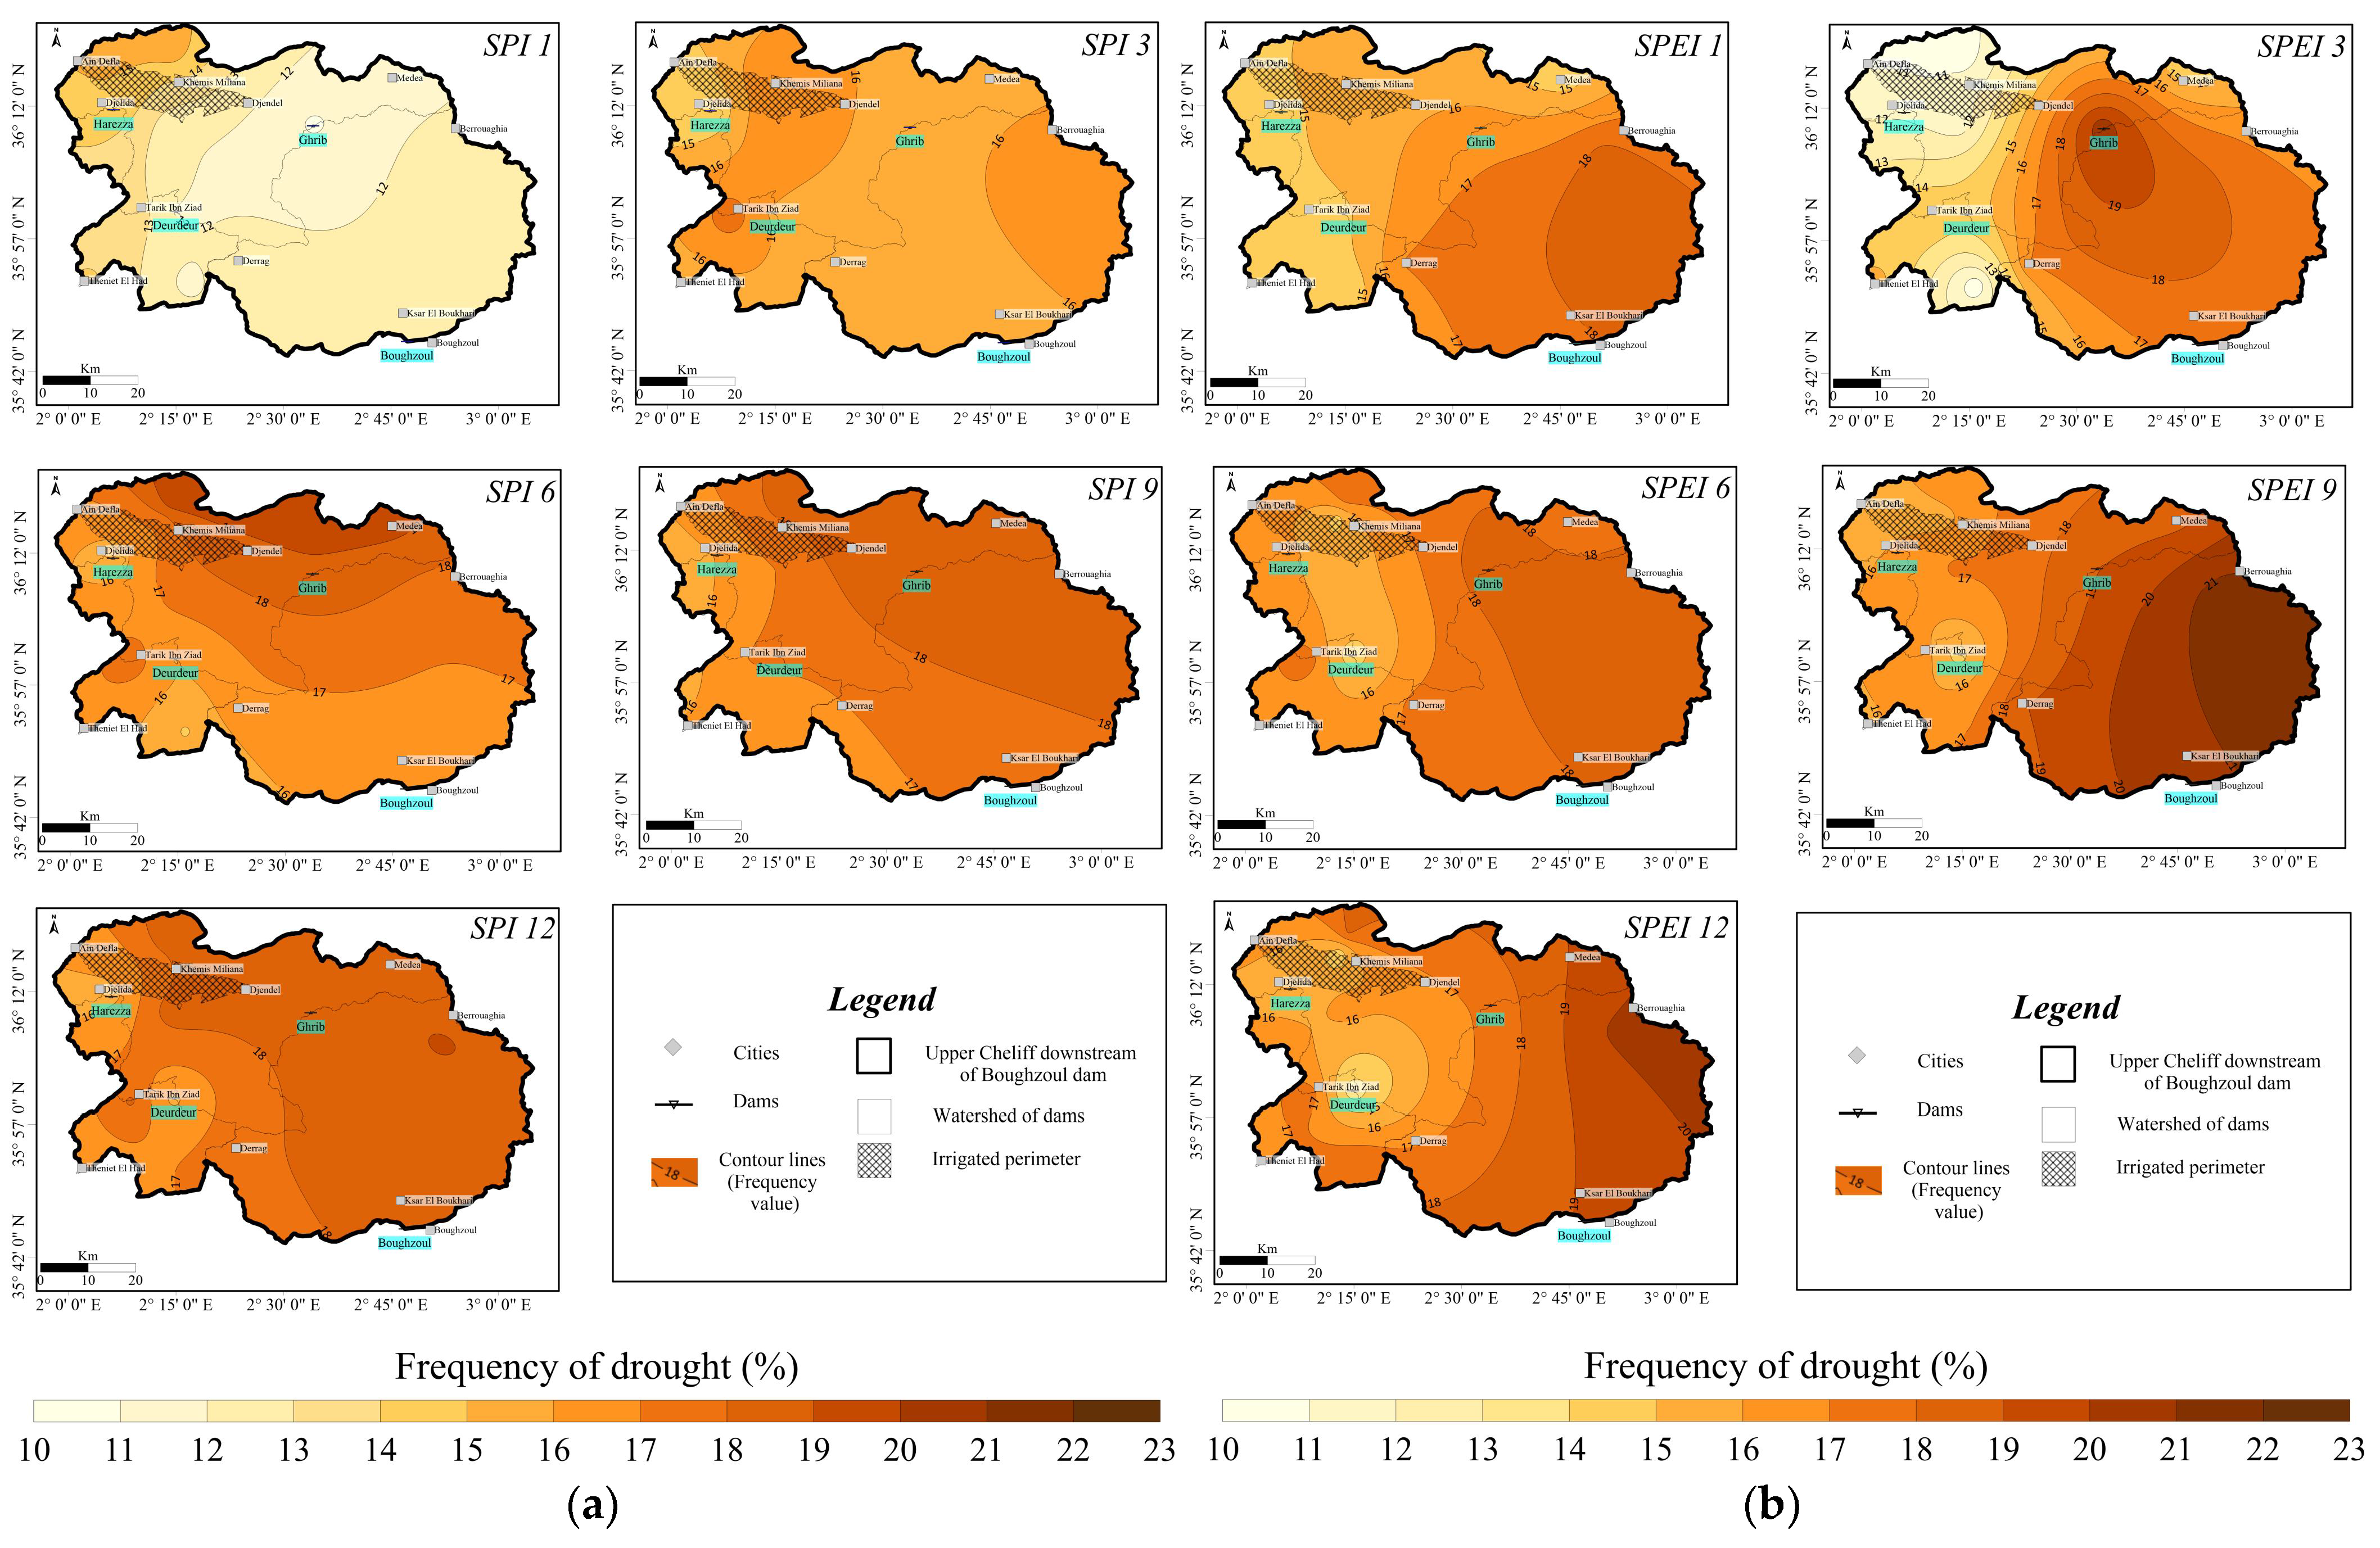
3.3. Spacial Analyses of Frequency Drought Characteristics Using SPI and SPEI Indices

Using the “ordinary kriging” method with a linear variogram model, the features of meteorological drought (drought frequency, number of drought events, maximum duration of meteorological drought, maximum drought severity) were mapped (Figure 5, Figure 6 and Figure 7). Figure 5 shows that the highest frequency of drought is located in the eastern and central regions of the basin, while the western region of the basin is much less affected by droughts. The frequency of droughts is much higher in the case of SPEI than SPI. In short periods, accumulated droughts last shorter (about 16% of the time for SPI 1, 3) than in longer periods (from 16% to 22% for SPI/SPEI 6, 9 and 12).
The frequency of droughts divided into its categories (moderate drought, severe drought, extreme drought) is presented in the Supplementary Materials (Figures S15–S17). The moderate drought (SPI/SPEI from −1.0 to −1.49) mainly affected the eastern and central regions of the basin, and to a lesser extent the western region of the basin. Interestingly, differences were observed in the spatial distribution of the frequency of severe and extreme drought between SPI and SPEI. Severe droughts show a higher frequency on long-term scales (SPI 6, 9 and 12 months) in the eastern part of the area (max = 9%), while for SPEI 6, 9 and 12, the highest frequency of severe drought is observed in the western part of the region, reaching the 8% curve. In the case of the short-term time scales SPI/SPEI 1 and 3, a similarity was observed in the distribution of severe droughts, reaching a maximum frequency of 7% in the western and central parts of the area. A better agreement between SPI and SPEI was obtained in the spatial distribution of extreme droughts, which are most frequent in the western region of the basin. Regarding the spatial distribution of severe drought months, in the case of short-term SPI/SPEI scales, the spatial variability is small, while in the case of long-term scales (6, 9 and 12), the spatial variability is more pronounced (varies from 1% to 6%).

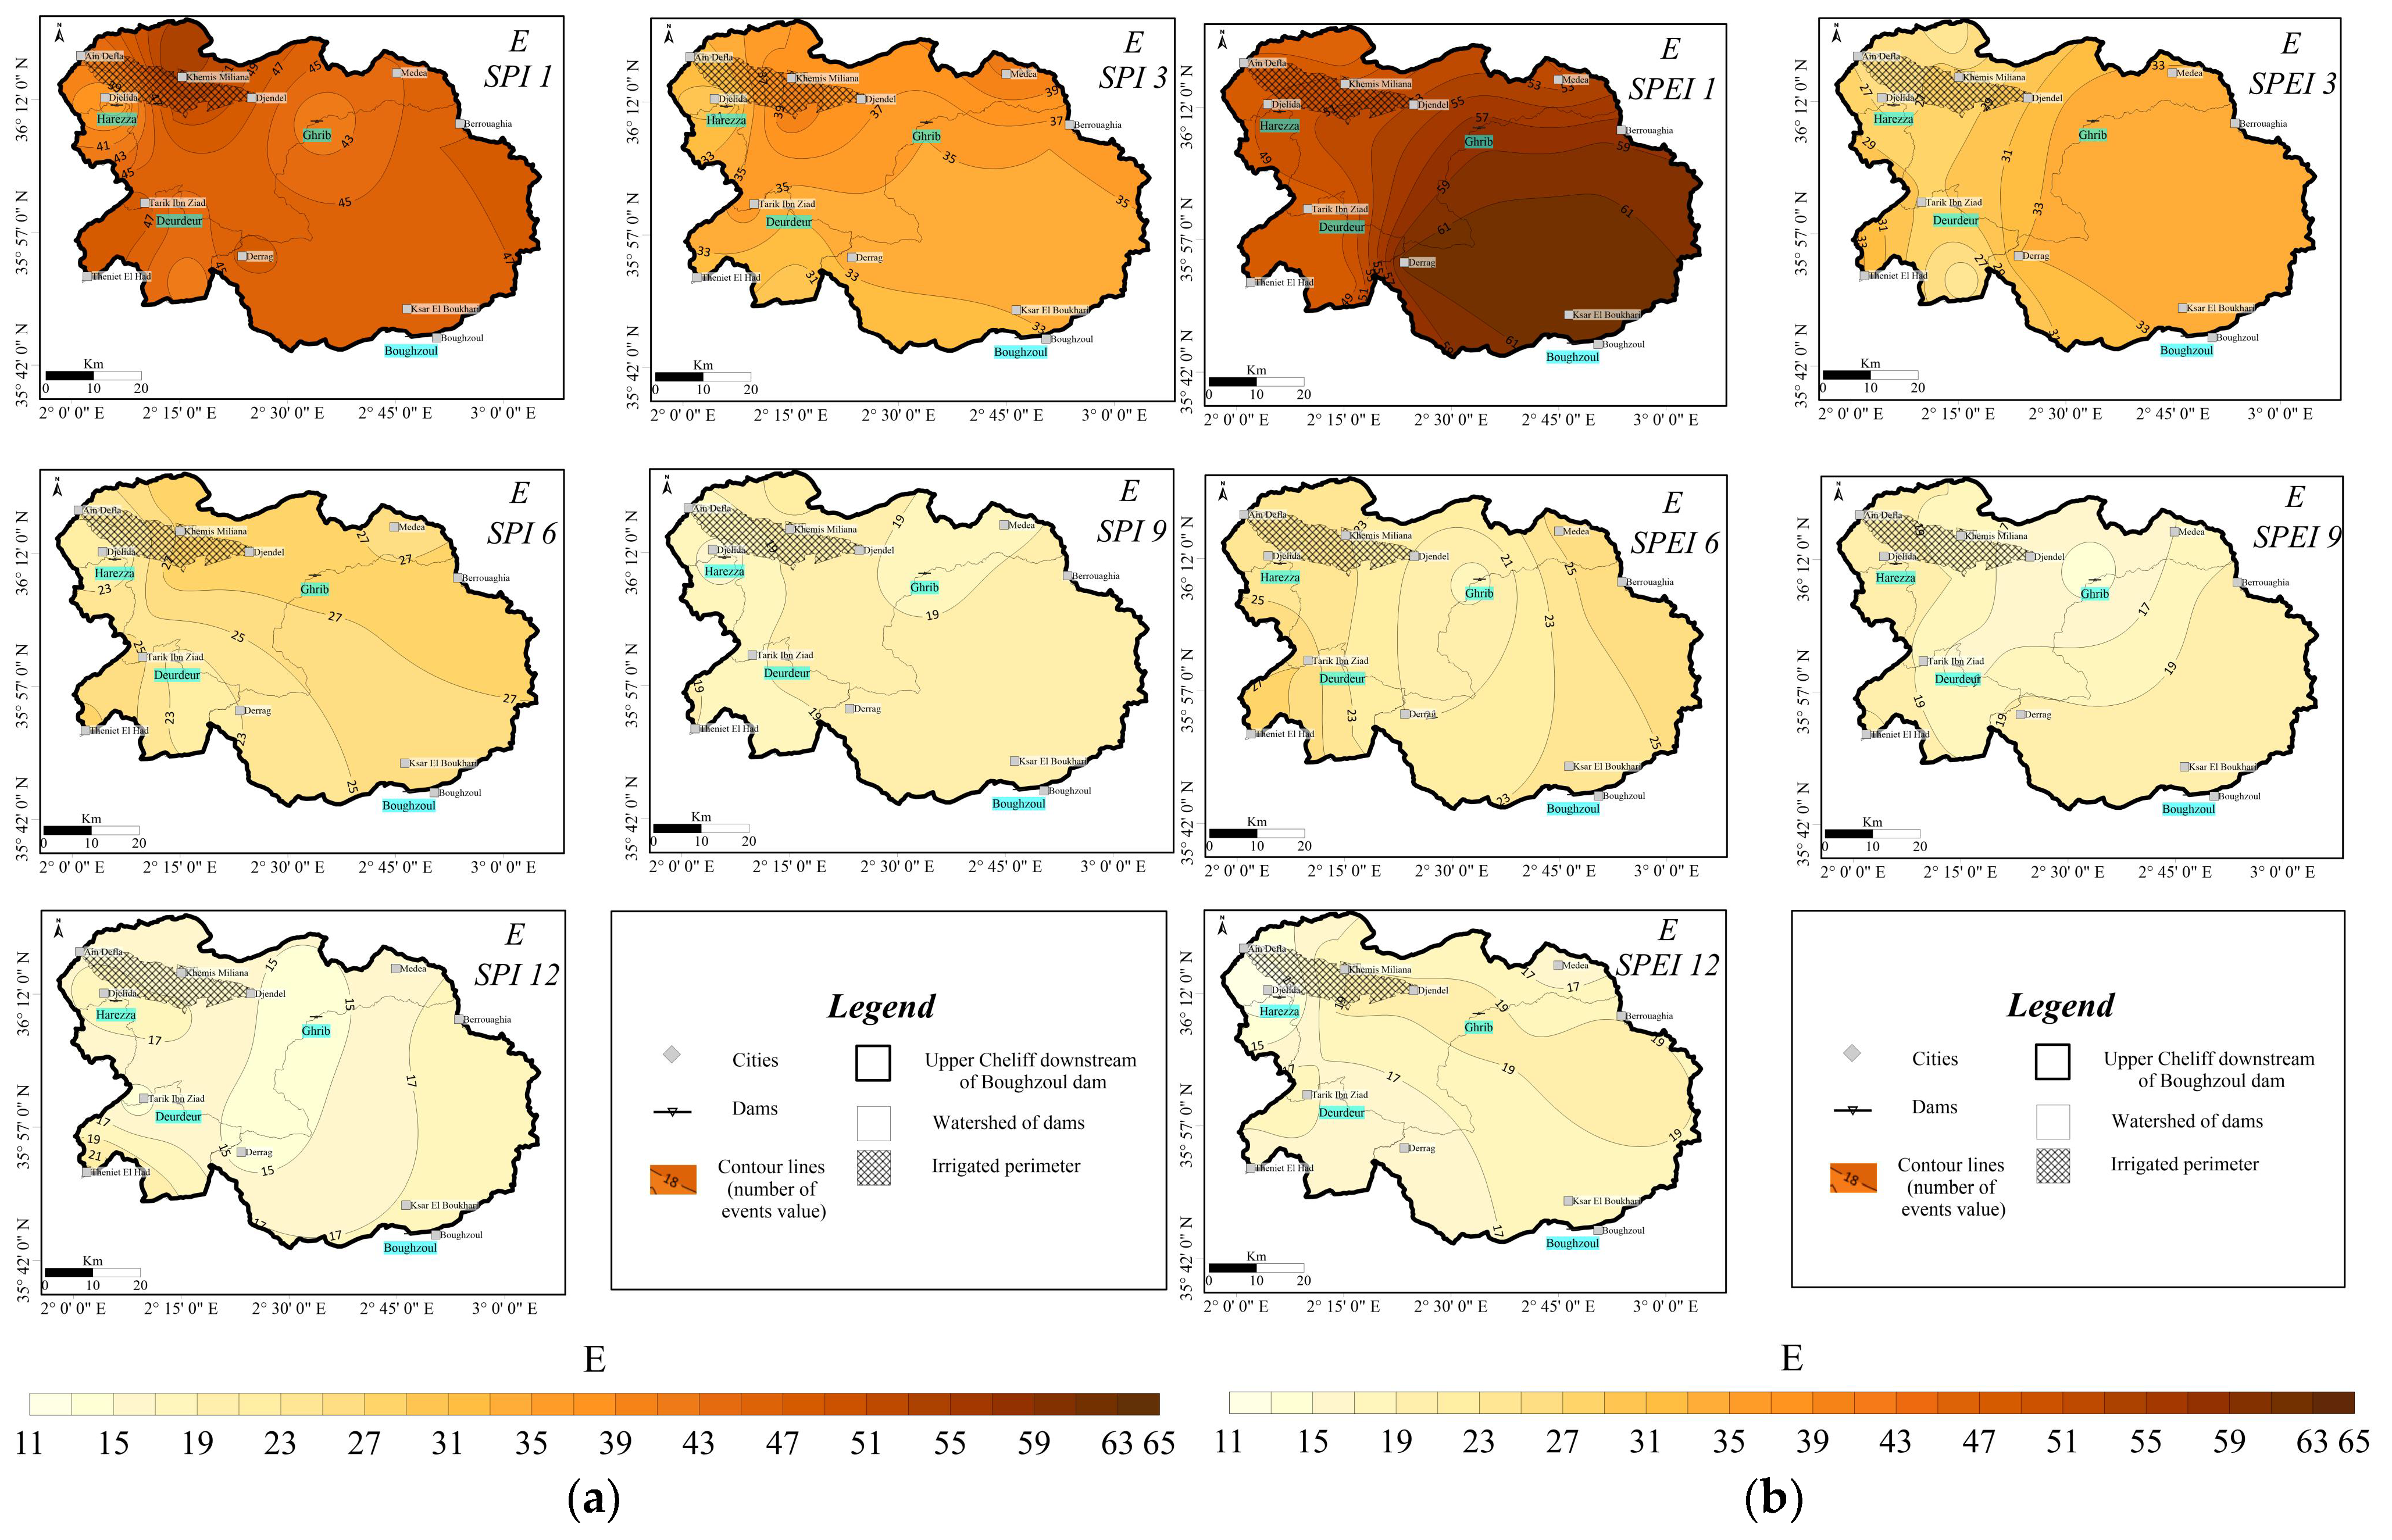
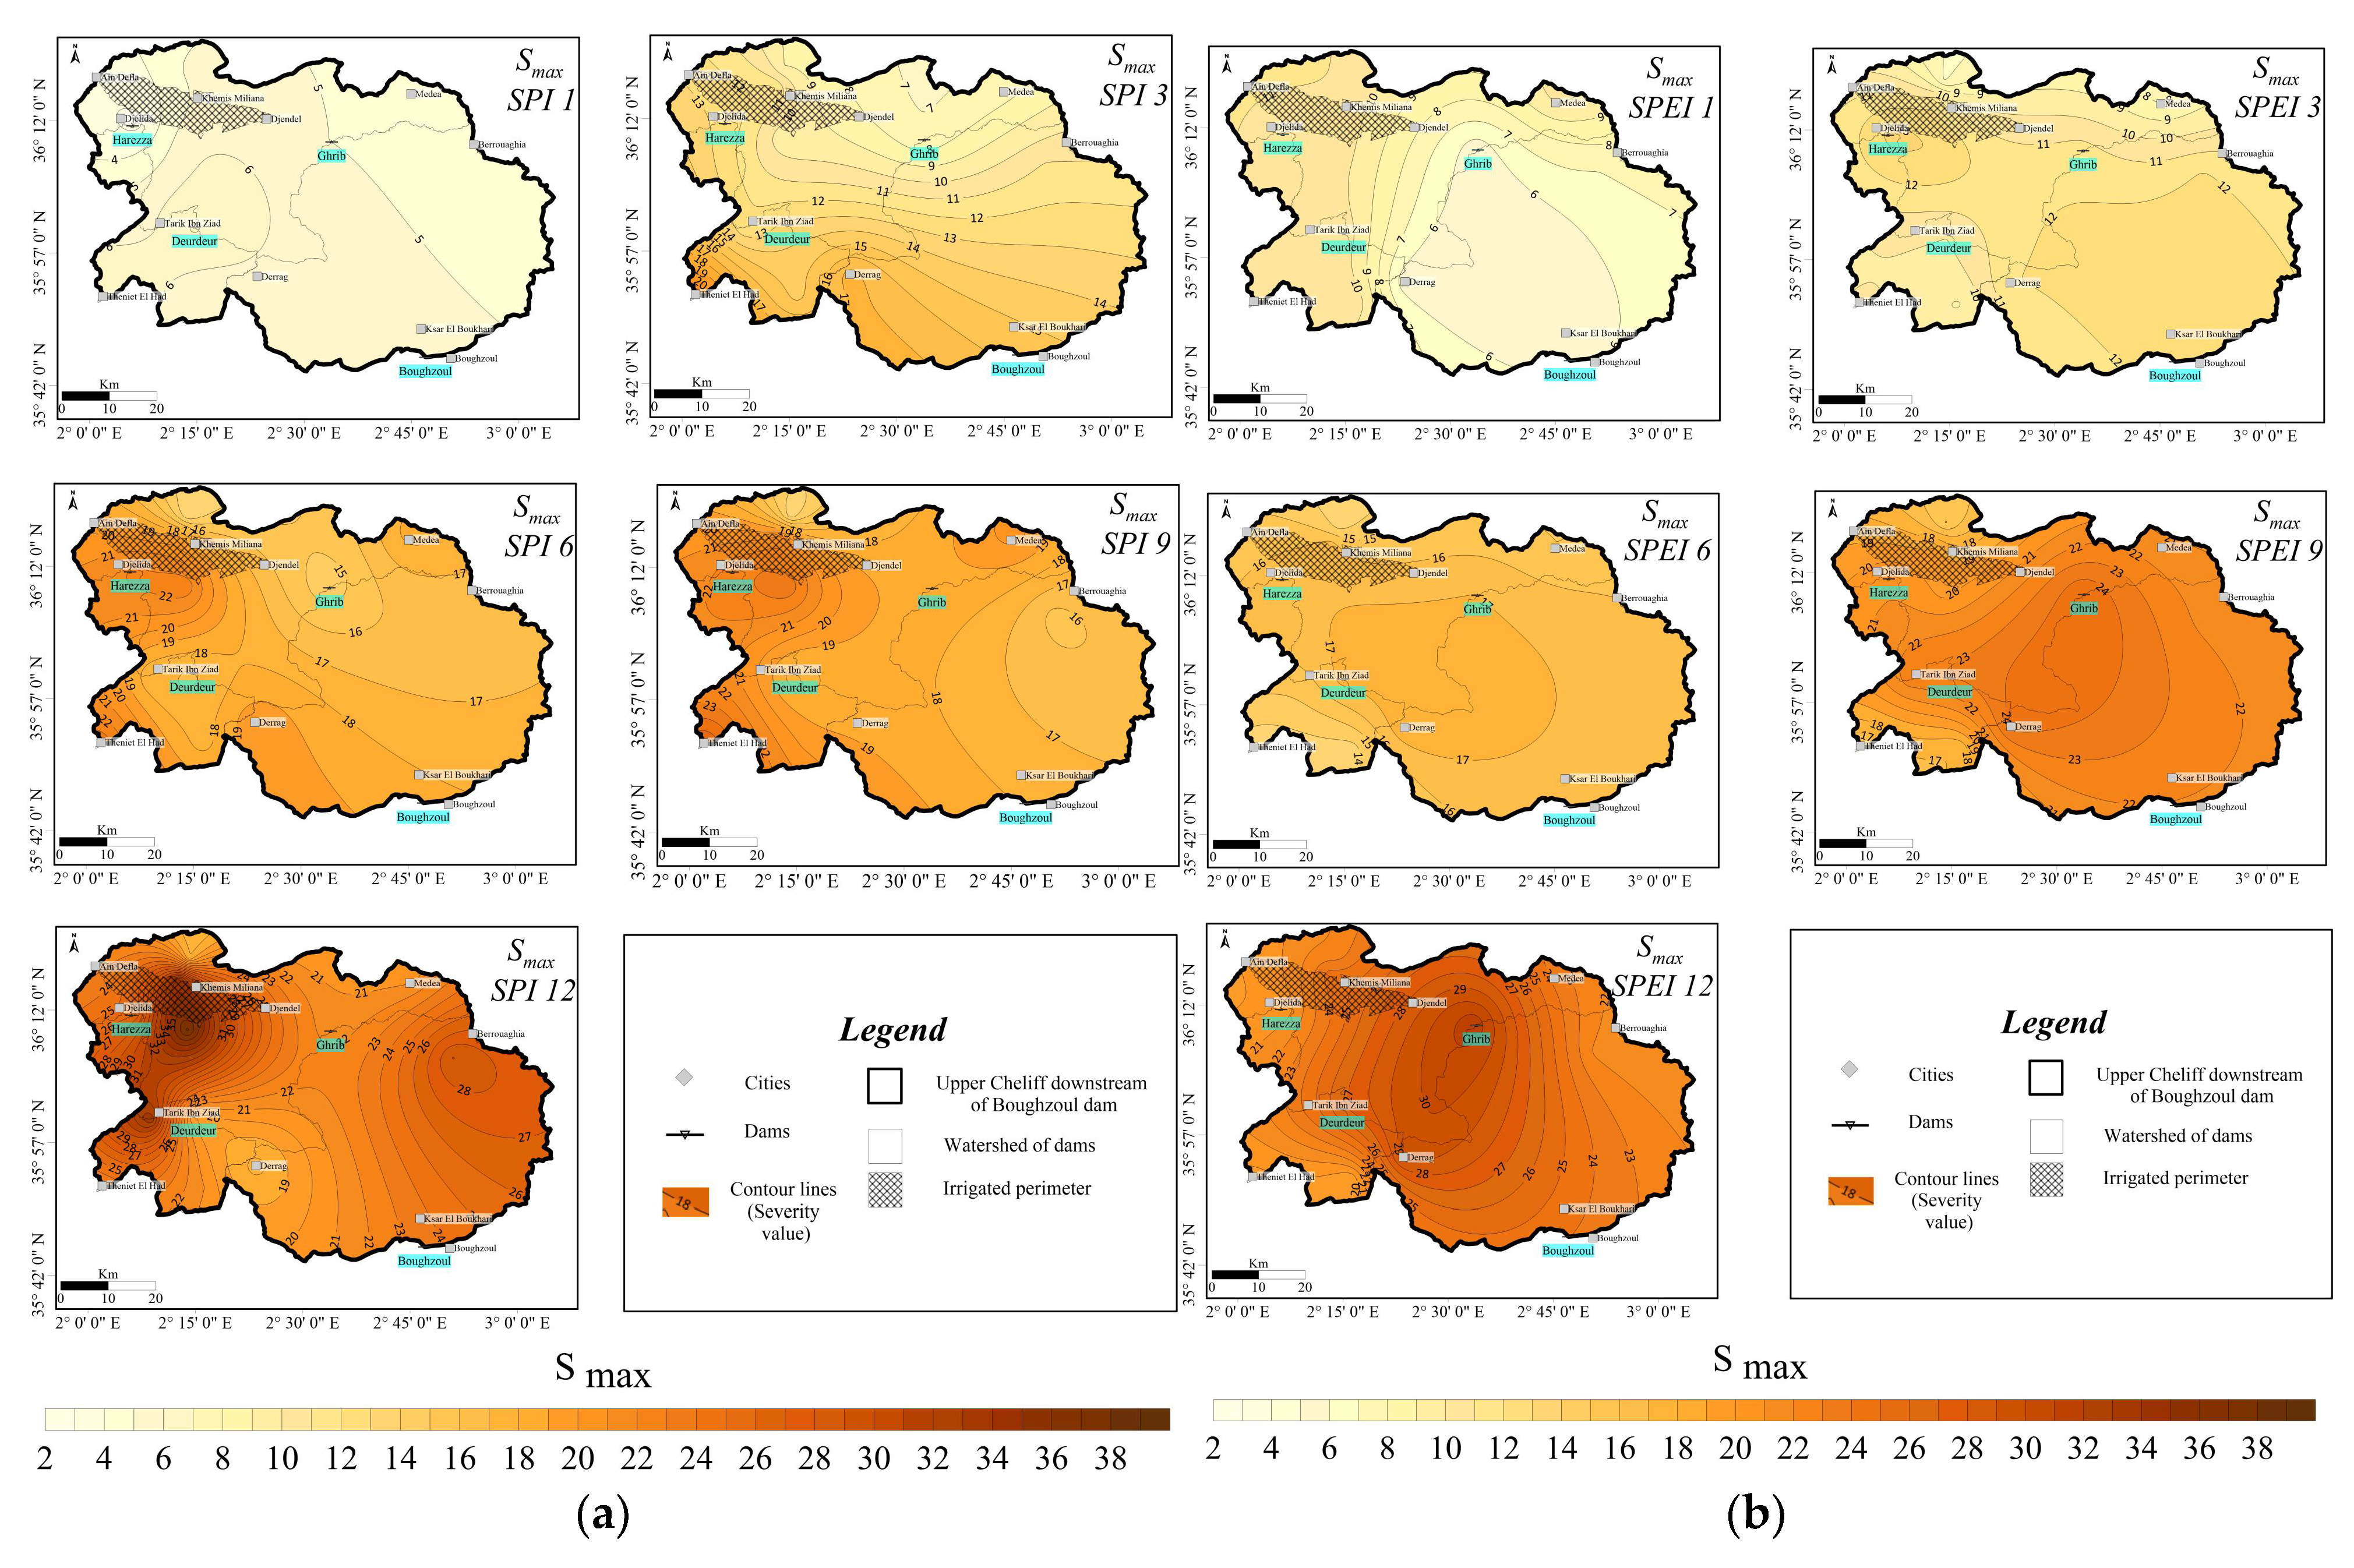
3.4. Number of Events and Severity and Duration of Meteorological Droughts (Theory of Run)

In short time scales, a greater number of drought events are visible, but their duration is short. These are often single months. The differences in the number of drought events between SPEI and SPI are clearly visible here. In the case of SPEI 1, there is a much greater number of drought events (from 49 to 65 events) than for SPI 1 (from 39 to 51). In a longer period of accumulation, e.g., 9 and 12 months, the number of drought events decreases, reaching similar values from about 13 to 19 (Figure 6). The number of meteorological drought events is the highest in short periods (1 month) and with the increase in the time scales, the number of events decreases, while the total duration of all droughts increases.
Based on the run theory concept, Figure 7 shows the evolution of meteorological drought events from September 1982 to August 2021 in Khemis ITGC station. The most remarkable drought events, taking both indices into account, were recorded in 1993/94, 2000/01 and 2020/21. During the first decades (from 1982/83 to 1998/99), the drought events estimated by SPI are more severe (S max from 5 to 38.21) and longer (Dmax from 4 to 20 months) than those recorded by the SPEI (Smax from 4 to 20 and Dmax from 3 to 11 months). However, the events estimated by SPEI are longer (Dmax from 4 to 15 months) and more severe (Smax from 10 to 24.40) from 2000 onwards. The dates of maximum severity can be distinguished in Figure 7 for each time scale. On the time scale of 1 month, SPI records Smax between November and December 2015 and SPEI between May and August 2021. On the time scales of 3 months and 6 months, the date of Smax is observed in 1994. On the time scales of 9 and 12 months, Smax estimated by SPI is observed in 1993/94. However, Smax estimated by SPEI is observed in 2000/01. Information about other stations (Derrag and Theniet El Had) is given in the Supplementary Materials (Figures S18 and S19).
Table 3 presents the events and extreme values (duration and severity) of drought for the SPI and SPEI indices in three chosen arbitrary stations (Derrag in Ghrib basin, Theniet El Had in Deurdeur basin and Khemis ITGC in irrigated perimeter). In the analyzed multi-year period, we observed five periods of exceptional drought intensity and duration in the region, namely 1983/84, 1993/94, 1987/88, the period from 1999/2000 to 2001/2002 and 2020/21. The SPEI shows a greater number of events (E) than the SPI.
The number of events (Es) observed by SPI varies, according to the time scale, between 15 and 48 events in Derrag station, from 19 to 49 events in Khemis ITGC station and from 15 to 48 events in Theniet El Had station. However, the number of Es observed by SPEI varies from 14 to 62 events in Derrag station, from 18 to 52 events in Khemis ITGC station and from 22 to 48 events in Theniet El Had station. Information about other stations is given in the Supplementary Materials (Table S1).
The analysis of the average drought severity (Figure S20), the maximum drought severity (Figure 8) and the maximum duration of a single drought event (Figure 9) show a similar spatial distribution for both SPI and SPEI. The lowest severity and duration are visible in short time scales (1, 3), while a much higher severity with maximum Smax = 38.21 (Table 3) is recorded in long periods of accumulation (6, 9 and 12 months). The increase in the maximum drought duration is the result of the accumulation of dry months (Figure 9).

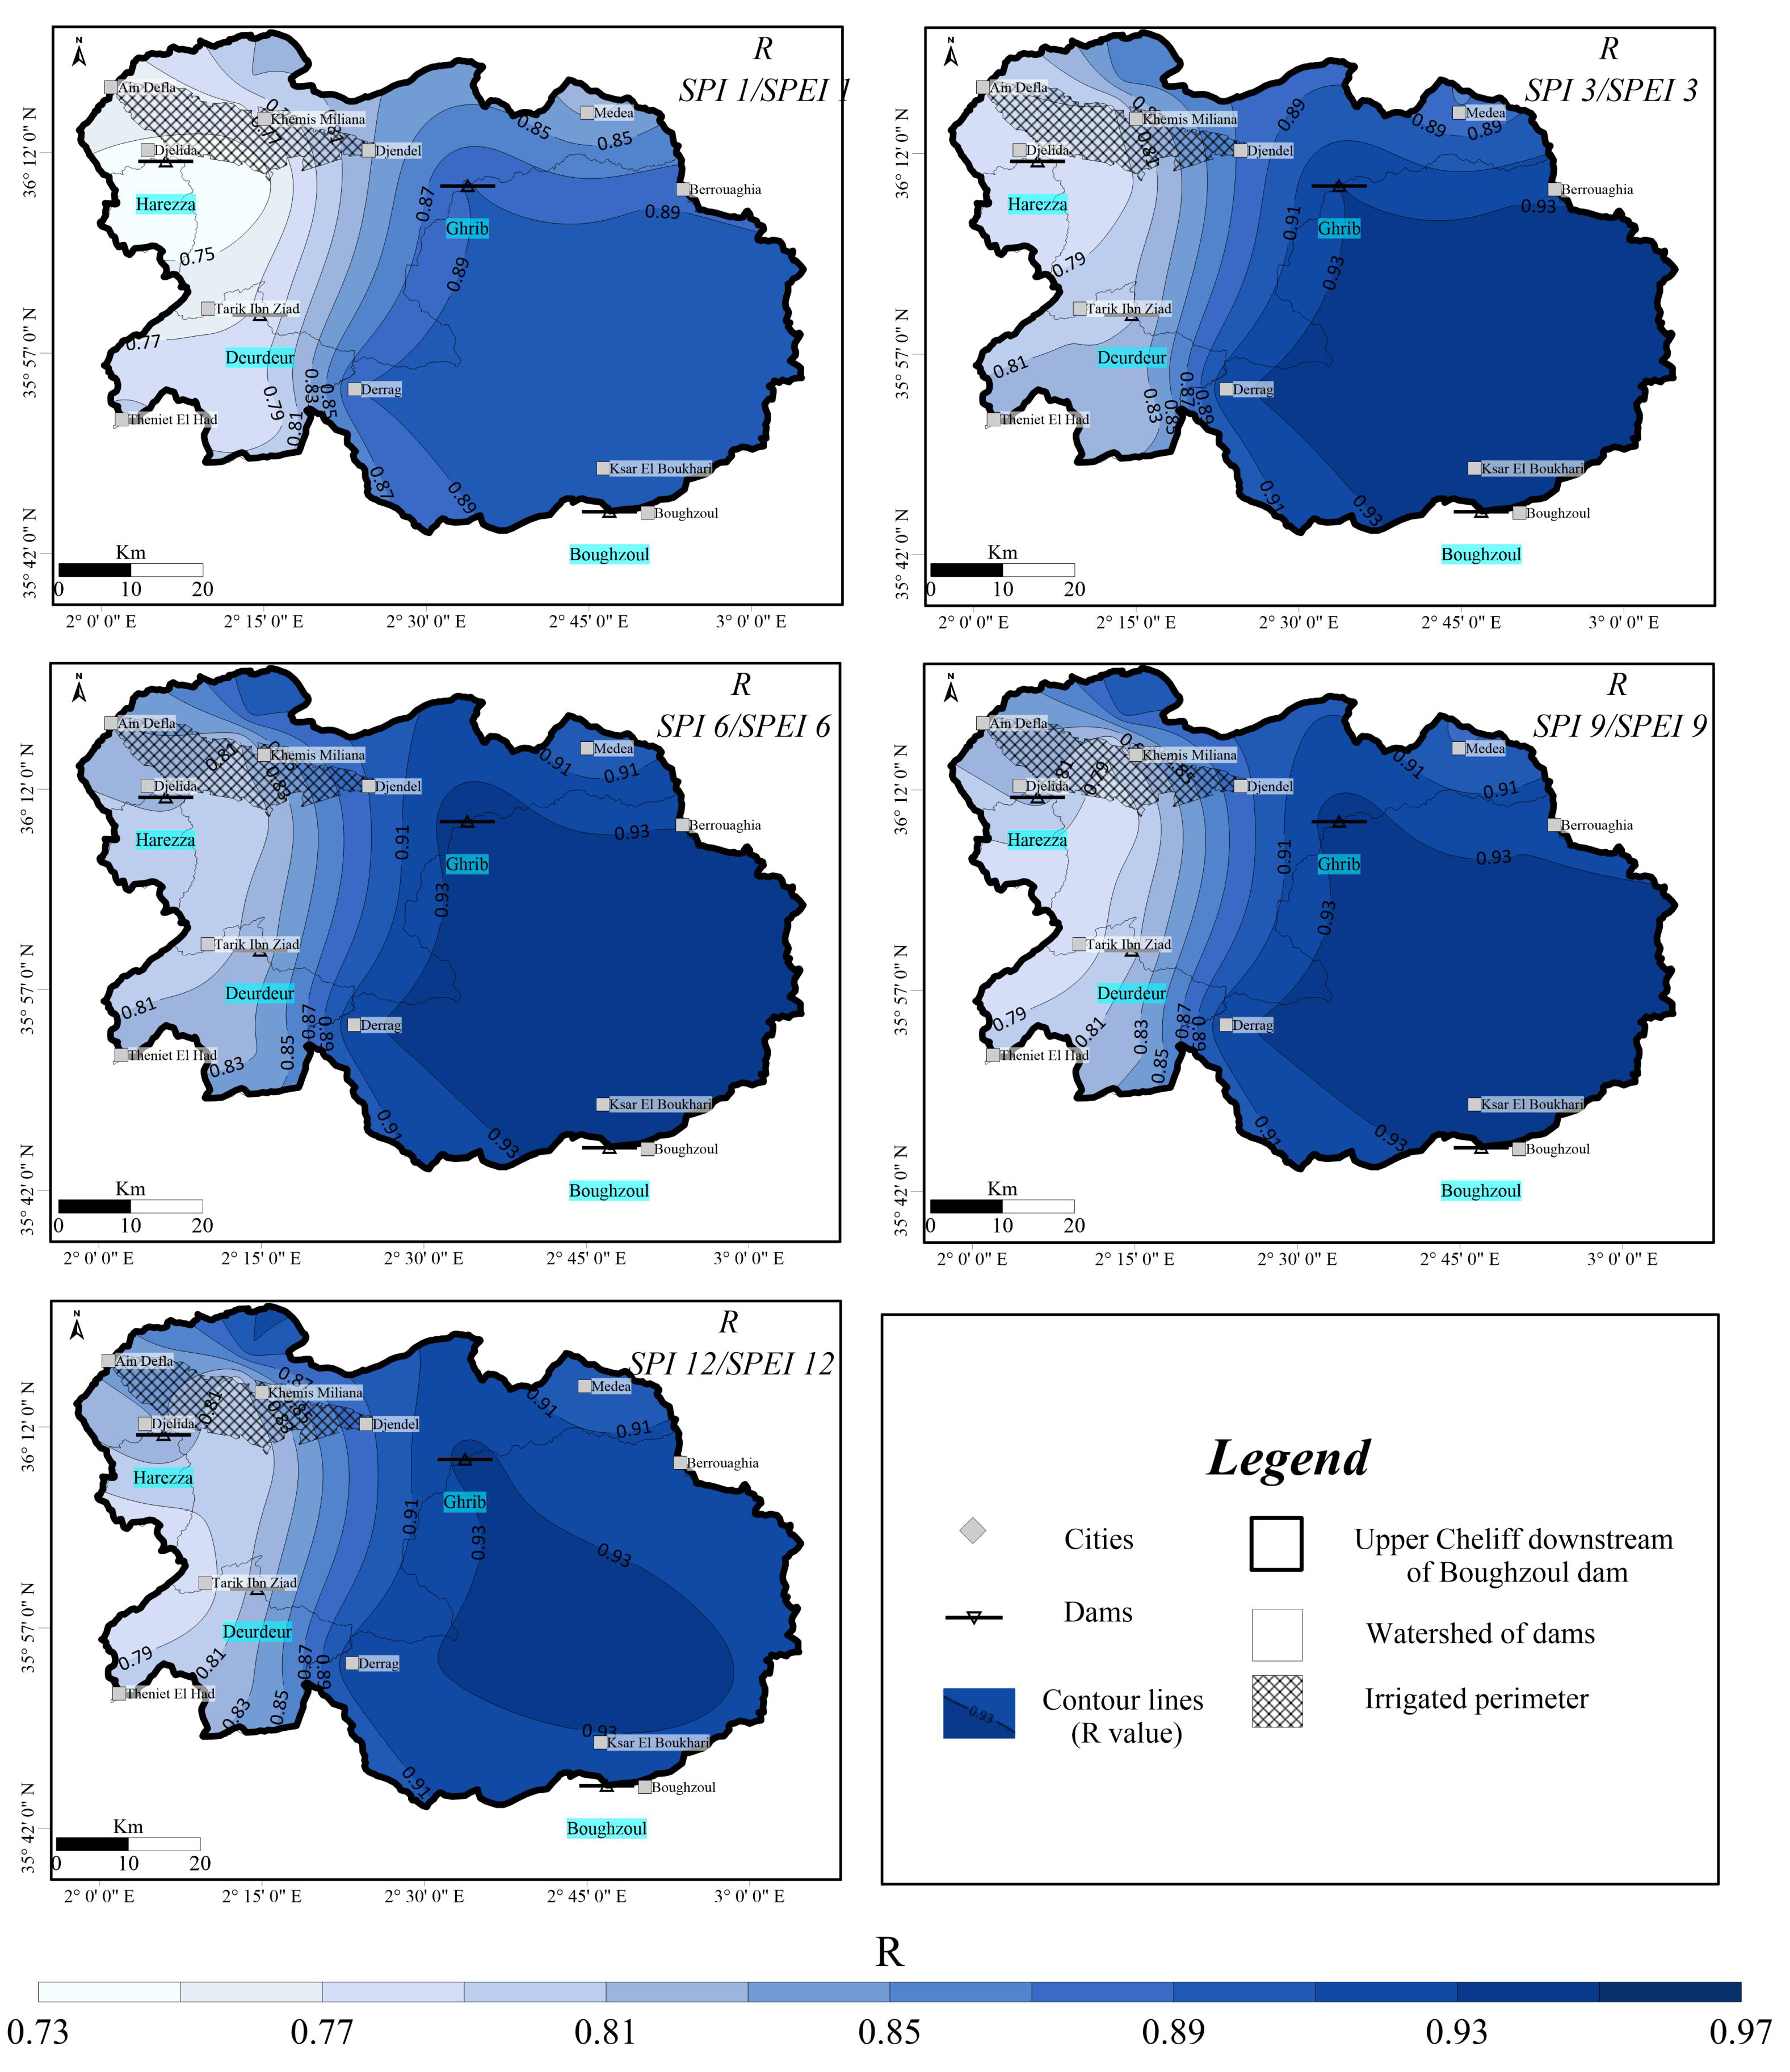
3.5. Correlations Between SPI and SPEI

The spatial distribution of the Pearson correlation coefficient between SPI and SPEI at different time scales is shown in Figure 10 and Table S2. The Pearson index values ranged from 0.73 to 0.97. The higher correlation values indicate the consistency between SPI, which takes into account only precipitation, and SPEI, which takes into account both precipitation and evaporation. When the correlation coefficient is equal to or higher than 0.8, a significant positive association is assumed [86,87]. The high values (>0.80) were recorded in the eastern part of the basin in the mountainous areas, while lower values (<0.80) were recorded in the western part of the basin in the lowlands. As a function of time scale, areas with R less than 0.80 were larger on longer time scales, while on shorter time scales these areas were smaller.

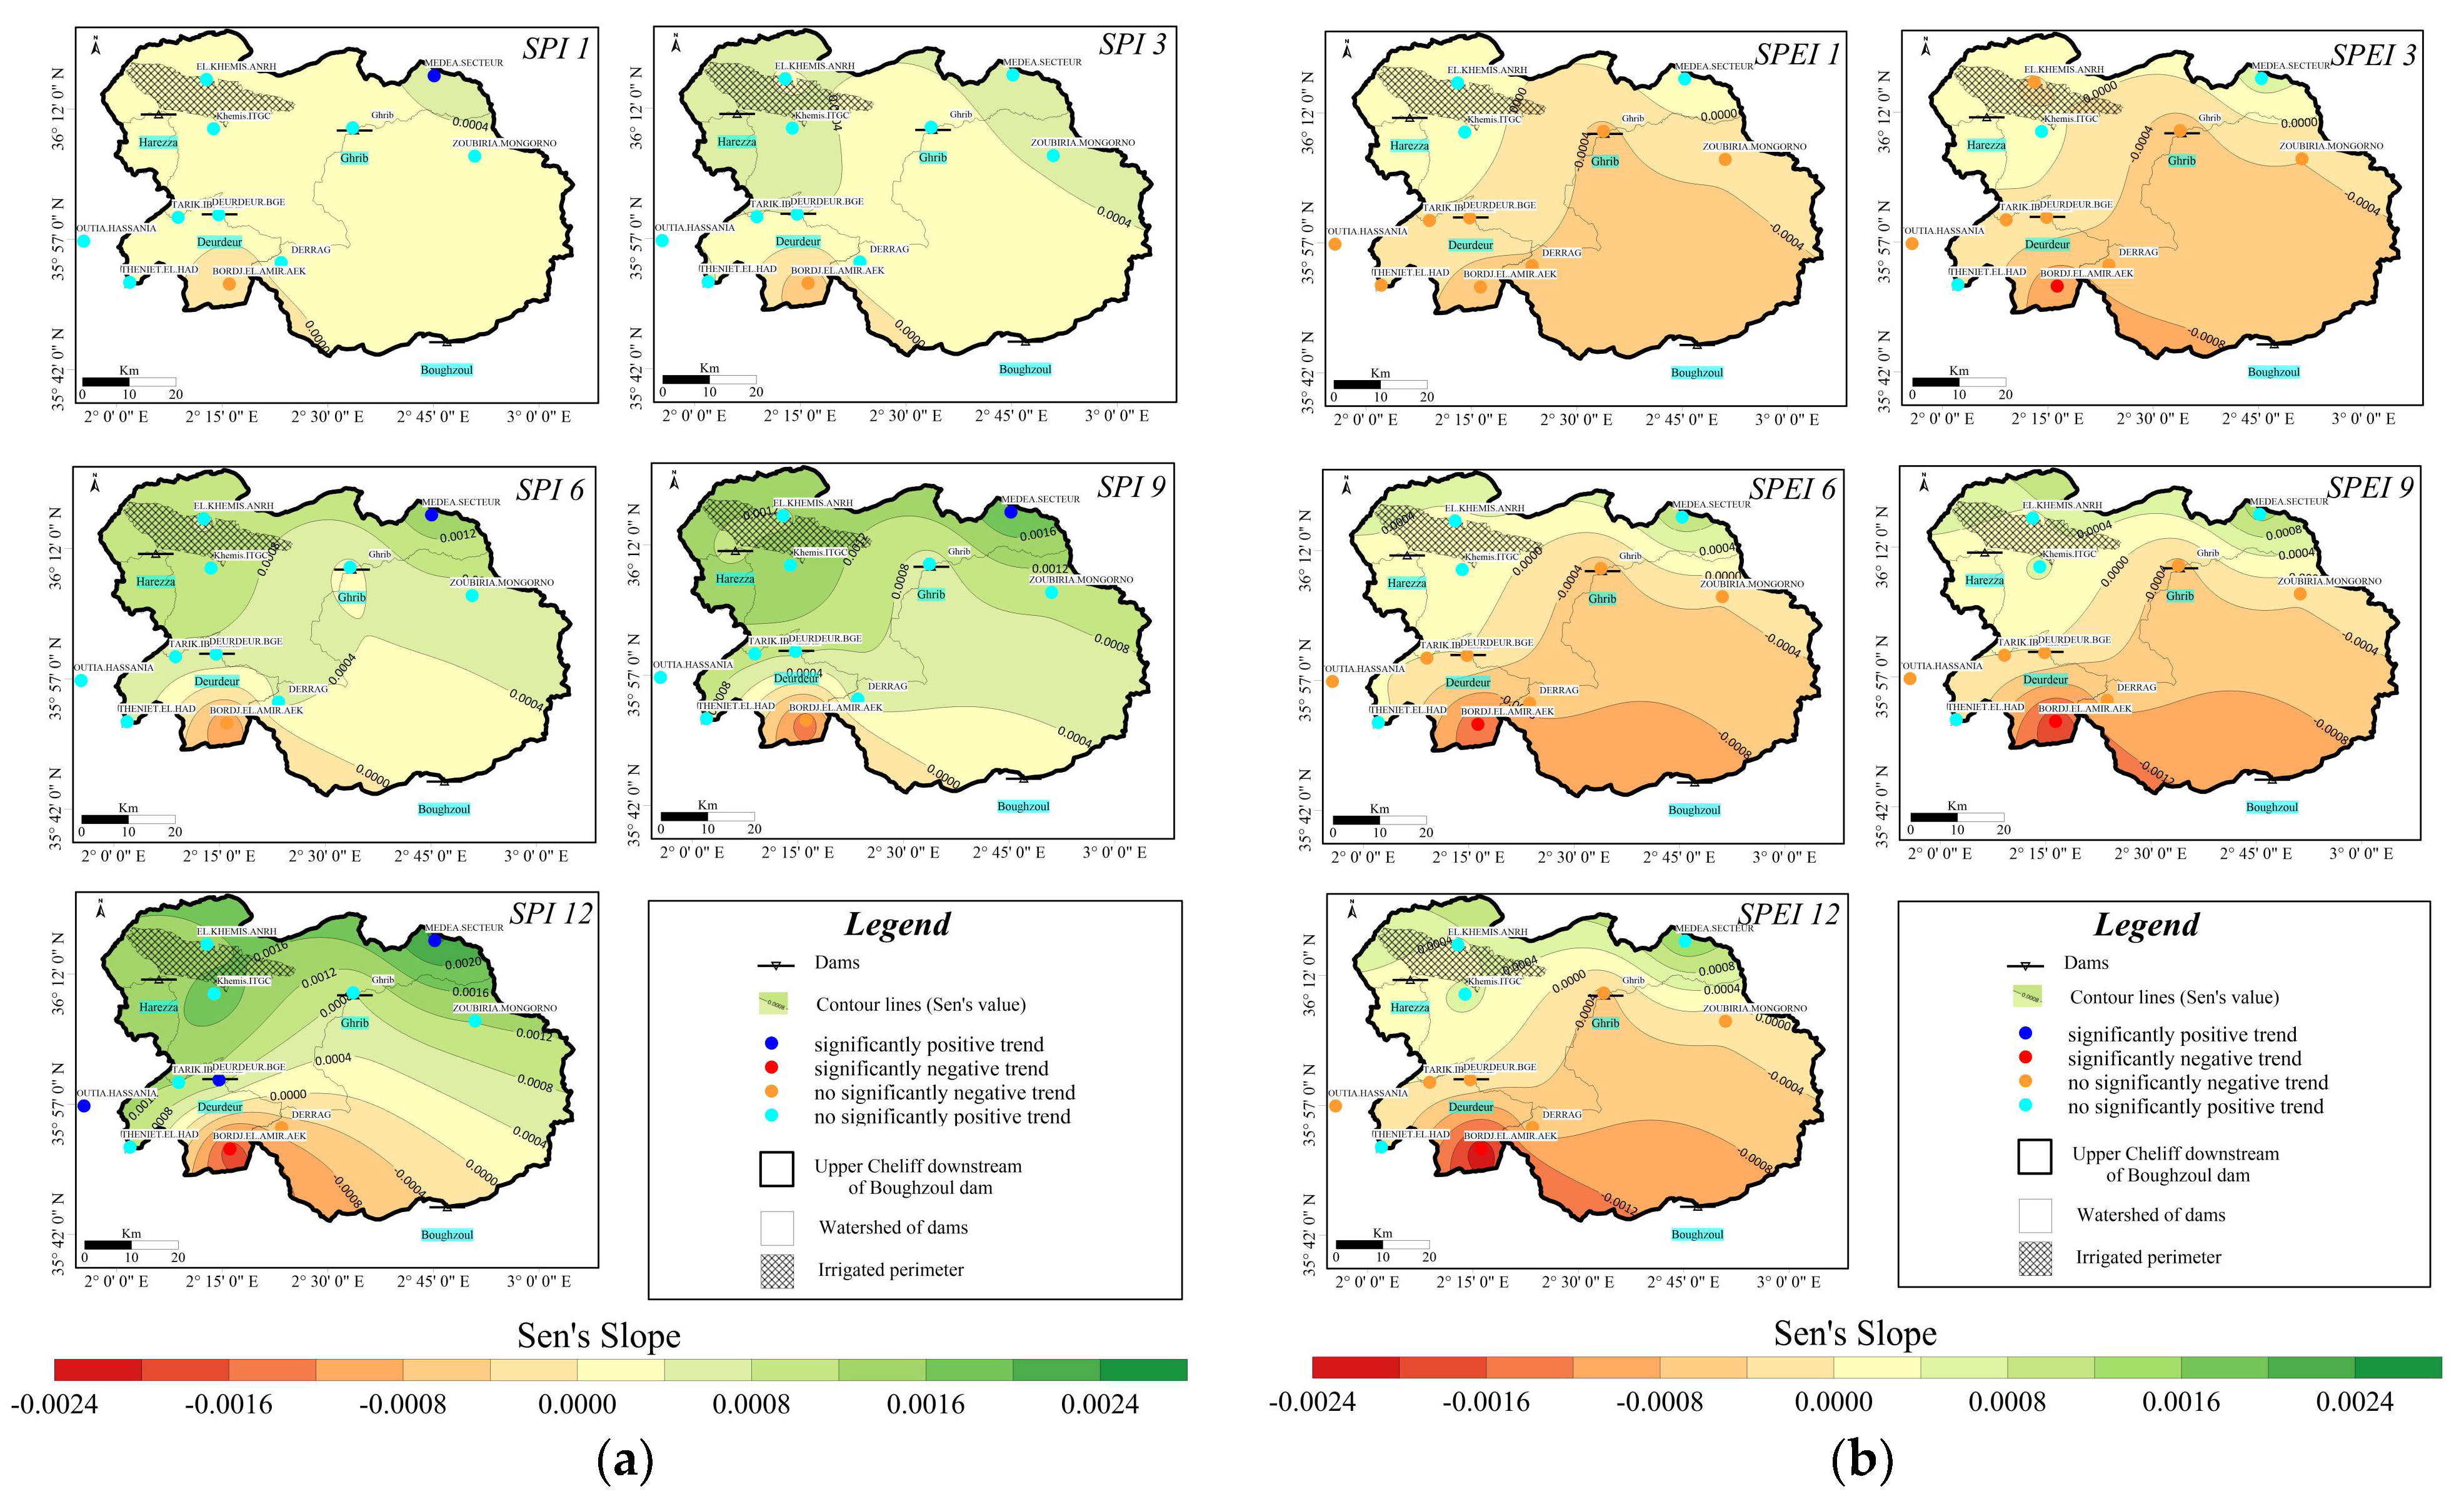
3.6. Trend SPI and SPEI

The significance and magnitude of trends for different temporal accumulations of SPI and SPEI are presented in Figure 11a,b. The application of the MMK test shows that statistically significant trends at the 5% significance level were not observed in most of the area. SPI showed an increasing trend in all time intervals at the Medea Secteur station. A negative trend in the SPI was observed in the south only on the 12-month time scale, meaning a decrease in annual precipitation totals. In addition, a greater amplitude of Sen’s slope values is visible on longer time scales. In the case of SPEI values, a non-significant negative trend was observed in the central and southern parts of the catchment, and a significant one was observed at the Bordj El Amir AEK station. In the northern part of the catchment, the trend was non-significantly positive.

4. Discussion

4.1. Drought Monitoring Using the SPI and SPEI

There are many studies on drought monitoring using different indices in different parts of the world, especially in arid and semi-arid areas [17,35,57,88,89,90,91]. In this study, the distribution of meteorological droughts was identified based on the SPI and SPEI indices in different time scales, i.e., 1, 3, 6, 9 and 12 months. Meteorological droughts are mainly the effect of low rainfall and high air temperature, which leads to increased evaporation.
Based on the mapping of the different drought characteristics identified (trend, drought frequency and parameters calculated using the theory of run concept, such as the number of drought events, maximum duration and maximum severity), the analysis of SPI and SPEI values in the upper Cheliff catchment shows the irregularity and heterogeneity of drought both spatially and temporally. Wet and dry periods were identified. The upper Cheliff basin experienced five periods of exceptional drought intensity and duration, namely 1983/84, 1993/94, 1987/88, the period from 1999/2000 to 2001/2002 and 2020/21, on a 1-year time scale. These results are consistent with those of studies carried out in other regions of Algeria [42,68,92,93,94].
To better understand the drought pattern in the study area, monthly analysis of SPI and SPEI values was performed. Both indices show that the drought frequency reached 23% in the 12-month time scale in the upper Cheliff basin. These values are compared with studies in the other regions in the word. Simsek et al. [17] showed that the frequency is greater than 30% in the Black Sea region, Turkey. In the north part of Poland, which is characterized by wet conditions, Kubiak-Wójcicka et al. [16] showed that the frequency of meteorological droughts is greater than 28% at different time scales. Liu et al. [4] showed that the frequency did not exceed 20% in Sichuan Province, China, which is characterized by drier conditions than the upper Cheliff.
The spatial distribution of drought frequency in upper Cheliff shows that the eastern and central areas of the basin are more affected by meteorological drought than the western part of the basin. This difference may be related to the presence of a relief, namely the Zaccar Mountains to the north-west and the Ouarsenis Mountains to the south. This orographic obstacle affects the stations between the mountains, which act as a screen against the clouds coming from the north-west of the Cheliff. This is in contrast to the plain of Khemis Miliana, which is well exposed and free of obstacles [95,96].
However, SPEI shows higher frequency values than SPI. On the other hand, the frequency of drought is lower for the shorter time scales (1 and 3 months) than for the longer time scales (6, 9 and 12 months). The frequency according to each drought class shows that the moderate droughts predominantly impacted the eastern and central regions. Severe droughts showed distinct spatial patterns depending on the time scale and index used. In the longer time scales, the SPI shows higher frequencies in the east. In contrast, the higher frequencies of the SPEI are more prominent in the west. In the short time scales, both indices show a convergence in the distribution of severe droughts in the western and central regions. But the extreme droughts are more frequent in the western region. The frequency of extreme drought calculated by SPI is higher than frequency calculated by SPEI. These results have been confirmed in the Mediterranean regions by other studies [36,37,38].
Based on the theory of run concept, the results showed that the number of drought events decreases in longer time scales (6, 9 and 12 months). However, they increase in shorter time scales (1 and 3 months). However, severity and duration increase during longer time scales. Comparing the two indices, SPEI estimates longer and more severe drought events than SPI by showing the influence of temperature in time and space. This has been confirmed by several studies [36,37,97].

4.2. Relationship Between SPI and SPEI

This study aimed to compare the level of agreement between the Standardized Precipitation Index (SPI) and the Standardized Precipitation Evapotranspiration Index (SPEI) at different time scales such as 1, 3, 6, 9 and 12 months. The trend analysis was based on the Modified Mann–Kendall (MMK) test and Sen’s slope estimator, which showed a positive trend in the SPI value, while a negative trend for SPEI. This means that there was an increase in precipitation during the study period, while a negative trend in SPEI indicates increasing drought, which is influenced by air temperature causing an increase in evaporation and transpiration [98]. In spatial terms, a clear regional division of the area is visible into the southern part (negative trend) and the northern part (positive trend). Our results are consistent with another study which showed no significate trend in precipitation using Mann–Kendall test and Sen’s slope, test particularly in upper Cheliff [41,93,95,96]. However, the change in the direction of the trend using the SPEI has been confirmed by other studies in Mediterranean regions [37,38].
The correlation analysis between SPEI and SPI in the upper Cheliff River Basin showed a high correlation between these indices at the same time scales (R from 0.73 to 0.97). A similar level of agreement (R > 0.7) was also obtained in studies conducted in other areas of Algeria, indicating a strong correlation between SPI and SPEI values at all time scales. The study conducted by Berhail and Katipoğlu [74] in the Mekerra Wadi Basin (NW Algeria) for the period 1970–2011 revealed the presence of a significant level of agreement between SPI and SPEI values at all time scales. Moreover, the researchers observed a positive linear correlation (r > 0.75, p < 0.0001) between the studied estimates. In turn, the studies of Choutri and Hussien [99] for the entire area of Algeria in the longer study period of 1950–2020 showed that the correlation coefficient observed between SPEI-3 and SPI-3 was r = 0.73 and it was the strongest correlation coefficient observed between indices of the same time scale [99]. Despite the high correlation coefficient between SPI and SPEI in the upper Cheliff basin, a difference in intensity was observed, with the SPI showing drier conditions than the SPEI. The results agree with those of former studies from around the world which use same indices [37,97]. Our study is focused on the spatial distribution of the correlation between SPI and SPEI, which shows that the strongest correlation between SPI and SPEI (R = 0.93) occurs in the mountainous areas, in the eastern part of the basin, where the climate is mainly semi-arid and arid. The lowest correlations (R = 0.73) were recorded in the eastern part of the area, in the plains, which are used for agriculture. The obtained results in the form of spatial variation in the correlation between SPI and SPEI are crucial for the development of strategies and decision-making support to meet future needs [39].
Meteorological drought poses a significant risk to water resources, agricultural productivity and socio-economic stability, especially in the Mediterranean region, which is highly vulnerable to climate change [38]. According to the national irrigation and drainage office (ONID) [100], the irrigated area completed in 2021 represents only 20% of the planned irrigated area, due to the drop in water levels in the three dams located in the upper Cheliff. Hence, in the case of the western part of the Cheliff catchment, improved water management must guarantee the supply of drinking water to the population and ensure stable water availability for irrigation in order to increase agricultural production [40]. Drought monitoring is an important aspect of drought risk management, and drought assessment should be carried out not only based on the SPI but also on the SPEI. The SPEI can more comprehensively consider the balance between precipitation and evapotranspiration, which makes it more suitable for meteorological analysis of drought, especially for the agricultural region of the river basin of a region [25].

5. Conclusions

Several studies have investigated meteorological drought in Algeria. However, understanding some of the characteristics in space and time has remained difficult. Using both indices SPI and SPEI, this study contributed to bettering understanding of the distribution of meteorological drought in the upper Cheliff basin downstream of the Boughzoul dam, between September 1982 and August 2021. We evaluated different characteristics (trends, drought frequency, number of drought events, duration and severity) in order to determine the spatiotemporal variability of drought for different time scales (1 year, 1 month, 3 months, 6 months, 9 months, 12 months). Both indices showed the same drought periods on a 1-year time scale (1983/84, 1993/94, 1987/88, the period from 1999/2000 to 2001/2002, and 2020/21). On the other time scales, the results showed extreme periods on the monthly scale, i.e., December 2015, with SPI values below −3 on the 1- and 3-month SPI time scales.
In terms of frequency, the eastern and central areas are much more affected by meteorological droughts than the west of the basin, which is due to the presence of relief. The frequency of droughts is much higher in the case of SPEI than SPI. With regard to the frequency of drought class, moderate droughts affect the eastern and central part of upper Cheliff. Finally, extreme droughts are more frequent in the western part of the basin.
The trend shows a change in significance between the two indices (generally positive using SPI and negative using SPEI) according to the MMK test. On the other hand, Sen’s slope shows a decrease in the magnitude of the trend from north to south.
Based on the run theory concept, the number of drought events decreases for longer time scales (6, 9 and 12 months). However, the duration and severity increase. The difference between two indices is that SPEI shows longer and more severe drought events from 2000 onwards.
The correlation between SPI and SPEI at different time scales shows a high degree of agreement (R from 0.73 to 0.97). The lowest correlation strength was recorded in the western part of the catchment (the Khemis Miliana plain), which is used for agriculture and intensive irrigation. The highest correlation strength was found in the eastern part of the area (mountainous areas). This difference in spatial variation explains the influence of temperatures in the plains compared with mountainous areas.
Based on the analyses carried out, it was found that the SPI can be used to monitor meteorological drought due to its simplicity and requirements covering only one parameter (precipitation). However, given the agricultural nature of the western part of the upper Cheliff basin, the SPEI is more sensitive to change in temperature and therefore drought prediction.
This study highlights the importance of considering the interplay between temperature, precipitation and evapotranspiration to better understand and predict drought changes in the upper Cheliff basin downstream of the Boughzoul dam. These insights are crucial for sustainable water management and climate change adaptation, especially for the intensively agricultural western part of the upper Cheliff basin. This study can be taken into account as a decision-making tool for strategies to mitigate the effects of drought on water resource management.

Supplementary Materials

The following supporting information can be downloaded at: https://www.mdpi.com/article/10.3390/cli13060123/s1, Figures S1–S20 and Tables S1 and S2.

Author Contributions

Conceptualization, M.-S.M. and K.K.-W.; methodology, M.-S.M. and K.K.-W.; software, M.-S.M.; validation, M.-S.M., K.K.-W., A.M. (Azeddine Mebarki) and A.M. (Abdelaaziz Merabti); formal analysis, M.-S.M., K.K.-W., A.M. (Azeddine Mebarki) and A.M. (Abdelaaziz Merabti); investigation, M.-S.M. and K.K.-W.; resources, M.-S.M.; data curation, M.-S.M., A.M. (Abdelaaziz Merabti) and A.M. (Azeddine Mebarki); writing—original draft preparation, M.-S.M., K.K.-W., A.M. (Azeddine Mebarki) and A.M. (Abdelaaziz Merabti); writing—review and editing, M.-S.M., K.K.-W., A.M. (Azeddine Mebarki) and A.M. (Abdelaaziz Merabti); visualization, M.-S.M.; supervision, M.-S.M., K.K.-W., A.M. (Azeddine Mebarki) and A.M. (Abdelaaziz Merabti); project administration, K.K.-W.; funding acquisition, K.K.-W. All authors have read and agreed to the published version of the manuscript.

Funding

This research received no external funding.

Data Availability Statement

The data presented in this study are available upon request from the corresponding author for further analysis of the complementary database.

Conflicts of Interest

The authors declare no conflicts of interest.

References

  1. Zhang, J.; Sun, F.; Lai, W.; Lim, W.H.; Liu, W.; Wang, T.; Wang, P. Attributing Changes in Future Extreme Droughts Based on PDSI in China. J. Hydrol. 2019, 573, 607–615. [Google Scholar] [CrossRef]
  2. Wilhite, D.A.; Glantz, M.H. Understanding: The Drought Phenomenon: The Role of Definitions. Water Int. 1985, 10, 111–120. [Google Scholar] [CrossRef]
  3. Nohtani, M.; Ajorlo, M.; Sarhadi, M. Zoning Drought with Standardized Precipitation Index and Reconnaissance Drought Index in Sistan and Baluchestan Province, Southeastern Iran. ECOPERSIA 2018, 6, 111–119. [Google Scholar]
  4. Liu, C.; Yang, C.; Yang, Q.; Wang, J. Spatiotemporal Drought Analysis by the Standardized Precipitation Index (SPI) and Standardized Precipitation Evapotranspiration Index (SPEI) in Sichuan Province, China. Sci. Rep. 2021, 11, 1280. [Google Scholar] [CrossRef] [PubMed]
  5. Parvizi, S.; Eslamian, S.; Gheysari, M.; Gohari, A.; Kopai, S.S. Regional Frequency Analysis of Drought Severity and Duration in Karkheh River Basin, Iran Using Univariate L-Moments Method. Environ. Monit. Assess. 2022, 194, 336. [Google Scholar] [CrossRef]
  6. Quiring, S.M.; Papakryiakou, T.N. An Evaluation of Agricultural Drought Indices for the Canadian Prairies. Agric. For. Meteorol. 2003, 118, 49–62. [Google Scholar] [CrossRef]
  7. Schwalm, C.R.; Anderegg, W.R.L.; Michalak, A.M.; Fisher, J.B.; Biondi, F.; Koch, G.; Litvak, M.; Ogle, K.; Shaw, J.D.; Wolf, A.; et al. Global Patterns of Drought Recovery. Nature 2017, 548, 202–205. [Google Scholar] [CrossRef]
  8. Tirivarombo, S.; Osupile, D.; Eliasson, P. Drought Monitoring and Analysis: Standardised Precipitation Evapotranspiration Index (SPEI) and Standardised Precipitation Index (SPI). Phys. Chem. Earth Parts A/B/C 2018, 106, 1–10. [Google Scholar] [CrossRef]
  9. Zarei, A.R.; Shabani, A.; Moghimi, M.M. Accuracy Assessment of the SPEI, RDI and SPI Drought Indices in Regions of Iran with Different Climate Conditions. Pure Appl. Geophys. 2021, 178, 1387–1403. [Google Scholar] [CrossRef]
  10. Minea, I.; Iosub, M.; Boicu, D. Multi-Scale Approach for Different Type of Drought in Temperate Climatic Conditions. Nat. Hazards 2022, 110, 1153–1177. [Google Scholar] [CrossRef]
  11. Van Loon, A.F. Hydrological Drought Explained. WIREs Water 2015, 2, 359–392. [Google Scholar] [CrossRef]
  12. Kubiak-Wójcicka, K.; Bąk, B. Monitoring of Meteorological and Hydrological Droughts in the Vistula Basin (Poland). Environ. Monit. Assess. 2018, 190, 691. [Google Scholar] [CrossRef]
  13. Ozkaya, A.; Zerberg, Y. A 40-Year Analysis of the Hydrological Drought Index for the Tigris Basin, Turkey. Water 2019, 11, 657. [Google Scholar] [CrossRef]
  14. Jamorska, I.; Kubiak-Wójcicka, K.; Krawiec, A. Dynamics of the Status of Groundwater in the Polish Lowland: The River Gwda Catchment Example. Geologos 2019, 25, 193–204. [Google Scholar] [CrossRef]
  15. Kubiak-Wójcicka, K.; Nagy, P.; Zeleňáková, M.; Hlavatá, H.; Abd-Elhamid, H.F. Identification of Extreme Weather Events Using Meteorological and Hydrological Indicators in the Laborec River Catchment, Slovakia. Water 2021, 13, 1413. [Google Scholar] [CrossRef]
  16. Kubiak-Wójcicka, K.; Owczarek, M.; Chlost, I.; Olszewska, A.; Nagy, P. Assessment of Meteorological Drought Trends in a Selected Coastal Basin Area in Poland—A Case Study. Water 2023, 15, 2836. [Google Scholar] [CrossRef]
  17. Simsek, O.; Yildiz-Bozkurt, S.; Gumus, V. Analysis of Meteorological Drought with Different Methods in the Black Sea Region, Turkey. Acta Geophys. 2023, 72, 1927–1943. [Google Scholar] [CrossRef]
  18. Dai, A.; Trenberth, K.E.; Qian, T. A Global Dataset of Palmer Drought Severity Index for 1870–2002: Relationship with Soil Moisture and Effects of Surface Warming. J. Hydrometeorol. 2004, 5, 1117–1130. [Google Scholar] [CrossRef]
  19. Ionita, M.; Scholz, P.; Chelcea, S. Assessment of Droughts in Romania Using the Standardized Precipitation Index. Nat. Hazards 2016, 81, 1483–1498. [Google Scholar] [CrossRef]
  20. Mishra, A.K.; Singh, V.P. A Review of Drought Concepts. J. Hydrol. 2010, 391, 202–216. [Google Scholar] [CrossRef]
  21. Zargar, A.; Sadiq, R.; Naser, B.; Khan, F.I. A Review of Drought Indices. Environ. Rev. 2011, 19, 333–349. [Google Scholar] [CrossRef]
  22. Montaseri, M.; Amirataee, B. Comprehensive Stochastic Assessment of Meteorological Drought Indices. Int. J. Climatol. 2017, 37, 998–1013. [Google Scholar] [CrossRef]
  23. Salimi, S.; Almuktar, S.A.; Scholz, M. Impact of Climate Change on Wetland Ecosystems: A Critical Review of Experimental Wetlands. J. Environ. Manag. 2021, 286, 112160. [Google Scholar] [CrossRef]
  24. Abrar Faiz, M.; Zhang, Y.; Tian, X.; Tian, J.; Zhang, X.; Ma, N.; Aryal, S. Drought Index Revisited to Assess Its Response to Vegetation in Different Agro-Climatic Zones. J. Hydrol. 2022, 614, 128543. [Google Scholar] [CrossRef]
  25. Han, Z.; Huang, S.; Zhao, J.; Leng, G.; Huang, Q.; Zhang, H.; Li, Z. Long-Chain Propagation Pathways from Meteorological to Hydrological, Agricultural and Groundwater Drought and Their Dynamics in China. J. Hydrol. 2023, 625, 130131. [Google Scholar] [CrossRef]
  26. Mianabadi, A.; Salari, K.; Pourmohamad, Y. Drought Monitoring Using the Long-Term CHIRPS Precipitation over Southeastern Iran. Appl. Water Sci. 2022, 12, 183. [Google Scholar] [CrossRef]
  27. Chen, J.; Fan, Y.; Zhang, Y.; Peng, J.; Zhang, J.; Cao, C. Comprehensive Propagation Characteristics between Paired Meteorological and Hydrological Drought Events: Insights from Various Underlying Surfaces. Atmos. Res. 2024, 299, 107193. [Google Scholar] [CrossRef]
  28. Mavromatis, T. Drought Index Evaluation for Assessing Future Wheat Production in Greece. Int. J. Climatol. 2007, 27, 911–924. [Google Scholar] [CrossRef]
  29. Mavromatis, T. Use of Drought Indices in Climate Change Impact Assessment Studies: An Application to Greece. Int. J. Climatol. 2010, 30, 1336–1348. [Google Scholar] [CrossRef]
  30. Mavromatis, T. Changes in Exceptional Hydrological and Meteorological Weekly Event Frequencies in Greece. Clim. Change 2012, 110, 249–267. [Google Scholar] [CrossRef]
  31. Zhang, R.; Chen, Z.-Y.; Xu, L.-J.; Ou, C.-Q. Meteorological Drought Forecasting Based on a Statistical Model with Machine Learning Techniques in Shaanxi Province, China. Sci. Total Environ. 2019, 665, 338–346. [Google Scholar] [CrossRef]
  32. Aktürk, G.; Çıtakoğlu, H.; Demir, V.; Beden, N. Meteorological Drought Analysis and Regional Frequency Analysis in the Kızılırmak Basin: Creating a Framework for Sustainable Water Resources Management. Water 2024, 16, 2124. [Google Scholar] [CrossRef]
  33. IPCC. Climate Change 2014: Impacts, Adaptation, and Vulnerability Working Group II Contribution to the Fifth Assessment Report of the Intergovernmental Panel on Climate Change; Cambridge University Press: New York, NY, USA, 2014; ISBN 978-1-107-64165-5. [Google Scholar]
  34. Tsesmelis, D.E.; Karavitis, C.A.; Oikonomou, P.D.; Alexandris, S.; Kosmas, C. Assessment of the Vulnerability to Drought and Desertification Characteristics Using the Standardized Drought Vulnerability Index (SDVI) and the Environmentally Sensitive Areas Index (ESAI). Resources 2018, 8, 6. [Google Scholar] [CrossRef]
  35. Myronidis, D.; Fotakis, D.; Ioannou, K.; Sgouropoulou, K. Comparison of Ten Notable Meteorological Drought Indices on Tracking the Effect of Drought on Streamflow. Hydrol. Sci. J. 2018, 63, 2005–2019. [Google Scholar] [CrossRef]
  36. Mathbout, S.; Lopez-Bustins, J.A.; Martin-Vide, J.; Bech, J.; Rodrigo, F.S. Spatial and Temporal Analysis of Drought Variability at Several Time Scales in Syria during 1961–2012. Atmos. Res. 2018, 200, 153–168. [Google Scholar] [CrossRef]
  37. Soydan Oksal, N.G. Comparative Analysis of the Influence of Temperature and Precipitation on Drought Assessment in the Marmara Region of Turkey: An Examination of SPI and SPEI Indices. J. Water Clim. Change 2023, 14, 3096–3111. [Google Scholar] [CrossRef]
  38. Aschale, T.M.; Cancelliere, A.; Palazzolo, N.; Buonacera, G.; Peres, D.J. Analysis of the Spatiotemporal Trends of Standardized Drought Indices in Sicily Using ERA5-Land Reanalysis Data (1950–2023). Water 2024, 16, 2593. [Google Scholar] [CrossRef]
  39. Bouguerra, H.; Derdous, O.; Tachi, S.E.; Hatzaki, M.; Abida, H. Spatiotemporal Investigation of Meteorological Drought Variability over Northern Algeria and Its Relationship with Different Atmospheric Circulation Patterns. Theor. Appl. Clim. 2024, 155, 1507–1518. [Google Scholar] [CrossRef]
  40. Habibi, B.; Meddi, M.; Torfs, P.J.J.F.; Remaoun, M.; Van Lanen, H.A.J. Characterisation and Prediction of Meteorological Drought Using Stochastic Models in the Semi-Arid Chéliff–Zahrez Basin (Algeria). J. Hydrol. Reg. Stud. 2018, 16, 15–31. [Google Scholar] [CrossRef]
  41. Merabti, A.; Darouich, H.; Paredes, P.; Meddi, M.; Pereira, L.S. Assessing Spatial Variability and Trends of Droughts in Eastern Algeria Using SPI, RDI, PDSI, and MedPDSI—A Novel Drought Index Using the FAO56 Evapotranspiration Method. Water 2023, 15, 626. [Google Scholar] [CrossRef]
  42. Fellag, M.; Achite, M.; Wałęga, A. Spatial-Temporal Characterization of Meteorological Drought Using the Standardized Precipitation Index. Case study in Algeria. Acta Sci. Polonorum. Form. Circumiectus 2021, 20, 19–31. [Google Scholar] [CrossRef]
  43. Messis, M.S.; Mebarki, A.; Merabti, A. Mapping of Annual and Frequency Rainfall in the Cheliff Catchment Area (Northwestern Algeria). Geomat. Landmanag. Landsc. 2024, 2, 67–83. [Google Scholar] [CrossRef]
  44. WMO. Standardized Precipitation Index User Guide; WMO: Geneva, Switzerland, 2012; ISBN 978-92-63-11091-6. [Google Scholar]
  45. Vicente-Serrano, S.M.; Beguería, S.; López-Moreno, J.I. A Multiscalar Drought Index Sensitive to Global Warming: The Standardized Precipitation Evapotranspiration Index. J. Clim. 2010, 23, 1696–1718. [Google Scholar] [CrossRef]
  46. Guttman, N.B. On the Sensitivity of Sample L Moments to Sample Size. J. Clim. 1994, 7, 1026–1029. [Google Scholar] [CrossRef]
  47. Guttman, N.B. Accepting the Standardized Precipitation Index: A Calculation Algorithm. J. Am. Water Resour. Assoc. 1999, 35, 311–322. [Google Scholar] [CrossRef]
  48. Hallouz, F.; Meddi, M.; Mahé, G.; Ali Rahmani, S.; Karahacane, H.; Brahimi, S. Analysis of Meteorological Drought Sequences at Various Timescales in Semi-Arid Climate: Case of the Cheliff Watershed (Northwest of Algeria). Arab. J. Geosci. 2020, 13, 280. [Google Scholar] [CrossRef]
  49. Mebarki, A.; Assaba, M.; Laborde, J.-P.; Rezak, S. Du Bilan Hydrologique Au Bilan Hydrique: Modélisation et Synthèse Cartographique Sur l’Algérie Du Nord. In Proceedings of the Le 5e Colloque International sur Ressources en Eau et Développement Durable (CIREDD), Blida, Algérie, 24 February 2013; Volume LJEE N° 21 et 22, pp. 412–416. [Google Scholar]
  50. Rezak, S.; Laborde, J.-P.; Errih, M. Validation d’un Modèle Numérique de Terrain Adapté à La Modélisation Hydrologique Régionale Sur l’Algérie Du Nord. Hydrol. Sci. J. 2012, 57, 928–941. [Google Scholar] [CrossRef]
  51. ANRH. Carte Des Évapotranspirations Potentielles du Nord Del’algérie Au1/500 000 (2 Feuilles, Notice De 42p); Alger, I.N.C.T., Ed.; Agence Nationale des Ressources Hydrauliques: Blida, Algeria, 2002. [Google Scholar]
  52. Mebarki, A.; Laborde, J.-P. Synthèse Cartographique Des Bilans Hydriques de l’Algérie Du Nord Par Modèle Distribué. In Proceedings of the Eau et Climat au Maghreb, Réseau eau et Climat, Normandy, France, 1 March 2014; Volume 2, pp. 163–174. [Google Scholar]
  53. ONS. Armature Urbaine RGPH 2008/Les Principaux Résultats De L’exploitation Exhaustive; Office National des Statistiques: Alger, Algeria, 2011; p. 214. [Google Scholar]
  54. ONID. Bilan D’Exploitation 2020; Office National d’Irrigation et de Drainage: Alger, Algeria, 2020. [Google Scholar]
  55. Tsendbazar, N.; Herold, M.; Tarko, A.; Linlin, L.; Lesiv, M.; Fritz, S.; Maus, V. Copernicus Global Land Service: Land Cover 100 m: Version 3 Globe 2015–2019: Validation Report; Copernicus Global Land Operations—Lot 1; Zenodo: Geneve, Switzerland, 2020. [Google Scholar]
  56. Muñoz Sabater, J. ERA5-Land Monthly Averaged Data from 1950 to Present; Copernicus Climate Change Service (C3S) Climate Data Store (CDS): Berks, UK, 2019. [Google Scholar] [CrossRef]
  57. Rahman, K.U.; Ejaz, N.; Shang, S.; Balkhair, K.S.; Alghamdi, K.M.; Zaman, K.; Khan, M.A.; Hussain, A. A Robust Integrated Agricultural Drought Index under Climate and Land Use Variations at the Local Scale in Pakistan. Agric. Water Manag. 2024, 295, 108748. [Google Scholar] [CrossRef]
  58. Palazzolo, N.; Peres, D.J.; Bonaccorso, B.; Cancelliere, A. A Probabilistic Analysis of Drought Areal Extent Using SPEI-Based Severity-Area-Frequency Curves and Reanalysis Data. Water 2023, 15, 3141. [Google Scholar] [CrossRef]
  59. Beguería, S.; Vicente-Serrano, S.M.; Beguería, M.S. Package ‘Spei’. Calculation of the Standardised Precipitation-Evapotranspiration Index. 2023. Available online: https://CRAN.R-project.org/package=SPEI (accessed on 19 April 2024).
  60. McKee, T.B.; Doesken, N.J.; Kleist, J. The Relationship of Drought Frequency and Duration to Time Scales. In Proceedings of the 8th Conference Applied Climatology, Anaheim, CA, USA, 17–22 January 1993; American Meteorological Society: Boston, MA, USA, 1993. [Google Scholar]
  61. Kubiak-Wójcicka, K.; Pilarska, A.; Kamiński, D. The Analysis of Long-Term Trends in the Meteorological and Hydrological Drought Occurrences Using Non-Parametric Methods—Case Study of the Catchment of the Upper Noteć River (Central Poland). Atmosphere 2021, 12, 1098. [Google Scholar] [CrossRef]
  62. Kubiak-Wójcicka, K.; Pilarska, A.; Kamiński, D. Meteorological Drought in the Upper Noteć Catchment Area (Central Poland) in the Light of NDVI and SPI Indicators. Appl. Water Sci. 2024, 14, 180. [Google Scholar] [CrossRef]
  63. Bąk, B.; Kubiak-Wójcicka, K. Impact of Meteorological Drought on Hydrological Drought in Toruń (Central Poland) in the Period of 1971–2015. J. Water Land Dev. 2017, 32, 3–12. [Google Scholar] [CrossRef]
  64. Bayer Altin, T.; Altin, B.N. Response of Hydrological Drought to Meteorological Drought in the Eastern Mediterranean Basin of Turkey. J. Arid. Land 2021, 13, 470–486. [Google Scholar] [CrossRef]
  65. Li, L.; Zhao, L.; Ge, J.; Yang, P.; Wu, F. Investigating Drought Propagation Time, Relationship, and Drivers in Perennial River Basins of China. Water 2022, 14, 2812. [Google Scholar] [CrossRef]
  66. Merabti, A.; Meddi, M.; Martins, D.S.; Pereira, L.S. Comparing SPI and RDI Applied at Local Scale as Influenced by Climate. Water Resour. Manag. 2018, 32, 1071–1085. [Google Scholar] [CrossRef]
  67. Habibi, B.; Meddi, M. Meteorological Drought Hazard Analysis of Wheat Production in the Semi-Arid Basin of Cheliff–Zahrez Nord, Algeria. Arab. J. Geosci. 2021, 14, 1045. [Google Scholar] [CrossRef]
  68. Zerouali, B.; Chettih, M.; Abda, Z.; Mesbah, M.; Santos, C.A.G.; Brasil Neto, R.M.; Da Silva, R.M. Spatiotemporal Meteorological Drought Assessment in a Humid Mediterranean Region: Case Study of the Oued Sebaou Basin (Northern Central Algeria). Nat. Hazards 2021, 108, 689–709. [Google Scholar] [CrossRef]
  69. WMO. Manuel Des Indicateurs et Indices de Sécheresse; OMM: Genève, Switzerland, 2016; ISBN 978-92-63-21173-6. [Google Scholar]
  70. Guttman, N.B. Comparing the Palmer Drought Index and the Standardized Precipitation Index. J. Am. Water Resour. Assoc. 1998, 34, 113–121. [Google Scholar] [CrossRef]
  71. Subedi, M.R.; Xi, W.; Edgar, C.B.; Rideout-Hanzak, S.; Hedquist, B.C. Assessment of Geostatistical Methods for Spatiotemporal Analysis of Drought Patterns in East Texas, USA. Spat. Inf. Res. 2019, 27, 11–21. [Google Scholar] [CrossRef]
  72. Shi, H.; Zhou, Z.; Liu, L.; Liu, S. A Global Perspective on Propagation from Meteorological Drought to Hydrological Drought during 1902–2014. Atmos. Res. 2022, 280, 106441. [Google Scholar] [CrossRef]
  73. Meresa, H.; Zhang, Y.; Tian, J.; Abrar Faiz, M. Understanding the Role of Catchment and Climate Characteristics in the Propagation of Meteorological to Hydrological Drought. J. Hydrol. 2023, 617, 128967. [Google Scholar] [CrossRef]
  74. Berhail, S.; Katipoğlu, O.M. Comparison of the SPI and SPEI as Drought Assessment Tools in a Semi-Arid Region: Case of the Wadi Mekerra Basin (Northwest of Algeria). Theor. Appl. Clim. 2023, 154, 1373–1393. [Google Scholar] [CrossRef]
  75. Beguería, S.; Vicente-Serrano, S.M.; Reig, F.; Latorre, B. Standardized Precipitation Evapotranspiration Index (SPEI) Revisited: Parameter Fitting, Evapotranspiration Models, Tools, Datasets and Drought Monitoring. Int. J. Climatol. 2014, 34, 3001–3023. [Google Scholar] [CrossRef]
  76. Allen, R.G.; Pereira, L.S.; Raes, D.; Smith, M. Crop evapotranspiration-Guidelines for computing crop water requirements-FAO Irrigation and drainage paper 56. FAO Rome 1998, 300, 05109. [Google Scholar]
  77. Yevjevich, V.M. Objective Approach to Definitions and Investigations of Continental Hydrologic Droughts. Ph.D. Thesis, Colorado State University, Fort Collins, CO, USA, 1967. [Google Scholar]
  78. Mishra, A.K.; Singh, V.P.; Desai, V.R. Drought Characterization: A Probabilistic Approach. Stoch. Environ. Res. Risk Assess. 2009, 23, 41–55. [Google Scholar] [CrossRef]
  79. Krige, D.G. A Statistical Approach to Some Basic Mine Valuation Problems on the Witwatersrand. J. Chem. Metal. Min. Soc. S. Afr. 1951, 52, 119–139. [Google Scholar]
  80. Golden Software, LLC. Surfer, Version 28; Golden Software, LLC: Golden, CO, USA, 2024. Available online: https://www.goldensoftware.com.
  81. Willmott, C.J.; Matsuura, K. On the Use of Dimensioned Measures of Error to Evaluate the Performance of Spatial Interpolators. Int. J. Geogr. Inf. Sci. 2006, 20, 89–102. [Google Scholar] [CrossRef]
  82. Hamed, K.H.; Ramachandra Rao, A. A Modified Mann-Kendall Trend Test for Autocorrelated Data. J. Hydrol. 1998, 204, 182–196. [Google Scholar] [CrossRef]
  83. Mitchell, J.F.B. The “Greenhouse” Effect and Climate Change. Rev. Geophys. 1989, 27, 115. [Google Scholar] [CrossRef]
  84. Daufresne, M.; Lengfellner, K.; Sommer, U. Global Warming Benefits the Small in Aquatic Ecosystems. Proc. Natl. Acad. Sci. USA 2009, 106, 12788–12793. [Google Scholar] [CrossRef]
  85. Sen, P.K. Estimates of the Regression Coefficient Based on Kendall’s Tau. J. Am. Stat. Assoc. 1968, 63, 1379–1389. [Google Scholar] [CrossRef]
  86. Pei, Z.; Fang, S.; Wang, L.; Yang, W. Comparative Analysis of Drought Indicated by the SPI and SPEI at Various Timescales in Inner Mongolia, China. Water 2020, 12, 1925. [Google Scholar] [CrossRef]
  87. Poudel, B.; Dahal, D.; Banjara, M.; Kalra, A. Assessing Meteorological Drought Patterns and Forecasting Accuracy with SPI and SPEI Using Machine Learning Models. Forecasting 2024, 6, 1026–1044. [Google Scholar] [CrossRef]
  88. Lee, S.; Lee, S.-J.; Jang, K.; Chun, J.-H. Drought Monitoring Based on Vegetation Type and Reanalysis Data in Korea. Atmosphere 2021, 12, 170. [Google Scholar] [CrossRef]
  89. Bougara, H.; Hamed, K.B.; Borgemeister, C.; Tischbein, B.; Kumar, N. A comparative assessment of meteorological drought in the Tafna basin, Northwestern Algeria. J. Water Land Dev. 2022, 78–93. [Google Scholar] [CrossRef]
  90. Hamarash, H.; Hamad, R.; Rasul, A. Meteorological Drought in Semi-Arid Regions: A Case Study of Iran. J. Arid. Land 2022, 14, 1212–1233. [Google Scholar] [CrossRef]
  91. Kartal, V. Assessment of Drought Using Different Tests and Drought Indices in Elazig, Turkey. Water Sci. Technol. 2023, 88, 1767–1794. [Google Scholar] [CrossRef] [PubMed]
  92. Bettahar, A.; Şener, Ş. Analysis of Meteorological Drought Indices in the Wadi Righ Area (Southern Algeria). Sustain. Water Resour. Manag. 2022, 8, 152. [Google Scholar] [CrossRef]
  93. Ziari, A.; Medjerab, A. Impact of Drought in Northeastern Algeria: Comparative Study of the SPI and SPEI Índices. Rev. De Gestão Soc. E Ambient. 2024, 18, e06591. [Google Scholar] [CrossRef]
  94. Balia, B.; Habibi, B.; Bouthiba, A. Statistical Analysis of Climatic Drought Indices as a Decision-Making Tool in Irrigation Matters—Case of Citrus Orchards in Middle and Upper Cheliff (Algeria). Arab. J. Geosci. 2024, 17, 272. [Google Scholar] [CrossRef]
  95. Taibi, S. Analyse Du Régime Climatique au Nord De l’algerie. Ph.D. Thesis, École Nationale Supérieure Agronomique, Alger, Algérie, 2011. [Google Scholar]
  96. Amiar, S.; Bouanani, A.; Baba-Hamed, K.; Belarbi, H. Variabilité Pluviométrique Dans Le Bassin Versant Du Haut et Moyen Cheliff. Rev. Des Sci. De L’eau 2020, 32, 337–347. [Google Scholar] [CrossRef]
  97. Li, L.; She, D.; Zheng, H.; Lin, P.; Yang, Z.-L. Elucidating Diverse Drought Characteristics from Two Meteorological Drought Indices (SPI and SPEI) in China. J. Hydrometeorol. 2020, 21, 1513–1530. [Google Scholar] [CrossRef]
  98. Zeroual, A.; Assani, A.A.; Meddi, M. Combined Analysis of Temperature and Rainfall Variability as They Relate to Climate Indices in Northern Algeria over the 1972–2013 Period. Hydrol. Res. 2017, 48, 584–595. [Google Scholar] [CrossRef]
  99. Choutri, I.; Hussien, A. Exploratory Analysis of Algeria Meteorological Drought Using SPI and SPEI. Open Access Libr. J. 2024, 11, 1–27. [Google Scholar] [CrossRef]
  100. ONID. Bilan D’exploitation 2021, Plan D’action 2022; Office National d’Irrigation et de Drainage: Alger, Algeria, 2021. [Google Scholar]
Figure 1. Presentation of the upper Cheliff catchment area downstream of Boughzoul dam. 1–11: numbering of rainfall stations as in Table 1.
Climate 13 00123 g001
Figure 2. General schematic of the methodology used in this study.
Climate 13 00123 g002
Figure 3. One-year SPI and SPEI for the rainfall stations (El Khemis ANRH, Bordj El Amir AEK and Medea Secteur) from 1982/83 to 2020/21.
Climate 13 00123 g003aClimate 13 00123 g003b
Figure 4. Monthly series of SPI and SPEI for the Derrag station from 1982/83 to 2020/21.
Climate 13 00123 g004
Figure 5. Spatial variation in meteorological drought frequency in % using SPI (a) and SPEI (b) (1982/83–2020/21).
Climate 13 00123 g005
Figure 6. Spatial variation in the number of meteorological drought events recorded (1982/83–2020/21). (a) SPI; (b) SPEI.
Climate 13 00123 g006
Figure 7. Evolution of meteorological drought events in Khemis ITGC station (1982/83–2020/21): duration (D), severity (S) and date of Smax. (a) SPI; (b) SPEI.
Climate 13 00123 g007
Figure 8. Spatial variation in maximum meteorological drought severity of extreme event (1982/83–2020/21). (a) SPI; (b) SPEI.
Climate 13 00123 g008
Figure 9. Spatial variation in the maximum duration of a meteorological drought event (1982/83–2020/21). (a) SPI; (b) SPEI.
Climate 13 00123 g009
Figure 10. Correlation between SPI and SPEI at different time scales (1, 3, 6, 9 and 12 months).
Climate 13 00123 g010
Figure 11. Result of MMK trend test and Sen’s slope for SPI (a) and SPEI (b).
Climate 13 00123 g011
Table 1. Characteristics and descriptive statistics of rainfall stations in the study area.
StationLongitude (Decimal
Degrees)
Latitude (Decimal
Degrees)
Elevation Z (m)Average Annual Rainfall P (mm)Coefficient of Variability Cv (%) Average Annual Air Temperature T (°C)
01El Khemis (ITGC)2.2336.16289401.4127.9518.57
02Derrag2.3935.911150527.4028.8014.96
03Zoubiria Mongorno2.8536.11932490.3328.2416.42
04Ghrib2.5636.17435450.7929.1717.68
05Medea Secteur2.7536.27935626.2427.0215.81
06Bordj El Amir AEK2.2735.871080405.5027.5315.43
07Theniet El Had2.0335.871150537.2524.9415.28
08Tarik Ibn Ziad2.1435.99660424.1626.9217.00
09Deurdeur Bge2.2436.00575395.5737.2116.98
10El Khemis ANRH2.2136.26300402.1325.6117.37
11Toutia Hassania1.9235.95850414.0318.5816.72
Table 2. Land use in the upper Cheliff (situation in 2019) [55].
Land UseArea (km2)%
Shrubland1027.3621.47
Herbaceous vegetation682.7514.27
Cropland1998.0041.76
Built up67.901.42
Bare/sparse vegetation71.431.49
Water bodies12.160.25
Herbaceous wetland1.230.03
Forests923.4719.30
Table 3. The parameters of meteorological drought for the two indices (SPI and SPEI).
StationIndexTime Scale (Months)136912
DerragSPIE4834232015
D max3991312
S max5.817.419.9318.7517.64
Date of S maxtiJan-00Feb-83Apr-83Nov-87Jan-02
teMar-00Oct-83Dec-83Nov-88Dec-02
SPEIE6233212014
D max47111619
S max5.3311.9217.8324.3429.51
Date of S maxtiMay-94Mar-00Oct.-20May-20Feb-20
teAug-94Sep-00Aug-21Aug-21Aug-21
Khemis ITGCSPIE4940281919
D max36111020
S max5.699.3922.6523.6238.21
Date of S maxtiNov-15Mar-94Oct-93Nov-93May-93
teDec-15Aug-94Aug-94Aug-94Dec-94
SPEIE5228241918
D max4891215
S max10.5112.9116.8519.6824.39
Date of S maxtiMay-21Nov-93Dec-93Jan-00Feb-00
teAug-21Jun-94Aug-94Dec-00Apr-01
Theniet El HadSPIE4932281915
D max410111212
S max6.8021.6223.7926.1522.86
Date of S maxtiOct-06Feb-83Apr-83May-83Aug-83
teNov-06Nov-83Dec-83Apr-84May-84
SPEIE4833292224
D max4681012
S max10.5710.3313.1516.0219.63
Date of S maxtiMay-21Jul-20May-83Feb-00Jan-02
teAug-21Dec-20Dec-83Nov-00Dec-02
Explanation: E—number of events, Dmax—maximum duration (months), Smax—maximum drought severity.
Disclaimer/Publisher’s Note: The statements, opinions and data contained in all publications are solely those of the individual author(s) and contributor(s) and not of MDPI and/or the editor(s). MDPI and/or the editor(s) disclaim responsibility for any injury to people or property resulting from any ideas, methods, instructions or products referred to in the content.

