Article

Variability and Trends in Spring Precipitation in the Central Sector of the Iberian Peninsula (1941–2020): The Central System and Southern Iberian System

by
David Espín-Sánchez
1,*,
Fernando Allende-Álvarez
2,
Nieves López-Estébanez
2 and
Jorge Olcina-Cantos
1
1
Laboratory of Climatology, University of Alicante, 03690 Alicante, Spain
2
Department of Geography, Autonomous University of Madrid, 28049 Madrid, Spain
*
Author to whom correspondence should be addressed.
Climate 2025, 13(6), 122; https://doi.org/10.3390/cli13060122
Submission received: 11 May 2025 / Revised: 27 May 2025 / Accepted: 6 June 2025 / Published: 10 June 2025

Abstract

The reduction in and irregularity of spring precipitation in Iberian latitudes over the past few decades are well-documented. This study analyses the behaviour of the accumulated series of monthly and annual spring precipitation for a broad section of the central-eastern part of the peninsula between Plasencia (Western Central System) and the south-eastern part of the Iberian System over the past 70 years. The area was chosen in accordance with the layout of the mountain systems and watersheds that cross the Iberian Peninsula from the west to east. Ten-year series and trends in the precipitation values accumulated between 1951 and 2020 provided by the AEMET were analysed together with their relationship with the pressure values for the same dates modelled by the Copernicus Climate Change Service. The totals obtained show an increasing weight regarding spring precipitation for the eastern sector (40–44%) and a gradual reduction in the west (30%). These percentages show the positive trend of the ten-year values for the easternmost sector. Spring precipitation increases are observed in the easternmost areas (7 mm/decade), while the central and western sectors generally show declining values (−35 mm/decade). The atmospheric pressure at height (Z500) and surface level (Z1000) were analysed together with their relationship with accumulated precipitation, revealing a clear trend of a dominance of high pressures in Z500.

1. Introduction

The current process of climate change has significant effects on the Iberian Peninsula. In addition to the changes in temperature, the ever-more frequent extreme weather events and alterations in the patterns and quantity of precipitation are some of its more concerning consequences. These effects correspond to the general indicators of the behaviour of global warming in the Mediterranean region [1,2]. Specifically in Iberian latitudes, the alterations in the regime, quantity and intensity of precipitation are fundamental factors for the phenological development of ecosystems and fundamental conditioning factors of different human activities [3]. In this environment, the mountain areas play an essential role as receivers and storers of the precipitation volumes that subsequently flow in the rivers or recharge the aquifers. Furthermore, annual precipitation cycles determine the rhythm of the planting, development and harvesting of crops. However, despite the existence of a certain variability in the maximum annual accumulated precipitation due to the geographical location of the meteorological observation points, they are, overall, equinoctial [4]. In the Iberian Peninsula the spring maximums play an essential role in the planting, development and harvest of crops as their critical cycles are between the months of March and August. Therefore, the reduction in the amount of spring precipitation leads to alterations in crop yields. These variations in spring precipitation are derived from the ever-more frequent anticyclonic episodes associated with the polar expansion of the Hadley cell [5,6,7].
This trend in the annual and seasonal reduction in precipitation in Iberian latitudes has been addressed by different authors. In a study on extreme precipitation trends, the CEDEX confirms this trend for the central and southern regions of the peninsula [8]. Meanwhile, Cardoso et al. (2020) evaluate the future changes in precipitation in the Iberian Peninsula in the RCP8.5 scenario and for the periods of 2046–2065 and 2081–2100 [9]. Their analysis reveals that a large part of the region will experience a reduction in annual precipitation of approximately 20–40%, reaching 80% in the summers at the end of the twenty-first century. Senent-Aparicio et al. (2023) study the precipitation trends in the Spanish peninsula, finding a reduction in the annual values in a large part of the territory, with this decrease being spatially significant between March and June [10].
On the other hand, other authors consider spring as one of the seasons most affected by climate change, and the changes in terms of duration and phenology are evident [11,12]. Spring precipitation combined with temperatures and soil humidity are fundamental in the reproductive and growth rhythms of vegetation and crops [13,14]. In the current context of climate change, some authors have recorded flowering several weeks earlier than in a normal context and with temperatures 4 and 5 °C above normal values [15]. This trend has been particularly notable in recent decades in the Iberian Peninsula [16,17,18,19,20,21]. The variations in the thermal timescale and seasonal precipitation are closely related to the values of the NAO index and the pre and post nuptial rhythms of migratory birds and, more specifically, in the earlier movements of passerine birds [22,23]. These alterations in the equinoctial climate rhythms are particularly visible in the more sensitive parts of the Palearctic region, such as in the Tibetan Plateau [24]. Moreover, these changes directly influence the vegetative period of crops and the need to gradually search for cereal varieties with shorter cycles in response to the reduction in precipitation and scarce medium-term feasibility of certain varieties [25,26].
The starting hypothesis seeks to confirm whether alterations exist in spring precipitation based on a west–east longitudinal analysis in the mountain regions of the central strip of the Iberian Peninsula (Central System and southern Cordillera Ibérica). To test this hypothesis, seventy years of climate series with precipitation information are analysed. The motivation of this study is related to the importance of spring precipitation for the maintenance and management of water resources, crops and ecosystems. Understanding variations in spring precipitation behaviour and amounts is crucial for improving near-future forecasts.
The objective of this study is to analyse the possible alterations of the accumulated precipitation trends in the spring months. First, a time range is established, which, depending on the characteristics of the meteorological year, ranges between March (early spring in the Mediterranean and incipient in the southern part of the Iberian System) and the last half of June (Mediterranean summer and the end of the spring in the Iberian plains or southern slopes of the Central System). In addition to this time and phenological variation, the starting point of this research takes as a reference the greater or lesser intensity, duration and depth of the precipitation regimes associated with the southern circulation of the Atlantic flows and the frequency of the regional convective processes and orographies associated with the warming of the Mediterranean.

2. Materials and Methods

2.1. Study Area

The area of study covers a broad section of the sierras, foothills and plateaus of the central-eastern area of the Iberian Peninsula (31,285.9 km2), where there is a high level of thermal precipitation heterogeneity (Figure 1). The degree of continentality, the latitude and longitude and the greater or lesser proximity to the Mediterranean or Atlantic are key factors in its precipitation records [27]. To this, we can add the orientation and complexity of its orography and altitude. Considering these factors, wide sectors are differentiated using as a reference thermal precipitation classifications on a regional scale [28] in the river basins of the Tajo, Duero, Ebro and Júcar: (1) cold Mediterranean continental peaks and slopes of the Central–Ayllón System, (2) cold continental sub-Mediterranean depressions of the sub-eastern Iberian System, (3) humid sub-Mediterranean Iberian sierras, (4) cold continental sub-Mediterranean transition sectors and (5) warm continental sub-Mediterranean transition sectors. However, on a smaller scale, there is large precipitation heterogeneity that is difficult to classify, particularly in the case of the Central–Ayllón System [28,29,30]. According to the classification, the peaks and slopes facing the Duero can be included in the category of mountain Mediterranean continental climates (600–2000 mm) with features typical of the North Plateau in its foothills (accumulated between 350 and 550 mm). In the case of the slopes towards the Tajo (between Plasencia and the Guadiela River), the characteristics are those considered within the South Plateau with accumulated precipitations similar to the previous ones but with temperature ranges between 18 and 20.5 °C [28]. The Iberian System exhibits a greater complexity with mountainous sectors with proven precipitation in Gúdar, Javalambre and Albarracín (between 700 and 2000 mm) and depressions with mean altitudes close to 1000 m (confluence of the Alfambra–Guadalaviar, Mijares and Turia) with recorded values of between 400 and 500 mm. The slopes towards the Mediterranean between the Cabriel and the Mijares are defined as the eastern Mediterranean facade (400–850 mm). To this, we can add the cold continental transition Mediterranean sectors (slopes to the Jalón between the Barahona and Sierra Ministra or to the Júcar in Cuenca).

2.2. Climate Data

This study uses two types of data for the period of 1951–2020: precipitation and geopotential values. The first type includes the accumulated daily series provided by the AEMET (State Meteorological Spanish Agency) in ASCII format, specifically version 2 [31]. The daily original series has been used in netCDF format. The daily values were simplified into accumulated monthly data between the months of March and June (considering the astronomical spring and phenology for such a broad area) and the annual and seasonal total. The analysis is reduced to a single season, spring, due to the importance of spring precipitation in generating pasture for extensive livestock farming. This information is available on a 5 × 5 km grid for the whole of the peninsula. Of the 3236 individual values available, a total of 1381 values were selected by intersecting the grid with the delimiting polygon of the area of study.
The daily scale gridded precipitation series was generated using a selected set of precipitation observations from the AEMET National Climatological Data Bank, namely the 24 h accumulated precipitation data series from the stations that were chosen for the production of regionalized climate change scenarios using empirical methods. These series meet a series of requirements regarding their completeness (there are more than 19 years of annual data) and their homogeneity (the annual accumulated precipitation data pass at least the Alexandersson or Wald-Wolfowitz test). In this way, the number of time series used to generate the gridded precipitation series is reduced to 2300 meteorological stations out of the more than 9000 existing in the AEMET National Climatological Data Bank.
The daily scale grid used in the analysis was validated by the authors themselves [31], determining that, in general terms, the statistical correlations are between 0.7 and 0.9 for the whole of Spain (verification with 44 independent meteorological stations), and they also determined BIAS values (−3.5 and 0.8) and the RMSE (1.4 to 13.5). The limitation posed by mountainous areas, which lack sufficient density of observations to adequately represent this heterogeneity, was also verified by the authors. They observed how the correlation decreases as the vertical distance increases. For altitudes above 900 m, the value is 0.9 with a horizontal distance of 10 km; then, it drops to 0.8 with a distance of 25 km, further drops to 0.7 at 40 km, and finally, for a distance of 150 km, the statistical correlation is 0.5.
The second group of data considers the information calculated based on the ERA5 reanalysis of the geopotential height variable obtained from the Climate Data Store (CDS) Copernicus Climate Change Service (C3S). The values available have a horizontal resolution of 0.25° × 0.25° (atmosphere) and an hourly time frame, with a daily updating frequency. Specifically, the data obtained from the ten-year monthly averages for the months between March and July were used. In this period, information was selected on two levels, 1000 (Z1000) and 500 hPA (Z500) in *grib format, expressed in m2 s−2 and considering as a standard hourly unit 0:00 UTC and as an altitude of reference 0 and 5600 metres, respectively.
Furthermore, a distinction is made between large-scale precipitation (lsp) (which represents the formation and dissipation of clouds and large-scale precipitation) and convective precipitation (cp), which represents convection at spatial scales smaller than the grid box. This aspect will be key to analyse Z500 and Z1000.

2.3. Data Integration

The accumulated daily precipitation data were simplified into monthly and annual data. Based on these values, the monthly and annual accumulated average precipitation was calculated, together with the accumulated precipitation in spring and spring losses or gains with respect to the annual total. In the case of geopotential height, the original value (potential gravitational energy by unit of mass with respect to sea level) at levels Z500 and Z1000 was transformed for its interpretation in m2 s−2 metres [32]. Due to the greater time frame of the mesoscale situations, the data obtained between March and July (1950–2020) were selected. The initial information was obtained using as a reference the space between the coordinates 45 N 30 S–11 W 4 E, dimensioned at hemispheric scale.
All of the original information was integrated into ArcGIS PRO v2.6, considering, in the case of precipitation, three vector layers linked to the reference information (1381 points): total accumulated annual values (69 items), seasonal totals for each of the spring months (276 items) and seasonal and annual totals and percentage loss values (207 items). On the other hand, the information referring to geopotential height was initially obtained from a multidimensional raster (GRID) processed in ArcGIS PRO v2.6 using the aggregation method and taking the ten-year average for subsequent calculations. This aggregation method has been used in studies to analyse anomalies in winter atmospheric circulation in the Northern Hemisphere [33]. By overlapping, information was obtained for 1381 points, excluding those sectors with null values, differentiating five vector layers for each Z level and using as a final value of reference the aggregated average (35 items for each layer).
In both cases and for a better interpretation, the volume of data was generalised through the use of ten-year and inter-decade records and their grouping into hydrographic basins [34,35].

2.4. Trend Calculation

In the calculation of trends, the results were initially processed in ArcGIS PRO v2.6 and were integrated and subsequently processed in the statistical software R-4.3.2 and, more specifically, using the library: “Rtrend Trend Estimating Tools” [36].
The time trends for the monthly, spring and annual averages of total precipitation and geopotential height in Z500 and Z1000 were calculated through non-parametric testing, as the analysis data do not follow a normal distribution. The analysis reveals that the mean and median are not similar. The Theil–Sen estimator (T-S) [37,38] was then applied to confirm the existence of trends in climate series, combined with the Mann–Kendall test [39,40] to determine the slope of the regression line or the magnitude of the trend. The latter method enabled the detection of the increasing or decreasing trend in the data series and, at the same time, the estimation of the slope based on the calculation of the mean slope of each pair of values of the whole set of data separately. In the calculations of trend significance, a significance level of 0.05 was used.
After obtaining the set of simple slopes for each pair [n(n − 1)/2 pairs in total] through different measurements in the time series (set of slopes in pairs), the result was valid if the mean of the set of slopes was close to the unknown slope (Equation (1)). In the case of a series of n pairs of data, the following method was used to obtain the slope:
qi = (xj − xk)/(j − k) I = 1, 2, …, n
q median = q (n + 1)/2 if n is an uneven number
q median = [q(n/2) + q(n + 2)/2]/2 if n is an even number
where xj and xk are the values of the series at moments j and k (j > k), respectively.
As it is a non-parametric test, the value of the median slope of the even set was used to estimate the slope of the unknown population. As the median even slope is taken instead of the mean, the slopes of the extreme pair (due to one or more atypical values or other errors) were ignored and had a small or insignificant impact on the estimator of the final slope.
The time trend of spring accumulated precipitation (mm/decade) was divided into the seven zones with the most relevant changes, delimited by hydrographic sub-basins. In the case of total monthly and spring precipitation and its statistical correlation with the geopotential height of 500 and 1000 hPa, the Kendall correlation coefficient (KCC) was used [41,42,43,44]. The Kendall concordance coefficient indicates the degree of association of the ordinal evaluations carried out by multiple evaluators as the same samples are evaluated.

3. Results

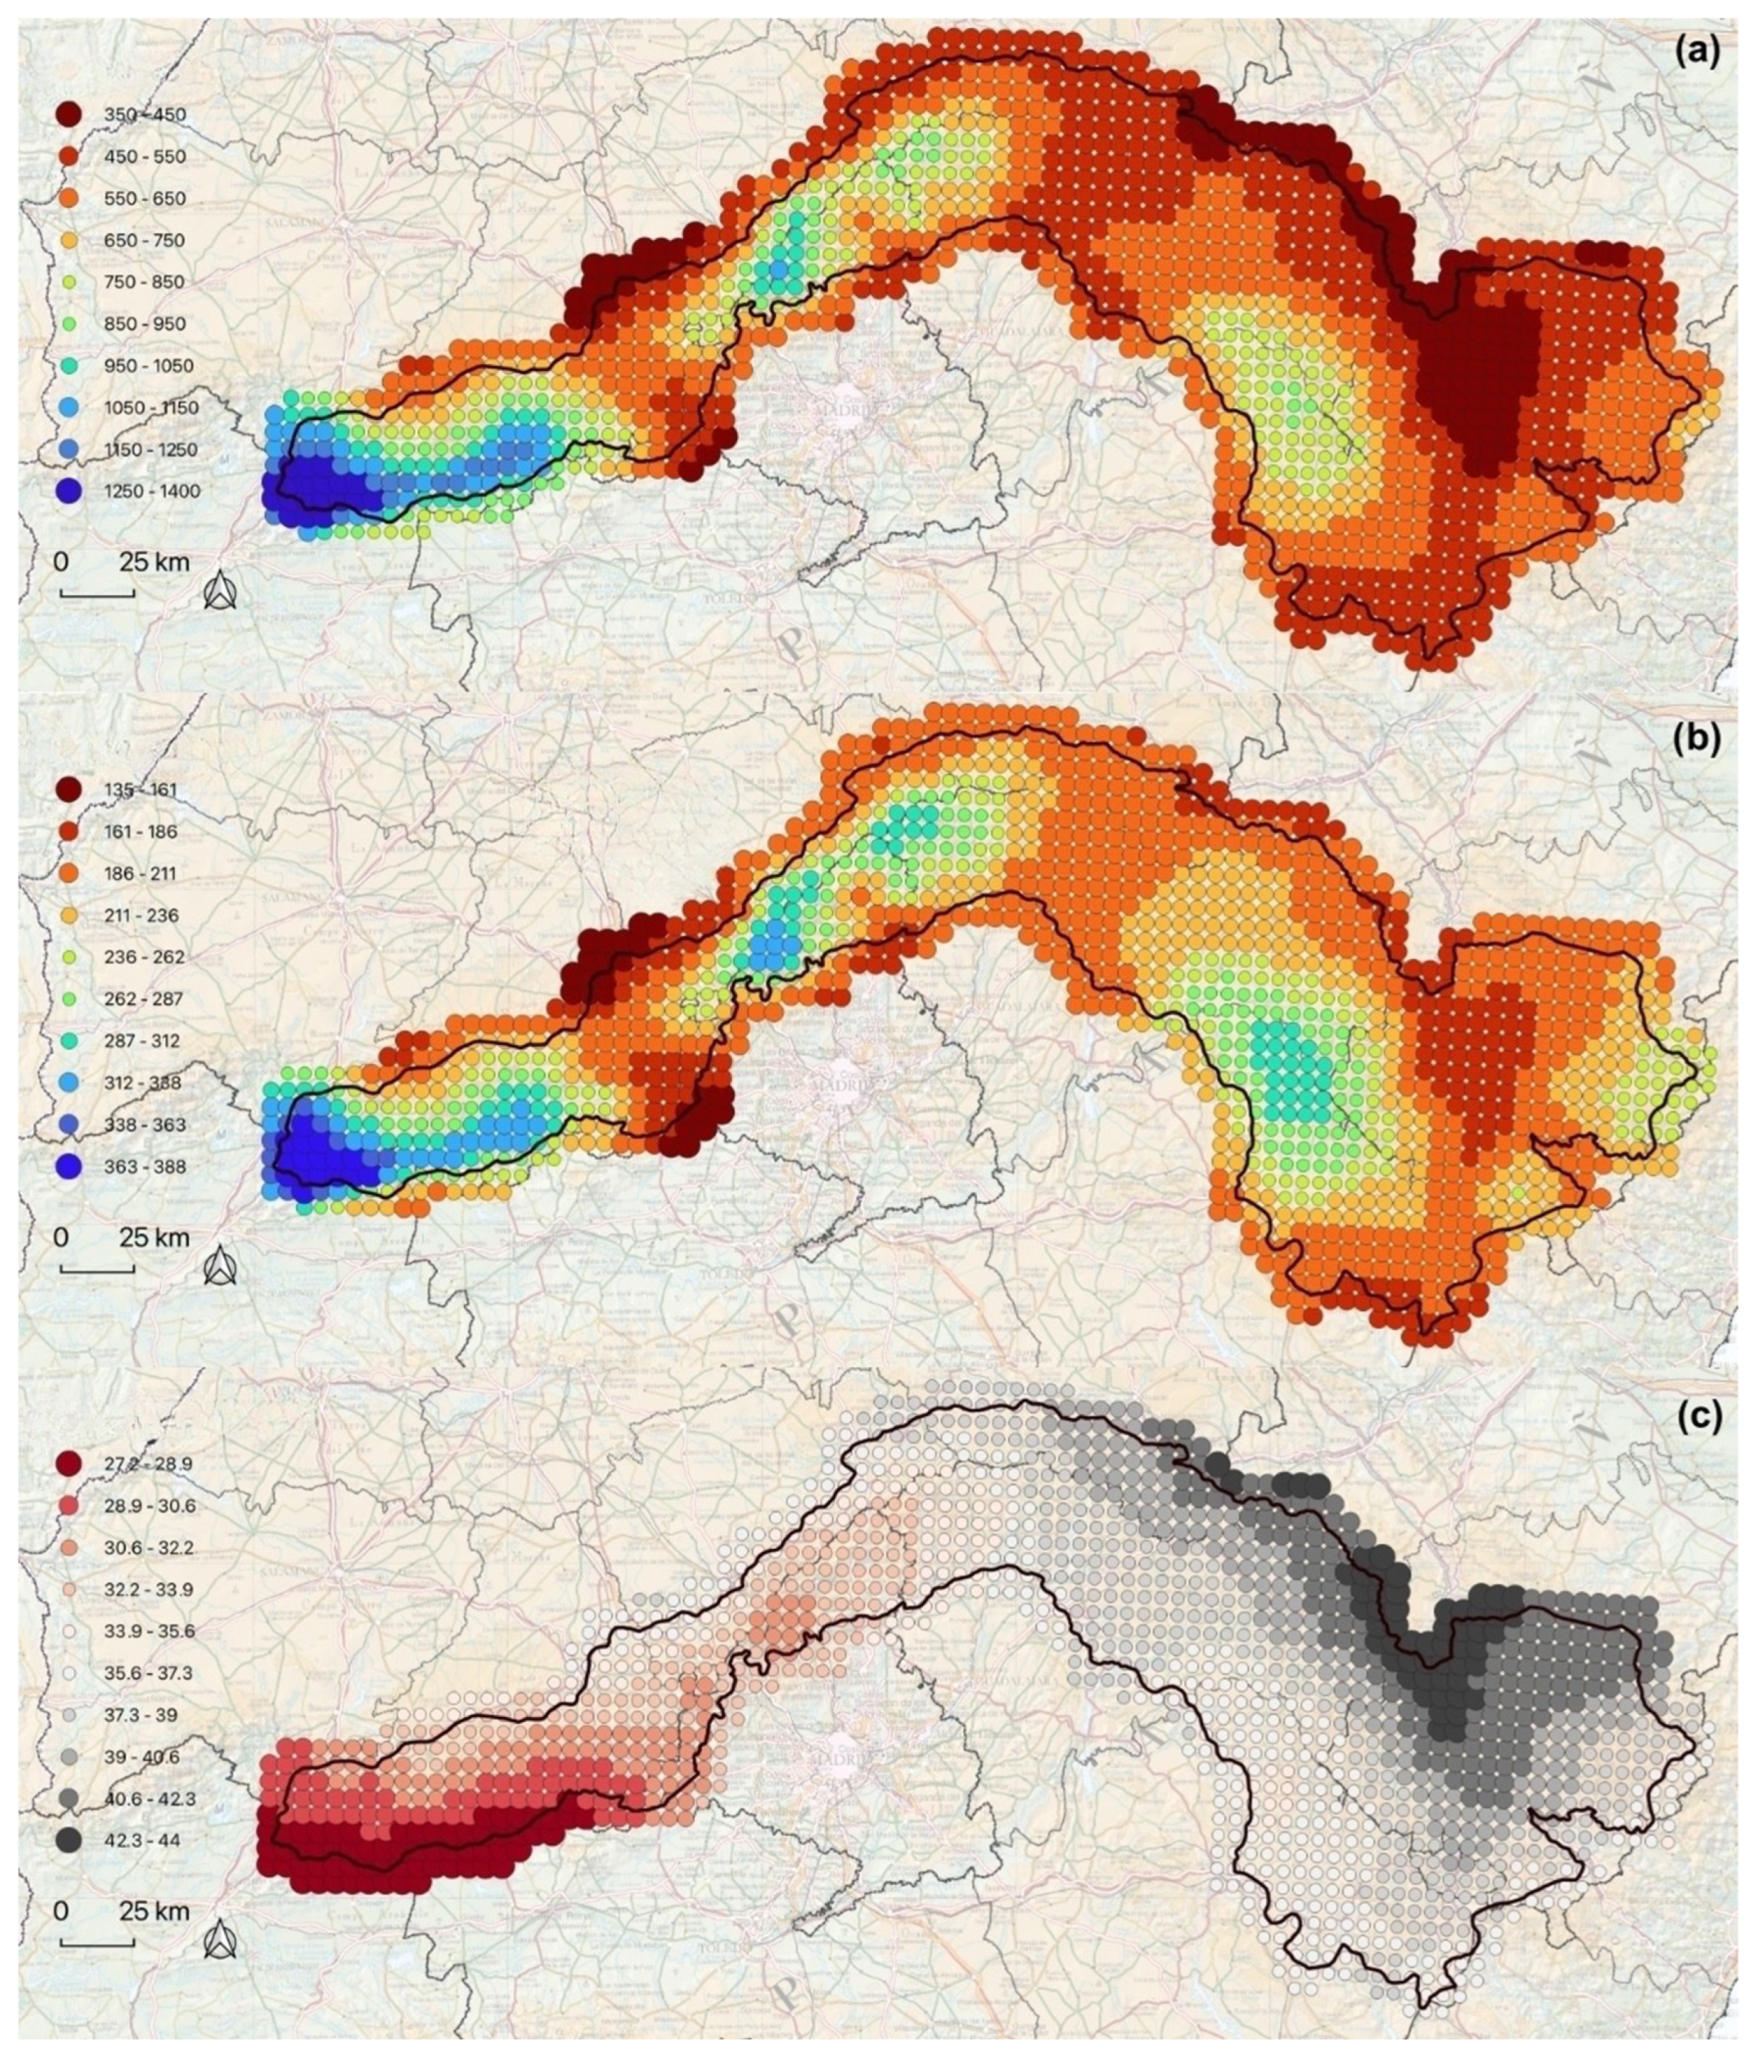
3.1. General Characterisation of Annual and Spring Precipitation

The annual mean precipitation of the area of study is 627.2 mm, with a notable spatial variability and differences between accumulated maximums and minimums of 1031.8 mm. In 45.6% of the territory, values of between 470 and 607 mm are reached, while in 15.3% of the territory, values of over 800 mm are recorded (Central and Iberian Systems). The sectors with minimum records (9.9%) are located in the Jiloca corridor, the slopes to the Ebro and depressions of the Adaja and Alberche (450 mm). In all cases, the longitudinal location, morpho structural type and orientation and layout of their orography play a fundamental role.
The maximum annual precipitation is located in the most westerly sector of the Central System (Tormantos–Covacha del Losar). Its orientation, with open west-facing slopes, favours the penetration of the Atlantic storms with maximum records of 1398.9 mm (district of La Vera). Meanwhile, the minimum annual precipitation is located in sectors that are structurally shaped like a ditch or depression or surrounded by orographies such as the Jiloca river corridor (Torremocha del Jiloca–Villarquemado), with an annual accumulated volume of 379.8 mm, or the basin of the Adaja River as it passes through Ávila (367.1 mm) (Figure 2a).
The total spring precipitation reaches an average of 223.1 mm (36.5% of the annual total) with a distribution similar to the annual values (Figure 2b). Its maximum value is reached in the western sector of the Sierra de Gredos (Valle del Jerte–Tornavacas with 388.1 mm), and the minimums in the Adaja River close to Ávila (135.4 mm) and in the basin of the Perales River−San Martín de Valdeiglesias (146.9 mm). A total of 47.9% of the territory records precipitation amounts of between 187.4 and 226.4 mm. However, it should be noted that this interpretation should be modified if we consider the percentage contributions of the spring precipitation with respect to total annual precipitation. Figure 2c shows a clear longitudinal gradient from west to east, with a lower weight in the western-most part of the area of study and a higher proportion in the east. In the most westerly sector and central area of the Sierra de Gredos, particularly on the southern-most slopes, the spring precipitation accounts for less than 30% of the total annual precipitation. In the most north-easterly sector (from the slopes of the Duerto to the Sierra de Javalambre) the percentages are between 40% and 44% (Figure 2c).

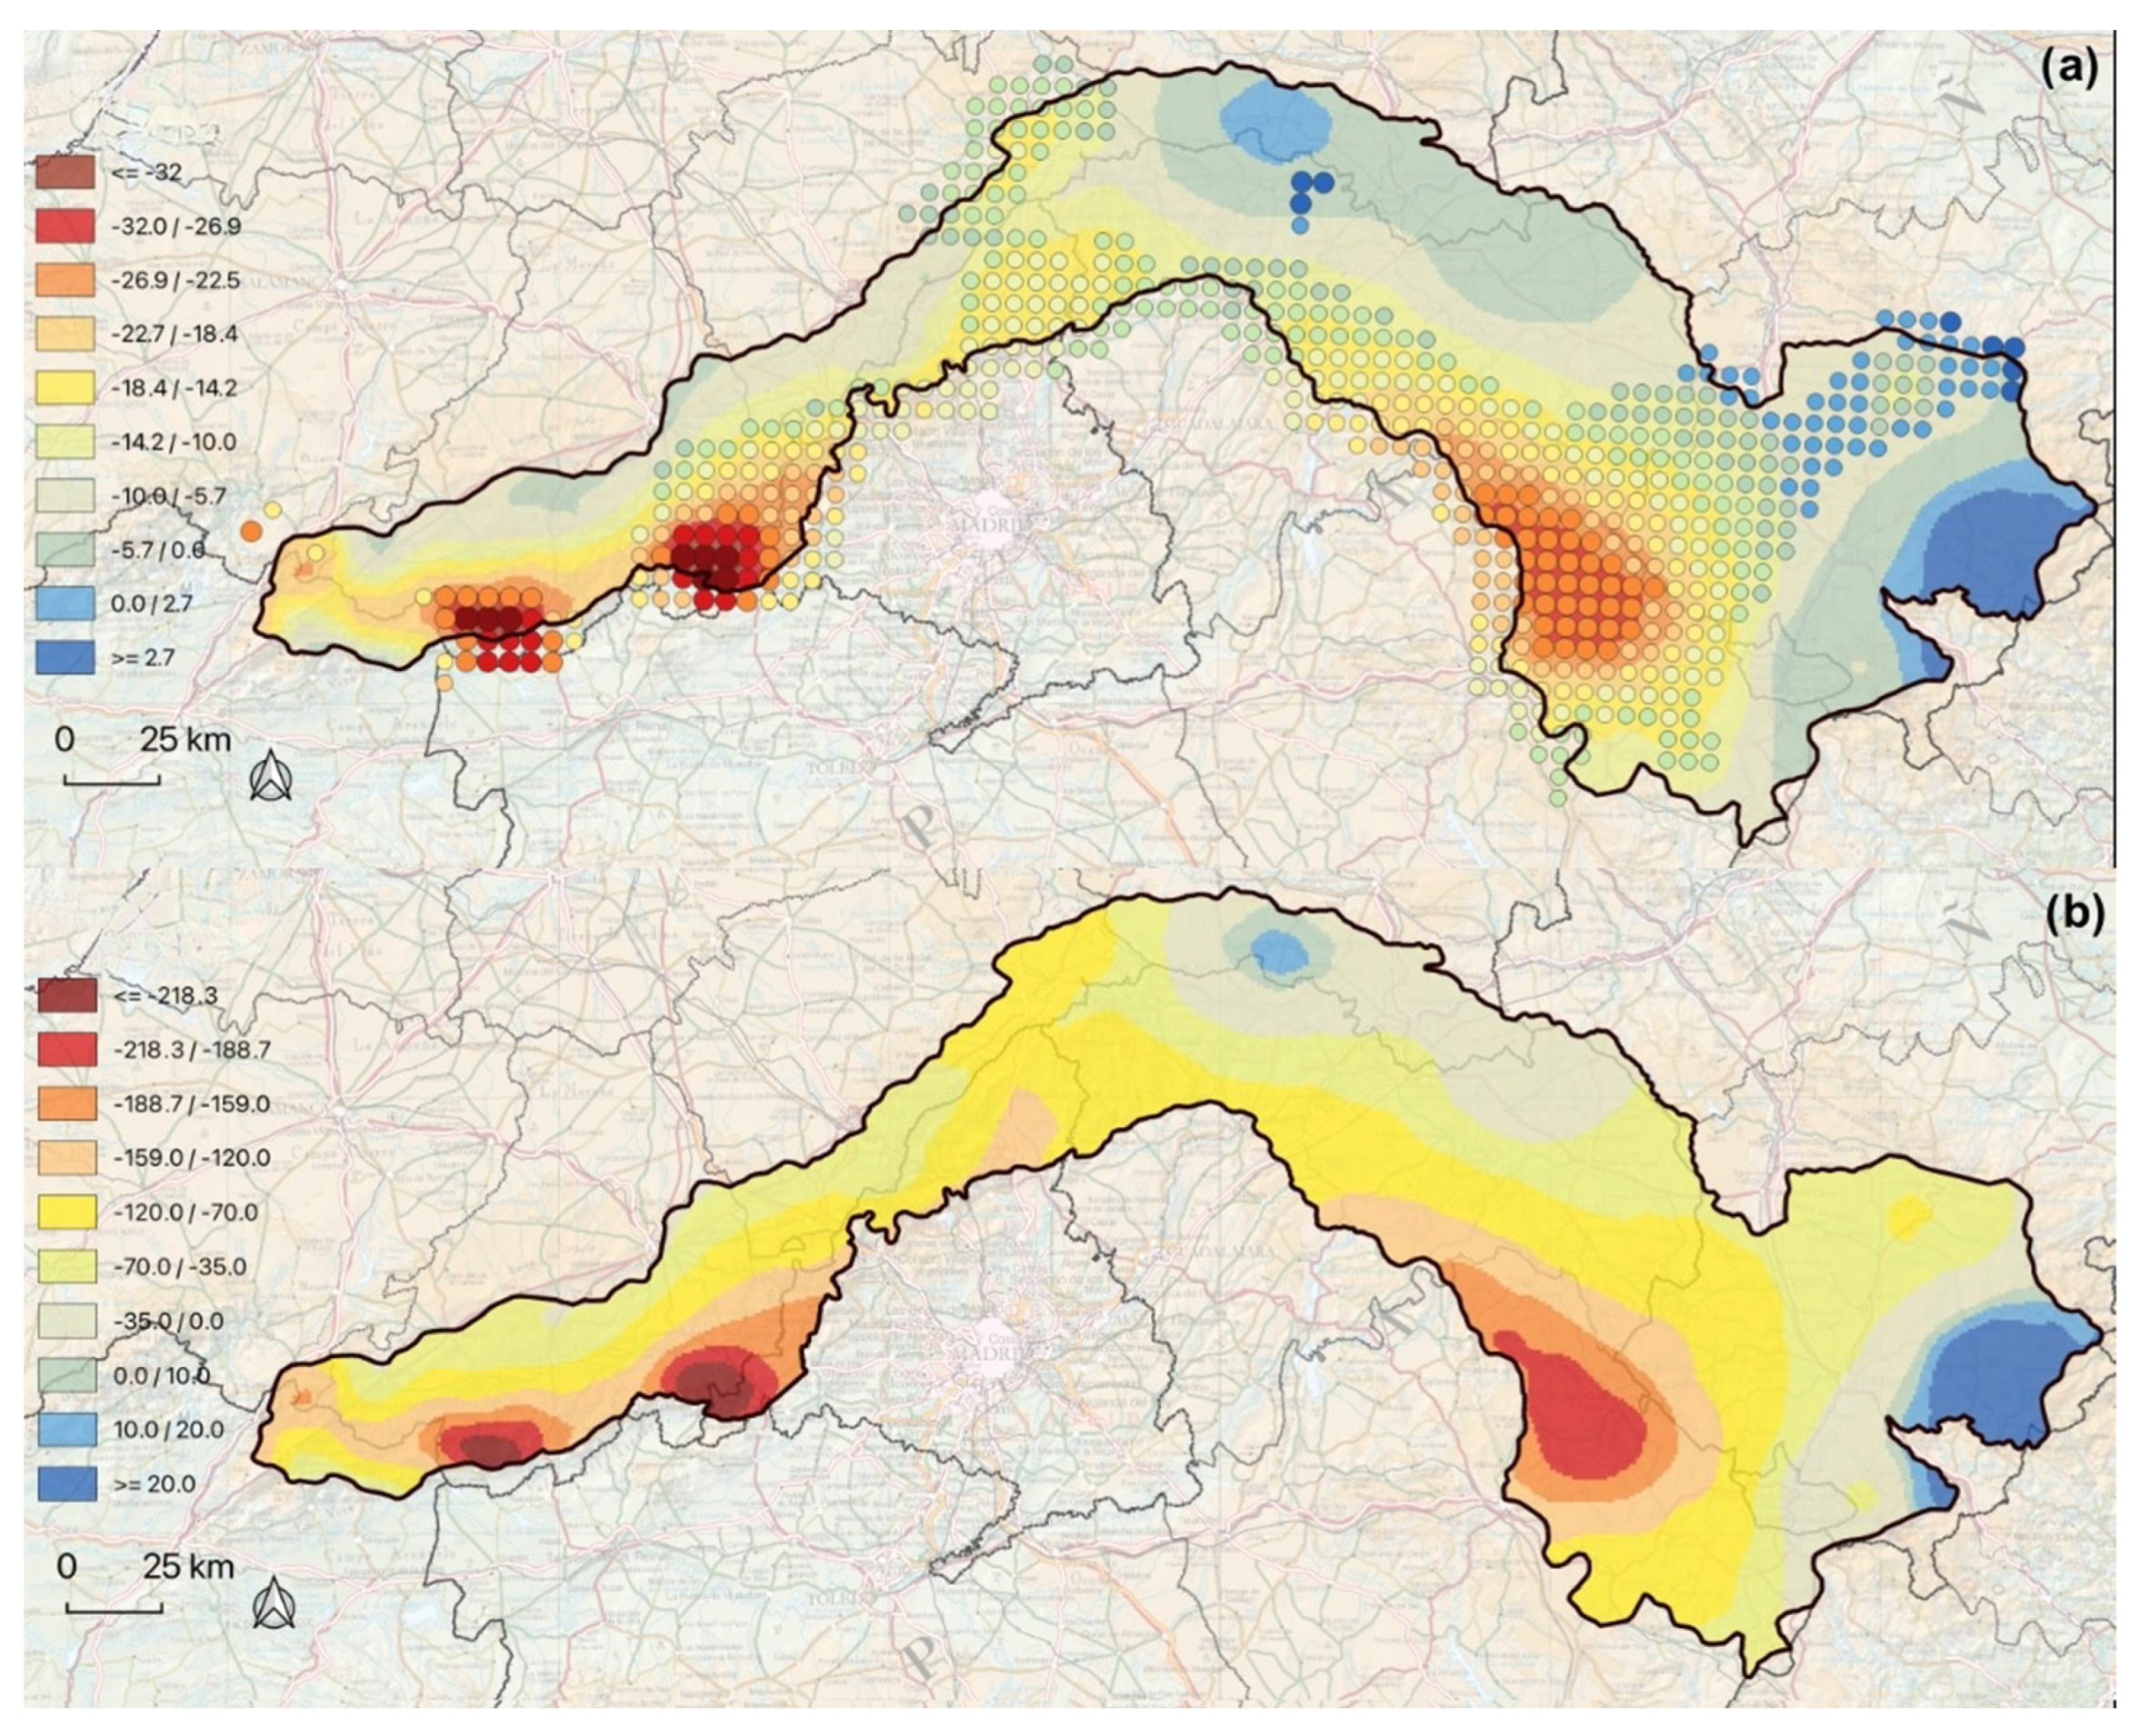
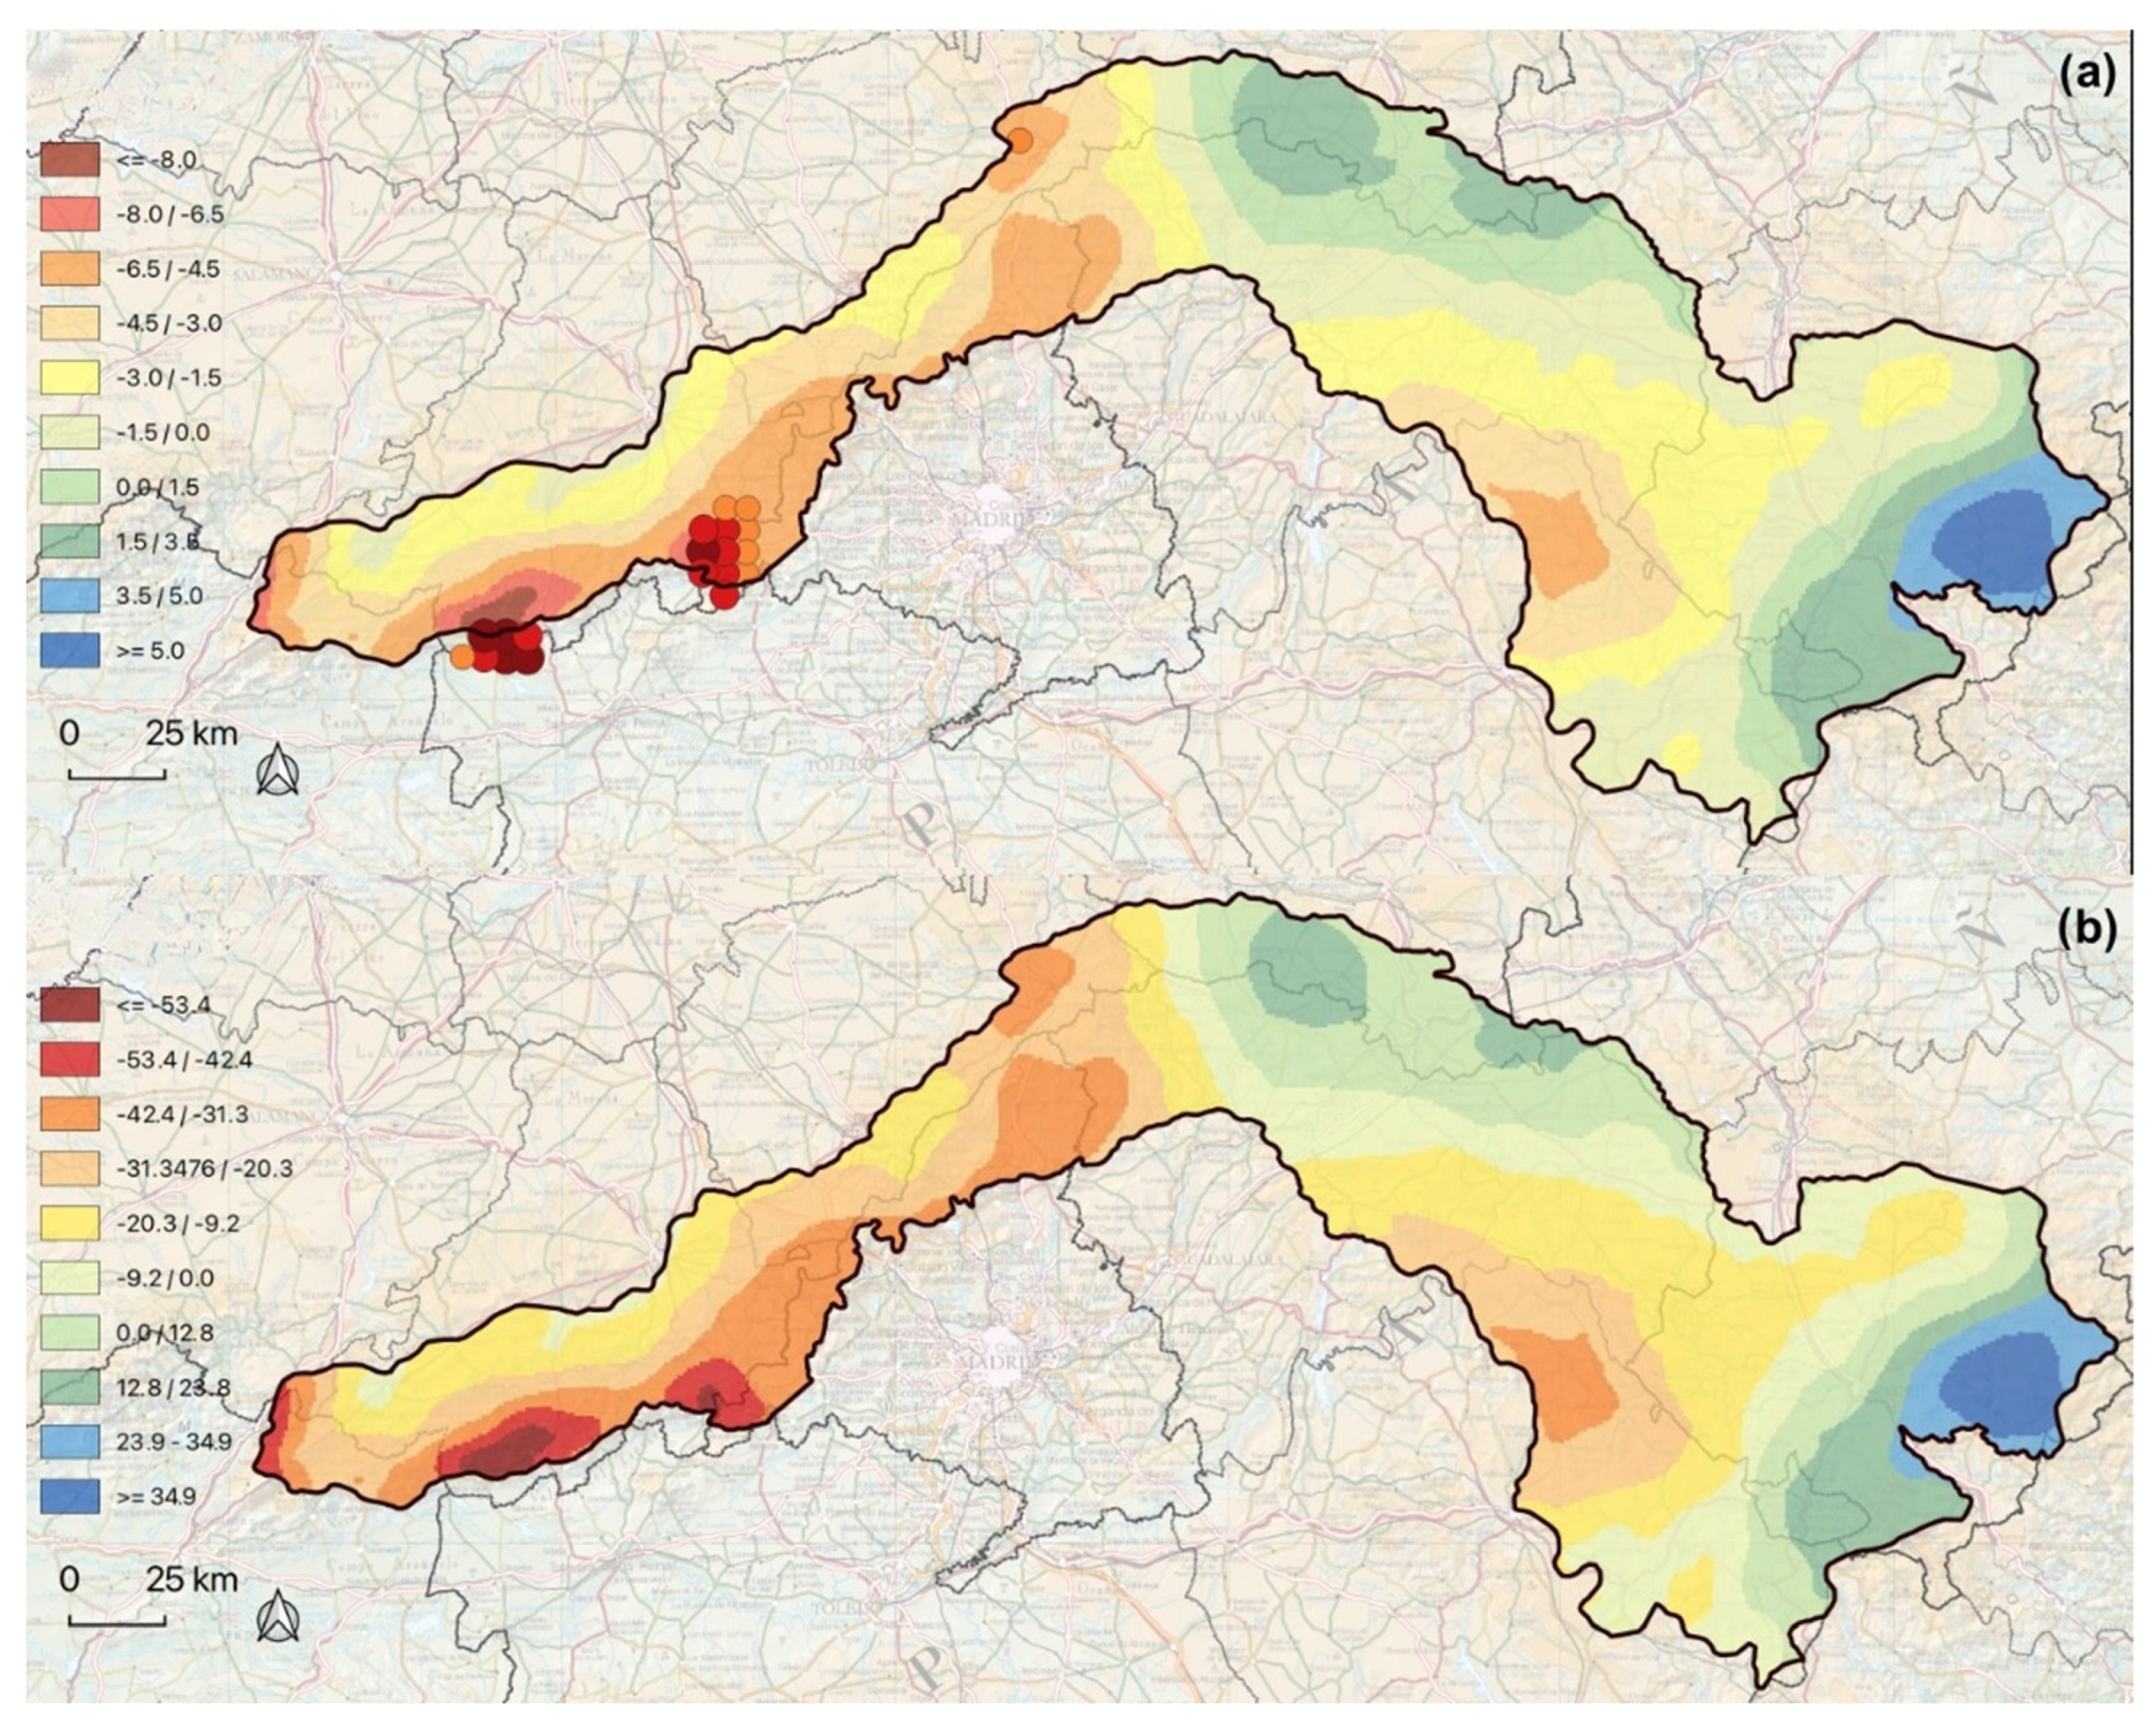
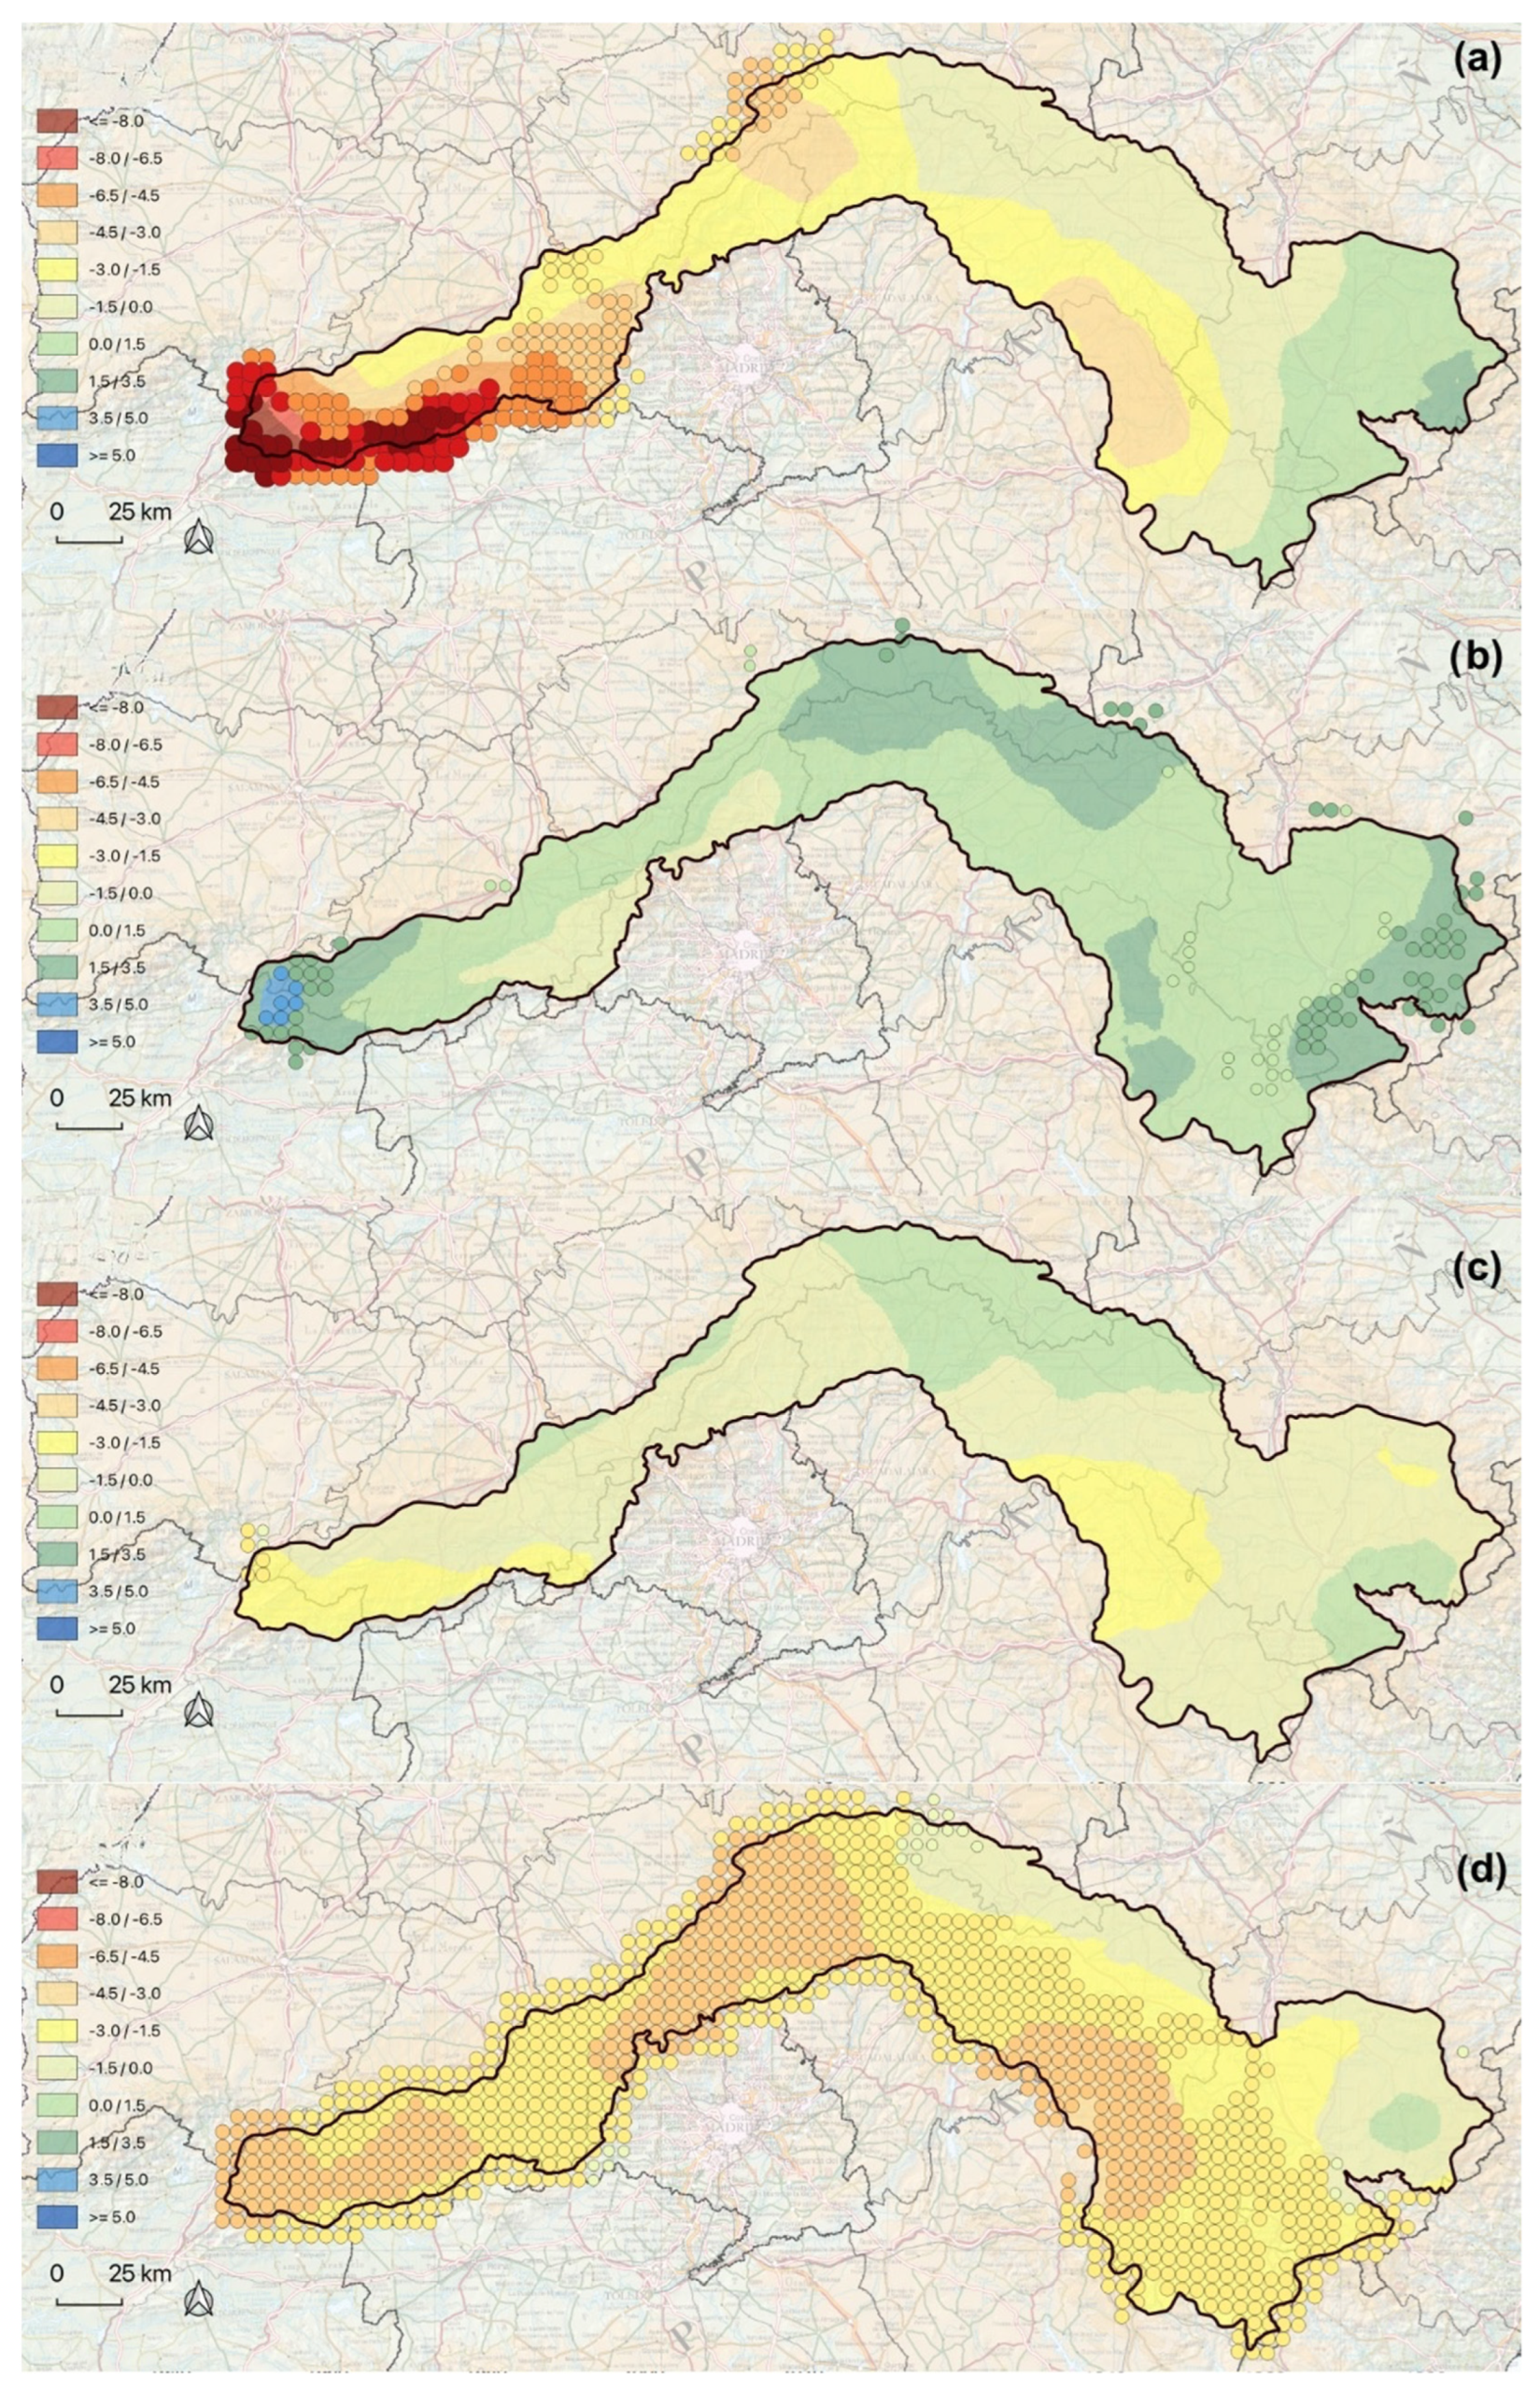
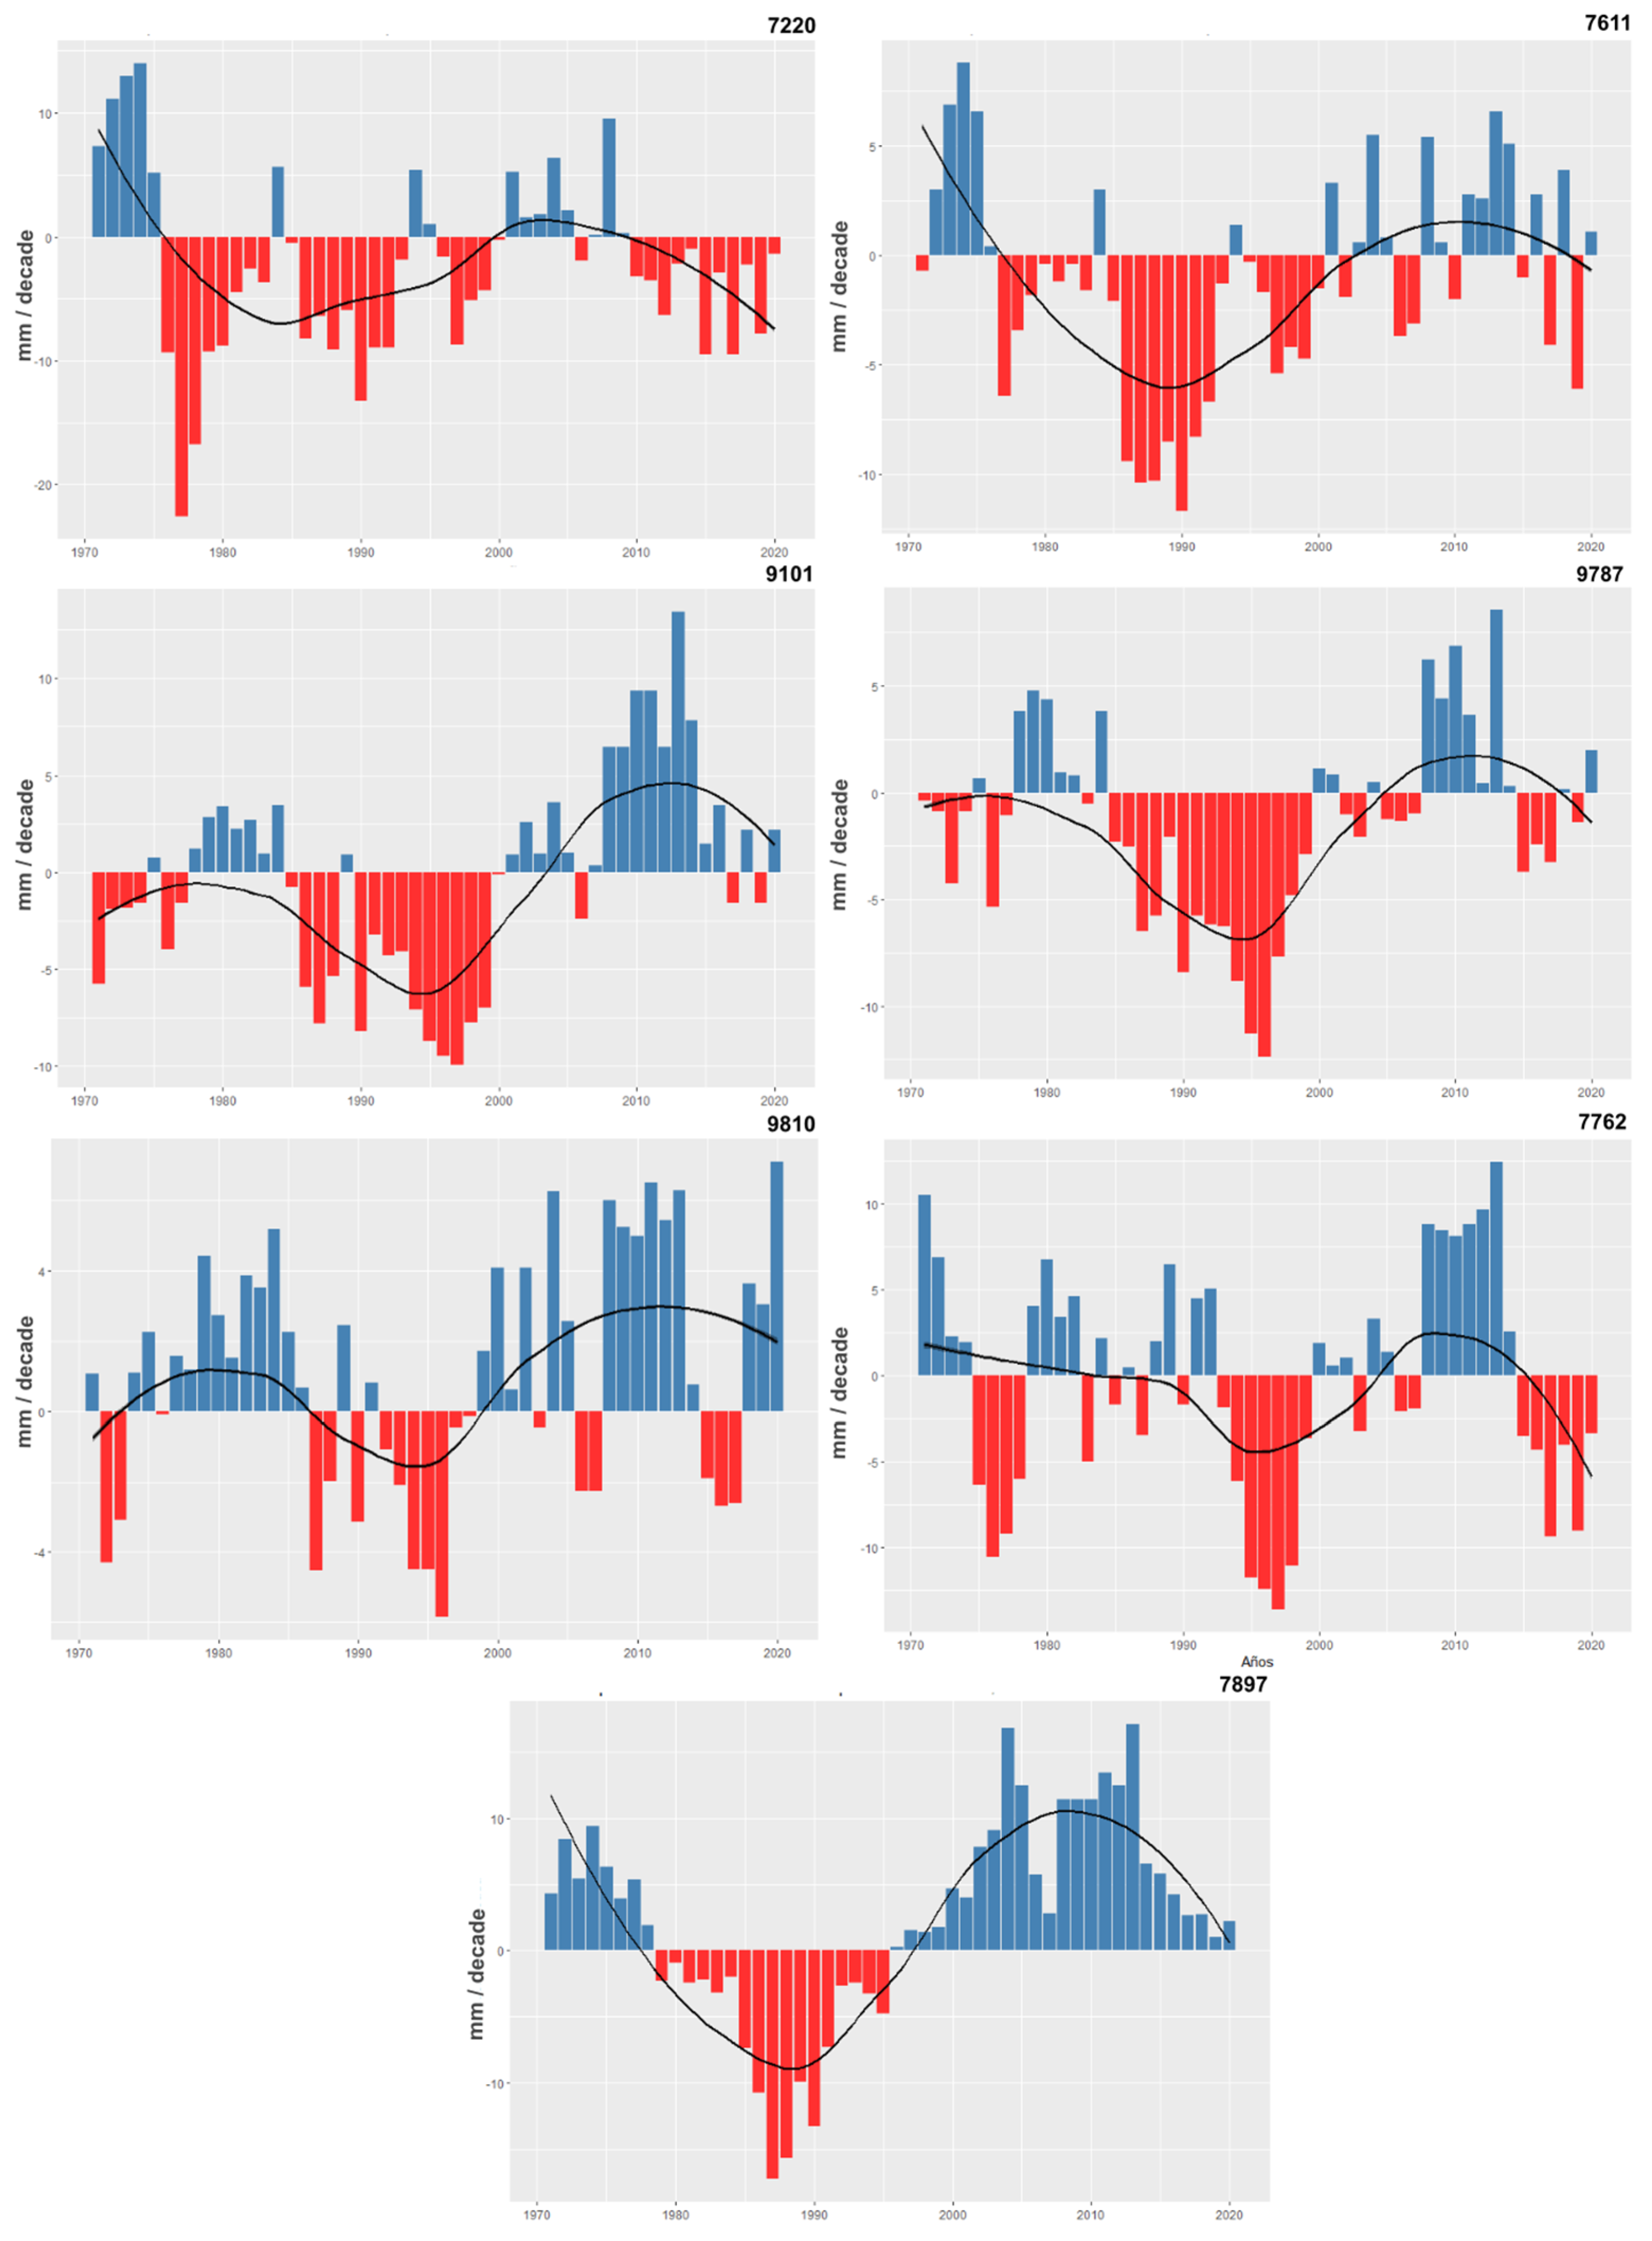
3.2. Analysis and Characterisation of Annual, Seasonal and Monthly Trends

In general, an overall reduction of −11.0 mm/decade in annual trends can be observed, with a gradual decline starting from the 1950s. The most statistically significant reductions are found in the southern sector of the Sierra de Gredos (Candeleda–Arenas de San Pedro) and the central–western sector in the depression of Alberche (−34.7 and −35.3 mm, respectively). There are reductions of up to 247.4 mm for the whole time interval with values of −37.5% with respect to the annual average in Navahondilla and San Martín de Valdeiglesias. On the other hand, the greatest increases are recorded in the Sierra de Gúdar–Javalambre, in the surroundings of Alcalá de la Selva–Valdelinares (+7.0 mm/decade) and of Almazán (Soria) with +2.0 mm/decade. These accumulated maximums for the whole series represent gains of +48.8 mm and an increase of +10.3% with respect to the annual total in Gúdar-Javalambre (Figure 3).
In the spring season, the trend indicates an overall reduction (−1.5 mm) (Figure 4). Similarly to the annual value, the variability is notable and particularly significant in the Iberian System. In this sector, the trend fluctuates between the general losses in the Sierra de Tragacete and Montes Universales (Alto Tajo) and the increases in the Sierra de Gúdar (Alto Mijares). In the latter geographical area, the increase reaches 6.6 mm, which represents 19.2% of the total accumulated precipitation in spring, specifically in Alcalá de la Selva–Valdelinares, located in the far east. On the contrary, decreases of up to −9.2 mm are recorded in the surroundings of Candeleda (Gredos Central), which represents a reduction of −24.9% with respect to the accumulated spring value. Statistically significant records (−53.4 mm) are located in the central and eastern slopes of the Sierra de Gredos.
There are large differences in the monthly trends, greatly contributing to the reduction in spring precipitation during the months of March and June. Meanwhile, April and May display positive precipitation trends (Figure 5).
March records an overall decrease of −1.88 mm in the area of study, and the second largest decrease is recorded in June. Particularly noteworthy is the statistically significant decrease in the western-most sector of the area of study (western and southern slopes of the Sierra de Gredos) with values of −9.6 mm (Sierra de Tormentas, surroundings of Piornal and Valle del Jerte) and −9.1 mm (Arenas de San Pedro–Valle del Tiétar). The most easterly sector records precipitation increases with moderate values (+1.6 mm) in the Sierra de Gúdar (Alcalá de la Selva–Linares de Mora). In general, increases were recorded in 19.3% of the territory, and widespread losses were recorded in the final decades in 80.7%.
Apart from certain sectors of the Sierra de Guadarrama, in April, a +1.21 mm trend can be observed over the final decades with an overall increase in 91.9% of the area analysed. The increase in the most westerly sector of the area of study (surroundings of Puerto de Tornavacas) is statistically significant, with values of +3.8 mm in the central-northern sector of Tierra de Osma and the River Jalón (+2.1 mm) and in the most easterly part of the Iberian System (Gúdar-Javalambre, Sierra de Santa Bárbara and Montes Universales), with increases of between +1 and +2 mm. The only precipitation reductions (8.1%) are found in the Sierra de Guadarrama-Somosierra with values of up to −0.8 mm.
An average time trend of −0.6 mm was recorded for May. This is the month with the most neutral trend of those analysed. Only 7 of the 1382 points of analysis have statistically significant values. A total of 77.4% of the area of study recorded slight precipitation reductions, with a greater decrease of −2.9 mm (Sierra de Béjar–Puerto de Tornavacas). The remaining 22.6% recorded slight increases of up to +1.5 mm (central–northern sector and the Sierras of Gúdar–Javalambre).
Finally, the greatest precipitation changes, with an overall decrease of −2.3 mm, were recorded in June. Only 0.8% of the area recorded slight precipitation increases (+0.7 mm) in the surroundings of Gúdar (Alcalá de la Selva–Valdelinares). The rest of the area recorded highly homogeneous precipitation reductions, distinguishing three large geographical areas. The first is the most westerly of the area of study (Sierra de Gredos), with losses of −3 to −4 mm; the second is Sierra de Guadarrama–Somosierra with values of −3 to −3.5 mm; and, finally, the third sector is the Serranía de Cuenca–Alto Tajo with reductions of up to −4.3 mm (Sierra de Tragacete).
The monthly trend analysis reveals a notable reduction in the annual values in the western sector and gradual accumulated ten-year gains in the south-east sector. This corroborates the precipitation characterisation, inferring a change in the mesoscale situations with an increased importance of the local orographic mechanisms and the instability of the air columns associated with the warming of the Mediterranean.
The gains are more perceptible in the monthly trends where there is an irregularity and shortening of the period of increases in early spring with major accumulated losses and variable losses and gains in April and May within an overall irregularity. Although there were positive values for the month of April, May experienced an overall reduction, with positive values only being recorded in Gúdar–Javalambre. Finally, in June, sharp decreases were experienced in the whole area of study except for the south–east sector. Only the Iberian mountains show increased in the accumulated value, probably associated with the local conditioning factors.

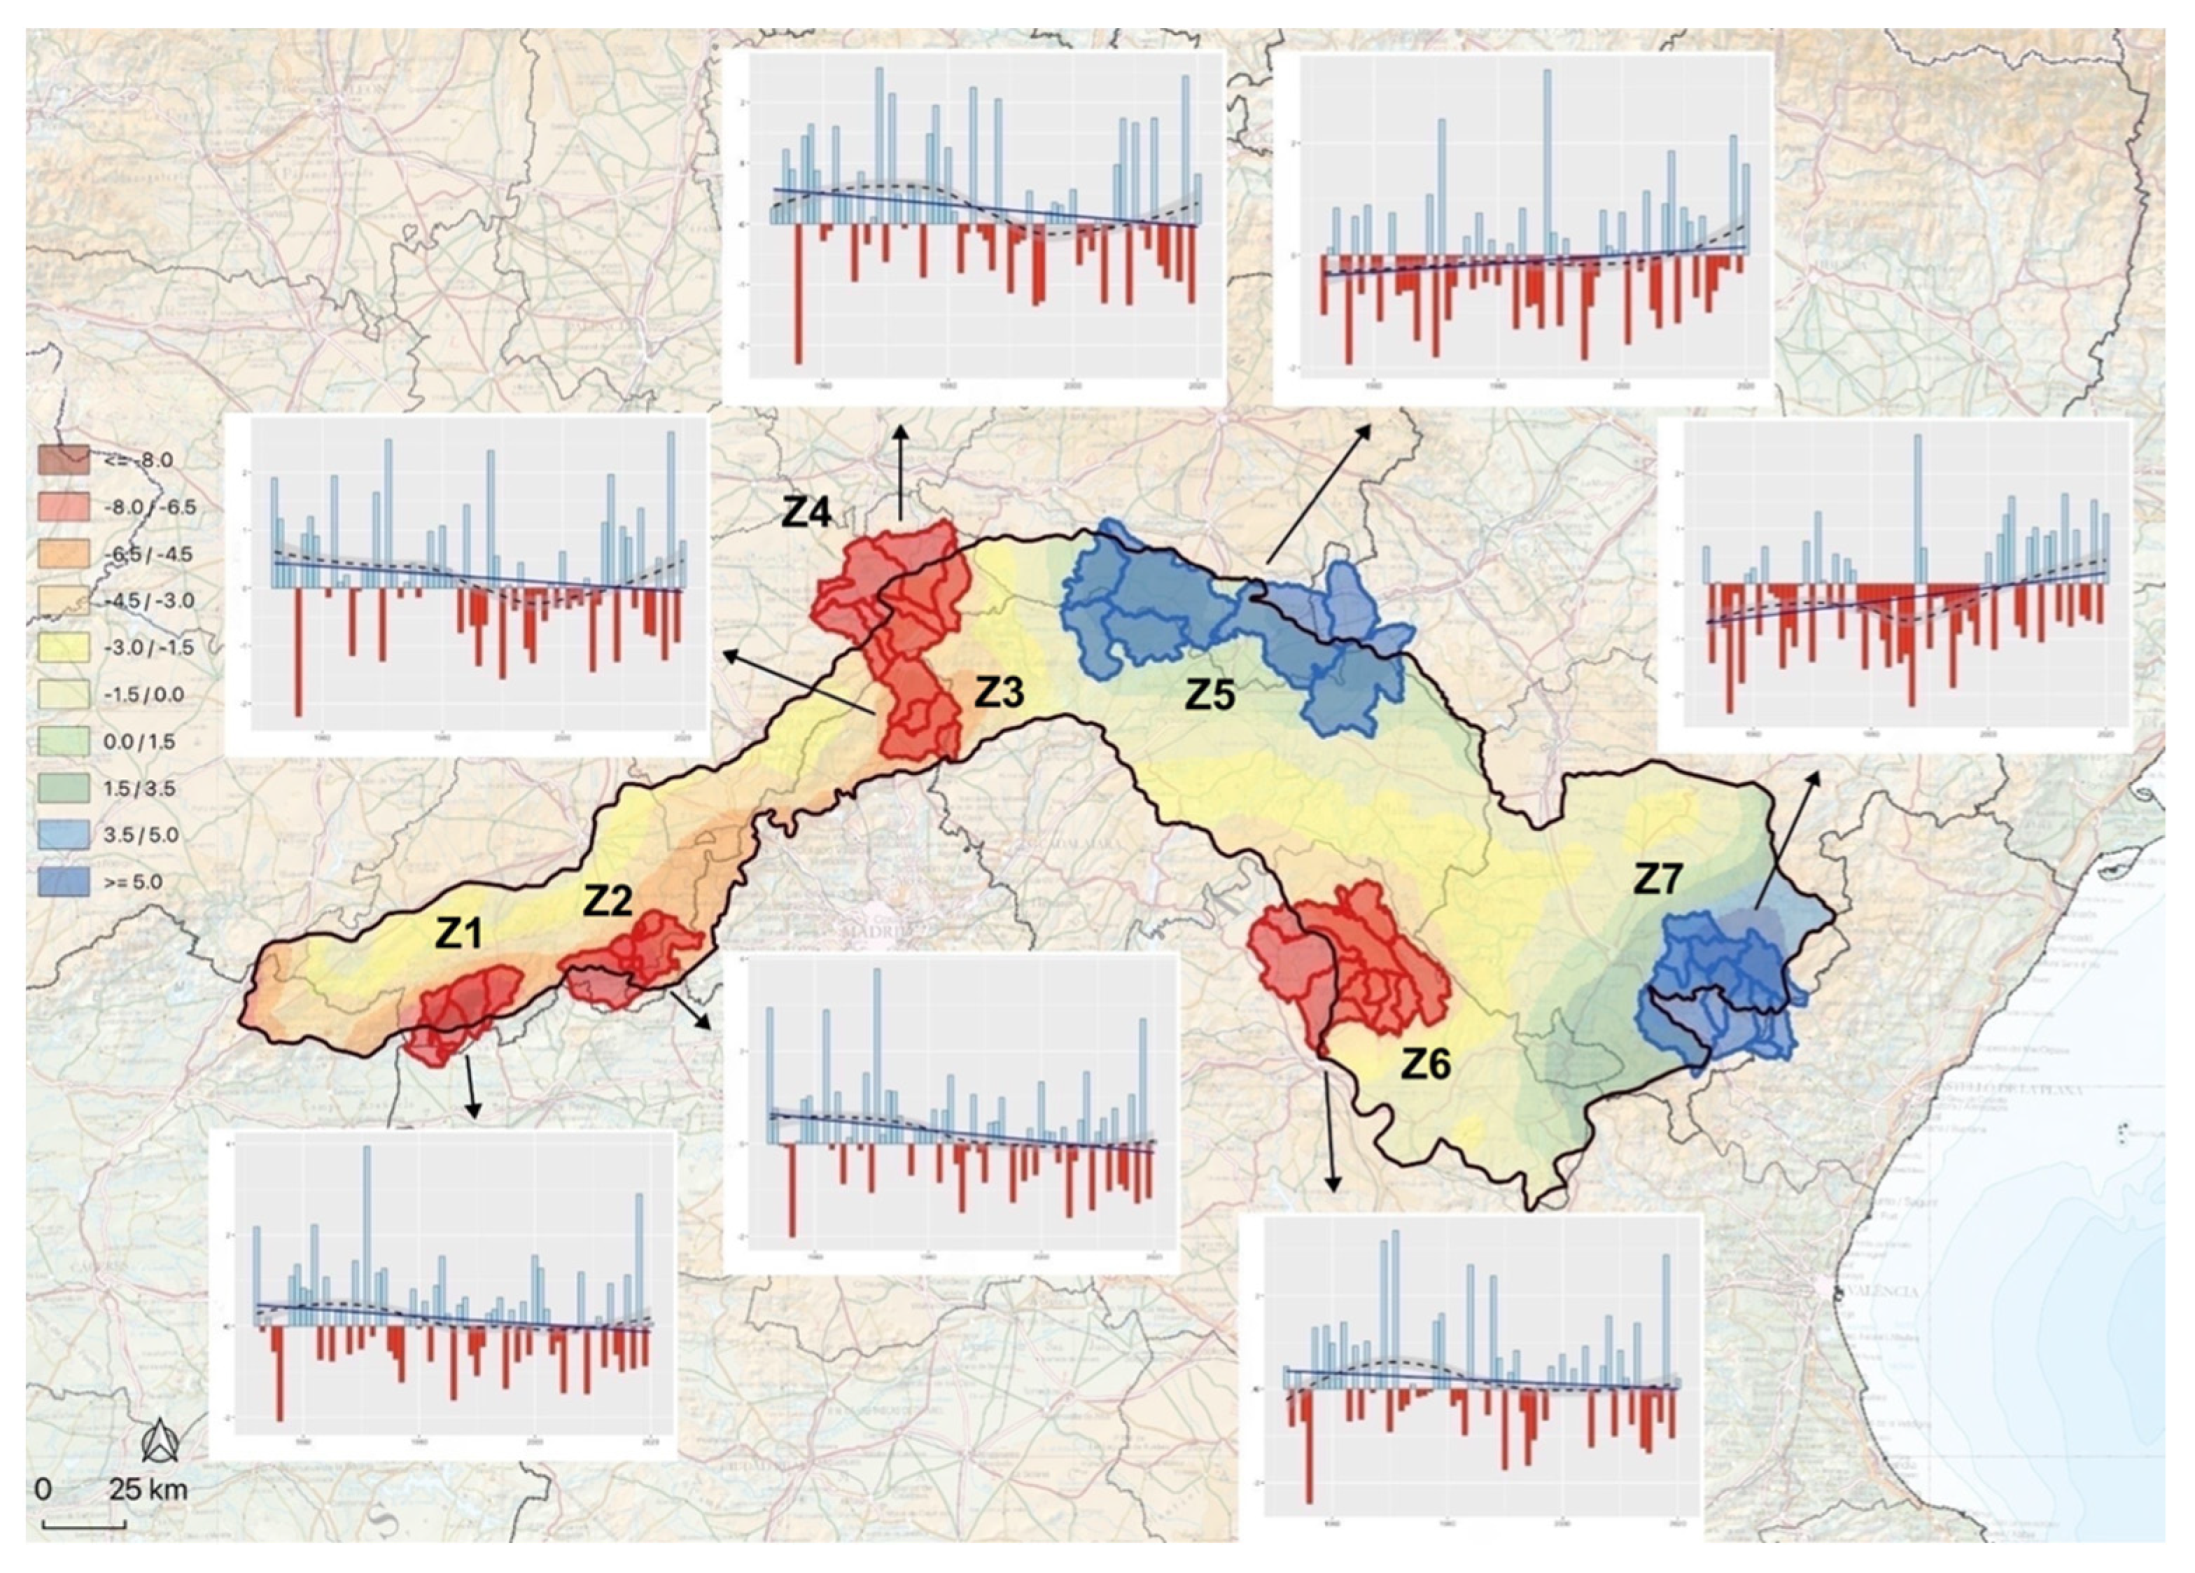
3.3. Zone Types in Accordance with Trend Analysis

According to the time trend in spring and the months of March, April, May and June, seven areas can be classified in terms of their precipitation loss (Z1, Z2, Z3, Z4 and Z6) or gain (Z5 and Z7) in the final decades (Figure 6). Meanwhile, the trend for each of them is shown in twenty-year time windows (Figure 7) and the monthly, spring and annual percentage changes with respect to the total average (Figure 8).
The percentage of convective precipitation during spring in the study area varies from 45% in Z1 and Z6 to no more than 28% in Z5, which is located on the northern slope of the study area There are important monthly differences between the great dependence on large-scale precipitation in March in Z5 (where it accounts for 85.0% of the total) or in Z6, where it is reduced to 68.2%. On the other hand, the month of June is the one with the highest percentage of convective precipitation due to its proximity to the beginning of meteorological summer. Here, values of up to 74% are recorded in Z1, falling to 46.2% in Z5, since storms in this area of the northern plateau are not as important as in the Central System and the Iberian System. In Z1, one of the areas with the greatest decrease in precipitation in recent decades, there is a decrease in the percentage of convective precipitation during spring, although it is especially noticeable in the month of April. In Z2, there is a clear increase in convective precipitation in March. A similar pattern is observed in Z6 and Z7, where convection is more important in June, with an increase of 8 to 10 percentage points between the reference periods 1961–1990 and 1991–2020 (Table 1).
Main areas of precipitation changes identified (Figure 6):
(Z1) Western Gredos. This is the zone with the greatest loss of annual and spring precipitation, especially in the month of March. The reduction in spring precipitation reached −9.24 mm, accounting for up to 18.9% of total spring precipitation in some cases (municipality of Candeleda). In the surroundings of River Pelayos (between Pelayos del Hoyo and Arenas de San Pedro) in spring, values of 367.3 mm for the period of 1952–1981 and 318.2 mm for the period of 1991–2020 are recorded, with total losses of −49.1 mm. The decrease has not been homogeneous, with precipitation maximums being observed in the 1960s and 1970s (382.3 and 370.1 mm). Although there has been a certain recovery in recent decades (values of 9.5 mm), over the past thirty years (1991–2020), the mean value of losses is −4.8 mm.
(Z2) Eastern Gredos. This is the area with the second largest precipitation loss in the area of study, with values reaching −8.0 mm (municipalities of Casillas). Over the past few decades, there has been a loss of up to 19.9% of total accumulated spring rain, with a reduction of −48.3 mm between the periods of 1952–1981 (285.7 mm) and 1991–2020 (237.4 mm) at the source of the Tiétar River. The time evolution of spring rain is very similar to that of Z1, with maximums being observed during the 1950s, 1960s and 1970s (289.8 mm). In recent decades, there has been an almost neutral evolution, even slightly positive. In the time windows from the period of 1989–2008 to the period of 1995–2014, a mean increase of +3.0 mm was reached, with the extremes reaching +6.6 mm (1994–2013).
(Z3) Guadarrama System. This is the area recording the third sharpest reduction, with a mean of −5.8 mm. In the surroundings of the Villar Reservoir, the precipitation loss represents 16.8% of the total spring precipitation, with values that fluctuate between 237.2 mm (1952–1981) and 205.7 mm for the 1991–2020 period (a reduction of −31.5 mm). The evolution over time shows the greatest ten-year accumulated values in the 1950s, 1960s and 1970s with averages of 263 and 244 mm. Starting from the 1980s (1984), a break point emerged, in which the minimum value of the series was calculated in the 1990s (184.1 mm). During the time windows from the 1982–2001 period to the 2001–2020 period, the precipitation increases reached extremes of almost +13 mm (1994–2013).
(Z4) Ayllón–Duratón. The reduction in precipitation is −5.4 mm in the surroundings of the Serrano River, equivalent to 16.5% of the total spring precipitation. The reduction from an average of 226.9 mm (1952–1981) to 194.2 mm (1991–2020) implies a decrease of −32.7 mm. The maximums were recorded in the 1950s and 1970s with a mean of 231.7 mm, with the year 1984 being the break point with a decrease, and the minimum value was reached in the 1990s (177.3 mm). Finally, the last time window (2001–2020) reflects a slight increase of +2 mm.
(Z5) North–West Iberian System. This is the geographical area with the second largest precipitation gains. The precipitation in certain areas of the Sierra de Soriano (source of the River Jalón) reached +2.9 mm, representing an increase of 12.1% with respect to the spring total. This represents a gain of +13.1 mm, with the value increasing from 165.6 mm (1952–1981) to 178.7 mm (1991–2020). Positive data are also recorded for 9.5% of the higher section of the Escalote River to the south-east of the municipality of Almazán. Precipitation maximums (185.6 mm) were recorded in the 2010s, although the increase was not gradual in the final decades. However, the precipitation increases in recent decades are more notable. We can highlight the windows from the 1988–2007 period to the 1994–2013 period with sustained values of +6 mm and at +7 mm in the past 20 years (2001–2020).
(Z6) Alto Tajo–Júcar. This is the fifth precipitation loss zone. The general precipitation trend is −5.3 mm with particularly relevant values in the month of June (−4.4 mm) (Table 2). It is a geographical area that loses 11.1% of the total mean precipitation in spring. In spring, a reduction of −35.7 mm can be observed, fluctuating between 327.5 mm (1952–1981) and 291.8 mm (1991–2020). The maximum precipitations are recorded between the 1960s and 1980s, particularly in the 1960s (356.2 mm). In 1990, there was a break point, which initiated a gradual decrease to minimum ten-year records in the 1990s (255.6 mm). Despite the increase in the 2000s, a reduction in precipitation occurred once again in the decade of the 2010s (292.1 mm). During the final years (1996–2015 to 2001–2020), the precipitation trend was +5 mm.
(Z7) Southeast Iberian System. This zone records the largest precipitation increases. The precipitation increase reached +7.0 mm in the surroundings of Valdelinares (22.4% with respect to the spring average), with values of +31.3 mm between 207.9 mm (1952–1981) and 239.2 mm (1991–2020). The zone is characterised by a precipitation evolution divided into two distinctly differentiated time phases: the 1950s recorded a mean precipitation value of 184.2 mm, and in the 2010s, the maximum precipitation of the series was recorded to be 259.3 mm. The final 20-year time windows recorded a noteworthy increase in precipitation (1978–1997 period to 2001–2020 period), with extremes of up to +17 mm in the 1985–2004 and 1994–2013 periods.
The precipitation changes occurring on monthly and seasonal scales generated changes in the spring total with respect to the annual total in the final decades of the period. In spring, decreases of between −20 and −30% were recorded on the southern face of the Sierra de Gredos (east and west) (Figure 8). In general, decreases of −10% can be observed on the majority of the southern slopes of the Sierra de Gredos and Navacerrada/Guadarrama, and also the Alto Tajo-Júcar. Meanwhile, the specific weight of spring rain is greater in the most easterly sector of the area of study, particularly in the Sierra de Gúdar/Javalambre, with maximum increases of 20/30% in the surroundings of Alcalá de la Sierra–Valdelinares. On an annual scale, the geographical distribution of the gains and losses is similar to that recorded in spring, with decreases of −30/−40% on the southern face of the Sierra de Gredos (east).
The time trend analysis conducted using 20-year time windows shows a common pattern in the geographical areas in the majority of geographical spaces, with a clear reduction in precipitation between the periods of 1955–1985 and 1970–2000, with maximum reductions of up to −10 mm/decade (Figure 7). Precipitation increases were only recorded in Z7 (point 7897) in the final decades of the period, specifically between the 1965–1995 and 1990–2020 periods (with maximum increases of 15 mm/decade).

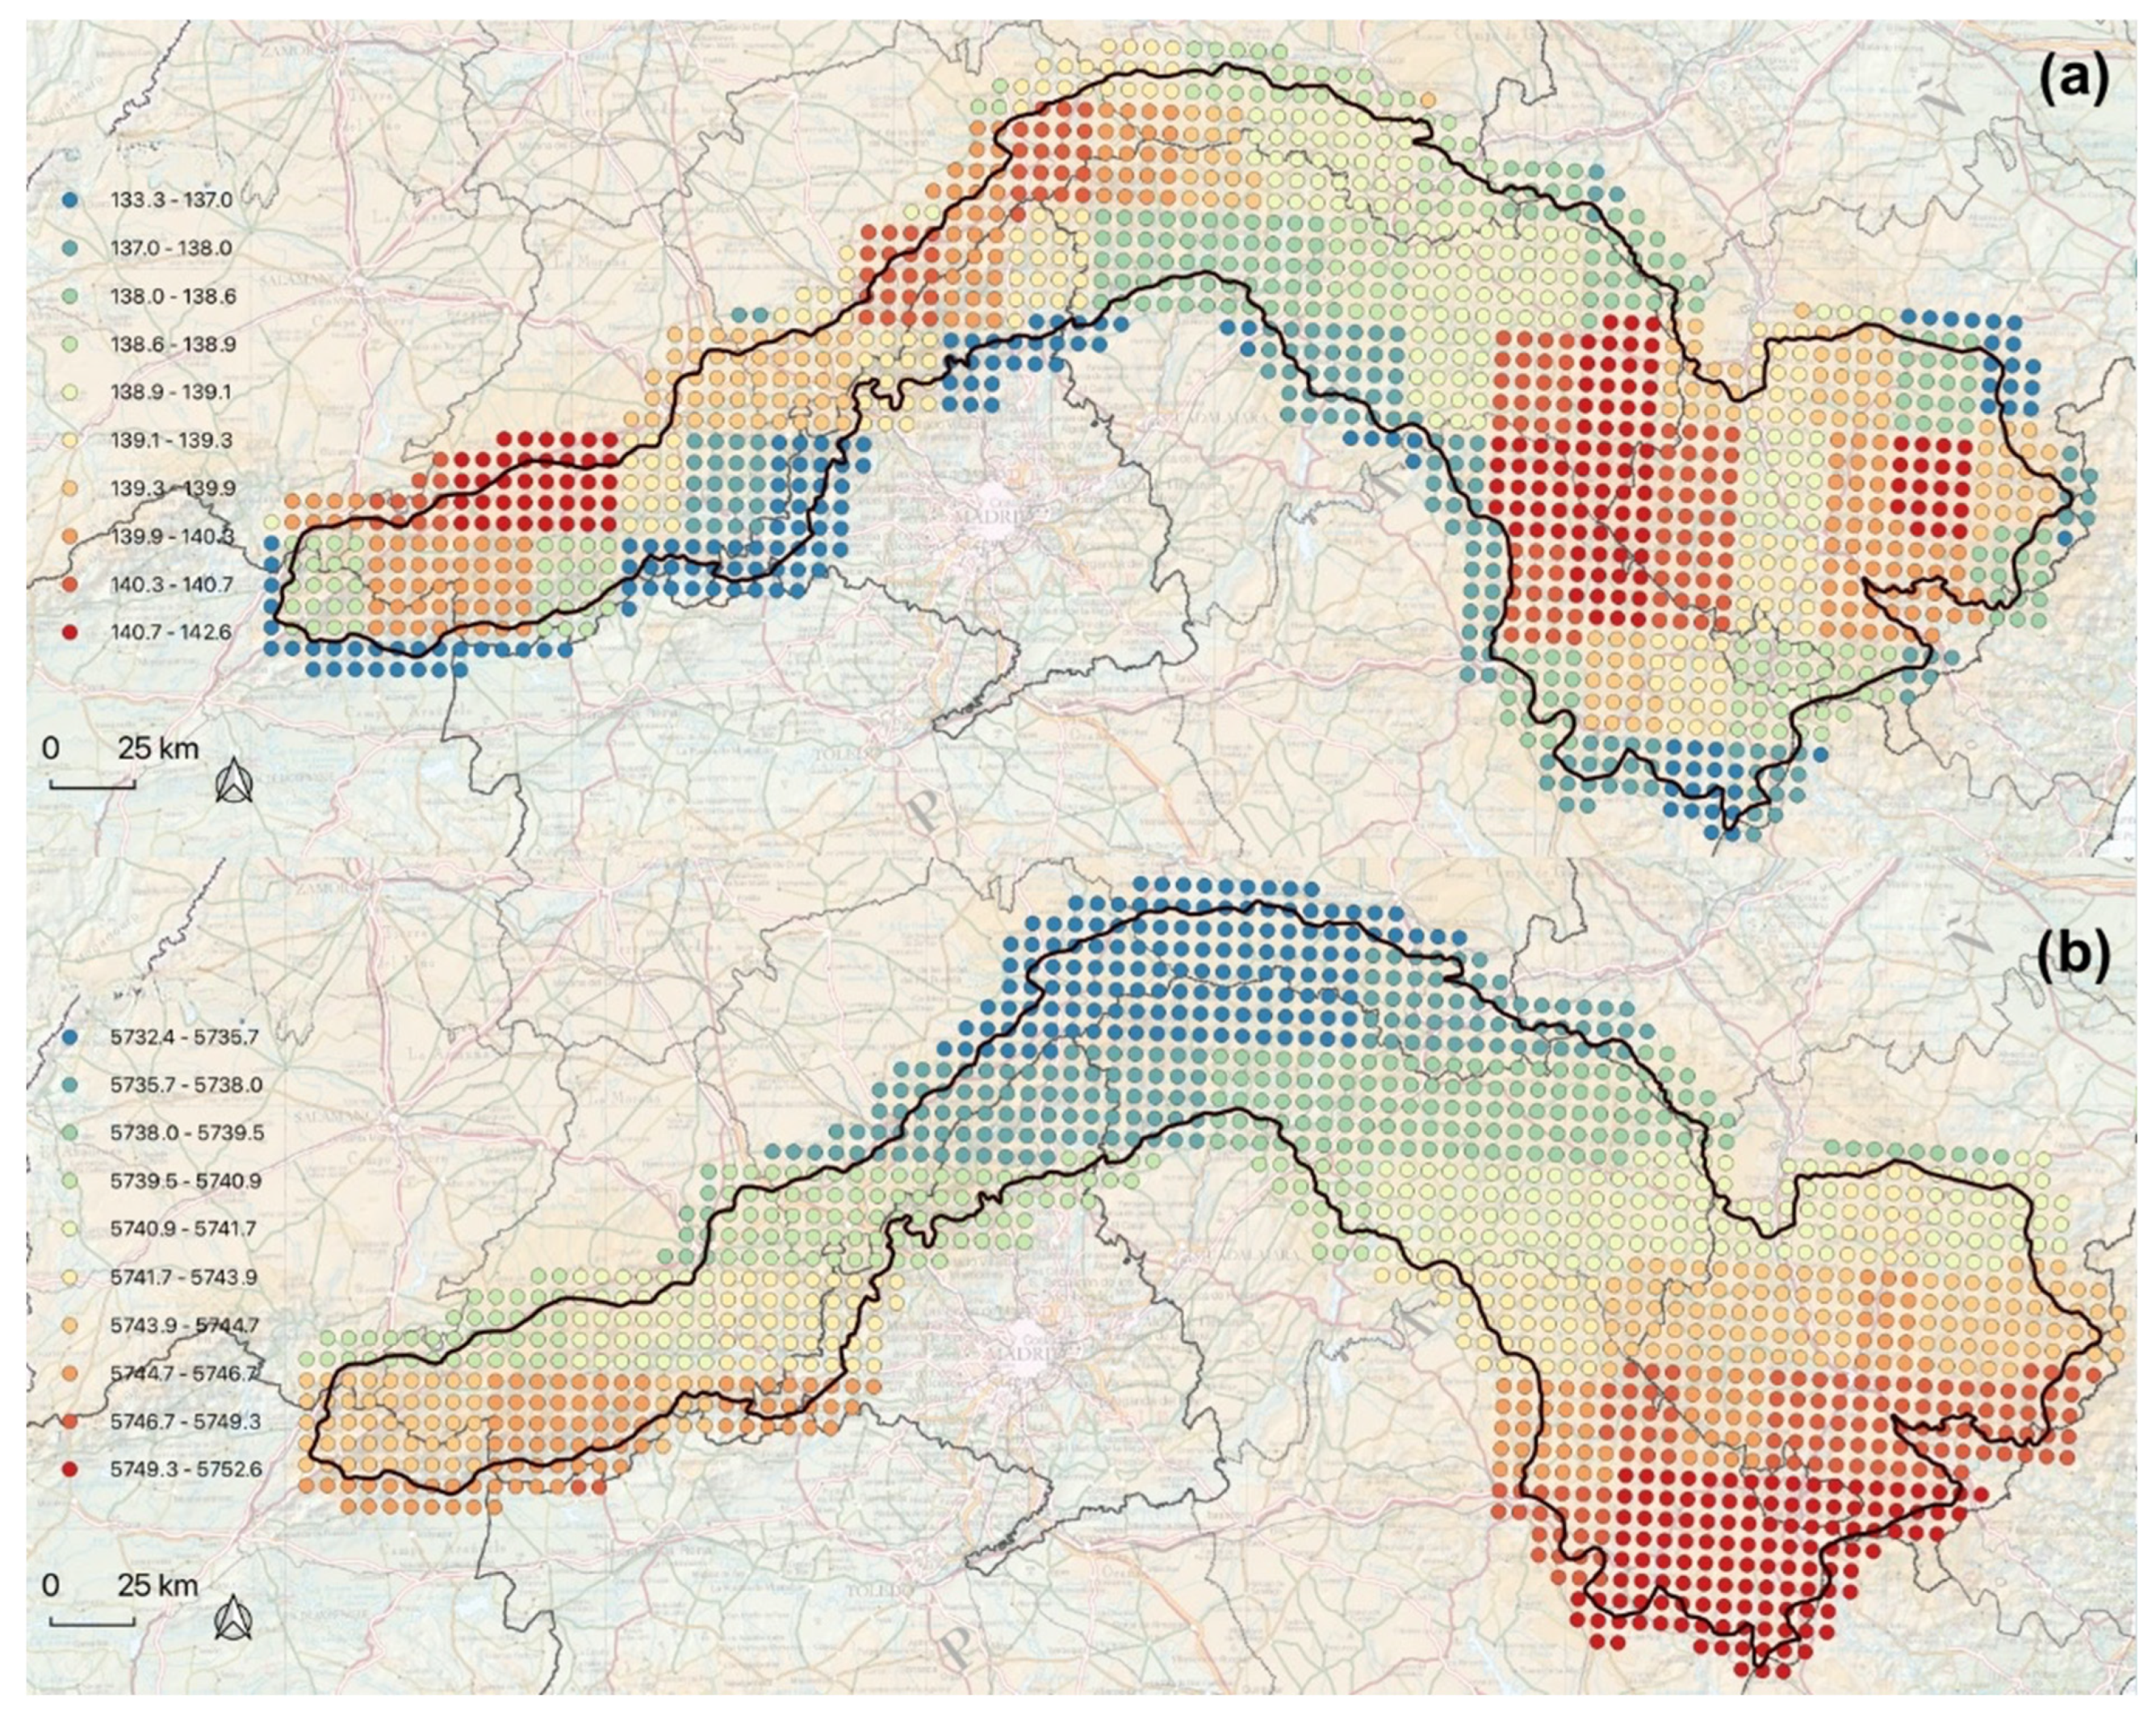
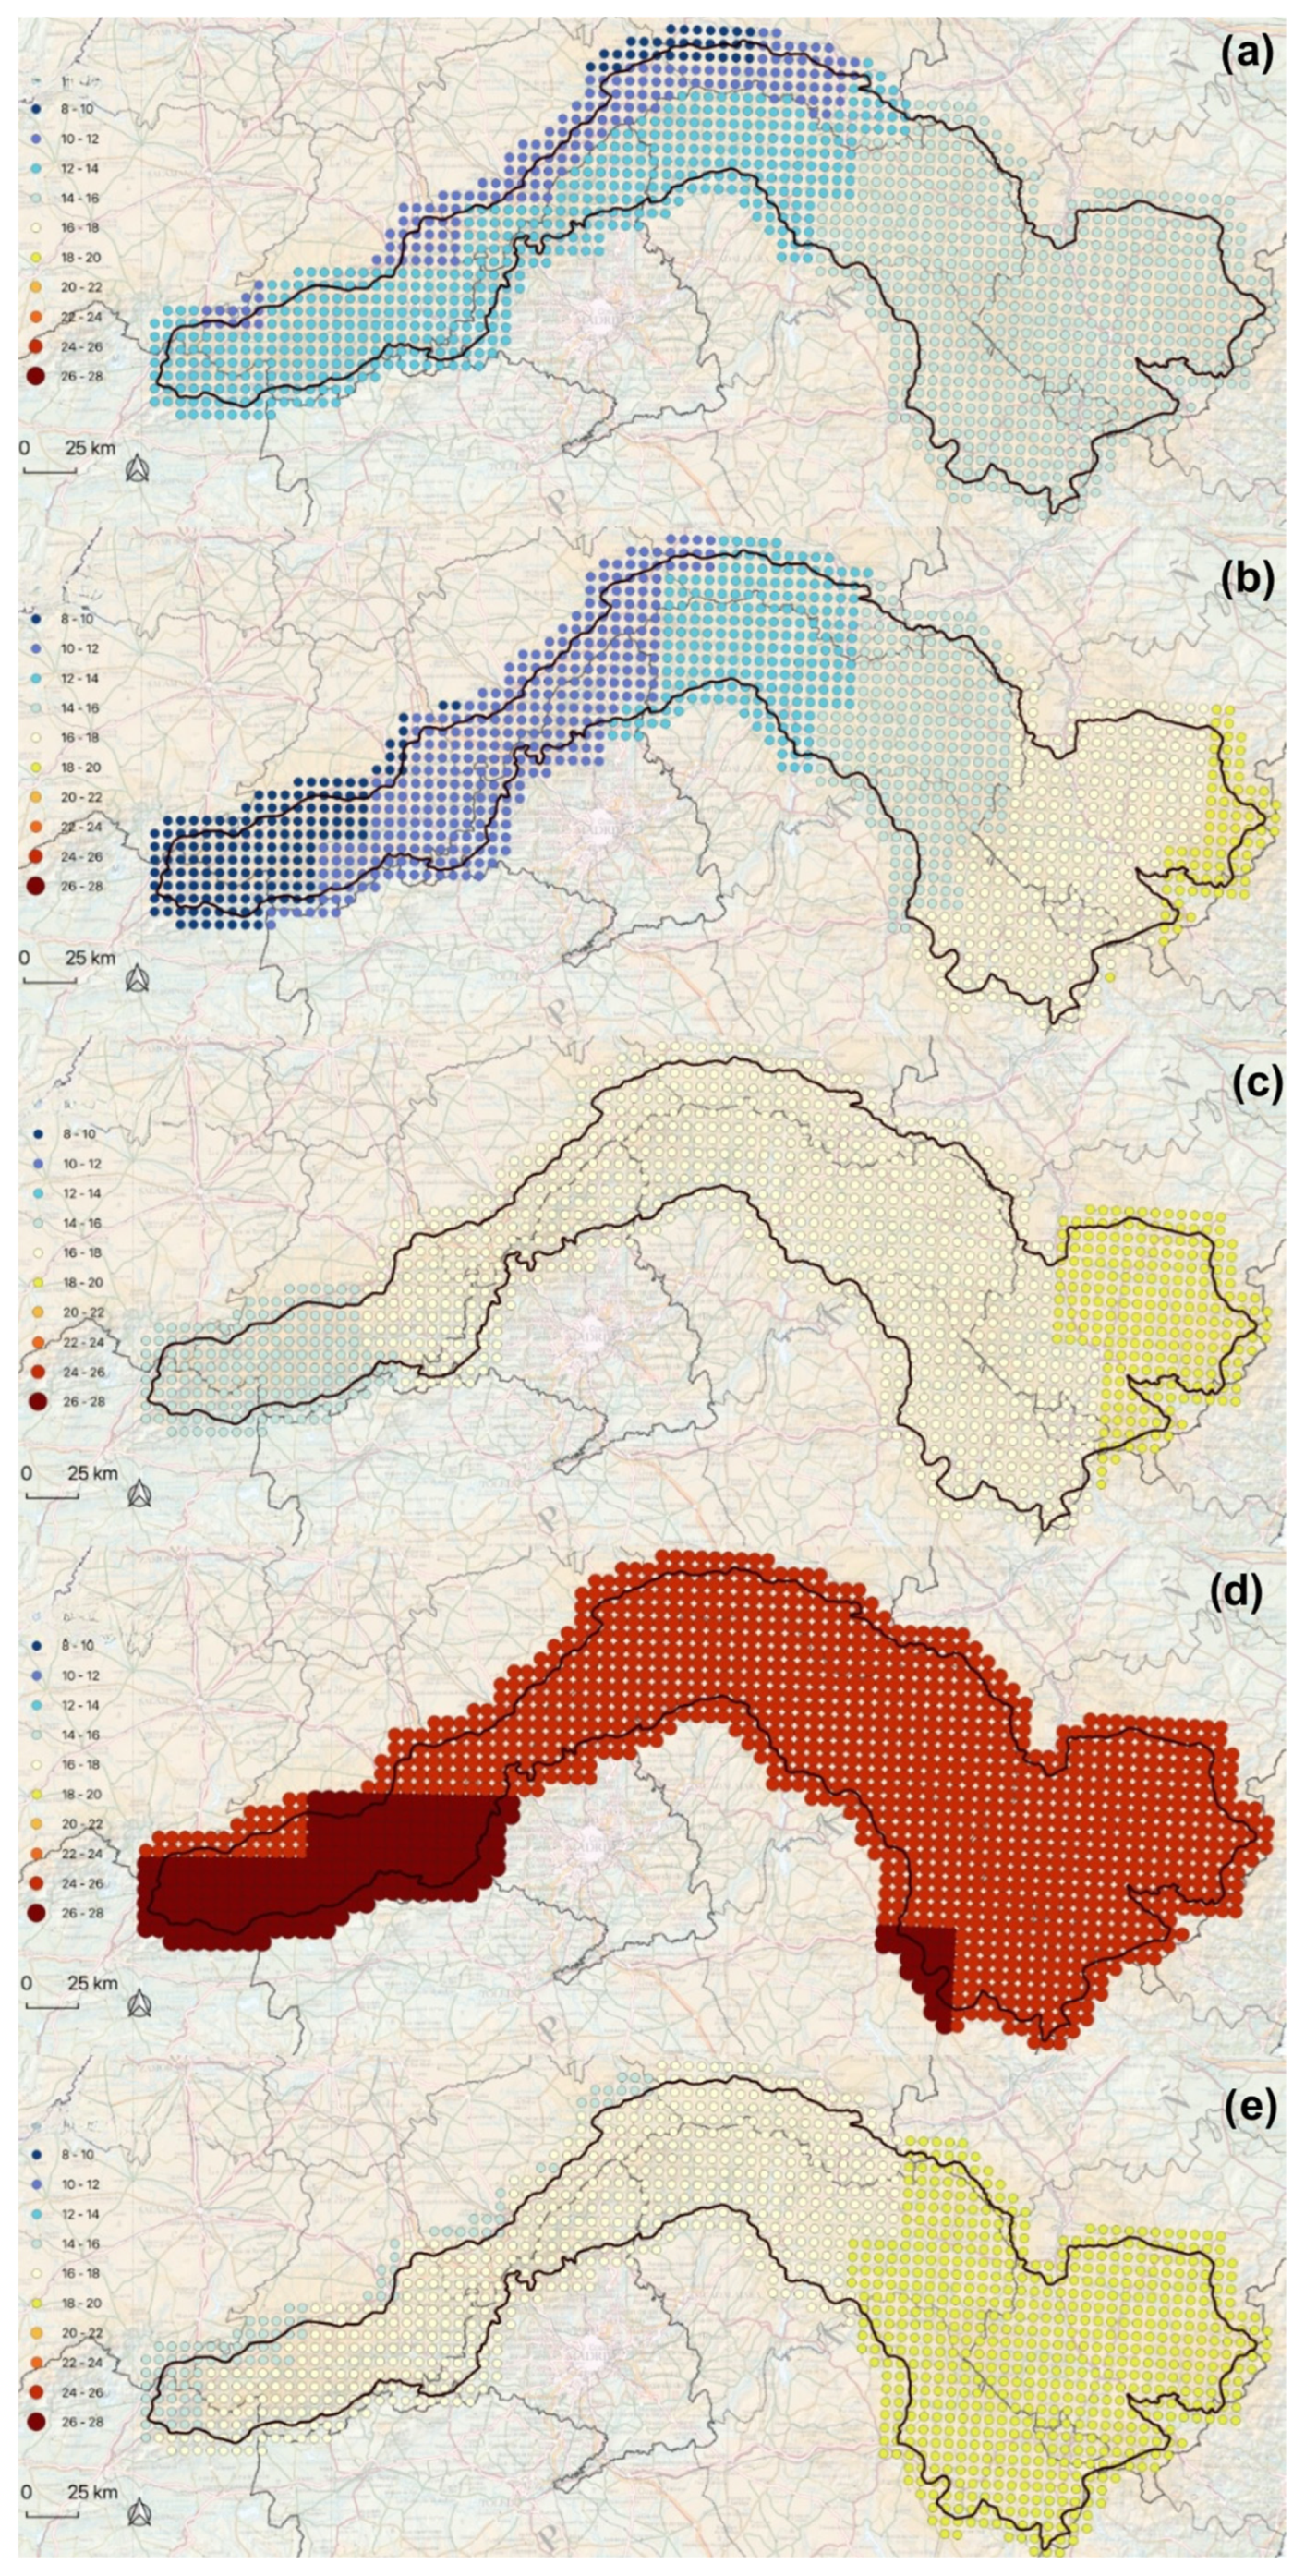
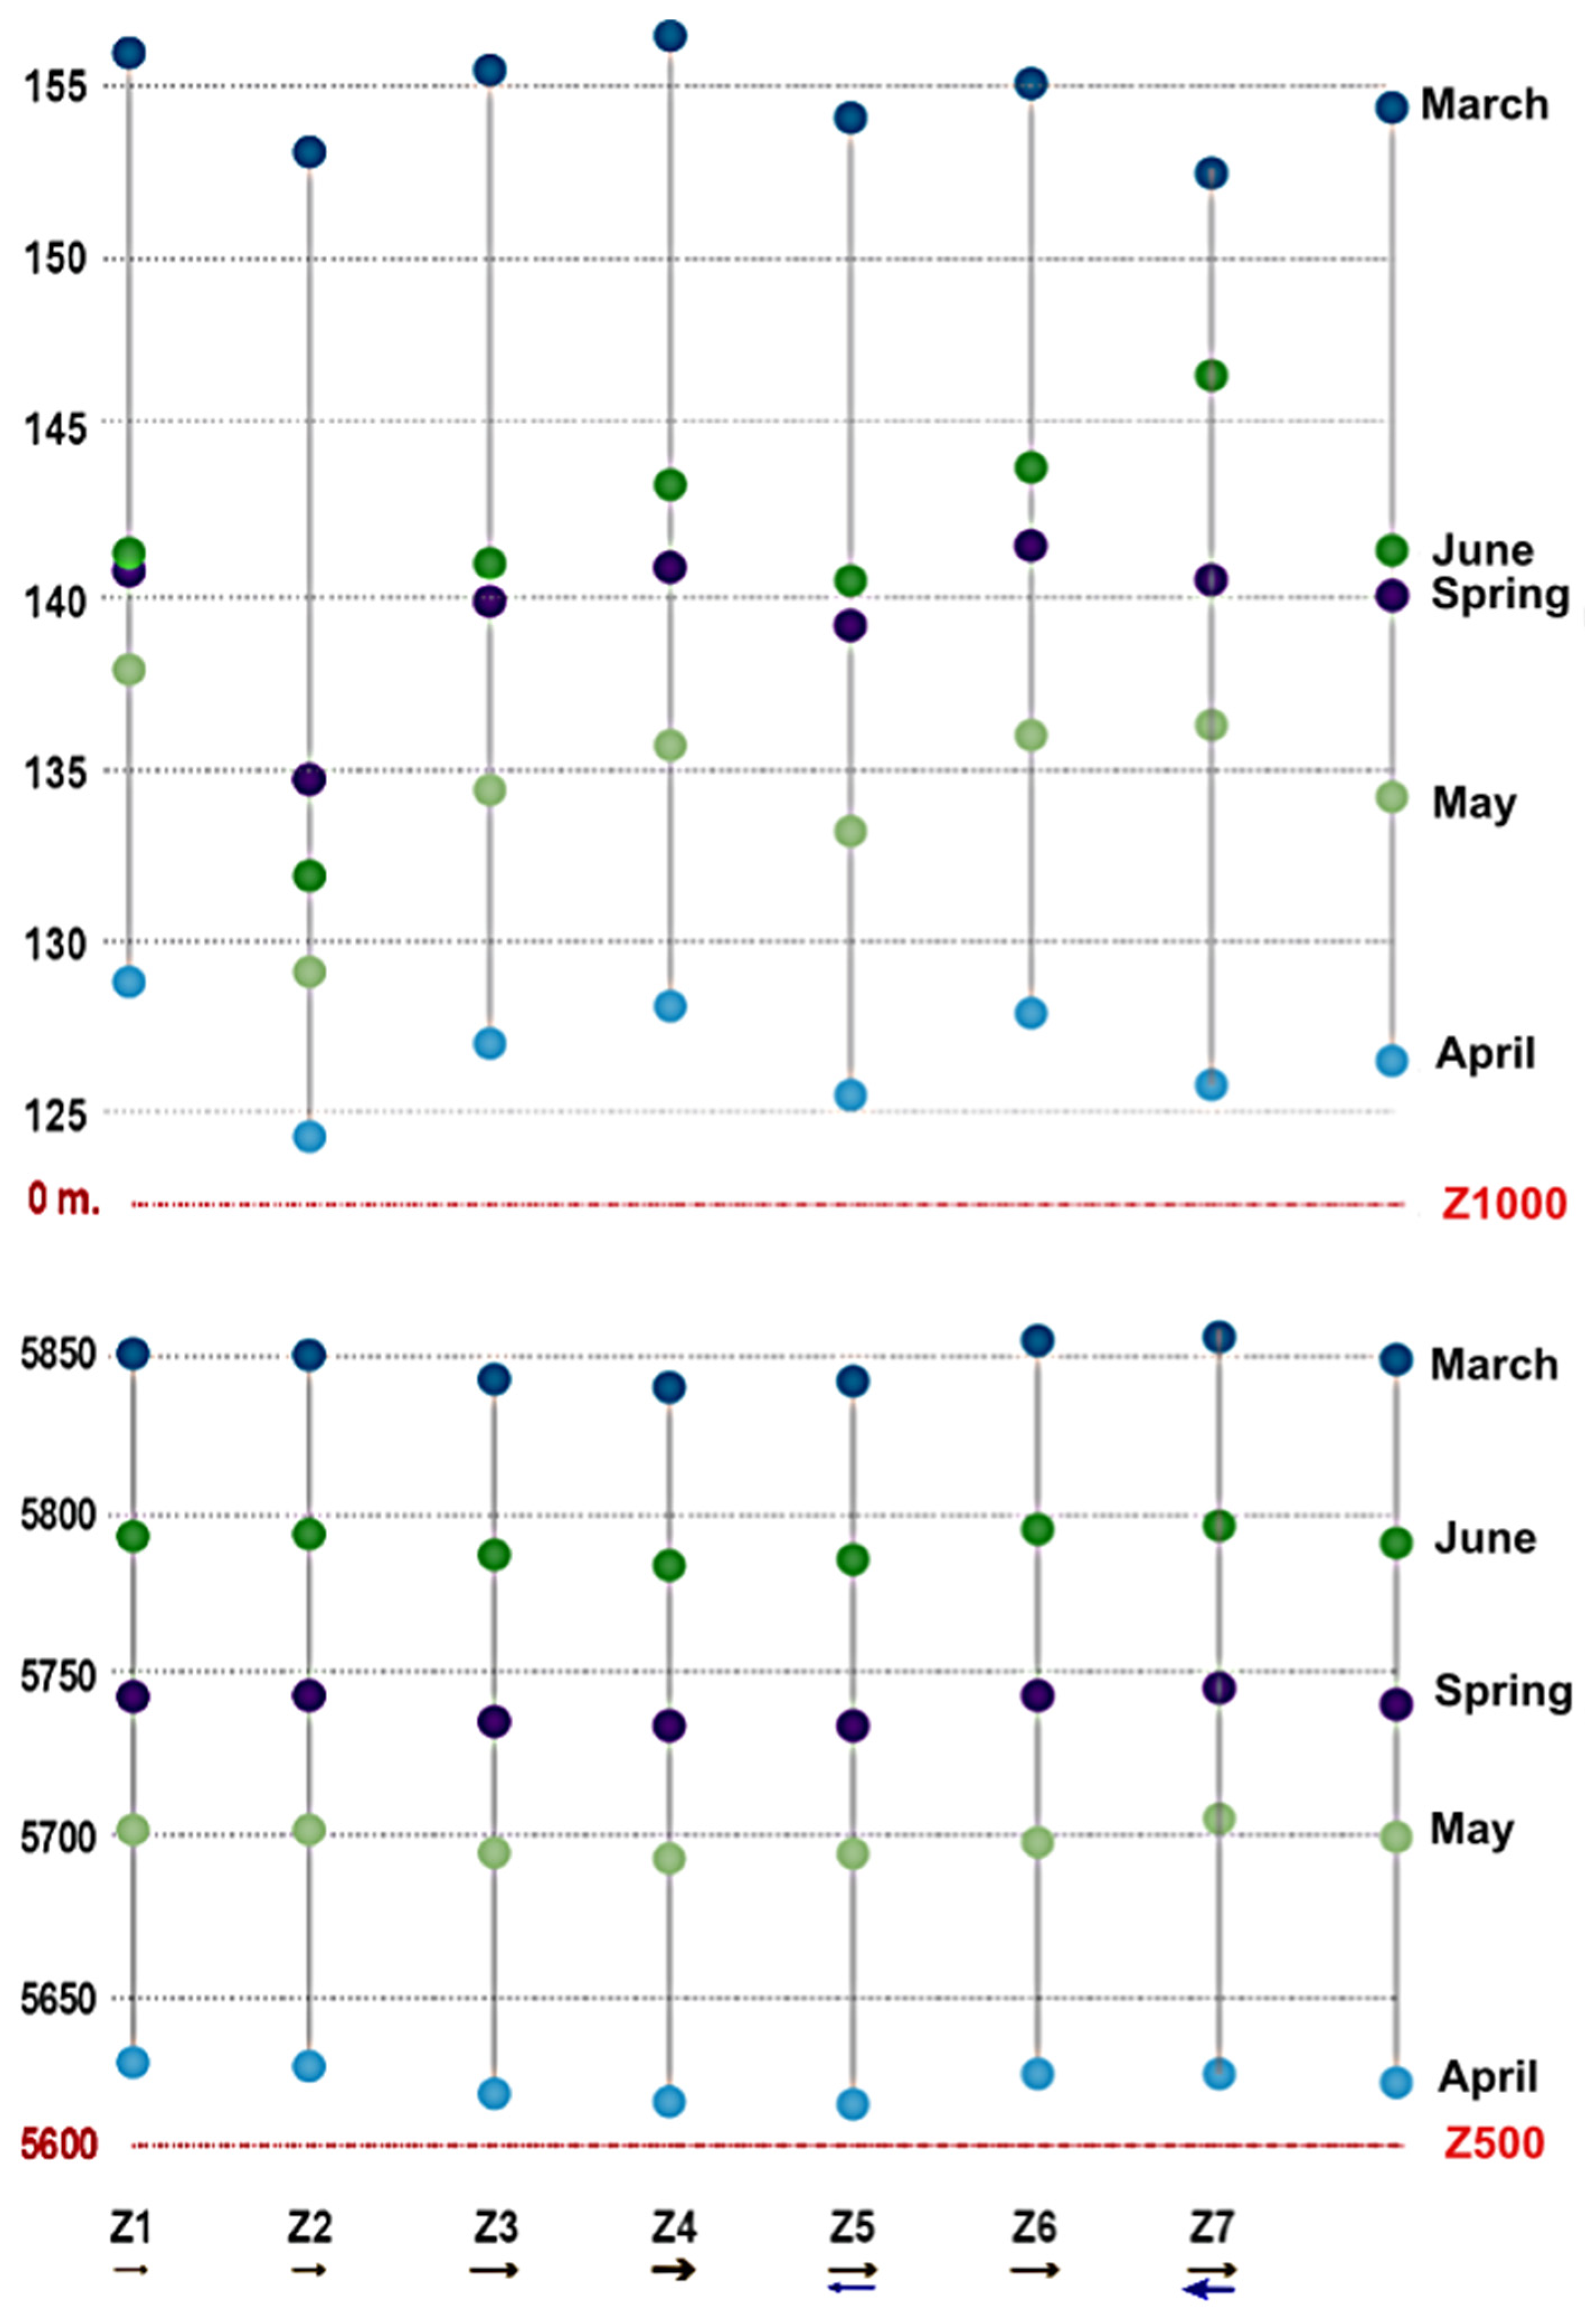
3.4. Geopotential Patterns and Precipitation Trends

The geopotential fields at a height of 500 hPa (Z500) and 1000 hPa (Z1000) were analysed in order to estimate the behaviour of the mid and lower layers of the atmosphere and their relationship with precipitation. The situations of greatest stability are recorded in March (Z500, 5849.1 m and Z1000, 154.2 m), and April is a month that reduces the benchmark (Z500, 5625 m; Z1000, 126.4 m) (Figure 9). On the other hand, between May and June, the pressure fields increase, reaching 5792.8 m (Z500) and 141.3 m (Z1000) (Table 3).
In spring, the lowest values for Z1000 (between 133 and 137 m) are recorded for the southern face of the Central System and southern and north-eastern parts of the Iberian System (Figure 9). These values are higher (141 to 143 m) in the central sector of the Iberian System and the northern face of the Sierra de Gredos and Guadarrama. For Z500, there is a clear gradation with lower altitude values in the whole of the northern area (5732 to 5736 m), while in the places in the southern part, the values are higher (5749 to 5753 m).
In the month of March, the coefficient of the precipitation–pressure fields correlation is very high in Z1000. This relationship is particularly relevant in the western and central areas of the Central System and western Iberian System, with a correlation coefficient of −0.86 in Z1. Only in Z7, there is no relationship with the geopotential field of 1000 hPa. The distinct reduction in precipitation in March is closely related to the increase (statistically significant) in Z1000 (between +3.7 and +4.6 m). During the entire period of analysis (1952–2020), the geopotential height at 1000 hPa reaches +27.6 m. In general, the increasing trend is homogeneous in the whole area of study (Figure 10 and Figure 11). This evolution is similar to the precipitation with maximums in the 1950s and 1960s and minimums in the 1990s.
The slight increase in precipitation in April is not related to the two geopotential fields, although it is somewhat higher in Z5 at Z500. The slight decrease in the geopotential height of 1000 hPa during the month of April (−0.3 to −1.6 m) could explain the neutral or slightly positive trend from a precipitation point of view. The higher rates of reduction are located in the southern sector of the Iberian System (Figure 10 and Figure 11).
In Z6, the month of May records a high correlation coefficient for Z500 (−0.74). The precipitation in this month reduces the most in Z6, particularly in recent years. In the same way, the time trend of Z500 in the Alto Tajo increases from +4.6 to +6.9 m, being particularly relevant in the final years of the period of study (absolute increase of +41.4 m) and in the most easterly sector of the area of study. Therefore, the average increased from 5560 m in the 1980s to 5710 m in the 2010s. On the other hand, the correlation coefficients with Z1000 are greater in Z3 and Z6.
No noteworthy correlation coefficient is observed in June with the pressure field Z1000. However, the coefficients are higher in Z500 in the whole area of study, except in Z7 (eastern Iberian System). The region Z1 (western slopes of Gredos) obtains the highest value of −0.79. In the final decades of the period of study, a highly significant decrease in precipitation is recorded in June, associated with the altitude increase (statistically significant from Z1 to Z5) of Z500 in the final decades (+3.1 to +3.7 m). Z1 experienced a gradual increase between the 1980s (5760 m), which coincides with the precipitation maximum, and the 2010s (5790 m), which coincides with the precipitation minimum.
In spring, the correlation coefficients are lower, particularly in the geopotential field of Z500 (Table 4). Only the geographical area of Z6 obtains a coefficient of −0.51. It should also be noted that the time trend of Z500 in spring stands between +6.0 and +7.5 m, so the altitude increase in absolute terms reaches +48.3 m and is particularly relevant between the 1970s and the 2010s. Meanwhile, the correlation coefficient of Z1000 with the precipitation evolution reaches the highest values in Z3 (−0.65) (Table 5).
The pressure reading in Z500 reflects an overall mesoscale stability for the area of study in spring with reference quotas much higher than 5600 metres. The high pressures are dominant in all of the months analysed, with higher values in March (5800 m) and minimums close to the optimum geopotential limit in April. The values recorded in May are below the average for spring but far from the levels considered as being low pressure (5700 m). On the other hand, the readings in Z1000 should be made considering the orography, the continentality and the seasonal temperature of the Mediterranean. On this level, variability is the dominant theme, except in April and March, where the homogeneity coincides with that existing in Z500 and is apparently conditioned by the mesoscale situations. However, the reading on the surface is only possible to understand on a zone level and when analysing its variability. Z2 displays a more defined behaviour, with its values concentrated below 130 metres in June, May and April.
The instability gains intensity in May with heterogeneous readings, always below the spring mean, which fluctuates around 135 metres and has extremes in Z1 and Z7, although it maintains the trend of a gradual increase in the proximity to the Iberian System. This west–east increase is more pronounced in June, although secondary peaks are observed in Z4, associated with local exchanges but with a marked reduction towards the west. It is interesting to observe how two of the sectors with the greatest continentality are almost the same (Z3 and Z5). The analysis of the correlations with precipitation generates disparate results, and it would be necessary to introduce new variables such as the orography or temperatures and humidity content of the air masses. In Z500, there is a direct correlation with the loss of precipitation. This relationship is particularly significant in the months of May and June, with a slight correlation for the south-east of the Iberian System in March, which increases in April. This is possible if we associate it with an earlier warming of the Mediterranean, and the orography is able to create early mesoscale situations on a regional scale. In Z1000, almost irrelevant values are recorded for the month of June. However, in the spring variances, the lowest values are recorded in the south-east of the Iberian System with severe penalties in the most continental sectors (Sierra de Guadarrama) (Figure 12).

4. Discussion and Conclusions

In a global study, Deitch et al. (2017) analysed all Mediterranean territories worldwide, showing that the annual precipitation trends (1975–2015) are reduced in a statistically significant way (0.10) in the central sector of the study area (Central System), while no significant temporal trends were observed between the end of fall winter and mid-spring (FWS) [45]. The study carried out by Caloeiro et al. (2018) on seasonal precipitation trends on the European continent shows negative trends in 18.2% of the European territory, including most of Spain and the study area of this article [46]. At a monthly level, the reductions in the western sector of the Central System (6–8 mm/decade) stand out, with few variations in April and May, and with negative trends (2–4 mm/decade) in the month of June. These results are therefore similar to those provided in our study. Finally, the easternmost sector of the Iberian System shows few variations or slight increases in precipitation during all the months of analysis.
Benetó and Khodayar (2023) highlight the dichotomy of the temporal trend of precipitation in the Iberian System, with decreases on the Atlantic slope and increases on the Mediterranean, both annually and in spring (1951–2020).
More than a decade ago, Acero et al. (2012) indicated that in spring, almost all of the geographical areas of the Iberian Peninsula displayed negative precipitation trends, only altered with increasing trends in the north-east part of the peninsula [47]. Serrano et al. (1999) affirm that there was an increase in the days of precipitation on the Mediterranean side of the peninsula in the period of 1950–2012 with decreases in certain geographical areas of the Central System [48]. Estrela et al. (2024) demonstrated significant precipitation decreases in the sub-Betic mountain sector of the Iberian Peninsula, where the hydraulic territory of the Guadalquivir, Guadiana, Segura and Júcar basins converge, for a series of the 1952–2021 period, being notable in the period of 1987–2021, with reductions between 1 and 3 mm/year [49]. This is a mountainous area that can be considered complementary, by the southern sector, to the area of the present study. In their analysis of precipitation trends in the Iberian Peninsula, Liu et al. (2022), when comparing the summer period of 1980–1997, showed that the central sector (Central System) and the eastern peninsula (eastern Pyrenees, Iberian S., Betic S. and Coastal–Catalan mountains) recorded between 1.7 and 1.1 mm less precipitation per month during the 1998–2019 period compared to the previous period, which represents 26% and 17% reductions in the supply of the main sources of water originating in the mountains of the centre and east of the Iberian Peninsula [50].
With respect to the total spring precipitation, the pattern is very similar. These authors identify statistically significant precipitation increases in the inter-provincial node of Teruel–Castellón–Valencia and decreases in Alto Júcar (the provincial border between Guadalajara and Teruel) and (statistically significant) precipitation reductions that are even more noteworthy in the central and southern slopes of the Sierra de Gredos. Additionally, González-Hidalgo et al. (2023) observe a reduction in the area subject to winter and spring precipitation in the Iberian Peninsula during the period of 1916–2015 [51]. The authors attribute this mainly to the reduction in spring precipitation. Negative trends were detected in two principal time waves corresponding to the first and last thirds of the twentieth century. However, the past three decades hardly exhibit significant changes. As we can see in the results of the current research, González Hidalgo et al. (2023) conclude that there is a major west–east gradient between the reduction in the western-most sector of the Central Sample and the increase in spring precipitation in the sector of the Iberian System, with a greater connection with the Mediterranean [18]. The research was also conducted during the period of maximum precipitation reduction in the overall area, from 1968 to 1997.
In a monthly trend analysis, Serrano (2017) provides similar data to those obtained in this study [51]. March is the month with the greatest precipitation loss in absolute terms in the majority of the Central System, except for the most easterly face of the Iberian System (Gúdar–Javalambre). The months of April and May hardly experience statistically significant changes (except for precipitation increases in April in the eastern most part of the Iberian System), and, again, a large reduction in total precipitation can be observed for the whole month of June in practically the entire area of study. Senent-Aparicio et al. (2023) indicate that March and June exhibit the highest percentage of points with significant negative trends of 27% and 65%, respectively [10]. Previous studies carried out in Spain [48,52,53,54] reveal similar trends in March, June and October. Some authors attribute this reduction to the displacement of storms towards the north or to a positive trend in the duration of sunshine and anticyclonic activity [55,56]. The large reduction in precipitation in June is consistent with recent studies conducted for the city of Barcelona and for Catalonia [57]. In a recent study, González-Hidalgo et al. (2024) indicate that the spring month with the greatest precipitation losses is March, together with June, which both show statistically significant decreases in the 1958–2017 and 1961–2020 periods, respectively [58]. The results of this study regarding one of the most complex sectors (south-east of the Iberian System) coincide with those obtained by Miró et al. (2023), who determined in their analysis of precipitation and drought trends in the area of study (1952–2021) that there is a reduction of 20 mm/decade in the Alto Tajo–Júcar and an increase of 20 mm/decade in the sierras of Gúdar–Javalambre [20].
The effects of changes in precipitation in the study area are manifested in changes in the macrobioclimates of the central and eastern sectors of the Iberian Peninsula. Lorente et al. (2024) show that the Mediterranean macrobioclimate advances from the east to the west of the peninsula compared to the temperate macrobioclimate in relation to the changes recorded since 1950 regarding temperatures and precipitation [59]. The most significant changes occurred in the following areas: the northwest of the Iberian Peninsula, the Cantabrian Mountains (especially on its southern slope), the Pyrenees (especially in its eastern sector and in the transition zones towards the Ebro valley), the Iberian System (where numerous change points are detected, especially in its north-eastern sector) and the Central System (with scattered but significant changes throughout the entire mountain range) [59].
Benetó and Khodayar (2023) highlight the dichotomy of the temporal trend of precipitation in the Iberian System, with decreases on the Atlantic slope and increases on the Mediterranean, both annually and in spring (1951–2020) [60]. Furthermore, de la Vara et al. (2024) conclude that there will be an increase of between 2 and 4 days of extreme precipitation in the eastern interior of the Iberian Peninsula (Iberian System), but the changes are barely significant in the central peninsula. This highlights the hydrological implications for future water policies in Spain [61].
Mezger et al. (2022) analysed the relationship between precipitation and hydrology (surface runoff) in the central-southern sector of the Central System in some of the sub-basins analysed in the current work (Henares River, Alberche River, etc.). They concluded that between 1950 and 2010, there was a decrease of between 11 and 16% in the total precipitation, with a direct impact on runoff (decreases of up to 47.4% in the Jarama River and 35.1% in the Alberche River) [62].
A statistical analysis in the Jucar Basin detected a change in NAO’s seasonal pattern, meaning there is a considerable reduction in winter rainfalls in the upper river basins located in the inland zone, which is also the water collection and reservoir area (40% of water resource availability since 1980) [63].
CMIP6 data support the Intergovernmental Panel on Climate Change’s Sixth Assessment Report. Several analyses have been carried out in the Iberian Peninsula, most notably that of Alvarez et al. (2024), which suggests that in spring, a general decline in the occurrence of these events is anticipated throughout the century, accompanied with a reduction in the area affected by them. Finally, Tarín-Carrasco et al. (2024) conclude that there will be an approximately 30% reduction in spring rainfall in the central Iberian Peninsula between 2050 and 2079. Furthermore, all CMIP6 aggregate models agree with the 8.5 scenario [64,65].
This study highlights the potential implications of changes in precipitation for agriculture, water supply, and land use in the study area, which could have a significant impact on policymaking in the coming years. This is undoubtedly a key aspect to address in future research.
This study allowed us to obtain a series of conclusions that define the amount and spring patterns of precipitation and pressure and their relationship with mesoscale patterns and local factors that influence their behaviour (Table 6).
The most marked downward precipitation trends are associated with the Atlantic precipitation type (cyclonic fronts), specifically in the westernmost sectors of the study area (Z1 and Z2), but also in Z6 (the Atlantic slope of the Iberian System with a clear Atlantic exposure). Z5, and especially Z7, are influenced by the Mediterranean precipitation type as they are exposed to a greater easterly flow.
Among the authors’ objectives is the possibility of presenting future lines of research with the introduction of new variables, such as orography, temperature, etc.
  • A general irregularity can be observed in the spring precipitation trends with overall losses at the beginning of spring and an alternation in losses and gains in the months of April and May.
  • There is an overall loss in accumulated amounts in the sectors with a marked continentality (Z1, Z2, Z3 and Z4) due to a dependence on a greater or lesser depth of the Atlantic fronts.
  • There are gains in the accumulated amounts in the more eastern areas, where the combination of relief and the proximity to the Mediterranean constitute climate-regulating elements, leading to discreet (Z5) and moderate (Z6 and Z7) precipitation increases.
  • In general, new patterns of precipitation behaviour are observed with shorter springs with irregular precipitation patterns.
  • There is a dominance of overall high pressures (Z500) for a large part of the astronomical spring.
  • An alteration is observed in the frequency and continuity of mesoscale situations related to general circulation from the west and a dependence, particularly in the eastern sector, on new reactivation mechanisms on local and regional scales.
This approach to the study of the reduction in spring precipitation in the central-eastern sector of the Iberian peninsula will be completed with subsequent research with broader areas of study (e.g., the Sub-Baetic sector of the heads of the rivers Guadalquivir and Segura), with the inclusion of new variables and a more detailed analysis of the local factors that influence the amount of accumulated precipitation in spring.

Author Contributions

D.E.-S.: Supervision, Methodology, Visualisation, Paper Writing, and Paper Revision. F.A.-Á.: Supervision, Data Curation, Methodology, Visualisation, Paper Writing, and Paper Revision. N.L.-E.: Review and Background, Formal Analysis, and Paper Revision. J.O.-C.: Review and Background, Formal Analysis, and Paper Revision. All authors have read and agreed to the published version of the manuscript.

Funding

This research received no external funding.

Data Availability Statement

The data presented in this study are available upon request from the corresponding author. The data are not publicly available because they were obtained from the Spanish State Meteorological Agency (AEMET).

Conflicts of Interest

The authors declare that they have no known competing financial interests or personal relationships that could have appeared to influence the work reported in this paper.

References

  1. Cramer, W.; Guiot, J.; Fader, M.; Garrabou, J.; Gattuso, J.P.; Iglesias, A.; Lange, M.A.; Lionello, P.; Llasat, M.C.; Paz, S.; et al. Climate change and interconnected risks to sustainable development in the Mediterranean. Nat. Clim. Change 2018, 8, 972–980. [Google Scholar] [CrossRef]
  2. Masson-Delmotte, V.; Zhai, P.; Pirani, A.; Connors, S.L.; Péan, C.; Berger, S.; Caud, N.; Chen, Y.; Goldfarb, L.; Gomis, M.I.; et al. Contribution of Working Group I to the Sixth Assessment Report of the Intergovernmental Panel on Climate Change. In Climate Change: The Physical Science Basis; IPCC: Geneva, Switzerland, 2021. [Google Scholar]
  3. Meseguer-Ruiz, O.; Olcina Cantos, J. Climate change in two Mediterranean climate areas (Spain and Chile): Evidences and projections. Investig. Geográficas 2023, 79, 9–31. [Google Scholar] [CrossRef]
  4. AEMET. Atlas Climático Ibérico. In Temperatura del Aire y Precipitación (1971–2000); Ministerio de Medio Ambiente, Medio Rural y Marino: Madrid, Spain, 2011; 79p, Available online: https://www.aemet.es/documentos/es/conocermas/recursos_en_linea/publicaciones_y_estudios/publicaciones/Atlas-climatologico/Atlas.pdf (accessed on 12 November 2024).
  5. Schmidt, D.F.; Grise, K.M. The response of local precipitation and sea level pressure to Hadley cell expansion. Geophys. Res. Lett. 2017, 44, 10–573. [Google Scholar] [CrossRef]
  6. Xian, T.; Xia, J.; Wei, W.; Zhang, Z.; Wang, R.; Wang, L.P.; Ma, Y.F. Is Hadley cell expanding? Atmosphere 2021, 12, 1699. [Google Scholar] [CrossRef]
  7. Cresswell-Clay, N.; Ummenhofer, C.C.; Thatcher, D.L.; Wanamaker, A.D.; Denniston, R.F.; Asmerom, Y.; Polyak, V.J. Twenthieth Century Azores High expansion unprecedented in the last 1200 years. Nat. Geosci. 2022, 15, 548–553. Available online: https://www.nature.com/articles/s41561-022-00971-w (accessed on 12 November 2024). [CrossRef]
  8. CEDEX. Impacto del Cambio Climático en las Precipitaciones Máximas en España, Madrid; Centro de Estudios Hidrográficos: Madrid, Spain, 2021; 404p. [Google Scholar]
  9. Cardoso, S.; Martinho, M.A.; Carvalho, A.C.; Rocha, A. Extreme precipitation events under climate change in the Iberian Peninsula. Int. J. Climatol. 2020, 40, 1255–1278. [Google Scholar] [CrossRef]
  10. Senent-Aparicio, J.; López-Ballesteros, A.; Jimeno-Sáez, P.; Pérez-Sánchez, J. Recent precipitation trends in Peninsular Spain and implications for water infrastructure design. J. Hydrol. Reg. Stud. 2023, 45, 101308. [Google Scholar] [CrossRef]
  11. Fernández-Martínez, M.; Barquin, J.; Bonada, N.; Cantonati, M.; Churro, C.; Corbera, J.; Delgado, C.; Dulsat-Masvidal, M.; Garcia, G.; Margalef, O.; et al. Mediterranean springs: Keystone ecosystems and biodiversity refugia threatened by global change. Glob. Change Biol. 2024, 30, e16997. [Google Scholar] [CrossRef]
  12. Zhang, J.; Chen, S.; Wu, Z.; Fu, Y.H. Review of vegetation phenology trends in China in a changing climate. Prog. Phys. Geogr. Earth Environ. 2022, 46, 829–845. [Google Scholar] [CrossRef]
  13. Li, R.; Xu, X.; Xu, X.; Shepherd, T.G.; Wang, Y. Importance of orographic gravity waves over the Tibetan Plateau on the spring precipitation in East Asia. Sci. China Earth Sci. 2023, 66, 2594–2602. [Google Scholar] [CrossRef]
  14. Chu, X.; Man, R.; Dang, Q.L. Spring phenology, phenological response, and growing season length. Front. For. Glob. Change 2023, 6, 1041369. [Google Scholar] [CrossRef]
  15. Bertin, R.I. Plant phenology and distribution in relation to recent climate change. J. Torrey Bot. Soc. 2008, 135, 126–146. [Google Scholar] [CrossRef]
  16. Ruiz-Sinoga, J.; García-Marín, R.; Martínez Murillo, J.; Gabarrón-Galeote, M. Precipitation dynamics in southern Spain: Trends and cycles. Int. J. Climatol. 2011, 31, 2281–2289. [Google Scholar] [CrossRef]
  17. Gonzalez-Hidalgo, J.C.; Peña-Angulo, D.; Brunetti, M.; Cortesi, N. Recent trend in temperature evolution in Spanish mainland (1951–2010): From warming to hiatus. Int. J. Climatol. 2016, 36, 2405–2416. [Google Scholar] [CrossRef]
  18. Gonzalez-Hidalgo, J.C.; Beguería, S.; Peña-Angulo, D.; Trullenque-Blanco, V. MOPREDAS_century database and precipitation trends in mainland Spain, 1916–2020. Int. J. Climatol. 2023, 43, 3828–3840. [Google Scholar] [CrossRef]
  19. Miró, J.J.; Estrela, M.J.; Olcina-Cantos, J.; Martin-Vide, J. Future Projection of Precipitation Changes in the Júcar and Segura River Basins (Iberian Peninsula) by CMIP5 GCMs Local Downscaling. Atmosphere 2021, 12, 879. [Google Scholar] [CrossRef]
  20. Miró, J.J.; Estrela, M.J.; Corell, M.; Gómez DIgor Luna, M.Y. Precipitation and drought trends (1952–2021) in a key hydrological recharge area of the eastern Iberian Peninsula. Atmos. Res. 2023, 286, 106695. [Google Scholar] [CrossRef]
  21. Miró, J.J.; Lemus-Canovas, M.; Serrano-Notivoli, R.; Olcina, J.; Estrela, M.J.; Martin-Vide, J.; Sarricolea, P.; Meseguer-Ruiz, O. A component-based approximation for trend detection of intense precipitation in the Spanish Mediterranean coast. Weather. Clim. Extrem. 2022, 38, 100513. [Google Scholar] [CrossRef]
  22. Hubálek, Z. Global weather variability affects avian phenology: A long-term analysis, 1881–2001. Folia Zool. 2004, 53, 227–236. [Google Scholar]
  23. Remisiewicz, M.; Underhill, L.G. Large-scale climatic patterns have stronger carry-over effects than local temperatures on spring phenology of long-distance passerine migrants between Europe and Africa. Animals 2022, 12, 1732. [Google Scholar] [CrossRef]
  24. Ma, J.; Wang, S.; Deng, T. When the woolly rhinoceroses roamed East Asia: A review of isotopic paleoecology of the genus Coelodonta from the Tibetan Plateau to northern Eurasia. Front. Ecol. Evol. 2024, 12, 1377000. [Google Scholar] [CrossRef]
  25. Cann, D.J.; Hunt, J.R.; Porker, K.D.; Harris, F.A.; Rattey, A.; Hyles, J. The role of phenology in environmental adaptation of winter wheat. Eur. J. Agron. 2023, 143, 126686. [Google Scholar] [CrossRef]
  26. Gaona, I.J.A.; Fanzone, M.L.; Galmarini, M.V.; Chirife, J.; Ferreras-Charro, R.; García-Estévez, I.; Escribano-Bailón, M.T. Encapsulation of phenolic compounds by spray drying of Ancellotta and Aspirant Bouchet wines to produce powders with potential use as natural food colorants. Food Biosci. 2022, 50, 102093. [Google Scholar] [CrossRef]
  27. Capel Molina, J.J. Los sistemas convectivos de mesoescala y su influencia en la España Mediterránea. Papeles Geogr. 2000, 32, 29–43. [Google Scholar]
  28. Martín Vide, J.; Olcina Cantos, J. Climas y Tiempos de España; Alianza: Madrid, Spain, 2001; 264p. [Google Scholar]
  29. García Fernández, F. El Clima de la Meseta Meridional: Los Tipos de Tiempo; Del Departamento de Geografía General de la Universidad Autónoma de Madrid: Madrid, Spain, 1985; Volume 3, 215p. [Google Scholar]
  30. García Fernández, J. El Clima en Castilla y León; Ámbito: Valladolid, Spain, 1986; 370p. [Google Scholar]
  31. Peral García, M.C.; Navascués, B.; Ramos Calzado, P. Serie de Precipitación Diaria en Rejilla con Fines Climáticos; Notas Técnicas AEMET; AEMET: Madrid, Spain, 2017; Volume 24, 30p. [Google Scholar]
  32. Hersbach, H.; Brönnimann, S.; Haimberger, L.; Mayer, M.; Villiger, L.; Comeaux, J.; Simmons, A.; Dee, D.; Jourdain, S.; Peubey, C.; et al. The potential value of early (1939–1967) upper-air data in atmospheric climate reanalysis. Q. J. R. Meteorol. Soc. 2017, 143, 1197–1210. [Google Scholar] [CrossRef]
  33. Babanov, B.A.; Semenov, V.A.; Akperov, M.G.; Mokhov, I.I.; Keenlyside, N.S. Occurrence of Winter Atmospheric Circulation Regimes in Euro-Atlantic Region and Associated Extreme Weather Anomalies in the Northern Hemisphere. Atmos. Ocean. Opt. 2023, 36, 522–531. [Google Scholar] [CrossRef]
  34. Feliks, Y.; Small, J.; Ghil, M. Global oscillatory modes in high-end climate modeling and reanalyses. Clim. Dyn. 2021, 57, 3385–3411. [Google Scholar] [CrossRef]
  35. Hu, K.; Fang, X.; Ferrier, K.L.; Granger, D.E.; Zhao, Z.; Ruetenik, G.A. Covariation of cross-divide differences in denudation rate and χ: Implications for drainage basin reorganization in the Qilian Shan, northeast Tibet. Earth Planet. Sci. Lett. 2021, 562, 116812. [Google Scholar] [CrossRef]
  36. Hamed, K.H.; Rao, A.R. A modified Mann-Kendall trend test for autocorrelated data. J. Hydrol. 1998, 204, 182–196. [Google Scholar] [CrossRef]
  37. Theil, H. A rank-invariant method of linear and polynomial regression analysis. Indag. Math. 1950, 12, 173. [Google Scholar]
  38. Sen, P.K. Estimates of the regression coefficient based on Kendall’s tau. J. Am. Stat. Assoc. 1968, 63, 1379–1389. [Google Scholar] [CrossRef]
  39. Mann, H.B. On the Field of Origin of an Ideal. Can. J. Math. 1950, 2, 16–21. [Google Scholar] [CrossRef]
  40. Kendall, M.G. Rank Correlation Methods, 4th ed.; Charles Griffin: London, UK, 1975. [Google Scholar] [CrossRef]
  41. Efon, E.; Ngongang, R.D.; Meukaleuni, C.; Wandjie, B.B.; Zebaze, S.; Lenouo, A.; Valipour, M. Monthly, seasonal, and annual variations of precipitation and runoff over west and Central Africa using remote sensing and climate reanalysis. Earth Syst. Environ. 2023, 7, 67–82. [Google Scholar] [CrossRef]
  42. Karanja, J.; Svoma, B.M.; Walter, J.; Georgescu, M. Southwest US winter precipitation variability: Reviewing the role of oceanic teleconnections. Environ. Res. Lett. 2023, 18, 053003. [Google Scholar] [CrossRef]
  43. Luiz-Silva, W.; Oscar-Júnior, A.C. Climate extremes related with rainfall in the State of Rio de Janeiro, Brazil: A review of climatological characteristics and recorded trends. Nat. Hazards 2022, 114, 713–732. [Google Scholar] [CrossRef]
  44. Tan, J.S.D.; Fischer, A.M. Suggestions for marine protected area management in Australia: A review of temperature trends and management plans. Reg. Environ. Change 2022, 22, 92. [Google Scholar] [CrossRef]
  45. Deitch, M.J.; Sapundjieff, M.J.; Feirer, S.T. Characterizing Precipitation Variability and Trends in the World’s Mediterranean-Climate Areas. Water 2017, 9, 259. [Google Scholar] [CrossRef]
  46. Caloiero, T.; Caloiero, P.; Frustaci, F. Long-term precipitation trend analysis in Europe and in the Mediterranean basin. Water Environ. J. 2018, 32, 433–445. [Google Scholar] [CrossRef]
  47. Acero, F.J.; Gallego, M.C.; García, J.A. Multi-day rainfall trends over the Iberian Peninsula. Theor. Appl. Climatol. 2012, 108, 411–423. [Google Scholar] [CrossRef]
  48. Serrano, A.; Mateos, V.L.; Garcia, J.A. Trend analysis of monthly precipitation over the iberian peninsula for the period 1921–1995. Phys. Chem. Earth Part B Hydrol. Ocean. Atmos. 1999, 24, 85–90. [Google Scholar] [CrossRef]
  49. Estrela, M.J.; Corell, D.; Miró, J.J.; Niclós, R. Analysis of Precipitation and Drought in the Main Southeastern Iberian River Headwaters (1952–2021). Atmosphere 2024, 15, 166. [Google Scholar] [CrossRef]
  50. Liu, Y.; Garcia, M.; Zhang, C.; Tang, Q. Recent decrease in summer precipitation over the Iberian Peninsula closely links to reduction in local moisture recycling. Hydrol. Earth Syst. Sci. 2022, 26, 1925–1936. [Google Scholar] [CrossRef]
  51. Serrano Notivoli, R. Reconstrucción Climática Instrumental de la Precipitación Diaria en España: Ensayo Metodológico y Aplicaciones. Doctoral Thesis, University of Zaragoza, Zaragoza, Spain, 2017. [Google Scholar]
  52. Del Río, S.; Penas, Á.; Fraile, R. Analysis of recent climatic variations in Castile and Leon (Spain). Atmos. Res. 2005, 73, 69–85. [Google Scholar] [CrossRef]
  53. Gonzalez-Hidalgo, J.C.; Brunetti, M.; de Luis, M. Precipitation trends in Spanish hydrological divisions, 1946–2005. Clim. Res 2010, 43, 215–228. [Google Scholar] [CrossRef]
  54. González-Hidalgo, J.C.; Brunetti, M.; De Luis, M. A new tool for monthly precipitation analysis in Spain: MOPREDAS database (monthly precipitation trends December 1945–November 2005): Monthly precipitation trends in Spain (December 1945–November 2005). Int. J. Clim. 2011, 31, 715–731. [Google Scholar] [CrossRef]
  55. Paredes, D.; Trigo, R.M.; Garcia-Herrera, R.; Trigo, I.F. Understanding precipitation changes in iberia in early spring: Weather typing and storm-tracking approaches. J. Hydrometeorol. 2006, 7, 101–113. [Google Scholar] [CrossRef]
  56. Sanchez-Lorenzo, A.; Brunetti, M.; Calbó, J.; Martin-Vide, J. Recent spatial and temporal variability and trends of sunshine duration over the Iberian Peninsula from a homogenized data set. J. Geophys. Res. 2007, 112, D20115. [Google Scholar] [CrossRef]
  57. Lana, X.; Casas-Castillo, M.C.; Rodríguez-Solà, R.; Prohom, M.; Serra, C.; Martínez, M.D.; Kirchner, R. Time trends, irregularity and multifractal structure on the monthly rainfall regime at Barcelona, NE Spain, years 1786–2019. Int. J. Climatol. 2022, 43, 499–518. [Google Scholar] [CrossRef]
  58. Gonzalez-Hidalgo, J.C.; Trullenque Blanco, V.; Beguería, S.; Peña-Angulo, D. Seasonal precipitation changes in the western Mediterranean Basin: The case of the Spanish mainland, 1916–2015. Int. J. Climatol. 2024, 44, 5. [Google Scholar] [CrossRef]
  59. Lorente, C.; Corell, D.; Estrela, M.J.; Miró, J.J.; Orgambides-García, D. Impact of Climate Change on the Bioclimatological Conditions Evolution of Peninsular and Balearic Spain During the 1953–2022 Period. Climate 2024, 12, 183. [Google Scholar] [CrossRef]
  60. Benetó, P.; Khodayar, S. On the need for improved knowledge on the regional-to-local precipitation variability in eastern Spain under climate change. Atmos. Res. 2023, 290, 106795. [Google Scholar] [CrossRef]
  61. de la Vara, A.; Cabos, W.; Gutiérrez, C.; Olcina, J.; Matamoros, A.; Pastor, F.; Khodayar, S.; Ferrando, M. Climate change impacts on the tourism sector of the Spanish Mediterranean coast: Medium-term projections for a climate services tool. Clim. Serv. 2024, 34, 100466. [Google Scholar] [CrossRef]
  62. Mezger, G.; De Stefano, L.; González del Tánago, M. Analysis of the Evolution of Climatic and Hydrological Variables in the Tagus River Basin, Spain. Water 2022, 14, 818. [Google Scholar] [CrossRef]
  63. Gómez-Martínez, G.; Pérez-Martín, M.A.; Estrela-Monreal, T.; del-Amo, P. North Atlantic Oscillation as a Cause of the Hydrological Changes in the Mediterranean (Júcar River, Spain). Water Resour. Manag. 2018, 32, 2717–2734. [Google Scholar] [CrossRef]
  64. Alvarez, I.; Pereira, H.; Picado, A.; Sousa, M.C.; Lorenzo, M.N.; Dias, J.M. Projection of Compound Wind and Precipitation Extreme Events in the Iberian Peninsula Based on CMIP6. Earth Syst. Environ. 2024, 8, 801–814. [Google Scholar] [CrossRef]
  65. Tarín-Carrasco, P.; Petrova, D.; Chica-Castells, L.; Lukovic, J.; Rodó, X.; Cvijanovic, I. Assessment of Future Precipitation Changes in Mediterranean Climate Regions from CMIP6 ensemble. EGUsphere 2024, 1–34. [Google Scholar] [CrossRef]
Figure 1. Location of area of study. (a) Altimetry; (b) geographic toponyms included in text (red: cities and municipalities; blue: rivers and reservoirs; and dark brown in capital letters: mountain system).
Climate 13 00122 g001
Figure 2. Precipitation characteristics: (a) annual accumulated precipitation (mm), (b) spring accumulated precipitation (mm) and (c) percentage of spring accumulated precipitation with respect to annual accumulated precipitation (mm).
Climate 13 00122 g002
Figure 3. Time trend (mm/decade): (a) annual precipitation and statistically significant variations, p value < 0.05, and (b) annual absolute variation (mm).
Climate 13 00122 g003
Figure 4. Time trend (mm/decade): (a) spring precipitation and statistically significant variations, p value < 0.05, and (b) spring absolute variation (mm).
Climate 13 00122 g004
Figure 5. Monthly time trend (mm/decade): (a) March, (b) April, (c) May and (d) June of total accumulated precipitation (points show sample variations, p value < 0.05).
Climate 13 00122 g005
Figure 6. Geographic areas with the greatest rainfall variations in the study area. In blue, areas of precipitations gains, in red, precipitation decreases (mm/decade). The graphs show blue columns with positive rainfall anomalies, and red with negative anomalies. Linear trend line in dashed black and a smooth-pass filter moving trend line in solid black.
Climate 13 00122 g006
Figure 7. Precipitation trend (mm/decade) during spring in 20-year time windows (1952–2020) for seven zones defined: 7270 (Z1), 7611 (Z2), 9101 (Z3), 9787 (Z4), 9810 (Z5), 7762 (Z6) and 7897 (Z7). Blue columns show positive precipitation anomalies, and red with negative anomalies. The solid black line shows a 30-year moving average trend.
Climate 13 00122 g007
Figure 8. Monthly, spring and annual percentage changes with respect to total average (mm): (a) March, (b) April, (c) May, (d) June, (e) spring and (f) annual.
Climate 13 00122 g008
Figure 9. Distribution of geopotential heights (m) of Z500 (a) and Z1000 (b) (1991–2020).
Climate 13 00122 g009
Figure 10. Time trend (m/decade) of geopotential height of 500 hPa (Z500) in area of study for (a) March, (b) April, (c) May, (d) June and (e) spring (1952–2020).
Climate 13 00122 g010
Figure 11. Time trend of geopotential height of 1000 hPa (Z1000) in area of study for (a) March, (b) April, (c) May, (d) June and (e) spring (1952–2020).
Climate 13 00122 g011
Figure 12. Seasonal geopotential height (m.) by months and areas (arrows indicate intensity in continentality (brown), and influence of Mediterranean Sea (blue)). Dark blue represents March, light blue represents April, light green represents May, dark green represents June, and purple represents Spring. The dashed red lines show the reference base altitude level for Z1000 and Z500.
Climate 13 00122 g012
Table 1. Monthly and seasonal percentage of precipitation type (convective (conv) or large-scale precipitation (lsp)) according to geographic area (Z1 to Z7).
MarchAprilMayJuneSpring
Z1% conv% lsp% conv% lsp% conv% lsp% conv% lsp% conv% lsp
41–7036.663.450.549.559.240.871.328.748.851.2
51–9029.770.348.151.956.243.869.430.644.655.4
61–9027.672.445.654.456.343.768.431.643.256.8
71–0029.370.742.557.553.246.869.830.242.058.0
81–1033.067.041.658.455.144.972.127.943.556.5
91–2033.966.142.757.356.743.373.726.344.755.3
Z2
41–7025.874.242.157.953.646.471.029.040.559.5
51–9024.375.737.762.353.746.363.336.738.661.4
61–9024.575.537.762.353.246.869.130.938.561.5
71–0027.972.136.663.453.04768.831.239.560.5
81–1026.973.141.258.853.946.172.127.941.059.0
91–2031.468.638.861.254.745.371.728.341.958.1
Z3
41–7029.270.841.758.355.144.975.324.742.058.0
51–9027.472.640.359.755.144.969.031.040.959.1
61–9028.971.139.760.355.444.669.930.141.358.7
71–0029.970.139.460.650.849.271.428.640.060.0
81–1031.268.840.159.952.847.273.027.041.458.6
91–2031.768.340.759.353.746.368.531.542.058.0
Z4
41–7027.073.032.967.151.648.469.730.337.262.8
51–9026.573.531.468.649.150.960.639.435.764.3
61–9025.674.433.366.751.248.860.139.936.763.3
71–0025.774.336.363.749.950.160.239.837.362.7
81–1027.073.039.061.052.147.966.333.739.460.6
91–2028.072.040.359.750.449.668.032.039.660.4
Z5
41–7019.580.524.375.738.661.448.251.827.572.5
51–9017.982.120.979.135.964.144.255.824.975.1
61–9014.285.820.080.035.664.446.653.423.276.8
71–0013.586.522.277.836.563.547.952.124.175.9
81–1014.585.526.473.638.861.246.753.326.673.4
91–2015.085.028.271.841.958.146.253.828.471.6
Z6
41–7029.370.740.959.150.349.767.732.340.159.9
51–9026.473.639.360.749.950.159.140.938.561.5
61–9024.875.238.062.050.149.957.742.337.662.4
71–0027.472.636.663.450.849.258.941.138.361.7
81–1030.169.941.158.952.247.863.136.941.158.9
91–2031.868.244.655.457.842.266.233.844.755.3
Z7
41–7026.973.139.260.851.648.458.042.039.260.8
51–9026.573.540.159.952.547.555.844.239.760.3
61–9026.074.037.562.552.947.154.245.838.861.2
71–0025.774.334.965.155.244.852.547.538.661.4
81–1024.675.435.264.854.445.656.943.138.161.9
91–2024.675.436.663.452.048.064.135.937.862.2
Table 2. Summary and graphical representation of monthly precipitation trends (mm/decade) by zone and for study area (statistically significant values in bold).
Z1Z2Z3Z4Z5Z6Z7Study Area
March−8.05−5.18−2.63−3.13−0.62−3.551.44−1.88
April0.19−0.380.241.011.761.722.361.21
May−2.04−1.65−0.46−0.421.10−2.770.45−0.64
June−3.31−2.35−3.08−3.63−1.06−4.39−0.18−2.32
Spring−9.24−8.04−5.81−5.392.91−5.306.57−1.50
Annual−32.10−35.34−17.35−16.51−0.80−28.656.97−10.98
Table 3. The average geopotential altitude (Z500 and Z1000) for the different spring months of the analysis in each of the regions of study.
MarchAprilMayJuneSpring
Z500 m
Z15850.65631.55703.05795.15745.1
Z25851.05630.25703.05795.15744.8
Z35843.75621.95697.05788.55737.8
Z45840.65619.35694.65785.95735.1
Z55842.55618.55696.25787.15736.1
Z65855.15628.45700.35797.65745.4
Z75856.45627.95707.05798.35747.4
Area of study5849.15625.25701.35792.85742.1
Z1000 m
Z1155.8128.7137.8141.2140.9
Z2152.9124.2129.0131.8134.5
Z3155.3126.9134.3140.9139.4
Z4156.3128.0135.6143.2140.8
Z5153.9125.4133.1140.4138.2
Z6154.9127.8135.9143.7140.6
Z7152.3125.7136.2146.4140.2
Area of study154.2126.4134.1141.3139.0
Table 4. Correlation coefficient (between P and Z500/Z1000) for spring months by zone.
MarchAprilMayJuneSpring
P vs. Z500
Z1−0.07−0.21−0.43−0.79−0.22
Z2−0.20−0.24−0.49−0.75−0.34
Z3−0.230.10−0.56−0.64−0.31
Z4−0.240.04−0.44−0.73−0.34
Z50.02−0.02−0.28−0.72−0.12
Z6−0.120.14−0.74−0.74−0.51
Z70.360.46−0.24−0.270.38
P vs. Z1000
Z1−0.86−0.23−0.490.04−0.54
Z2−0.81−0.17−0.460.21−0.34
Z3−0.78−0.12−0.670.27−0.65
Z4−0.82−0.24−0.550.09−0.51
Z5−0.73−0.55−0.55−0.25−0.41
Z6−0.81−0.18−0.680.19−0.51
Z7−0.22−0.36−0.37−0.23−0.25
Table 5. Time trend of Z500 (above) and Z1000 (below) for spring months by zone.
MarchAprilMayJuneSpring
m/decade Z500
Z12.433.206.493.637.51
Z22.454.016.813.567.39
Z32.637.146.883.177.17
Z42.685.736.203.097.41
Z52.726.636.573.367.09
Z62.596.246.213.576.56
Z72.655.364.583.696.05
m/decade Z1000
Z13.73−0.801.62−0.250.49
Z23.76−0.981.48−0.360.42
Z34.12−1.251.98−0.420.32
Z44.05−1.311.73−0.390.37
Z54.20−1.562.04−0.760.18
Z64.60−0.442.82−0.370.20
Z74.18−0.302.72−0.180.60
Table 6. Summary table of final results.
Sector AnalysedAnnual Precipitation Trends
(mm/decade)
Springs Precipitation Trends
(mm/decade)
Z1−9.24−32.10 *
Z2−8.04 *−35.34 *
Z3−5.81−17.35 *
Z4−5.39 *−16.51 *
Z52.91−0.80
Z6−5.30−28.65 *
Z76.576.97
Study area−1.50−10.98
* Significant statistics are shown in bold.
Disclaimer/Publisher’s Note: The statements, opinions and data contained in all publications are solely those of the individual author(s) and contributor(s) and not of MDPI and/or the editor(s). MDPI and/or the editor(s) disclaim responsibility for any injury to people or property resulting from any ideas, methods, instructions or products referred to in the content.

