Article

Improving Daily CMIP6 Precipitation in Southern Africa Through Bias Correction—Part 1: Spatiotemporal Characteristics

by
Amarech Alebie Addisuu
*,
Gizaw Mengistu Tsidu
* and
Lenyeletse Vincent Basupi
Department of Sustainable Natural Resources, Botswana International University of Science and Technology (BIUST), Palapye 10071, Botswana
*
Authors to whom correspondence should be addressed.
Climate 2025, 13(5), 95; https://doi.org/10.3390/cli13050095
Submission received: 13 March 2025 / Revised: 19 April 2025 / Accepted: 24 April 2025 / Published: 4 May 2025

Abstract

:
Impact models used in water, ecology, and agriculture require accurate climatic data to simulate observed impacts. Some of these models emphasize the distribution of precipitation within a month or season rather than the overall amount. To meet this requirement, a study applied three bias correction techniques—scaled distribution mapping (SDM), quantile distribution mapping (QDM), and QDM with a separate treatment for precipitation below and above the 95th percentile threshold (QDM95)—to daily precipitation data from eleven Coupled Model Intercomparison Project Phase 6 (CMIP6) models, using the Climate Hazards Group Infrared Precipitation with Station version 2 (CHIRPS) as a reference. This study evaluated the performance of all bias-corrected CMIP6 models over Southern Africa from 1982 to 2014 in replicating the spatial and temporal patterns of precipitation across the region against three observational datasets, CHIRPS, the Climatic Research Unit (CRU), and the Global Precipitation Climatology Centre (GPCC), using standard statistical metrics. The results indicate that all bias-corrected precipitation generally performs better than native model precipitation in replicating the observed December–February (DJF) mean and seasonal cycle. The probability density function (PDF) of the bias-corrected regional precipitation indicates that bias correction enhances model performance, particularly for precipitation in the range of 3–35 mm/day. However, both corrected and uncorrected models underestimate higher extremes. The pattern correlations of the bias-corrected precipitation with CHIRPS, the GPCC, and the CRU, as compared to the correlations of native precipitation with the three datasets, have improved from 0.76–0.89 to 0.97–0.99, 0.73–0.87 to 0.94–0.97, and 0.74–0.89 to 0.97–0.99, respectively. Additionally, the Taylor skill scores of the models for replicating the CHIRPS, GPCC, and CRU precipitation spatial patterns over Southern Africa have improved from 0.57–0.80 to 0.79–0.95, 0.55–0.76 to 0.80–0.91, and 0.54–0.75 to 0.81–0.91, respectively. Overall, among the three bias correction techniques, QDM consistently demonstrated better performance than both QDM95 and SDM across various metrics. The implementation of distribution-based bias correction resulted in a significant reduction in bias and improved the spatial consistency between models and observations over the region.

1. Introduction

Climate change significantly impacts agricultural production and food supplies. Agriculture is particularly vulnerable to the effects of climate change, making it one of the least resilient economic sectors when dealing with shifting weather patterns [1]. Between 2006 and 2015, millions of people in Africa were negatively impacted by floods, heatwaves, droughts, and storms, resulting in billions of dollars in economic losses [2]. In Southern Africa, precipitation is critical in shaping agricultural activities and influencing crop selection, planting, and harvesting decisions. Water scarcity significantly hinders agricultural productivity within the region [3]. The Sixth Assessment Report from the Intergovernmental Panel on Climate Change [4] has found that climate change will cause changes in the spatial patterns of precipitation events and lead to more extreme weather conditions. Therefore, generating accurate, high-resolution climate data, particularly for precipitation, is of utmost importance for hydrological and risk assessment studies.
High-resolution climate data are either available in the form of gridded data, climate data, or reanalysis model data. These datasets suffer from either poor spatial resolution or model bias or from both. For example, due to poor spatial resolution, most global climate models (GCMs) only provide general projections for specific areas, such as watersheds, bioregions, or agricultural zones. In addition, climate models suffer from systematic biases. The lack of representation of small areas such as watersheds, bioregions, or agricultural zones in the models and inherent model bias become particularly challenging when applying impact models such as hydrological, ecological, and agricultural models, which require high-resolution and unbiased local data. To address these problems in climate simulations, bias correction (BC) methods have been developed to provide more accurate climate conditions for impact studies [5]. BC methods can be broadly categorized into two types: the scale distribution method and the quantile mapping (QM) method [6,7,8]. Moreover, past studies have also noted that there are a variety of quantile distribution bias correction techniques that may not necessarily have a similar capability of correcting the bias of the GCMs’ outputs (e.g., [6]).
As a result, it is crucial to identify and correct any biases in the model outputs using one or more of the BC methods and baseline or reference datasets to create accurate simulations of the observed climate. The effectiveness of bias adjustment methods depends on the availability and reliability of observed time series or reanalysis data. There are various approaches to choosing BC methods, each based on a different premise and methodology. However, most comparative analyses suggest that distribution-based bias correction methods are the most effective in mitigating precipitation biases [6,9,10]. For instance, Gumindoga et al. [11] compared five bias correction methods regarding satellite precipitation estimates and concluded that quantile mapping yielded the most accurate precipitation that captures the empirical distribution. Tabari et al. [10] compared four bias correction methods and found that the quantile mapping methodology produced superior results. Similarly, Chen et al. [12] compared various bias correction techniques and found that quantile mapping based in a gamma distribution yields the most accurate precipitation in terms of replicating observed distribution. Moreover, studies conducted in different parts of Africa, such as those by Ayugi et al. [13], Hamadalnel et al. [14], and Sian et al. [15], which employed similar quantile mapping on gamma distribution methods, reported improvements in model data. While quantile mapping (QM) has been widely used for bias-correcting historical precipitation data, it faces limitations due to its reliance on the stationarity assumption and potential biases in evaluation methods. Switanek et al. [16] challenge the effectiveness of QM for historical data and propose scaled distribution mapping (SDM) as a more robust alternative. In particular, with regard to projection, SDM adjusts the observed historical distribution based on raw model-projected changes to avoid the stationarity assumption. While there are differences between bias correction methods, there is a general consensus that bias correction effectively reduces significant biases in the model data and is deemed necessary before conducting any projection studies [17,18,19].
With this general consensus, a number of studies have been conducted in different parts of the world to improve climate data [6,20]. However, there are only a handful of studies across Africa [11,13,15,21]. Recently, researchers conducted studies in Southern Africa using ensembles of bias-corrected and -uncorrected CMIP6 model data. For instance, Sian et al. [15] compared both bias-corrected and non-bias-corrected mean precipitation in CMIP6 models against GPCC data for Southern Africa. However, their analysis was focused on future projections. Additionally, Sian et al. [17] analyzed CMIP6 precipitation data to examine the mean precipitation in the Southern Africa region. Nonetheless, their analysis primarily relied on non-bias-corrected CMIP6 model data. Similarly, various studies focusing on different parts of Africa employed CMIP6 to analyze the mean precipitation at various temporal scales as seen in the works of Mmame and Ngongondo [19], Babaousmail et al. [22], Faye and Akinsanola [23], Ngoma et al. [24], Makula and Zhou [25], and Jima et al. [26]. However, these investigations relied on non-bias-corrected model data. While acknowledging that the models generally performed reasonably well in simulating the mean precipitation, these studies also identified instances of overestimation, particularly in high-elevation regions and large open water bodies [17,18,26,27]. Their findings emphasize the need to improve model data by correcting biases in climate models.
To this end, previous studies have looked into the reliability and robustness of bias-corrected climate models such as those from CMIP5, CMIP6, and RCM (e.g., CORDEX), for precipitation in areas with complex terrain. However, there has not been sufficient characterization of bias-corrected models across Southern Africa. In this study, we use three bias correction techniques—namely, SDM and two variants of QM—to assess how effectively 11 CMIP6 models capture observed precipitation over Southern Africa during the peak of the rainy season from December to February (DJF). DJF displays a notable bias compared to the rest of the seasons, especially in the low-precipitation months of November and March [28]. Hence, it is essential to assess how bias correction techniques enhance the spatial representation of climate change in CMIP6 GCMs across different time scales and to determine the most effective bias correction techniques for CMIP6 GCMs, based on their ability to accurately capture the spatial and temporal patterns of daily precipitation. Access to a greater number of bias-corrected climate models and their effectiveness in simulating precipitation across the region during this season is vital for users of climate impact models. Additionally, the current set of models selected for this study was not previously evaluated to determine whether there is an improvement in performance after applying bias correction techniques.
The remainder of this paper is organized as follows: In Section 2, we summarize the datasets and methodologies employed. The results of the analysis and discussion on the performance of both bias-corrected and -uncorrected historical simulation relative to the three sets of observations are provided in Section 3. Section 4 presents the conclusions and summary of the most noteworthy findings.

2. Study Area, Data, and Methods

2.1. The Study Area

The study area is Southern Africa, which lies between 9°–35° S and 11°–52° E (as depicted in Figure 1). This region covers a wide drainage basin characterized by extensive coastlines that stretch from the Atlantic Ocean in the west to the Indian Ocean in the east, converging at Cape Agulhas in the south. This geographical domain includes eleven countries, namely, Angola, Namibia, Zambia, Malawi, Zimbabwe, Botswana, the Republic of South Africa (South Africa), Lesotho, Swaziland (Eswatini), Mozambique, and Madagascar. The region features a complex and varied topography, including multiple mountain ranges and inland water bodies, with a land elevation gradient that increases from east to west. High-elevation areas limit direct wind flow over the continent [29]. Southern Africa’s climate, classified according to the Koppen–Geiger system as tropical, temperate, and arid, exhibits strong seasonal variations [30,31]. The extended latitudinal range of Southern Africa results in a latitudinal gradient in precipitation, with the northern regions exhibiting a more tropical climate and greater precipitation than the southern regions [32]. Further contributing to this, the tropical rain belt (TRB) accounts for most of the precipitation in the northern parts of Southern Africa. During the austral summer (DJF), the TRB shifts into the Southern Hemisphere, often bringing substantial precipitation and resulting in wetter conditions [33,34,35].

2.2. Data

2.2.1. Observational Data

Three different datasets were chosen to evaluate the potential improvement after the bias correction relative to bias-uncorrected simulated precipitation. The diversity of the data is intended to account for variations in the observational datasets over Southern Africa [37]. The Climate Hazards Group Infrared Precipitation with Station version 2 (CHIRPS) covers the period from 1981 to the present day and provides a spatial resolution of 0.25° (roughly 25 km), as explained by Funk et al. [38]. CHIRPS daily precipitation over the study area is used as a reference dataset in the bias correction of daily precipitation simulated by selected CMIP6 models during 1982–2014. The Global Precipitation Climatology Centre (GPCC) V2020 with a resolution of 1 ° × 1 ° and daily temporal resolution from January 1982 to December 2020 [39] is used to evaluate the improvement in bias-corrected precipitation relative to uncorrected precipitation.
The Climatic Research Unit (CRU) Time-Series (TS) data version 4.05, gridded at a high resolution of 0 . 5 ° × 0 . 5 ° degrees and monthly temporal resolution, is used as a seasonal precipitation dataset to assess the added value of bias correction. The University of East Anglia generated these datasets [40]. The use of three datasets to evaluate the bias-corrected model precipitation at the monthly time scale is motivated by the need to assess the level of disagreement with other observed datasets. This discrepancy arises from the differences in the observed dataset and the reference dataset used in bias correction. Samuel et al. [41] have demonstrated that the probability density function (PDF) of precipitation from bias-uncorrected low- and high-resolution models shows varying levels of agreement with the PDF of CHIRPS, tropical applications of meteorology using satellite data and ground-based observations (TAMSAT), and multi-source weighted precipitation (MSWEP) in different river basins in Southern Africa.

2.2.2. Cmip6 Climate Models

We employed simulations of historical daily precipitation data from the CMIP6 climate models in the bias correction. Comprehensive details about these models, including their basic information, can be found in Table 1. Eleven daily CMIP6 models with the variant label r1i1p1f1 were obtained from the Earth System Grid Federation (ESGF) data distribution portal. These datasets can be accessed at https://esgf-node.llnl.gov/search/cmip6, last accessed on 1 April 2025. Our selection criteria were based on the availability of data for both historical and future periods (i.e., for a follow-up study on the SSP1-2.6, SSP2-4.5, SSP3-7.0, and SSP5-8.5 scenarios within the CMIP6 framework) at the time of our study.

2.3. Methods

2.3.1. Bias Correction

Various bias correction methods exist, each based on a distinct set of assumptions and methodologies [6,9,10]. This study assessed three techniques for correcting bias in historical daily precipitation data for Southern Africa, using eleven GCMs from the Coupled Model Intercomparison Project Phase 6 (CMIP6). The techniques included two versions of quantile mapping. The first version, quantile mapping (quantile distribution mapping (QDM)), involved constructing a cumulative density function (CDF) based on 33 years of data (1982–2014) using a 30-day moving window centered on a given day for which precipitation bias correction is required. The second variant, referred to as QDM95 hereafter, is a modified version of standard QM, which uses two CDFs for precipitation values less than or equal to the 95th percentile and greater than the 95th percentile. This modification was made to reduce the impact of large data points around the mean precipitation in quantile matching on the lower and upper extremes of the precipitation distribution. The third bias correction technique used in this study is the scaled distribution mapping (SDM). Detailed descriptions of the QDM (QDM95) and SDM techniques are provided in the following section.

Quantile Distribution Mapping

QM adjusts the cumulative distribution function (CDF) of the model-simulated variable to match the observed CDF. Essentially, for each quantile of the simulated data, QM ensures that it maps to the corresponding quantile in the observed data. QM corrects the full distribution, including biases in the mean, variance, and higher-order moments. Therefore, it uses statistical transformations to post-process climate modeling outputs, which involves transforming distribution functions of modeled variables into observed ones using a mathematical function [52]. We can use the following transformation function f to relate observed precipitation ( x o ) with modeled precipitation ( x m ):
x o = f ( x m ) ,
Using the CDFs of both observed and simulated variable time series, their quantile relation can also be determined from [53]:
x b c = F o 1 [ F m ( x m ) ] ,
where x b c is bias-corrected model precipitation, F m is the CDF of the modeled precipitation, and F o 1 is the inverse CDF of observation. Two types of transformations are used to model the relationship between variables: parametric and non-parametric. Parametric transformations use a direct approach to model the quantile–quantile relationship using Equation (1). Non-parametric transformations, on the other hand, use empirical CDFs to solve Equation (2). In this context, we use the distribution-derived transformation, which involves a theoretical distribution to solve Equation (2). In this study, the theoretical CDF is computed using theoretical gamma distributions, often used to model precipitation. The gamma distribution’s probability density function is given by
f ( x ) = x k 1 e x θ Γ ( k ) θ k
where k and θ are positive numbers. After integrating Equation (3), we obtain the CDF of the gamma distribution, F, given by
F = γ ( k , x θ ) Γ ( k )
where the lower incomplete gamma function γ in Equation (4) is computed from
γ ( k , x θ ) = o x θ t k 1 e t d t
It is essential to note that f(x) could also be any other suitable distribution for modeling the observed distribution of interest. For this reason, the appropriateness of the selected distribution should be evaluated whether it fits the observed reference distribution used in this study. We state the null hypothesis that cumulative CHIRPS precipitation distribution is the same as the one obtained from gamma distribution as per the test statistics given in Section 2.3.2.
QDM and QDM95 are both implemented based on the steps indicated in Equations (1)–(4). However, there are differences between the two techniques: 1. QDM uses a 30-day moving window centered on the date of interest to calculate the 33-year daily precipitation cumulative distribution function (CDF) from observations and simulations, while QDM95 uses the whole daily time series with no moving window. 2. In QDM95, model precipitation that is less than or equal to the 95th percentile and that above this percentile are separately adjusted to match observations during bias correction. This distinction is not present in the case of QDM.

Scaled Distribution Mapping (SDM)

Scaled distribution mapping (SDM) is a bias correction technique commonly utilized in climate modeling and downscaling applications. It is specifically developed to rectify biases in simulated climate variables, such as temperature and precipitation, in comparison to observed data. The primary goal of SDM is to adjust the distribution of the modeled values to align more closely with the observed data, focusing on scaling the modeled values to better match the range of and variability in the observed data. This is achieved by adjusting the model output using a scaling factor that brings the modeled distribution closer to the observed one. SDM accounts for differences in the mean and variability (such as standard deviation) between the simulated and observed data by preserving the relative differences between the model outputs while aligning the overall distribution with observed data.
In SDM, the bias correction involves scaling the model-simulated precipitation to match the observed precipitation distribution. The basic equation used in SDM can be written as follows:
x b c = μ o + σ o σ m ( x m μ m )
where μ o , μ m , σ o , and σ m represent the observed and simulated mean and standard deviation of precipitation.

2.3.2. Performance Evaluation Statistical Metrics

To facilitate a direct comparison of the models with the observational monthly datasets, the daily precipitation simulations are aggregated into monthly precipitation simulations. The analysis focuses on the period from 1982 to 2014, aligning with the availability of GPCC daily data. Moreover, this study focuses on the rainy season from December to February (DJF) as this season covers most of the Southern Africa region [54,55,56]. The GPCC, CHIRPS, and CRU datasets are used to evaluate the added values of bias correction. The horizontal resolution of the CRU dataset and CMIP6 GCMs vary. To facilitate a direct comparison of the models with the observational datasets, the daily precipitation simulations of all the selected bias-corrected and -uncorrected CMIP6 GCMs were remapped to a common grid with a resolution of CHIRPS data using bilinear interpolation. Also, the CRU was remapped to a common grid with CHIRPS data using bilinear interpolation [57].
In this study, the evaluation was performed by processing and comparing the models’ outputs with the observation datasets using some of the statistical measures recommended by the World Meteorological Organization (WMO) as reported in Gordon and Shaykewich [58]. These statistical indicators include standard deviation (Stdv), mean ratio, mean bias (MB), Root Mean Square Error (RMSE), pattern correlation coefficient (R), and comprehensive rating metric (RM).
The mean ratio is given as
R a t i o = σ m σ o
where σ o and σ m are the standard deviation of the observed and modeled datasets, respectively. The mean ratio is dimensionless, and a mean ratio of 1 denotes an equivalency between model-predicted and observed precipitation, implying no substantial difference. A mean ratio exceeding 1 signifies that simulated precipitation exceeds the observed precipitation, indicating increased predicted precipitation. Conversely, a mean ratio less than 1 suggests that the simulated precipitation falls short of the observed data, implying a decrease in predicted precipitation [59]. Mean bias (MB) is another assessment metric that describes the mean difference between the simulated and observed precipitation, as given by
M B = 1 n ( i = 1 n y m y o )
MB indicates whether the models have overestimated/underestimated the observed values. A small bias indicates that the model has good skills in capturing mean precipitation [60]. The Root Mean Square Error (RMSE) is a good measure of how accurately the model simulates observations. It is given by
R M S E = i = 1 n ( y m y o ) 2 n
A small value indicates better model performance and vice versa [61].
The pattern correlation coefficient (R) is given by
R = i = 1 n ( y m i y m ¯ ) ( y o i y o ¯ ) i = 1 n ( y m i y m ¯ ) 2 i = 1 n ( y o i y o ¯ ) 2
where y m is the model value, y o is observation, and n is the number of total grids over Southern Africa. It measures the strength of the linear association among two variables. In addition, the pattern correlation coefficient between ±0.4 and 0.6 is considered a moderate positive/negative relationship, and 0 to ± 0.2 is a very weak positive /negative or no relationship between the two variables.
Furthermore, we employ the Taylor skill score (TSS) defined by
T S S = 4 ( 1 + R ) 4 ( σ m σ o + σ o σ m ) 2 ( 1 + R 0 ) 4
where R is the pattern correlation coefficient between observation and model data, σ m and σ o are the model and observation standard deviations, respectively, and R 0 is the highest achievable correlation coefficient (we use a threshold of 1) [62,63]. The TSS measures the performance of CMIP6 models in replicating observed precipitation patterns across Southern Africa from the three reference datasets. The TSS is a statistical summary of the R, RMSE, and Stdv, thus providing a single-valued metric. The robustness of the TSS has been reported in several studies (e.g., [22,26,64,65]). A TSS value of 1.0 indicates the best-performing model, while a TSS value close to 0 indicates poor performance. This study also uses the probability distribution functions (PDFs) to evaluate how well the daily precipitation from CMIP6 models matches the observed precipitation distribution with and without bias correction. This statistical method helps determine whether the precipitation patterns simulated by the models align with those observed in the reference data. The PDFs provide valuable insight into the degree of agreement or discrepancy between model outputs and actual observations, aiding in the comprehensive evaluation of model performance.
The comprehensive rating metric (RM) was calculated for each CMIP6 model to assess its overall performance in simulating the mean monthly DJF precipitation across the study area [66,67]. The overall ranks of the CMIP6 GCMs were calculated using the following equation:
M R = 1 1 n . l i = 1 n ( R a n k i K G E + R a n k i T S S )
where l denotes the number of models, n denotes the number of metrics, and i refers to the rank of a GCM based on the ith Kling–Gupta efficiency (KGE) and TSS (Equation (11)). A value of the RM close to 1 refers to a better CMIP6 GCM model in terms of its ability to mimic the spatial characteristics of observations.
The Kling–Gupta efficiency is given by the following:
K G E = 1 ( R 1 ) 2 + ( β 1 ) 2 + ( γ 1 ) 2
where
β = μ m μ o
and
γ = ( σ m μ m ) ( σ o μ o )
and R is obtained from Equation (10), μ m and μ o refer to the mean of the model-simulated and observed data, respectively, and σ m and σ o refer to the standard deviation of the model-simulated and observed data, respectively [66].
In addition, the Kolmogorov–Smirnov (K-S) test was employed to assess the goodness of fit of the reference, native model, and bias-corrected daily precipitation to the gamma distribution [68]. This test calculates the maximum difference between the empirical cumulative distribution functions (ECDFs) of the observed and the fitted gamma cumulative distribution functions (CDFs) of the simulated daily precipitation, as defined by the following:
D l , q = m a x | o b s l ( x ) m o d e l q ( x ) | .
where D l , q is the maximum absolute difference between the CDFs of the observed ( o b s l ( x ) and the fitted gamma distribution of the model ( m o d e l q ( x ) data. The null hypothesis was evaluated at a 5 % confidence level.

3. Results and Discussion

3.1. The Kolmogorov–Smirnov (K–S) Goodness-of-Fit Test

The suitability of gamma distribution for quantile mapping bias correction using CHIRPS precipitation as a reference is assessed using Kolmogorov–Smirnov (K-S) test statistics. The K-S test reveals that precipitation at all grids within the study area fits very well to a gamma distribution with average K-S test statistics of 0.1466 and a null hypothesis (H = 0). We then extended the analysis to the native and bias-corrected precipitation. The Kolmogorov–Smirnov (K-S) test results, presented in Table 2, reveal that the majority of grids with precipitation from the raw CMIP6 model consistently fail to fit the gamma distribution as reflected in the high number of alternative hypotheses (H = 1), accounting for 57% to 71% of the total grid within the study domain. However, after applying bias correction techniques, QDM, QDM95, and SDM, the rejection rate substantially reduced, implying the bias correction has adjusted the departure from the gamma distribution. Notably, QDM consistently outperforms the others, frequently achieving acceptance rates exceeding 70% and demonstrating its effectiveness in refining simulated precipitation. QDM95 also generally improves model performance, with acceptance rates above 50% (except for CM2-SR5), while SDM shows robust performance with acceptance rates between 63% and 81%. The consistently higher acceptance rates of the null hypothesis is achieved by QDM across models, often exceeding 70% of the total grids and yielding lower K-S values indicative of a closer match to observed precipitation distributions. This underscores its reliability as the superior bias correction method for improving precipitation simulations in Southern Africa. This aligns with the findings of Sian et al. [15].

3.2. Seasonal Precipitation Climatology

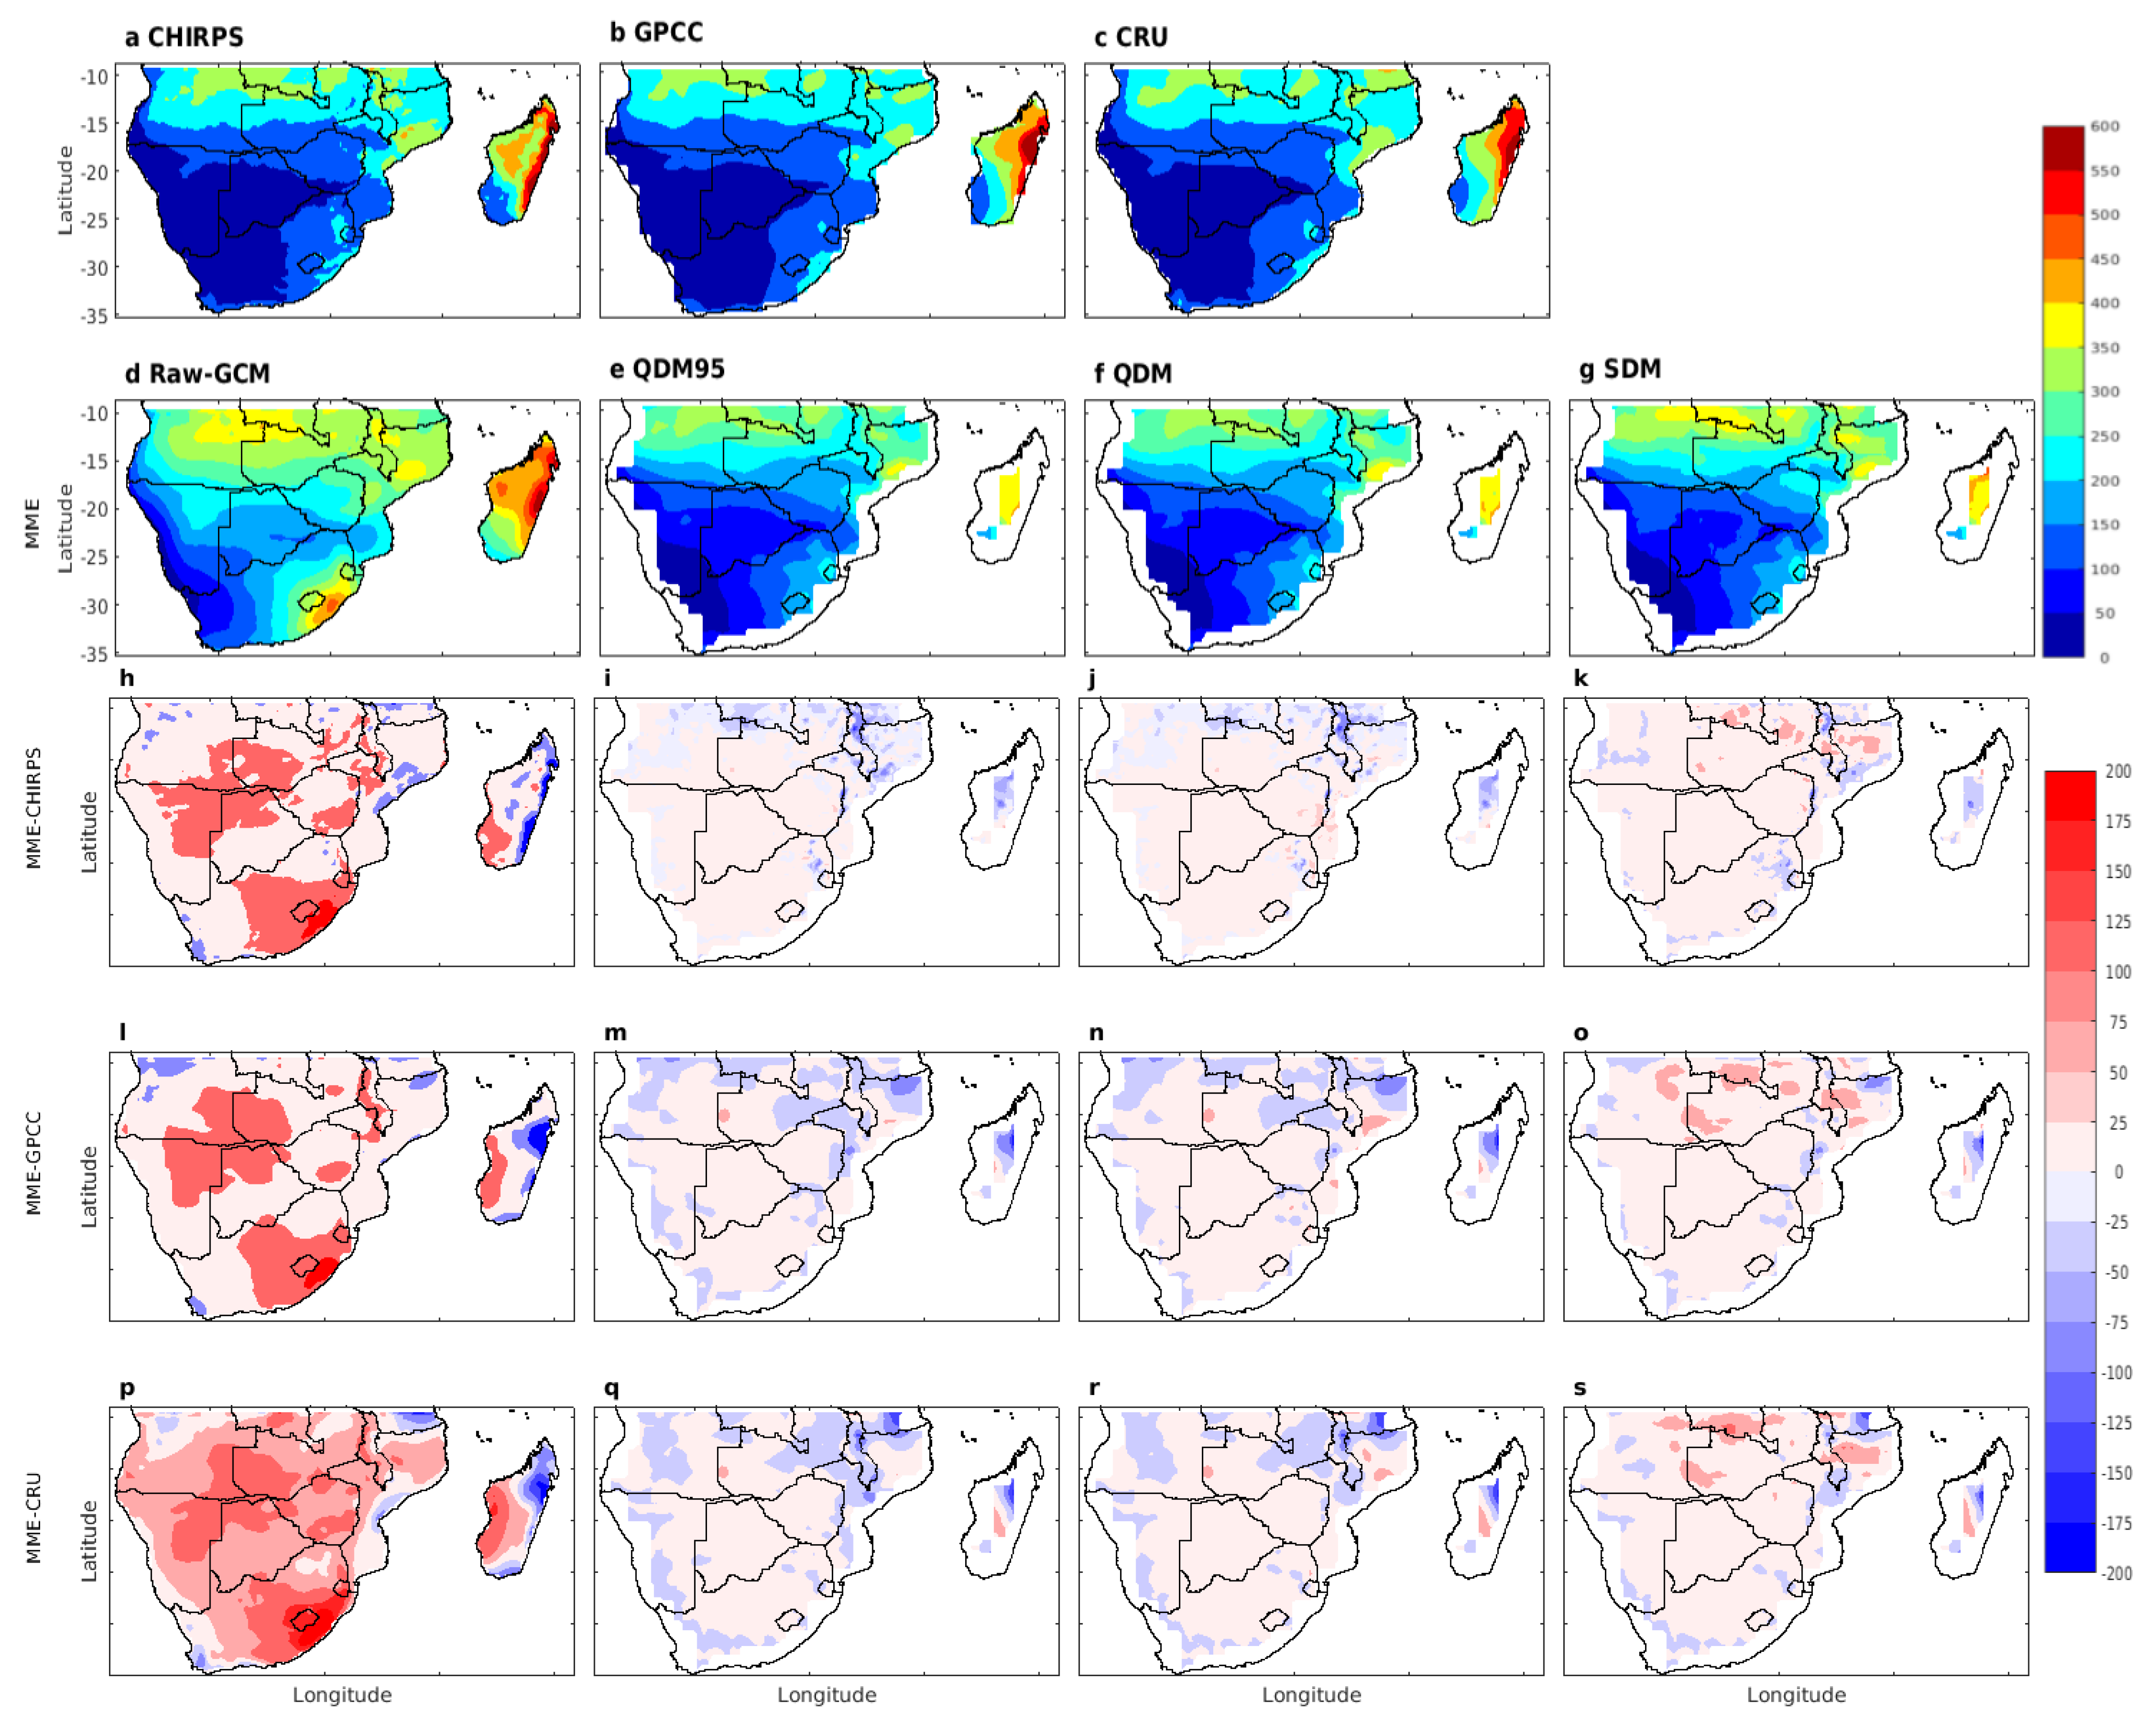
Figure 2 illustrates the mean climatology of DJF-accumulated precipitation, the total sum of daily precipitation within the DJF season, over Southern Africa as captured by the CHIRPS, GPCC, and CRU precipitation datasets. Figure 2a–c show that northern Southern Africa (northward of −15.5° S), northern and central Mozambique, and the eastern half of Madagascar receive the highest precipitation. In contrast, the central and southwestern regions of Southern Africa receive scant precipitation during the DJF season. Although the GPCC (Figure 2b) exhibits a similar spatial pattern in mean precipitation, its magnitude is generally lower than that of CHIRPS and the CRU. Since the bias correction is relative to CHIRPS, this difference in magnitude might also be reflected in the comparison of bias-corrected model precipitation with the GPCC and CRU. All the observation datasets demonstrate that Madagascar has a distinct west-to-east precipitation distribution, with precipitation levels on the eastern side being multiple times higher than those on the western side. This pattern has been reported in previous studies [17,69,70]. This noticeable east–west gradient in precipitation is primarily due to the orographic effect [29] of higher elevation along the central part of the island (Figure 1).
When comparing the multi-model ensemble (MME) means with observations, we found significant differences between the raw GCM output (Figure 2d) and the bias-corrected CMIP6 GCM result (Figure 2e–g) in terms of precipitation magnitude and spatial distribution. Specifically, the raw GCM simulations (Figure 2d) differed significantly from the three observed datasets (Figure 2a–c) in both the magnitude and spatial distribution of the precipitation. The areas in the northern and eastern parts of Southern Africa receiving more than 200 mm/month of DJF precipitation showed the largest differences between the observations and raw GCM simulations. The bias correction techniques (QDM95, QDM, and SDM) have successfully adjusted the raw GCM results to resemble the observations by fixing systematic biases (Figure 2e–g). These techniques have enhanced the accuracy of CMIP6 models by more accurately representing observed precipitation patterns (Figure 2a–c). For instance, regions such as the Lesotho–Eswatini area, coastal Angola, and central Southern Africa, including Madagascar, display noticeable improvements after the application of bias correction techniques (Figure 2e–g).
A comparison of the average seasonal precipitation differences among the three observational datasets and the average results from raw GCM, as well as the three bias-corrected techniques from the CMIP6 simulations, is presented in Figure 2h–s. There are significant overestimations in high-altitude areas such as the Lesotho–Eswatini region, western and central Madagascar, coastal Angola, and central Southern Africa, while there are notable underestimations along the east coast of Madagascar (Figure 2h,l,p). These significant discrepancies highlight the challenges models face in accurately simulating precipitation in complex terrain [31,71]. The extensive areas of under- and overestimation are considerably reduced from 200 mm to ≤50 mm after bias correction compared to CHIRPS, the GPCC, and the CRU (Figure 2i–k, 2m–o, and 2q–s, respectively). For example, Figure 2i–k for MME-CHIRPS indicate a generally lower dry bias across northern Angola and Zambia, central Mozambique, and the east coast of Madagascar when compared to Figure 2m–o,q–s. The MME-GPCC (Figure 2m–o) and MME-CRU (Figure 2q–s) show similar precipitation patterns, with the MME-GPCC exhibiting slightly less dry bias than the MME-CRU but more than MME-CHIRPS (Figure 2i–k). The differences in the bias of the MME of bias-corrected DJF precipitation, relative to the three observation datasets, demonstrate inherent variations among the observations. This is evident in the lower bias relative to CHIRPS compared to the GPCC and CRU. Overall, the ensemble means of precipitation from the three bias-corrected techniques showed consistent improvement in most study areas, except for a few regions.
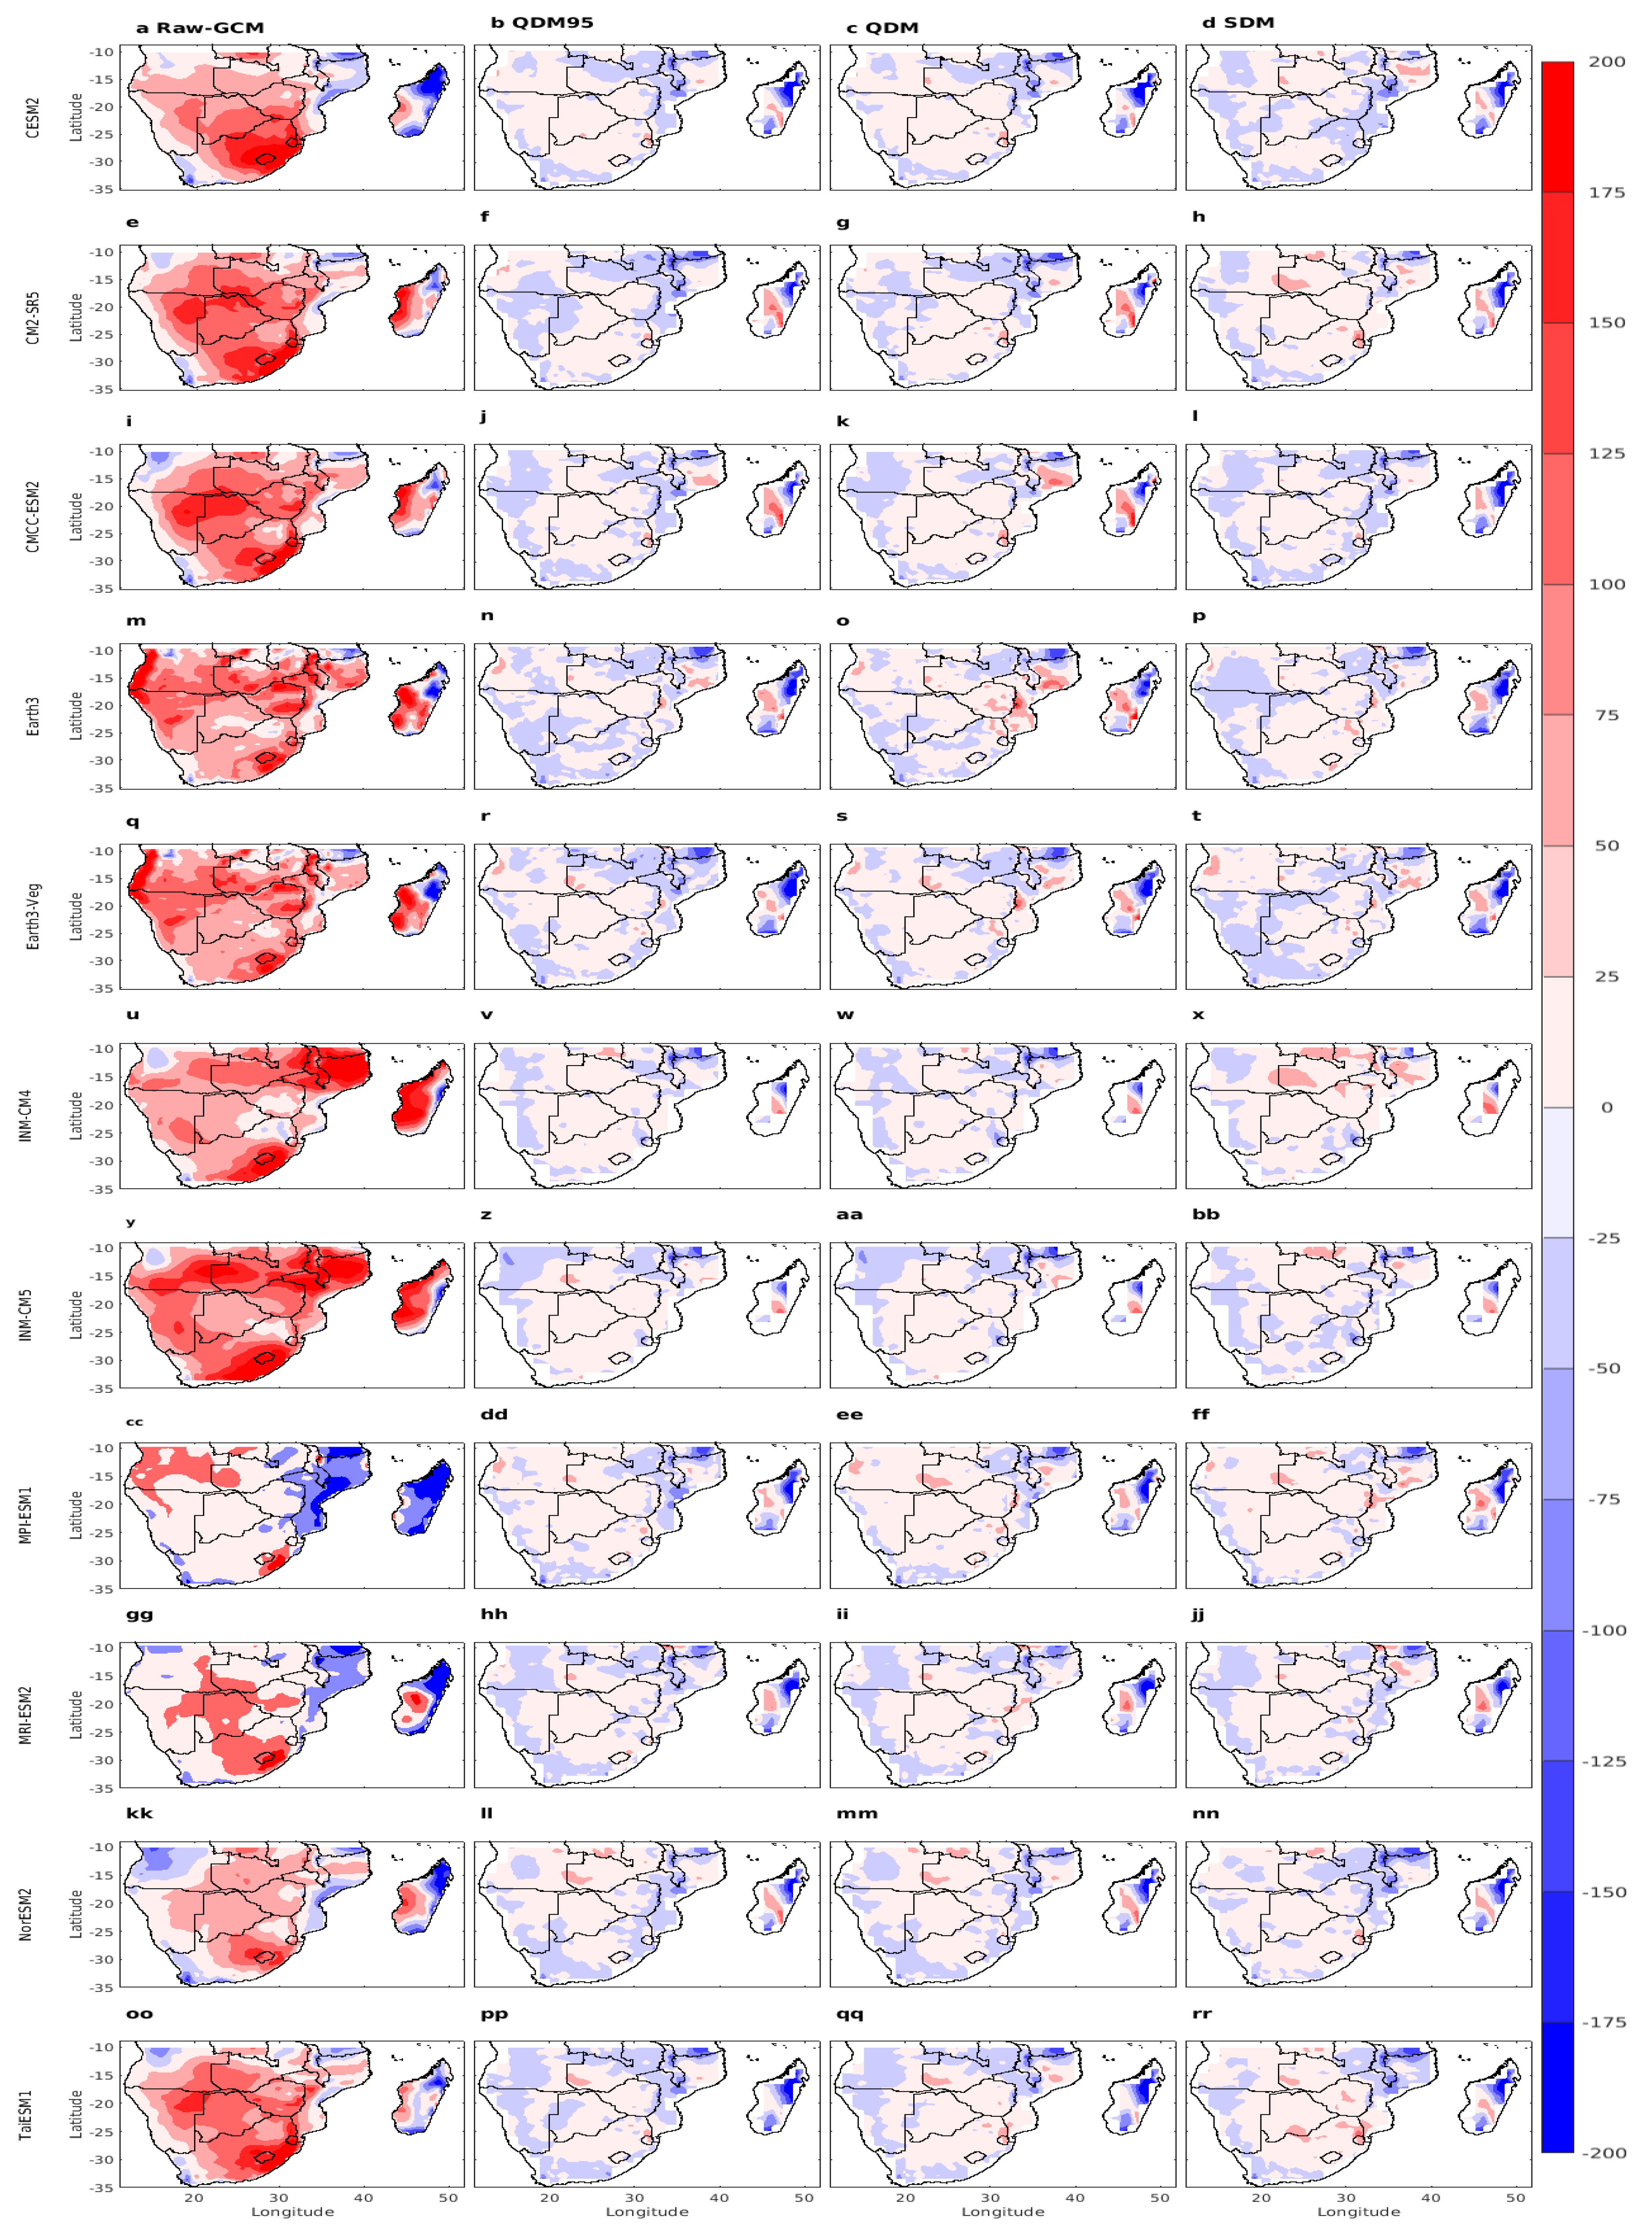
Figure 3 shows the climatological spatial distribution of the mean monthly precipitation during DJF from all eleven CMIP6 models for raw GCM (first column) and the three bias correction techniques (last three columns). The coupled GCM models have captured the observed spatial patterns of precipitation except for wet bias over most parts of the region (Figure 3a,e,i,m,q,u,y,cc,gg,kk,oo). For example, the drier western region of Southern Africa receives less precipitation than the eastern half of Southern Africa and Madagascar. These results agree with the findings of Sian et al. [17], Engelbrecht et al. [31], who found that GCMs generally capture annual precipitation variation apart from the tendency to overestimate, especially in high-elevation areas. However, neither the magnitude nor the spatial distribution of the wet bias among the model is the same. For example, the wet bias over northern Mozambique and Madagascar from INM-CM4 and INM-CM5 (Figure 3u,y) is the highest, reaching as high as twice the climatological mean of DJF. Moreover, the two models do not capture the apparent east–west precipitation gradient over Madagascar in the observation. Specifically, the bias-uncorrected CMIP6 models (Figure 3a,e,i,m,q,u,y,cc,gg,kk,oo) simulated significantly overestimated precipitation over the northern half of Southern Africa, coastal Angola, Lesotho, Eswatini, Mozambique, and Madagascar relative to the three observation datasets in Figure 2a–c. Similar overestimations have been reported in earlier studies, where GCMs tend to misrepresent orographic and convective rainfall, particularly in regions with complex topography and strong mesoscale dynamics [71]. The three bias correction techniques (QDM95, QDM, and SDM) were able to replicate the precipitation from the CMIP6 GCM models (Figure 3, columns 2–4) quite accurately across most of Southern Africa, except Madagascar. In Madagascar, the bias correction did not produce satisfactory results. This could be attributed to limitations in correcting biases where model error stems from structural rather than statistical sources [72]. All three bias correction techniques (QDM95, QDM, and SDM) effectively reduced the mean precipitation values in the CMIP6 GCM models, making them comparable with the observed values, unlike the original raw models. Specifically, QDM95 and QDM reduced the wet bias over Madagascar and the coastal regions. Additionally, QDM reduced the wet bias in precipitation in northern Southern Africa. SDM led to the most uniform precipitation distribution across the region. Sian et al. [15] also used the quantile mapping using gamma distribution to correct bias in the daily precipitation estimates from different sets of CMIP6 models over Southern Africa. Their findings indicated an improvement in the bias-corrected precipitation across Southern Africa consistent, for the large part, with our findings. Precipitation processes are often subject to shifting statistical properties over time, driven by changes in circulation patterns, land–atmosphere interactions, and anthropogenic forcings [73]. Such nonstationarity poses challenges for bias correction methods that assume a stable statistical relationship between model simulations and observations across historical and future periods. In this regard, the quantile delta mapping approaches, which allow for change-preserving adjustments, are generally preferred for climate impact studies [74] or more complex approaches involving nonstationary QM (NS-QM) and its simplified version, consistent nonstationarity patterns (CNS-QM) [75].

3.3. Mean Seasonal Cycle Precipitation

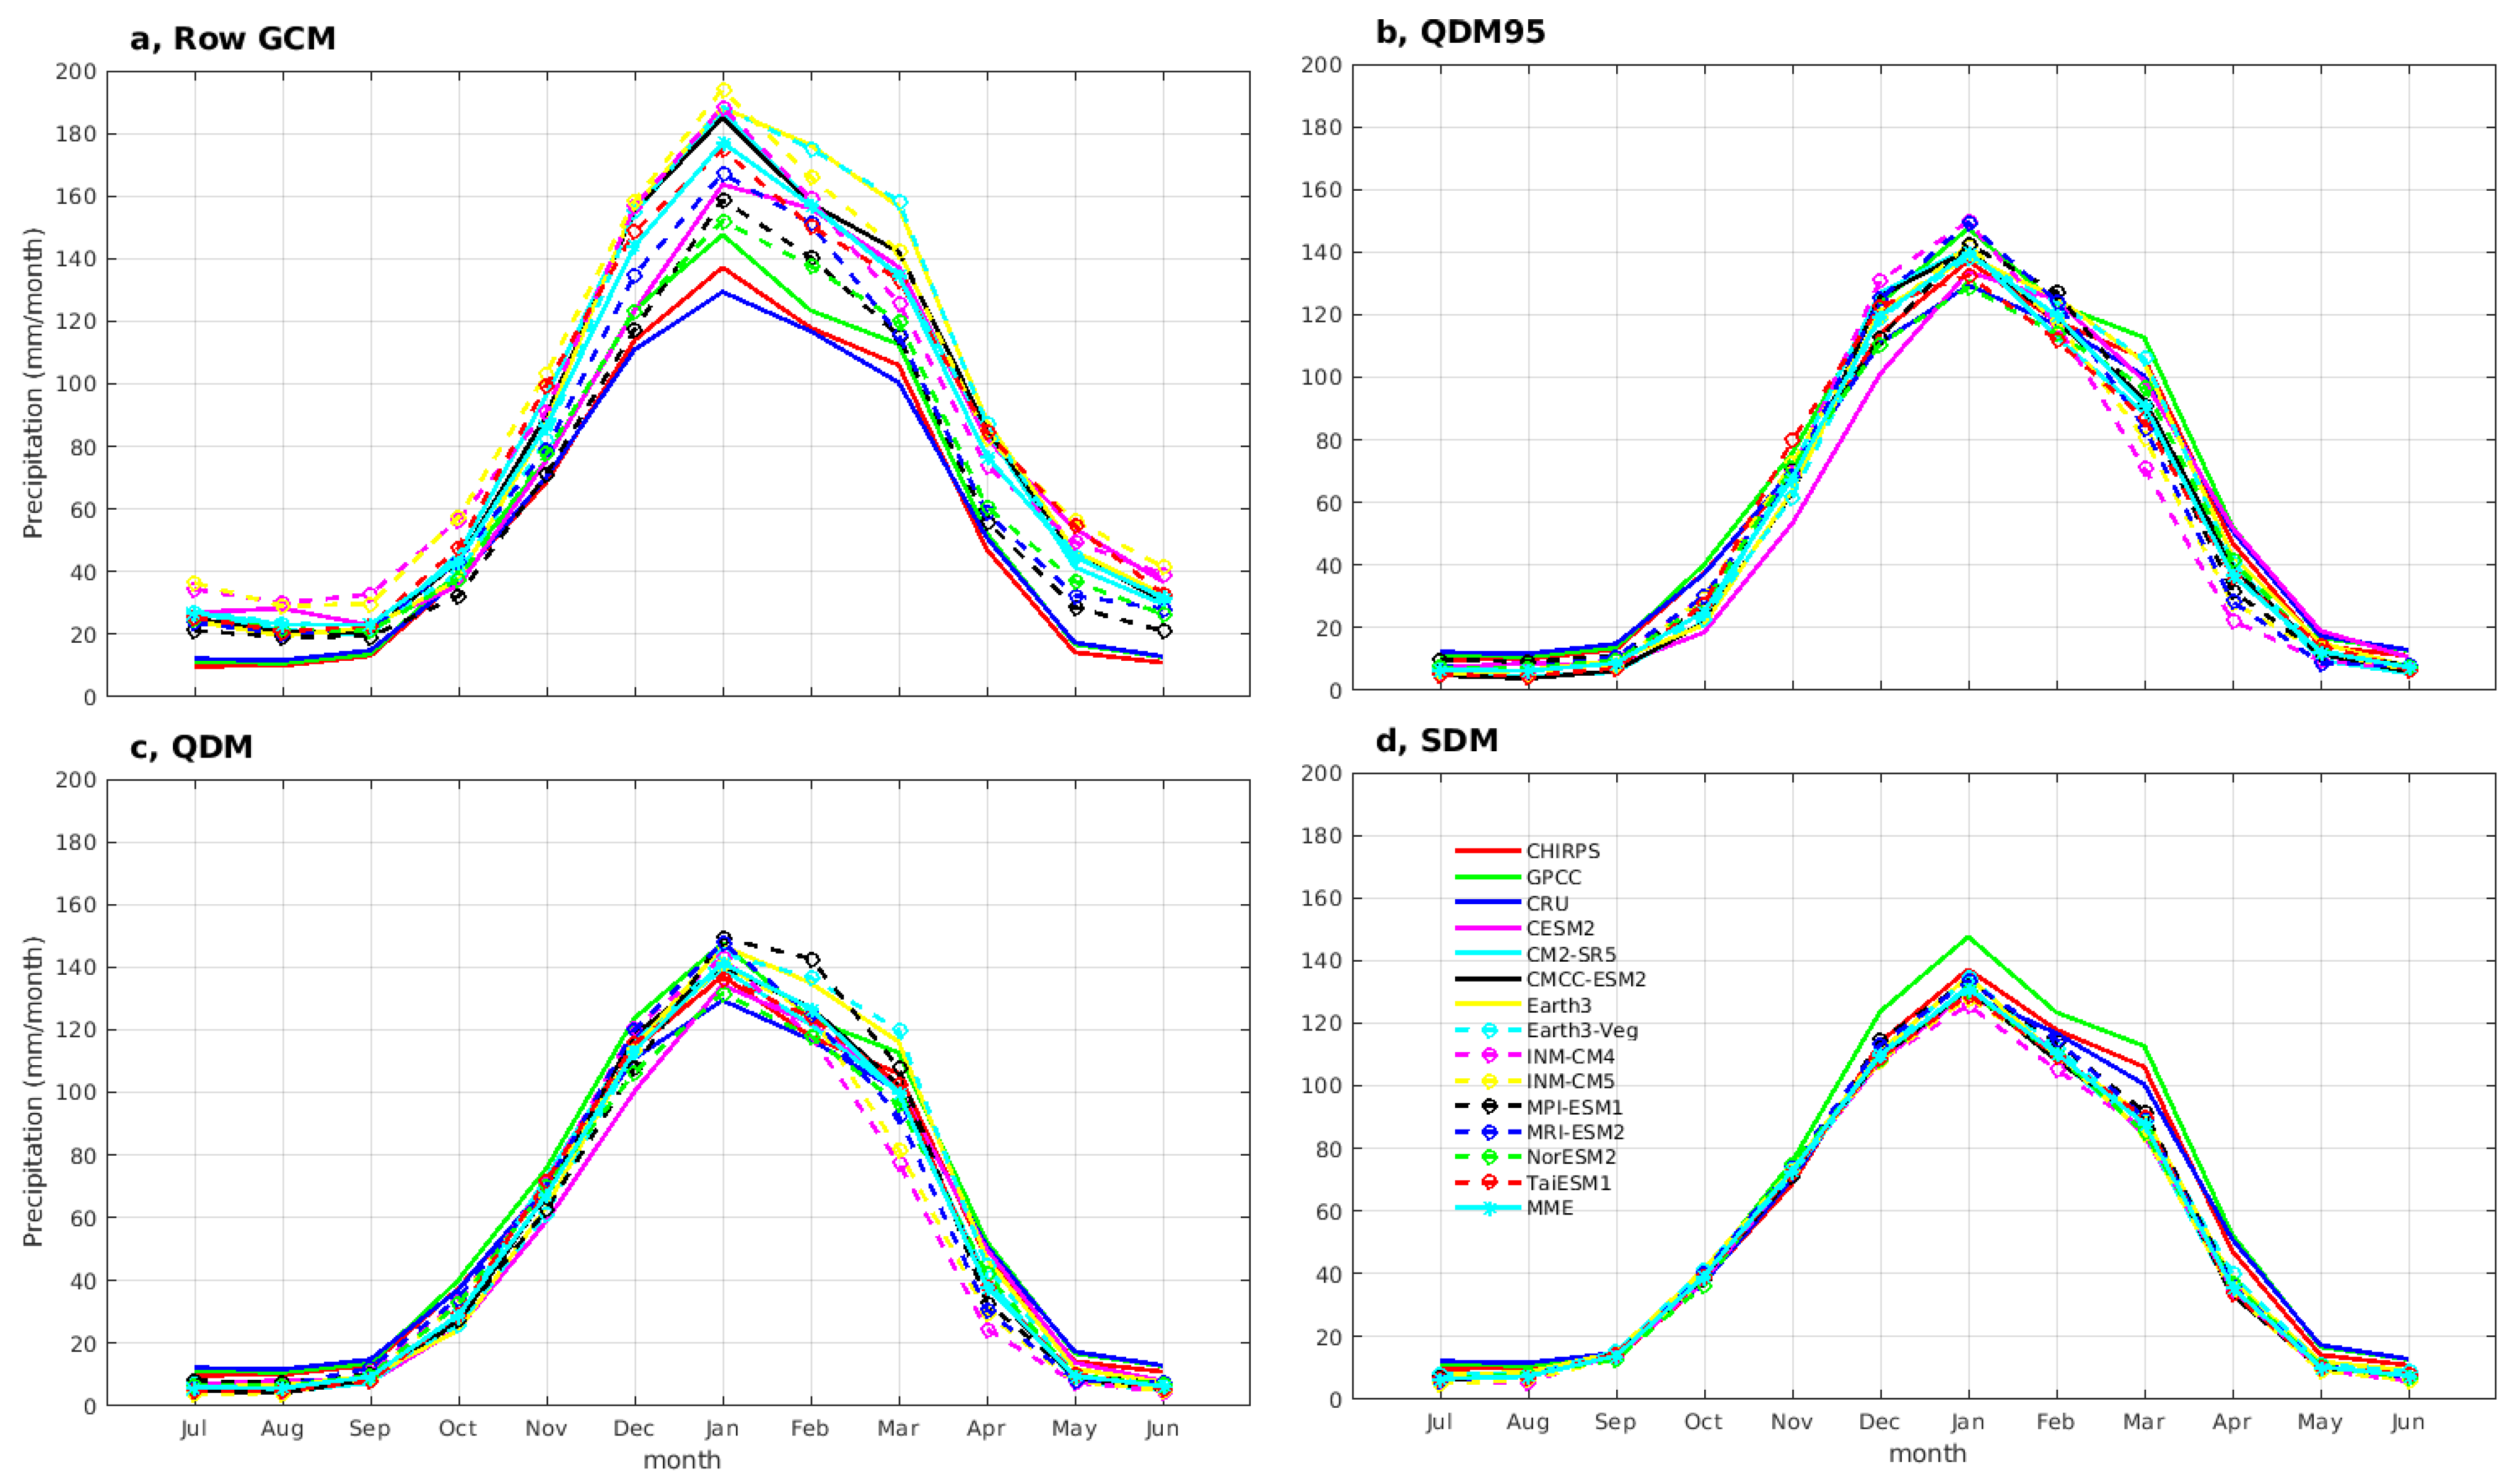
Figure 4 represents the annual cycle of precipitation over Southern Africa, based on data from CHIRPS, the GPCC, and the CRU, as well as raw GCM (bias uncorrected) and the three bias-corrected CMIP6 GCMs. All the CMIP6 models can replicate the observed precipitation annual cycle over the study area, regardless of bias correction. All the raw models and bias correction techniques indicate that the peak precipitation occurs in January across the study region, which is consistent with the observations. This finding is consistent with the conclusions reported by Dosio et al. [76] for western and eastern Southern Africa, by Karypidou et al. [77] for Southern Africa, and by Samuel et al. [28] for the four major river basins in Southern Africa. However, the magnitude of the peak precipitation varies between 129 and 194 mm/month. CHIRPS and the GPCC exhibit the highest precipitation amount, reaching 137 and 147 mm/month, respectively, in January, while the CRU exhibits the lowest precipitation amount (129 mm/month) in January. The precipitation dataset from raw GCM and the three bias correction techniques capture the uni-modal distribution of precipitation over Southern Africa. However, there are significant discrepancies in the magnitude of precipitation and spread.
All the CMIP6 models can capture the dry period, which starts in May and extends through to approximately the end of October (MJJASO), as reported by Libanda and Nkolola [78] for Malawi and Weber et al. [55], for southwestern Southern Africa and Botswana. The rainy season starts in November and extends through to approximately the end of March (NDJFM). All the bias-corrected CMIP6 precipitation data align more closely with the observations than the bias-uncorrected CMIP6 precipitation, especially during the DJF season. This indicates that applying bias correction techniques to CMIP6 model simulations enhances the agreement between the model simulations and precipitation datasets from CHIRPS, the GPCC, and the CRU. However, it is essential to note that CHIRPS is dry-biased against the GPCC and wet-biased against the CRU during DJF (Figure 4). Bias correction using CHIRPS as a reference may, therefore, contribute to the overall bias of models relative to the CRU and GPCC. It is also evident from (Figure 4) that SDM produced a more compact seasonal cycle than QDM and QDM95 for all the models, implying better performance in replicating the observed seasonal cycle than the QM approach.

3.4. Performance of Bias-Corrected and Corrected CMIP6 GCM Models in Simulating Observed CHIRPS, GPCC, and CRU Precipitation

3.4.1. Bias

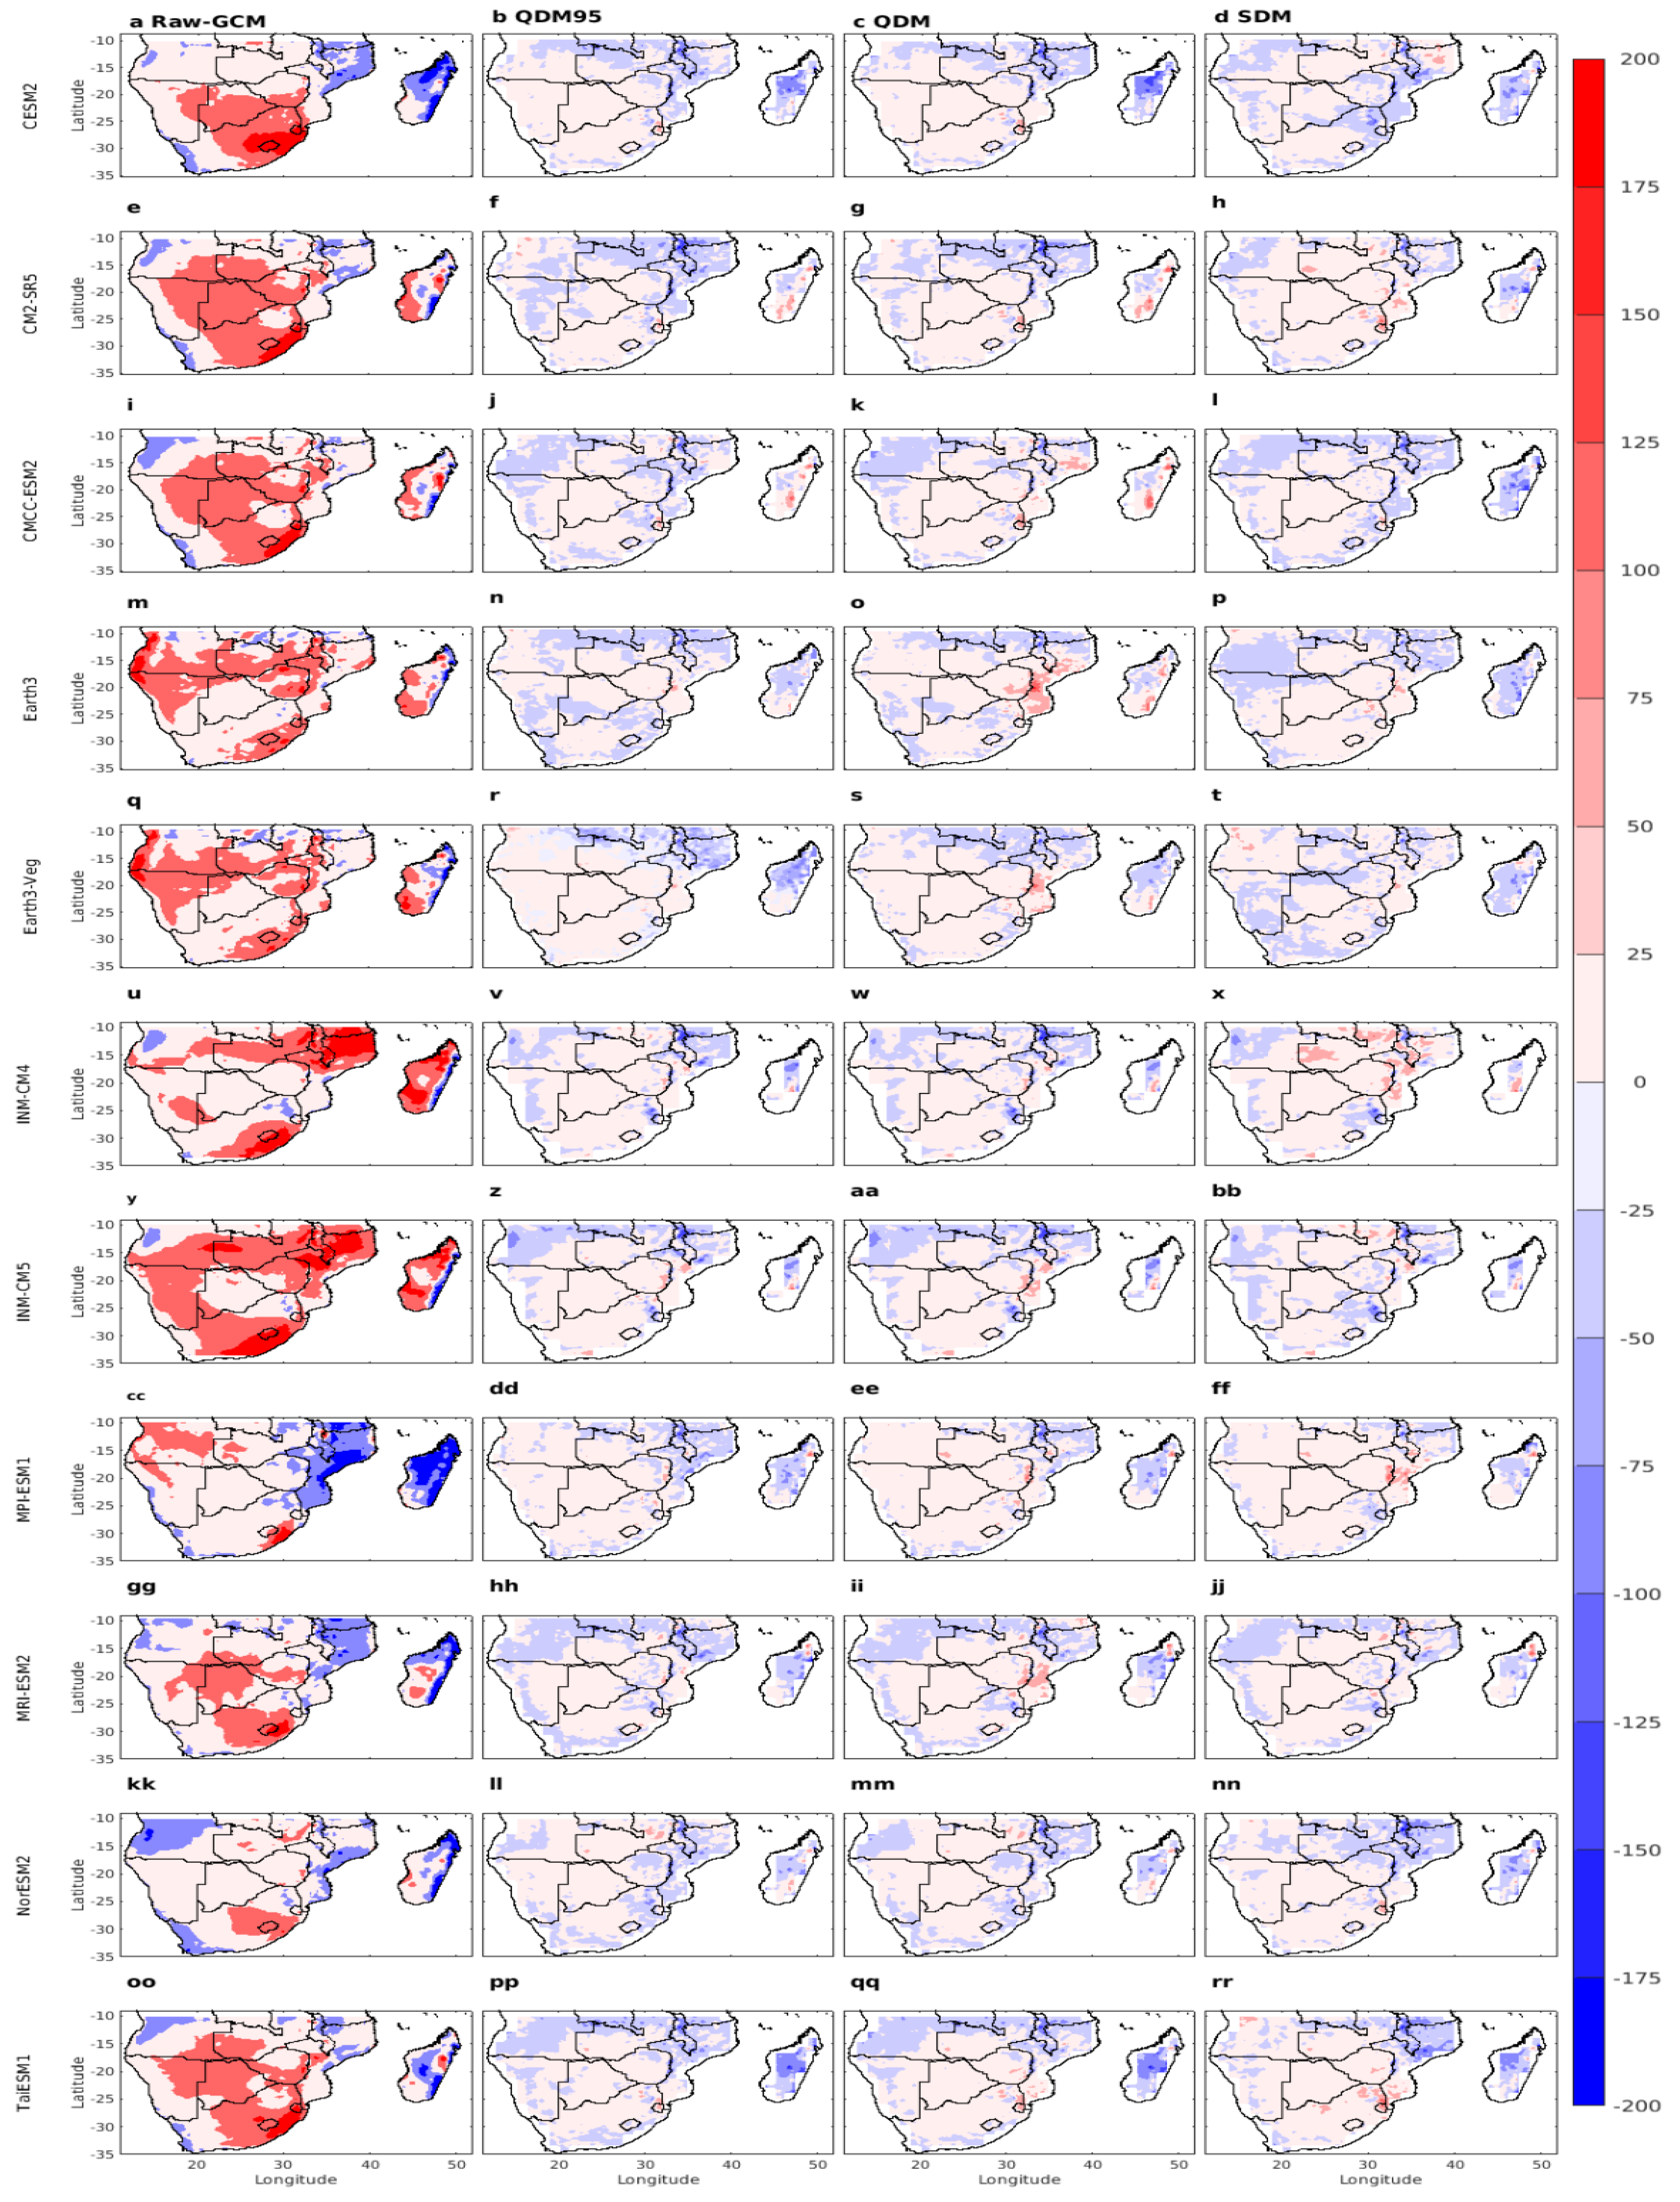
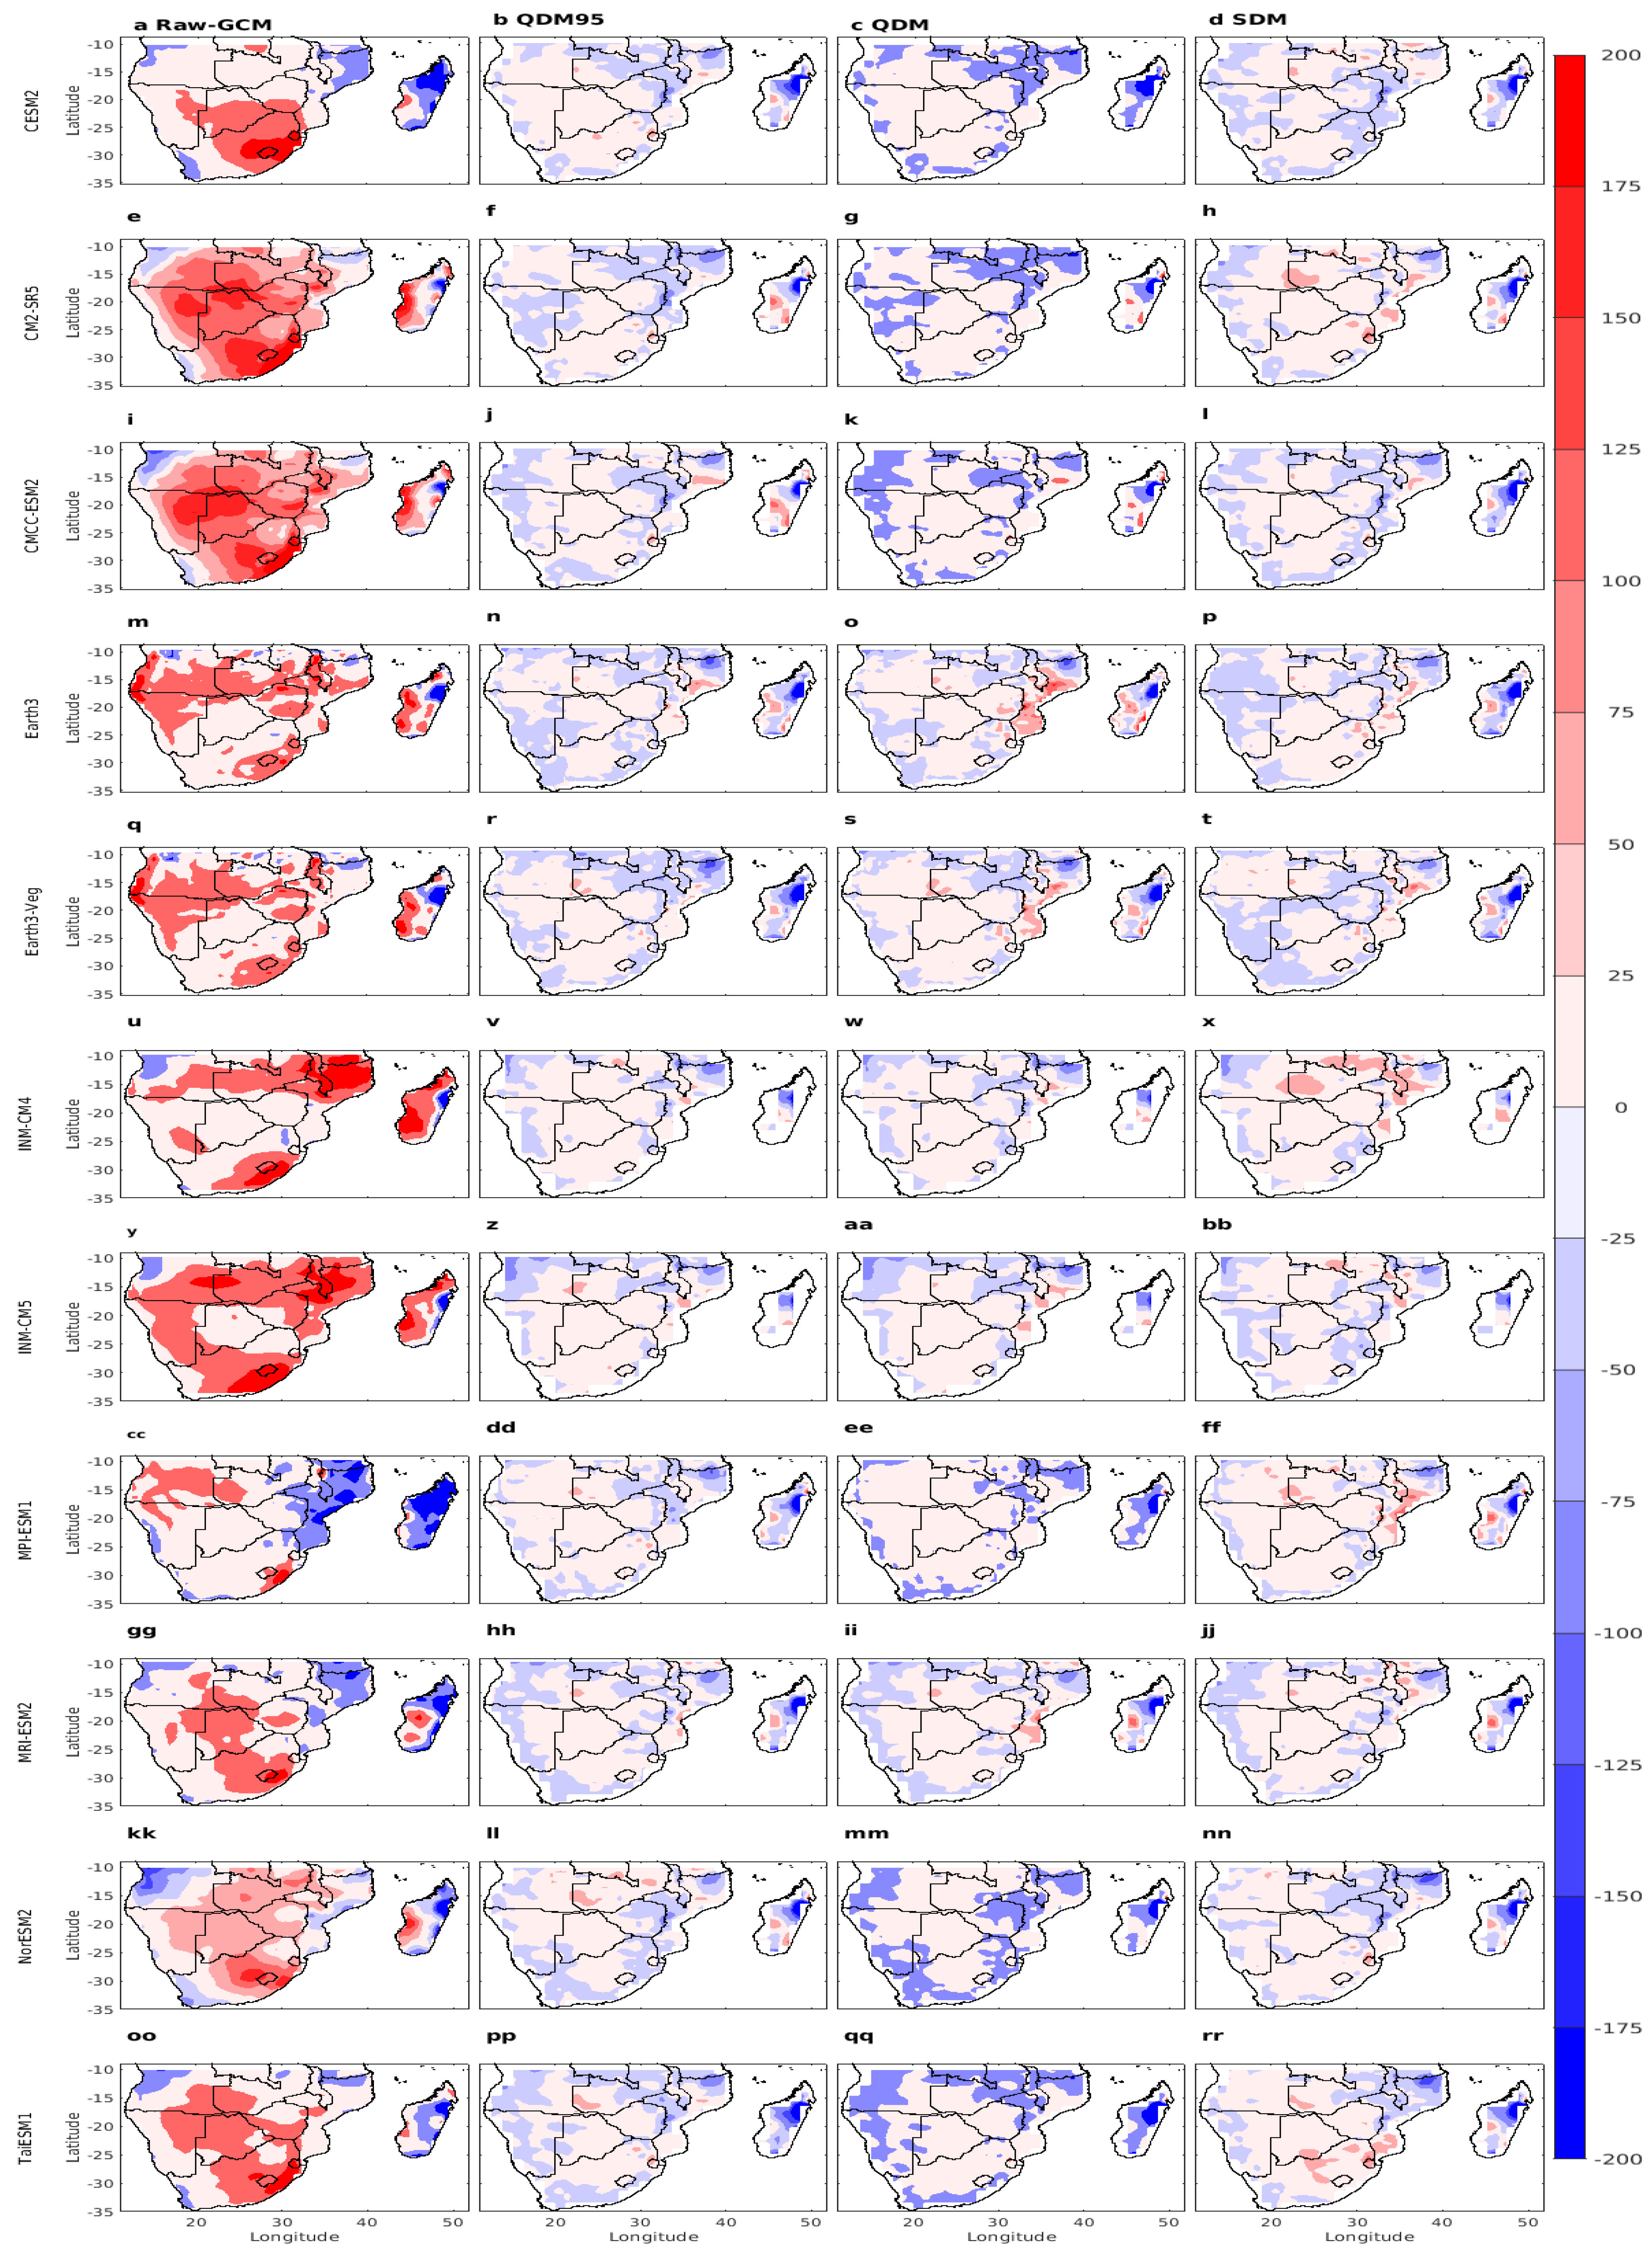
Figure 5, Figure 6 and Figure 7 present the mean DJF precipitation bias for eleven CMIP6 models relative to three observational datasets (viz., CHIRPS, the GPCC, and the CRU). The bias-corrected models show substantial reductions in the bias of precipitation relative to CHIRPS (Figure 5, second, third, and fourth columns) compared to precipitation from raw-GCM (bias-uncorrected) models (Figure 5, first column) over most of Southern Africa. For instance, the CESM2, CM2-SR5, and CMCC-ESM2 models simulate precipitation with a wet bias between 75 and 125 mm over Botswana, the adjoining countries, and central and southeastern South Africa (Figure 5, first column). However, this is reduced to less than 40 mm after the three bias correction techniques over Botswana (Figure 5, second, third, and fourth columns). Similarly, EC-Earth3 and EC-Earth-Veg significantly reduced bias from 75–125 mm to less than 25 mm in wet bias over northern Botswana, the adjoining border areas, and southeastern South Africa. Additionally, dry bias in the range of 125 to 200 mm from the MPI-ESM1 and MRI-ESM2 models over Mozambique and the adjoining areas has been reduced to dry bias between 50 and a maximum of 100 mm. Similarly, dry bias in the range of 75 to 150 from the NorESM2 and TaiESM1 models over northern Angola and the adjoining areas has been reduced to dry bias between 25 and a maximum of 50 mm.
It is crucial to examine the difference between CHIRPS and the other two observational datasets before evaluating the differences between bias-corrected models and the GPCC or CRU, given the correction was performed using CHIRPS as a reference. The difference between the observations can be seen from the mean climatology (Figure 2a–c) as well as from the bias of the native model precipitation relative to the observations (Figure 5, Figure 6 and Figure 7, first column). Over most of Southern Africa, there is no discernible difference in model bias relative to CHIRPS and the GPCC across all the models, except for CM2-SR5, CMCC-ESM2, EC-Earth3, and INM-CM5. However, in some isolated areas, the biases of these models relative to the GPCC differ significantly. Similarly, in most of the study areas, the precipitation biases in all the raw GCMs, except for MPI-ESM1, MRI-ESM2, and NorESM2, differ significantly relative to the CRU. Therefore, these discrepancies between observations are likely to add up to the bias of the models relative to the GPCC and CRU. For example, the bias of most bias-corrected models relative to the GPCC (second, third, and fourth columns) shows the dry bias of 25 to 100 mm over the southern half of Nambia, coastal Angola, Malawi, northern Mozambique, and the western and southern border areas of South Africa. The bias-corrected CMIP6 models have consistently uniform (i.e., except Figure 6c,g,k,ee,qq) performance relative to CHIRPS and the GPCC over regions where the bias is dry after correction. A notable difference in models relative to CHIRPS and the GPCC is over isolated places in Botswana, Zambia, and the adjoining areas where the models are wet-biased even after bias correction. Furthermore, the three bias-corrected CMIP6 precipitations reveal more dry bias in most of Southern Africa relative to the GPCC precipitation (Figure 6, second, third, and fourth columns), while the raw GCM (bias-uncorrected) CMIP6 precipitation exhibits a substantial wet bias over Southern Africa relative to the GPCC (Figure 6, first column, except the MPI-ESM1 and MRI-ESM2 models). Similarly, a significant decrease in the bias of precipitation from the models relative to the CRU (Figure 7, second, third, and fourth columns) compared to precipitation from the bias-uncorrected models (Figure 7, first column) is observed over most of Southern Africa.
The precipitation from most of the native CMIP6 models display wet biases across most of Southern Africa, with few dry biases, notably over Mozambique, according to the MPI-ESM1, MRI-ESM2, and NorESM2 models (Figure 5, Figure 6 and Figure 7, first column). In particular, most raw-GCM (bias-uncorrected) CMIP6 models exhibit a consistently significant wet bias over Lesotho, the southeast coastal region, and the TRB region centered at 15° S of Southern Africa. These considerable differences have been reported as a challenge for models to accurately simulate precipitation over complex areas [31,71]. Furthermore, Diallo et al. [79] and Samuel et al. [28] have linked the observed wet bias over Lesotho and the southeastern coastal region of Southern Africa to the overestimation of southerly wind flux and the influence of intricate topography on convective processes. More specifically, the extent of overestimation over Lesotho and southeastern coastal Southern Africa is significantly greater in native CMIP6 models compared to bias-corrected ones.
A comparison of the performance of QDM, QDM95, and SDM in reducing bias relative to CHIRPS showed that the two QDM approaches produced similar spatial patterns of bias across the region. In contrast, SDM displayed a distinct bias pattern across the region (Figure 5, columns 2–4). This is observed in the form of a dry bias over the northern parts of Southern Africa in most models when QDM and QDM95 are applied, which is in contrast to a wet bias under SDM bias correction. The similarity of bias patterns of bias-corrected precipitation relative to the GPCC using QDM and QDM95 is also notable. However, the magnitude of the bias, particularly the dry bias under QDM, is far greater than that of QDM95 (Figure 6, columns 2–4). SDM exhibits notable differences in the bias patterns relative to the GPCC with the two bias correction techniques over areas mostly north of Botswana. The relative performance of the three techniques in terms of minimizing model precipitation relative to the CRU precipitation shows that QDM and QDM95 are comparable with some variation among the models, whereas SDM is distinct from the two over some areas and consistent among the models.
Overall, the comparison reveals a substantial reduction in precipitation bias in the three bias-corrected techniques of the CMIP6 models relative to CHIRPS. Furthermore, the analysis shows that the three bias-corrected models had a significantly lower precipitation bias than the GPCC and CRU observations, indicating the importance of bias correction in accurately representing precipitation spatial patterns. In summary, QDM95, QDM, and SDM are effective techniques that can significantly reduce the precipitation biases in the native models. The bias-corrected results can be used for regional climate change analysis and climate impact assessment in Southern Africa.

3.4.2. Distribution of Probability Density Functions (PDFs)

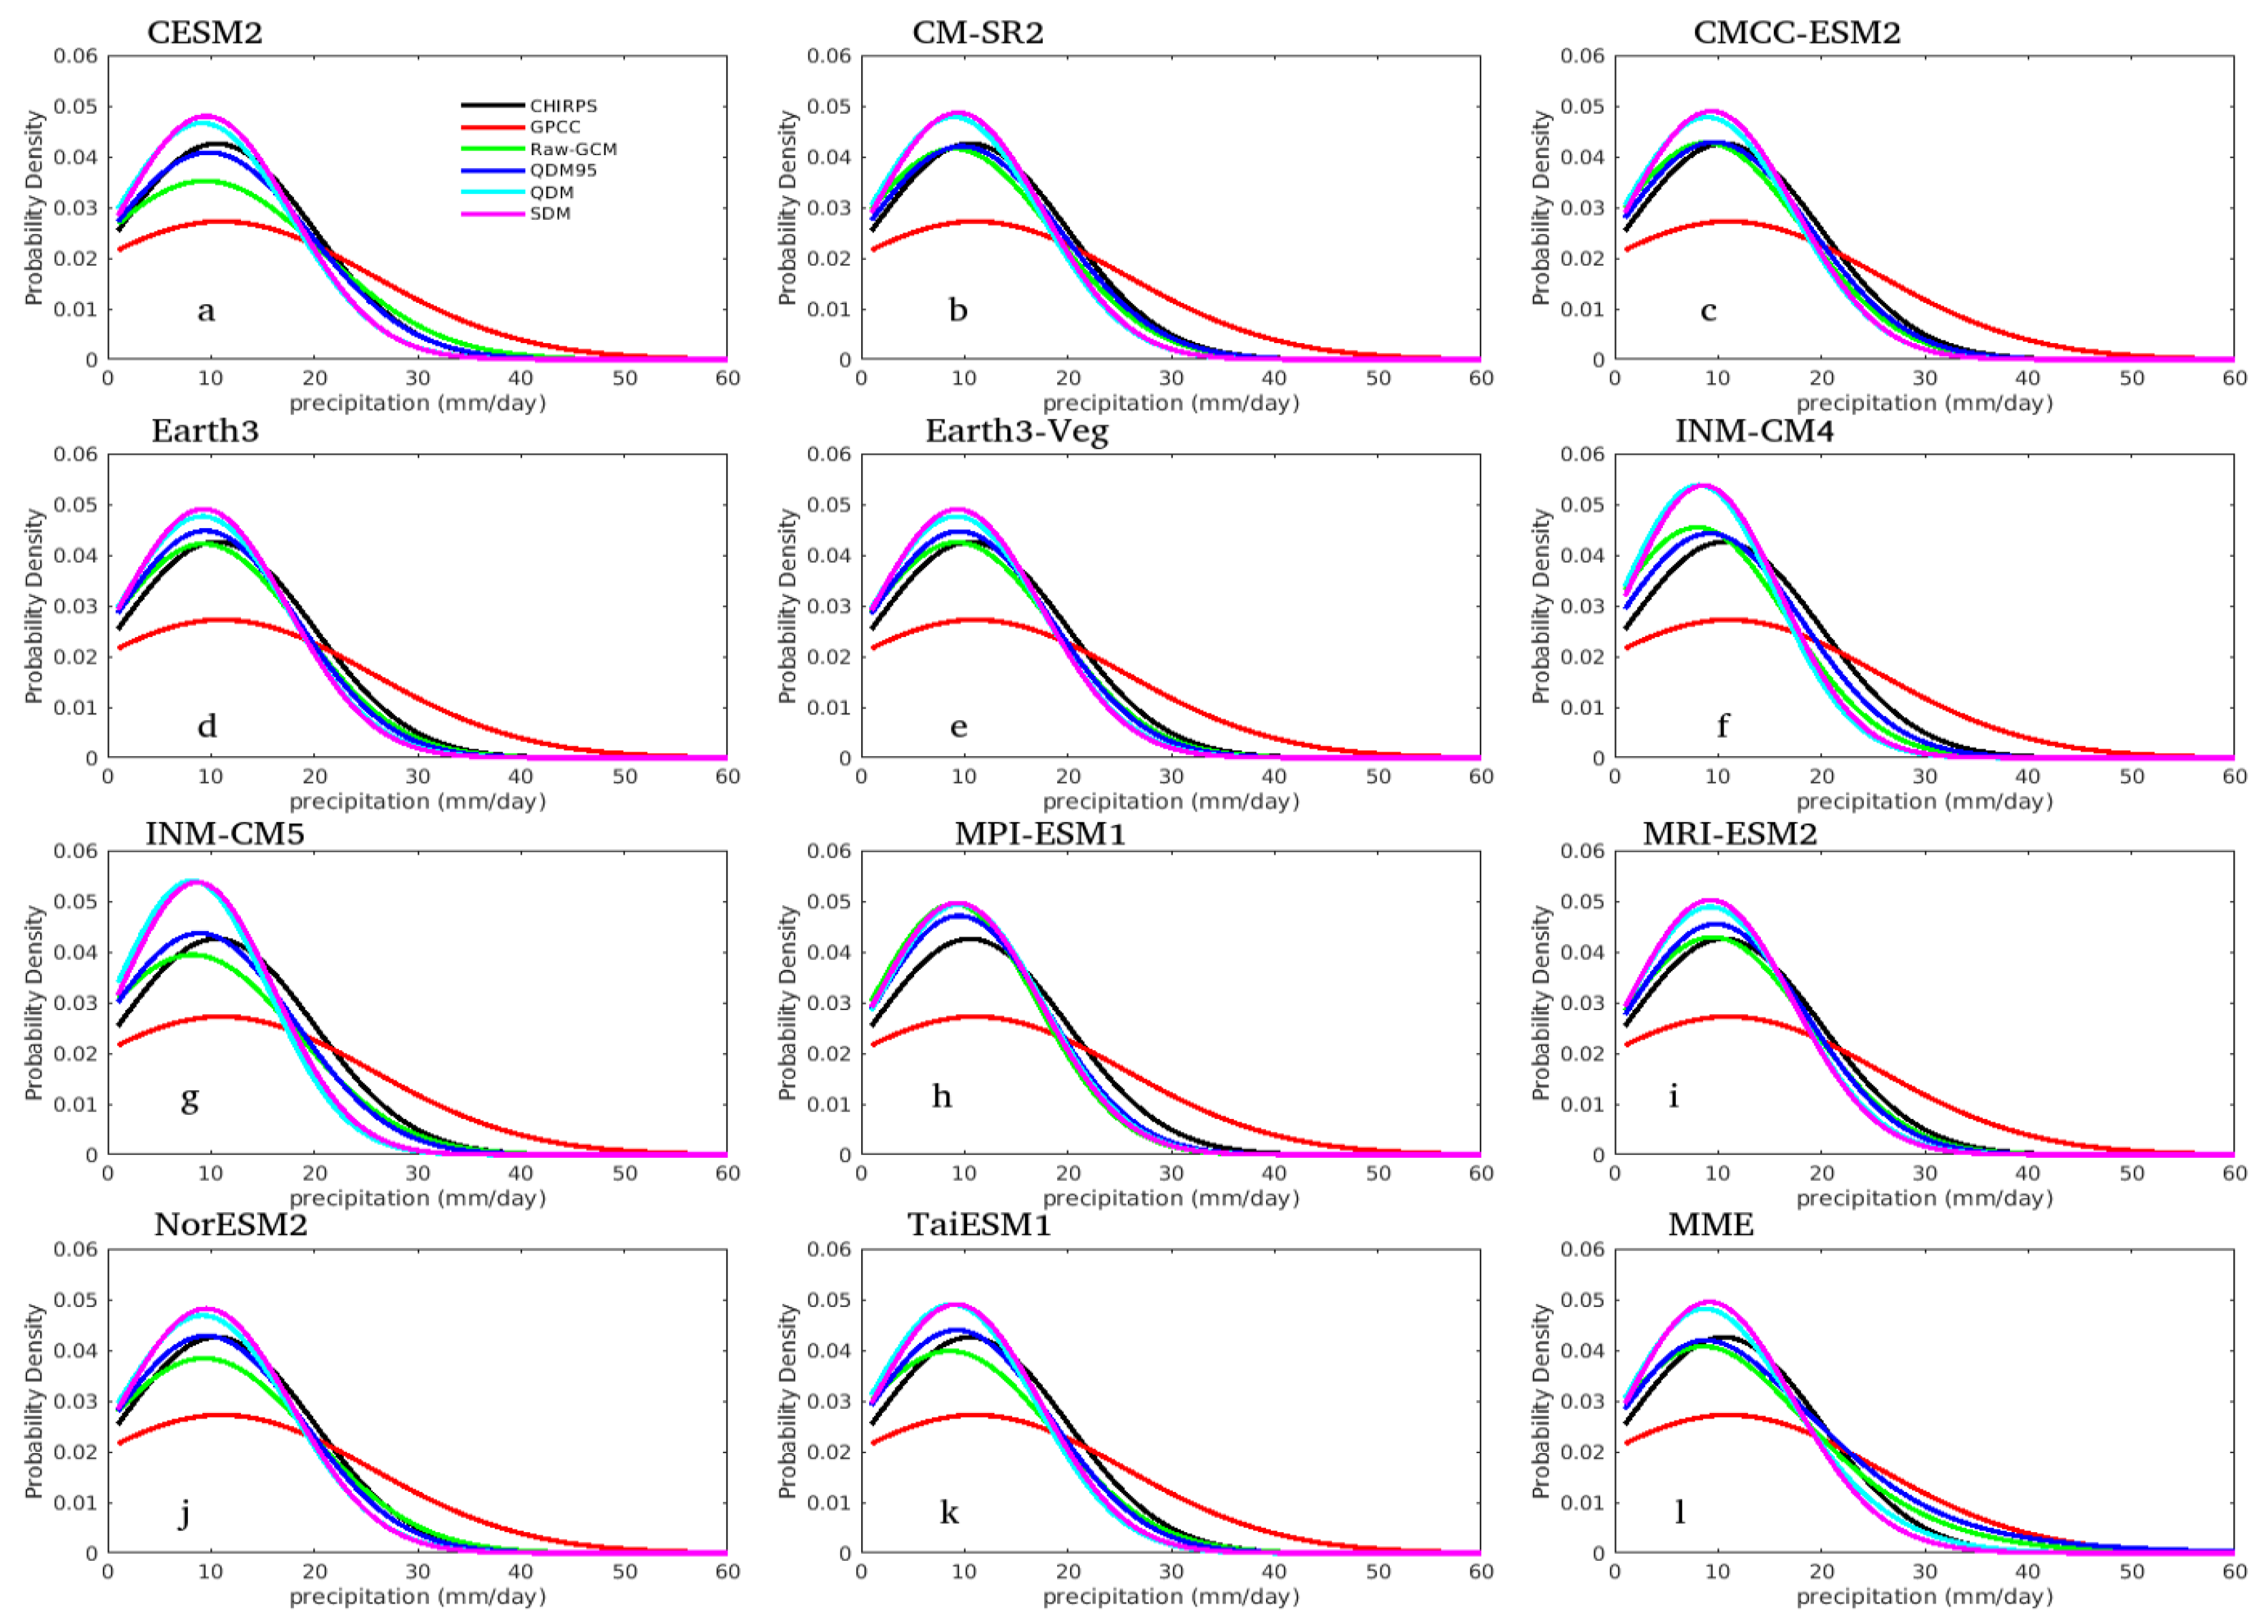
Southern Africa is characterized by high precipitation variability, with a peak during the DJF season [56]. Examining the PDFs for DJF precipitation allows us to capture the full range of variability, including extreme events and dry spells that can significantly impact the region [32]. Figure 8 shows the PDF plots of the observed, bias-uncorrected, and corrected precipitation for each CMIP6 GCM model over Southern Africa. The distribution aids in understanding the performance of each technique, especially for studying the variability in precipitation events. We compared the DJF precipitation PDFs from the CMIP6 GCM models to two daily precipitation datasets, CHIRPS and the GPCC, using both bias-uncorrected and corrected simulations. A comparison of the GPCC and CHIRPS reveals substantial differences in the PDFs across Southern Africa, particularly concerning their peaks and lower and higher extremes (Figure 8). At the lower extreme, particularly for precipitation amounts less than 20 mm/day, the GPCC consistently underestimates precipitation compared to CHIRPS. Conversely, at the higher extreme, where precipitation exceeds 23 mm/day, the GPCC tends to overestimate precipitation relative to CHIRPS. Furthermore, at the peak probability, which corresponds to the most frequent precipitation amounts, the GPCC shows lower values than CHIRPS. This underestimation (overestimation) suggests that CHIRPS captures light-to-moderate precipitation events more accurately than the GPCC, while the GPCC tends to overestimate heavy precipitation events.
Some uncorrected models show deviations from the observed PDF. However, all three bias correction techniques effectively adjusted the PDF’s shape, albeit in different ways. The corrected precipitation successfully captured the observed precipitation corresponding to the probability peaks, aligning with CHIRPS and the GPCC precipitation curve in the low-precipitation range (Figure 8). At the lower extreme, particularly for precipitation amounts less than 3 mm/day, most native GCMs (bias uncorrected) and the three bias-corrected CMIP6 models tend to overestimate precipitation compared to CHIRPS and the GPCC. Conversely, at the higher extreme, where precipitation exceeds 13 to 35 mm/day, both bias-uncorrected and bias-corrected techniques tend to underestimate precipitation relative to CHIRPS and the GPCC. Additionally, at the peak probability, corresponding to the most frequent precipitation amounts, both bias-uncorrected and bias-corrected precipitation show higher values than CHIRPS and GPCC. Figure 8l shows that the bias-corrected multi-model ensemble (MME) of the CMIP6 models overestimates precipitation at the lower extremes by 1 to 9.9 mm/day compared to CHIRPS and the GPCC. Similarly, the Raw-GCMs overestimate precipitation by 1 to 7 mm/day relative to CHIRPS and the GPCC. At higher extremes, except for NorESM2 (Figure 8j), all the native and bias-corrected models consistently underestimate precipitation by 15 to 40 mm/day compared to CHIRPS. NorESM2’s raw GCM begins to overestimate precipitation starting at 27 mm/day, continuing up to 50 mm/day. However, all the models underestimate precipitation relative to the GPCC at higher extremes, with values ranging from 21 to 50 mm/day. Furthermore, the precipitation corresponding to the peak probability remains around 10 mm/day for all the bias correction and uncorrected precipitation relative to CHIRPS. After bias correction using QDM95, most CMIP6 models show a closer alignment with CHIRPS and the GPCC in the 3–35 mm/day range, indicating better performance in adjusting the frequency of moderate precipitation events. All three bias correction techniques performed well in correcting precipitation across all the CMIP6 models. The result demonstrates that the performance of bias correction techniques relies on their ability to correct the central tendencies of daily precipitation (such as the mean) and the extremes in the tails of the distribution (including very light and very heavy precipitation).

3.4.3. Region-Wide Aggregated Performance of CMIP6 Models

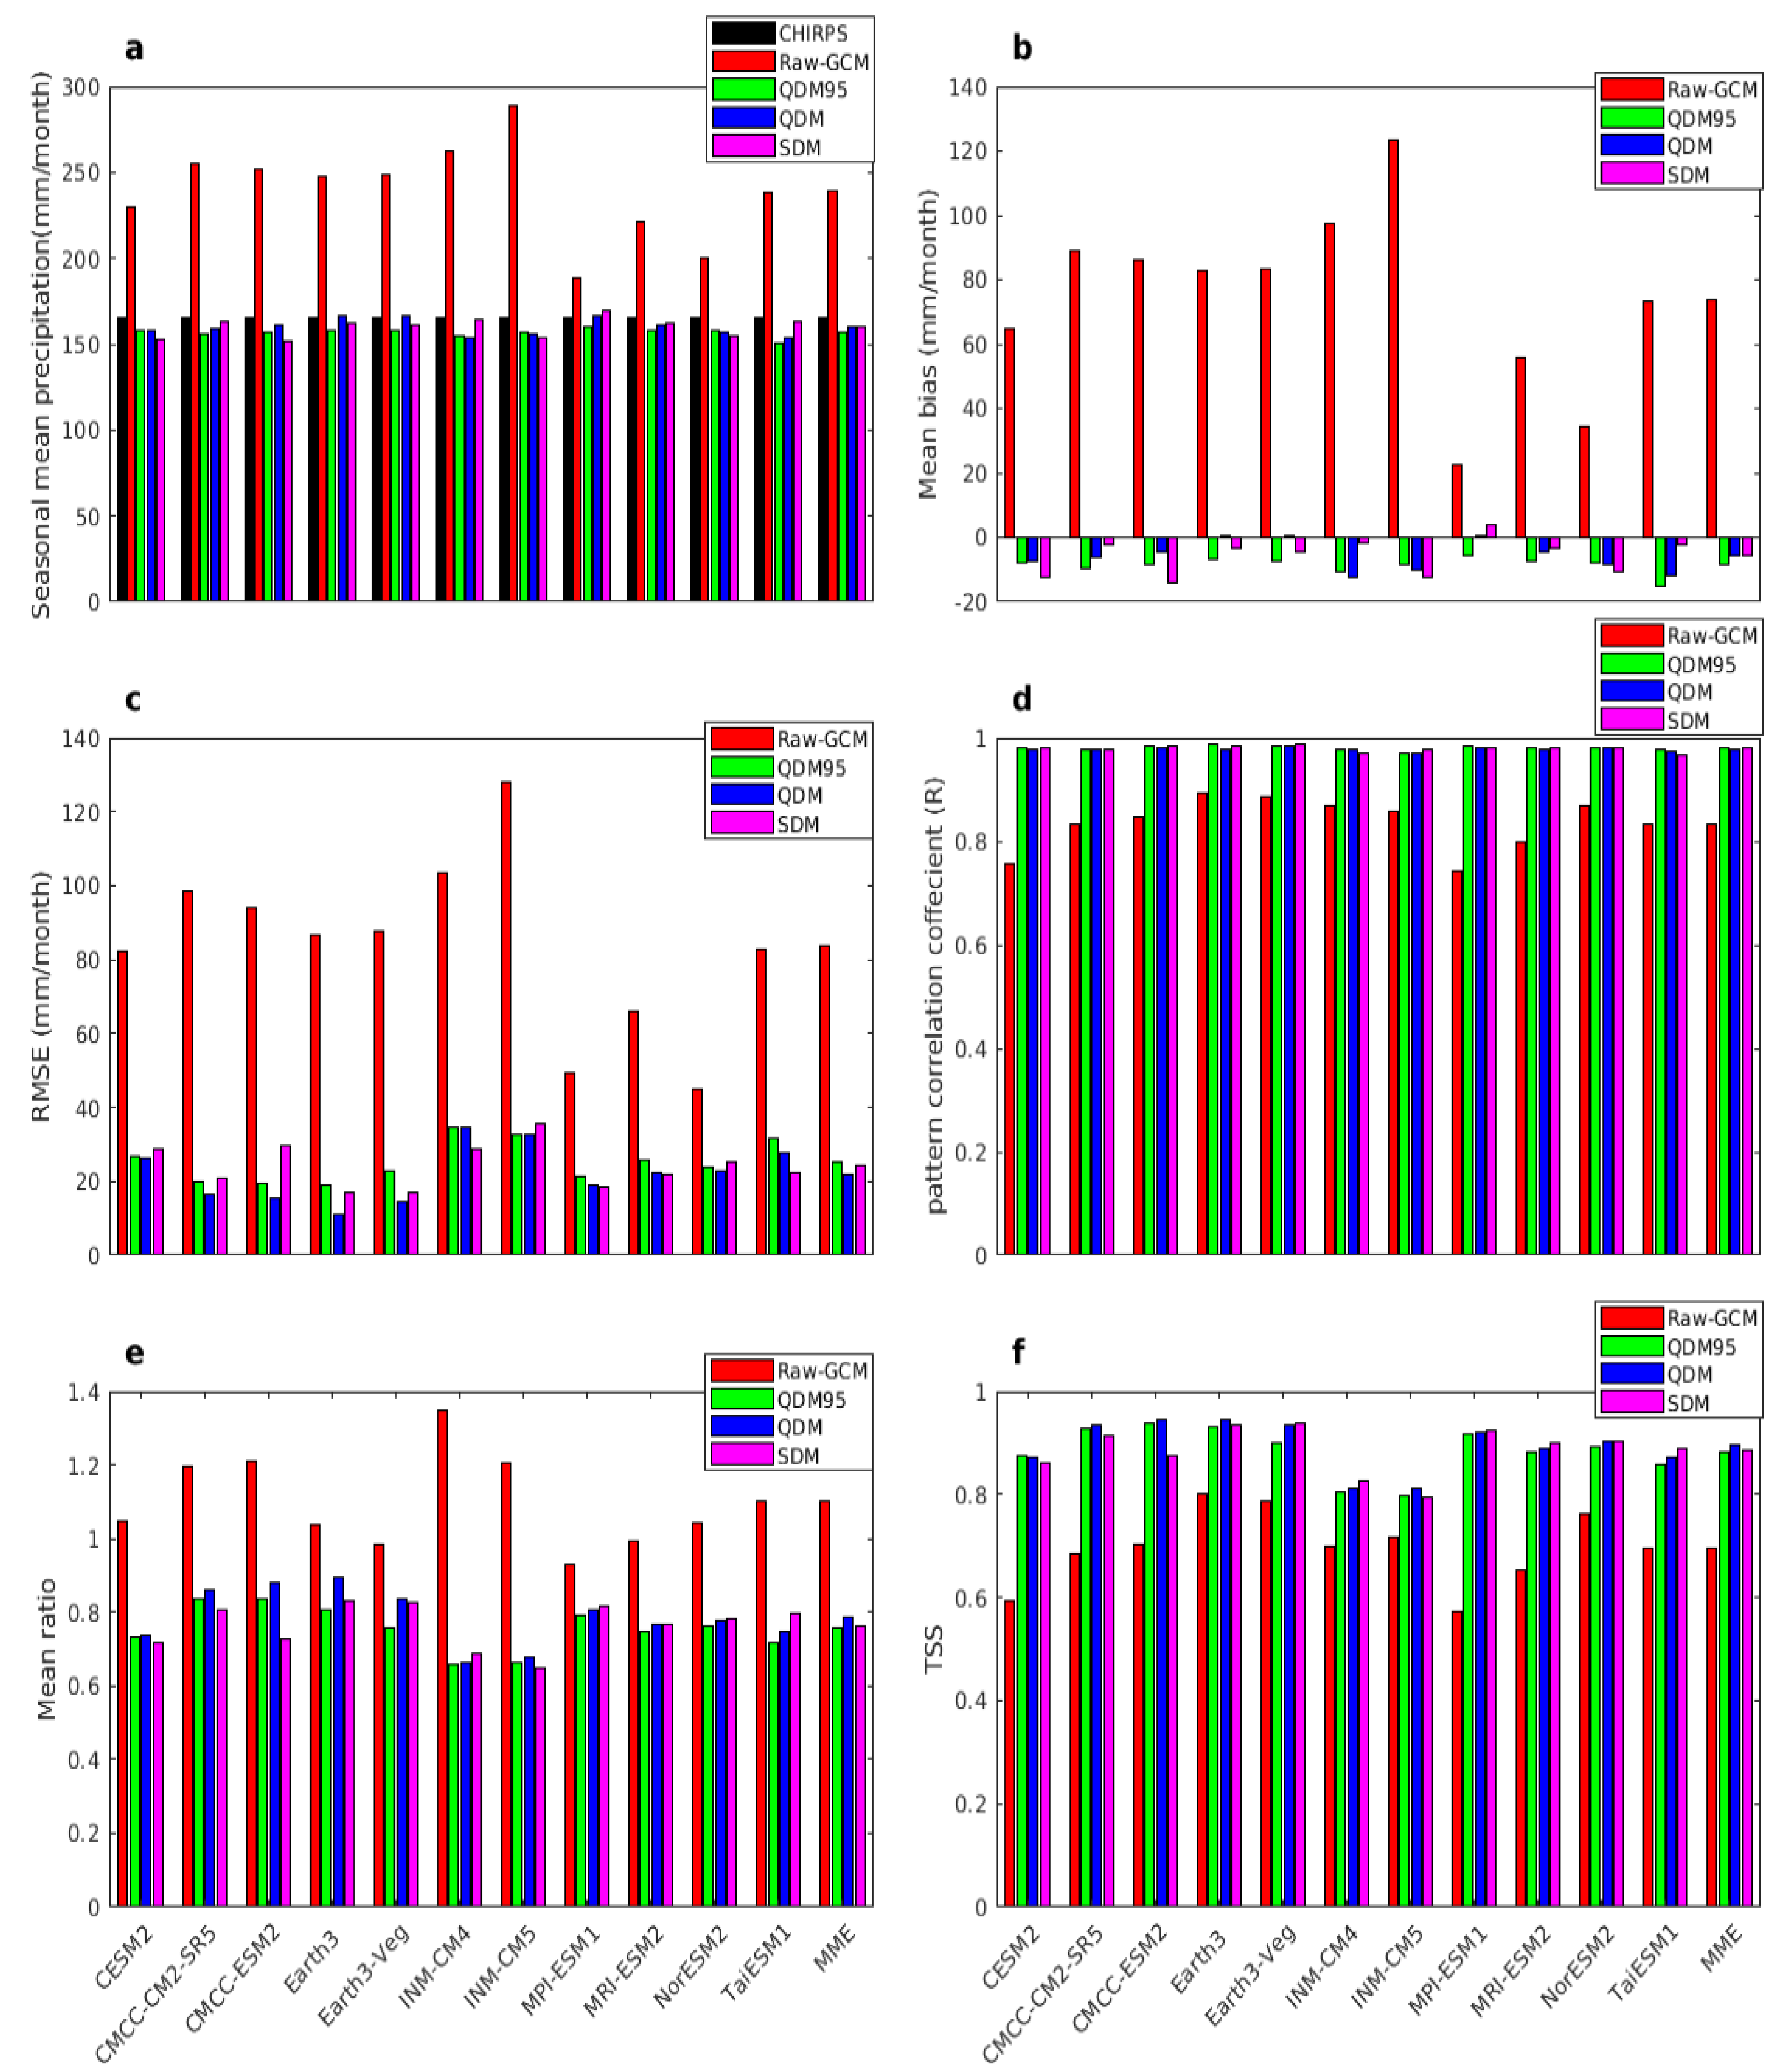
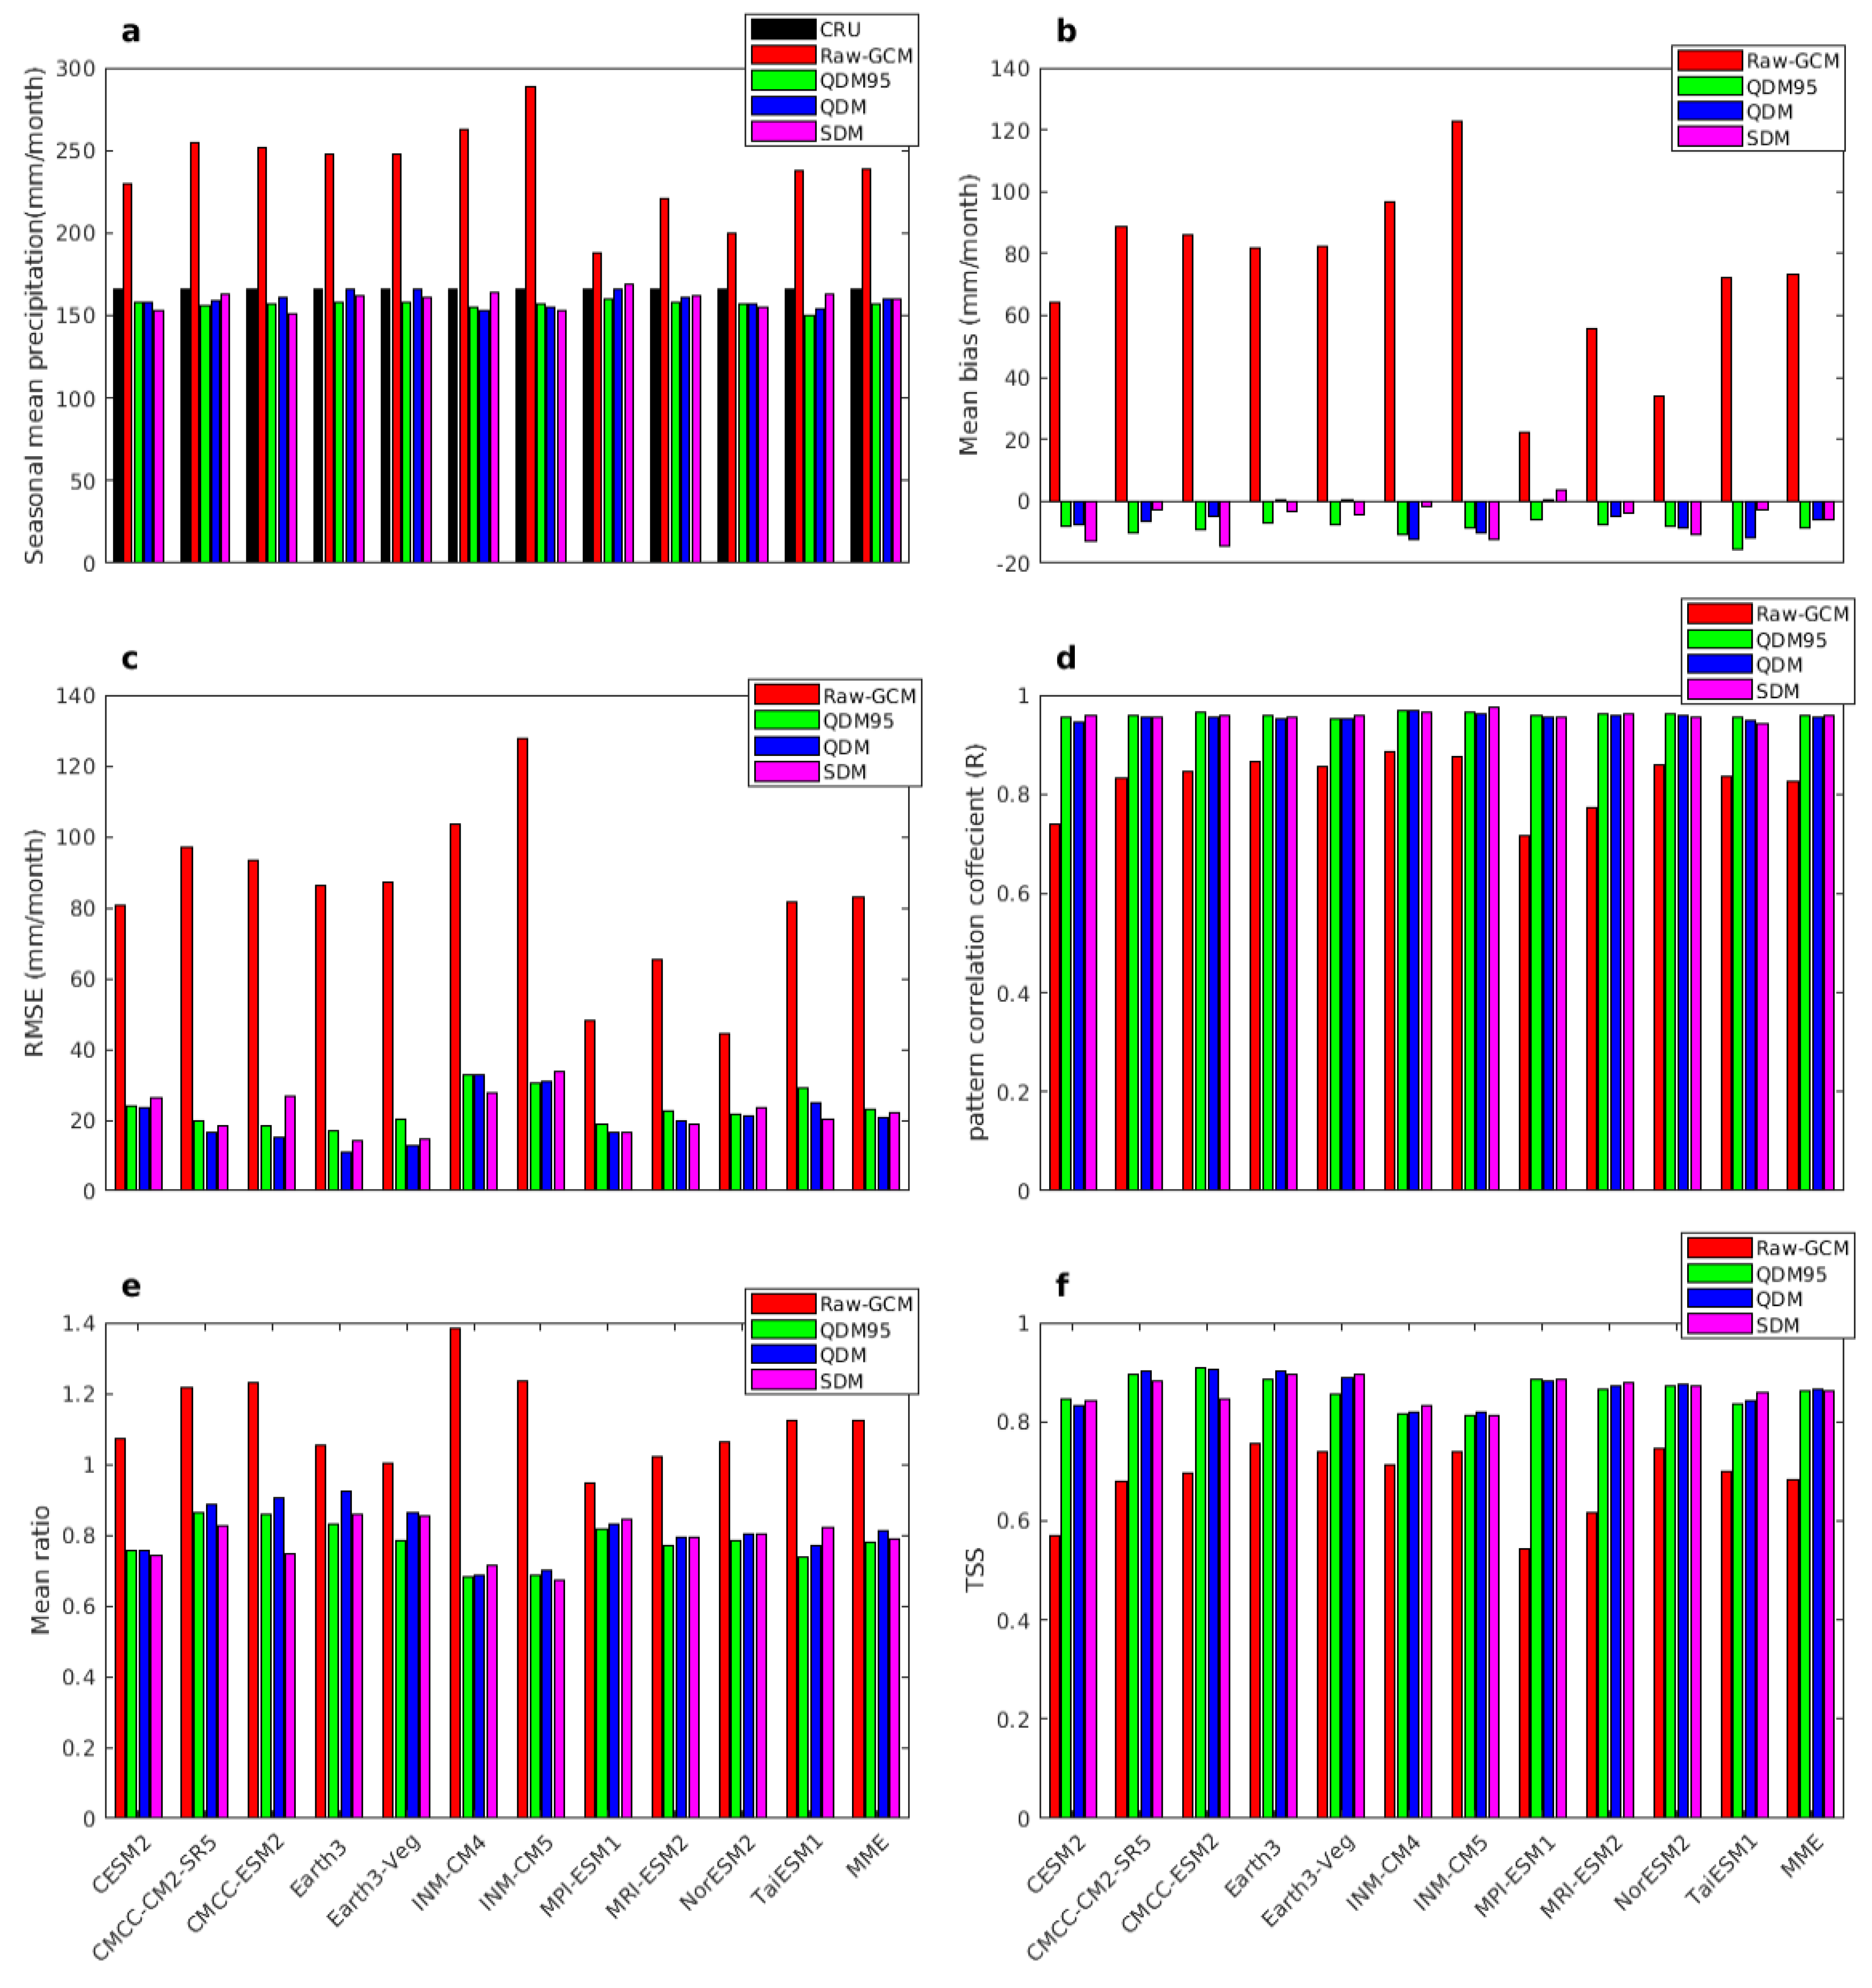
The assessment of the models using various performance metrics such as the seasonal mean, mean bias, pattern correlation, RMSE, standard deviation, mean ratio, and TSS can provide valuable insights to improve bias-corrected model precipitation relative to the data from CHIRPS, the GPCC, and the CRU. Figure 9 shows the performance measures of the bias-corrected and -uncorrected simulations from the CMIP6 models over Southern Africa. Table 3 shows the same metrics as in the figure for the sake of data records. After bias correction, all the techniques demonstrated improved alignment with the CHIRPS dataset (Figure 9). For instance, the seasonal mean precipitation from CHIRPS is 165.47 mm/month. The bias-corrected seasonal mean values for CESM2 (QDM), CM2-SR5 (SDM), CMCC-ESM2 (QDM), Earth3 (QDM), Earth3-Veg (QDM), INM-CM4 (SDM), INM-CM5 (QDM95), MPI-ESM1 (QDM), MRI-ESM2 (SDM), NorESM2 (QDM95) and TaiESM1 (SDM) and the mean of MME (SDM) are 158.10, 163.44, 161.10, 166.06, 165.86, 163.95, 157.20, 166.23, 164.92, 157.53, and 163.03 and 159.76 mm/month, respectively, which all exhibit closer agreement with the CHIRPS data (Table 3). This is demonstrated in the bar graphs for the eleven models (Figure 9a, red bar) and the observed CHIRPS precipitation (Figure 9a, black bar). Except for Earth3 (QDM), Earth3-Veg (QDM), and MPI-ESM1 (SDM), the bias-corrected seasonal mean precipitation (Figure 9a: green, blue, and magenta bars) shows only a few millimeters of dry bias compared to the observed CHIRPS precipitation. The reduction in the mean bias due to the bias correction of the precipitation from the models relative to CHIRPS is shown in Figure 9b and Table 3. The improvement in the performance of the models in capturing the observed precipitation is not limited to the seasonal mean monthly precipitation. The deviation of model precipitation from the observations as measured by the RMSE has also significantly reduced to less than 35.6 mm/month from an RMSE in the range of 45.16 (NorESM2)–128.11 (INM-CM5) mm/month before bias correction (Figure 9c).
The standard deviation (Stdev) of CHIRPS precipitation is 80.21 mm/month. The standard deviations of all the bias-corrected precipitation for the CMIP6 models are significantly lower than that of CHIRPS (Table 3). In contrast, the standard deviation of all the bias-uncorrected models except for MPI-ESM1 and EC-Earth3-Veg exceeds that of CHIRPS. The seasonal mean ratio of precipitation from all the bias-uncorrected models and the mean ratio of MME (Figure 9e, red bar) is higher than the three bias-corrected precipitations (Figure 9e). Moreover, the seasonal mean precipitation ratio from the CESM2, CM2-SR5, CMCC-ESM2, INM-CM4, INM-CM5, Earth3, MRI-ESM2, NorESM2, TaiESM1, and MME models exceeds 1, indicating wet bias in these models. All the bias correction techniques have significantly improved the performance of the CMIP6 models in reproducing seasonal precipitation spatial patterns over Southern Africa. The QDM95 bias correction technique significantly enhanced the ability of the CMIP6 models to replicate seasonal precipitation spatial patterns across Southern Africa. The pattern correlation increased from 0.760–0.890 to 0.970–0.987 (Figure 9d, blue bar). Similar improvements were observed with the QDM and SDM bias correction techniques, as evidenced by the correlation increases to 0.969–0.983 (Figure 9d, green bar) and 0.967–0.987 (Figure 9d, magenta bar), respectively. The improvement in model precipitation is also apparent from the Taylor skill score of 0.79–0.94 for QDM95, 0.81–0.95 for QDM, and 0.79–0.94 for SDM, as opposed to 0.57–0.80 before the bias correction (Figure 9f). QDM shows the highest overall improvement with a score range of 0.81–0.95, followed by QDM95 and SDM at 0.79–0.94.
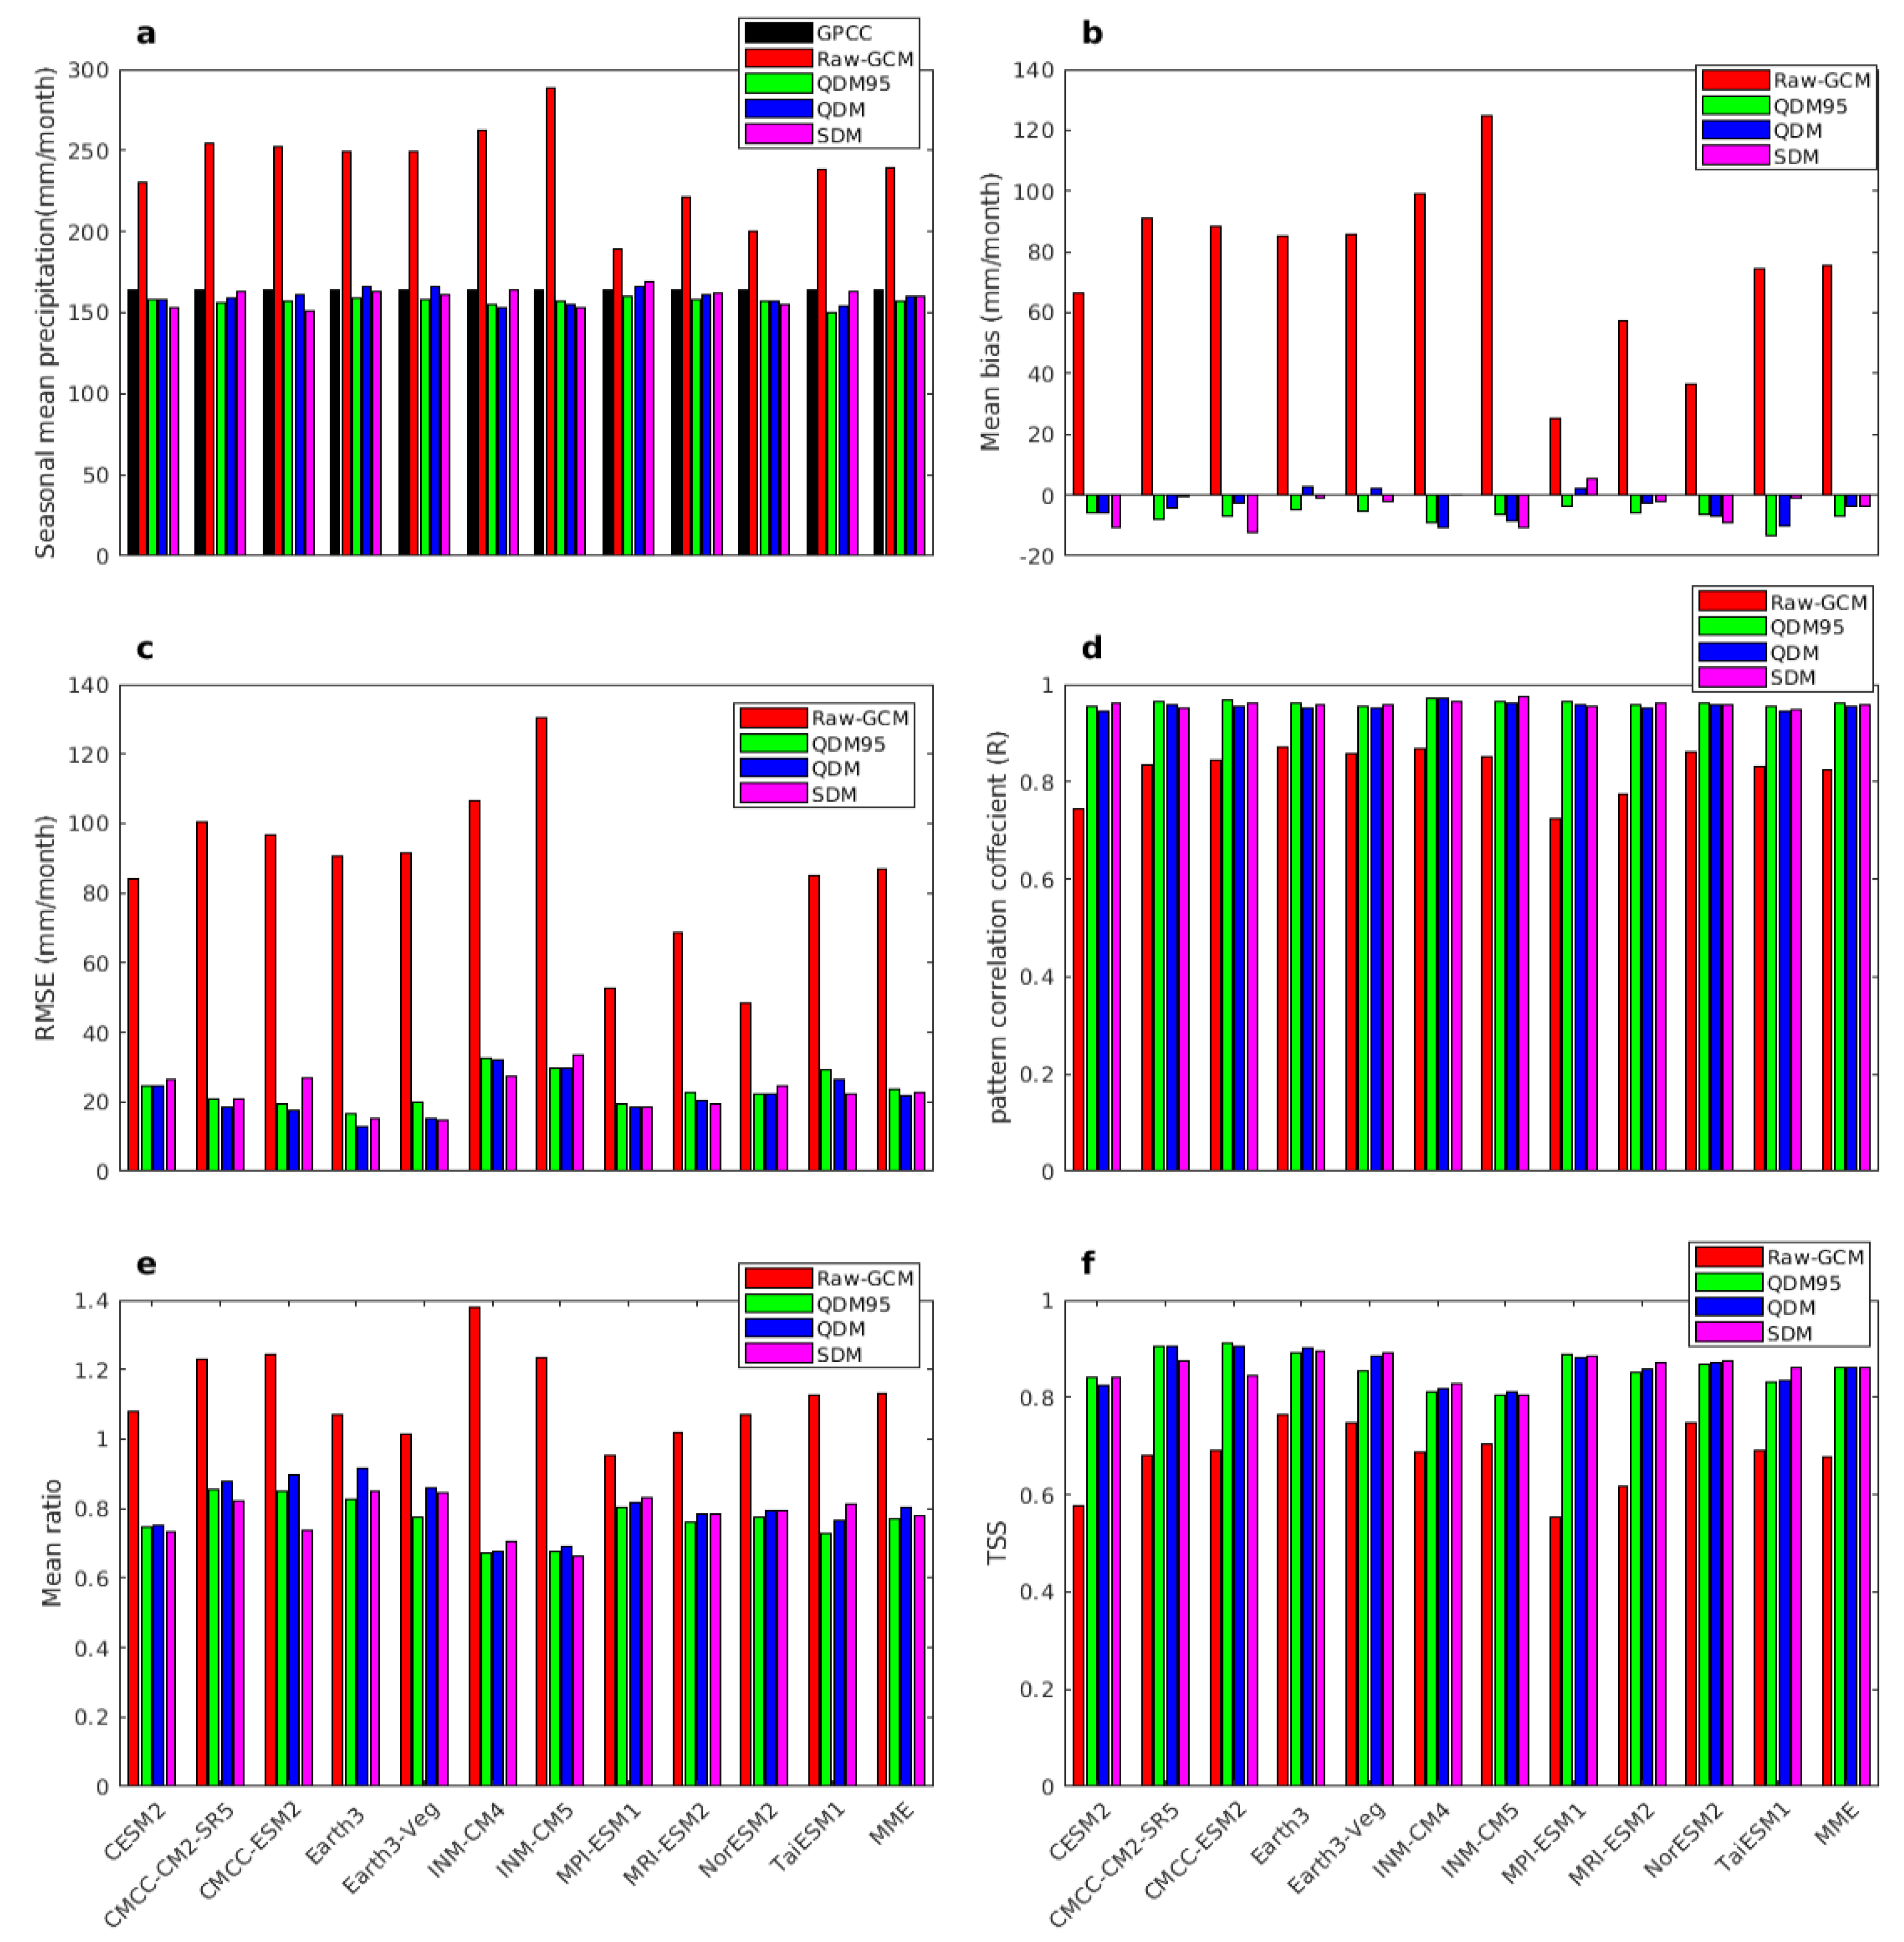
Figure 10 and Table 4 display the performance measures of the CMIP6 models, both bias-corrected and uncorrected, over Southern Africa. The measures include several metrics, such as the mean seasonal precipitation, MB, RMSE, R, Stdv, mean ratio, and TSS, which are compared with GPCC precipitation as a reference. Before bias correction, the region-wide precipitation from all the models exhibited a wet bias against the GPCC. However, after applying bias correction, most of the models show a dry bias compared to the GPCC, with only a few models showing a wet bias (Figure 10a,b; also see Table 4). However, the seasonal mean precipitation of all the bias-corrected models (Figure 10a, green, blue, and magenta bars) are much closer to the observed GPCC precipitation, indicating a significant reduction in the substantial bias of the simulated precipitation from the models. After applying the three bias correction techniques, the RMSE has also been reduced to less than 33.46 mm/month (Figure 10c).
After the bias correction, the pattern correlation between the precipitation from the CMIP6 models and the GPCC has improved significantly. The spatial pattern correlation increased from 0.725–0.870 to 0.955–0.971 for QDM95, 0.944–0.973 for QDM, and 0.946–0.974 for SDM (Figure 10d, green, blue, and magenta bars, respectively). The TSS of reproducing the observed spatial pattern of the GPCC precipitation by the CMIP6 models also improved, as indicated by an increase in the TSS from 0.55–0.76 to 0.80–0.91 for QDM95, 0.81–0.91 for QDM, and 0.80–0.89 for SDM (Figure 10f, green, blue, and magenta bars, respectively). Following the bias correction, the standard deviation decreased to values lower than that of the GPCC. It is worth noting that the precipitation from MPI-ESM1 exhibits a standard deviation lower than that of the observation, even before bias correction (Table 4). The mean ratio of precipitation from ten of the uncorrected models and their MME (Figure 10e, red bar) is much higher than that of the bias-corrected precipitation (Figure 10e, green, blue, and magenta bars). It is important to note that a value of 1 indicates a perfect agreement between model and observation.
Among the three bias correction techniques evaluated, the QDM technique demonstrated superior performance. It yielded the greatest enhancement in spatial pattern correlation, increasing from 0.944 to 0.973, and a substantial improvement in the TSS, rising from 0.81 to 0.91 when the GPCC is used as a reference. These results indicate that the QDM technique is a highly effective approach for correcting precipitation data biases.
The statistical scores for the bias-corrected and -uncorrected simulations of the CMIP6 models over Southern Africa relative to the CRU are presented in Figure 11 and Table 5. The seasonal mean precipitation of the CRU is 165.56 mm/month, with a standard deviation of 77.60 mm/month. This is significantly lower than the mean of the bias-uncorrected precipitation from all the individual models and their MME over the region (Figure 11a). Additionally, the variance of model precipitation is higher than the CRU, except for MPI-ESM1 (Table 5). After bias correction techniques are applied, the observed large bias in the model precipitation has been reduced considerably to less than 15 mm/month from a maximum of 122 mm/month (Figure 11b). The RMSE has also been significantly reduced to less than 33.92 mm/month from an RMSE in the range of 44.29 (NorESM2) to 127.67 (INM-CM5) mm/month before bias correction (Figure 11c). The bias-corrected precipitation from all the bias correction techniques exhibits better coherence with the CRU, as noted from the high pattern correlation coefficient. As measured by the pattern correlation and TSS, the improvement in bias-corrected precipitation relative to the CRU increased from 0.741–0.893 to 0.970–0.987 for QDM95, 0.969–0.983 for QDM, and 0.967–0.987 for SDM. Similarly, the improvement in the TSS increased from 0.54–0.75 to 0.81–0.91 for QDM95, 0.82–0.91 for QDM, and 0.81–0.90 for SDM. Based on these metrics, QDM95 generally demonstrates the best improvement, particularly in terms of the correlation (reaching a high value of 0.987 (Earth3) and TSS (with a maximum of 0.91 (CMCC-ESM2)). Significant bias reduction in precipitation simulated by all eleven CMIP6 models and their MME is achieved following the implementation of distribution-based bias correction. All the bias-corrected CMIP6 simulations demonstrate better coherence with the CRU (Figure 11d,f).
As noted in the preceding discussions, the raw CMIP6 models exhibit high positive mean biases relative to CHIRPS, the GPCC, and the CRU. This overestimation is consistent across most models and is primarily attributed to their limitations in capturing regional-scale precipitation processes. One key limitation is their coarse spatial resolution, which restricts the ability to resolve fine-scale features such as regional topography and local-scale convective systems, both of which are critical to the distribution of precipitation over Southern Africa [80]. These unresolved features influence atmospheric dynamics, moisture convergence, and convection processes, leading to discrepancies between modeled and observed precipitation. Additionally, many CMIP6 models struggle to accurately simulate large-scale circulation features that strongly influence regional precipitation, including the dynamics of the Intertropical Convergence Zone (ITCZ) [34,35], the position of the Angola Low, and the intensity of the South Indian Ocean Anticyclone [81]. These limitations underscore the importance of bias correction to enhance the reliability of climate simulations in the region. After implementing bias correction methods, these high positive biases were significantly reduced, leading to improved alignment with observed precipitation patterns.

3.4.4. Ranking of CMIP6 Models

Table 6 presents the evaluation of the bias correction and bias-uncorrected models alongside the ranking of the models based on the comprehensive rating metrics (MR) values. The results demonstrate that the choice of reference data and bias correction techniques significantly impact the model ranking. The overall ranks were assigned to each model based on the RM values to indicate their performance in representing the spatial characteristics of precipitation (Table 6). It is noted that the RM metric value ranged from 0.03 (CM2-SR5) for native GCM (ranked last) to 0.98 (CMCC-ESM2) for the bias correction models relative to CHIRPS, the GPCC, and the CRU, respectively (ranked first) (Table 6).
In the QDM bias correction technique, the CMCC-ESM2 and Earth3 models performed the best in simulating precipitation, both achieving the top rank with an MR of 0.98 compared to CHIRPS. Following closely, the Earth3-Veg and MPI-ESM1 models secured the fourth rank with an MR of 0.86, while the CM2-SR5 model ranked fifth with an MR of 0.85. Using the QDM95 bias correction technique, the CMCC-ESM2 and MPI-ESM1 models emerged as the best performers, with an MR of 0.95 and 0.85, ranking second and fifth, respectively. In the multi-bias correction technique ensemble (MBCE), the Earth3, CMCC-ESM2, and MPI-ESM1 models performed the best in simulating precipitation, with MR values of 0.88 (rank 3), 0.82 (rank 7), and 0.80 (rank 8), respectively. Lastly, when bias-corrected using the SDM technique, the Earth3-Veg model performed the best, achieving fourth rank with an MR of 0.86 relative to CHIRPS (Table 6). For the GPCC dataset, the CMCC-ESM2 model demonstrated strong performance, ranking first with an MR of 0.98 when bias-corrected by QDM95. It also achieved the highest performance with QDM, scoring 0.95. Earth3 performed best with QDM (0.93) and ranked sixth with a 0.86 MR for the MBCE. CM2-SR5 secured third rank for QDM95 (MR of 0.93) and ranked fourth and eighth under QDM and the MBCE (MR of 0.89 and 0.82, respectively). MPI-ESM1 followed closely, ranking third with QDM95 (MR of 0.93) and fifth with QDM (MR of 0.88). Earth3-Veg exhibited high performance, ranking eighth under SDM (MR of 0.82) and tenth under QDM (MR of 0.79) (Table 6). The model rankings showed noticeable improvements compared to the CRU dataset, though their specific positions and MR values varied considerably. For example, CMCC-ESM2 achieved the highest rank with an MR of 0.98 under QDM, while under QDM95, it ranked second with an MR of 0.97, and under MBCE, it also performed well. The Earth3 model ranked third under QDM with an MR of 0.95 and sixth under the MBCE with an MR of 0.86. Notably, Earth3-Veg, with an MR of 0.87 and 0.84, secured fifth and seventh place under QDM and SDM, respectively. MPI-ESM1 showed strong performance, ranking fourth with an MR of 0.92 under QDM95 and seventh with an MR of 0.84 under QDM (Table 6). Interestingly, QDM, QDM95, and SDM affect model ranking differently in addition to the reference dataset used. Therefore, understanding the influence of the bias correction techniques in model ranking is important when models are chosen for specific tasks based on their ranks. Additionally, it is worth exploring the ensemble mean of different bias-corrected precipitation datasets from each model in terms of combined ranking. Following QDM and QDM95, the combined ranking of the MBCE demonstrated the effectiveness of using an ensemble approach to identify models that perform consistently well across bias correction techniques. The integration of QDM, QDM95, and SDM in the MBCE has successfully balanced the strengths and weaknesses inherent in each technique, resulting in a more reliable assessment of model performance. This approach provides a holistic view, ensuring that the selected models are suited to specific conditions and exhibit robustness across different datasets and bias correction techniques.
Overall, all the uncorrected (Raw-GCM) models and their MME show poor performance, with MR values typically below 0.2 across all three datasets. The bias-corrected mean MR of the MME ranged from 0.45 under SDM to 0.70 under QDM when compared to CHIRPS, from 0.44 under SDM to 0.64 under QDM when compared to the GPCC, and from 0.45 under SDM to 0.64 under QDM when compared to the CRU. While some models, such as CMCC-ESM2, MPI-ESM, Earth3-Veg, and Earth3, showed relatively high MR values, exceeding 0.80 in CHIRPS, the GPCC, and the CRU, the overall MR of the MME remains relatively modest (Table 6). However, their rankings varied across the datasets. In contrast, INM-CM5 and INM-CM4 consistently performed poorly in simulating precipitation from CHIRPS, the GPCC, and the CRU before and after bias correction. Therefore, this finding shows the critical role of bias correction precipitation in improving the performance of CMIP6 models. Among the bias correction techniques, QDM has significantly enhanced the reliability of CMIP6 GCMs in accurately simulating precipitation over the study area.
Relative to CHRIPS, the GPCC, and the CRU, the bias-uncorrected MPI-ESM1 and NorESM2 models perform relatively well, exhibiting the lowest MB and RMSE values and mean ratio closer to unity (Table 3, Table 4 and Table 5). Sian et al. [17] utilized the latest version of the CMIP6 experiment to simulate precipitation over Southern Africa and demonstrated that MPI-ESM1-2-HR outperformed most other models in their study. Similarly, Makula and Zhou [25] used the latest version of the CMIP6 precipitation data over East Africa and showed that MPI-ESM1-2-HR has outperformed other individual models. The findings of both studies are consistent with our results as far as the magnitude of precipitation estimates from the models are concerned. However, in terms of spatial consistency (i.e., as measured by pattern correlation and the TSS), CESM2, MPI-ESM1, and MRI-ESM2 performances are inferior to the rest of the models in this study. Interestingly, this difference in the performance of the models significantly diminishes after bias correction, implying the importance of bias correction techniques for all models to produce consistent simulations among models. Based on all the statistical metrics, the CMCC-ESM2, Earth3, Earth3-Veg, and MPI-ESM1 models stand out as the top performers in this evaluation. Their strong performance across all metrics, particularly after bias correction, demonstrates their superior ability to simulate precipitation patterns over the study region. The consistency of these models across different datasets and bias correction techniques underscores their robustness and reliability for climate modeling. On the contrary, INM-CM4 and INM-CM5 exhibit relatively poor performance, characterized by the smallest MR values and largest RMSE, MB, standard deviation, and seasonal mean, primarily due to their tendency to overestimate changes in precipitation owing to presumably their coarser resolution. A few studies argue that higher-resolution climate models outperform those with coarser resolutions in accurately simulating observed precipitation [82,83]. Others have shown that this is not always the case (e.g., [26]).

4. Conclusions

In this study, the effectiveness of various bias correction techniques—QDM, separate QDM for precipitation equal to or less than the 95th percentile and greater than the 95th percentile (QDM95), and SDM—in improving the accuracy of precipitation simulations from CMIP6 models across Southern Africa was comprehensively evaluated. The primary focus was on enhancing the simulated precipitation’s alignment with the observed data, particularly during the DJF season. We focused on correcting the daily precipitation data from eleven CMIP6 models. This study compared the performance of these bias-corrected CMIP6 models, from 1982 to 2014, with three observational datasets: CHIRPS, the CRU, and the GPCC. Standard statistical metrics such as the seasonal mean, MB, RMSE, Pattern correlation coefficient (R), Stdv, mean ratio, PDF, TSS, and comprehensive rating metrics (MR) were used to assess the accuracy of the models before and after bias correction in reproducing seasonal precipitation patterns over Southern Africa. Additionally, the K-S test was applied to assess whether the gamma distribution is suitable for daily rainfall distribution in a statistical sense.
The findings reveal that while raw GCM outputs exhibited notable discrepancies in both the magnitude and spatial distribution of precipitation, particularly over complex terrains and high-altitude regions, the application of bias correction techniques significantly mitigated these biases. The bias-corrected models demonstrated improved alignment with the observational datasets, such as CHIRPS, the GPCC, and the CRU. Among the methods, QDM emerged as the most consistent across various metrics, while QDM95 proved particularly effective in reducing wet biases in northern Southern Africa and the coastal regions. Despite these advancements, challenges persisted. The bias correction techniques, while effective, did not fully resolve all the discrepancies, especially in regions like Madagascar, where the east–west precipitation gradient remained inadequately captured. Discrepancies between the observational datasets also contributed to residual biases, affecting the overall performance of the bias correction techniques in certain areas. CHIRPS, for instance, better captured light-to-moderate precipitation events but showed biases relative to the GPCC and CRU. The analysis of the PDF of the bias-corrected precipitation indicated that bias correction enhanced model performance, particularly for moderate precipitation (3–35 mm/day). However, both the corrected and uncorrected models underestimated higher extremes. The substantial increase in the number of precipitation grids following bias correction showed significant improvement in the goodness of fit of the model precipitation to the gamma distribution, as reflected in the high acceptance rate of the null hypothesis. This is consistent with the preceding reduced bias.
This study demonstrated the impact of bias correction on various performance metrics, including the MB, RMSE, and pattern correlation. The bias-corrected models exhibited substantial improvements in simulation accuracy, with reductions in the RMSE from values as high as 130.53 mm/month (for INM-CM5) to less than 35.6 mm/month. The spatial patterns of precipitation also improved significantly, with correlations increasing from 0.740–0.890 to 0.972–0.987 post-correction. QDM95, in particular, showed superior performance in enhancing the spatial pattern correlation and TSS, outperforming other techniques. The results underscored that while bias correction techniques improved model simulations, their effectiveness varied depending on precipitation intensity and regional characteristics.
The three bias-corrected techniques performed consistently in replicating the seasonal spatial pattern of DJF precipitation, with only a small bias observed over most parts of Southern Africa compared to the three observational datasets. In contrast, the bias-uncorrected precipitation showed much higher RMSE values than the bias-corrected CMIP6 simulations. Additionally, the pattern correlation coefficients were higher for the bias-corrected models than the bias-uncorrected models in all eleven CMIP6 models and their MME. Moreover, the Stdv in the bias-corrected CMIP6 simulations was lower than those of the uncorrected ones. The bias-corrected CMIP6 models strongly agreed with the CRU, the GPCC, and CHIRPS regarding the seasonal mean precipitation, boasting a high pattern correlation and low RMSE values. The PDF for all the models demonstrated a significant improvement from the three bias correction techniques, especially QDM95 and QDM, which helped preserve the precipitation extremes and reduced the potential filtering of the extremes due to quantile matching as it depends on data volume in different precipitation classes. There were especially notable differences in the data volume within the lower and upper extremes compared to the rest of the dataset.
Following the three bias correction techniques, the pattern correlation increased from 0.76–0.89 to 0.97–0.99. Additionally, the TSS for reproducing the CHIRPS spatial pattern over Southern Africa improved from 0.57–0.80 to 0.79–0.95. Similarly, the pattern correlation of precipitation from the CMIP6 models with the GPCC precipitation improved from 0.73–0.87 to 0.94–0.97. The TSS of reproducing the observed spatial pattern of the GPCC precipitation by the CMIP6 models also increased from 0.55–0.76 to 0.80–0.91. Furthermore, the improvement in the three bias-corrected precipitations compared to the CRU in terms of correlation increased from 0.74–0.89 to 0.97–0.99, while the TSS changed from 0.54–0.75 to 0.81–0.91.
Comprehensive rating metrics (MR) were used to rank the models based on their spatial performance across three observational datasets (CHIRPS, GPCC, and CRU). The findings indicated that the bias correction techniques significantly impacted the model rankings, with QDM and QDM95 generally improving model reliability. Notably, CMCC-ESM2, Earth3, Earth3-Veg, and MPI-ESM1 showed high performance after bias correction, achieving top ranks. Conversely, uncorrected models exhibited poor performance, with MR values below 0.23, underscoring the necessity of bias correction. These results highlighted the importance of selecting appropriate bias correction techniques and reference datasets for accurate model evaluations. Models with a higher resolution generally performed better, though the relationship between resolution and performance remained complex and context-dependent. Future investigations should focus on refining bias correction techniques and exploring the merit of applying an ensemble of bias-corrected techniques to enhance climate studies and projections.
Overall, this study underscored the critical role of bias correction in improving the reliability of CMIP6 model simulations for precipitation, with significant implications for climate impact assessments, water resource management, and disaster risk mitigation in Southern Africa. This improvement was reflected in various aspects, such as temporal distribution, spatial patterns, mean climatology, and seasonal cycles. Moreover, Part II of this paper addresses, the added value of distribution-based bias correction in representing climate extremes by assessing the models’ performance before and after bias correction. Also, evaluating the impact models, such as hydrological and crop models, using bias-corrected and bias-uncorrected precipitation as inputs over the Southern African region can provide valuable insights.

Author Contributions

A.A.A. worked on the methodology, statistical data analysis, visualization, writing, original draft review, and editing. G.M.T. worked on the conceptualization, methodology, statistical data analysis, visualization, supervising, writing, reviewing, and editing. L.V.B. worked on the supervising, reviewing, and editing. All authors have read and agreed to the published version of the manuscript.

Funding

This work has received funding from the O.R. Tambo Africa Research Chairs Initiative as supported by the Botswana International University of Science and Technology; the Ministry of Tertiary Education, Science and Technology; the National Research Foundation of South Africa (NRF); the Department of Science and Innovation of South Africa (DSI); the International Development Research Center of Canada (IDRC); and the Oliver & Adelaide Tambo Foundation (OATF), with grant number: (UID)136696.

Data Availability Statement

The bias-corrected data are available upon request.

Acknowledgments

The authors would like to acknowledge that the CMIP6 simulations used in our analyses are freely available from the Earth System Grid Federation (https://esgf-node.llnl.gov/search/cmip6, and the CHIRPS, GPCC, and CRU datasets are freely available from https://cds.climate.copernicus.eu/datasets, last accessed on 1 April 2025).

Conflicts of Interest

The authors declare no conflicts of interest.

References

  1. Chandio, A.A.; Jiang, Y.; Amin, A.; Ahmad, M.; Akram, W.; Ahmad, F. Climate change and food security of South Asia: Fresh evidence from a policy perspective using novel empirical analysis. J. Environ. Plan. Manag. 2023, 66, 169–190. [Google Scholar] [CrossRef]
  2. Parker, D.J.; Blyth, A.M.; Woolnough, S.J.; Dougill, A.J.; Bain, C.L.; de Coning, E.; Diop-Kane, M.; Kamga Foamouhoue, A.; Lamptey, B.; Ndiaye, O.; et al. The African SWIFT project: Growing science capability to bring about a revolution in weather prediction. Bull. Am. Meteorol. Soc. 2021, 103, E349–E369. [Google Scholar] [CrossRef]
  3. Ferrari, C.T.d.R.; Signor, A. Water crisis in Parana: Causes and consequences. Open Sci. J. 2023, 8, 3284. [Google Scholar]
  4. Zwiers, F.W.; Zhang, X. Translating Science into Actionable Policy Information—A Perspective on the Intergovernmental Panel on Climate Change Process. In Applied Data Science; Springer: Cham, Switzerland, 2023; pp. 1–12. [Google Scholar]
  5. Xu, Z.; Han, Y.; Yang, Z. Dynamical downscaling of regional climate: A review of methods and limitations. Sci. China Earth Sci. 2019, 62, 365–375. [Google Scholar] [CrossRef]
  6. Maraun, D. Bias correcting climate change simulations-a critical review. Curr. Clim. Chang. Rep. 2016, 2, 211–220. [Google Scholar] [CrossRef]
  7. Ghimire, U.; Srinivasan, G.; Agarwal, A. Assessment of rainfall bias correction techniques for improved hydrological simulation. Int. J. Climatol. 2019, 39, 2386–2399. [Google Scholar] [CrossRef]
  8. Li, X.; Li, Z. Evaluation of bias correction techniques for generating high-resolution daily temperature projections from CMIP6 models. Clim. Dyn. 2023, 61, 3893–3910. [Google Scholar] [CrossRef]
  9. Casanueva, A.; Herrera, S.; Iturbide, M.; Lange, S.; Jury, M.; Dosio, A.; Maraun, D.; Gutiérrez, J.M. Testing bias adjustment methods for regional climate change applications under observational uncertainty and resolution mismatch. Atmos. Sci. Lett. 2020, 21, e978. [Google Scholar] [CrossRef]
  10. Tabari, H.; Paz, S.M.; Buekenhout, D.; Willems, P. Comparison of statistical downscaling methods for climate change impact analysis on precipitation-driven drought. Hydrol. Earth Syst. Sci. 2021, 25, 3493–3517. [Google Scholar] [CrossRef]
  11. Gumindoga, W.; Rientjes, T.H.; Haile, A.T.; Makurira, H.; Reggiani, P. Performance of bias-correction schemes for CMORPH rainfall estimates in the Zambezi River basin. Hydrol. Earth Syst. Sci. 2019, 23, 2915–2938. [Google Scholar] [CrossRef]
  12. Chen, J.; Brissette, F.P.; Chaumont, D.; Braun, M. Finding appropriate bias correction methods in downscaling precipitation for hydrologic impact studies over North America. Water Resour. Res. 2013, 49, 4187–4205. [Google Scholar] [CrossRef]
  13. Ayugi, B.; Tan, G.; Ruoyun, N.; Babaousmail, H.; Ojara, M.; Wido, H.; Mumo, L.; Ngoma, N.H.; Nooni, I.K.; Ongoma, V. Quantile mapping bias correction on rossby centre regional climate models for precipitation analysis over Kenya, East Africa. Water 2020, 12, 801. [Google Scholar] [CrossRef]
  14. Hamadalnel, M.; Zhu, Z.; Gaber, A.; Iyakaremye, V.; Ayugi, B. Possible changes in Sudan’s future precipitation under the high and medium emission scenarios based on bias adjusted GCMs. Atmos. Res. 2022, 269, 106036. [Google Scholar] [CrossRef]
  15. Sian, K.T.C.L.K.; Hagan, D.F.T.; Ayugi, B.O.; Nooni, I.K.; Ullah, W.; Babaousmail, H.; Ongoma, V. Projections of precipitation extremes based on bias-corrected Coupled Model Intercomparison Project phase 6 models ensemble over southern Africa. Int. J. Climatol. 2022, 42, 8269–8289. [Google Scholar] [CrossRef]
  16. Switanek, M.B.; Troch, P.A.; Castro, C.L.; Leuprecht, A.; Chang, H.I.; Mukherjee, R.; Demaria, E. Scaled distribution mapping: A bias correction method that preserves raw climate model projected changes. Hydrol. Earth Syst. Sci. 2017, 21, 2649–2666. [Google Scholar] [CrossRef]
  17. Sian, K.T.C.L.K.; Wang, J.; Ayugi, B.O.; Nooni, I.K.; Ongoma, V. Multi-decadal variability and future changes in precipitation over Southern Africa. Atmosphere 2021, 12, 742. [Google Scholar] [CrossRef]
  18. Ribes, A.; Qasmi, S.; Gillett, N.P. Making climate projections conditional on historical observations. Sci. Adv. 2021, 7, eabc0671. [Google Scholar] [CrossRef]
  19. Mmame, B.; Ngongondo, C. Evaluation of CMIP6 model skills in simulating tropical climate extremes over Malawi, Southern Africa. Model. Earth Syst. Environ. 2024, 10, 1695–1709. [Google Scholar] [CrossRef]
  20. Li, X.; Li, Z. Assessment of bias correction methods for high resolution daily precipitation projections with CMIP6 models: A Canadian case study. J. Hydrol. Reg. Stud. 2025, 58, 102223. [Google Scholar] [CrossRef]
  21. Samuel, S.; Mengistu Tsidu, G.; Dosio, A.; Mphale, K. Assessment of historical and future mean and extreme precipitation over sub-saharan africa using nex-gddp-cmip6: Part i—Evaluation of historical simulation. Int. J. Climatol. 2025, 45, e8672. [Google Scholar] [CrossRef]
  22. Babaousmail, H.; Hou, R.; Ayugi, B.; Ojara, M.; Ngoma, H.; Karim, R.; Rajasekar, A.; Ongoma, V. Evaluation of the performance of CMIP6 models in reproducing rainfall patterns over North Africa. Atmosphere 2021, 12, 475. [Google Scholar] [CrossRef]
  23. Faye, A.; Akinsanola, A.A. Evaluation of extreme precipitation indices over West Africa in CMIP6 models. Clim. Dyn. 2022, 58, 925–939. [Google Scholar] [CrossRef]
  24. Ngoma, H.; Wen, W.; Ayugi, B.; Babaousmail, H.; Karim, R.; Ongoma, V. Evaluation of precipitation simulations in CMIP6 models over Uganda. Int. J. Climatol. 2021, 41, 4743–4768. [Google Scholar] [CrossRef]
  25. Makula, E.K.; Zhou, B. Coupled Model Intercomparison Project phase 6 evaluation and projection of East African precipitation. Int. J. Climatol. 2022, 42, 2398–2412. [Google Scholar] [CrossRef]
  26. Jima, W.L.; Bahaga, T.K.; Tsidu, G.M. Fidelity of CMIP6 Models in Simulating June–September Rainfall Climatology, Spatial and Trend Patterns Over Complex Topography of Greater Horn of Africa. Pure Appl. Geophys. 2024, 181, 577–609. [Google Scholar] [CrossRef]
  27. Almazroui, M.; Saeed, F.; Saeed, S.; Nazrul Islam, M.; Ismail, M.; Klutse, N.A.B.; Siddiqui, M.H. Projected change in temperature and precipitation over Africa from CMIP6. Earth Syst. Environ. 2020, 4, 455–475. [Google Scholar] [CrossRef]
  28. Samuel, S.; Dosio, A.; Mphale, K.; Faka, D.N.; Wiston, M. Comparison of multimodel ensembles of global and regional climate models projections for extreme precipitation over four major river basins in southern Africa—assessment of the historical simulations. Clim. Chang. 2023, 176, 57. [Google Scholar] [CrossRef]
  29. Favre, A.; Hewitson, B.; Lennard, C.; Cerezo-Mota, R.; Tadross, M. Cut-off lows in the South Africa region and their contribution to precipitation. Clim. Dyn. 2013, 41, 2331–2351. [Google Scholar] [CrossRef]
  30. Peel, M.C.; Finlayson, B.L.; McMahon, T.A. Updated world map of the Köppen-Geiger climate classification. Hydrol. Earth Syst. Sci. 2007, 11, 1633–1644. [Google Scholar] [CrossRef]
  31. Engelbrecht, F.; McGregor, J.; Engelbrecht, C. Dynamics of the Conformal-Cubic Atmospheric Model projected climate-change signal over southern Africa. Int. J. Climatol. J. R. Soc. 2009, 29, 1013–1033. [Google Scholar] [CrossRef]
  32. Usman, M.T.; Reason, C. Dry spell frequencies and their variability over southern Africa. Clim. Res. 2004, 26, 199–211. [Google Scholar] [CrossRef]
  33. Dunning, C.M.; Black, E.C.; Allan, R.P. The onset and cessation of seasonal rainfall over Africa. J. Geophys. Res. Atmos. 2016, 121, 11–405. [Google Scholar] [CrossRef]
  34. Nicholson, S.E. The ITCZ and the seasonal cycle over equatorial Africa. Bull. Am. Meteorol. Soc. 2018, 99, 337–348. [Google Scholar] [CrossRef]
  35. Daron, J.; Burgin, L.; Janes, T.; Jones, R.G.; Jack, C. Climate process chains: Examples from southern Africa. Int. J. Climatol. 2019, 39, 4784–4797. [Google Scholar] [CrossRef]
  36. NOAA National Geophysical Data Center. 2-Minute Gridded Global Relief Data (ETOPO2) v2; NOAA National Centers for Environmental Information: Asheville, NC, USA, 2006.
  37. Akinsanola, A.; Ogunjobi, K.; Ajayi, V.; Adefisan, E.; Omotosho, J.; Sanogo, S. Comparison of five gridded precipitation products at climatological scales over West Africa. Meteorol. Atmos. Phys. 2017, 129, 669–689. [Google Scholar] [CrossRef]
  38. Funk, C.; Peterson, P.; Landsfeld, M.; Pedreros, D.; Verdin, J.; Shukla, S.; Husak, G.; Rowland, J.; Harrison, L.; Hoell, A.; et al. The climate hazards infrared precipitation with stations—A new environmental record for monitoring extremes. Sci. Data 2015, 2, 1–21. [Google Scholar] [CrossRef]
  39. Schneider, U.; Becker, A.; Finger, P.; Meyer-Christoffer, A.; Ziese, M.; Rudolf, B. GPCC’s new land surface precipitation climatology based on quality-controlled in situ data and its role in quantifying the global water cycle. Theor. Appl. Climatol. 2014, 115, 15–40. [Google Scholar] [CrossRef]
  40. Jones, P.; Harris, I. CRU Time Series (TS) High Resolution Gridded Datasets; Clim Res Unit, Univ East Anglia: Norwich, UK, 2008; Available online: https://iridl.ldeo.columbia.edu/expert/SOURCES/.UEA/.CRU/.TS3p1/.monthly/.pre (accessed on 1 April 2025).
  41. Samuel, S.; Mengistu Tsidu, G.; Dosio, A.; Mphale, K. Exploring the influence of improved horizontal resolution on extreme precipitation in Southern Africa major river basins: Insights from CMIP6 HighResMIP simulations. Clim. Dyn. 2024, 62, 8099–8120. [Google Scholar] [CrossRef]
  42. Danabasoglu, G. NCAR CESM2-WACCM model output prepared for CMIP6 CMIP historical. Earth Syst. Grid Fed. 2019. [Google Scholar] [CrossRef]
  43. Cherchi, A.; Fogli, P.G.; Lovato, T.; Peano, D.; Iovino, D.; Gualdi, S.; Masina, S.; Scoccimarro, E.; Materia, S.; Bellucci, A.; et al. Global mean climate and main patterns of variability in the CMCC-CM2 coupled model. J. Adv. Model. Earth Syst. 2019, 11, 185–209. [Google Scholar] [CrossRef]
  44. Fogli, P.G.; Manzini, E.; Vichi, M.; Alessandri, A.; Patara, L.; Gualdi, S.; Scoccimarro, E.; Masina, S.; Navarra, A. INGV-CMCC carbon (ICC): A carbon cycle earth system model. CMCC Res. Pap. 2009. [Google Scholar] [CrossRef]
  45. Döscher, R.; Acosta, M.; Alessandri, A.; Anthoni, P.; Arneth, A.; Arsouze, T.; Bergmann, T.; Bernadello, R.; Bousetta, S.; Caron, L.P.; et al. The EC-earth3 Earth system model for the climate model intercomparison project 6. Geosci. Model Dev. Discuss. 2021, 2021, 1–90. [Google Scholar]
  46. Volodin, E.M.; Mortikov, E.V.; Kostrykin, S.V.; Galin, V.Y.; Lykossov, V.N.; Gritsun, A.S.; Diansky, N.A.; Gusev, A.V.; Iakovlev, N.G.; Shestakova, A.A.; et al. Simulation of the modern climate using the INM-CM48 climate model. Russ. J. Numer. Anal. Math. 2018, 33, 367–374. [Google Scholar] [CrossRef]
  47. Volodin, E.; Gritsun, A. Simulation of observed climate changes in 1850–2014 with climate model INM-CM5. Earth Syst. Dyn. 2018, 9, 1235–1242. [Google Scholar] [CrossRef]
  48. Yukimoto, S.; Kawai, H.; Koshiro, T.; Oshima, N.; Yoshida, K.; Urakawa, S.; Tsujino, H.; Deushi, M.; Tanaka, T.; Hosaka, M.; et al. The Meteorological Research Institute Earth System Model version 2.0, MRI-ESM2. 0: Description and basic evaluation of the physical component. J. Meteorol. Soc. Jpn. Ser. II 2019, 97, 931–965. [Google Scholar] [CrossRef]
  49. Yukimoto, S.; Yoshimura, H.; Hosaka, M.; Sakami, T.; Tsujino, H.; Hirabara, M.; Tanaka, T.Y.; Deushi, M.; Obata, A.; Nakano, H.; et al. Meteorological research institute-earth system model version 1 (MRI-ESM1)-model description. Meteorol. Res. Inst. Tech. Rep. 2011, 64, 92. [Google Scholar]
  50. Seland, Ø.; Bentsen, M.; Olivié, D.; Toniazzo, T.; Gjermundsen, A.; Graff, L.S.; Debernard, J.B.; Gupta, A.K.; He, Y.-C.; Kirkevåg, A.; et al. Overview of the Norwegian Earth System Model (NorESM2) and key climate response of CMIP6 DECK, historical, and scenario simulations. Geosci. Model Dev. 2020, 13, 6165–6200. [Google Scholar] [CrossRef]
  51. Lee, W.L.; Wang, Y.C.; Shiu, C.J.; Tsai, I.c.; Tu, C.Y.; Lan, Y.Y.; Chen, J.P.; Pan, H.L.; Hsu, H.H. Taiwan Earth System Model Version 1: Description and evaluation of mean state. Geosci. Model Dev. 2020, 13, 3887–3904. [Google Scholar] [CrossRef]
  52. Piani, C.; Weedon, G.P.; Best, M.; Gomes, S.M.; Viterbo, P.; Hagemann, S.; Haerter, J.O. Statistical bias correction of global simulated daily precipitation and temperature for the application of hydrological models. J. Hydrol. 2010, 395, 199–215. [Google Scholar] [CrossRef]
  53. Ringard, J.; Seyler, F.; Linguet, L. PA quantile mapping bias correction method based on hydroclimatic classification of the Guiana Shield. Sensors 2017, 17, 1413. [Google Scholar] [CrossRef]
  54. Moses, O.; Blamey, R.; Reason, C. Extreme rainfall events over the Okavango river basin, southern Africa. Weather. Clim. Extrem. 2023, 41, 100589. [Google Scholar] [CrossRef]
  55. Weber, T.; Cabos, W.; Sein, D.V.; Jacob, D. Benefits of simulating precipitation characteristics over Africa with a regionally-coupled atmosphere–ocean model. Clim. Dyn. 2023, 60, 1079–1102. [Google Scholar] [CrossRef]
  56. Rouault, M.; Dieppois, B.; Tim, N.; Hünicke, B.; Zorita, E. Southern Africa Climate Over the Recent Decades: Description, Variability and Trends. In Sustainability of Southern African Ecosystems under Global Change: Science for Management and Policy Interventions; Springer: Berlin/Heidelberg, Germany, 2024; pp. 149–168. [Google Scholar]
  57. Gampe, D.; Ludwig, R. Evaluation of gridded precipitation data products for hydrological applications in complex topography. Hydrology 2017, 4, 53. [Google Scholar] [CrossRef]
  58. Gordon, N.D.; Shaykewich, J. Guidelines on Performance Assessment of Public Weather Services; World Meteorological Organization: Geneva, Switzerland, 2000. [Google Scholar]
  59. Enayati, M.; Bozorg-Haddad, O.; Bazrafshan, J.; Hejabi, S.; Chu, X. Bias correction capabilities of quantile mapping methods for rainfall and temperature variables. J. Water Clim. Chang. 2021, 12, 401–419. [Google Scholar] [CrossRef]
  60. Dasari, H.P.; Salgado, R.; Perdigao, J.; Challa, V.S. A regional climate simulation study using WRF-ARW model over Europe and evaluation for extreme temperature weather events. Int. J. Atmos. Sci. 2014, 2014, 704079. [Google Scholar] [CrossRef]
  61. Chen, J.; Li, G. Estimation of monthly mean solar radiation from air temperature in combination with other routinely observed meteorological data in Yangtze River basin in China. Meteorol. Appl. 2012, 10, 1002. [Google Scholar]
  62. Taylor, K.E. Summarizing multiple aspects of model performance in a single diagram. J. Geophys. Res. Atmos. 2001, 106, 7183–7192. [Google Scholar] [CrossRef]
  63. Wang, B.; Zheng, L.; Liu, D.L.; Ji, F.; Clark, A.; Yu, Q. Using multi-model ensembles of CMIP5 global climate models to reproduce observed monthly rainfall and temperature with machine learning methods in Australia. Int. J. Climatol. 2018, 38, 4891–4902. [Google Scholar] [CrossRef]
  64. Zhu, H.; Jiang, Z.; Li, J.; Li, W.; Sun, C.; Li, L. Does CMIP6 inspire more confidence in simulating climate extremes over China? Adv. Atmos. Sci. 2020, 37, 1119–1132. [Google Scholar] [CrossRef]
  65. Ayugi, B.; Zhihong, J.; Zhu, H.; Ngoma, H.; Babaousmail, H.; Rizwan, K.; Dike, V. Comparison of CMIP6 and CMIP5 models in simulating mean and extreme precipitation over East Africa. Int. J. Climatol. 2021, 41, 6474–6496. [Google Scholar] [CrossRef]
  66. Ahmed, K.; Sachindra, D.A.; Shahid, S.; Demirel, M.C.; Chung, E.S. Selection of multi-model ensemble of general circulation models for the simulation of precipitation and maximum and minimum temperature based on spatial assessment metrics. Hydrol. Earth Syst. Sci. 2019, 23, 4803–4824. [Google Scholar] [CrossRef]
  67. Chen, J.; Brissette, F.P.; Zhang, X.J.; Chen, H.; Guo, S.; Zhao, Y. Bias correcting climate model multi-member ensembles to assess climate change impacts on hydrology. Clim. Chang. 2019, 153, 361–377. [Google Scholar] [CrossRef]
  68. Oseni, B.A.; Ayoola, F.J. Fitting the Statistical Distribution for Daily Rainfall in Ibadan, Based On Chi-Square and Kolmogorov-Smirnov Goodness-Of-Fit Tests. West Afr. J. Ind. Acad. Res. 2013, 7, 93–100. [Google Scholar]
  69. Jury, M.R.; Parker, B.; Raholijao, N.; Nassor, A. Variability of summer rainfall over Madagascar: Climatic determinants at interannual scales. Int. J. Climatol. 1995, 15, 1323–1332. [Google Scholar] [CrossRef]
  70. Macron, C.; Richard, Y.; Garot, T.; Bessafi, M.; Pohl, B.; Ratiarison, A.; Razafindrabe, A. Intraseasonal rainfall variability over Madagascar. Mon. Weather. Rev. 2016, 144, 1877–1885. [Google Scholar] [CrossRef]
  71. Kalognomou, E.A.; Lennard, C.; Shongwe, M.; Pinto, I.; Favre, A.; Kent, M.; Hewitson, B.; Dosio, A.; Nikulin, G.; Panitz, H.J.; et al. A diagnostic evaluation of precipitation in CORDEX models over southern Africa. J. Clim. 2013, 26, 9477–9506. [Google Scholar] [CrossRef]
  72. Papadimitriou, L.V.; Koutroulis, A.G.; Grillakis, M.G.; Tsanis, I.K. High-end climate change impact on European runoff and low flows–exploring the effects of forcing biases. Hydrol. Earth Syst. Sci. 2016, 20, 1785–1808. [Google Scholar] [CrossRef]
  73. Maraun, D. Bias correction, quantile mapping, and downscaling: Revisiting the inflation issue. J. Clim. 2013, 26, 2137–2143. [Google Scholar] [CrossRef]
  74. Cannon, A.J.; Sobie, S.R.; Murdock, T.Q. Bias Correction of GCM Precipitation by Quantile Mapping: How Well Do Methods Preserve Changes in Quantiles and Extremes? J. Clim. 2015, 28, 6938–6959. [Google Scholar] [CrossRef]
  75. Vidrio-Sahagún, C.T.; He, J.; Pietroniro, A. Improved Correction of Extreme Precipitation through Explicit and Continuous Nonstationarity Treatment and the Metastatistical Approach. Water Resour. Res. 2025, 61, e2024WR037721. [Google Scholar] [CrossRef]
  76. Dosio, A.; Pinto, I.; Lennard, C.; Sylla, M.B.; Jack, C.; Nikulin, G. What can we know about recent past precipitation over Africa? Daily characteristics of African precipitation from a large ensemble of observational products for model evaluation. Earth Space Sci. 2021, 8, e2020EA001466. [Google Scholar] [CrossRef]
  77. Karypidou, M.C.; Katragkou, E.; Sobolowski, S.P. Precipitation over southern Africa: Is there consensus among global climate models (GCMs), regional climate models (RCMs) and observational data. Geosci. Model Dev. 2022, 15, 3387–3404. [Google Scholar] [CrossRef]
  78. Libanda, B.; Nkolola, N.B. Skill of CMIP5 models in simulating rainfall over Malawi. Model. Earth Syst. Environ. 2019, 5, 1615–1626. [Google Scholar] [CrossRef]
  79. Diallo, I.; Giorgi, F.; Sukumaran, S.; Stordal, F.; Giuliani, G. Evaluation of RegCM4 driven by CAM4 over Southern Africa: Mean climatology, interannual variability and daily extremes of wet season temperature and precipitation. Theor. Appl. Climatol. 2015, 121, 749–766. [Google Scholar] [CrossRef]
  80. Akinsanola, A.A.; Wenhaji, C.N.; Barimalala, R.; Monerie, P.-A.; Dixon, R.D.; Tamoffo, A.T.; Adeniyi, M.O.; Ongoma, V.; Diallo, I.; Gudoshava, M.; et al. Modeling of Precipitation over Africa: Progress, Challenges, and Prospects. Adv. Atmos. Sci. 2025, 1–28. [Google Scholar] [CrossRef]
  81. Barimalala, R.; Blamey, R.C.; Desbiolles, F.; Reason, C.J.C. The influence of southeastern African river valley jets on regional rainfall. Clim. Dyn. 2021, 57, 2905–2920. [Google Scholar] [CrossRef]
  82. Mishra, V.; Kumar, D.; Ganguly, A.R.; Sanjay, J.; Mujumdar, M.; Krishnan, R.; Shah, R.D. Reliability of regional and global climate models to simulate precipitation extremes over India. J. Geophys. Res. Atmos. 2014, 119, 9301–9323. [Google Scholar] [CrossRef]
  83. Agel, L.; Barlow, M. How well do CMIP6 historical runs match observed Northeast US Precipitation and extreme precipitation—Related circulation. J. Clim. 2020, 33, 9835–9848. [Google Scholar] [CrossRef]
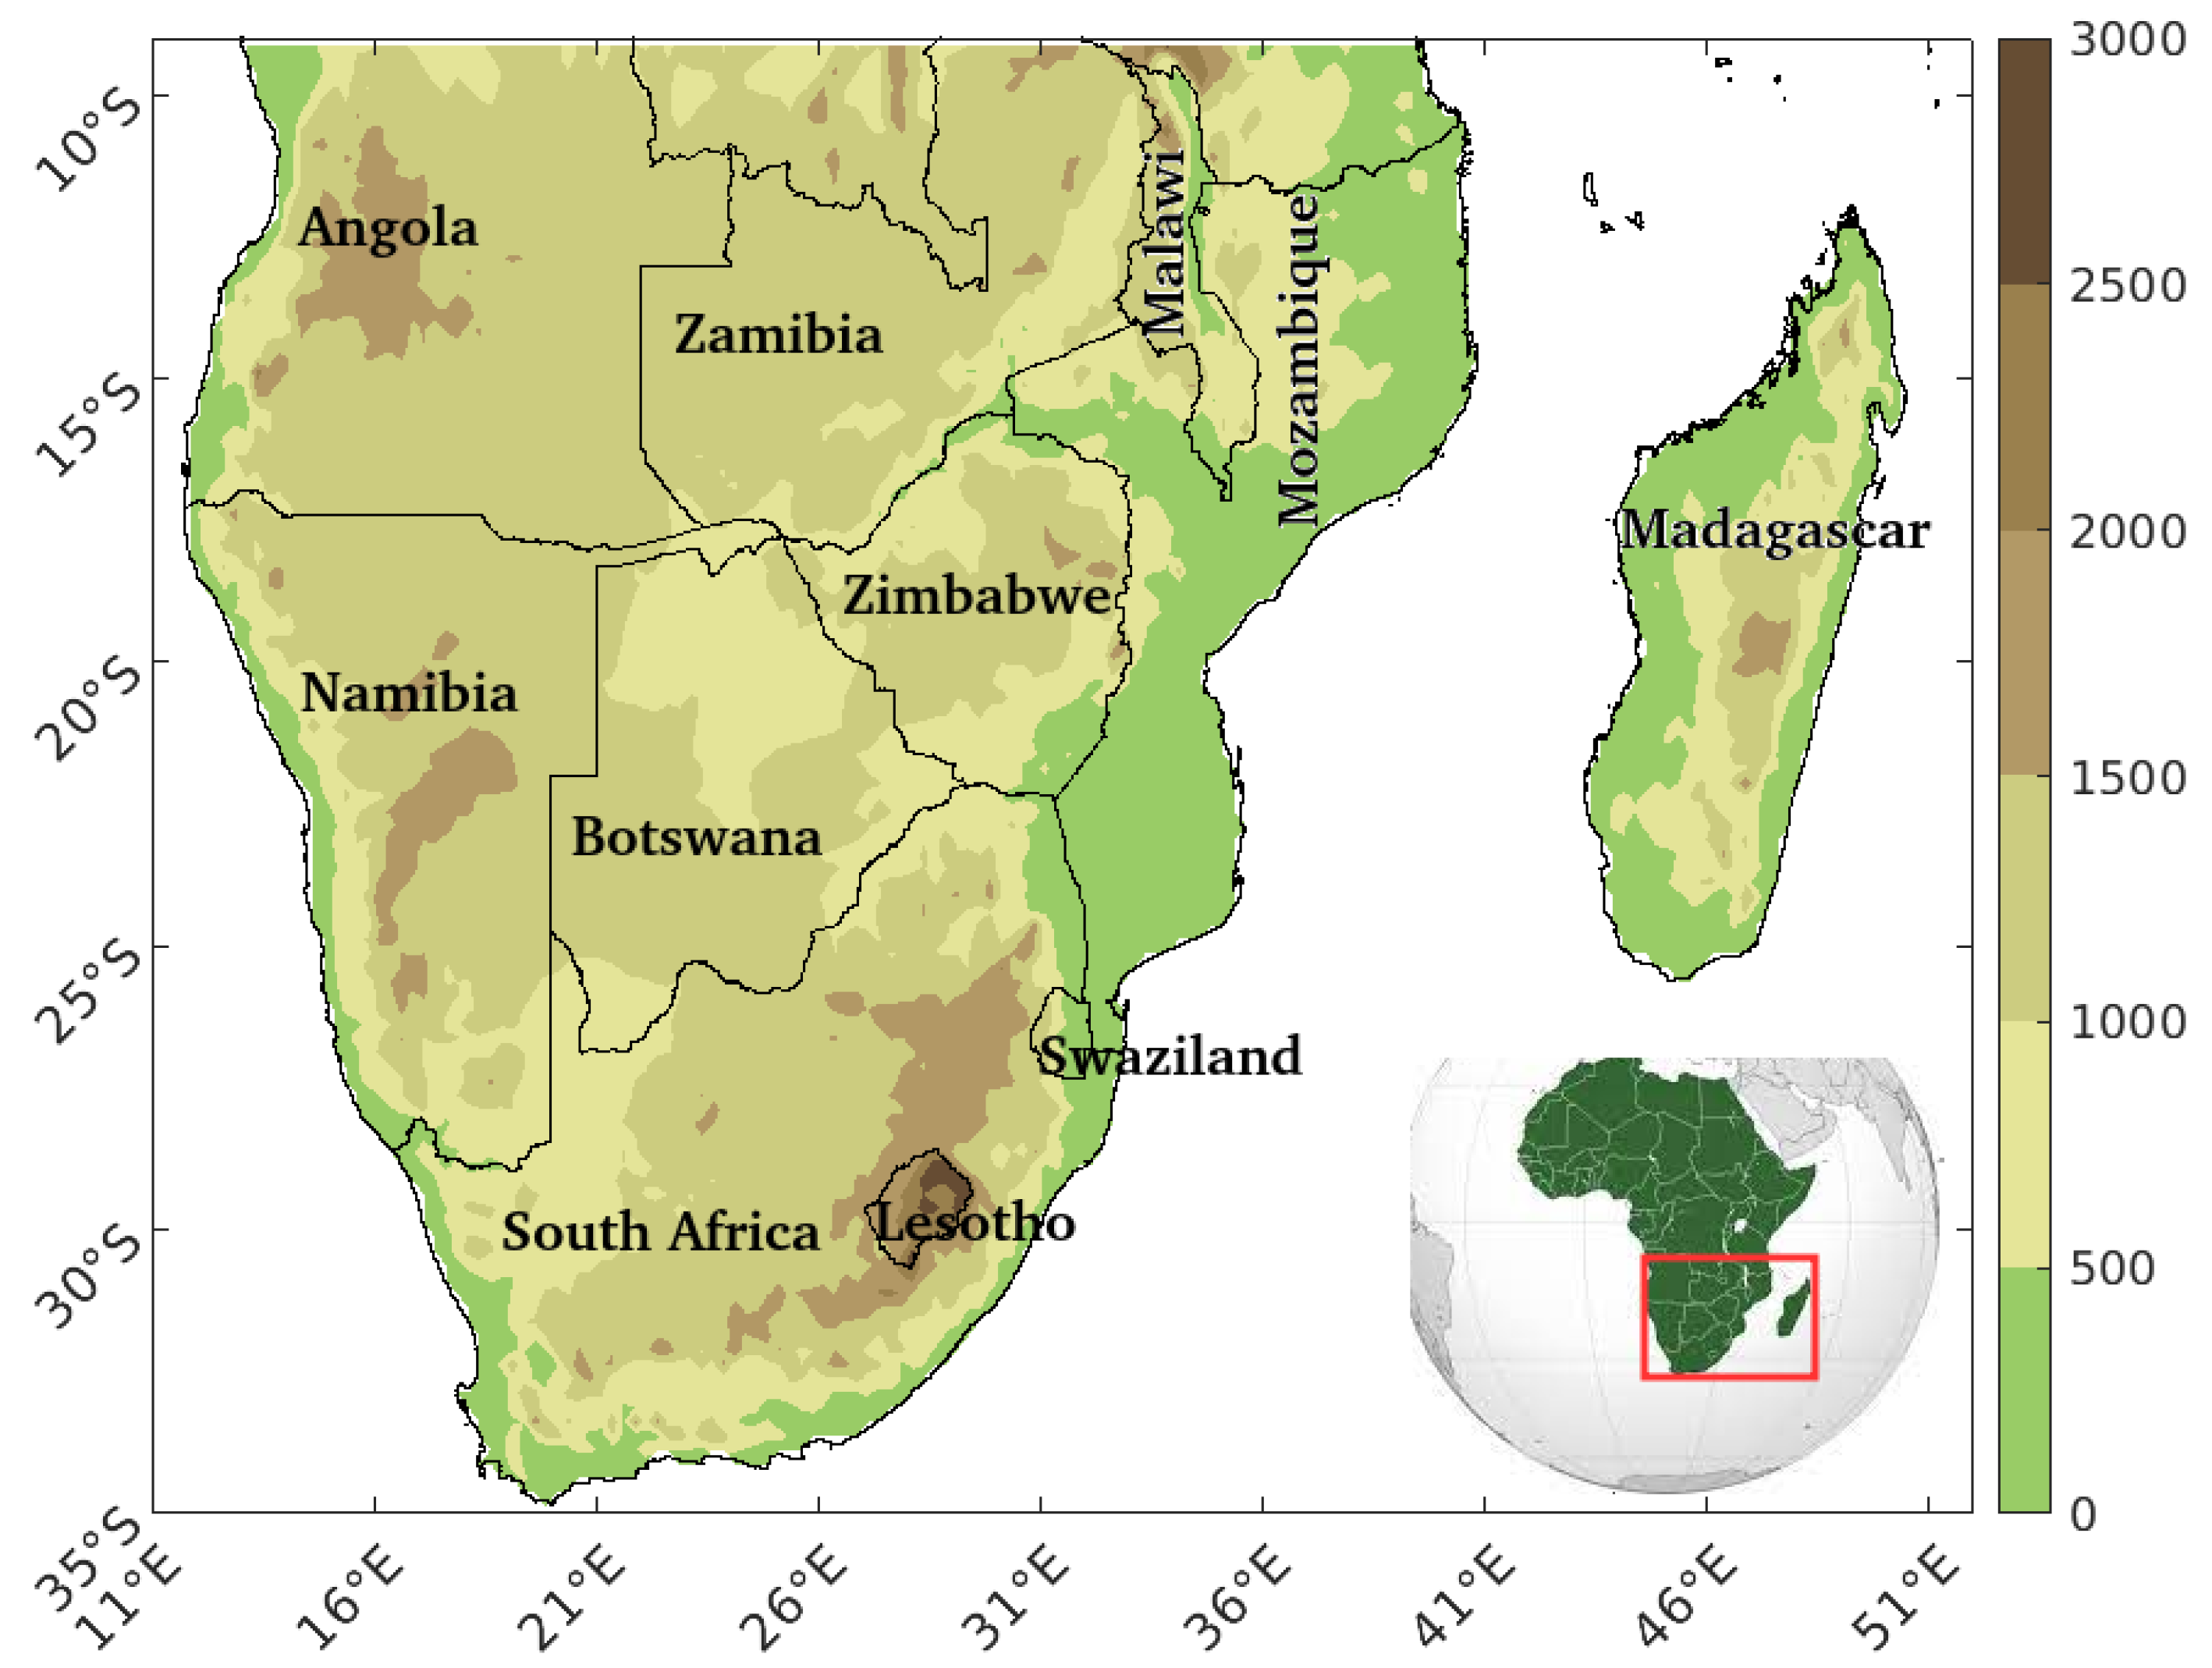
Figure 1. The study region is located in Africa as shown in red box. The zoomed inset displays the elevation (in meters) and the borders of the countries within the study area. The surface elevation data are from ETOPO2 [36].
Climate 13 00095 g001
Figure 2. The climatological (1982–2014) spatial distribution of the mean precipitation is shown for (ac) observations (CHIRPS, GPCC, and CRU) and then the merged ensemble means from raw-GCM (d), QDM95 (e), QDM (f), and SDM (g). The biases of the MME relative to CHIRPS (hk), the GPCC (lo), and the CRU (ps) are also presented.
Climate 13 00095 g002
Figure 3. The spatial distribution of the DJF seasonal climatology of precipitation (mm/month) over Southern Africa is depicted using eleven CMIP6 GCM models, where the 1st column represents raw-GCM and the 2nd, 3rd, and 4th columns represent QDM95, QDM, and SDM bias-corrected technique precipitation for the period 1982–2014: (ad) CESM2, (eh) CM2-SR5, (il) CMCC-ESM2, (mp) Earth3, (qt) Earth3-Veg, (ux) INM-CM4, (ybb) INM-CM5, (ccff) MPI-ESM1, (ggjj) MRI-ESM2, (kknn) NorESM2, and (oorr) TaiESM1.
Climate 13 00095 g003
Figure 4. Annual cycle of mean monthly precipitation in Southern Africa for the period 1982–2014 based on the GPCC, CHIRPS, CRU, and eleven CMIP6 raw GCM (bias-uncorrected) and three different bias correction techniques. Panel (a) presents the uncorrected raw General Circulation Model (GCM) output. Panel (b) displays results using quantile distribution mapping at the 95th percentile (QDM95). Panel (c) shows quantile distribution mapping (QDM). Finally, panel (d) illustrates the scaled distribution mapping (SDM).
Climate 13 00095 g004
Figure 5. Spatial bias in DJF seasonal precipitation (mm) is assessed for the raw GCM (uncorrected) and bias-corrected CMIP6 simulations relative to CHIRPS. The 1st, 2nd, 3rd, and 4th columns represent raw-GCM, QDM95, QDM, and SDM, respectively, during the period 1982–2014: (ad) CESM2, (eh) CM2-SR5, (il) CMCC-ESM2, (mp) Earth3, (qt) Earth3-Veg, (ux) INM-CM4, (ybb) INM-CM5, (ccff) MPI-ESM1, (ggjj) MRI-ESM2, (kknn) NorESM2, and (oorr) TaiESM1.
Climate 13 00095 g005
Figure 6. The same as Figure 5 but relative to the GPCC.
Climate 13 00095 g006
Figure 7. The same as Figure 5 but relative to the CRU.
Climate 13 00095 g007
Figure 8. The probability density of the observed DJF precipitation over Southern Africa during 1982–2014 is compared among the CHIRPS and GPCC datasets, along with the uncorrected and bias-corrected CMIP6 GCM models:(a) CESM2, (b)CM-SR5, (c) CMCC-ESM2, (d) Earth3, (e) Earth3-Veg, (f) INM-CM4, (g) INM-CM5, (h) MPI-ESM1, (i) MRI-ESM2, (j) NorESM2, (k) TaiESM1, and (l) MME.
Climate 13 00095 g008
Figure 9. Statistical scores for the DJF seasonal mean precipitation (a), MB (b), RMSE (c) and R (d), mean ratio (e), and TSS (f) compared to the CHIRPS data, respectively, for both the bias-corrected (i.e., QDM95, QDM, and SDM) and bias-uncorrected (raw-GCM) CMIP6 model results over Southern Africa from 1982 to 2014.
Climate 13 00095 g009
Figure 10. The same as Figure 9 but as compared to the GPCC dataset.
Climate 13 00095 g010
Figure 11. The same as Figure 9 but as compared to the CRU dataset.
Climate 13 00095 g011
Table 1. List of CMIP6 global climate models used in this study.
Model NameInstitutionMain ReferenceVariant LabelResolution ( l o n × l a t )Acronym
CESM2-WACCMNational Center for Atmospheric ResearchDanabasoglu [42]r1i1p1f1 1.25 × 0.94 CESM2
CMCC-CM2-SR5  Euro-Mediterranean Center for Climate Change (Italy)Cherchi et al. [43]r1i1p1f1 1.25 × 0.94 CM2-SR5
CMCC-ESM2Euro-Mediterranean Center for Climate Change (Italy)Fogli et al. [44]r1i1p1f1 1.3 × 0.94 CMCC-ESM2
EC-Earth3EC-Earth Consortium (Europe)Döscher et al. [45]r1i1p1f1 0.7 × 0.7 Earth3
EC-Earth3
-Veg
EC-Earth Consortium (Europe)Döscher et al. [45]r1i1p1f1 0.7 × 0.7 Earth3-Veg
INM-CM4
-8
Institute for Numerical Mathematics (Rus.)Volodin et al. [46]r1i1p1f1 2 × 1.5 INM-CM4
INM-CM5
-0
Institute for Numerical Mathematics (Rus.)Volodin and Gritsun [47]r1i1p1f1 2 × 1.5 INM-CM5
MPI-ESM1
-2-HR
Max Planck Institute for Meteo. (Germany)Yukimoto et al. [48]r1i1p1f1 0.94 × 0.94 MPI-ESM1
MRI-ESM2
-0
Meteorological Research Institute (Japan)Yukimoto et al. [49]r1i1p1f1 1.13 × 1.13 MRI-ESM2
NorESM2-MMNorwegian Climate Centre, NorwaySeland et al. [50]r1i1p1f1 1.25 × 0.94 NorESM2
TaiESM1Research Center for Environmental Changes (Taiwan)Lee et al. [51]r1i1p1f1 1.25 × 0.94 TaiESM1
Table 2. The Kolmogorov–Smirnov (K–S) test statistics for precipitation from eleven native and bias-corrected CMIP6 GCMs and their ensemble mean (MME) over Southern Africa. Columns h = 0 and h = 1 represent the percentage of precipitation grids that follow null and alternative hypotheses.
Model NameRaw-GCMQDM95QDMSDM
h = 0h = 1K-Sh = 0h = 1K-Sh = 0h = 1K-Sh = 0h = 1K-S
(%)(%) (%)(%) (%)(%) (%)(%)
CESM234660.269263370.258489110.245766340.2489
CM2-SR532680.272548520.255085150.240863370.2478
CMCC-ESM231690.271150500.254985150.238163370.2580
Earth340600.255562380.247276240.239877230.2494
Earth3-Veg40600.253962380.247679210.240276240.2492
INM-CM443570.264357430.25439190.234574260.2422
INM-CM543570.266062380.25169370.231977230.2368
MPI-ESM129710.293055450.250973270.243171290.2437
MRI-ESM234660.282856440.259371290.250973270.2483
NorESM234660.269651490.252273270.245681190.2460
TaiESM136640.267957430.253788120.241074260.2462
MME33670.305971290.265770300.272465350.2872
Table 3. Statistical scores for bias-corrected and uncorrected CMIP6 model results for the DJF season are compared to CHIRPS data over Southern Africa from 1982 to 2014.
Model
Name
Bias Uncorrected
and Corrected
Seas. Mean
(mm/Month)
MB
(mm/Month)
RMSE
(mm/Month)
RStdv
(mm/Month)
Mean RatioTSS
CHIRPS (obs.) 165.4700180.211
CESM2Raw-GCM230.1164.5982.080.76084.211.040.60
QDM95157.86−7.4626.680.98058.770.730.86
QDM158.10−7.6026.180.97859.070.730.87
SDM152.60−12.5228.770.97957.650.710.86
CM2-SR5Raw-GCM254.6989.2298.240.83396.011.190.68
QDM95155.73−9.7319.920.97867.070.840.93
QDM159.41−6.0516.320.97869.120.860.94
SDM163.413−2.3420.720.97864.470.800.91
CMCC-ESM2Raw-GCM251.9186.4494.290.84897.081.210.70
QDM95156.85−8.6119.280.98466.860.830.94
QDM161.10−4.3615.320.97970.610.880.95
SDM151.57−13.8929.530.98458.130.720.87
Earth3Raw-GCM248.1482.6786.500.89383.211.030.80
QDM95158.44−7.0218.950.98764.510.800.93
QDM166.060.5910.940.97871.710.890.95
SDM162.34−3.1216.850.98466.590.830.94
Earth3-VegRaw-GCM248.6283.1587.510.88578.910.980.79
QDM95158.19−7.2722.730.98560.690.750.90
QDM165.860.3914.600.98367.030.830.94
SDM161.13−4.3316.850.98766.130.820.94
INM-CM4Raw-GCM262.8597.38103.440.868108.161.350.69
QDM95154.74−10.7234.510.97652.860.650.80
QDM153.19−12.2734.520.97753.300.660.82
SDM163.95−1.5128.930.97255.250.680.82
INM-CM5Raw-GCM288.76123.29128.110.85696.621.200.71
QDM95157.20−8.2632.820.97053.140.660.79
QDM155.41−10.0532.490.96954.360.670.81
SDM153.25−12.2135.600.97652.010.640.79
MPI-ESM1Raw-GCM188.2422.7749.300.74174.440.930.57
QDM95159.84−5.6221.450.98463.440.790.92
QDM166.230.7618.710.98264.640.810.92
SDM169.173.7018.390.98265.350.820.93
MRI-ESM2Raw-GCM221.1255.6565.860.79879.670.990.65
QDM95158.18−7.2825.710.98059.750.750.88
QDM161.01−4.4222.450.97661.670.770.89
SDM164.92−3.5422.090.98261.480.770.90
NorESM2Raw-GCM199.9534.4845.160.87083.501.040.76
QDM95157.53−7.9323.760.98160.970.760.89
QDM156.97−8.4922.940.98062.400.780.90
SDM154.88−10.5825.190.98162.550.780.91
TaiESM1Raw-GCM238.4973.0282.950.83288.301.110.70
QDM95150.32−15.1431.570.97957.390.720.86
QDM153.87−11.5927.790.97360.020.750.87
SDM163.05−2.4122.400.96763.880.790.89
MMERaw-GCM239.3573.8883.950.83588.191.090.70
QDM95156.81−8.6525.220.98060.500.750.88
QDM159.74−5.7222.030.97863.080.770.90
SDM159.76−5.7024.110.97961.220.760.89
Table 4. Same as Table 3 but compared to the GPCC.
Model
Name
Bias Uncorrected
and Corrected
Seas. Mean
(mm/Month)
MB
(mm/Month)
RMSE
(mm/Month)
RStdv
(mm/Month)
Mean RatioTSS
GPCC (obs.) 163.6500178.511
CESM2Raw-GCM229.9466.2884.120.74484.671.070.57
QDM95157.72−5.9224.590.95558.690.750.84
QDM157.86−5.7924.780.94458.980.750.82
SDM152.81−10.8426.270.96257.560.730.84
CM2-SR5Raw-GCM254.6490.98100.550.83696.481.220.68
QDM95155.57−8.0721.020.96466.970.850.91
QDM159.26−4.3918.700.95969.050.870.91
SDM162.99−0.6620.650.95364.400.820.87
CMCC-ESM2Raw-GCM251.8488.1996.740.84497.511.240.69
QDM95156.69−6.9619.500.96766.710.850.91
QDM160.48−2.7117.510.95570.480.900.90
SDM151.44−11.2127.130.96058.050.740.84
Earth3Raw-GCM248.8885.2390.600.87083.911.060.76
QDM95158.83−4.8116.820.96164.780.830.89
QDM166.482.8313.020.95272.000.920.90
SDM162.59−2.2215.100.95866.840.850.89
Earth3-VegRaw-GCM249.1985.5391.310.85979.751.010.75
QDM95158.41−5.2420.040.95560.920.780.86
QDM166.482.4415.110.95167.280.860.88
SDM162.59−2.2214.960.95866.360.850.89
INM-CM4Raw-GCM262.5298.86106.700.868108.381.380.69
QDM95154.74−8.9132.370.97152.860.670.81
QDM153.19−10.4532.220.97353.300.680.82
SDM163.9050.2927.580.96655.250.700.83
INM-CM5Raw-GCM288.29124.64130.530.85396.761.200.71
QDM95157.20−6.4429.890.96653.140.680.80
QDM155.41−8.2429.870.96154.360.690.81
SDM153.25−10.4033.460.97452.010.660.80
MPI-ESM1Raw-GCM188.7925.1452.670.72574.770.950.55
QDM95159.71−3.9319.550.96463.150.800.89
QDM166.092.4318.620.95864.260.820.88
SDM169.075.4218.620.95665.080.830.88
MRI-ESM2Raw-GCM220.8657.2168.550.77479.901.010.62
QDM95158.08−5.5622.710.95859.720.760.85
QDM160.95−2.6920.140.95361.650.790.86
SDM161.82−1.8219.310.96161.440.780.87
NorESM2Raw-GCM200.0436.3948.510.86183.941.060.75
QDM95157.39−6.2522.390.96160.900.780.87
QDM156.84−6.8022.330.95862.340.790.87
SDM154.72−8.9224.650.96062.420.780.88
TaiESM1Raw-GCM238.2274.5785.080.83088.591.130.69
QDM95150.18−13.4629.460.95657.280.730.83
QDM153.74−9.9026.280.94559.920.760.83
SDM162.89−0.7622.180.94663.770.810.86
MMERaw-GCM239.3875.7386.850.82488.611.120.68
QDM95156.78−6.8723.490.96260.470.770.86
QDM159.71−3.9321.690.95563.060.800.86
SDM159.72−3.9222.720.95961.200.780.86
Table 5. Same as Table 3 but compared to the CRU.
Model
Name
Bias Uncorrected
and Corrected
Seas. Mean
(mm/Month)
MB
(mm/Month)
RMSE
(mm/Month)
RStdv
(mm/Month)
Mean RatioTSS
CRU (obs.) 165.5600177.601
CESM2Raw-GCM230.1164.2180.570.76084.211.070.57
QDM95157.86−7.8623.790.98058.770.750.84
QDM158.10−7.7223.670.97859.070.750.83
SDM152.60−12.7326.110.97957.650.740.84
CM2-SR5Raw-GCM254.6988.6997.150.83396.011.210.68
QDM95155.73−10.0219.620.97867.070.860.90
QDM159.41−6.3716.640.97869.120.880.90
SDM163.413−2.6418.190.97864.470.820.88
CMCC-ESM2Raw-GCM251.9185.8193.2250.84897.081.230.70
QDM95156.85−8.8918.160.98466.860.850.91
QDM161.10−4.6415.340.97970.610.900.91
SDM151.57−14.1626.930.98458.130.740.85
Earth3Raw-GCM248.1482.0086.450.89383.211.050.75
QDM95158.44−7.1117.170.98764.510.830.89
QDM166.060.4910.760.97871.710.920.90
SDM162.34−3.2214.190.98466.590.850.90
Earth3-VegRaw-GCM248.6287.2087.510.88578.911.000.74
QDM95158.19−7.3620.220.98560.690.780.86
QDM165.860.2912.920.98367.030.860.89
SDM161.13−4.3914.530.98766.130.850.90
INM-CM4Raw-GCM262.8596.60103.570.868108.161.380.71
QDM95154.74−10.8232.830.97652.860.680.81
QDM153.19−12.3632.910.97753.300.680.82
SDM163.95−1.6127.750.97255.250.710.83
INM-CM5Raw-GCM288.76122.78127.670.85696.621.230.73
QDM95157.20−8.3530.670.97053.140.680.81
QDM155.41−10.1530.780.96954.360.700.82
SDM153.25−12.3133.920.97652.010.670.81
MPI-ESM1Raw-GCM188.2422.3147.980.74174.440.940.54
QDM95159.84−5.6818.990.98463.440.810.88
QDM166.230.6816.670.98264.640.830.88
SDM169.173.6616.540.98265.350.840.89
MRI-ESM2Raw-GCM221.1255.5065.450.79879.671.020.62
QDM95158.18−7.4322.730.98059.750.760.86
QDM161.01−4.5819.600.97661.670.790.87
SDM164.92−3.6618.940.98261.480.790.88
NorESM2Raw-GCM199.9534.0744.290.87083.501.060.74
QDM95157.53−8.2121.470.98160.970.780.87
QDM156.97−8.7421.130.98062.400.800.86
SDM154.88−10.8823.640.98162.550.800.87
TaiESM1Raw-GCM238.4972.4681.4350.83288.301.120.70
QDM95150.32−15.3728.910.97957.390.730.84
QDM153.87−11.8325.110.97360.020.770.84
SDM163.05−2.7020.420.96763.880.820.86
MMERaw-GCM239.3573.3683.180.83588.191.120.68
QDM95156.81−8.8323.140.98060.500.770.86
QDM159.74−5.9020.500.97863.080.810.87
SDM159.76−5.8721.920.97961.220.780.86
Table 6. Comprehensive ranking (MR) of raw and bias-corrected CMIP6 GCMs for simulating precipitation over Southern Africa relative to CHIRPS, the GPCC, and the CRU for the period 1982–2014.
ModelBias CorrectionCHIRPSGPCCCRU
MRRankMRRankMRRank
CESM2Raw-GCM0.08390.08370.0739
QDM950.35270.37270.3326
QDM0.43250.38260.3824
SDM0.33280.33290.3525
MBCE0.35270.36280.3525
CM2-SR5Raw-GCM0.03410.04390.0340
QDM950.8360.9330.874
QDM0.8550.8940.838
SDM0.62160.60170.6314
MBCE0.78100.8280.799
CMCC-ESM2Raw-GCM0.08390.08400.0838
QDM950.9520.9810.972
QDM0.9810.9520.981
SDM0.39260.41250.4023
MBCE0.8270.8370.847
Earth3Raw-GCM0.13360.12380.1235
QDM950.8080.8190.7810
QDM0.9810.9330.953
SDM0.7990.78110.818
MBCE0.8830.8660.866
Earth3-VegRaw-GCM0.10370.09360.1036
QDM950.55190.48230.4820
QDM0.8640.79100.875
SDM0.8640.8280.847
MBCE0.76110.71120.7411
INM-CM4Raw-GCM0.08390.08370.0837
QDM950.26320.26320.2631
QDM0.29290.30300.3028
SDM0.28300.28310.3127
MBCE0.28300.28310.2929
INM-CM5Raw-GCM0.05400.06380.0739
QDM950.21340.21330.2034
QDM0.27310.28300.2830
SDM0.18350.20340.2133
MBCE0.23330.23310.2232
MPI-ESM1Raw-GCM0.09380.08370.0838
QDM950.8550.9330.924
QDM0.8640.8850.875
SDM0.68140.58180.6314
MBCE0.8080.8280.818
MRI-ESM2Raw-GCM0.09380.09360.0937
QDM950.53210.53210.5916
QDM0.61170.59180.6612
SDM0.64150.67140.6413
MBCE0.58170.63160.6015
NorESM2Raw-GCM0.23330.22320.2133
QDM950.48240.54200.5119
QDM0.68140.68130.6612
SDM0.64150.68130.6413
MBCE0.59170.63160.6015
TaiESM1Raw-GCM0.13360.13350.1334
QDM950.42260.47240.4422
QDM0.58180.56190.5617
SDM0.50230.51220.4820
MBCE0.50230.51220.4820
MMERaw-GCM0.10370.08370.0837
QDM950.51220.53210.5119
QDM0.70130.64150.6413
SDM0.43250.44250.4521
MBCE0.54200.53210.5318
Disclaimer/Publisher’s Note: The statements, opinions and data contained in all publications are solely those of the individual author(s) and contributor(s) and not of MDPI and/or the editor(s). MDPI and/or the editor(s) disclaim responsibility for any injury to people or property resulting from any ideas, methods, instructions or products referred to in the content.