Article

Extreme Weather Shocks and Crime: Empirical Evidence from China and Policy Recommendations

1
Department of Environmental Science & Engineering, Fudan University, Shanghai 200433, China
2
Fudan Tyndall Center, Fudan University, Shanghai 200433, China
*
Author to whom correspondence should be addressed.
Climate 2025, 13(5), 94; https://doi.org/10.3390/cli13050094
Submission received: 17 March 2025 / Revised: 1 May 2025 / Accepted: 2 May 2025 / Published: 3 May 2025

Abstract

:
Rising global temperatures and increasing extreme weather events pose challenges to social stability and public security. This study examines the relationship between extreme weather and crime in China using fixed-effects quasi-Poisson and negative binomial regression models, along with a generalized additive model to explore nonlinear effects. The results show that extreme heat significantly increases crime, following an “S” shaped pattern. This intense heat heightens emotional instability and impulsivity, leading to a crime surge. While moderate heat reduces crime, extreme cold and heavy rainfall have no significant effects. These findings highlight the need for stratified policy interventions. Based on empirical evidence, this study proposes three key recommendations: (1) developing a weather warning and public security risk coordination system, (2) promoting community-based crime prevention through mutual assistance networks and infrastructure improvements, and (3) enhancing psychological interventions to mitigate mental health challenges linked to extreme weather. Integrating meteorological data, law enforcement, and interventions to help potential perpetrators can strengthen urban resilience and public safety against climate-induced crime risks.

1. Introduction

Climate change has become one of the most pressing global challenges of the modern era, manifesting in persistent global temperature increases, a rising frequency of extreme weather events, and significant shifts in precipitation patterns [1]. According to the China Meteorological Administration’s global surface temperature dataset, the global average temperature from 2014 to 2023 was 1.2 °C higher than pre-industrial levels, marking the highest recorded temperature since 1850 [2]. This trend suggests a continuous warming of the global climate, accompanied by an increased risk of extreme weather events [3,4].
In China, a region particularly sensitive to climate change and significantly affected by its consequences, the frequency and intensity of extreme heat and heavy rainfall events have been increasing [2]. Long-term climate observations indicate that from 1961 to 2023, the occurrence of extreme heat events in China has risen sharply, with 2022 recording the highest frequency of such events since 1961 [2]. These extreme heat events have not only become more frequent but have also intensified and lasted longer. As rising temperatures increase atmospheric moisture-holding capacity, the frequency and intensity of extreme heavy rainfall events have also intensified. Projections suggest that under the ongoing global warming trend, extreme heat events in China will continue to increase over the next 30 years [2]. The average maximum extreme temperature in different regions is expected to rise by 1.7 °C to 2.8 °C, with the most pronounced increases in East China and western Xinjiang. Additionally, the average number of extreme heatwave days in China is expected to increase by 7 to 15 days. Under a high-emission scenario, extreme heat events that currently occur once every 50 years may become annual or biennial occurrences by the end of this century.
Beyond the physical manifestations of climate change, it is equally important to consider its psychological and behavioral effects on individuals. Extreme weather events, such as high temperatures and heavy rainfall, have profound impacts on agricultural production, energy supply, infrastructure operations, and social stability [5]. They may also serve as key triggers of social disorder, as individuals are more frequently exposed to various stressors under extreme weather conditions, leading to heightened emotions of anger, confusion, and fear [6]. These negative emotions can impair rational decision-making and may drive individuals to engage in actions that disrupt social order, with crime being perceived as a coping mechanism to alleviate or escape stress [7]. The root of this stress often stems from difficulties in adapting to extreme weather conditions. For instance, high temperatures have been linked to sleep deprivation, mood fluctuations, and psychological distress—factors closely associated with violent behavior [8,9,10,11,12]. The Generalized Temperature–Aggression Hypothesis [13], grounded in physiological and psychological perspectives, posits that temperature is a crucial environmental factor influencing human emotions and behaviors. This hypothesis suggests that high temperatures increase physiological stress—such as elevated heart rate and blood pressure—making individuals more prone to hostile emotions. Moreover, heat exposure negatively affects psychological states by increasing irritability and dissatisfaction, which in turn heightens the likelihood of aggressive behavior. Additionally, extreme weather events can exacerbate stress through physical injuries, property damage, housing destruction, and livelihood disruptions, compelling individuals and families to adopt risky or illegal means to cope with adversity [14,15,16]. Warm weather can also intensify social interactions, leading to greater crowding and disputes, which in turn increase the likelihood of outdoor violence [17,18]. For example, individuals are more likely to go out and consume more alcohol during hot weather, potentially contributing to heightened aggression [19,20]. Moreover, extreme weather events can reduce law enforcement capacity, further increasing both crime opportunities and the potential rewards of criminal activity [6,21]. These complex pathways highlight the potential link between extreme weather and crime, emphasizing the necessity of more effective social governance policies to mitigate the public security risks posed by extreme weather events.
The relationship between extreme weather and crime has increasingly become a focus of academic research, with numerous studies using daily, monthly, and annual panel data to examine the link between weather conditions and crime [22]. A growing body of evidence consistently finds that interpersonal violence increases with rising temperatures and, in some cases, with decreased precipitation [23,24,25]. This effect is evident not only in low-level aggressive behaviors—such as mistreatment of service workers and increased use of profane language on social media—but also in serious violent crimes, including rape, homicide, robbery, and assault [26,27]. Ranson, M. [7] used a 30-year monthly panel dataset and found that rising temperatures in the United States led to increases in homicides, rapes, assaults, robberies, burglaries, thefts, and motor vehicle thefts. Hu et al. [28] examined the effects of heat stress on violent and non-violent robberies in Beijing, China, and found that robbery patterns shifted under the influence of environmental factors, further affected by the social dynamics surrounding major events such as the 2008 Beijing Olympics. Both violent and non-violent robbery rates significantly increased with spring heat stress, while non-violent robberies also rose during summer heat stress. Meanwhile, in impoverished agricultural regions, such as rural India, anomalies in rainfall patterns have been shown to significantly affect crime rates, likely due to the role of agricultural output declines as a mediating factor [29].
However, studies examining the impact of extreme weather on crime in China remain relatively limited. This is largely due to the long-standing constraint of crime research in China, which has been hindered by the lack of comprehensive crime data. To address this gap, this study estimates extreme weather events at the prefecture level in China from 2013 to 2020 using climate statistics and historical climate data. The analysis covers all 333 prefecture-level administrative divisions (including cities, autonomous prefectures, and leagues), with both urban and rural areas within their jurisdictions accounting for approximately 85% of China’s total population according to the 2020 Chinese National Census. Furthermore, information was extracted from 8.6 million criminal case verdicts published on the China Judgments Online platform between 2013 and 2020 through machine learning-based text analysis. Based on the location of the cases and the year of judgment, datasets on total crime cases and total offenders for prefecture-level divisions were constructed. This approach allowed for an investigation into whether extreme weather events are correlated with crime across Chinese prefectures.
The key innovation of this study lies in the use of a novel data construction method, which enriches research on the relationship between extreme weather and crime while providing empirical evidence from China. Specifically, machine learning-based text analysis was employed to extract crime data from court verdicts, overcoming the limitations of traditional crime data collection and offering a new data source and analytical tool for social science research. Moreover, by integrating methodologies from meteorology, criminology, legal text analysis, and machine learning, this study not only expands the boundaries of climate change impact research but also establishes a methodological framework for future studies in this field. The findings offer valuable insights for both potential perpetrators and policymakers by clarifying how extreme weather influences criminal behavior. They provide a scientific foundation for mitigating weather-induced stress and for developing climate adaptation policies and social governance strategies.

2. Materials and Methods

2.1. Variable and Data Source

2.1.1. Data on Extreme Weather Events

Extreme weather events generally refer to meteorological phenomena that deviate significantly from the normal range in climatic statistics, occur infrequently, and exert substantial impacts. These events characterize the short-term, intense fluctuations associated with climate change. In this study, extreme weather events are defined by the following criteria: their occurrence frequency falls within the extreme tails of long-term historical data (e.g., below the 5th percentile or above the 95th percentile); their intensity or duration is markedly higher than normal levels; and they have the potential to cause significant societal, economic, and ecological consequences. In this study, the indicators for extreme weather events are categorized into three main types:
(1) Extreme cold events: Defined as periods of at least three consecutive days during which the daily average temperature falls below the 5th percentile of the long-term monthly average temperature distribution. The calculation formula is as follows:
E C E = { T i : T i < P 5 ( T m ) , i d 1 , d 2   a n d   ( d 2 d 1 + 1 ) 3 }
E C E represents the set of extreme cold events; T i denotes the daily average temperature on day   i ; P 5 ( T m ) refers to the 5th percentile of the long-term monthly average temperature distribution for each calendar month m ; T i < P 5 ( T m ) indicates that the daily average temperature T i falls below the 5th percentile threshold; and the time interval [ d 1 , d 2 ] represents a consecutive sequence of days, where the constraint   ( d 2 d 1 + 1 ) 3 ensures that the event lasts for at least three consecutive days.
(2) Extreme heat events: Defined as periods of at least three consecutive days during which the daily average temperature exceeds the 95th percentile of the long-term monthly average temperature distribution.
E H E = { T i : T i > P 95 ( T m ) , i d 1 , d 2   a n d   ( d 2 d 1 + 1 ) 3 }
E H E represents the set of extreme cold events; T i denotes the daily average temperature on day   i ; P 95 T m   refers to the 95th percentile of the long-term monthly average temperature distribution for each calendar month m ; T i > P 95 T m   indicates that the daily average temperature T i above the 95th percentile threshold; and the time interval [ d 1 , d 2 ] represents a consecutive sequence of days, where the constraint ( d 2 d 1 + 1 ) 3 ensures that the event lasts for at least three consecutive days.
(3) Heavy rainfall events: Defined as periods of at least three consecutive days during which the daily precipitation exceeds the 95th percentile of the long-term average monthly precipitation distribution.
H R E = { R i : R i > P 95 ( T m ) , i d 1 , d 2     a n d     ( d 2 d 1 + 1 ) 3 }
H R E represents the set of heavy rainfall events; R i denotes the daily average precipitation on day i ; and P 95 ( T m ) refers to the 95th percentile of the long-term daily precipitation distribution for each calendar month m . The condition T i > P 95 ( T m ) indicates that the daily average precipitation R i exceeds the 95th percentile threshold. The time interval [ d 1 , d 2 ] represents a consecutive sequence of days, where the constraint d 2 d 1 + 1 3 ensures that the event lasts for at least three consecutive days.
Temperature and precipitation data for China (1973–2020) were extracted from the Global Surface Summary of the Day (GSOD) dataset provided by the National Centers for Environmental Information (NCEI) of the United States. The 5th and 95th percentiles were derived from the distribution of long-term historical data spanning 1973–2012.

2.1.2. Data on Crimes

In 2013, the Provisional Measures for the Online Disclosure of Court Judgments issued by the Supreme People’s Court officially came into effect, mandating that all legally effective judgments, rulings, and decisions be published online, except in cases involving national security, juvenile crimes, and other legally specified exceptions. The China Judgments Online platform (https://wenshu.court.gov.cn, accessed on 3 May 2025) serves as the official repository for criminal cases adjudicated by courts across all 31 provinces and municipalities in China. Since 2013, court judgments have been regularly published within seven days of sentencing, providing detailed information on plaintiffs, defendants, judges, courts, case facts, rulings, indictment dates, judgment dates, and publication dates. To ensure the completeness and unbiased nature of the dataset, 2013 was set as the starting year of the sample period.
To measure crime outcomes, all criminal judgments issued in China between 1 January 2013 and 31 December 2020 were collected from the China Judgments Online platform, resulting in a total of 8,590,716 verdicts. Regardless of the type of crime, judicial decisions follow a standardized format, as court clerks typically adopt similar templates when drafting rulings. This uniformity allows for the extraction of key crime-related information, including offense types and the offenders. The raw court judgment texts were first preprocessed using Python scripts (v3.8.2), followed by further text analysis. An unsupervised machine learning technique, Latent Dirichlet Allocation (LDA), was employed to implement a three-layer Bayesian estimation. This method categorized case files based on keywords and contextual relationships, identified the typical locations where key variables appear, and extracted relevant information from unstructured text, such as the adjudicating court, offender characteristics, sentencing rationale, and sentencing outcomes. For further methodological details, refer to Darling, W.M. [30]. As a result, a unique regional time-series dataset was constructed, covering all Chinese cities over an eight-year period (2013–2020). The annual number of crime cases per city served as the primary measure of crime outcomes. Additionally, crime variables were expanded to capture the severity of criminal activity within each city, including the total offenders. To further validate the findings, a robustness check was conducted using an alternative outcome measurement approach.

2.1.3. Data of Control Variables

Control variables data came from the ‘China City Statistical Yearbook’ and the annual statistical yearbooks of each city. The model incorporates per capita GDP and the ratio of secondary industry output to control for local economic development and industrial structure. Population density was included to account for city population size, while public expenditure serves as a measure of local government investment in social governance. The average labor wage level was used to control for regional economic well-being. Table 1 shows the summary statistics of the key variables used in this study.

2.2. Econometric Model Settings

2.2.1. Fixed-Effects Quasi-Poisson Regression Model

This study employs a fixed-effects quasi-Poisson regression model to analyze the impact of extreme weather events on crime. The quasi-Poisson model is well-suited for count data and accounts for overdispersion, where the variance of observed data may exceed the mean, thereby overcoming the limitations of the standard Poisson model. This approach not only accurately captures the count nature of crime events but also leverages both cross-sectional and longitudinal information in panel data, providing more robust estimation results. The specific model specification is as follows:
l n E C r i m e c , t = α 0 + α 1 W e a t h e r c , t + α 2 X c , t +   δ c + δ t + ε c , t
This model assumes that the number of crime incidents C r i m e c , t in each city c in year t follows a quasi-Poisson distribution. W e a t h e r c , t represents a set of extreme weather event variables, including extreme heat events, extreme cold events, and heavy rainfall events. X c , t comprises a set of time-varying control variables reflecting fundamental city characteristics, including per capita GDP, the proportion of secondary industry output, population density, public expenditure level, and average labor wages. The parameters α 0 , α 1 , and α 2 are estimated based on the data. δ c denotes city fixed effects, which control for time-invariant city-specific heterogeneity, such as legal systems, cultural factors, and public security conditions. δ t represents time fixed effects, which account for time trends that may influence crime rates across all cities in specific years, such as economic crises or nationwide policy adjustments. ε c , t is the robust standard error clustered at the city level.

2.2.2. Generalized Additive Model

The Generalized Additive Model (GAM) is a non-parametric regression method that combines the interpretability of linear regression with the flexibility of nonlinear models. It allows independent variables to influence the dependent variable through non-parametric smooth functions. Crime incidents often cluster in the tail of the data distribution, with crime surges being particularly pronounced under extreme weather conditions. One key advantage of GAM is its ability to capture smooth nonlinear trends, such as how crime rates evolve as extreme heat events intensify—an aspect crucial for crime data analysis. This method provides a more refined analytical tool for comprehensively understanding the mechanisms through which climate change affects crime.
This study employs GAM to examine the nonlinear effects of extreme weather events (extreme cold events, extreme heat events, and heavy rainfall events) on crime. Additionally, city fixed effects and year fixed effects are incorporated to control for regional and temporal variations. The specific model is formulated as follows:
C r i m e c , t = θ 0 + s W e a t h e r c , t + θ 1 X c , t + δ c + δ t + ε c , t
s W e a t h e r c , t = j = 1 m β j B j ( W e a t h e r c , t )
In this model, C r i m e c , t represents the total number of crime incidents in city c in year t . s W e a t h e r c , t is a nonlinear smooth function of extreme weather events (extreme cold events, extreme heat events, and heavy rainfall events). This specification allows for a comprehensive examination of how total crime incidents respond to varying intensities of extreme weather events, facilitating a deeper understanding of the nonlinear effects of weather extremes on crime. B j ( W e a t h e r c , t ) denotes the basis functions, which are modeled using thin plate splines (TP splines). M represents the number of basis functions, determined by the effective degrees of freedom (edf). If e d f 1 , the variable’s effect is approximately linear, and the GAM smooth curve closely resembles a straight line. If e d f > 1 , the effect is nonlinear, resulting in a curved relationship that indicates a more complex pattern. X c , t comprises a set of time-varying control variables reflecting fundamental city characteristics, including per capita GDP, the proportion of secondary industry output, population density, public expenditure level, and average labor wages. δ c and δ t denote city fixed effects and time fixed effects, respectively. ε c , t represents the error term.

3. Results and Discussions

3.1. Analysis of Extreme Weather Event Characteristics in Chinese Prefecture-Level Units

As shown in Figure 1, the total number of extreme weather events in Chinese prefecture-level units exhibited distinct trends across different event types from 2013 to 2020. Extreme heat events consistently dominated, with an annual average of nearly 4000 occurrences, maintaining a high level despite minor fluctuations. This pattern aligns closely with the long-term trend of global warming. Heavy rainfall events showed a declining trend after 2016, reaching approximately 2000 occurrences in 2020, which may be attributed to changes in regional climate systems, urbanization processes, and shifts in Heavy rainfall patterns. In contrast, extreme cold events were relatively infrequent, fluctuating around 1400 occurrences, with an overall declining trend. This decline may reflect the suppressing effect of global warming on extremely cold weather. Overall, climate change is influencing both the frequency and types of extreme weather events, particularly the increasing occurrence of extreme heat and heavy rainfall events.
To examine the spatial heterogeneity of extreme weather events across China, Figure 2 illustrate the cumulative spatial distribution of extreme cold, extreme heat, and heavy rainfall events in Chinese prefecture-level administrative divisions from 2013 to 2020. As shown in Figure 2a, the mid-to-high percentile regions of extreme heat events are primarily concentrated in eastern coastal cities, the North China Plain, central China, northwestern China, and the Sichuan Basin in southwestern China, as well as Yunnan and Xinjiang. The enclosed topography of the Sichuan Basin contributes to a pronounced heat-trapping effect, significantly increasing the frequency of extreme heat events during summer. The high-percentile distribution in North China, Central China, and East China is closely linked to the influence of the subtropical high-pressure system during summer, which prolongs periods of extreme heat and intensifies the frequency of such events. Eastern coastal cities are also affected by the urban heat island effect, exacerbating temperature extremes. Low-percentile regions are primarily distributed in South China and Northeast China, where the occurrence of extreme heat events remains non-negligible.
As shown in Figure 2b, high-percentile regions of heavy rainfall events are primarily concentrated in northwestern and northeastern China. These regions experience a relatively high frequency of heavy rainfall events despite their overall low annual precipitation. This phenomenon may be attributed to the northward movement of the East Asian summer monsoon and warm moist airflows, which lead to intense, short-duration heavy rainfall in arid areas. Additionally, cities in South China, the lower reaches of the Yangtze River, and the middle and lower reaches of the Yellow River exhibit a high frequency of heavy rainfall events, which are closely associated with typhoons and monsoon-induced heavy rainfall. In contrast, cities in Hunan, Hubei, and Sichuan experience relatively lower frequencies of heavy rainfall events but remain vulnerable to risks posed by seasonal rainfall.
As shown in Figure 2c, high-percentile regions of extreme cold events are primarily concentrated in Northeast China, Xinjiang, as well as Guangxi, Hunan, and Jiangxi provinces. This indicates that these areas experience extreme cold events with high frequency, particularly in northeast China, where winter cold waves have a pronounced impact. Guangxi, Hunan, and Jiangxi exhibit a distinct clustering pattern of cold wave occurrences, likely due to strong temperature drops caused by southward-moving cold air masses. Despite the generally warm climate in southern China, extreme cold events in these regions tend to be particularly intense. In contrast, low-percentile regions are mainly distributed along the eastern coastal areas, including cities in Fujian, Zhejiang, Jiangsu, and Shandong. The relatively low frequency of extreme cold events in these areas is likely attributed to the moderating influence of oceanic regulation.

3.2. Analysis of Crime Data Characteristics in Chinese Prefecture-Level Units

First, the annual variation in national crime trends from 2013 to 2020 was analyzed by aggregating the total number of recorded crime cases and the total number of individuals involved in crime across all prefecture-level units. As shown in Figure 3, both total crime cases and the total offenders exhibit similar temporal trends. Between 2013 and 2020, the years 2016 and 2018 stand out as periods of heightened criminal activity. Crime incidents increased significantly from 2013, reaching a peak in 2016, followed by a decline in 2017. However, another surge occurred in 2018, marking a second peak, after which crime levels gradually declined slightly through 2020.
Furthermore, to examine the spatial heterogeneity of criminal activity across China, Figure 4 illustrate the spatial distribution of total crime cases and the offenders. The overall spatial distribution reveals a clear division along the Daxing’anling–Yinshan Mountains–Helan Mountains–Liupan Mountains–Hengduan Mountains line, with a distinct variation in crime levels. West of this boundary, crime rates are relatively low, whereas east of the boundary, crime incidents are significantly more frequent. This spatial pattern may be attributed to regional differences in population density. Due to favorable climatic conditions and other factors, the eastern region has a significantly higher population density than the western region. Higher population density is associated with more frequent social interactions and economic activities, which in turn increase the likelihood of criminal incidents.

3.3. Estimation Results of Baseline Model

To comprehensively assess the impact of extreme weather events on crime, a stepwise regression analysis approach was employed. Table 2 and Table 3 report the effects of extreme heat events on the total number of crime cases and the total offenders, based on the quasi-Poisson regression model. Specifically, (1) includes only the baseline model without controlling for any variables or fixed effects; (2) introduces fixed effects while excluding control variables; (3) incorporates a set of key control variables but omits fixed effects; and (4) represents the most comprehensive model, controlling for both fixed effects and control variables. In models without control variables, the regression coefficients decrease significantly with the inclusion of fixed effects. However, due to the influence of omitted variables, these estimates may be biased. In contrast, model (4), which accounts for both city and year fixed effects, minimizes omitted variable bias and thus provides more reliable estimates. In this model, the regression coefficient for extreme heat events remains positive and statistically significant at the 5% level. Notably, the estimated effects of extreme heat on total crime cases and total offenders are numerically similar, indicating that high temperatures not only increase the occurrence of crime incidents but also likely involve a larger number of individuals. This finding supports the interpretation that extreme heat might influence group behavior or criminal motivations, leading to a broader range of criminal activities rather than just increasing isolated incidents. In terms of model fit, the introduction of fixed effects substantially improves the Pseudo R2 and reduces the RMSE, demonstrating enhanced estimation precision. These results confirm that even after controlling for long-term city characteristics and time trends, the impact of extreme heat on crime remains robust. Furthermore, even when considering potential moderating factors such as economic activity, labor market conditions, and demographic characteristics, extreme heat appears to drive higher crime rates through short-term mechanisms. These mechanisms may include increased anxiety and aggression, reduced law enforcement efficiency, or changes in social interactions. Overall, the effect of extreme heat events on crime remains robust across different model specifications, with consistent impacts on both total crime cases and total offenders. This not only confirms their statistical correlation but also likely reflects actual behavioral changes in criminal activity under high-temperature conditions.
The regression results in Table 4 and Table 5 indicate that heavy rainfall events have a positive effect on both total crime cases and total offenders across different model specifications. However, the significance and magnitude of these effects vary with the inclusion of control variables and fixed effects. In the baseline model, model (1), the impact of heavy rainfall events on crime is statistically significant. However, in model (4), which incorporates city and year fixed effects along with key socioeconomic variables, the effect of heavy rainfall on total crime cases is no longer significant, whereas its effect on the offenders remains significant at the 10% level. This result indicates that during periods of heavy rainfall events, certain groups are more likely to exhibit increased violent or unlawful behavior. However, overall crime rates may be influenced by law enforcement intensity and changes in social order, thereby weakening the direct impact of precipitation on total crime cases. Additionally, in model (4), the pseudo R2 reaches its highest value, and the RMSE decreases further, demonstrating improved model explanatory power and estimation precision. Overall, the impact of heavy rainfall events on crime remains somewhat robust across different model specifications, particularly in the regression analysis of offender counts. Even after controlling for city fixed effects and key variables, this effect remains significant. However, in the regression analysis of total crime cases, the effect is no longer significant once fixed effects are included, suggesting that heavy rainfall may primarily influence the behavioral decisions of specific groups rather than the overall crime trend. These findings may also be interpreted through the lens of crime displacement theory. Although the total number of crime cases does not significantly change under heavy rainfall events once fixed effects are included, the persistent effect on total offenders suggests a possible shift in the form or structure of criminal behavior. Existing research on weather and crime has identified multiple forms of displacement during adverse weather conditions—including shifts in crime type (e.g., from outdoor to indoor offenses), spatial displacement (changes in crime locations), temporal displacement (delays or advances in criminal activity relative to the weather event), and target displacement (e.g., from public to private victims). The rise in offender counts during rainfall events could therefore reflect a transition in crime dynamics rather than an overall volume increase.
The regression results in Table 6 and Table 7 show that the effects of extreme cold events on total crime cases and total offenders vary across different model specifications. In the baseline model, model (1), extreme cold events have a significantly negative impact on crime. However, as city fixed effects are introduced in model (2) and socioeconomic control variables in model (3), this effect diminishes and eventually loses significance. In the most comprehensive model, model (4), which includes both city and year fixed effects as well as key socioeconomic controls, the impact of extreme cold events on crime remains statistically insignificant. This result indicates that extreme cold events do not significantly drive an increase in crime and, in some cases, may even be associated with a reduction in criminal activity. However, after controlling for long-term city characteristics and socioeconomic factors, this effect is no longer robust. Additionally, model (4) achieves the highest pseudo R2 and the lowest RMSE, demonstrating superior explanatory power and estimation accuracy. Overall, the impact of extreme cold events on crime appears to be largely moderated by city characteristics and socioeconomic factors rather than directly driven by temperature drops. Furthermore, in model (4), the effects of extreme cold events on both total crime cases and total offenders remain statistically insignificant, reinforcing the conclusion that their overall influence on crime is weak. Compared to extreme heat or heavy rainfall, extreme cold does not appear to directly stimulate criminal activity or affect law enforcement efficiency. Instead, its impact is more likely constrained by socioeconomic structures and urban environments.

3.4. Robustness Tests

To ensure the robustness of the results, alternative dependent variables and estimation models were employed for validation.
An aggregate measure of extreme weather events, summing extreme heat, cold, and heavy rainfall events, was used as the key weather indicator in regression analysis. Table 8 and Table 9 present the regression results for total crime cases and total offenders using this aggregated extreme weather event variable. The results indicate a significantly positive effect of extreme weather events on both total crime cases and total offenders, regardless of the model specification. In model (4), which includes control variables and fixed effects, the effect remains significantly positive. According to the estimated coefficients, an increase of one unit in extreme weather events leads to a 0.1% increase in both total crime cases and total offenders.
Additionally, negative binomial regression was employed to further verify the robustness of the estimates. While quasi-Poisson regression accounts for overdispersion by allowing the variance to exceed the mean, it remains based on the Poisson distribution assumption. In contrast, negative binomial regression explicitly models overdispersion, making it a suitable alternative for robustness checks. Table 10 and Table 11 report the effects of extreme heat, extreme cold, and heavy rainfall events on total crime cases and total offenders using negative binomial regression. The robustness test results align with the baseline regression findings: extreme heat events exhibit a significantly positive relationship with both total crime cases and total offenders, while heavy rainfall events also show a positive correlation with the offenders. In contrast, extreme cold events have no significant association with crime. The aggregated extreme weather event variable also maintains a significant correlation with both crime measures.

3.5. Nonlinear Effects

To capture how extreme weather events influence crime in complex ways, this study used a generalized additive model to test the impact of extreme weather on the total crime cases and total offenders. The results are illustrated in Figure 5, showing how different weather extremes affect total crime cases and total criminals. Extreme cold events have an effect on crime that is essentially linear. In the GAM analysis, the smoothing term had about 1 degree of freedom, indicating no nonlinear relationship. In simple terms, the influence of extreme cold on crime can be represented as a straight line (no curve). Statistical tests (p-values and F-values) further show that extreme cold events do not have a significant impact on either total crime cases or total offenders. In other words, very cold weather does not notably increase or decrease crime in this analysis.
Heavy rainfall events showed a nonlinear effect on crime, with smoothing degrees of freedom around 2.85 for total cases and 2.74 for total offenders, meaning the relationship is not a straight line. However, this curving effect is not statistically significant. The p-value for the rainfall effect is greater than 0.1, suggesting that any pattern in crime during heavy rain is weak or could be due to chance. Thus, heavy rain does not have a clear or reliable influence on the total crime cases or total offenders.
Extreme heat events exhibit a strong nonlinear impact on crime. The analysis found about 3.67 degrees of freedom for the effect on total crime cases and 3.49 for total offenders. Both the p-value and F-test indicate this effect is statistically significant. In other words, the influence of extreme heat on crime is both complex and significant. Figure 5c,d reveal an S-shaped relationship between extreme heat events and crime. When the intensity of extreme heat is low (just moderately hot), crime tends to decrease. However, as the extreme heat becomes more intense, its effect on crime turns positive and grows stronger, meaning higher temperatures eventually lead to increases in crime. This increase is not purely linear—it rises with some fluctuations (hence the S-shape). This finding indicates a complex pattern of how crime changes under different levels of extreme heat. In high temperatures, people are less inclined to go outside. With fewer people out and about, there are fewer chances for potential offenders to encounter victims or opportunities for crime. This leads to a lower incidence of certain types of crime during moderately hot conditions. Once the temperature exceeds a critical threshold, the intense heat causes physical and psychological stress to build up in people. This accumulated stress can trigger more aggressive or conflict-prone behavior, leading to an increase in crime rates.

4. Conclusions and Policy Implications

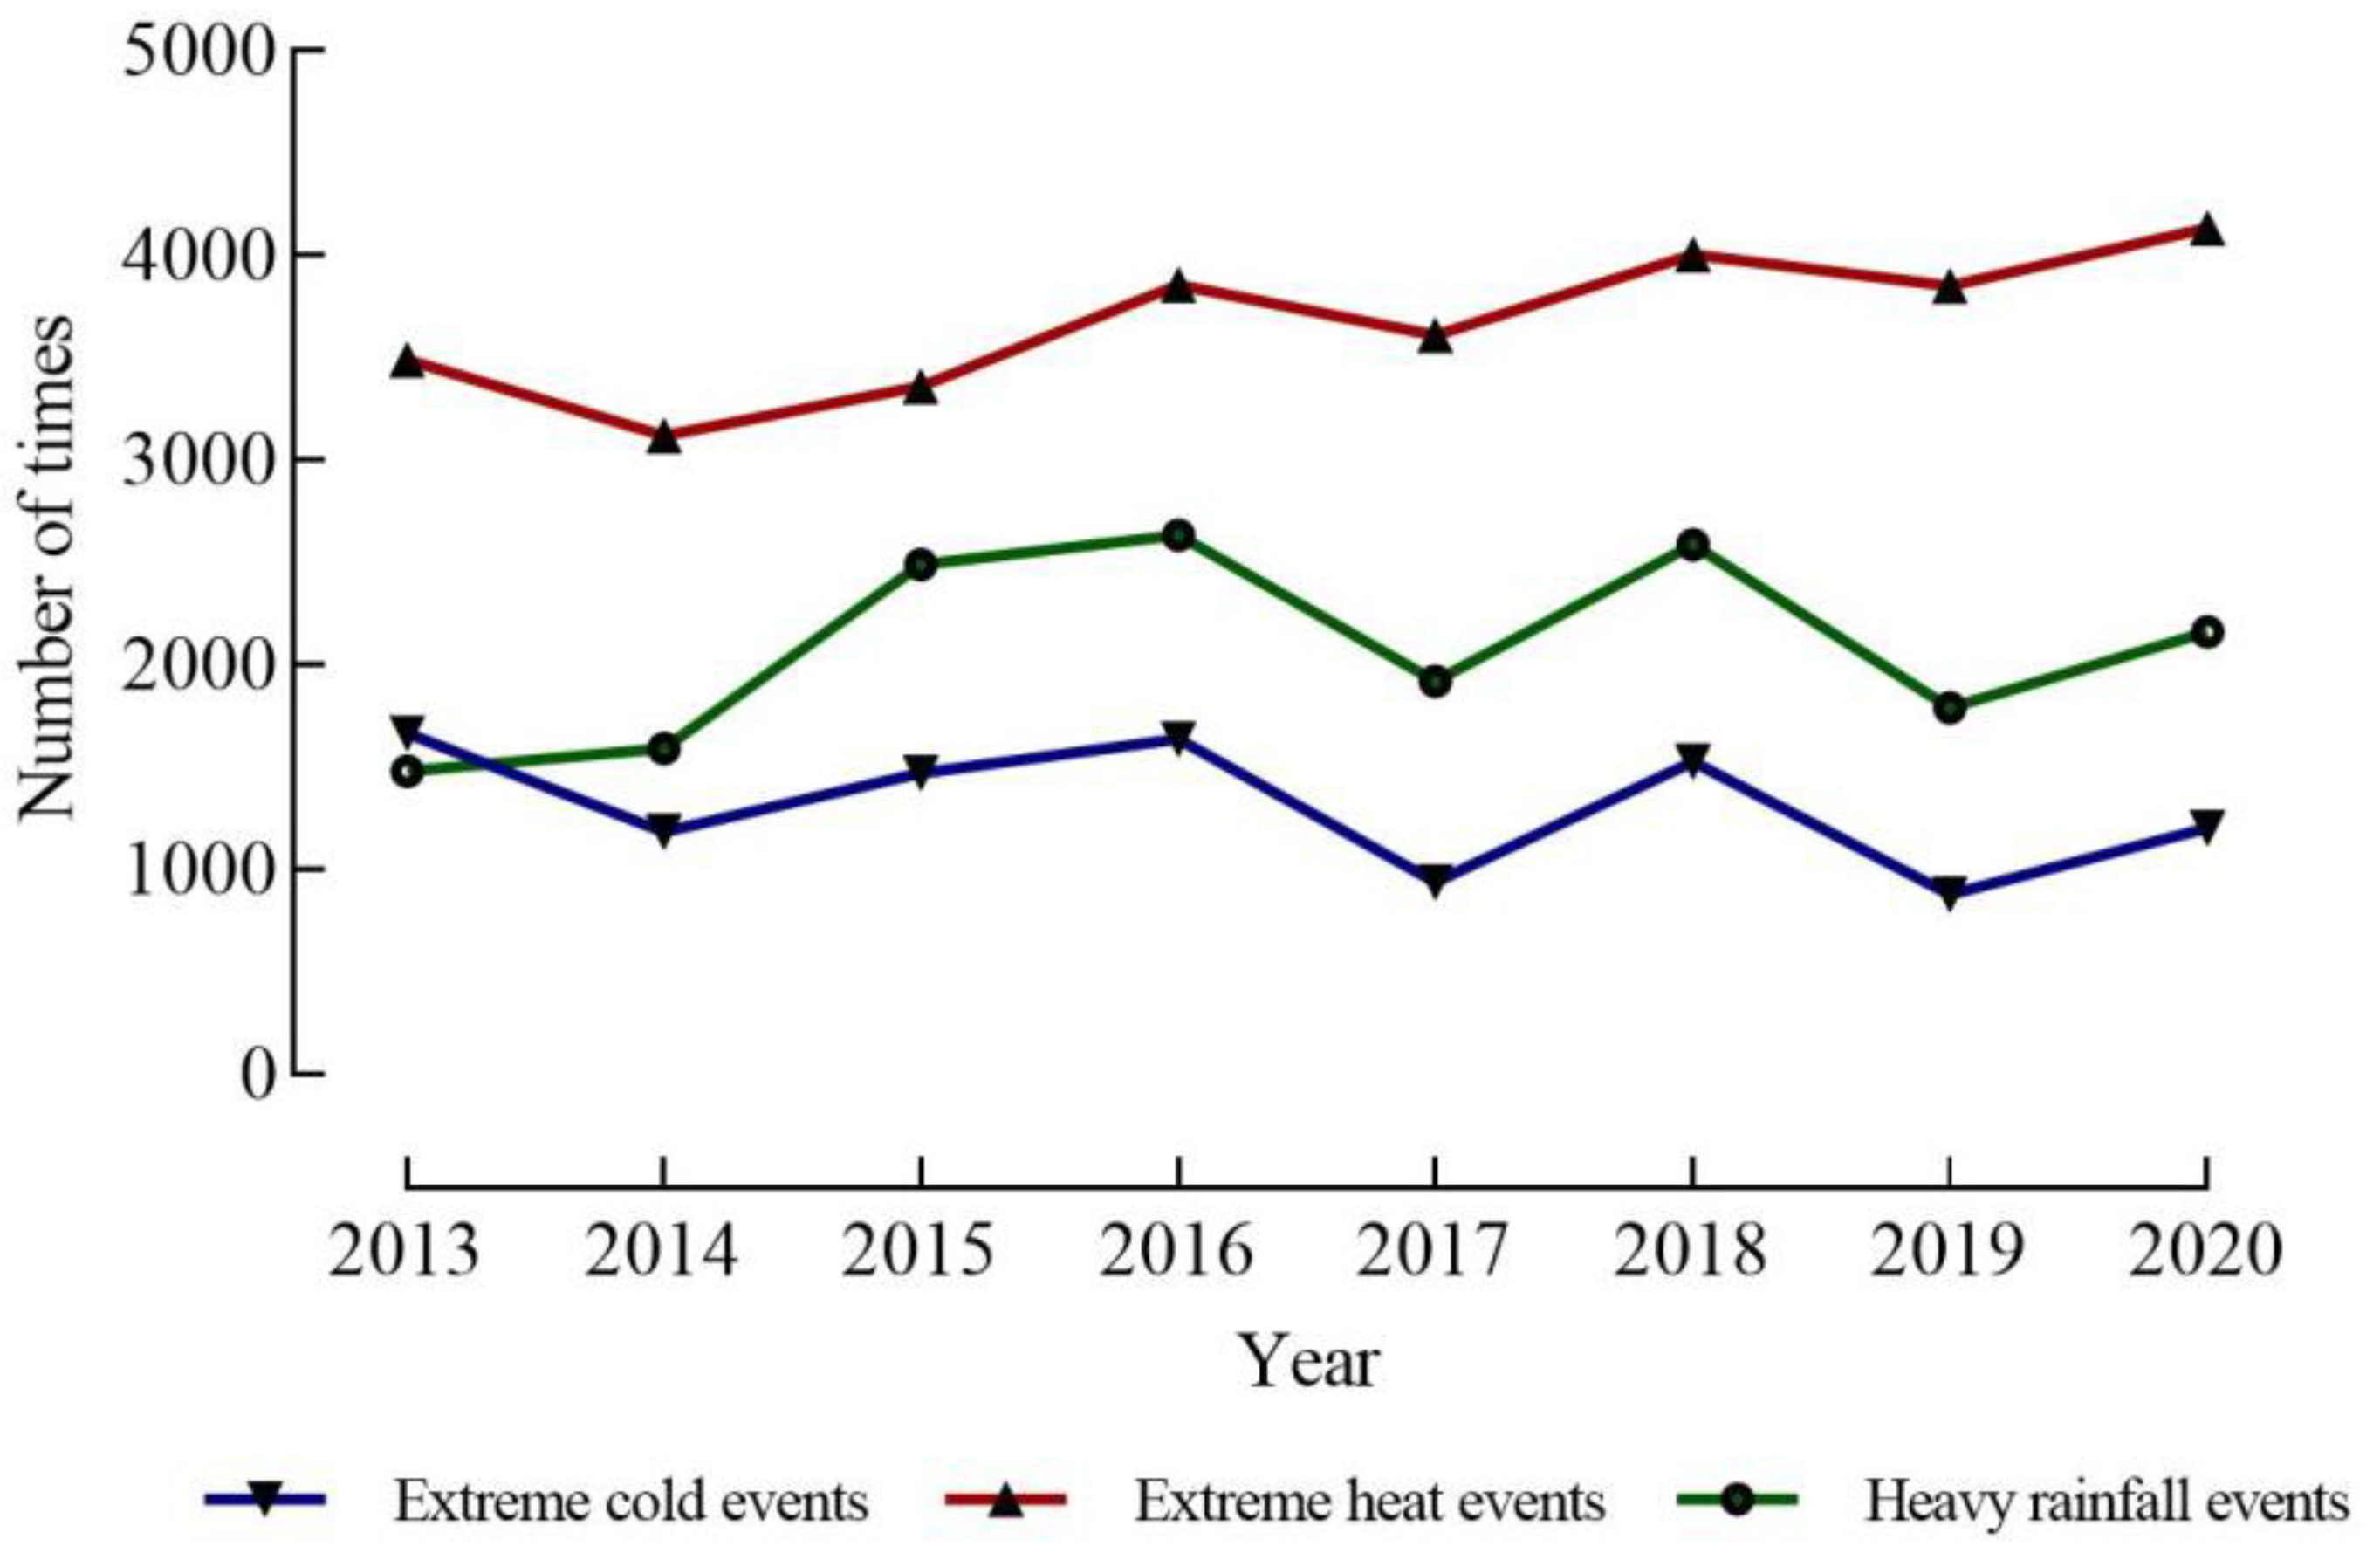
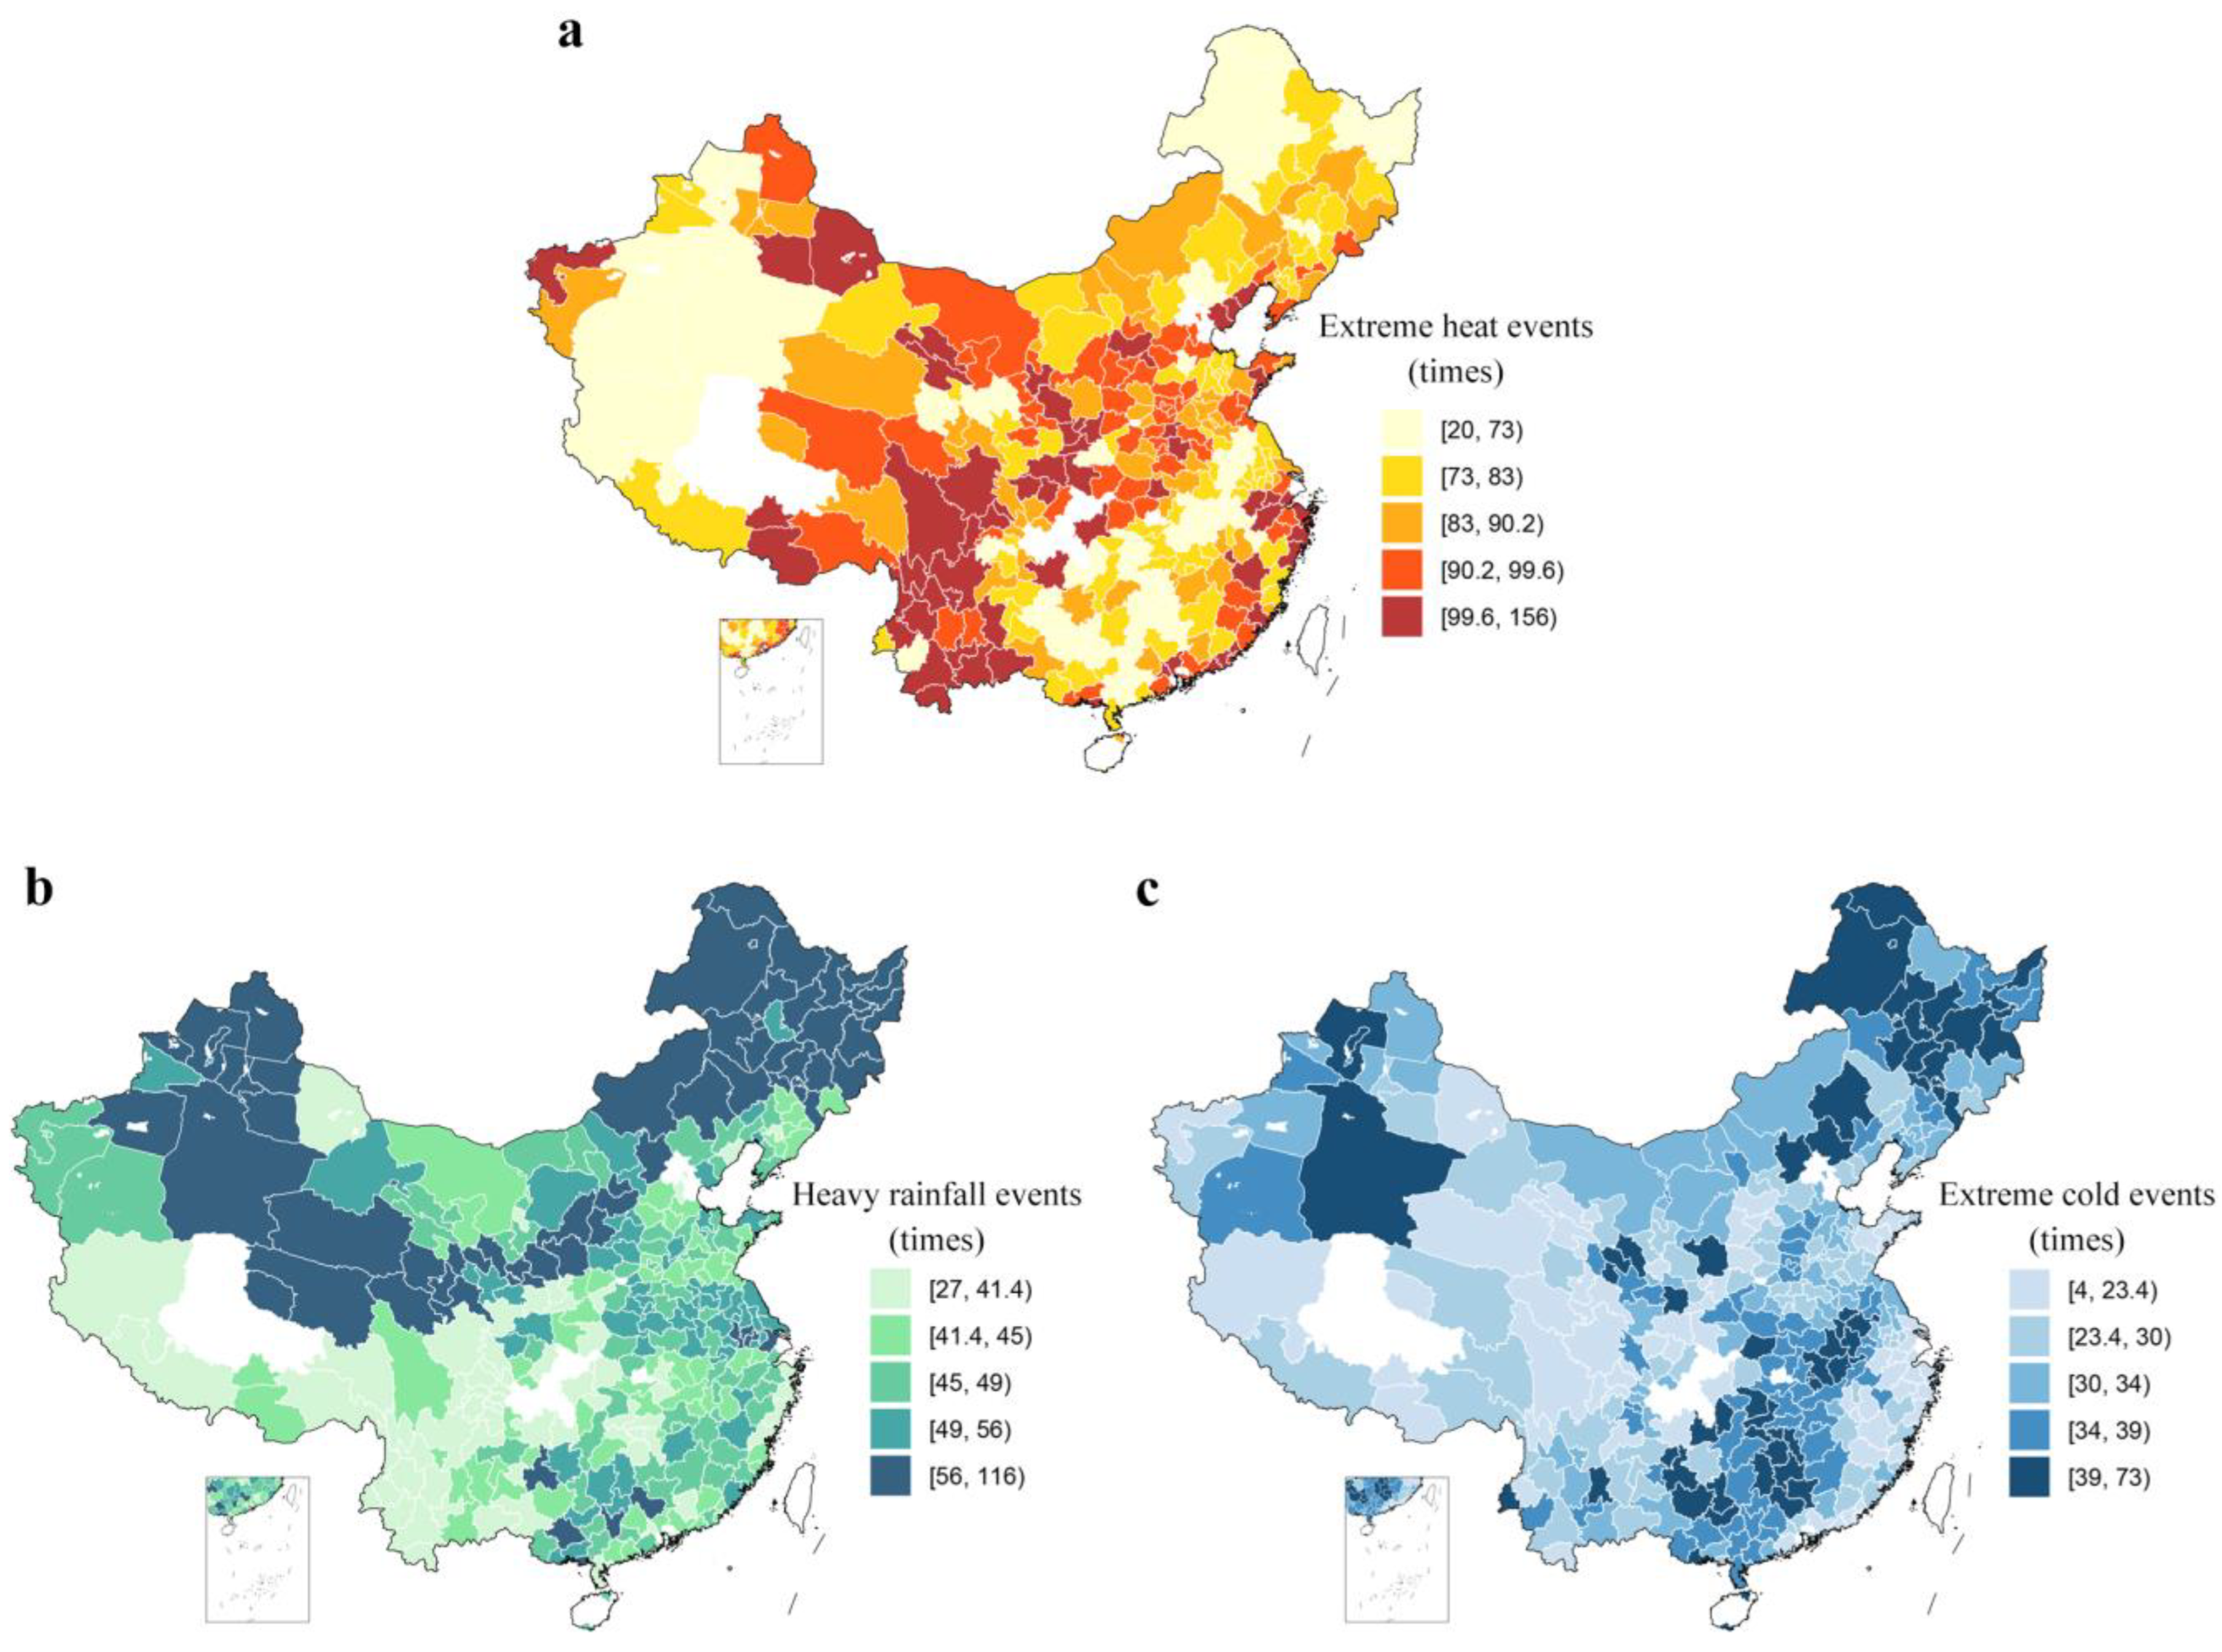
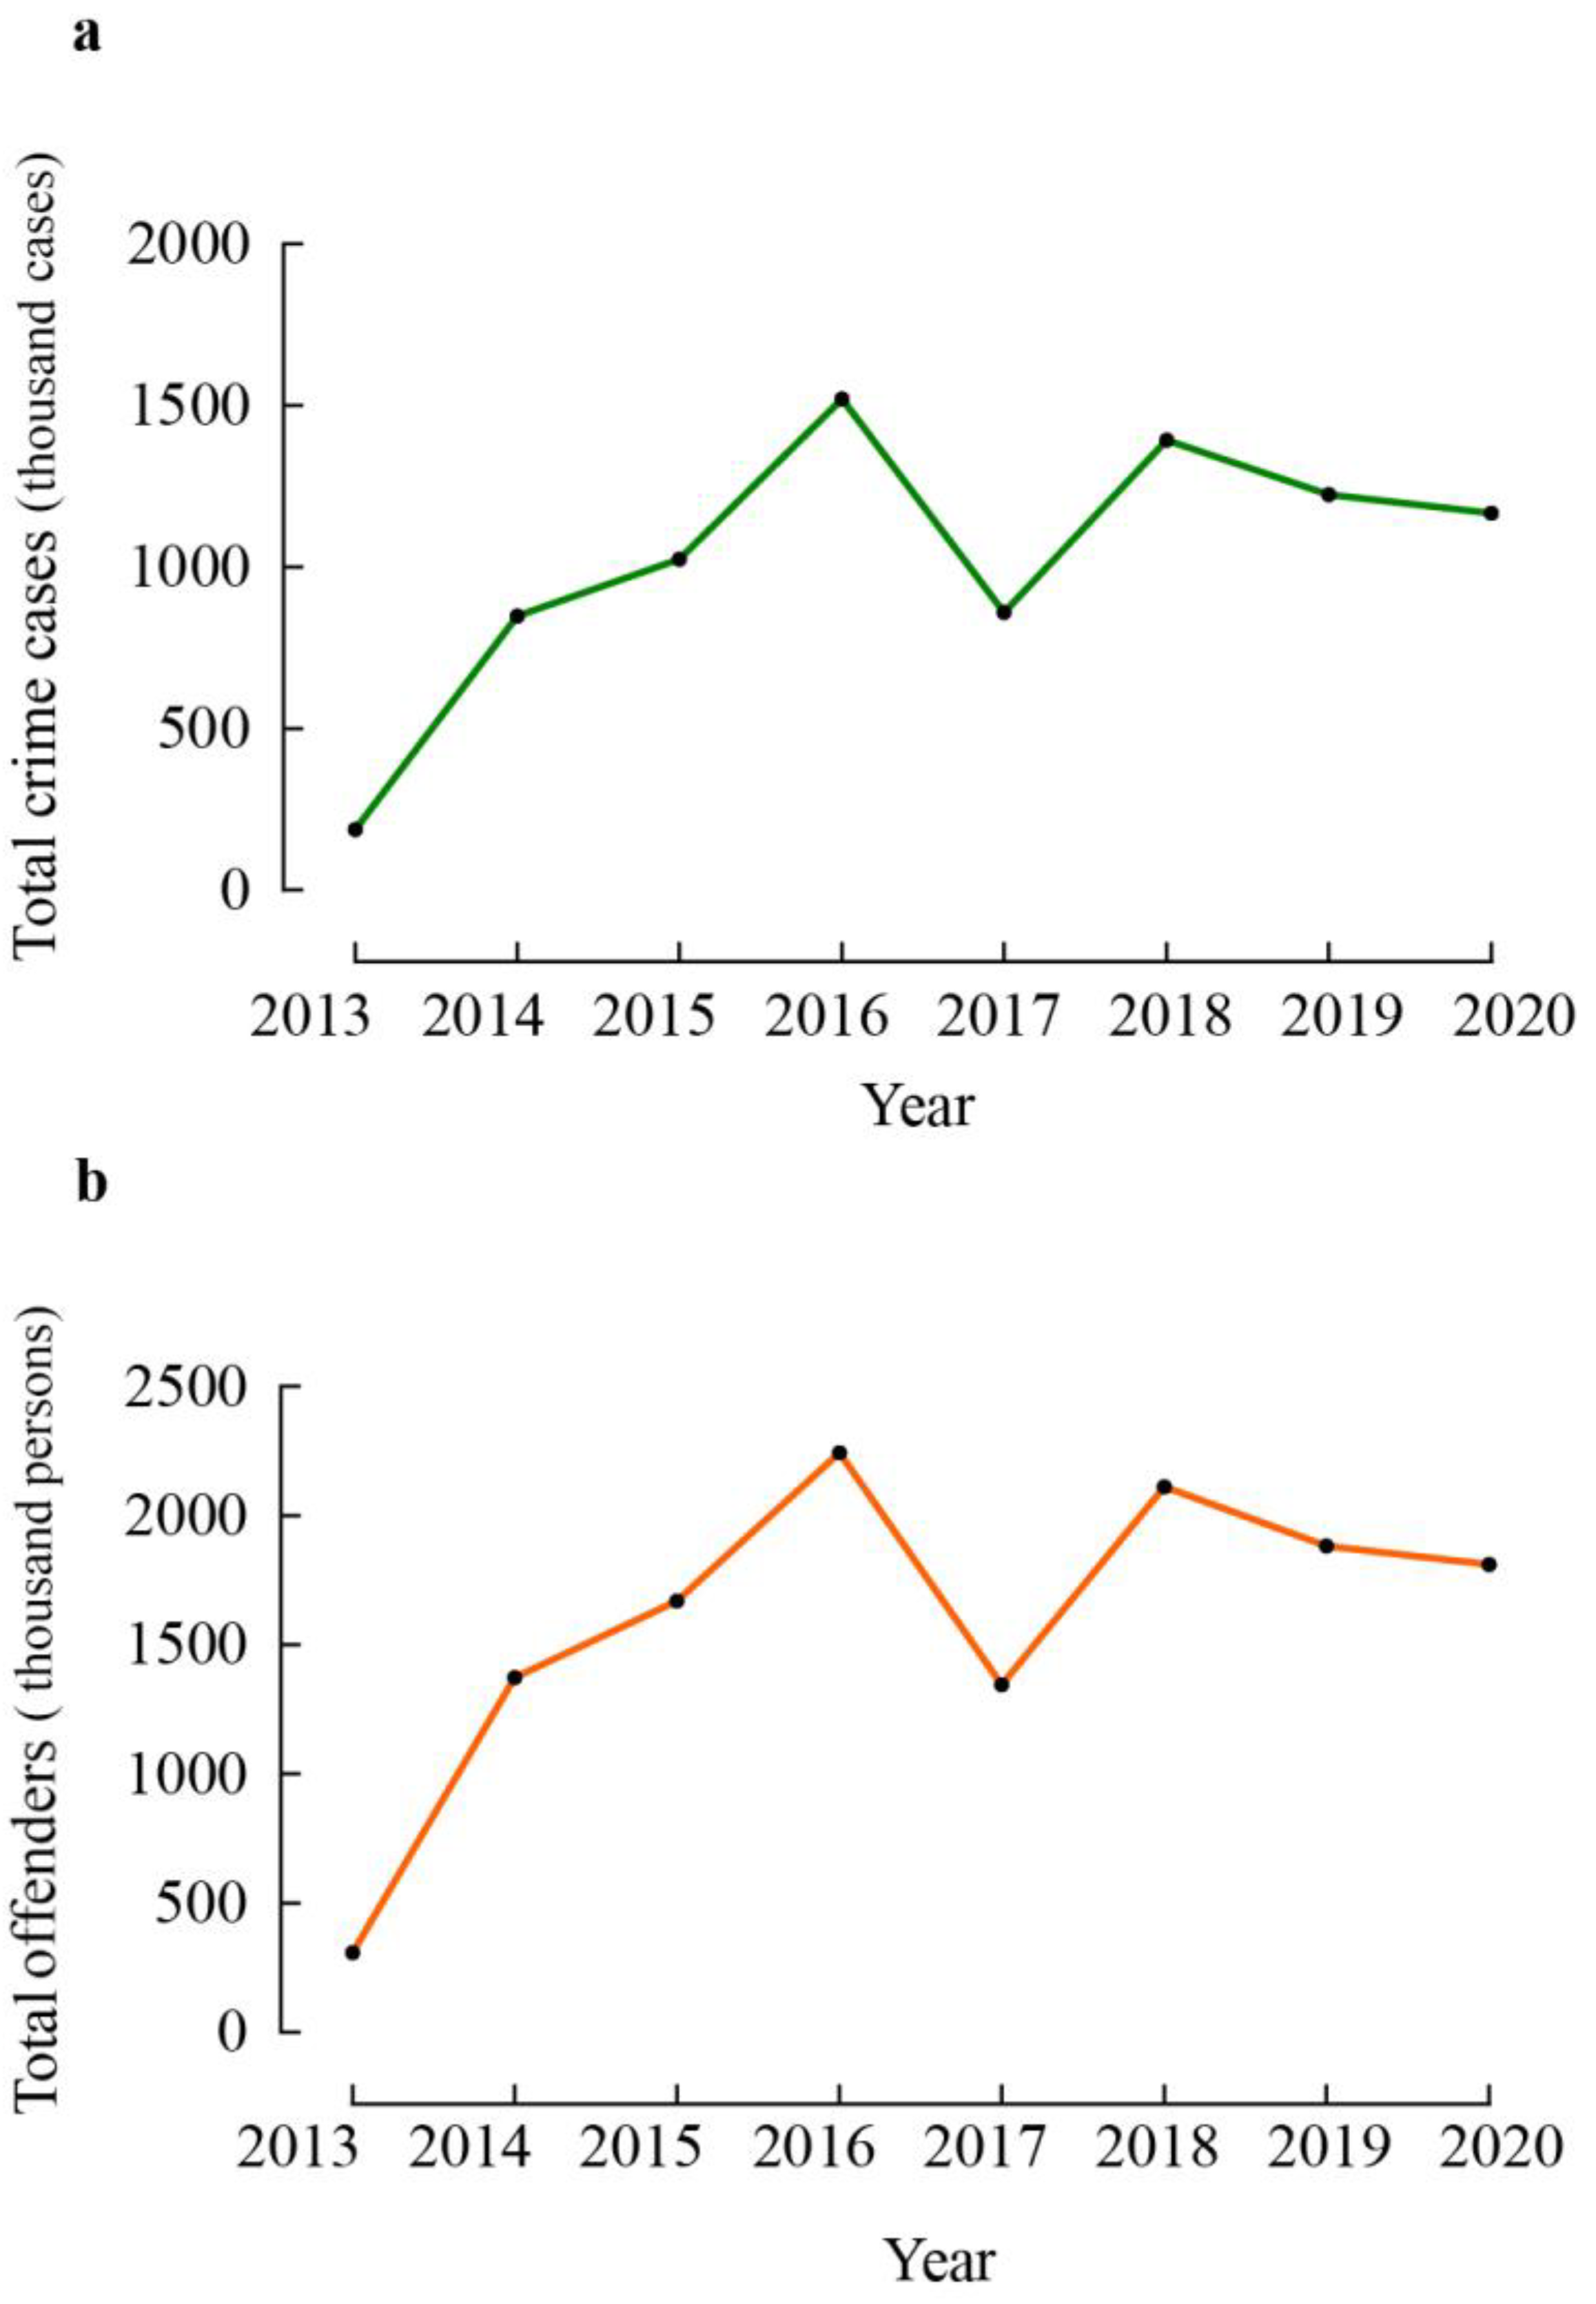
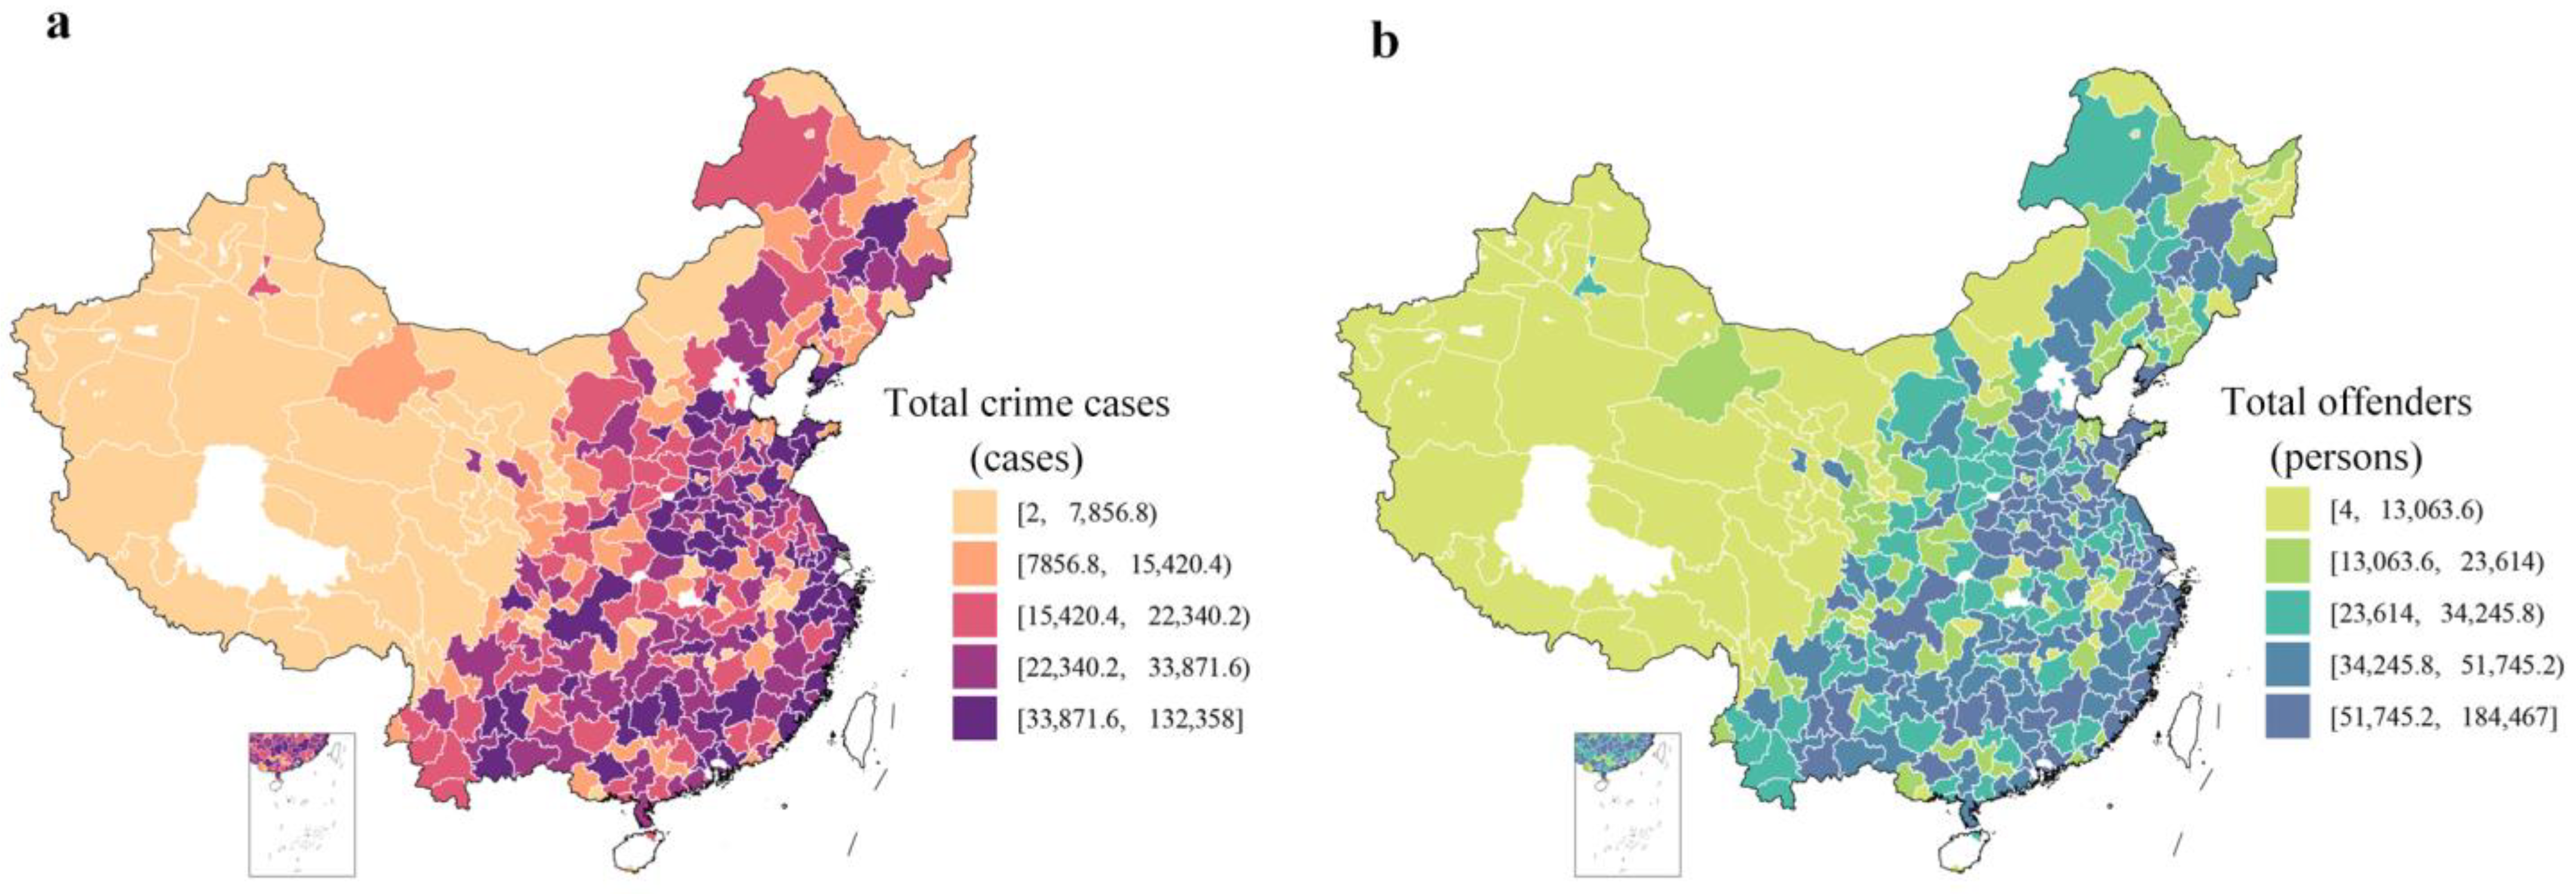
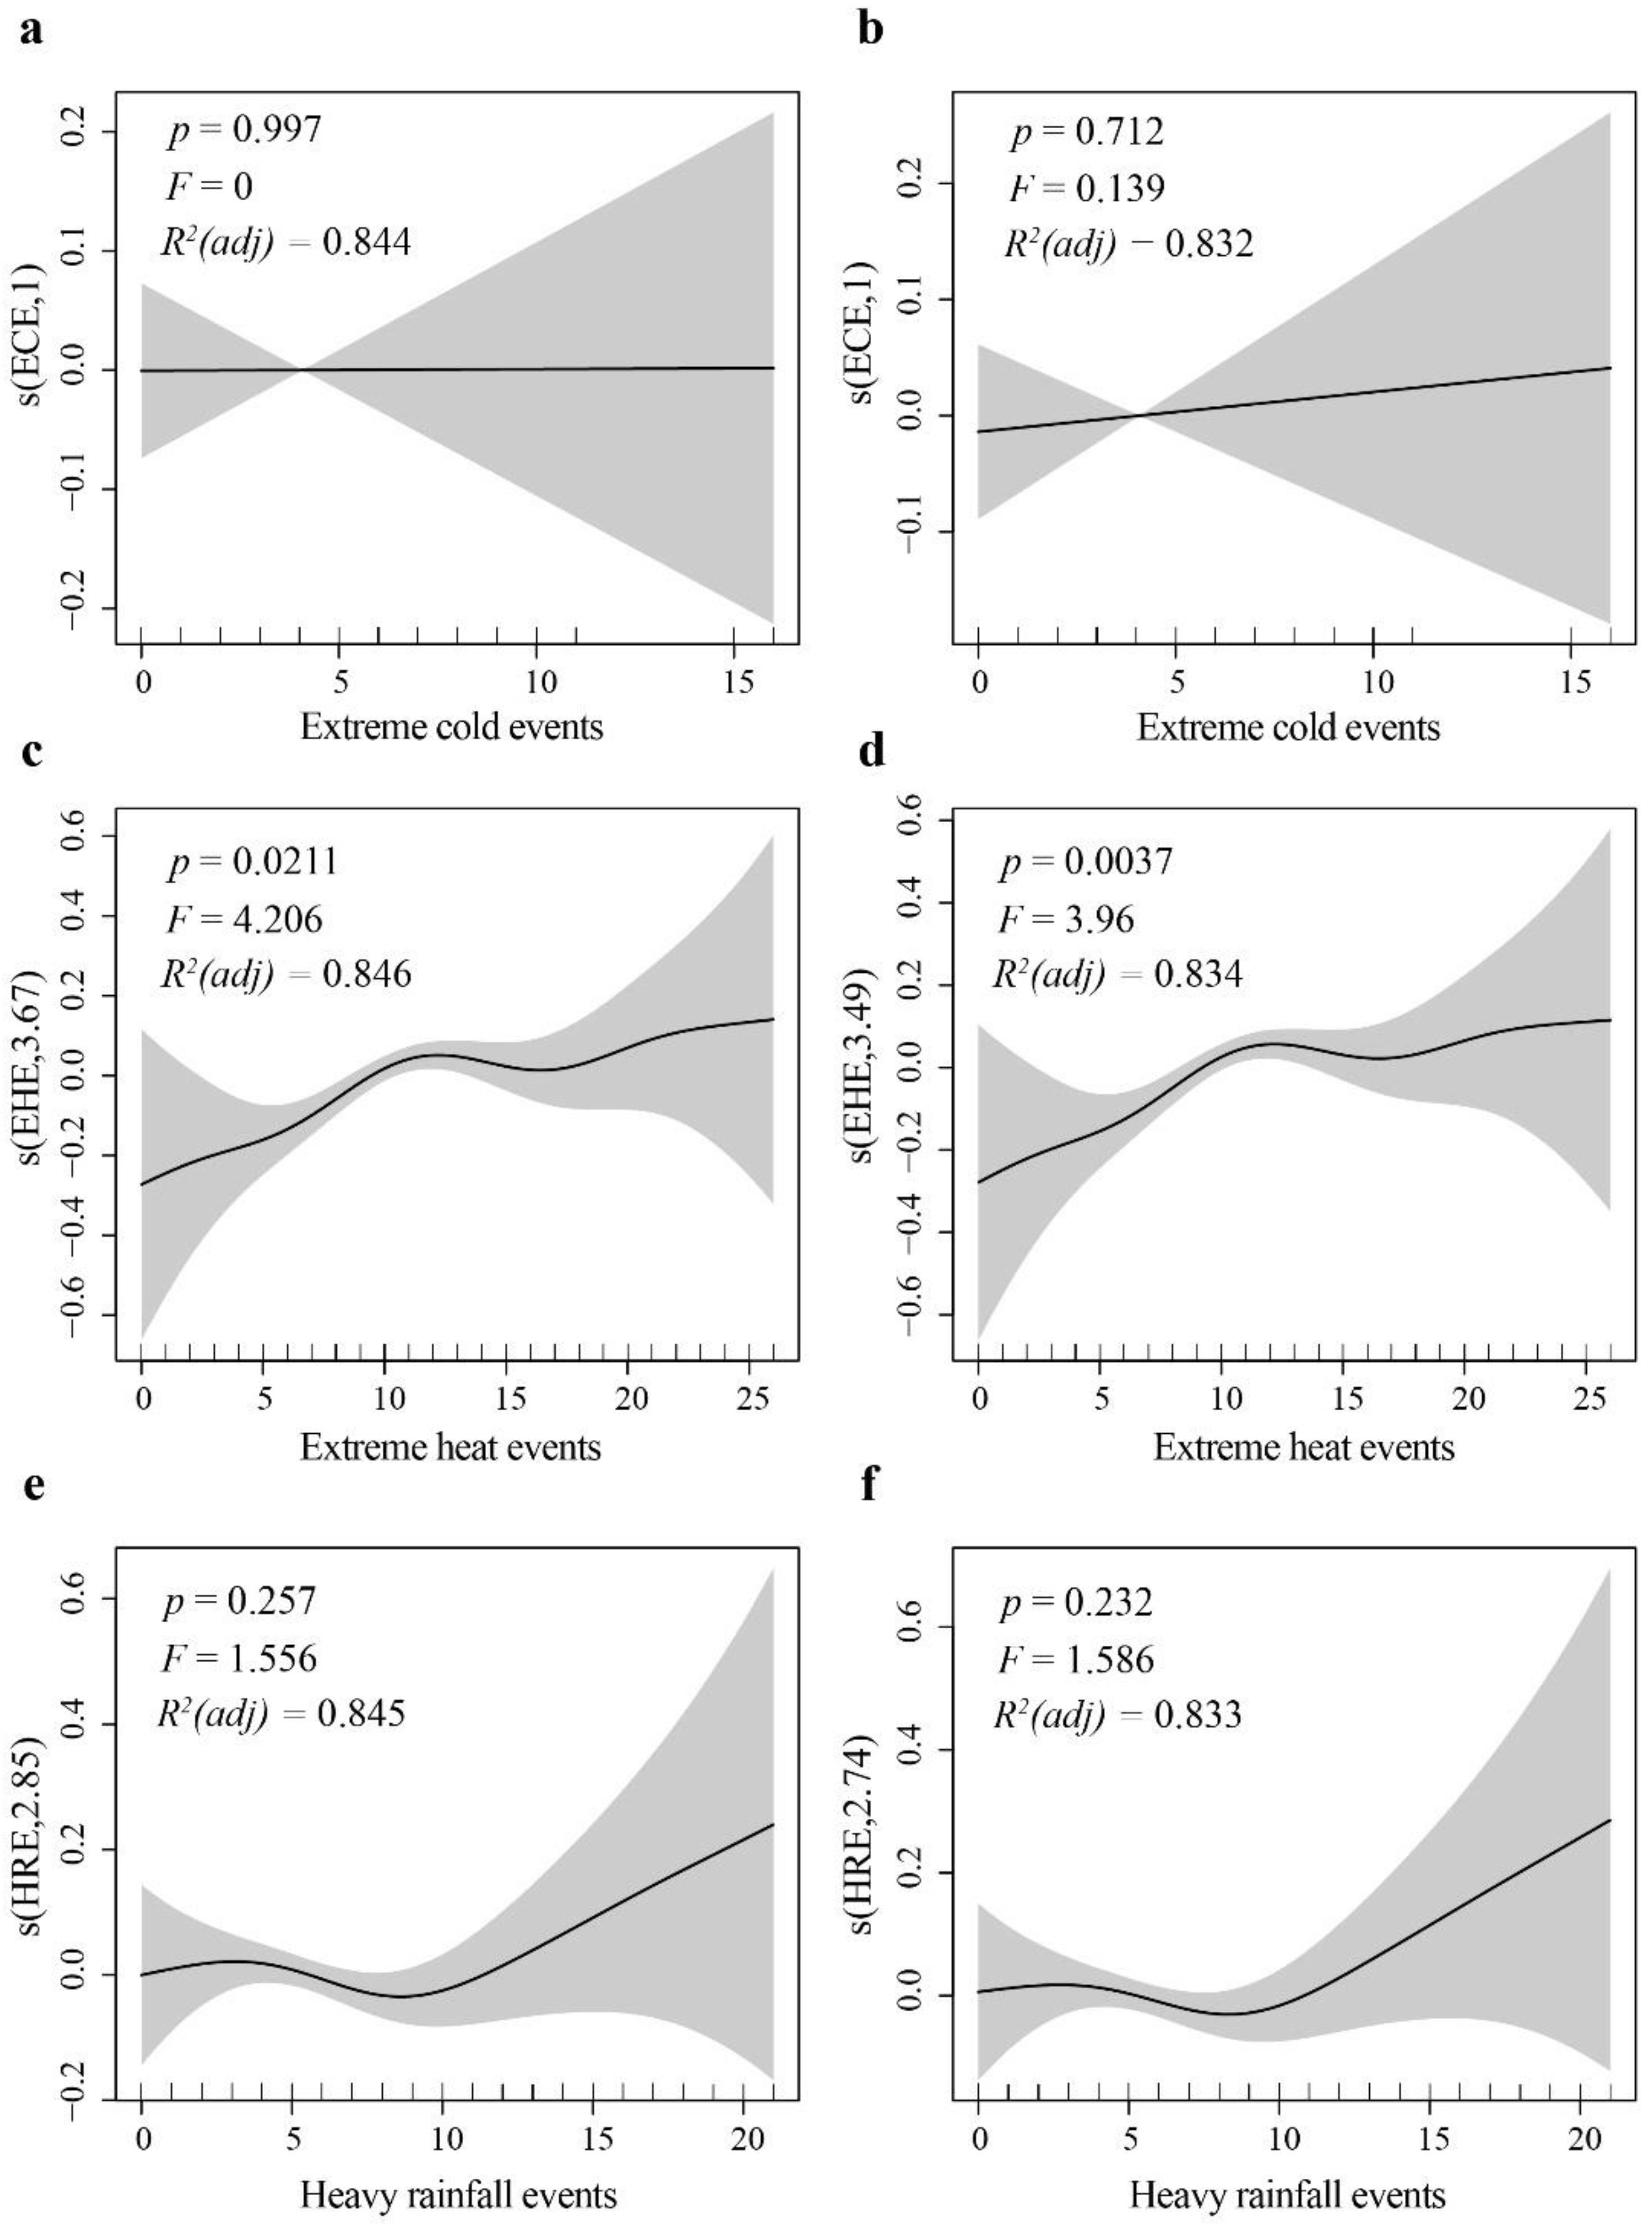
This study analyzed the temporal trends and spatial distribution of extreme weather events, total crime cases, and total offenders at the city level in China. Subsequently, the effects of extreme heat, extreme cold, and heavy rainfall events on total crime cases and total offenders were examined using a fixed-effects quasi-Poisson regression model and a negative binomial regression model. Finally, given the complexity of this relationship, a generalized additive model was applied to estimate the nonlinear effects of extreme weather events.
Extreme weather events exhibit a significant positive correlation with both total crime cases and total offenders, although the effects vary across different types of weather conditions. The results from the quasi-Poisson regression and negative binomial regression confirm that extreme heat events have a significantly positive effect on both crime measures. In contrast, extreme cold events and heavy rainfall events do not show statistically significant effects on crime.
Extreme heat events demonstrate a notable nonlinear relationship with criminal activity. The GAM estimation results reveal that extreme cold and heavy rainfall events do not exhibit significant nonlinear effects, whereas extreme heat events show a distinct nonlinear impact. At lower levels of heat intensity, high temperatures may restrict outdoor activities, reducing criminal opportunities and potential targets, thereby leading to a decline in crime rates. However, at higher levels of heat intensity, thermal stress may cause emotional fluctuations, reduced tolerance, and increased impulsivity, thereby escalating interpersonal conflicts and significantly raising crime rates. This results in an “S”-shaped relationship. This nonlinear effect suggests that policy interventions should be stratified and targeted according to different levels of heat intensity. For instance, during moderate heat conditions, enhancing community crime prevention measures can help reduce outdoor crime opportunities. However, during extreme heat periods, greater attention should be given to the risks of heat-induced violent conflicts, with strengthened psychological health interventions and public security management to mitigate the adverse effects of extreme heat on social stability.
Based on the empirical results of this study, the following policy recommendations are put forward:
(1) Establish a weather warning and public security risk coordination system. Develop a real-time early warning platform based on artificial intelligence and big data by integrating meteorological data, police dispatch records, and population mobility data. This system can predict high-risk areas and time periods where extreme weather events may lead to security issues, optimizing police resource allocation for rapid response. During extreme heat events, particular attention should be given to commercial areas and transportation hubs, which are often more vulnerable to property crimes due to higher foot traffic, lower perceived guardianship, and increased social agitation. Previous studies have documented elevated risks of theft and opportunistic crimes in such locations during extreme weather conditions [6]. Through real-time data analysis, law enforcement can dynamically adjust police deployments to reduce security risks. Additionally, the warning system can be linked with social media platforms to issue public security alerts, advising people to avoid unnecessary outdoor activities during high-risk weather conditions and providing safety recommendations for those who must go out. While preventive measures are essential, it is crucial to design risk communication strategies carefully to avoid unnecessarily heightening public fear of crime.
(2) Encourage community participation in public security management, especially under extreme weather conditions. Community engagement can help reduce crime opportunities through neighborhood mutual assistance and community patrols. For instance, volunteer teams can be organized to assist law enforcement in monitoring and reporting suspicious activities. Regular community meetings and training programs can also enhance residents’ awareness and ability to prevent crime. Importantly, community safety initiatives should operate under formal legal frameworks and in close coordination with official law enforcement agencies. Furthermore, designated “safe shelters” can be established within communities to provide temporary refuge for residents in need during extreme weather conditions. For example, during extreme heat events, community centers can be opened as cooling stations, offering drinking water and first-aid services. When planning safe shelters, security risks such as potential looting must be carefully assessed, and appropriate measures must be in place to safeguard both people and property. Besides, by planting more trees and vegetation, cities can naturally lower temperatures, provide shaded areas, alleviate residents’ heat stress reactions and long-term accumulated psychological pressure to a certain extent, and enhance residents’ sense of happiness [31,32]. These services are universally accessible and intended for all citizens, including those who may be more vulnerable to weather-induced psychological stress. Strengthening public infrastructure is crucial for enhancing community resilience and disaster preparedness. Governments should increase investments in community centers, health consultation facilities, and social service infrastructure to ensure that these facilities can provide emergency shelter and medical assistance when extreme weather occurs. While centralized measures, such as community shelters, can provide timely and coordinated support during emergencies, they also reflect an economic policy preference for cost-efficient, large-scale responses. In the context of China’s public governance model, centralized planning allows for optimized resource allocation. However, to achieve balanced and inclusive resilience, it is equally important to provide tailored support for individual households. Promoting household-level adaptations—such as subsidies for cooling systems, water storage, and structural improvements—can reduce reliance on centralized shelters and empower families to manage risks more effectively.
(3) Strengthen psychological interventions and support during extreme weather periods. Providing mental health services during extreme heat events can help alleviate psychological stress and conflicts exacerbated by high temperatures. Measures such as establishing temporary psychological counseling stations, conducting mental health awareness campaigns, and offering hotline services can be effective. Key target groups for psychological interventions include high-risk populations such as low-income individuals, migrant workers, and outdoor laborers who are particularly vulnerable to extreme weather conditions. Additionally, community and school-based mental health education programs can promote stress management and emotional regulation skills, helping the public better cope with the psychological challenges posed by extreme weather events.
Although the current study focuses on total crime cases, it is important to recognize that extreme weather events may differentially affect specific types of crime, such as looting or property-related offenses. Due to the current limitations in crime-type classification, this remains an important direction for future research.

Author Contributions

Conceptualization, methodology, data curation, validation, formal analysis, writing—original draft, H.L.; supervision, P.J. All authors have read and agreed to the published version of the manuscript.

Funding

This work was supported by the National Natural Science Foundation of China (grant Nos: 71774033 and 31961143006) and the Fudan Tyndall Centre of Fudan University (grant No. IDH6286315).

Informed Consent Statement

Not applicable.

Data Availability Statement

The raw data supporting the conclusions of this article will be made available by the authors upon request.

Conflicts of Interest

The authors declare no conflicts of interest.

References

  1. De Winne, J.; Peersman, G. The adverse consequences of global harvest and weather disruptions on economic activity. Nat. Clim. Change 2021, 11, 665–672. [Google Scholar] [CrossRef]
  2. China Meteorological Administration Climate Change Center. China Climate Change Blue Book (2024); Science Press: Beijing, China, 2024. [Google Scholar]
  3. Perkins-Kirkpatrick, S.; Lewis, S. Increasing trends in regional heatwaves. Nat. Commun. 2020, 11, 3357. [Google Scholar] [CrossRef] [PubMed]
  4. Singh, J.; Ashfaq, M.; Skinner, C.B.; Anderson, W.B.; Mishra, V.; Singh, D. Enhanced risk of concurrent regional droughts with increased ENSO variability and warming. Nat. Clim. Change 2022, 12, 163–170. [Google Scholar] [CrossRef]
  5. Pörtner, H.-O.; Roberts, D.; Tignor, M.; Poloczanska, E.; Mintenbeck, K.; Alegría, A.; Craig, M.; Langsdorf, S.; Löschke, S.; Möller, V.; et al. Climate Change 2022: Impacts, Adaptation and Vulnerability Working Group II Contribution to the Sixth Assessment Report of the Intergovernmental Panel on Climate Change; 2022; Available online: https://www.ipcc.ch/report/sixth-assessment-report-working-group-ii/ (accessed on 16 March 2025).
  6. Agnew, R. Dire forecast: A theoretical model of the impact of climate change on crime. Theor. Criminol. 2012, 16, 21–42. [Google Scholar] [CrossRef]
  7. Ranson, M. Crime, weather, and climate change. J. Environ. Econ. Manag. 2014, 67, 274–302. [Google Scholar] [CrossRef]
  8. Minor, T.; Sugg, M.; Runkle, J.D. Short-term exposure to temperature and mental health in North Carolina: A distributed lag nonlinear analysis. Int. J. Biometeorol. 2023, 67, 573–586. [Google Scholar] [CrossRef]
  9. Burke, M.; González, F.; Baylis, P.; Heft-Neal, S.; Baysan, C.; Basu, S.; Hsiang, S. Higher temperatures increase suicide rates in the United States and Mexico. Nat. Clim. Change 2018, 8, 723–729. [Google Scholar] [CrossRef]
  10. Casas, L.; Cox, B.; Nemery, B.; Deboosere, P.; Nawrot, T.S. High temperatures trigger suicide mortality in Brussels, Belgium: A case-crossover study (2002–2011). Environ. Res. 2022, 207, 112159. [Google Scholar] [CrossRef]
  11. Miles-Novelo, A.; Anderson, C.A. Climate change and psychology: Effects of rapid global warming on violence and aggression. Curr. Clim. Change Rep. 2019, 5, 36–46. [Google Scholar] [CrossRef]
  12. Otrachshenko, V.; Popova, O.; Tavares, J. Extreme Temperature and Extreme Violence: Evidence from Russia. Econ. Inq. 2021, 59, 243–262. [Google Scholar] [CrossRef]
  13. Baron, R.A.; Bell, P.A. Aggression and heat: The influence of ambient temperature, negative affect, and a cooling drink on physical aggression. J. Personal. Soc. Psychol. 1976, 33, 245–255. [Google Scholar] [CrossRef]
  14. Harari, M.; Ferrara, E.L. Conflict, climate, and cells: A disaggregated analysis. Rev. Econ. Stat. 2018, 100, 594–608. [Google Scholar] [CrossRef]
  15. Barlett, C.P.; DeWitt, C.C.; Madison, C.S.; Heath, J.B.; Maronna, B.; Kirkpatrick, S.M. Hot temperatures and even hotter tempers: Sociological mediators in the relationship between global climate change and homicide. Psychol. Violence 2020, 10, 1–7. [Google Scholar] [CrossRef]
  16. Forbes, D.; Alkemade, N.; Waters, E.; Gibbs, L.; Gallagher, C.; Pattison, P.; Lusher, D.; MacDougall, C.; Harms, L.; Block, K.; et al. The role of anger and ongoing stressors in mental health following a natural disaster. Aust. N. Z. J. Psychiatry 2015, 49, 706–713. [Google Scholar] [CrossRef]
  17. Cohen, L.E.; Felson, M. Social Change and Crime Rate Trends: A Routine Activity Approach. Am. Sociol. Rev. 1979, 44, 588–608. [Google Scholar] [CrossRef]
  18. Cruz, E.; D’Alessio, S.J.; Stolzenberg, L. The effect of maximum daily temperature on outdoor violence. Crime Delinq. 2023, 69, 1161–1182. [Google Scholar] [CrossRef]
  19. Hagström, H.; Widman, L.; von Seth, E. Association between temperature, sunlight hours and alcohol consumption. PLoS ONE 2019, 14, e0223312. [Google Scholar] [CrossRef]
  20. Tiihonen, J.; Halonen, P.; Tiihonen, L.; Kautiainen, H.; Storvik, M.; Callaway, J. The association of ambient temperature and violent crime. Sci. Rep. 2017, 7, 6543. [Google Scholar] [CrossRef]
  21. Becker, G.S. Crime and Punishment: An Economic Approach. J. Political Econ. 1968, 76, 169–217. [Google Scholar] [CrossRef]
  22. Corcoran, J.; Zahnow, R. Weather and crime: A systematic review of the empirical literature. Crime Sci. 2022, 11, 16. [Google Scholar] [CrossRef]
  23. Burke, M.; Hsiang, S.M.; Miguel, E. Climate and Conflict. Annu. Rev. Econ. 2015, 7, 577–617. [Google Scholar] [CrossRef]
  24. Scartozzi, C.M. Reframing Climate-Induced Socio-Environmental Conflicts: A Systematic Review. Int. Stud. Rev. 2020, 23, 696–725. [Google Scholar] [CrossRef]
  25. Mapou, A.E.M.; Shendell, D.; Ohman-Strickland, P.; Madrigano, J.; Meng, Q.; Whytlaw, J.; Miller, J. Environmental Factors and Fluctuations in Daily Crime Rates. J. Environ. Health 2017, 80, 8–22. [Google Scholar]
  26. Kolb, P.; Gockel, C.; Werth, L. The effects of temperature on service employees’ customer orientation: An experimental approach. Ergonomics 2012, 55, 621–635. [Google Scholar] [CrossRef]
  27. Perliger, A.; Liu, M. Exploring the intersection of environmental events and domestic political violence in the United States. Terror. Political Violence 2022, 34, 1024–1040. [Google Scholar] [CrossRef]
  28. Hu, X.F.; Chen, P.; Huang, H.; Sun, T.; Li, D. Contrasting impacts of heat stress on violent and nonviolent robbery in Beijing, China. Nat. Hazards 2017, 87, 961–972. [Google Scholar] [CrossRef]
  29. Sekhri, S.; Storeygard, A. Dowry deaths: Response to weather variability in India. J. Dev. Econ. 2014, 111, 212–223. [Google Scholar] [CrossRef]
  30. Darling, W.M. A Theoretical and Practical Implementation Tutorial on Topic Modeling and Gibbs Sampling. In Proceedings of the 49th Annual Meeting of the Association for Computational Linguistics: Human Language Technologies, Portland, OR, USA, 19–24 June 2011. [Google Scholar]
  31. Demir, C.; Ozcan, S.E. Do air quality and green space reduce propensity to crime? An empirical investigation of OECD countries. Manag. Environ. Qual. Int. J. 2023, 34, 351–367. [Google Scholar] [CrossRef]
  32. Schusler, T.; Weiss, L.; Treering, D.; Balderama, E. Research note: Examining the association between tree canopy, parks and crime in Chicago. Landsc. Urban Plan. 2018, 170, 309–313. [Google Scholar] [CrossRef]
Figure 1. Line chart of the national cumulative total of extreme weather events from 2013 to 2020.
Climate 13 00094 g001
Figure 2. Spatial distribution of extreme heat (a), cold (b), and heavy rainfall (c) events across Chinese prefecture-level administrative divisions, 2013–2020.
Climate 13 00094 g002
Figure 3. Line chart of the national cumulative number of criminal cases and offenders from 2013 to 2020. (a) Total criminal cases; (b) total offenders.
Climate 13 00094 g003
Figure 4. Spatial distribution of (a) total criminal cases and (b) total offenders across Chinese prefecture-level administrative divisions, 2013–2020.
Climate 13 00094 g004
Figure 5. Impact curve of extreme weather events on total criminal cases and criminals: (a,c,e) are total criminal cases; (b,d,f) are total offenders.
Climate 13 00094 g005
Table 1. Descriptive statistics of main variables.
VariableObservationMeanStd. Dev.MinMax
Extreme cold events26563.9532.112018
Extreme heat events265611.0743.671027
Heavy rainfall events26566.2653.106025
Total crime cases26563098.383540.80132,946
Total offenders26564800.685344.53162,700
GDP per capita224471,992.49139,509.0641346,421,762
Ratio of secondary sector output229944.57111.4989.4982.23
Population Intensity2026447.472322.8830.043416
Public expenditure2312142,228.832,435,642.7022.05748,939,461
Average level of labor wages201260,391.9917,223.984958173,205
Notes: “Observation” refers to the number of city-year level data points, and the variation in observations across variables is due to missing data.
Table 2. Baseline effects of extreme heat events on total crime cases.
Dependent Variable: ln (Total Crime Cases)
(1)(2)(3)(4)
Extreme Heat Events0.006 ***0.001 *0.0010.002 **
(0.001)(0.001)(0.001)(0.001)
Ratio of Secondary Sector Output −0.002 ***0.000
(0.000)(0.000)
GDP per capita −0.0110.006
(0.008)(0.010)
Public Expenditure 0.030 ***−0.174 ***
(0.004)(0.022)
Average Labor Wages 0.210 ***−0.049**
(0.018)(0.018)
Population Density 0.082 ***−0.231 *
(0.003)(0.111)
Observations2656265626562656
RMSE1.560.581.220.57
Pseudo R20.0100.8630.3940.868
City fixed effects
Year fixed effects
Notes: *** p < 0.01, ** p < 0.05, * p < 0.1.
Table 3. Baseline effects of extreme heat events on total offenders.
Dependent Variable: ln (Total Offenders)
(1)(2)(3)(4)
Extreme Heat Events0.006 ***0.002 *0.0010.002 **
(0.001)(0.001)(0.001)(0.001)
Ratio of Secondary Sector Output −0.002 ***0.000
(0.000)(0.000)
GDP per capita −0.0100.008
(0.008)(0.009)
Public Expenditure 0.029 ***−0.163 ***
(0.003)(0.021)
Average Labor Wages 0.186 ***−0.052 **
(0.017)(0.018)
Population Density 0.075 ***−0.205 *
(0.003)(0.105)
Observations2656265626562656
RMSE1.550.601.220.58
Pseudo R20.0110.8530.3850.859
City fixed effects
Year fixed effects
Notes: *** p < 0.01, ** p < 0.05, * p < 0.1.
Table 4. Baseline effects of heavy rainfall events on total crime cases.
Dependent Variable: ln (Total Crime Cases)
(1)(2)(3)(4)
Heavy Rainfall Events0.007 ***0.002 **0.012 ***0.001
(0.001)(0.001)(0.001)(0.001)
Ratio of Secondary Sector Output −0.002 ***0.000
(0.000)(0.000)
GDP per capita −0.0080.007
(0.008)(0.010)
Public Expenditure 0.031 ***−0.171 ***
(0.004)(0.022)
Average Labor Wages 0.203 ***−0.050 ***
(0.017)(0.018)
Population Density 0.085 ***−0.212
(0.003)(0.108)
Observations2656265626562656
RMSE1.560.581.200.57
Pseudo R20.0100.8630.4170.868
City fixed effects
Year fixed effects
Notes: *** p < 0.01, ** p < 0.05.
Table 5. Baseline effects of heavy rainfall events on total offenders.
Dependent Variable: ln (Total offenders)
(1)(2)(3)(4)
Heavy Rainfall Events0.007 ***0.002 **0.011 ***0.001 *
(0.001)(0.001)(0.001)(0.001)
Ratio of Secondary Sector Output −0.002 ***0.000
(0.000)(0.000)
GDP per capita −0.0080.010
(0.008)(0.010)
Public Expenditure 0.030 ***−0.159 ***
(0.003)(0.021)
Average Labor Wages 0.180 ***−0.052 ***
(0.016)(0.018)
Population Density 0.079 ***−0.186 *
(0.003)(0.102)
Observations2656265626562656
RMSE1.550.601.200.58
Pseudo R20.0100.8530.4070.868
City fixed effects
Year fixed effects
Notes: *** p < 0.01, ** p < 0.05, * p < 0.1.
Table 6. Baseline effects of extreme cold events on total crime cases.
Dependent Variable: ln (Total Crime Cases)
(1)(2)(3)(4)
Extreme Cold Events−0.007 ***0.0020.000−0.001
(0.002)(0.001)(0.002)(0.001)
Ratio of Secondary Sector Output −0.002 ***0.000
(0.000)(0.000)
GDP per capita −0.0110.006
(0.008)(0.010)
Public Expenditure 0.030 ***−0.172 ***
(0.004)(0.022)
Average Labor Wages 0.213 ***−0.050 ***
(0.018)(0.018)
Population Density 0.082 ***−0.217 **
(0.003)(0.108)
Observations2656265626562656
RMSE1.570.581.220.57
Pseudo R20.0040.8530.3940.868
City fixed effects
Year fixed effects
Notes: *** p < 0.01, ** p < 0.05.
Table 7. Baseline effects of extreme cold events on total offenders.
Dependent Variable: ln (Total Offenders)
(1)(2)(3)(4)
Extreme Cold Events−0.007 ***0.002−0.000−0.001
(0.002)(0.001)(0.002)(0.001)
Ratio of Secondary Sector Output −0.002 ***0.000
(0.000)(0.000)
GDP per capita −0.0110.009
(0.008)(0.009)
Public Expenditure 0.029 ***−0.161 ***
(0.003)(0.021)
Average Labor Wages 0.189 ***−0.053 ***
(0.017)(0.018)
Population Density 0.076 ***−0.190 **
(0.003)(0.103)
Observations2656265626562656
RMSE1.550.601.220.59
Pseudo R20.0040.8530.3850.859
City fixed effects
Year fixed effects
Notes: *** p < 0.01, ** p < 0.05.
Table 8. Baseline effects of extreme weather events on total crime cases.
Dependent Variable: ln (Total Crime Cases)
(1)(2)(3)(4)
Extreme Weather Events0.005 ***0.002 **0.006 ***0.001 ***
(0.001)(0.001)(0.001)(0.001)
Ratio of Secondary Sector Output −0.002 ***0.000
(0.000)(0.000)
GDP per capita -0.0090.007
(0.008)(0.010)
Public Expenditure 0.030 ***−0.170 ***
(0.004)(0.022)
Average Labor Wages 0.205 ***−0.049 ***
(0.016)(0.018)
Population Density 0.083 ***−0.214 *
(0.003)(0.109)
Observations2656265626562656
RMSE1.560.581.210.57
Pseudo R20.0140.8530.4070.868
City fixed effects
Year fixed effects
Notes: *** p < 0.01, ** p < 0.05, * p < 0.1.
Table 9. Baseline effects of extreme weather events on total offenders.
Dependent Variable: ln (Total Offenders)
(1)(2)(3)(4)
Extreme Weather Events0.005 ***0.002 **0.005 ***0.001 ***
(0.001)(0.000)(0.001)(0.000)
Ratio of Secondary Sector Output −0.002 ***0.000
(0.000)(0.000)
GDP per capita −0.0090.010
(0.008)(0.010)
Public Expenditure 0.029 ***−0.158 ***
(0.003)(0.021)
Average Labor Wages 0.183 ***−0.052 ***
(0.016)(0.017)
Population Density 0.076 ***−0.188 *
(0.003)(0.103)
Observations2656265626562656
RMSE1.550.601.210.58
Pseudo R20.0140.8530.3980.859
City fixed effects
Year fixed effects
Notes: *** p < 0.01, ** p < 0.05, * p < 0.1.
Table 10. Baseline effects of extreme cold events on total crime cases based on negative binomial regression.
Dependent Variable: ln (Total Crime Cases)
(1)(2)(3)(4)
Extreme Heat Events0.002 **
(0.001)
Extreme Cold Events −0.000
(0.001)
Heavy Rainfall Events 0.001
(0.001)
Extreme Weather Events 0.001 ***
(0.000)
Ratio of Secondary Sector Output0.0000.000−0.002 ***0.000
(0.000)(0.000)(0.000)(0.000)
GDP per capita0.0060.0060.0070.007
(0.010)(0.010)(0.010)(0.010)
Public Expenditure−0.174 ***−0.173 ***−0.171 ***−0.170 ***
(0.022)(0.022)(0.022)(0.022)
Average Labor Wages−0.050 **−0.050 **−0.050 ***−0.049 ***
(0.018)(0.018)(0.018)(0.018)
Population Density−0.231 *−0.217 *−0.212 *−0.214 *
(0.111)(0.108)(0.108)(0.109)
Observations2656265626562656
RMSE0.570.570.570.57
Adjust R20.0170.0170.0170.017
City fixed effects
Year fixed effects
Notes: *** p < 0.01, ** p < 0.05, * p < 0.1.
Table 11. Baseline effects of extreme weather events on total offenders based on negative binomial regression.
Dependent Variable: ln (Total Offenders)
(1)(2)(3)(4)
Extreme Heat Events0.002 **
(0.001)
Extreme Cold Events 0.000
(0.001)
Heavy Rainfall Events 0.001 *
(0.001)
Extreme Weather Events 0.001 ***
(0.000)
Ratio of Secondary Sector Output0.0000.0000.0000.000
(0.000)(0.000)(0.000)(0.000)
GDP per capita0.0080.0090.0100.010
(0.009)(0.010)(0.010)(0.010)
Public Expenditure−0.163 ***−0.161 ***−0.159 ***−0.158 ***
(0.021)(0.021)(0.021)(0.021)
Average Labor Wages−0.052 **−0.053 **−0.052 ***−0.052 ***
(0.018)(0.018)(0.018)(0.017)
Population Density−0.205 *−0.190 *−0.186 *−0.188 *
(0.105)(0.103)(0.102)(0.103)
Observations2656265626562656
RMSE0.580.590.580.58
Adjust R20.0100.0090.0100.010
City fixed effects
Year fixed effects
Notes: *** p < 0.01, ** p < 0.05, * p < 0.1.
Disclaimer/Publisher’s Note: The statements, opinions and data contained in all publications are solely those of the individual author(s) and contributor(s) and not of MDPI and/or the editor(s). MDPI and/or the editor(s) disclaim responsibility for any injury to people or property resulting from any ideas, methods, instructions or products referred to in the content.

