Abstract
This paper discusses the development of baseline and mitigation scenarios to guide the creation of a long-term plan supporting low-carbon transport in Ethiopia. Developing this method involved comprehensively reviewing policy documents, collecting historical activity data, and modelling the baseline and mitigation scenarios. The paper emphasises the importance of stakeholder engagement, which is instrumental in validating the model inputs, policy targets, and results at each stage, ensuring the credibility and robustness of our findings. The scenario development and analysis are based on the IPCC guidelines, informed by the policies of the Government of Ethiopia, and implemented with the Low-Energy Analysis Platform (LEAP). Three net-zero scenarios are assessed for the time horizon between 2020 to 2050. The so-called maximum ambition, NDC-aligned, and late action scenarios reflect the energy requirements and emissions contribution for varying levels of government ambition towards low-carbon interventions in the transport sector. In the baseline scenario, the total amount of carbon emissions is estimated at 4.81 million tonnes of CO2e in 2020, which is projected to increase to over 15 million tonnes by 2050. Under the mitigation scenarios, significant reductions are projected, with specific interventions like electrification in road freight reducing emissions by 9.68 MtCO2e and expanding rail transport reducing 9.95 MtCO2e by 2050 compared to the baseline. Other strategies identified for mitigating transport sector emissions, like improving energy efficiency, encouraging mass transit and non-motorised transport, show good potential for achieving a greener future. With the transport sector in Ethiopia identified as a major contributor to GHG emissions and climate change, this paper underscores the government’s efforts to ensure the long-term sustainability of its transport sector.
1. Introduction
The transport sector is a key contributor to global greenhouse gas (GHG) emissions, accounting for an estimated 24% of the total CO2e emitted globally [1]. This is because fossil fuels accounts for 91% of energy supply in the sector [2]. Furthermore, data on transport emission worldwide show that sub-Saharan Africa contributes 23%, North Africa and the Middle East 26%, and Central and South America 37%. In contrast, East Asia and the Pacific contribute 11% [3]. Transport plays a vital role in supporting socioeconomic activities, including the movement of people, goods, and information; it also facilitates access to areas like education, work, healthcare, and leisure, among others [4]. Despite the positive role transport plays in contributing to the well being of communities, the sector remains a major polluting end-user of energy because fossil fuels remain the most significant component of the energy sources used for transport operations [5]. Therefore, with the anticipated increase in travel demand caused by increased vehicle ownership [1] and other socioeconomic factors like population growth and increased urbanisation [6,7], it is foreseeable that, without intervention, there will be an increase in emissions from the sector in the future. Decarbonisation efforts targeted at the transport sector are likely to yield significantly positive outcomes aligned with the objectives of the 2015 Paris Agreement of reducing global emissions and the impacts of climate change [8]. Reducing transport emissions will require a combination of energy system transformations, technological advances, and multi-stakeholder cooperation at the national and international levels worldwide [9].
This paper describes the development of baseline and mitigation pathways to support the low-carbon development of Ethiopia’s transport sector. The broader context of the work is the country’s multi-sectoral long-term low-emission development strategy (LT-LEDS), developed to ensure that future economic growth is compatible with the nation’s climate commitments [10]. Understanding the country’s transport sector’s decarbonisation options is particularly useful in the context of other longer-term strategies like the Nationally Determined Contributions (NDCs), as they may help benchmark new and revised NDCs. Hence, the transport LEDS contrasts baseline and mitigation scenarios with different policy targets to indicate which goals the country can attain by 2050. The transport sector baseline involves establishing a historical scenario for GHG emissions and energy consumption from the base year of 2020 and projecting to the target year of 2050, with the key assumption of not implementing any intervention policies. On the other hand, the mitigation scenarios facilitate emission reductions, with a target year of 2050. The results provide key findings for the transportation sector, encompassing all land-based, water-based, and air-based modes for a developing country.
This work encompasses Ethiopia’s transport sector and subsectors while considering existing official policies, targets, alignment with the NDCs, and technological advances. Under the baseline scenario, transportation emissions continue to grow with increasing mobility demand and reliance on conventional, carbon-intensive fuels. The current trends in vehicle ownership, infrastructure utilisation, and travel patterns persist, escalating greenhouse gas emissions [11,12]. Without substantial changes, the baseline scenario represents a path of continued environmental degradation and the exacerbation of climate change impacts, underscoring the urgent need for proactive measures to transition to cleaner and more sustainable transportation alternatives [13,14]. Ultimately, this paper provides an analysis and the results of energy and emissions modelling, which can inform the creation of mitigation scenarios involving interventions that lead to emission reductions. The development, refinement, and validation of the baseline and mitigation scenarios significantly benefit from extensive stakeholder engagement involving interactions with experts in the public and private sectors, civil society, women’s and youth groups, and academia, ensuring that the scenarios reflect sectoral realities and that the entire process is inclusive.
This paper’s significance is that it defines clear and measurable pathways for the low-carbon development of Ethiopia’s transport sector, which help demonstrate the synergies between climate mitigation and long-term sectoral priorities. This paper also incorporates the impacts of mitigation strategies into long-term emission planning, particularly in the context of a sub-Saharan African country’s transport sector. The results include key findings from developing the earlier-mentioned scenarios, highlighting the strategic transportation sector policies most suited for defining the trajectories of three mitigation or net-zero pathways. The rest of this paper is structured as follows: The next section outlines a review of the relevant literature, discussing recent transport emissions trends. Section 3 discusses the national context of Ethiopia’s transport sector relative to its GHG emission contribution and sectoral policies. Section 4 focuses on the scenario development and modelling processes, including those for the baseline and mitigation pathways. Section 5 presents the results of the scenarios and discusses their implications. The concluding section outlines insights drawn from the analysis, highlighting potential avenues for future research.
2. Literature Review
Decarbonising the transport sector has the potential to reduce global emissions significantly. A compelling case for this is demonstrated by the strong positive linear relationship between travel demand and the transport sector [1,15]. Furthermore there is evidence of the direct relationship between carbon emissions and economic advancement [16,17] and the causal relationship between the factors [18]. Therefore, fostering collaborative efforts to alleviate the increase in transport-related GHG emissions is crucial, with both institutional and private-sector stakeholders play a role in this collective endeavour towards reducing transport emissions. A brief exploration of the mechanisms and pathways to reduce CO2e emissions and energy consumption in the transport sector, with a direct focus on sub-Saharan Africa’s challenges is presented in [19]. Some conclusions in the work show the link between energy management policies and basic developmental goals like improving access and affordability of transport services; hence, separating energy management from core development objectives leads to failed outcomes. Moreover, the situation calls for the aggressive implementation of strategic approaches like the Avoid, Shift and Improve (ASI) policies, coupled with institutional effectiveness, to significantly reduce regional transport emissions.
The ASI paradigm [20], offers a comprehensive framework for exploring low-carbon transportation policies. It involves strategies such as reducing the need for physical travel through implementing travel demand management strategies, encouraging the use of less-emitting transport modes, and improving the overall energy use and efficiency within a sector. Specifically, Avoid looks at reducing travel demand through improving urban land use and travel activity planning. It also considers reducing the need to travel or the distances people travel to reach their desired activities, involving strategies like remote work, mixed-use development, and transit-oriented development (TOD). Shift involves travel behavioural changes, typically involving a transition from high-polluting to low-emission modes of transport, such as giving up private cars for public transport modes, carpooling, and other non-motorised modes like cycling and walking. Lastly, the Improve strategy focuses on enhancing the efficiency and environmental performance of the existing modes of transport through improving fuel efficiency, promoting alternative fuels, and improving traffic management and control, including intelligent transport systems (ITS). A discussion of the applications of ASI in estimating transport sector emissions is presented in earlier works. These studies highlight important conclusions, such as the effectiveness of the ASI paradigm in reducing emissions and the need for further research to refine and improve its application in different contexts [21,22,23,24].
Assumptions, frameworks, data, intermediate parameters and projections from four existing global transport emission models are compared, to identify the sources of uncertainty and inconsistencies in transport emission estimates of current models, giving recommendations to address these issues [25]. Similarly, global comparative reviews of transport emission models, including energy–economy and integrated assessment models are presented in [8,15]. These studies identify ways of unifying and improving the estimation and evaluation of transport sector energy consumption and emission to improve the overall sectoral emission reduction process.
Works specifically discussing LT-LEDS, are also available in the literature. A comparison is done of how France, Germany and the United Kingdom develop, communicate and implement their long-term low-GHG development strategies [26]. The authors analyse key stages of LT-LEDS development, including the institutional and technical processes, the strategy document, and the implementation mechanisms. They focus on how to develop LT-LEDS in a way that is consistent with the Sustainable Development Goals (SDGs), particularly SDG 13 on climate action. The delivery of different system transformations aimed at GHG reduction and other non-climate policy goals is also presented in a new framework which designs and compares long-term decarbonisation pathways for the passenger transport sector [27]. The framework applied to four countries, namely Japan, the U.K., Mexico, and France, to compare country-specific pathways and explicitly consider demand-side factors and no-climate policies. The adopted method involves quantifying mitigation pathways, combining modelling and expert-based assessments of current and planned policies. A sustainable low-carbon transport (SLCT) scenario based on strategies that were considered for passenger and freight mobility, vehicle technologies and fuel, was developed and analysed [28]. A cost–benefit analysis for the scenarios, particularly considering improved energy security and air quality was also conducted in the work. The results of comparing the pathways were presented with a quantitative dashboard that allowed further engagement and analysis with stakeholders. Also long-term transport energy and emissions is modelled in Nigeria with recommendations about implementing of aggressive energy efficiency improvements alongside fuel and technology switching to maximise the reductions in energy demand and emissions in the transport sector [29].
An energy-saving and emission-reducing model with scenarios were also developed to measure the options and potential for long-term reductions in passenger transport energy and emissions in the Chinese city of Tianjin using a time span of 2010 to 2040 [30]. The scenarios were a business-as-usual plan, a five-year plan policy, a comprehensive policy, and a hybrid of the five-year plan and comprehensive policies. The study highlights the comprehensive policy scenario as achieving the most significant reductions. Delhi’s transport database and vehicle fuel consumption data was used to calculate transport demand and energy consumption [31]. The research assesses the impact of urban transport policies on reducing long-term energy consumption and emissions to identify an optimal transport policy for limiting future fuel consumption growth and air pollution. Their results show that the best-performing policies often combines different measures, such as encouraging a shift to public transport, increasing the average speed of urban traffic, and introducing greener forms of urban transit.
Other works have also discussed transport sector decarbonisation reviewing the existing literature to investigate how the low-carbon transport sector has progressed and to identify how the transport sector in the Global South can decarbonise [32]. The research also highlights important cost-effective alternatives and some knowledge gaps in the literature. The authors utilise a systematic quantitative literature review and trend analysis of the scholarly output by geographical location. Their main findings highlighted some key challenges facing transport decarbonisation in the Global South. On the other hand, the decarbonisation potential of different automotive propulsion technologies, including renewable fuels, e-fuels, hydrogen and electric mobility vehicles ae the review in [33]. Some of the conclusions drawn include the low adoption of new-energy vehicles like battery-electric and hydrogen-powered vehicles, which, combined with the long lifespan of the existing internal combustion engine vehicles, limit their near-term impact on decarbonisation.
Looking at research focused on specific transport subsectors, decarbonisation is considered in the context of heavy-duty transport and heavy-goods vehicles [34]. The work evaluated the feasibility of four scenarios, notably, environmental, technical, economic, and socio-political factors in the context of vehicle technology. The key technological challenges associated with reducing GHG emissions in shipping, aviation, and road freight, is discussed in [35]. The work also conducted an overview of alternative technologies available for this purpose. The technologies were explicitly compared to the earlier sectors’ electrification. There is significant uncertainty and mixed forecasts regarding the most cost-effective technologies for electrifying the heavy and long-haul transportation sectors compared to the passenger car segment. In [36] looked specifically at decarbonisation of the maritime sector, exploring the feasibility of attaining the Paris Agreement target of 1.5 °C. Presenting four possible decarbonisation pathways that combine available technologies, the study projected the transport demand for dry bulk, container, oil tanker, gas, wet product, and general cargo ship types based on the Organization for Economic Co-operation and Development’s (OECD’s) global trade projections. The authors examine the barriers to and the relevant policy measures for advancing the decarbonisation of international maritime transport. A study related to the specific objective of our work reported in this paper is [37], which assessed the long-term energy consumption and emissions in Malaysia. The authors developed a baseline scenario and three alternative fuel policy scenarios to do this. The study aimed to identify alternative fuel policies that would effectively reduce the future growth in road transport energy consumption and emissions in Malaysia. Furthermore, a baseline scenario and three alternative fuel policy scenarios involving biodiesel vehicles (BIOs), natural gas vehicles (NGVs), and hybrid electric vehicles (HEVs) is developed in [38]. The result of the study showed that when compared to the BIO and HEV scenarios, the NGV scenario offered the best energy demand and GHG emissions for road transport. Furthermore, the NGV scenario achieved the most significant reductions in the emissions of four pollutants.
A key limitation of many long-term strategies developed to reduce carbon emissions in the transport sector is the overemphasis on supply-side technological solutions, which often restricts exploring strategies for reducing mobility demand and encouraging modal shifts [39]. Focusing too much on technological transformation and integration also limits the understanding of the impacts of important factors like social practices, spatial planning, and infrastructure evolution [40]. Furthermore data unavailability hinders the accurate measurement of emissions for transport-sector decarbonisation policies [41]. This may also be exacerbated by underdeveloped institutional frameworks for monitoring and reporting transport-related data, which hamper the collection of comprehensive and reliable information. Other factors like the absence of standardised and centralised systems for reporting transport data lead to inconsistencies and gaps in the data obtained from various sources [42,43]. Also, inconsistencies in vehicle stock classification between different levels of government, like the regional and federal governments, make it challenging to create a uniform dataset and databases for emission estimation [44]. The research addressed previous challenges by implementing measures such as harmonising databases and establishing uniform methodologies for collecting and classifying transport activity data across different tiers of the relevant government institutions. These efforts were already undertaken during the formulation of the Nationally Determined Contributions (NDCs) in 2016 and its subsequent update in 2021 [45]. Moreover, institutional processes have been refined since the country’s GHG inventory publication for the transport sector [46].
3. Ethiopian Context
Ethiopia is geographically located in eastern Africa, with a land area of approximately 1,127,127 Sq. km [47]. The country is bordered by Kenya to the south, Sudan and South Sudan to the west, Eritrea to the north, and Djibouti and Somalia to the east, as shown in Figure 1a. With a population of 115 million, Ethiopia is Africa’s most populous country after Nigeria, ranking the 12th largest globally, with approximately 20% of the population residing in cities, according to the World Bank population data bank [47]. This urbanisation rate is forecasted to increase to 40% by the year 2050 [48]. Pressure from economic growth, the reclassification of rural settlements, and population increase have resulted in a considerable urban landscape transformation. The capital city of Ethiopia, Addis Ababa, and its regional capitals are highlighted in Figure 1b Over the past decade, Ethiopia has maintained an average economic growth rate of over 9% per annum [45], positioning it as one of the world’s fastest-growing economies. This growth has spurred increased economic activities and a promising outlook for the country. Agriculture, which is the main economic activity, accounts for 46% of the GDP and employs over 70% of the population [47]. According to [45], Ethiopia has vast regional differences in its topography, which in turn affect the weather and climate. The south and north-eastern parts of the country, which account for approximately 55% of its land mass, are low-lying, with a tropical climate and average temperatures above 25 °C, while the central regions of the country have elevations as high as 1500 m, with cooler temperatures between 15 °C and 20 °C. Urbanisation has increased the demand for passenger and freight transport in Ethiopian cities. This, in turn, has increased the rates of human activities, resource consumption, and infrastructure utilisation, which are some of the primary sources of emissions of the transport sector. These conditions and the previously described physical circumstances predispose Ethiopia to the effects of climate change events such as heavy rain, flash floods, and heat waves. The situation is worsened by its high dependence on agriculture and a very low adaptive capacity due to reliance on rainfall. The transport sector, therefore, needs to guide development and ensure minimal negative externalities, using sectoral priorities and policy interventions to arrest the current trend and meet its climate-related obligations. In the next section, the transport sector in Ethiopia is discussed, as are the its existing policy environment, energy consumption, and current emission trajectory in the sector.
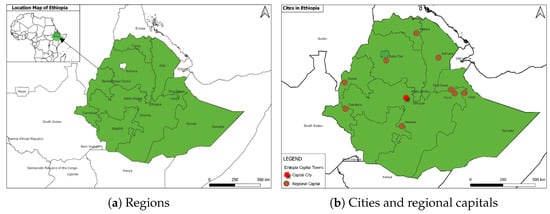
Figure 1.
Map of Ethiopia showing its cities and regions.
3.1. Overview of Ethiopia’s Transport Sector
Ethiopia’s transport sector comprises road, maritime, rail, and air subsectors, with road transport accounting for approximately 90% of passenger and freight movement, dominating the urban, rural, and international corridors. As of 2023, there were over 1.5 million registered vehicles, predominantly light-duty vehicles like cars and motorcycles. Major international routes, such as the Addis Ababa–Djibouti road, are crucial for connecting landlocked Ethiopia to the port facilities in Djibouti. Rail transport includes the Addis Ababa Light Rail Transit (AALRT), which serves over 60,000 passengers daily and helps reduce urban traffic congestion, and the Ethiopia–Djibouti Railway (EDR), enhancing freight efficiency by reducing travel time to the port to about 12 h. Air transport facilitates the domestic, regional, and international movement of people and goods. Additionally, the government is emphasising the growth in the freight sector through significant investments in rail and aviation infrastructure. Emissions stem from transport activities like mass transit and freight services, road construction, airports, and dry port development, with GHG-emitting vehicle classes including passenger vehicles, freight, and off-road vehicles. Table 1 summarises the transport subsectors and their emission-contributing activities, Figure 2a shows the distribution of registered vehicles, and Figure 2b presents the total vehicle mileage for each category in 2023, as supplied by the Ministry of Transport and Logistics (MoTL). The land transport network comprising roads and railwyas is presented in Figure 3.

Table 1.
Transport subsectors and activities.
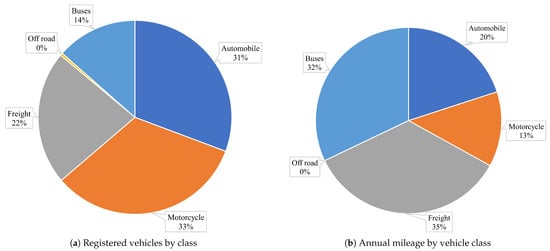
Figure 2.
Vehicle stock information.
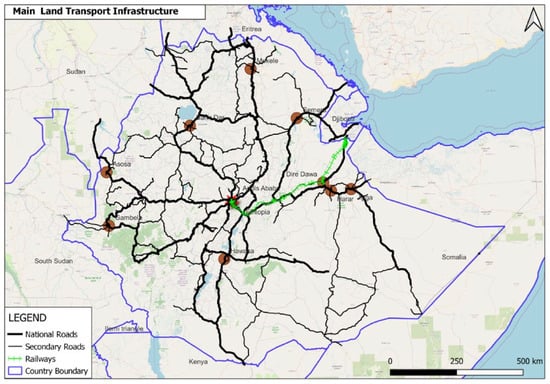
Figure 3.
Land transport network in Ethiopia.
3.2. Transport Sector Energy Analysis
Carbon-based fossil fuels account for most of the energy use in Ethiopia’s transport sector. The sector accounted for 47% to 61% of the national fossil fuel consumption between 2010 and 2022 [49]. The consumption of oil products across all energy and non-energy sectors in this period is shown in Figure 4. Furthermore, data provided by the MoTL show that oil products, namely, gasoline and diesel, accounted for over 95% of the energy consumption within the transport sector between 2018 and 2022, as portrayed in Figure 5a,b.

Figure 4.
Oil product consumption by energy end-use sector [49].
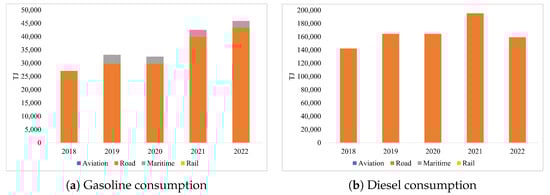
Figure 5.
Transport sector consumption of oil products.
Ref. [50] reported attempts to diversify the energy mix within the transport sector, including introducing biofuels like bioethanol. However, these attempts still represent a minute percentage of the energy consumption of the sector. Regarding electricity generation and consumption, [49] showed that at least 97% of the electricity used in the country was generated from hydro sources, see Figure 6a; however, only 1% of this was utilised by the transport sector in 2022, see Figure 6b. The observed low utilisation of electricity as a power source in the sector offers a significant opportunity for emission reduction through electrification.
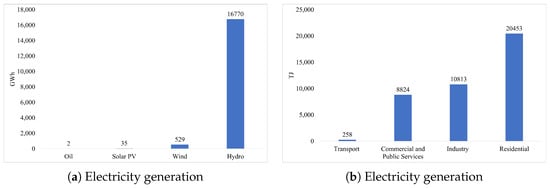
Figure 6.
Electricity generation and consumption in Ethiopia [49].
3.3. Transport-Sector GHG Contribution and Inventory
According to [46], Ethiopia’s transport sector accounts for 3% of the total national emissions. The land-based transport subsector is the most significant contributor to emissions in Ethiopia’s transportation sector, producing over 90% of the total transport emissions [46]. Among the land-based transport modes, the freight subsector contributes more than 50%, while the next most significant contribution, 20%, is from passenger transport vehicles. From a regional perspective, Addis Ababa, which is the capital of Ethiopia, produces 63% of the total emissions, highlighting the city’s importance in mitigating carbon emissions. The vehicular composition in Addis Ababa includes private cars, buses, two- and three-wheelers, trailers, trucks, and off-road vehicles of different configurations.
Ethiopia’s major GHG emissions comprise CO2, CH4, and NOx across various transportation subsectors [51]. The historic transport emissions from 2010 to 2020 are shown in the figures below. In Figure 7, emissions from land, air, and water transport are presented, while a breakdown of land transport is shown in Figure 8. Over 90% of the land transport emissions are produced by road transport vehicles from both the passenger and freight categories. The rail sector’s contribution is negligible, given that the primary energy source in this sector is electricity. This underscores the importance of land transport in any decarbonisation initiative for the entire sector. Domestic water and air transportation also contribute less than land transport.
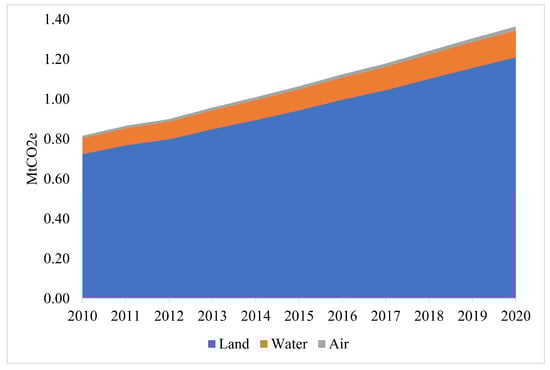
Figure 7.
Emission contribution of key transport subsectors.
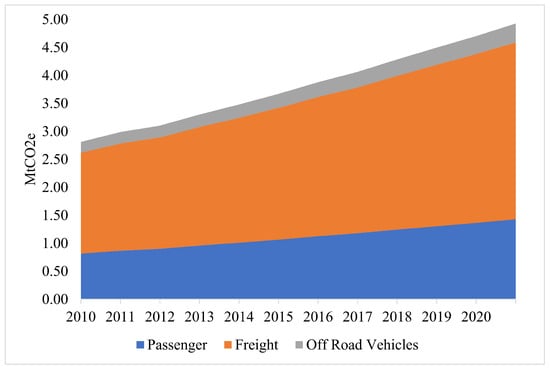
Figure 8.
Road transport contribution to emissions.
These insights can guide the Ethiopian government in formulating policies to mitigate the emissions of the transport sector.
3.4. Transport Sector Policy
Ethiopia’s transport sector is critical to the nation’s economic growth and development. The sector is guided by various strategic frameworks and policies to improve infrastructure, enhance connectivity, and reduce GHG emissions. In 1994, Ethiopia ratified the United Nations Framework Convention on Climate Change (UNFCCC), laying the groundwork for climate change mitigation strategies. In 2012, the Green Economy Strategy [52] was launched, aiming for sustainable and environmentally friendly economic growth to stabilise GHG concentrations to prevent detrimental human-induced climate interference. Furthermore, Ethiopia aims to achieve middle-income status and double-digit economic growth through environmentally sustainable economic development, known as green growth, with the aspiration of rapid poverty alleviation [53]. Hence, Ethiopia was the first developing nation to submit its intended nationally determined contributions (INDCs) to the UNFCCC, with the existing Climate Resilience and Green Economy Strategy (CRGE) informing the INDC submission and aligning international commitments with national development priorities through a growth and transformation plan. The key guiding documents for green growth initiatives include Ethiopia’s CRGE [51] and the Nationally Determined Contributions [45], which envision a climate-resilient green economy with net-zero carbon growth. As part of these efforts, units have been established in its government ministries, and focal individuals have been appointed in relevant institutions to oversee GHG emission reduction operations. An overview of the key transport-sector policies and strategies is presented below, briefly describing the main focus of each policy.
- Climate Resilient Green Economy Strategy (CRGE, 2010)
- The CRGE is one of the first policy documents developed by the government of Ethiopia with the aim of establishing a climate-resilient economy by 2025. The policy focuses on sustainable development while addressing climate change. The transport-sector strategies under the CRGE emphasise implementing low-carbon transportation systems, promoting electric vehicles (EVs), and enhancing public transport. The CRGE provides a foundational framework for integrating climate considerations into transport planning.
- Growth and Transformation Plans (GTP I, 2013) and (GTP II, 2016)
- GTP I and GTP II set ambitious infrastructure development goals, including significant road, rail, and air transport investments. GTP I enhances the road network and expands rail infrastructure, particularly the Addis Ababa–Djibouti railway. GTP II continues along this trajectory, emphasising the importance of sustainable transport systems that support economic growth while reducing environmental impact.
- Transport Sector GHG Inventory Report (2018)
- This report highlights the transport sector’s contribution to national GHG emissions, providing a baseline for future mitigation efforts. It identifies key areas for improvement, such as transitioning to cleaner fuels, increasing public transport usage, and promoting non-motorised transport (NMT). The findings have informed subsequent policy revisions and the development of more targeted interventions.
- National Transport Policy (2020)
- This policy was adopted to guide the development and management of the transport sector. It emphasises integrating transport planning, investing in infrastructure, and promoting sustainable practices. It aligns with the goals of the GTPs and CRGE, reinforcing the need for a comprehensive approach to transport development that considers economic, social, and environmental factors.
- Non-Motorised Transport Strategy (2020)
- The NMT strategy aims to promote walking and cycling as viable transportation options. It addresses the need for safe and accessible infrastructure for pedestrians and cyclists, contributing to reduced traffic congestion and lower emissions. This strategy complements the broader efforts to enhance public transport and improve urban mobility.
- Updated Nationally Determined Contributions (2021)
- Ethiopia’s updated NDCs outline its commitments to reducing GHG emissions by 50% by 2030, with significant contributions expected from the transport sector. This includes promoting EV adoption, enhancing public transport, and improving the fuel efficiency of vehicles. The updated NDCs align with international climate goals and demonstrates Ethiopia’s commitment to sustainable development.
- Ten-Year Development Plan (2021–2030)
- The Ten-Year Development Plan outlines strategic initiatives for economic growth, with a strong focus on infrastructure development. It emphasises the need for a resilient transport system that supports trade and connectivity while addressing environmental sustainability. The plan seeks to attract investment in transport infrastructure, including roads, railways, and airports.
- Ethiopian Transport Master Plan (2022)
- This comprehensive master plan provides a roadmap for the development of the transport sector over the next three decades. It emphasises integrated transport systems, regional connectivity, and the need for sustainable financing mechanisms. The plan aligns with national and international objectives, promoting a holistic approach to transport development.
- EV Standards (2022)
- The introduction of EV standards marks a significant step towards promoting electric mobility in Ethiopia. These standards aim to facilitate the adoption of EVs, improve charging infrastructure, as well as ensure safety and performance. This initiative supports the broader goals of reducing emissions and transitioning to a sustainable transport system.
Ethiopia’s transport-sector policies and strategies reflect a commitment to sustainable development, economic growth, and climate resilience. The integration of climate considerations into transport planning, as evidenced by policies like the CRGE and updated NDCs, signifies a proactive approach to addressing environmental challenges. Continued investment in infrastructure, the promotion of non-motorised transport, and the adoption of EVs are crucial for achieving the goals set forth in the GTPs and other strategic frameworks. Stakeholders must collaborate to ensure effective implementation and monitoring of these policies, paving the way for Ethiopia’s sustainable and resilient transport sector. As the country moves forward, it is imperative to strengthen institutional capacities, enhance stakeholder engagement, and foster innovation in transport solutions to meet the evolving demands of a growing economy while safeguarding the environment.
4. Materials and Methods
A working group was set up to oversee the development of the transport LT-LEDS. The group comprised experts from the MoTL as well as the Ministry of Water, Irrigation and Energy (MoWIE), and technical experts from the private sector and academia. The main activities undertaken in developing the transport LT-LEDS were grouped as non-analytic and analytic. The non-analytic activities involved an extensive and inclusive stakeholder consultation process to guide the entire LEDS development, promote knowledge sharing, and ensure data access by key stakeholders. The stakeholder engagement also facilitated the verification, validation, and prioritisation of policy interventions during the analytical phase of this work. The analytical components of the development of the LEDS focused on the sectoral analysis of the transport sector and the development of the baseline and mitigation scenarios. The main steps employed are illustrated in Figure 9.

Figure 9.
Research approach adapted from [54].
The process started with an initial review of the pertinent historical and contemporary policy documents, some of which were listed in the preceding section. An initial engagement with key stakeholders was also conducted through workshops to provide valuable insights about the transport sector’s existing energy and emission trends. Subsequently, transport activity and other relevant data were collected to facilitate modelling tasks. A baseline scenario was then formulated and refined to assess the historical emissions and energy consumption in conjunction with the stakeholders. Following this, sectoral policy priorities and targets for mitigation interventions were identified and reviewed. Subsequently, mitigation scenarios were developed, reviewed, and validated through further stakeholder engagement. The last activity in the process was documenting and reporting the results.
In developing the low-carbon pathways, climate resilience was considered during the identification of mitigation and intervention policies, target setting, and modelling of various mitigation scenarios. This integration was underscored by substantial attention given to initiatives, such as enhancing the efficiency of transport infrastructure to mitigate the impacts of climate change. Additionally, the mitigation policy scenarios were developed to align with Ethiopia’s NDCs, ensuring the long-term sustainability and climate resilience of the Ethiopian transport sector.
4.1. Data Collection and Processing
The MoTL in Ethiopia supplied the transport activity data used to develop and analyse the baseline and mitigation scenarios. Other data types such as GHG emissions, energy, and macroeconomics, as captured in Table 2, were obtained from other sources like an Intergovernmental Panel on Climate Change (IPCC) report [55]. Table 3 presents a sample breakdown of road-based vehicles used in this work.
Table 2.
Categories of activity.
Table 3.
Vehicle categories, descriptions, and fuel types.
The data structure employed for the analysis is depicted in Figure 10. It adhered to the guidelines outlined by the IPCC [55]. In the figure, the transport sector occupies the highest hierarchy level. The sector was then sub-classified into passenger, freight, and off-road subsectors. The subsectors were further divided into roads, rail, water, air, and NMT modes. Next, the transport modes were grouped into vehicle classes, followed by vehicle types at their lowest level. This hierarchical structure can be modified for regional models by including or excluding modes and types of vehicles at specific levels of the data structure, depending on data availability.

Figure 10.
Hierarchy of the components of the transport sector that contribute to emissions.
4.2. Stakeholder Interactions
Multi-faceted stakeholder engagement activities were held at key stages of this work, to ensure the successful development of the transport LT-LEDS. The engagements involved participatory workshops and consultations with stakeholders from different institutional and individual parties. Some of the stakeholders that contributed to all information gathering, discussion, and consultation activities in the process included experts from the MoTL, the Ministry of Planning and Development (MoPD), the Environmental Protection Authority, the Ministry of Urban Development and Construction, the MoWIE, Ministry of Women and Social Affairs, the Ethiopian Policy Studies Institute, the Worlds Resource Institute (WRI), and UN Women. The events served as critical platforms for soliciting constructive feedback in defining the inputs, results, and assumptions for developing the baseline and mitigation scenarios, as well as validating and refining policy priorities in the models. Furthermore, stakeholder engagement helped establish a robust stakeholder network that included various entities drawn from regional agencies, the private sector, civil society, academia, and the relevant public institutions that supported the current process. We look forward to future updates on the transport LEDS. Communication with the stakeholder network was facilitated through frequent meetings and teleconferences, allowing for the continuous assessment and refinement of the transport emission reduction pathways.
Capacity-building workshops were also organised to equip the local staff of the relevant government agencies, including their regional offices, with the necessary tools and skills to collaborate effectively in developing the baseline and mitigation scenarios. These training sessions, facilitated by experts from the Stockholm Environment Institute (SEI), aimed at equipping local stakeholders to manage future updates of the models. Below is a summary of some stakeholder engagement and capacity-building activities conducted for the transport-sector LEDS.
- Initial workshop and project kick-off
- This workshop presented the project objective, work plan, and modelling approach to stakeholders. The workshop also had scoping and visioning exercises to portray the development pathways and targets for the LEDS. A working group led by the MoTL, consisting of key experts from the earlier-mentioned stakeholders, was also formed for the transport LT-LEDS.
- Draft baseline scenario validation
- After the working group collaborated to develop their sectoral working plan and draft the baseline scenario, this workshop aimed to present the baseline scenario results and assumptions to experts as well as to gather feedback and inputs to further improve and validate the baseline scenario, including the assumptions and methodologies.
- Youth and women stakeholders’ session:
- This workshop was used to familiarise civil society organisation (CSO) networks dealing specifically with women and youth with the LED strategy development process and to discuss ways to engage them in climate-change-related issues.
- Baseline finalisation and low-carbon scenario modelling workshop
- The objectives of this workshop were to finalise the baseline scenario, discuss sectoral priorities for mitigation scenarios, and enhance the modelling capacity of government experts in the MoTL. The workshop was efficient as a first round of prioritising mitigation and adaptation actions in the sectors. An integrated assessment of the mitigation and adaptation actions, identifying synergies and trade-offs, was also conducted in preparation for modelling the mitigation options.
- National stakeholder consultation and modelling training
- The aim was to further consult on the LT-LEDS and to validate the low-carbon-emission scenarios. In addition, the workshop had follow-up modelling training sessions that helped the participants to understand the tools and methods used in developing the BAU and mitigation scenarios. The workshop included participants from research institutes, private sector representatives, NGOs, academia, and sectoral experts assigned by the government to collaborate on the LT-LEDS.
4.3. Scenario Modelling
The modelling in this work followred the IPCC guidelines, which estimated the emissions from the total energy consumption in a sector and the emission factors of the consumed fuels. Methodologically, the Tier 1 approach was used, which involved estimating sectoral energy consumption from national energy consumption and combining this with default emission factors, as specified in [55]. Regarding estimating the total energy consumed or fuel combusted, two methods exist for estimating transport emissions and energy demands: an aggregated or top-down approach and a disaggregated or bottom-up approach. A hybrid approach combining both methods may also be adopted depending on data availability.
The top-down approach uses aggregated base-year data to perform the analysis. This method is advantageous for developing strategic energy or emission models in cases of relative data scarcity when detailed transport activity data are unavailable. In contrast, the bottom-up method builds detailed models that are more representative using disaggregated activity data from different transport subsectors. The scenario modelling in this work was performed with a bottom-up approach. This was due to the approach’s greater flexibility in analysing complex mitigation scenarios and policies. Furthermore, the choice of the method wass facilitated by the availability of sufficient and appropriate disaggregated transport activity data.
The tool adopted for scenario modelling was the Low-Energy Analysis Platform (LEAP) [56], energy and emission modelling software developed by the Stockholm Environment Institute (SEI). The LEAP functions as a scenario analysis tool with a rigorous accounting framework for energy systems considering demand-side and supply-side technologies, ensuring a holistic assessment of total system impacts. The tool excels at tracking energy demand and pollution from fuel use for different end-use sectors. In addition, LEAP seamlessly integrates with environmental databases and resources, ensuring compliance with the IPCC guidelines for scenario development. LEAP was used in this work due to its proven accuracy and compatibility with other relevant modelling tools, such as the Green Economy Model. This compatibility facilitated integrated assessments covering energy, non-energy, and macro-economic factors, contributing to a holistic understanding of the scenarios considered in this study.
Furthermore, the LEAP has found widespread application in published works on transport emissions and energy analysis, such as [21,31,57,58,59].
Lastly, the tool combines a distance- and energy-based emission estimate for the transport sector, as shown in Equations (1) and (2), respectively. Equation (1) calculates emissions based on the total distance covered by the available vehicle fleet, while Equation (2) estimates emissions based on the total energy consumption of the fleet.
where:
- : Total emissions across all vehicle classes, years, and pollutants for a given time.
- t: The specific time point at which emissions are calculated.
- p: Specific pollutant type.
- y: Calendar year within the study period being summed over.
- v: The category of vehicle being summed over.
- : Number of vehicles of class v in operation at time t in year y.
- : Total distance traveled by vehicles of type v at time t in year y.
- : Total energy used by vehicles of type v at time t in year y.
- : Rate at which pollutant p is emitted per kilometer traveled.
- : Rate at which pollutant p is emitted per joule of energy consumed.
- : A factor representing the change in emission rate due to aging or wear of vehicles of type v.
5. Results
5.1. Baseline Scenario
The baseline scenario forecasts the trajectories of transport-sector emissions and energy demands, assuming no significant changes occur in the current policies and practices. The scenario projects greenhouse gas (GHG) emissions without policy interventions or technological advancements such as renewable energy. It operates on the premise that energy consumption patterns persist without changes to Ethiopia’s transport sector. Hence, transportation emissions will continue increasing due to rising mobility demands and the reliance on conventional, carbon-intensive fuels. The model projects emissions from 2020 to 2050, providing insight into the sector’s 100-year global warming potential (GWP). In the base year (2020), the total emissions from Ethiopia’s transport sector were estimated to be 4.81 million tonnes of CO2e. By 2050, this figure is projected to grow significantly to over 15 million tonnes of CO2e, as shown in Figure 11.
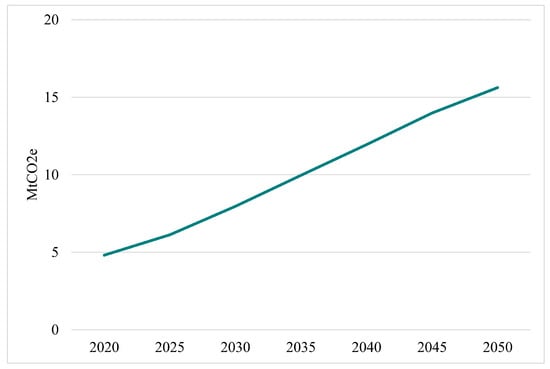
Figure 11.
BAU emissions.
Regarding energy consumption, the model shows that the transport-sector energy use in 2020 was about 66.1 PJ. This consumption is estimated to increase to over 200 PJ by 2050, as shown in Figure 12.
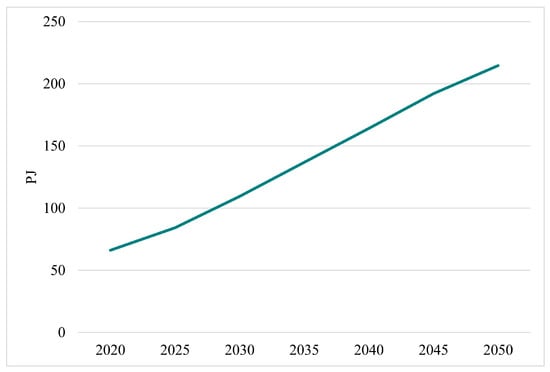
Figure 12.
BAU energy demand.
These projections underscore the importance of proactive measures to transition towards cleaner and more sustainable transportation alternatives to mitigate the environmental degradation and climate change impacts associated with the baseline scenario.
5.2. Mitigation Targets and Priorities
The mitigation targets set by the government of Ethiopia (GoE), based on its future development objectives for the transport sector, are presented in this section. The targets were used as quantitative assumptions in each mitigation scenario, showing the rates at which policies will be incrementally implemented to achieve emission reductions in the transport sector. The targets were obtained from some of the earlier-reviewed policy documents, including [45,60,61,62,63]. MoTL officials and stakeholders validated these assumptions from the other relevant government ministries, such as the MoWIE. Table 4 shows the intended emission reduction interventions and the planned implementation by 2030, 2040, and 2050 compared to 2020.
Table 4.
Transport-sector mitigation policy targets.
5.3. Mitigation Intervention Policies
Figure 13 depicts different emissions intervention policies, while Figure 14 illustrates the energy consumption scenarios under these mitigation strategies. The scenarios incorporated the validated sectoral targets provided by the GoE through the MoTL. The analysis reveals that the most significant reductions in emissions and energy consumption stem from interventions focused on expanding the rail transport sector and electrifying vehicles. These interventions will support the goal of reducing the GHG emissions of the transport sector by 2050. For instance, introducing electric vehicles in the road freight sector is projected to reduce emissions by 9.68 MtCO2e by 2050 compared to the business-as-usual (BAU) scenario. Furthermore, the electrification of passenger transport, particularly buses, could reduce emissions by 1.43 MtCO2e. Notably, the largest emission decrease by 2050 is expected from increasing the share of rail transport in the freight sector, with a projected reduction of 9.95 MtCO2e.
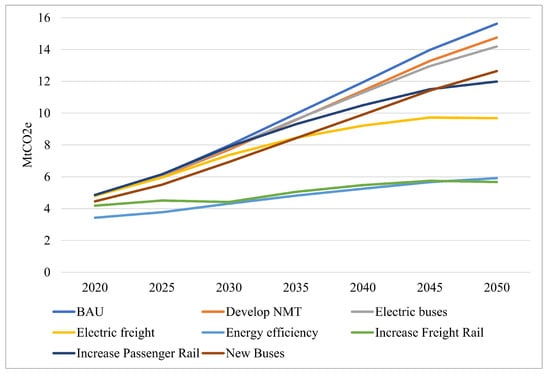
Figure 13.
Individual intervention policies for transport emissions.
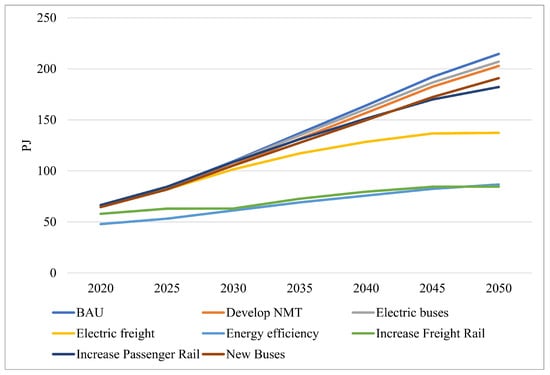
Figure 14.
Individual intervention policies for energy demand in transport sector.
Improvements in fuel efficiency are also significant, potentially reducing emissions by 9.71 MtCO2e by 2050. Similarly, increasing the share of passenger rail could lead to an emissions’ reduction of 3.63 MtCO2e. These reductions are feasible because Ethiopia’s rail sector is predominantly powered by electricity, suggesting that significant emission reductions can be achieved by prioritising mass rail transportation. Furthermore, other modelled interventions like developing NMT and increasing vehicle fleets (buses and rail) to support mass transit are also expected to contribute to the decrease in GHG emissions and energy consumption in the transport sector; however, when considered individually, they contribute less than the earlier-discussed policies. Overall, the mitigation interventions identified by the GoE are crucial for attaining the planned low-carbon development future in Ethiopia’s transport sector. However, further analysis was conducted to determine the optimal combination of mitigation policies.
5.4. Policy Aggregation
Extending the previous discussion, the identified mitigation measures were grouped into four key policies, namely, vehicle electrification, promote NMT, increase energy efficiency, and promote mass transit, as shown in Figure 15 and Figure 16. As shown in the figures, the non-motorised transport (NMT) policy results in the lowest expected emissions’ reductions, while the mass transit policy, which includes measures to strengthen passenger and freight rail, achieves the largest projected emissions’ reductions by 2050. This is due to the NMT scenario being considered only as last-mile transport services. NMT potentially offers the highest emissions’ reductions if all travel demand can be satisfied by non-motorised modes. However, this assumption requires significantly reimagining the current urban form and transport system in Ethiopia both in terms of investment and infrastructure. In Ethiopia, the GoE has no immediate plans to undertake a massive urban redesign of its cities. Nonetheless, NMT interventions still play a critical role in increasing the efficiency of mass transit services through last-mile connectivity; hence, NMT, as a an intervention, should be combined with the expansion of mass transit [64]. Without last-mile integration, mass transit fails to capture the desired ridership, which in turn affects its emission reduction potential. Ultimately, the above discourse provides valuable insights for the GoE to prioritise the described policy mix in its efforts to decarbonise the transport sector.
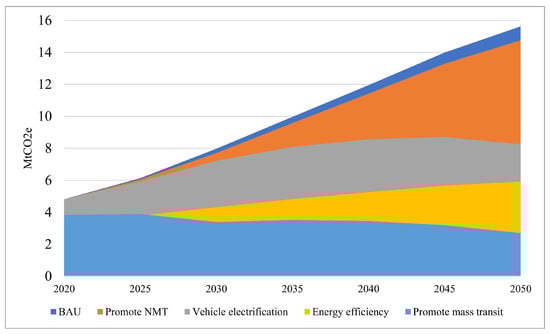
Figure 15.
Policy aggregation for emissions.

Figure 16.
Policy aggregation for energy demand.
A brief description of some initiatives of the GoE under the above-stated policies is presented below.
- Vehicle electrification
- This policy has a high emission reduction potential. With initial investment in the Addis Ababa Light Rail Transit (AALRT) system, an electric-powered light rail transit system will be located in Addis Ababa. The GoE aims to extend vehicle electrification to other key subsectors, such as private vehicles, mass transport modes, and freight. Other efforts by the GoE to support the uptake of electric vehicles (EVs) include various tax exemption schemes for the importation and local manufacturing of EVs and a ban on the importation of internal combustion engine (ICE) cars. These are expected to catalyse the growth og the electric vehicle sector in Ethiopia. Furthermore, there are plans to increase the use of local electricity from clean sources, such as wind, solar, and hydropower, which are currently the primary energy generation sources that will diminish the dependence on imported petroleum products to power the transport sector.
- Promote NMT
- Non-motorised transport usage fosters efficient and environmentally friendly transportation systems by providing last-mile connectivity for mass transit modes. Therefore, Ethiopia’s government is undertaking various initiatives to encourage NMT usage, including designing and implementing walking and cycling facilities of high quality in various towns and cities, updating the national street design standards to accommodate and prioritise NMT infrastructure, as well as conducting audits and surveys to monitor the progress of strategy implementations and identify areas for improvement. Additionally, the GoE is focused on developing safe pedestrian access in school zones to enhance child safety and promote walking as a viable mode of transport. Other measures include repairing faulty street lights and expanding street lighting into new areas to improve visibility and enhance pedestrian safety, particularly at night. Furthermore, the establishment of dedicated cycling tracks along major streets aims to provide cyclists with safe and separate pathways, encouraging more individuals to choose bicycles as a sustainable mode of transportation.
- Energy efficiency
- Ethiopia’s transport sector relies heavily on imported fossil fuels. In response, the government is initiating efforts to enhance fuel quality and efficiency as part of its environmental strategy. This initiative involves the continued development of biofuels. Ethanol offers a good alternative to carbon-based fuels when blended with gasoline due to its environmental and health benefits as well as competitive cost. However, it is understood that biofuels are less energy-efficient owing to their lower energy content. However, the loss of efficiency normally occurs at lower blend levels. Conversely, biofuels reduce greenhouse gas emissions and can be more sustainable. Ultimately, a significant aspect of the energy efficiency strategy involves the establishment of micro-distilleries capable of producing 1000 to 5000 litres per day, tailored to agricultural operations and to capitalise on feedstock. Studies [65,66] have highlighted the GoE’s strategy of promoting the blending of ethanol with gasoline as a viable energy source for transport.
- Promote mass transit
- The GoE recognises the crucial role of efficient public transportation in reducing GHG emissions and conserving energy. Hence, it prioritises policies to improve mass transit systems. Key actions include expanding bus rapid transit (BRT) and light rail transit (LRT) network coverage to serve more areas, enhancing the frequency of services to provide more convenient and reliable transportation options, upgrading public transport terminals and services to attract more travellers, giving signal priority to public transport vehicles intersections to improve traffic flow and reduce congestion, and increasing both the fleet and road-rolling stock of important transport modes to meet the growing demand and enhance the service capacity.
5.5. Low-Emission Scenarios
Three net-zero scenarios were considered: the NDC-aligned, maximum ambition, and late action scenarios, each offering different trajectories towards achieving a net-zero transport sector by 2050. These are shown in Figure 17 and Figure 18. The NDC-aligned scenario shows an initial gradual increase in ambition, as indicated by a reduction in the trajectory to meet the NDC emissions target by 2030, followed by a decrease from 2035 to attain net-zero emissions by 2050. The maximum ambition scenario sets high ambitions early on, indicated by a more aggressive reduction in the trajectory before reaching net-zero emissions around 2032 and sustaining them thereafter until 2050. In contrast, the late action scenario defers ambitious actions, with most interventions planned for 2040 to 2050, potentially missing the NDC 2030 target but aiming for net-zero emissions by 2050. The results reveal distinct trajectories for each scenario, showcasing varying emissions and energy consumption levels over time. In the maximum ambition scenario, emissions consistently decline from a peak in the base year to the target year of 2050. Conversely, the NDC-aligned scenario initially experiences a peak around 2035 to 2040 before sharply declining from around 2040 to 2050.
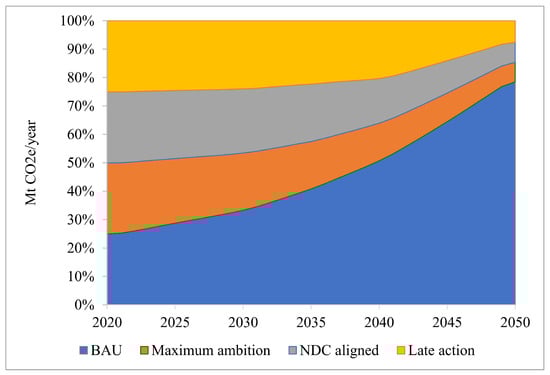
Figure 17.
Policy aggregation for emissions.
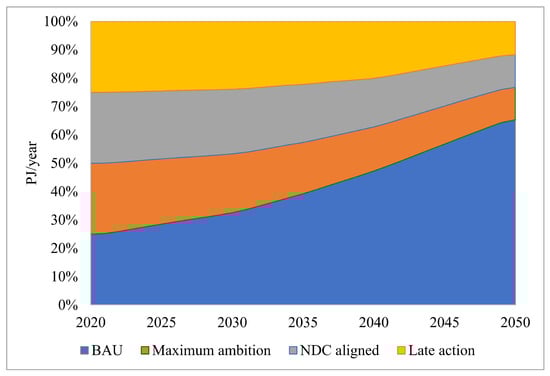
Figure 18.
Policy aggregation for energy demand.
In contrast, the late action scenario follows a higher-emission pathway, with a peak of around 2040 and a gradual reduction towards 2050. Similarly, the energy mitigation scenarios display distinctive patterns, with the maximum ambition scenario exhibiting the lowest trajectory while the late action scenario displays the highest trajectory. In all scenarios, the base year energy consumption remains constant at 66.1PJ, decreasing to 28.1PJ by the target year. The maximum ambition scenario demonstrates a steady decline and a steep slope, while the NDC-aligned scenario peaks around 2035, and the late action scenarios peak by 2040, respectively, before declining towards the target year.
6. Discussion
It is predicted that climate change will negatively impact many key areas of Ethiopia’s transport sector, like network planning and design, infrastructure like road pavements and bridges, and system implementation and operations. The main triggers will likely be increases in severe weather events, like severe rainfall, flash floods, and heat waves, which already pose a challenge to the transport infrastructure. The results presented in this work, therefore, contribute to climate mitigation by defining pathways that will reduce transport-sector GHG emissions. Adopting these strategies will ultimately encourage the implementation of mitigation pathways. These have the potential to improve the quality of transport systems and services, guaranteeing enhanced access to sustainable mobility in the future. The following non-exhaustive recommendations are proposed based on the analysis and results presented in this work and on the information supplied by the Ethiopian transport authorities. They touch on some of the mitigation policies already analysed in this work but also discuss other cross-cutting issues that should be considered by policymakers, stakeholders, and researchers to facilitate the transition towards a low-carbon transport sector in Ethiopia:
- Policy prioritisation:
- The GoE should prioritise implementing additional policies to reduce emissions, particularly by implementing land use and travel demand management strategies. These policies will facilitate reductions in the overall demand for travel and motorised vehicle mileage, offering substantial potential for mitigating greenhouse gas emissions and curbing energy consumption within the transport sector.
- Investment in renewable energy:
- To support the electrification of transportation and the adoption of EVs, the GoE should invest in expanding the electricity generation capacity from local clean sources, such as hydro and wind. This investment will ensure sufficient electricity supply to meet the growing demand for electric vehicles while advancing renewable energy development goals. Lastly, renewable electricity investment will also support electrified mass transit expansion.
- Expansion of mass transit systems:
- Investments in Bus Rapid Transit (BRT), Light Rail Transit (LRT), and other mass transit options should be accelerated to improve public transportation services. This includes expanding infrastructure coverage, increasing service frequency, and enhancing commuter safety and comfort.
- Promotion of non-motorised transport:
- Despite NMT contributing the least to emission reductions compared to other policies, NMT interventions play a critical role in the last mile of mass transit: without last-mile integration, mass transit fails to capture the desired ridership. Therefore, enhancing the infrastructure and facilities for non-motorised transport modes, such as walking and cycling, should be a priority.
- Development of biofuels:
- The GoE should continue to develop biofuels, like biodiesel and ethanol-based gasoline, to reduce the carbon content of fuels and promote sustainable alternatives to fossil fuels. This includes supporting the development of micro-distilleries for biofuel production and promoting the use of ethanol for blending with gasoline.
- Institutional capacity building:
- The MoTL needs to facilitate knowledge transfer and capacity-building activities centred around the transport LEDS on an ongoing basis. These efforts should focus on equipping personnel at the ministry to ensure that the overall progress of the LEDS will be monitored relative to the original goals of achieving the low-carbon development of Ethiopia’s transport sector.
- Research and monitoring:
- Further research is required to measure the socioeconomic effects of mitigation interventions, explore synergies between different policy measures, and identify innovative technologies and sustainable infrastructure solutions. Monitoring and evaluating policy effectiveness are essential to ensure progress towards low-carbon transport goals.
By implementing these recommendations, Ethiopia can accelerate its transition towards a low-carbon transport sector, mitigate climate change’s impacts, and promote sustainable economic development. Collaboration between government agencies, private sector stakeholders, and research institutions will be critical in achieving these objectives.
7. Conclusions
The analysis of emission mitigation scenarios in Ethiopia’s transport sector underscores the critical role of climate mitigation policy interventions in attaining a low-carbon future. Examining net-zero scenarios, including NDC-aligned, maximum ambition, and late action scenarios, highlights the importance of timely and ambitious actions in curbing GHG emissions and reducing energy consumption. The results show that efforts to expand the rail sector and electrify vehicles offer the highest potential for reducing emissions. Electrification, particularly in the road freight sector, emerges as a promising strategy, with substantial projected reductions compared to the baseline scenario. Furthermore, enhancements in non-motorised transport, congestion reductions, and limiting vehicle age are identified as complementary measures to decrease the emissions and energy footprint of transport in Ethiopia.
However, there is a recognition that the GoE faces other significant hurdles, such as funding limitations, infrastructure deficits, and a lack of institutional capacity, which may challenge the implementation of these policies within the projected time frames. Therefore, the GoE must address these issues with strategies that bridge the funding gap, reduce the skill mismatch required to successfully implement the programme, and strengthen the institutional capacity to monitor the entire process. Some of the steps taken through the LEDS project to ensure the adequate monitoring of transport-sector climate actions included knowledge transfer to local experts in the MoTL. This was achieved through the participatory role played by the MoTL Working Group in developing the BAU and mitigation pathways. This will ensure sufficient local capacity at the implementation stage, monitoring and evaluation, and further updates of the LEDS in the future. Another step taken regarding the institutional arrangement dealt with the inclusion of climate-related KPIs, which will ensure that the overall progress of the transport sector LEDS will be monitored relative to the original goals of achieving low-carbon development. Lastly, this process as well as its monitoring and evaluation will generate additional information that can be built into a valuable repository for updating the LEDS going forward. Looking ahead, future research should focus on several key areas: Firstly, the continued analysis and refinement of the mitigation policies are necessary to identify the optimal combination of interventions and their implementation timelines. Additionally, assessing these policies’ socioeconomic impacts and feasibility, including their effects on employment, accessibility, and equity, is crucial for ensuring a holistic and sustainable transition. Furthermore, investigating the potential synergies and trade-offs between different mitigation measures will provide valuable insights for policymakers. Moreover, research on innovative technologies, alternative fuels, and sustainable transportation infrastructure can accelerate the move towards a long-term, sustainable, low-carbon transport sector.
Author Contributions
Conceptualisation, O.A.N., D.S. and M.Z.; methodology, O.A.N.; software, O.A.N. and D.S.; validation, Y.Y.; formal analysis, O.A.N. and M.Z.; investigation, O.A.N. and O.M.; data curation, Y.Y.; writing—original draft preparation, O.A.N. and O.M.; writing—review and editing, O.A.N., D.S. and Y.Y.; project administration, M.Z. and D.S.; funding acquisition, D.S. All authors have read and agreed to the published version of this manuscript.
Funding
This research was funded by Agence Française de Développement (AFD) under the AFD2050 Facility CZZ273905.
Data Availability Statement
The data used in this study on available on direct request from the Ministry of Transport and Logistics Ethiopia.
Acknowledgments
The authors wish to thank the Agence Française de Développement (AFD) for providing the funds for this work; the working groups from the Ministry of Transport and Logistics, whose contributions and insight and the provision of relevant data for this work were crucial for completing this project; the Green Global Growth Institute for their facilitation and support during the LEDS project.
Conflicts of Interest
The authors declare no conflicts of interest.
References
- Yeh, S.; Gil, J.; Kyle, P.; Kishimoto, P.; Cazzola, P.; Craglia, M.; Edelenbosch, O.; Fragkos, P.; Fulton, L.; Liao, Y.; et al. Improving future travel demand projections: A pathway with an open science interdisciplinary approach. Prog. Energy 2022, 4, 043002. [Google Scholar] [CrossRef]
- International Energy Agency. Transport. 2023. Available online: https://www.iea.org/energy-system/transport (accessed on 23 November 2024).
- Ritchie, H.; Roser, M.; Rosado, P. CO2 and Greenhouse Gas Emissions. Our World in Data. 2023. Available online: https://ourworldindata.org/co2-and-greenhouse-gas-emissions (accessed on 23 January 2025).
- Quium, A.S.A. Transport corridors forwider socio-economic development. Sustainability 2019, 11, 5248. [Google Scholar] [CrossRef]
- IEA. Africa Energy Outlook, Paris: International Energy Agency; Technical Report; IEA: Paris, France, 2019. [Google Scholar]
- Satterthwaite, D. The implications of population growth and urbanization for climate change. Environ. Urban. 2009, 21, 545–567. [Google Scholar] [CrossRef]
- Mkalawa, C.C.; Haixiao, P. Dar es Salaam city temporal growth and its influence on transportation. Urban Plan. Transp. Res. 2014, 2, 423–446. [Google Scholar] [CrossRef]
- Pietzcker, R.C.; Longden, T.; Chen, W.; Fu, S.; Kriegler, E.; Kyle, P.; Luderer, G. Long-term transport energy demand and climate policy: Alternative visions on transport decarbonization in energy-economy models. Energy 2014, 64, 95–108. [Google Scholar] [CrossRef]
- Bouckaert, S.; Pales, A.F.; McGlade, C.; Remme, U.; Wanner, B.; Varro, L.; D’Ambrosio, D.; Spencer, T. Net Zero by 2050: A Roadmap for the Global Energy Sector. International Energy Agency. 2021. Available online: https://iea.blob.core.windows.net/assets/063ae08a-7114-4b58-a34e-39db2112d0a2/NetZeroby2050-ARoadmapfortheGlobalEnergySector.pdf (accessed on 29 March 2025).
- FDRE. Ethiopia’s Long-Term Low Emission and Climate Resilient Development Strategy (2020–2050); Technical Report; Ministry of Planning and Development: Addis-Ababa, Ethiopia, 2023. [Google Scholar]
- Zhang, R.; Hanaoka, T. Cross-cutting scenarios and strategies for designing decarbonization pathways in the transport sector toward carbon neutrality. Nat. Commun. 2022, 13, 3629. [Google Scholar] [CrossRef] [PubMed]
- Das, D.; Kalbar, P.P.; Velaga, N.R. Pathways to decarbonize passenger transportation: Implications to India’s climate budget. J. Clean. Prod. 2021, 295, 126321. [Google Scholar] [CrossRef]
- Kumar, M.; Shao, Z.; Braun, C.; Bandivadekar, A. Decarbonizing India’s road transport: A meta-analysis of road transport emissions models. Int. Council Clean Transp. 2022, 1–34. [Google Scholar]
- Victor-Gallardo, L.; Rodríguez-Zúñiga, M.; Quirós-Tortós, J.; Jaramillo, M.; Vogt-Schilb, A. Policy options to mitigate the fiscal impact of road transport decarbonization: The case of Costa Rica. Energy Policy 2024, 185, 113958. [Google Scholar] [CrossRef]
- Gota, S.; Huizenga, C.; Peet, K.; Medimorec, N.; Bakker, S. Decarbonising transport to achieve Paris Agreement targets. Energy Effic. 2019, 12, 363–386. [Google Scholar] [CrossRef]
- Muhammad, B. Energy consumption, CO2 emissions and economic growth in developed, emerging and Middle East and North Africa countries. Energy 2019, 179, 232–245. [Google Scholar] [CrossRef]
- Onanuga, O.T. Elasticity of CO2 emissions with Respect to Income, Population, and Energy Use: Time Series Evidence from African Countries. Econ. Altern. 2017, 4, 651–670. [Google Scholar]
- Menyah, K.; Wolde-Rufael, Y. Energy consumption, pollutant emissions and economic growth in South Africa. Energy Econ. 2010, 32, 1374–1382. [Google Scholar] [CrossRef]
- Gorham, R. Prospects for decarbonizing transport in Africa. Energy and Transportation in the Atlantic Basin; Center for Transatlantic Relations: Washington, DC, USA, 2017. [Google Scholar]
- Bongardt, D.; Creutzig, F.; Hüging, H.; Sakamoto, K.; Bakker, S.; Gota, S.; Böhler-Baedeker, S. Low-Carbon Land Transport: Policy Handbook; Routledge: London, UK, 2013. [Google Scholar]
- Maduekwe, M.; Akpan, U.; Isihak, S. Transportation Research Interdisciplinary Perspectives Road transport energy consumption and vehicular emissions in Lagos, Nigeria: An application of the LEAP model. Transp. Res. Interdiscip. Perspect. 2020, 6, 100172. [Google Scholar] [CrossRef]
- Wimbadi, R.W.; Djalante, R.; Mori, A. Urban experiments with public transport for low carbon mobility transitions in cities: A systematic literature review (1990–2020). Sustain. Cities Soc. 2021, 72, 103023. [Google Scholar] [CrossRef]
- Wismans, J.; Grahn, M.; Denbratt, I. Low-Carbon Transport-Health and Climate Benefits. OECD Environ. Work. Pap. 2016, 160, 1–68. [Google Scholar]
- Tao, X.; Wu, Q.; Zhu, L. Mitigation potential of CO2 emissions from modal shift induced by subsidy in hinterland container transport. Energy Policy 2017, 101, 265–273. [Google Scholar] [CrossRef]
- Yeh, S.; Mishra, G.S.; Fulton, L.; Kyle, P.; McCollum, D.L.; Miller, J.; Cazzola, P.; Teter, J. Detailed assessment of global transport-energy models’ structures and projections. Transp. Res. Part D Transp. Environ. 2017, 55, 294–309. [Google Scholar] [CrossRef]
- Rocha, M.; Falduto, C. Key Questions Guiding the Process of Setting Up Long-Term Low-Emission Development Strategies; OECD Publishing: Paris, France, 2019. [Google Scholar]
- Lefèvre, J.; Briand, Y.; Pye, S.; Tovilla, J.; Li, F.; Oshiro, K.; Waisman, H.; Cayla, J.M.; Zhang, R. A pathway design framework for sectoral deep decarbonization: The case of passenger transportation. Clim. Policy 2021, 21, 93–106. [Google Scholar] [CrossRef]
- Dhar, S.; Shukla, P.R. Low carbon scenarios for transport in India: Co-benefits analysis. Energy Policy 2015, 81, 186–198. [Google Scholar] [CrossRef]
- Emodi, N.V.; Emodi, C.C.; Murthy, G.P.; Emodi, A.S.A. Energy policy for low carbon development in Nigeria: A LEAP model application. Renew. Sustain. Energy Rev. 2017, 68, 247–261. [Google Scholar] [CrossRef]
- Peng, B.; Du, H.; Ma, S.; Fan, Y.; Broadstock, D.C. Urban passenger transport energy saving and emission reduction potential: A case study for Tianjin, China. Energy Convers. Manag. 2015, 102, 4–16. [Google Scholar] [CrossRef]
- Bose, R.K. Energy demand and environmental implications in urban transport—Case of Delhi. Atmos. Environ. 1996, 30, 403–412. [Google Scholar] [CrossRef]
- Emodi, N.V.; Okereke, C.; Abam, F.I.; Diemuodeke, O.E.; Owebor, K.; Nnamani, U.A. Transport sector decarbonisation in the Global South: A systematic literature review. Energy Strategy Rev. 2022, 43, 100925. [Google Scholar] [CrossRef]
- Yu, X.; LeBlanc, S.; Sandhu, N.; Wang, L.; Wang, M.; Zheng, M. Decarbonization potential of future sustainable propulsion—A review of road transportation. Energy Sci. Eng. 2024, 12, 438–455. [Google Scholar] [CrossRef]
- Li, K.; Acha, S.; Sunny, N.; Shah, N. Strategic transport fleet analysis of heavy goods vehicle technology for net-zero targets. Energy Policy 2022, 168, 112988. [Google Scholar] [CrossRef]
- Appl-Scorza, S.; Lippelt, J.; Littlejohn, C. Challenges of Electrification of Heavy and Long-haul Traffic. CESifo Forum 2018, 19, 46–49. [Google Scholar]
- Halim, R.A.; Kirstein, L.; Merk, O.; Martinez, L.M. Decarbonization pathways for international maritime transport: A model-based policy impact assessment. Sustainability 2018, 10, 2243. [Google Scholar] [CrossRef]
- Azam, M.; Othman, J.; Begum, R.A.; Abdullah, S.M.S.; Nor, N.G.M. Energy consumption and emission projection for the road transport sector in Malaysia: An application of the LEAP model. Environ. Dev. Sustain. 2016, 18, 1027–1047. [Google Scholar] [CrossRef]
- Luè, A.; Bresciani, C.; Colorni, A.; Lia, F.; Maras, V.; Radmilović, Z.; Whitmarsh, L.; Xenias, D.; Anoyrkati, E. Future priorities for a climate-friendly transport: A European strategic research agenda toward 2030. Int. J. Sustain. Transp. 2016, 10, 236–246. [Google Scholar] [CrossRef]
- Edelenbosch, O.Y.; McCollum, D.; Van Vuuren, D.; Bertram, C.; Carrara, S.; Daly, H.; Fujimori, S.; Kitous, A.; Kyle, P.; Broin, E.Ó.; et al. Decomposing passenger transport futures: Comparing results of global integrated assessment models. Transp. Res. Part D Transp. Environ. 2017, 55, 281–293. [Google Scholar] [CrossRef]
- Creutzig, F. Evolving narratives of low-carbon futures in transportation. Transp. Rev. 2016, 36, 341–360. [Google Scholar] [CrossRef]
- Singh, A.; Gangopadhyay, S.; Nanda, P.; Bhattacharya, S.; Sharma, C.; Bhan, C. Trends of greenhouse gas emissions from the road transport sector in India. Sci. Total Environ. 2008, 390, 124–131. [Google Scholar] [CrossRef] [PubMed]
- McKinnon, A. CO2 Emissions from Freight Transport in the UK. Rep. Prep. Clim. Chang. Work. Group Comm. Integr. Transp. 2007, 57, 35–42. [Google Scholar]
- Parshall, L.; Gurney, K.; Hammer, S.A.; Mendoza, D.; Zhou, Y.; Geethakumar, S. Modeling energy consumption and CO2 emissions at the urban scale: Methodological challenges and insights from the United States. Energy Policy 2010, 38, 4765–4782. [Google Scholar] [CrossRef]
- Gately, C.K.; Hutyra, L.R.; Sue Wing, I. Cities, traffic, and CO2: A multidecadal assessment of trends, drivers, and scaling relationships. Proc. Natl. Acad. Sci. USA 2015, 112, 4999–5004. [Google Scholar] [CrossRef] [PubMed]
- FDRE. Updated Nationally Determined Contribution of Federal Democratic Republic Ethiopia; Technical Report; Commission for the Environment, Forest, and Climate Change of the FDRE: Addis-Ababa, Ethiopia, 2021. [Google Scholar]
- MoT. Ethiopia: Transport Sector National GHG Inventory; Technical Report; Ministry of Transport and Logistics: Addis-Ababa, Ethiopia, 2018. [Google Scholar]
- World Bank. World Bank in Ethiopia 2020. Available online: https://data.worldbank.org/country/ethiopia (accessed on 15 March 2024).
- United Nations. World Population Prospects 2019; Department of Economic and Social Affairs Population Division: New York, NY, USA, 2019; pp. 1–25. [Google Scholar]
- International Energy Agency. Ethiopia—Energy Mix. 2022. Available online: https://www.iea.org/countries/ethiopia/energy-mix (accessed on 9 January 2025).
- Nnene, O.A.; Senshaw, D.; Zuidgeest, M.H.; Hamza, T.; Grafakos, S.; Oberholzer, B. Baseline scenario modelling for low emissions development in Ethiopia’s energy sector. Energy Strategy Rev. 2023, 49, 101166. [Google Scholar] [CrossRef]
- FDRE. Ethiopia’s Climate Resilient Green Economy; Technical Report; Federal Democratic Republic of Ethiopia: Addis-Ababa, Ethiopia, 2011. [Google Scholar]
- Paul, C.J.; Weinthal, E. The development of Ethiopia’s Climate Resilient Green Economy 2011–2014: Implications for rural adaptation. Clim. Dev. 2019, 11, 193–202. [Google Scholar] [CrossRef]
- Medhin, H.A.; Mekonnen, A. Green and climate-resilient transformation in Ethiopia. In The Oxford Handbook of the Ethiopian Economy; Oxford University Press: Oxford, UK, 2019; pp. 288–307. [Google Scholar] [CrossRef]
- Nnene, O.; Zuidgeest, M.; Senshaw, D.; Oberholzer, B.; Grafakos, S. Energy and emissions modelling in Ethiopia’s transport sector. In Proceedings of the 41st Southern African Transport Conference, Pretoria, South Africa, 10–13 July 2023. [Google Scholar]
- Eggleston, H.S.; Buendia, L.; Miwa, K.; Ngara, T.; Tanabe, K. 2006 IPCC Guidelines for National Greenhouse Gas Inventories; Technical Report; IPCC National Greenhouse Gas Inventories Programme, Intergovernmental Panel on Climate Change IPCC, c/o Institute for Global Environmental Strategies IGES, 2108–11: Kanagawa, Japan, 2006. [Google Scholar]
- Heaps, C.G. LEAP: The Low Emissions Analysis Platform; Software Version: 2020.1. 19; Stockholm Environment Institute: Somerville, MA, USA, 2020. [Google Scholar]
- Guayanlema, V.; Espinoza, S.; Ramirez, A.D.; Núñez, A. Trends and mitigation options of greenhouse gas emissions from the road transport sector in ecuador. WIT Trans. Ecol. Environ. 2014, 191, 933–941. [Google Scholar] [CrossRef]
- Al-Jabir, M.; Isaifan, R.J. Low Transportation Emission Analysis and Projection Using LEAP: The Case of Qatar. Atmosphere 2023, 14, 1286. [Google Scholar] [CrossRef]
- Li, Y.; Bao, L.; Shan, X. Scenario Analysis of Urban Transport Emission Mitigation Potential in Shanghai based on LEAP. In Proceedings of the 2016 IEEE 19th International Conference on Intelligent Transportation Systems (ITSC), Rio de Janeiro, Brazil, 1–4 November 2016; pp. 1869–1874. [Google Scholar] [CrossRef]
- FDRE Planning and Development Commission. Ten Years Development Plan: A Pathway to Prosperity; Technical Report; Planning and Development Commission: Addis-Ababa, Ethiopia, 2021. [Google Scholar]
- FDRE. Ethiopia Non-Motorised Transport Strategy 2020–2029; Technical Report; Ministry of Transport and Logistics: Addis-Ababa, Ethiopia, 2020. [Google Scholar]
- FDRE. Ethiopian Transport Master Plan: Policy and Strategy; Technical Report; Ministry of Transport and Logistics: Addis-Ababa, Ethiopia, 2022. [Google Scholar]
- Bayleyegn, D.; Ericksen, P.; Solomon, D. Climate Resilient Green Economy Strategy: Sector-Wise GTP II Implementation Monitoring Checklist; Technical Report; Ministry of Transport and Logistics: Addis-Ababa, Ethiopia, 2018. [Google Scholar]
- Das, D.; Kalbar, P.P.; Velaga, N.R. Role of non-motorized transportation and buses in meeting climate targets of urban regions. Sustain. Cities Soc. 2022, 86, 104116. [Google Scholar] [CrossRef]
- Benti, N.E.; Aneseyee, A.B.; Geffe, C.A.; Woldegiyorgis, T.A.; Gurmesa, G.S.; Bibiso, M.; Asfaw, A.A.; Milki, A.W.; Mekonnen, Y.S. Biodiesel production in Ethiopia: Current status and future prospects. Sci. Afr. 2023, 19, e01531. [Google Scholar] [CrossRef]
- Gabisa, E.W.; Gheewala, S.H. Policy implications and recommendations for sustainable bioenergy development in Ethiopia. Sustain. Futur. 2025, 9, 100612. [Google Scholar] [CrossRef]
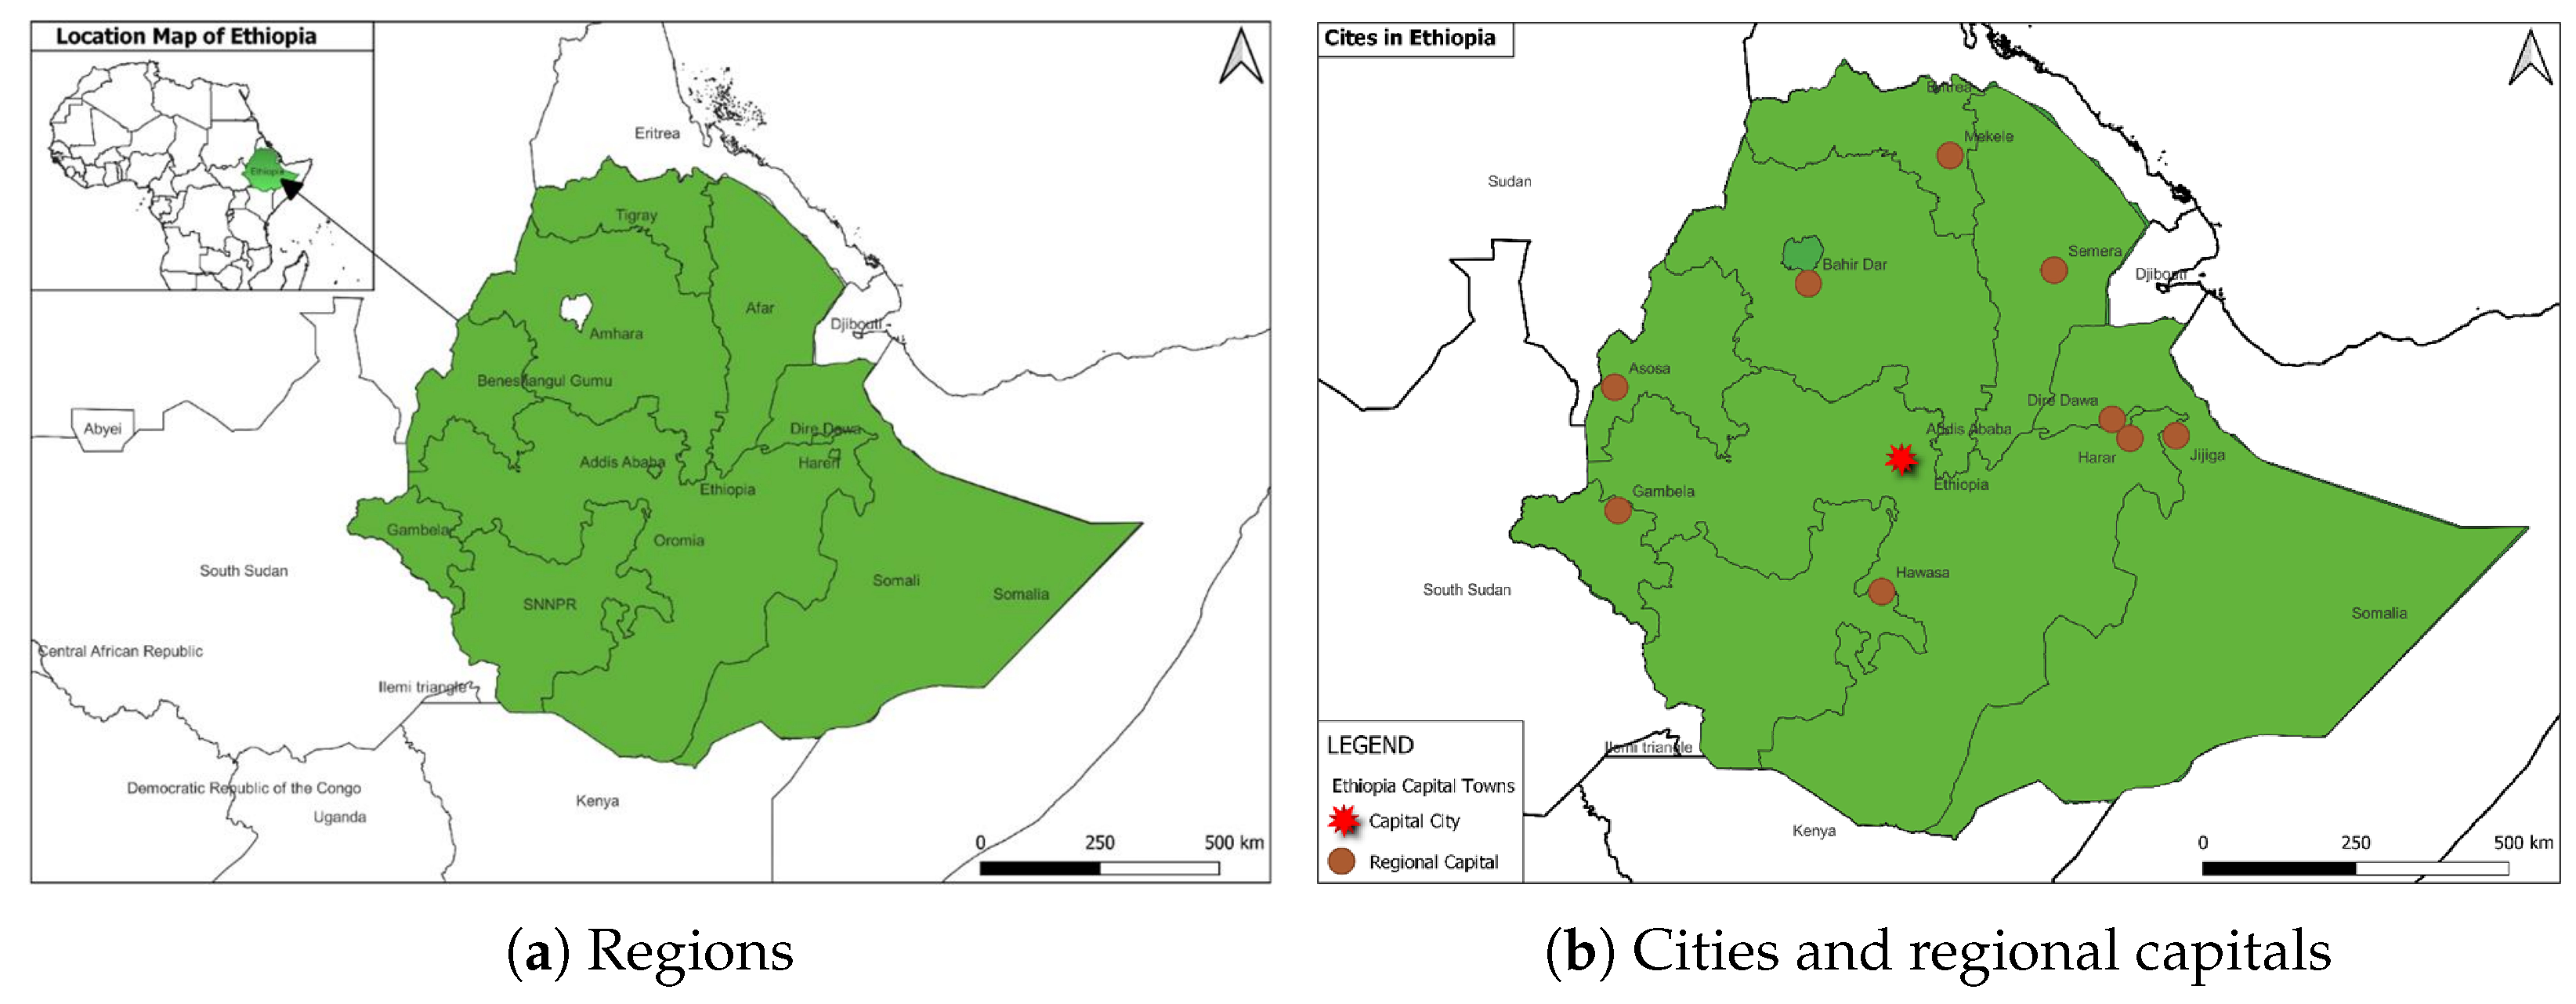
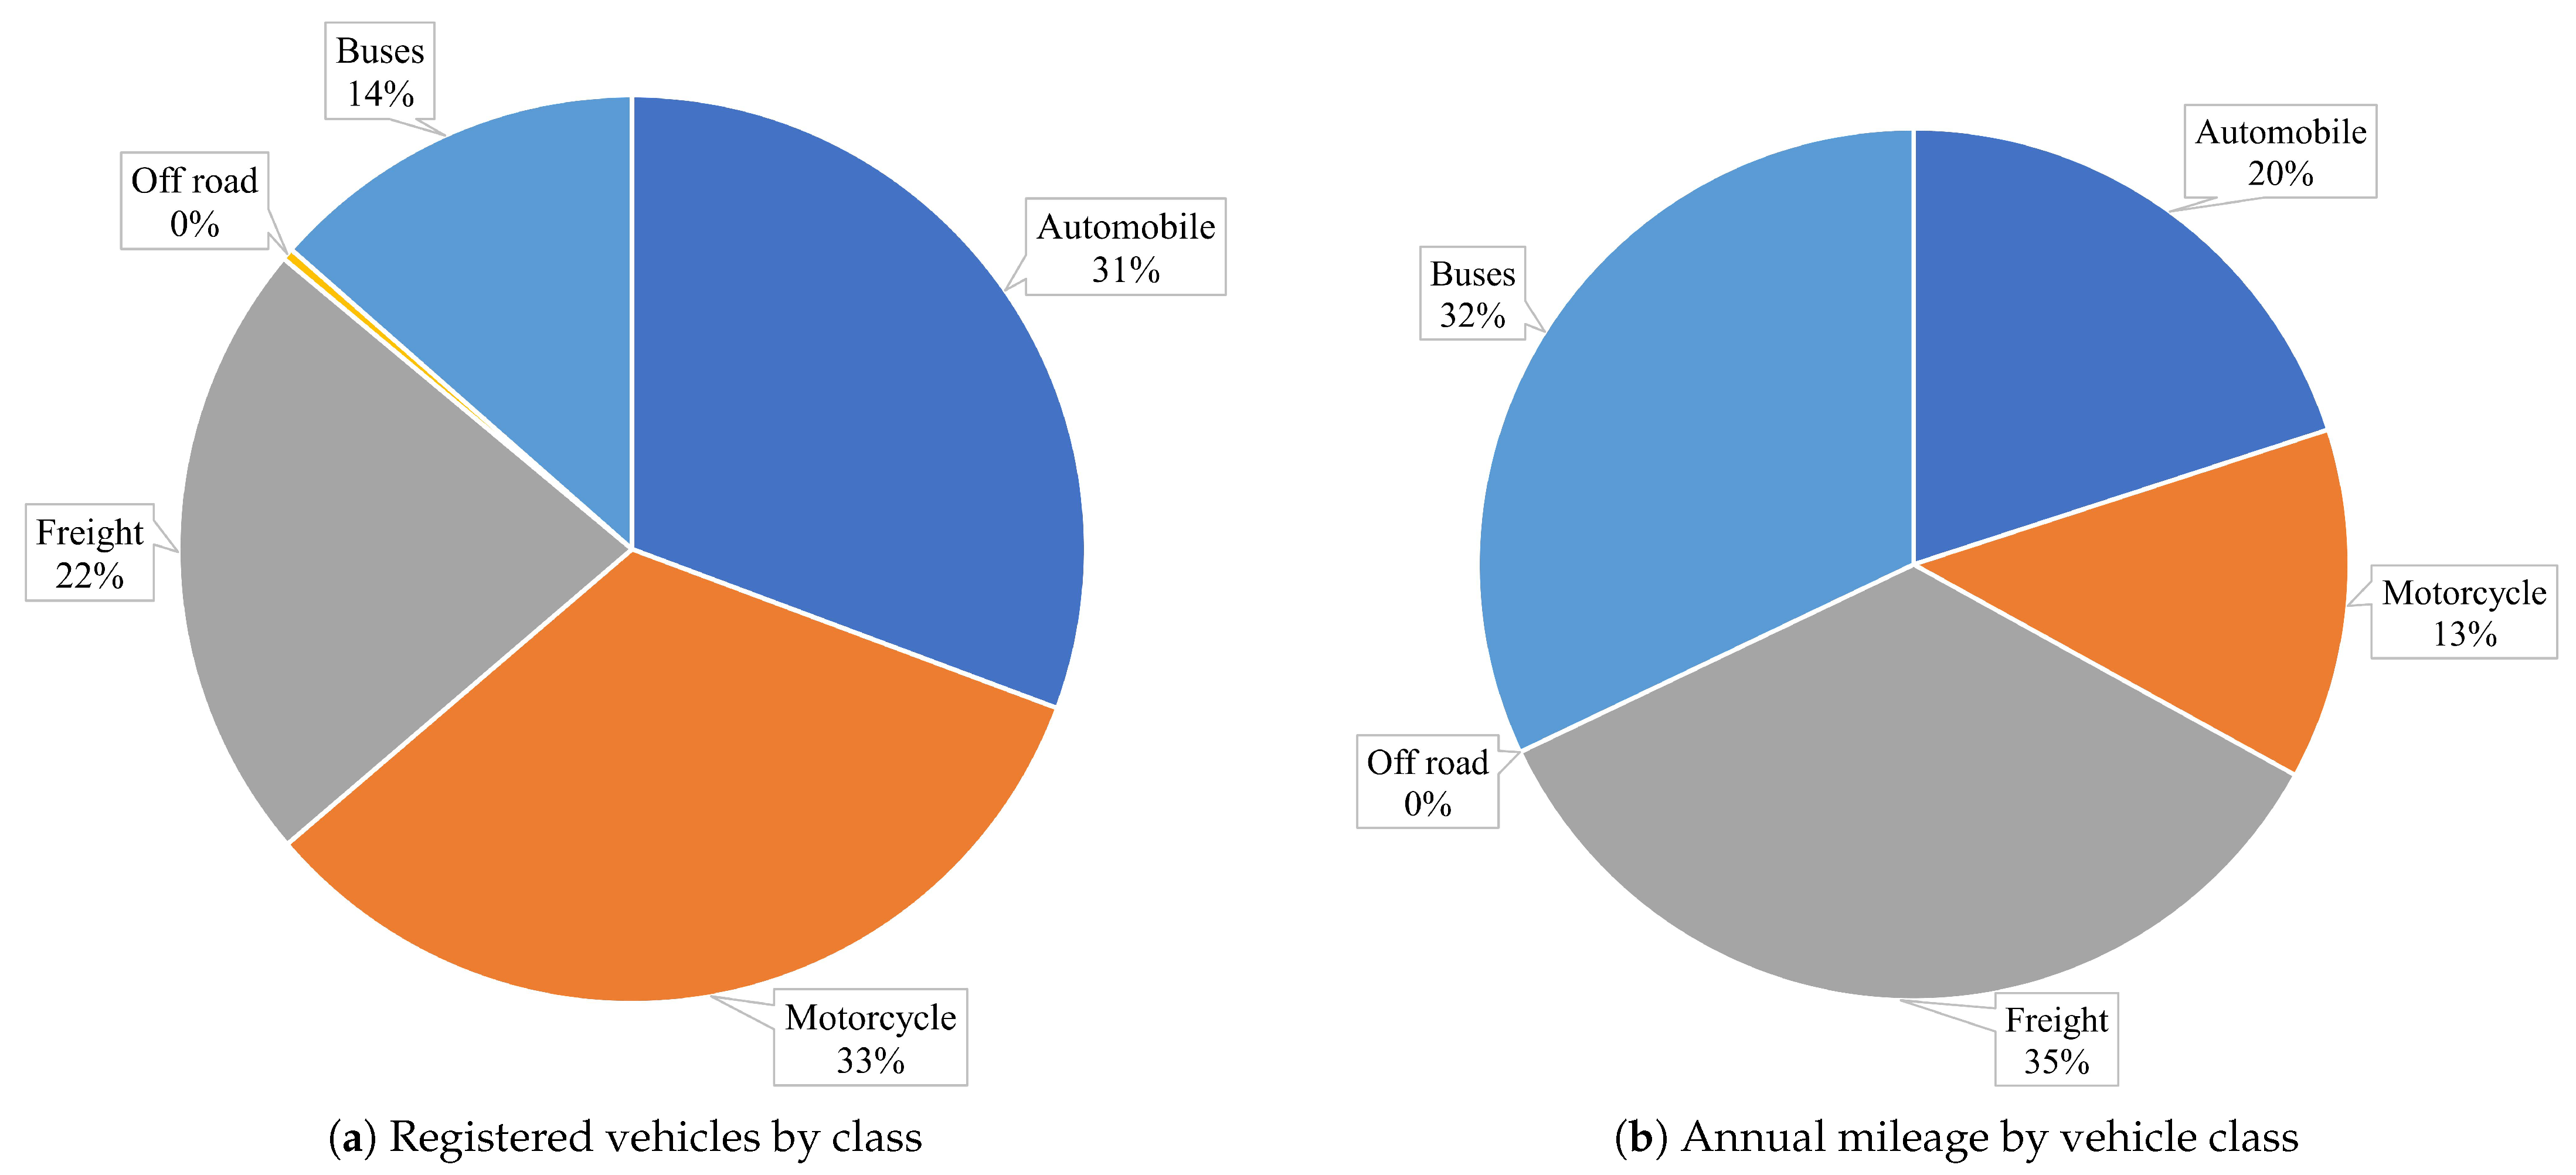
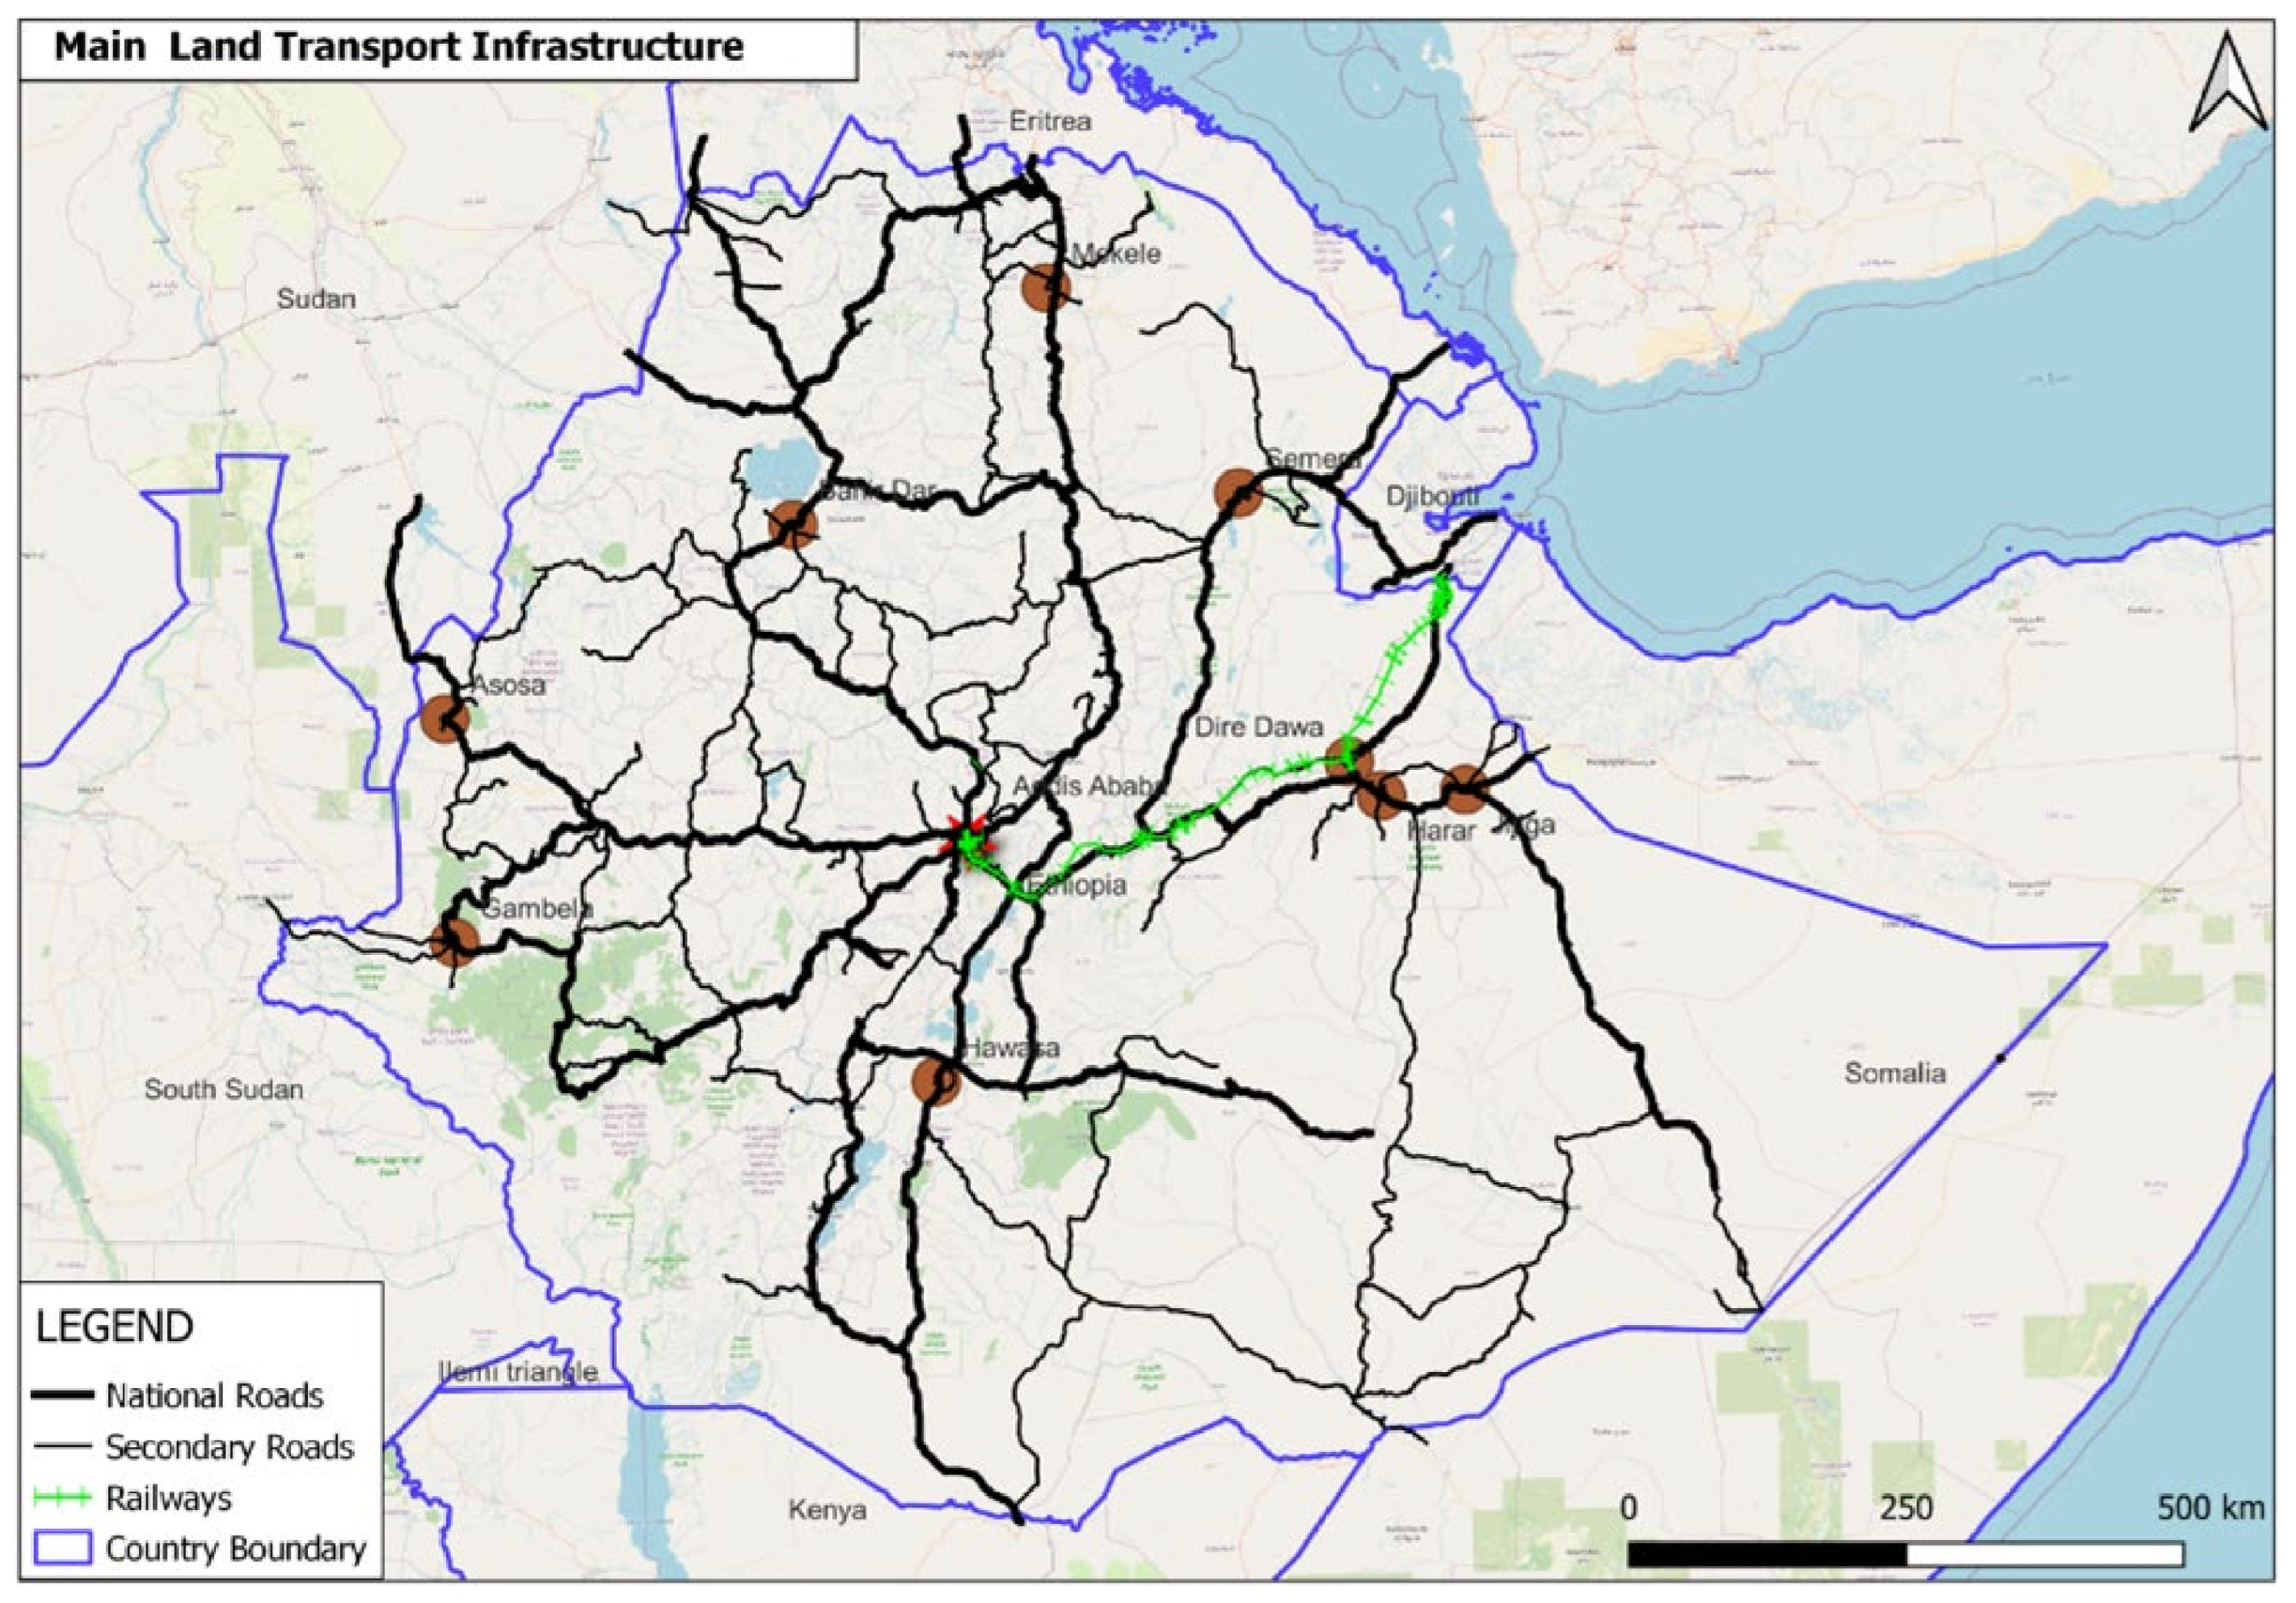
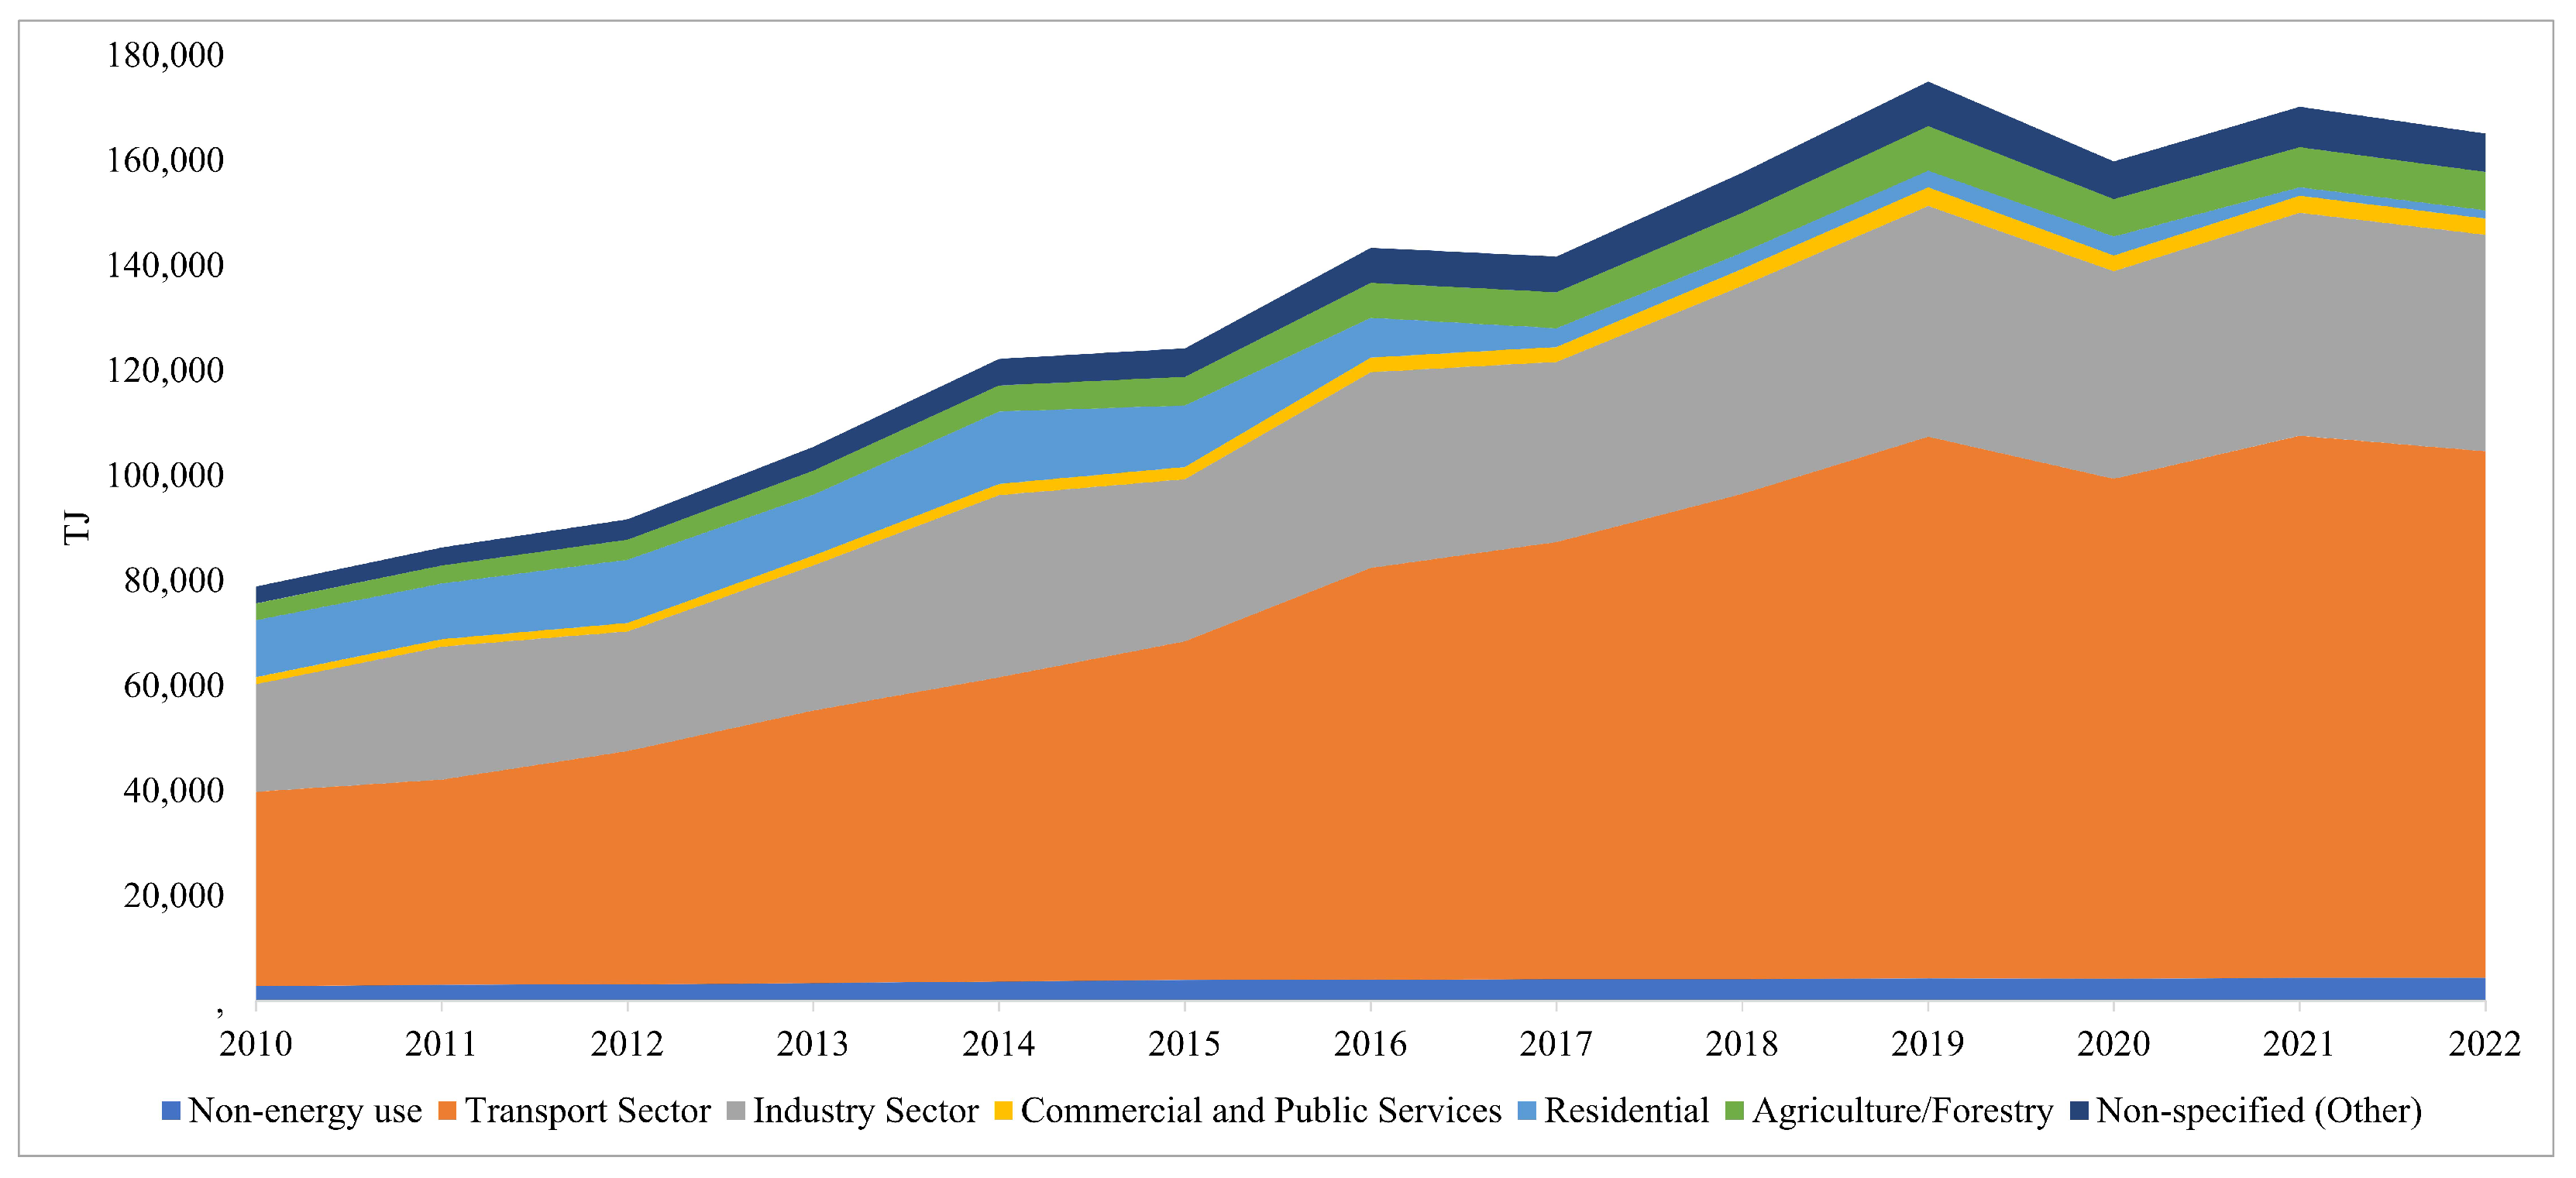
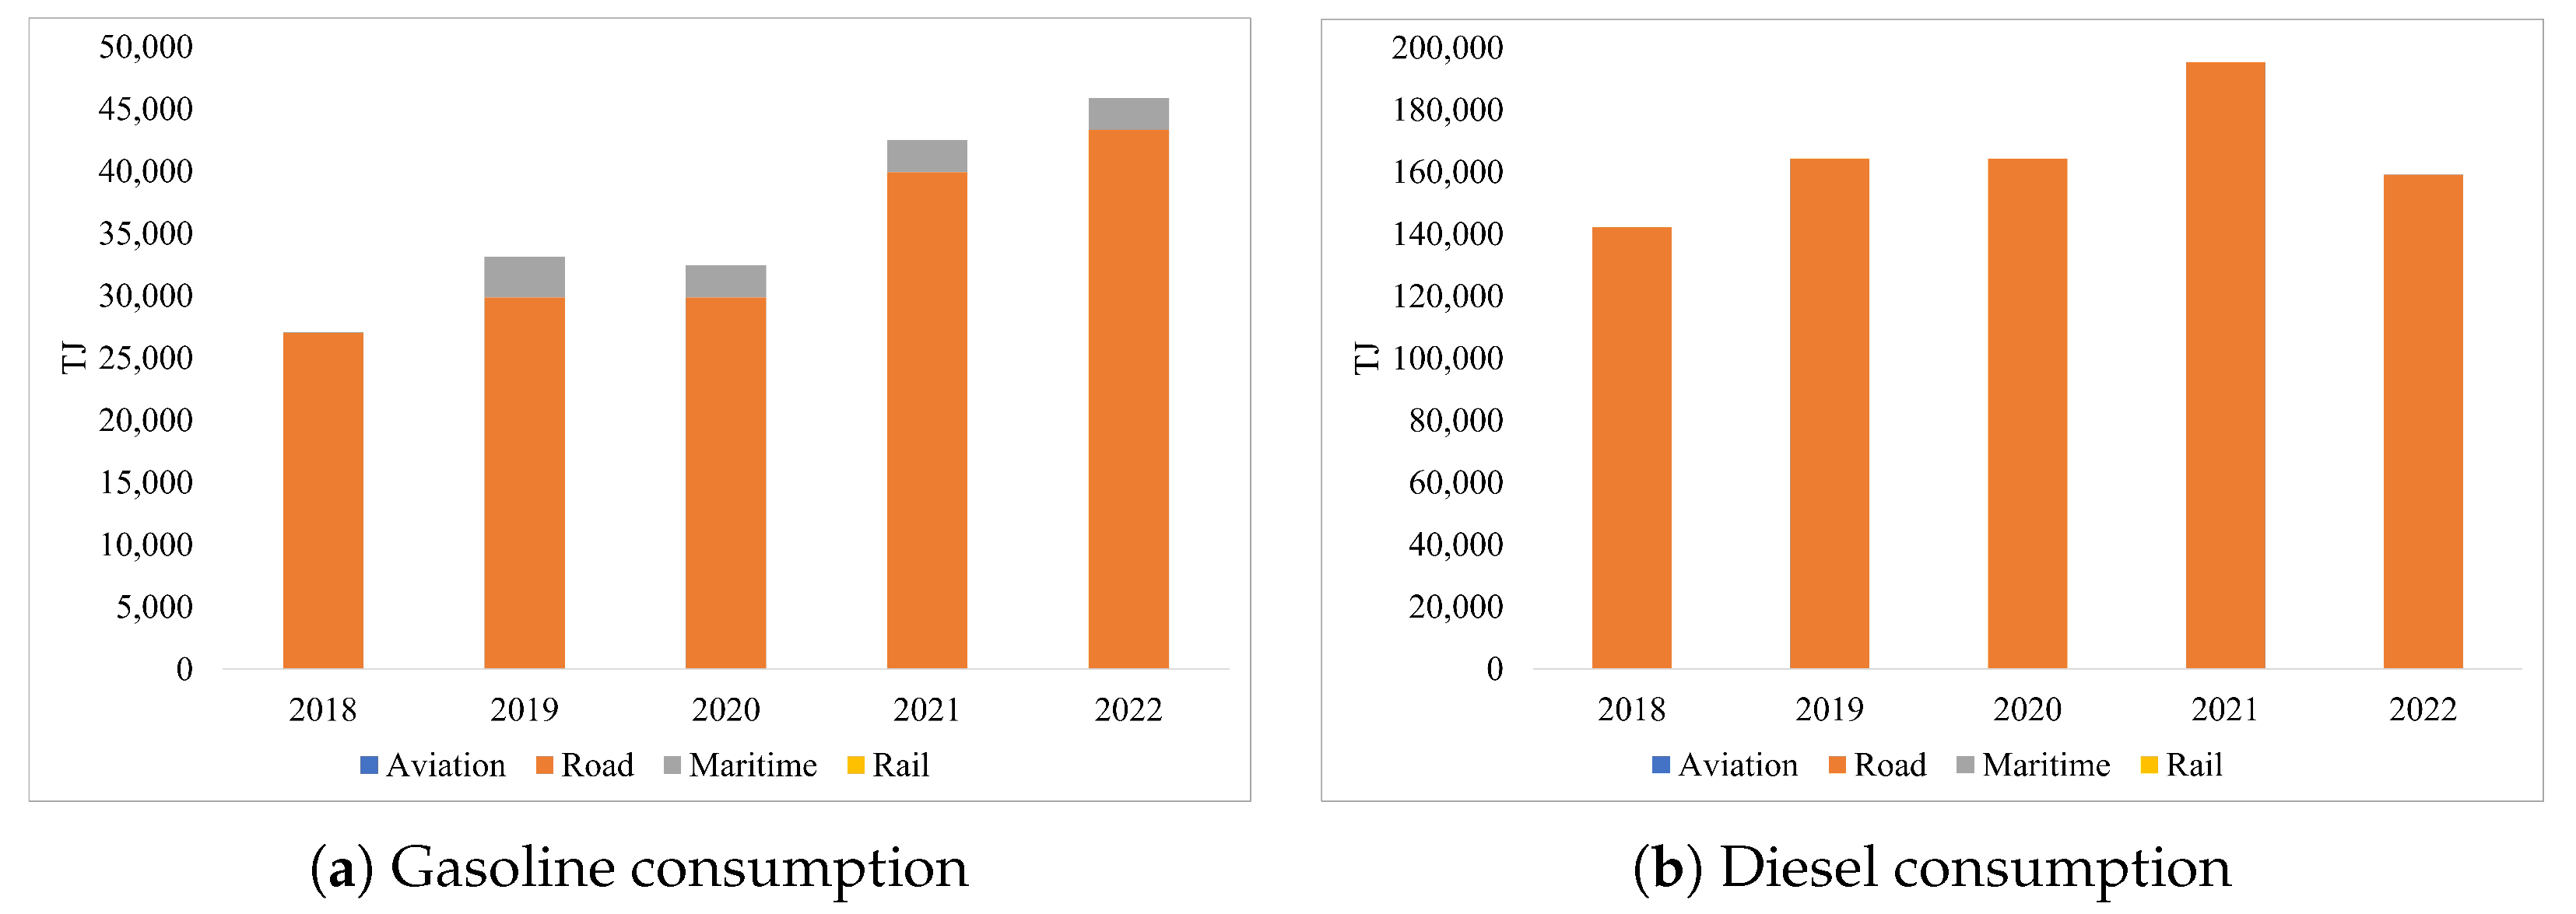
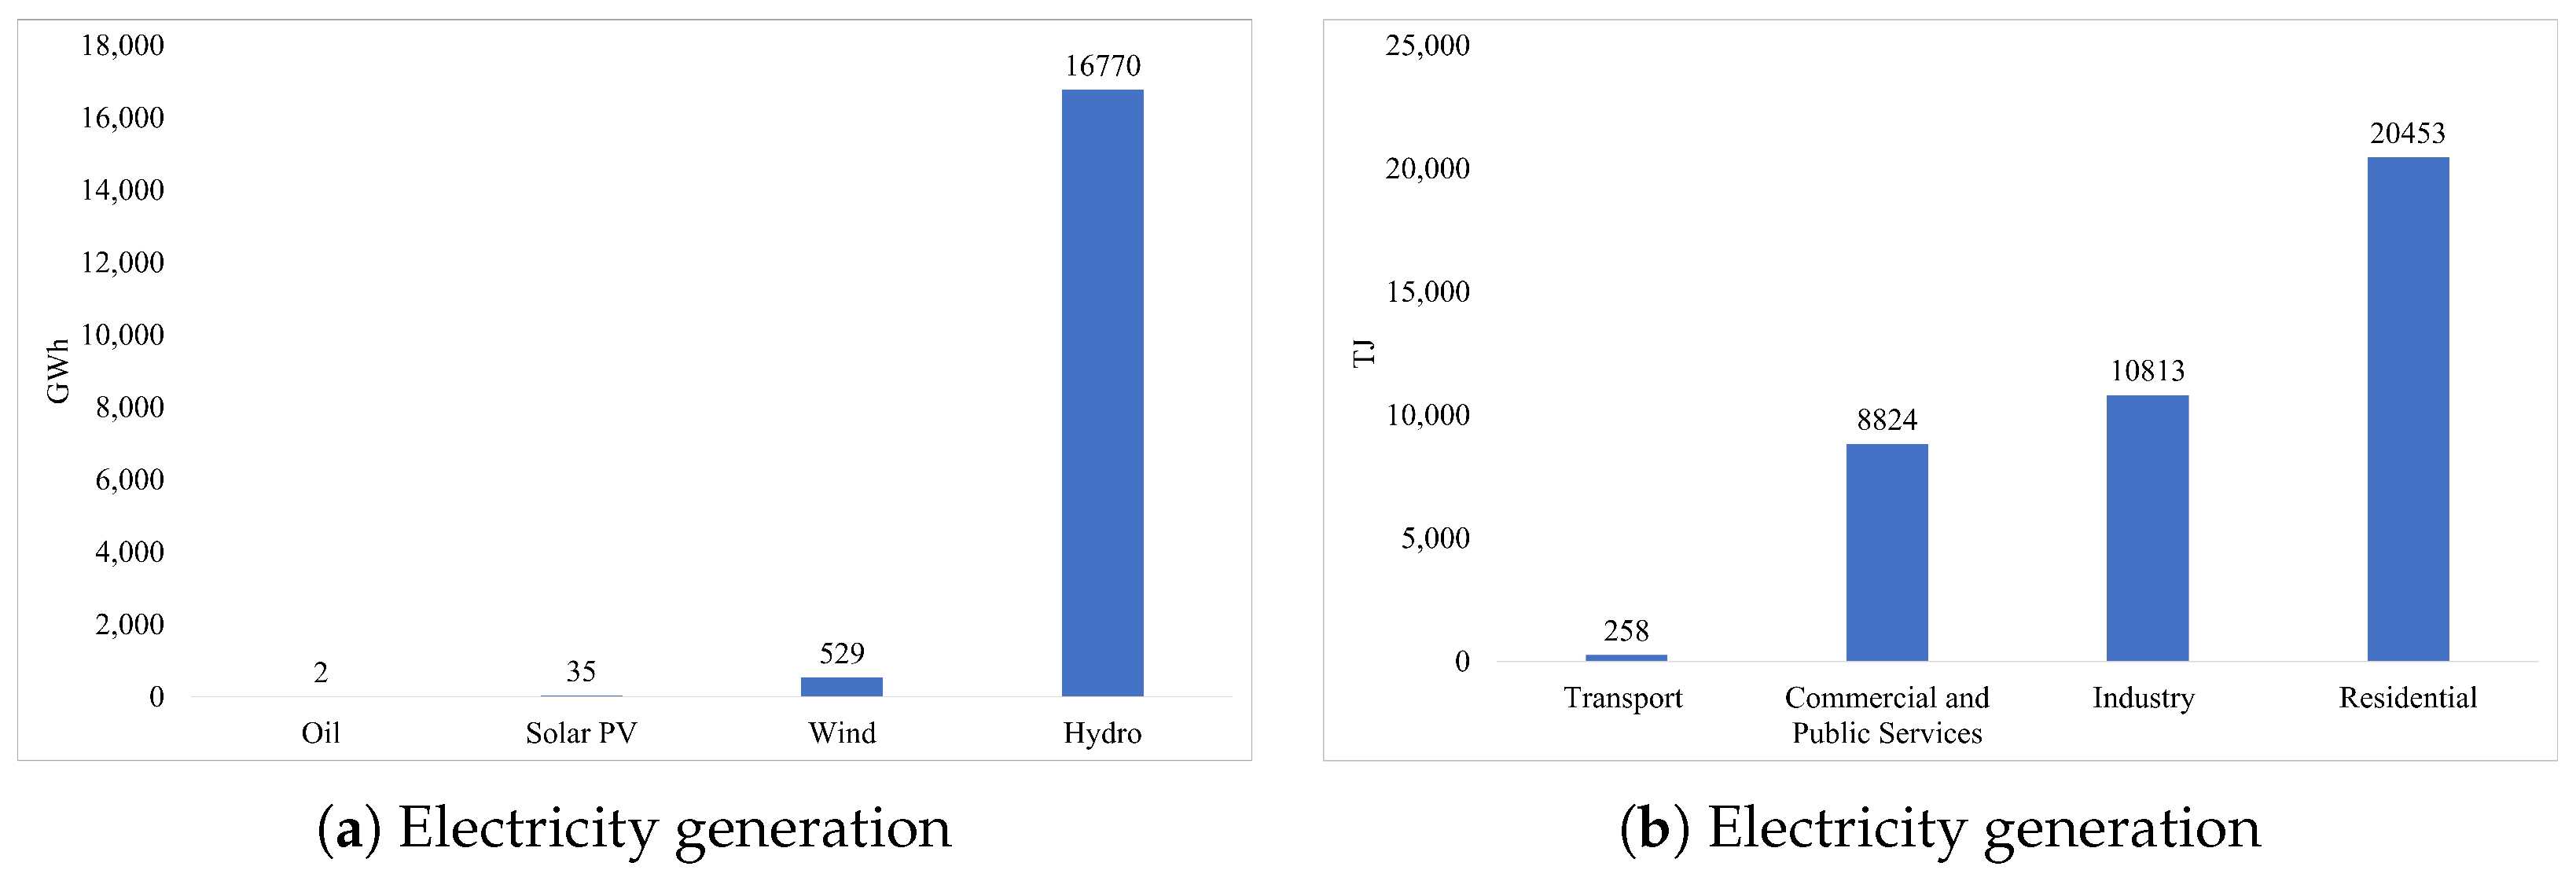

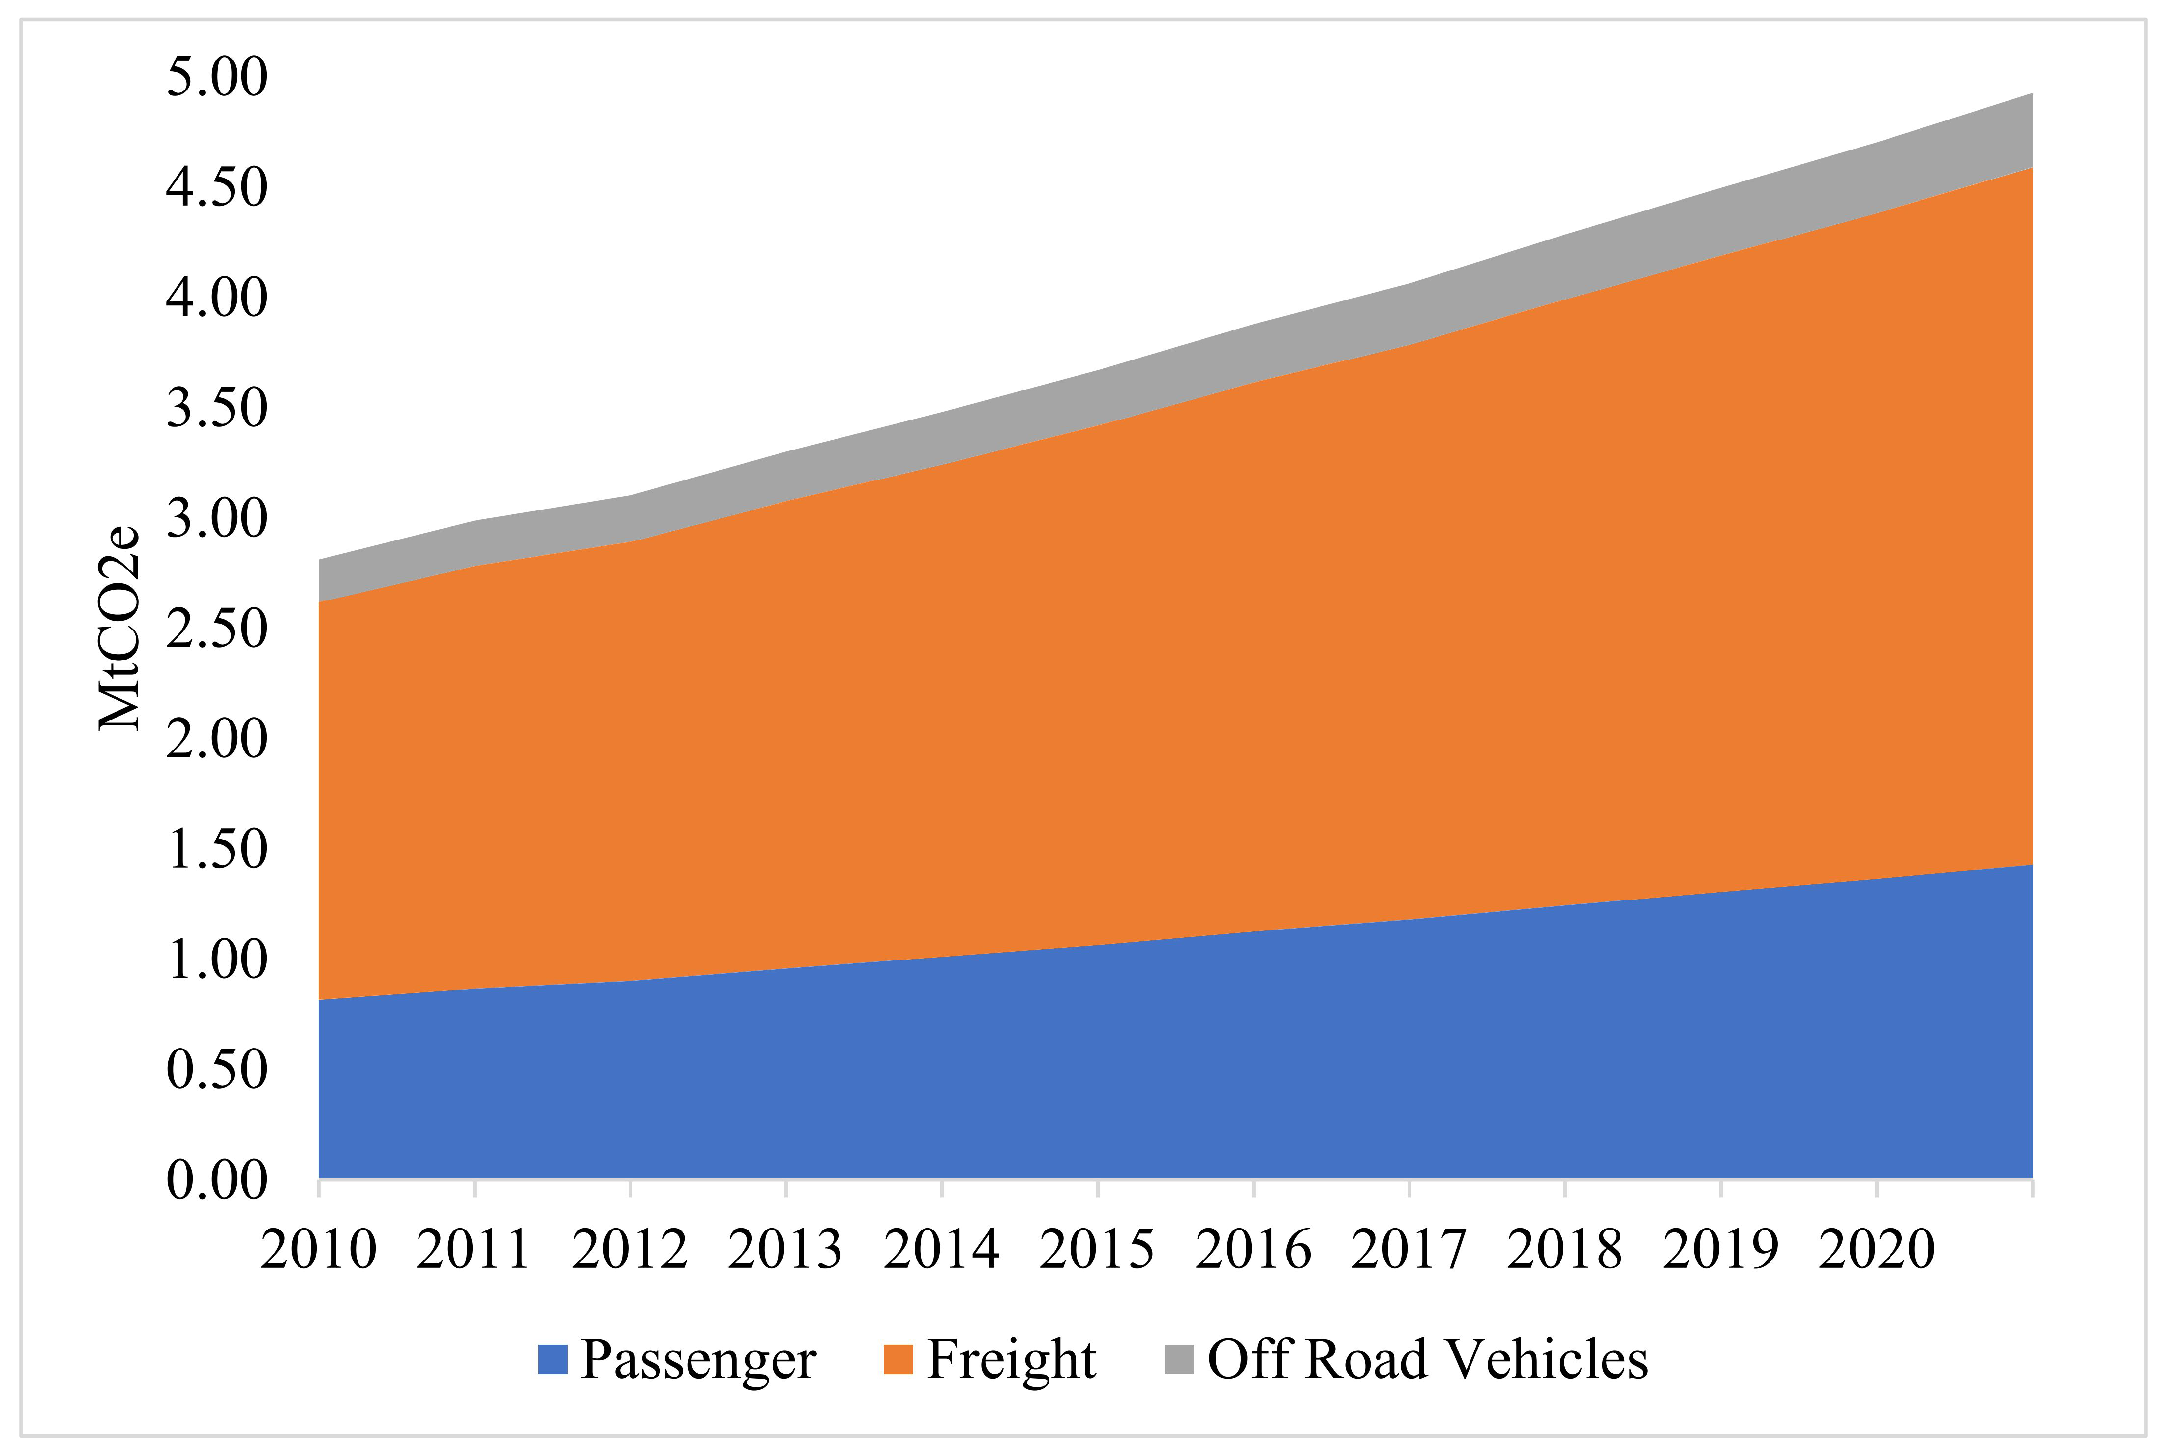
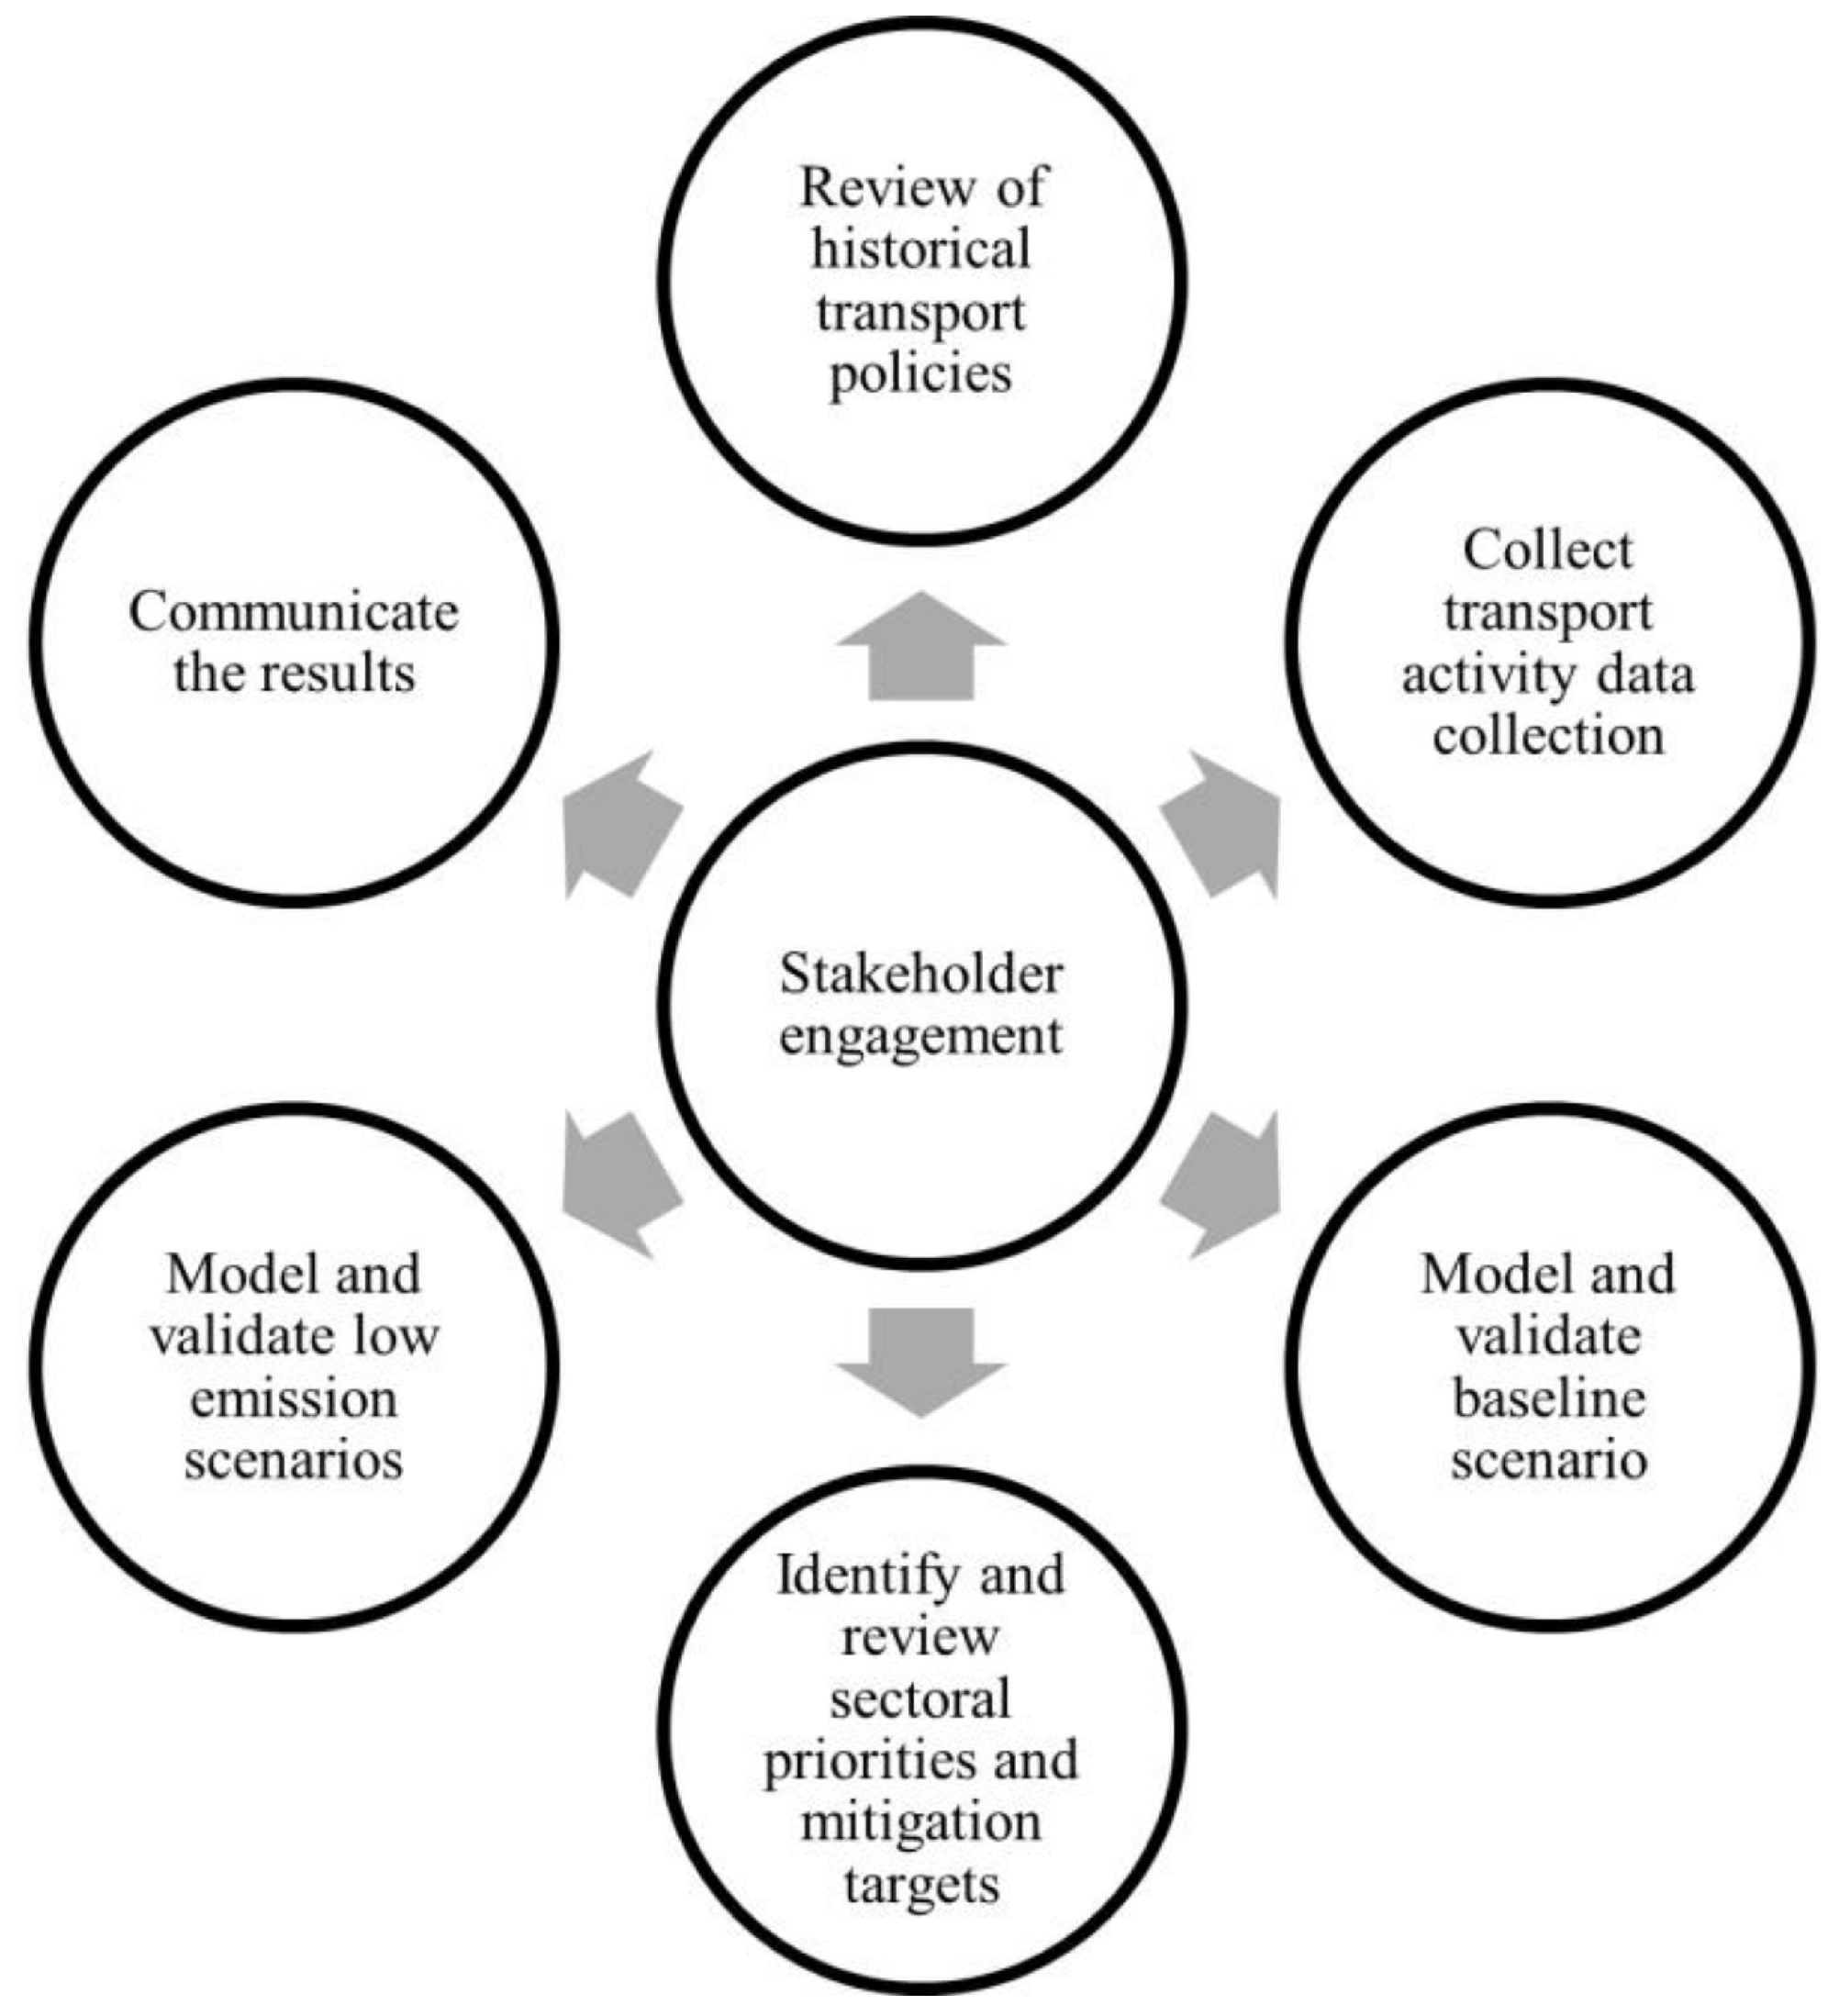
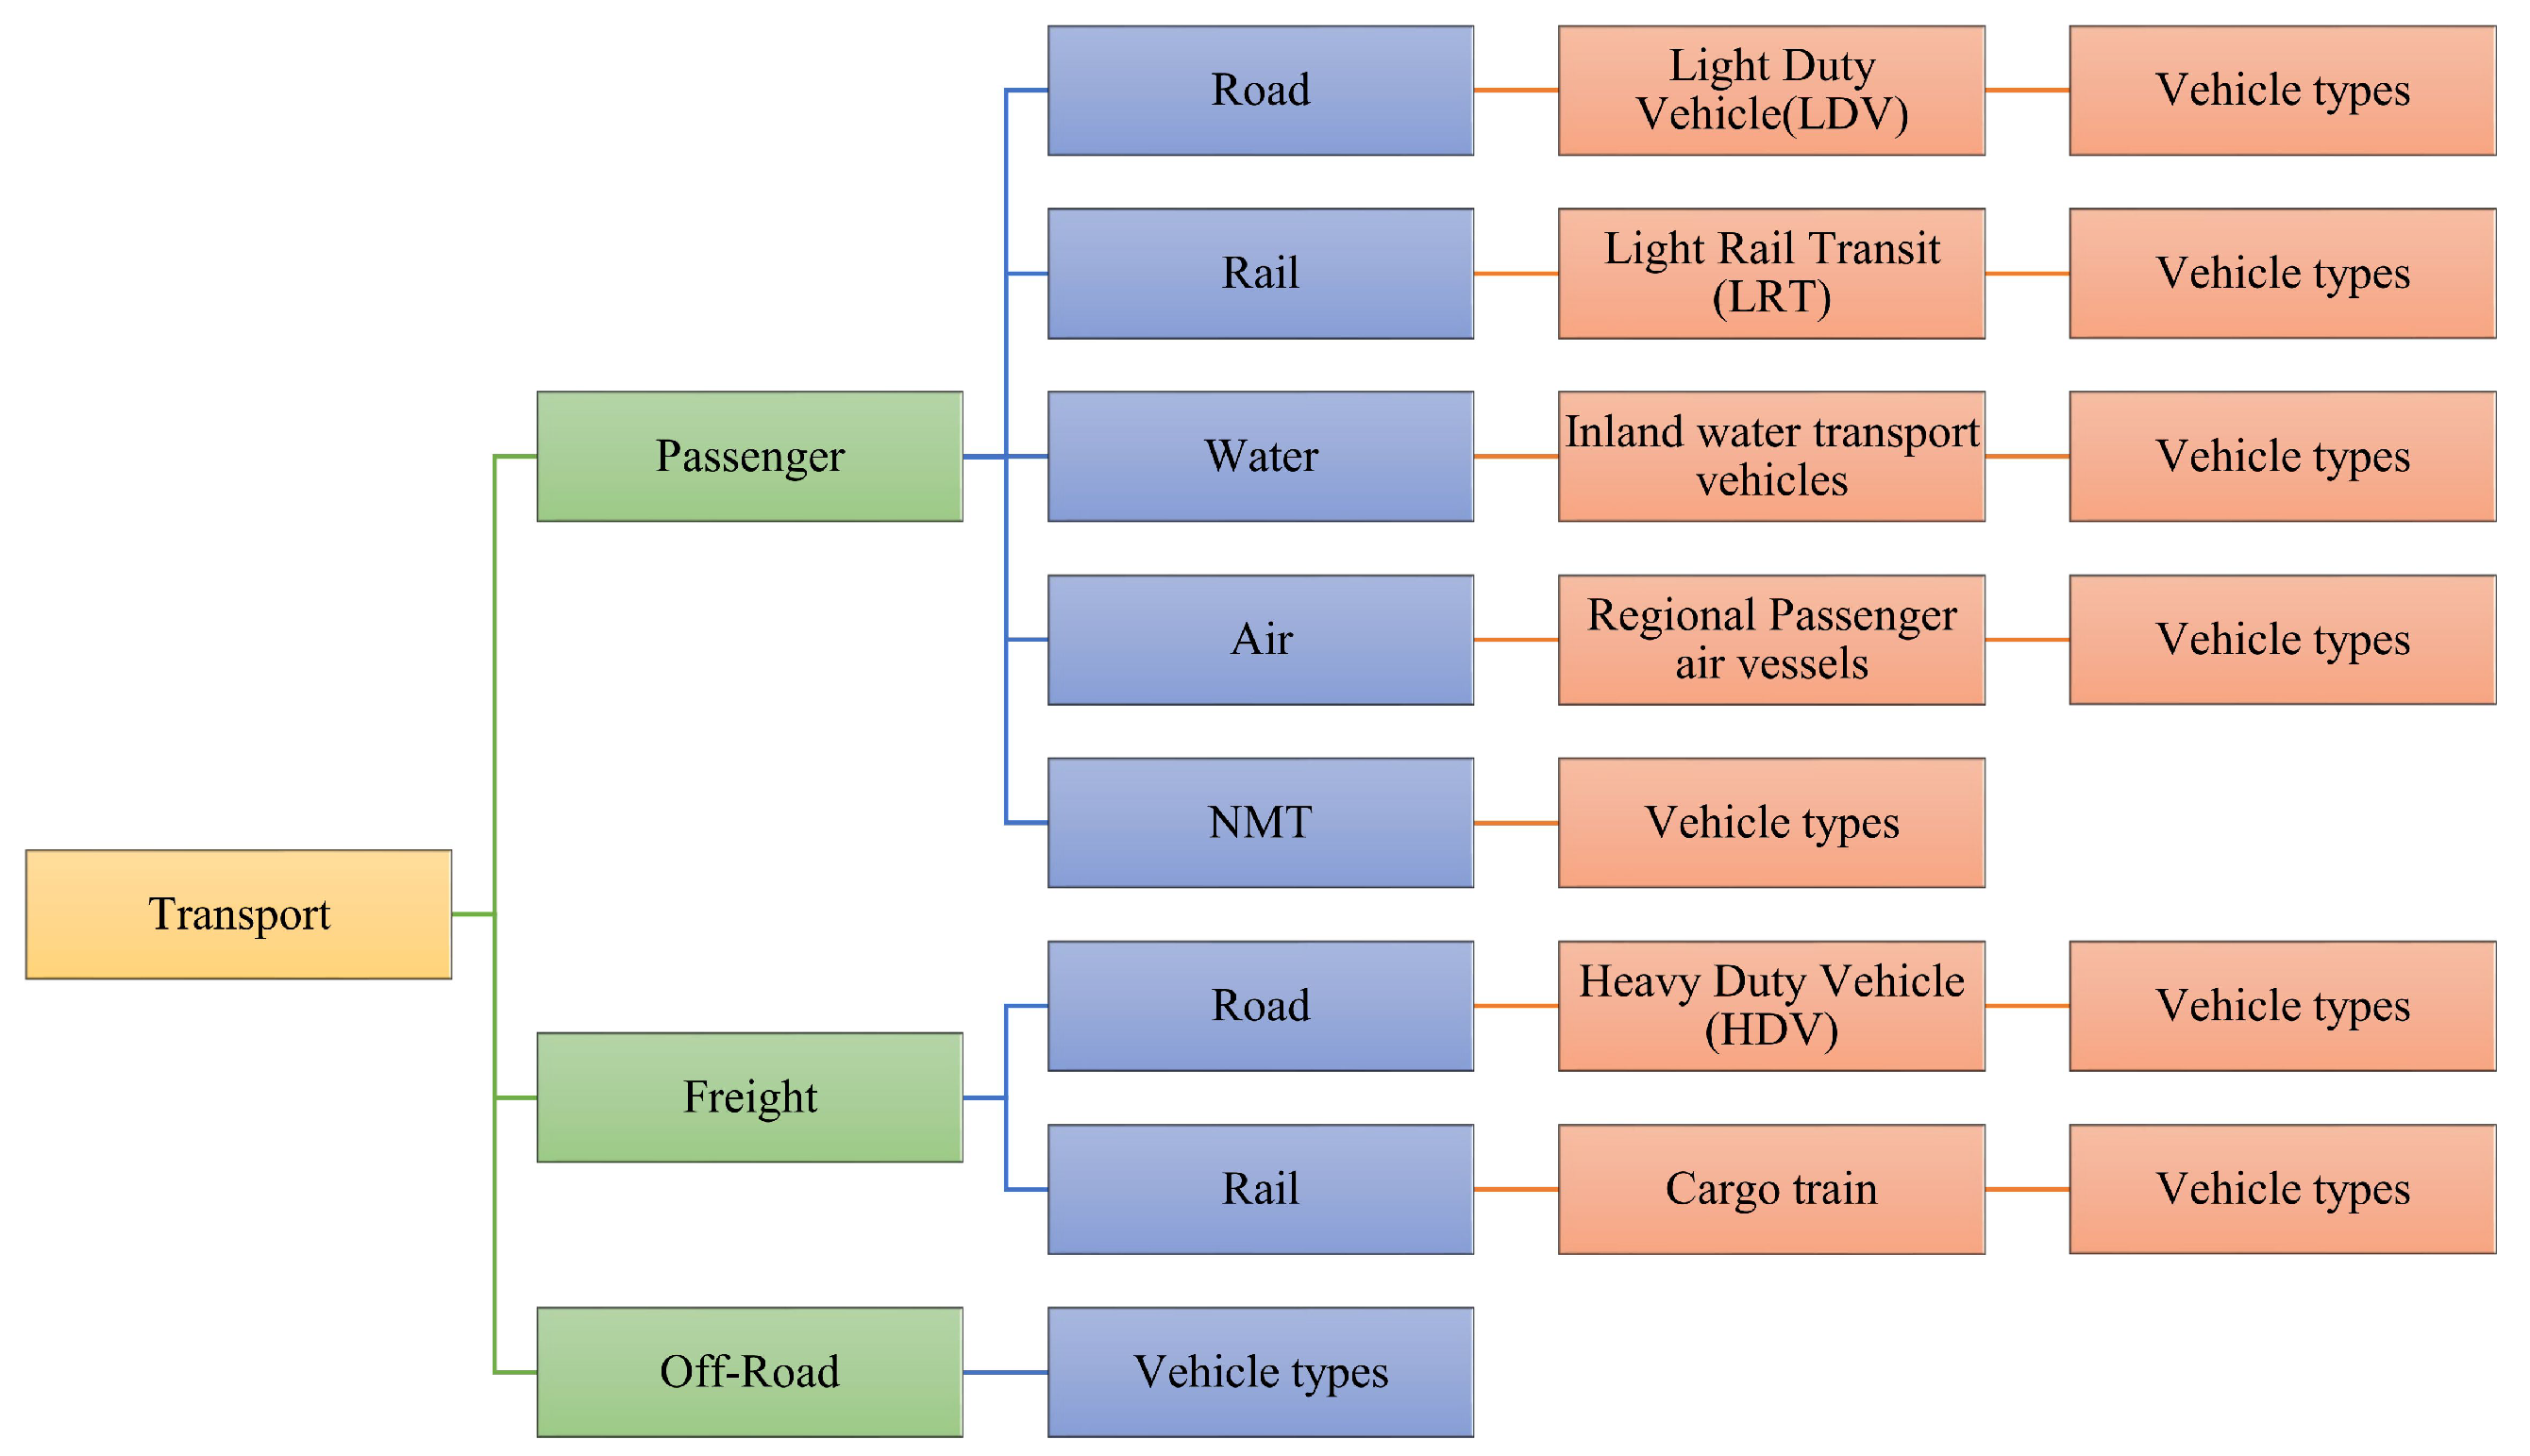
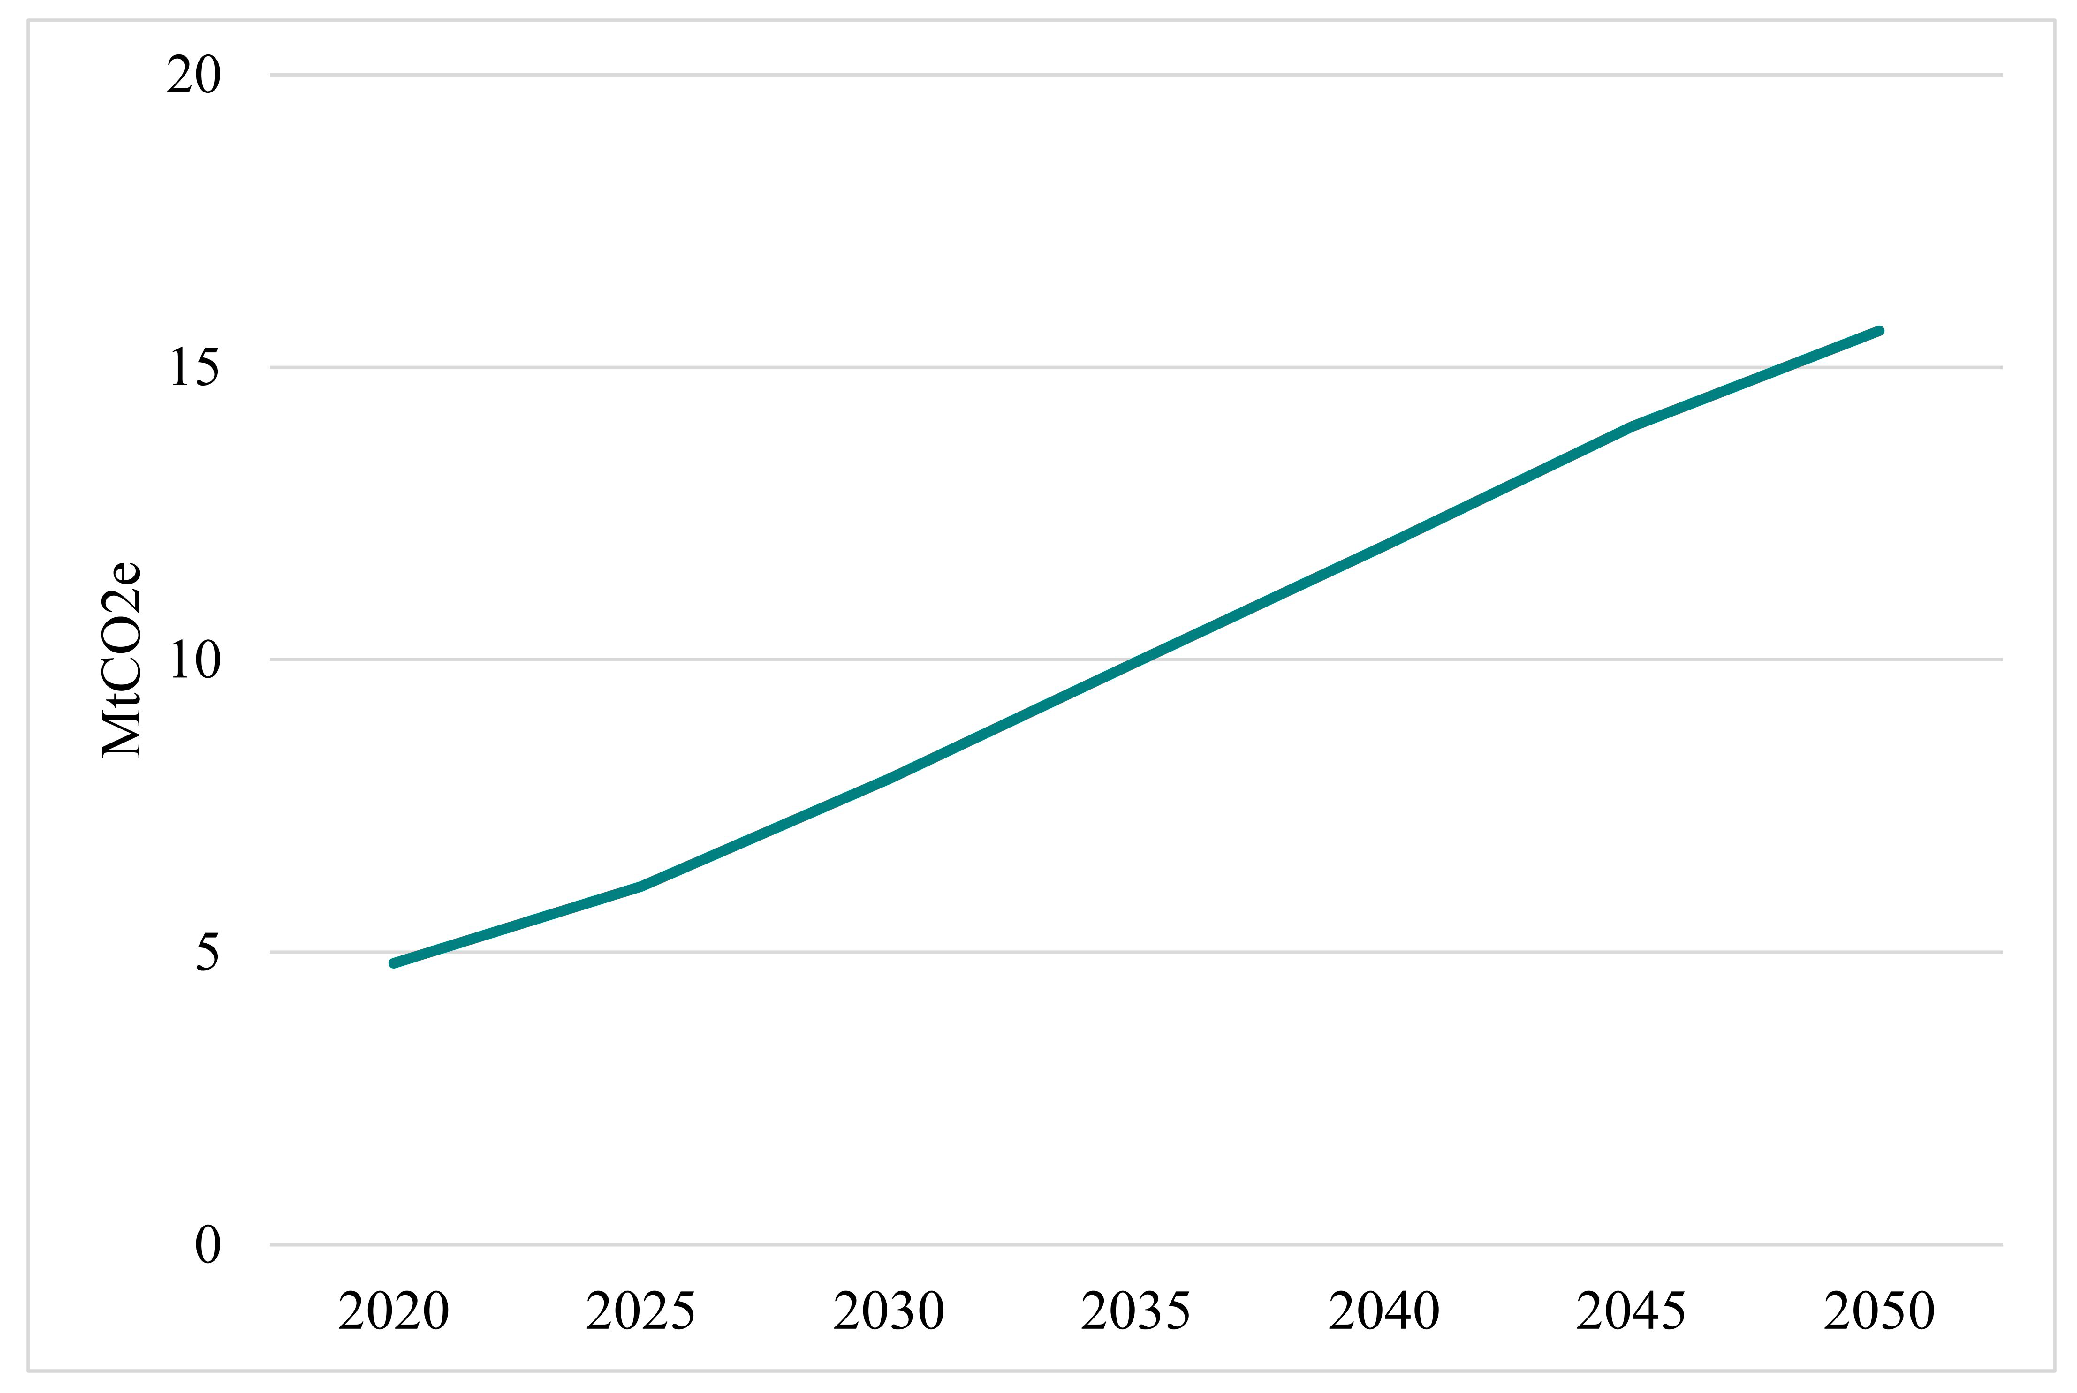
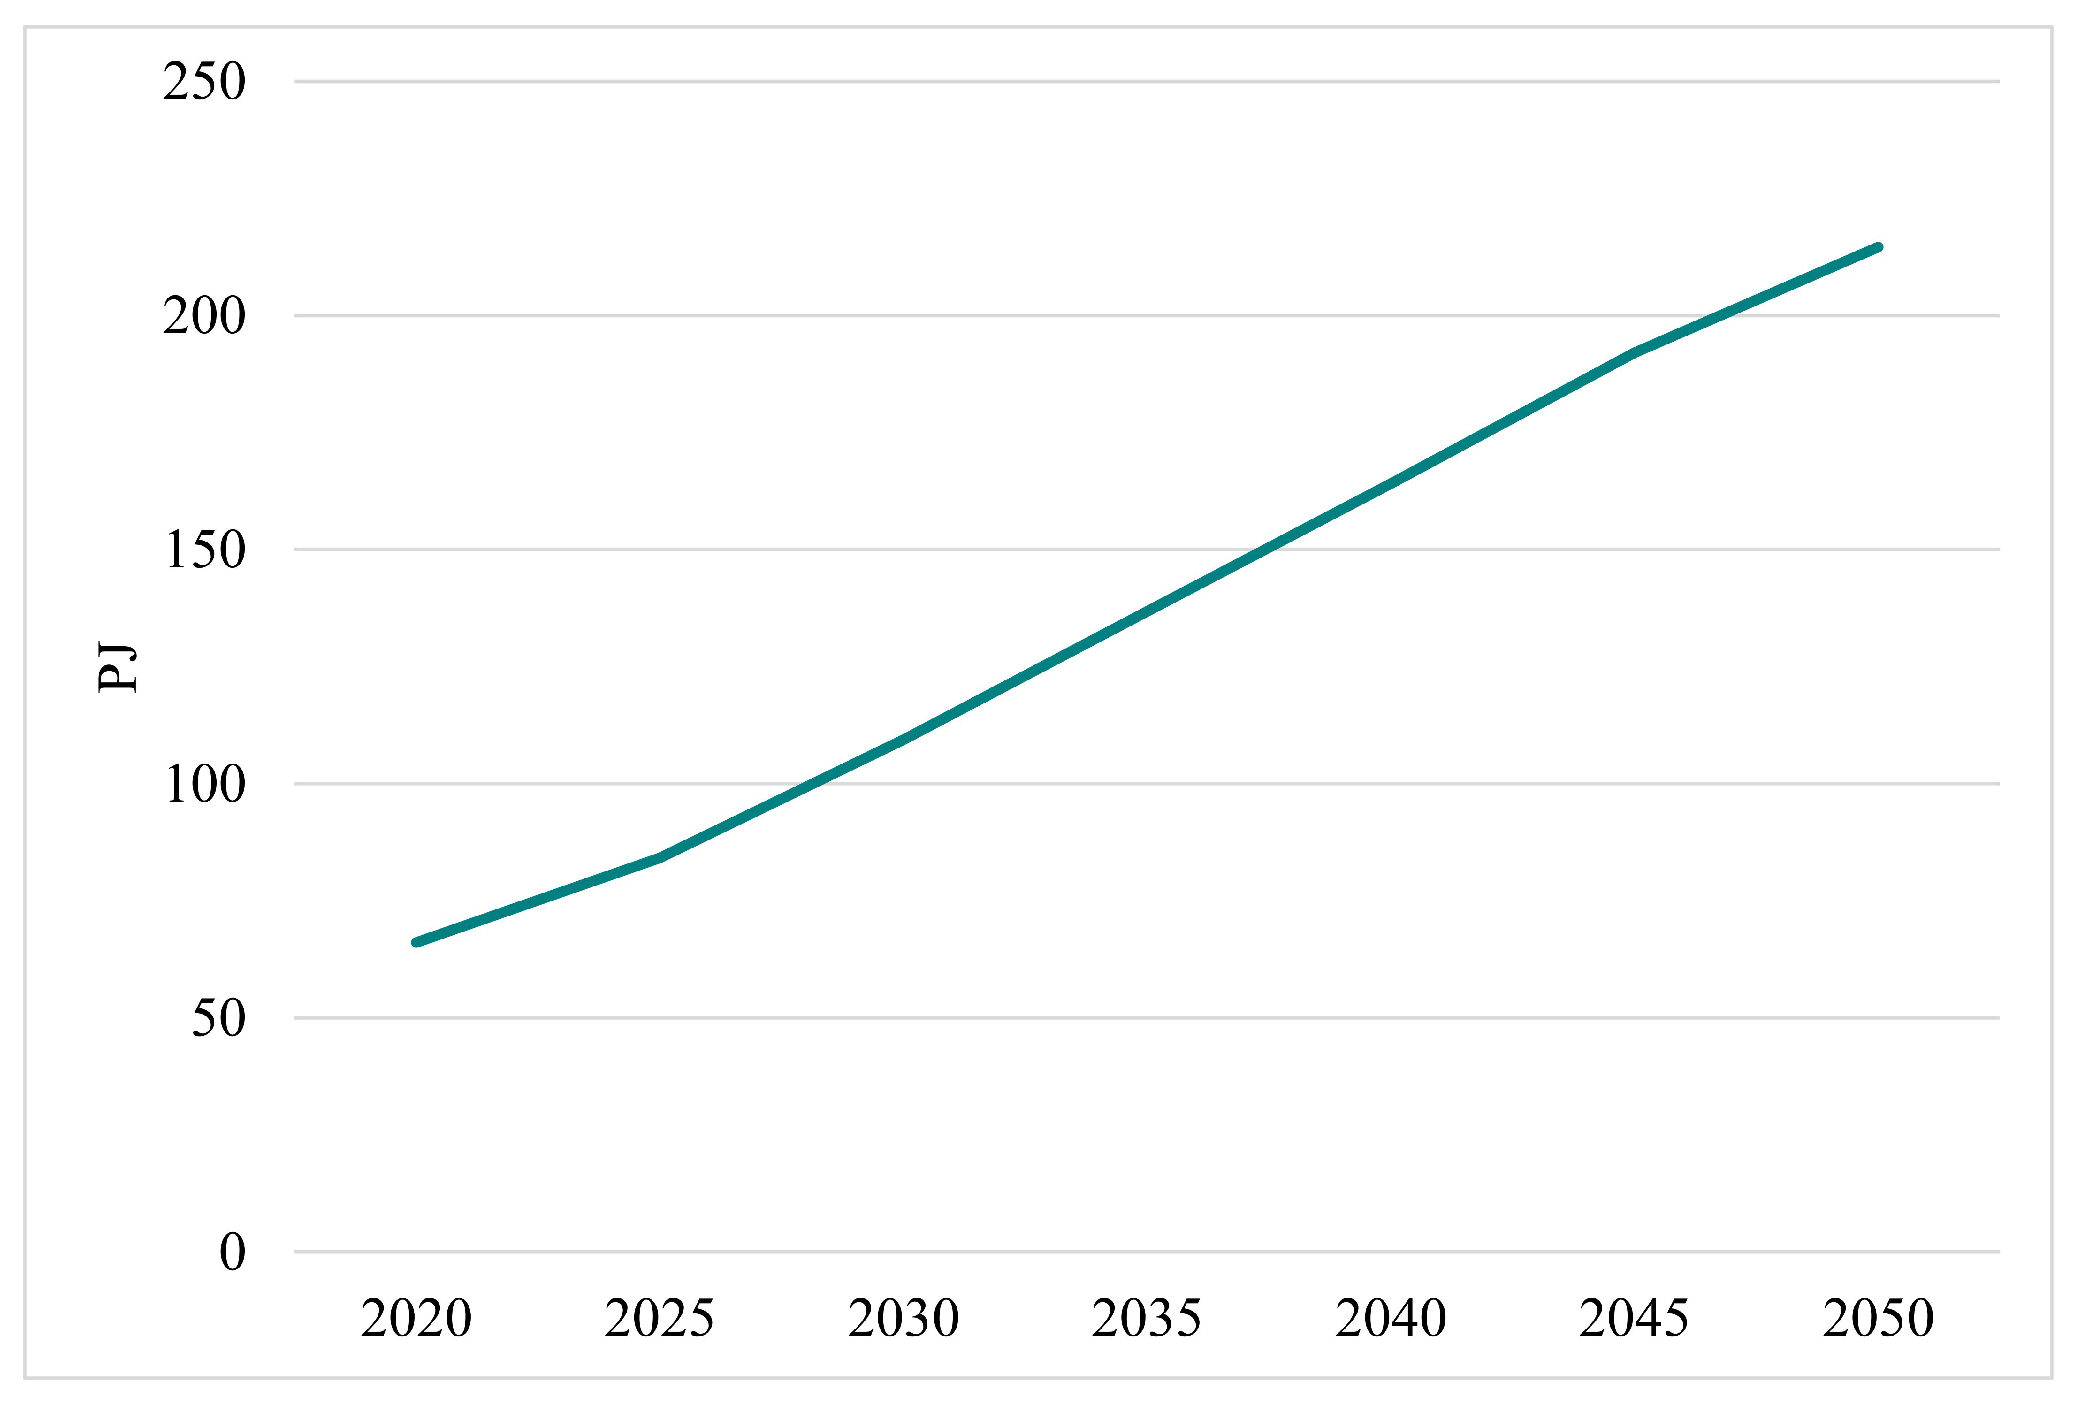
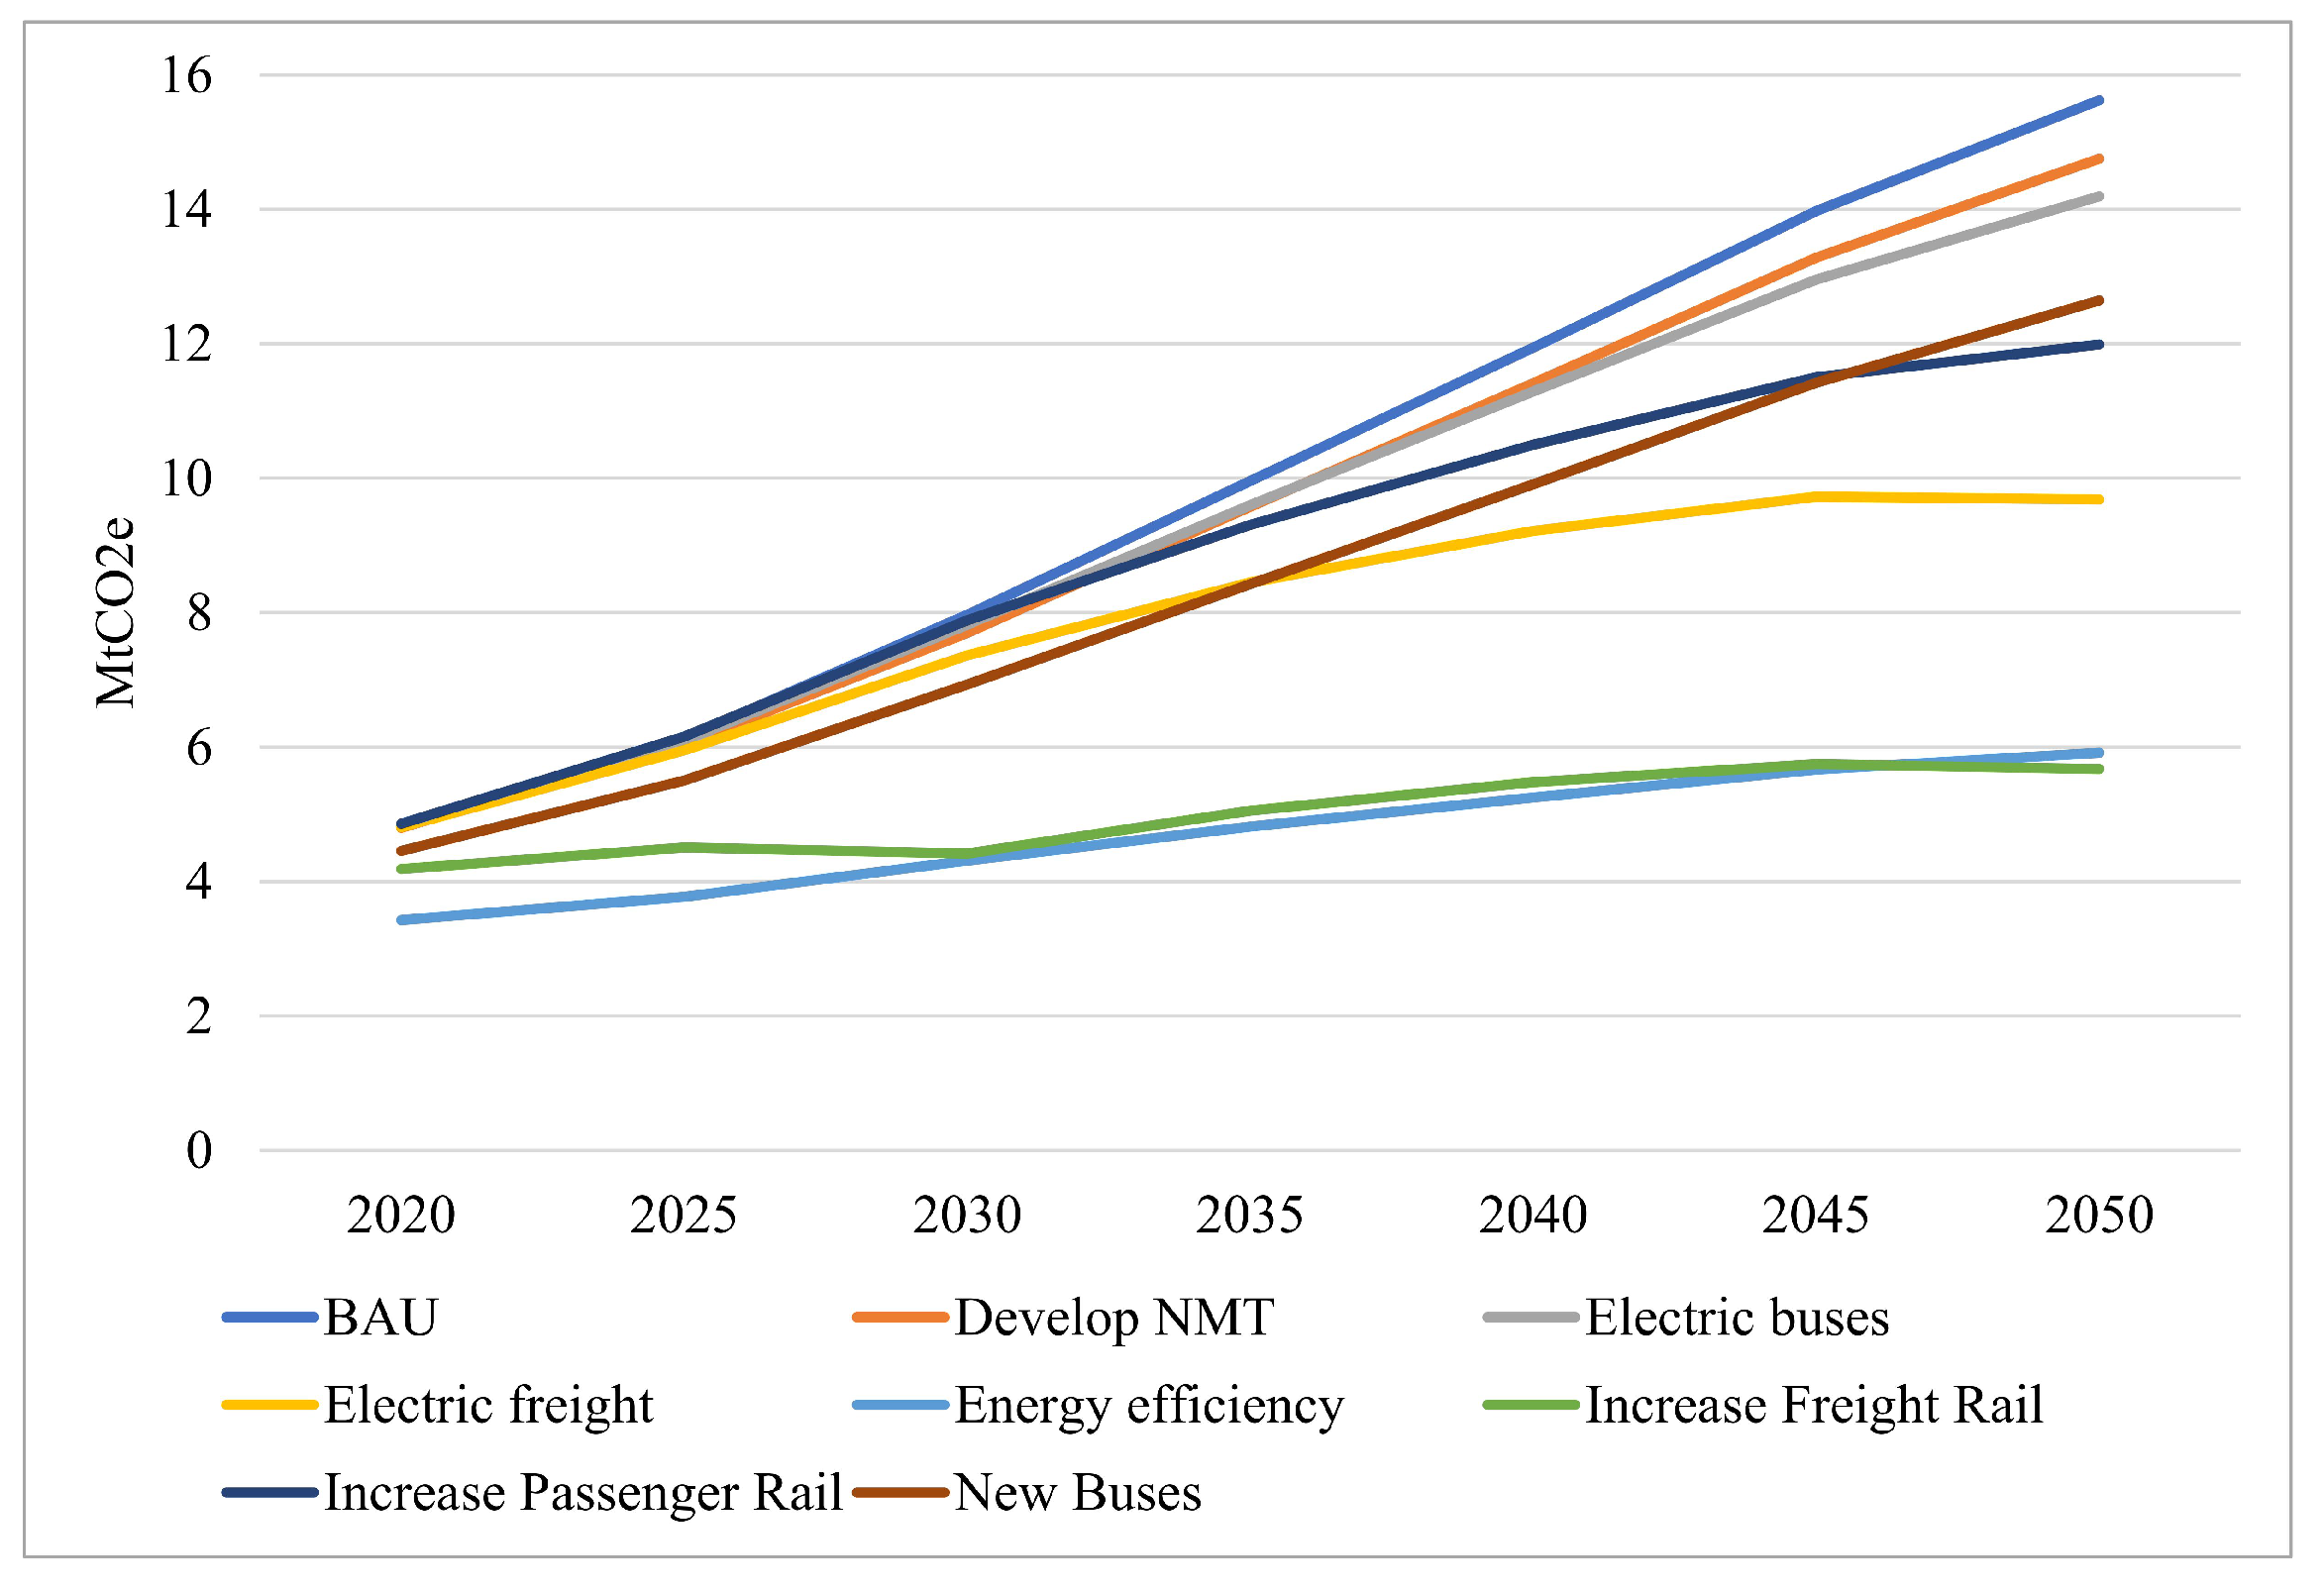
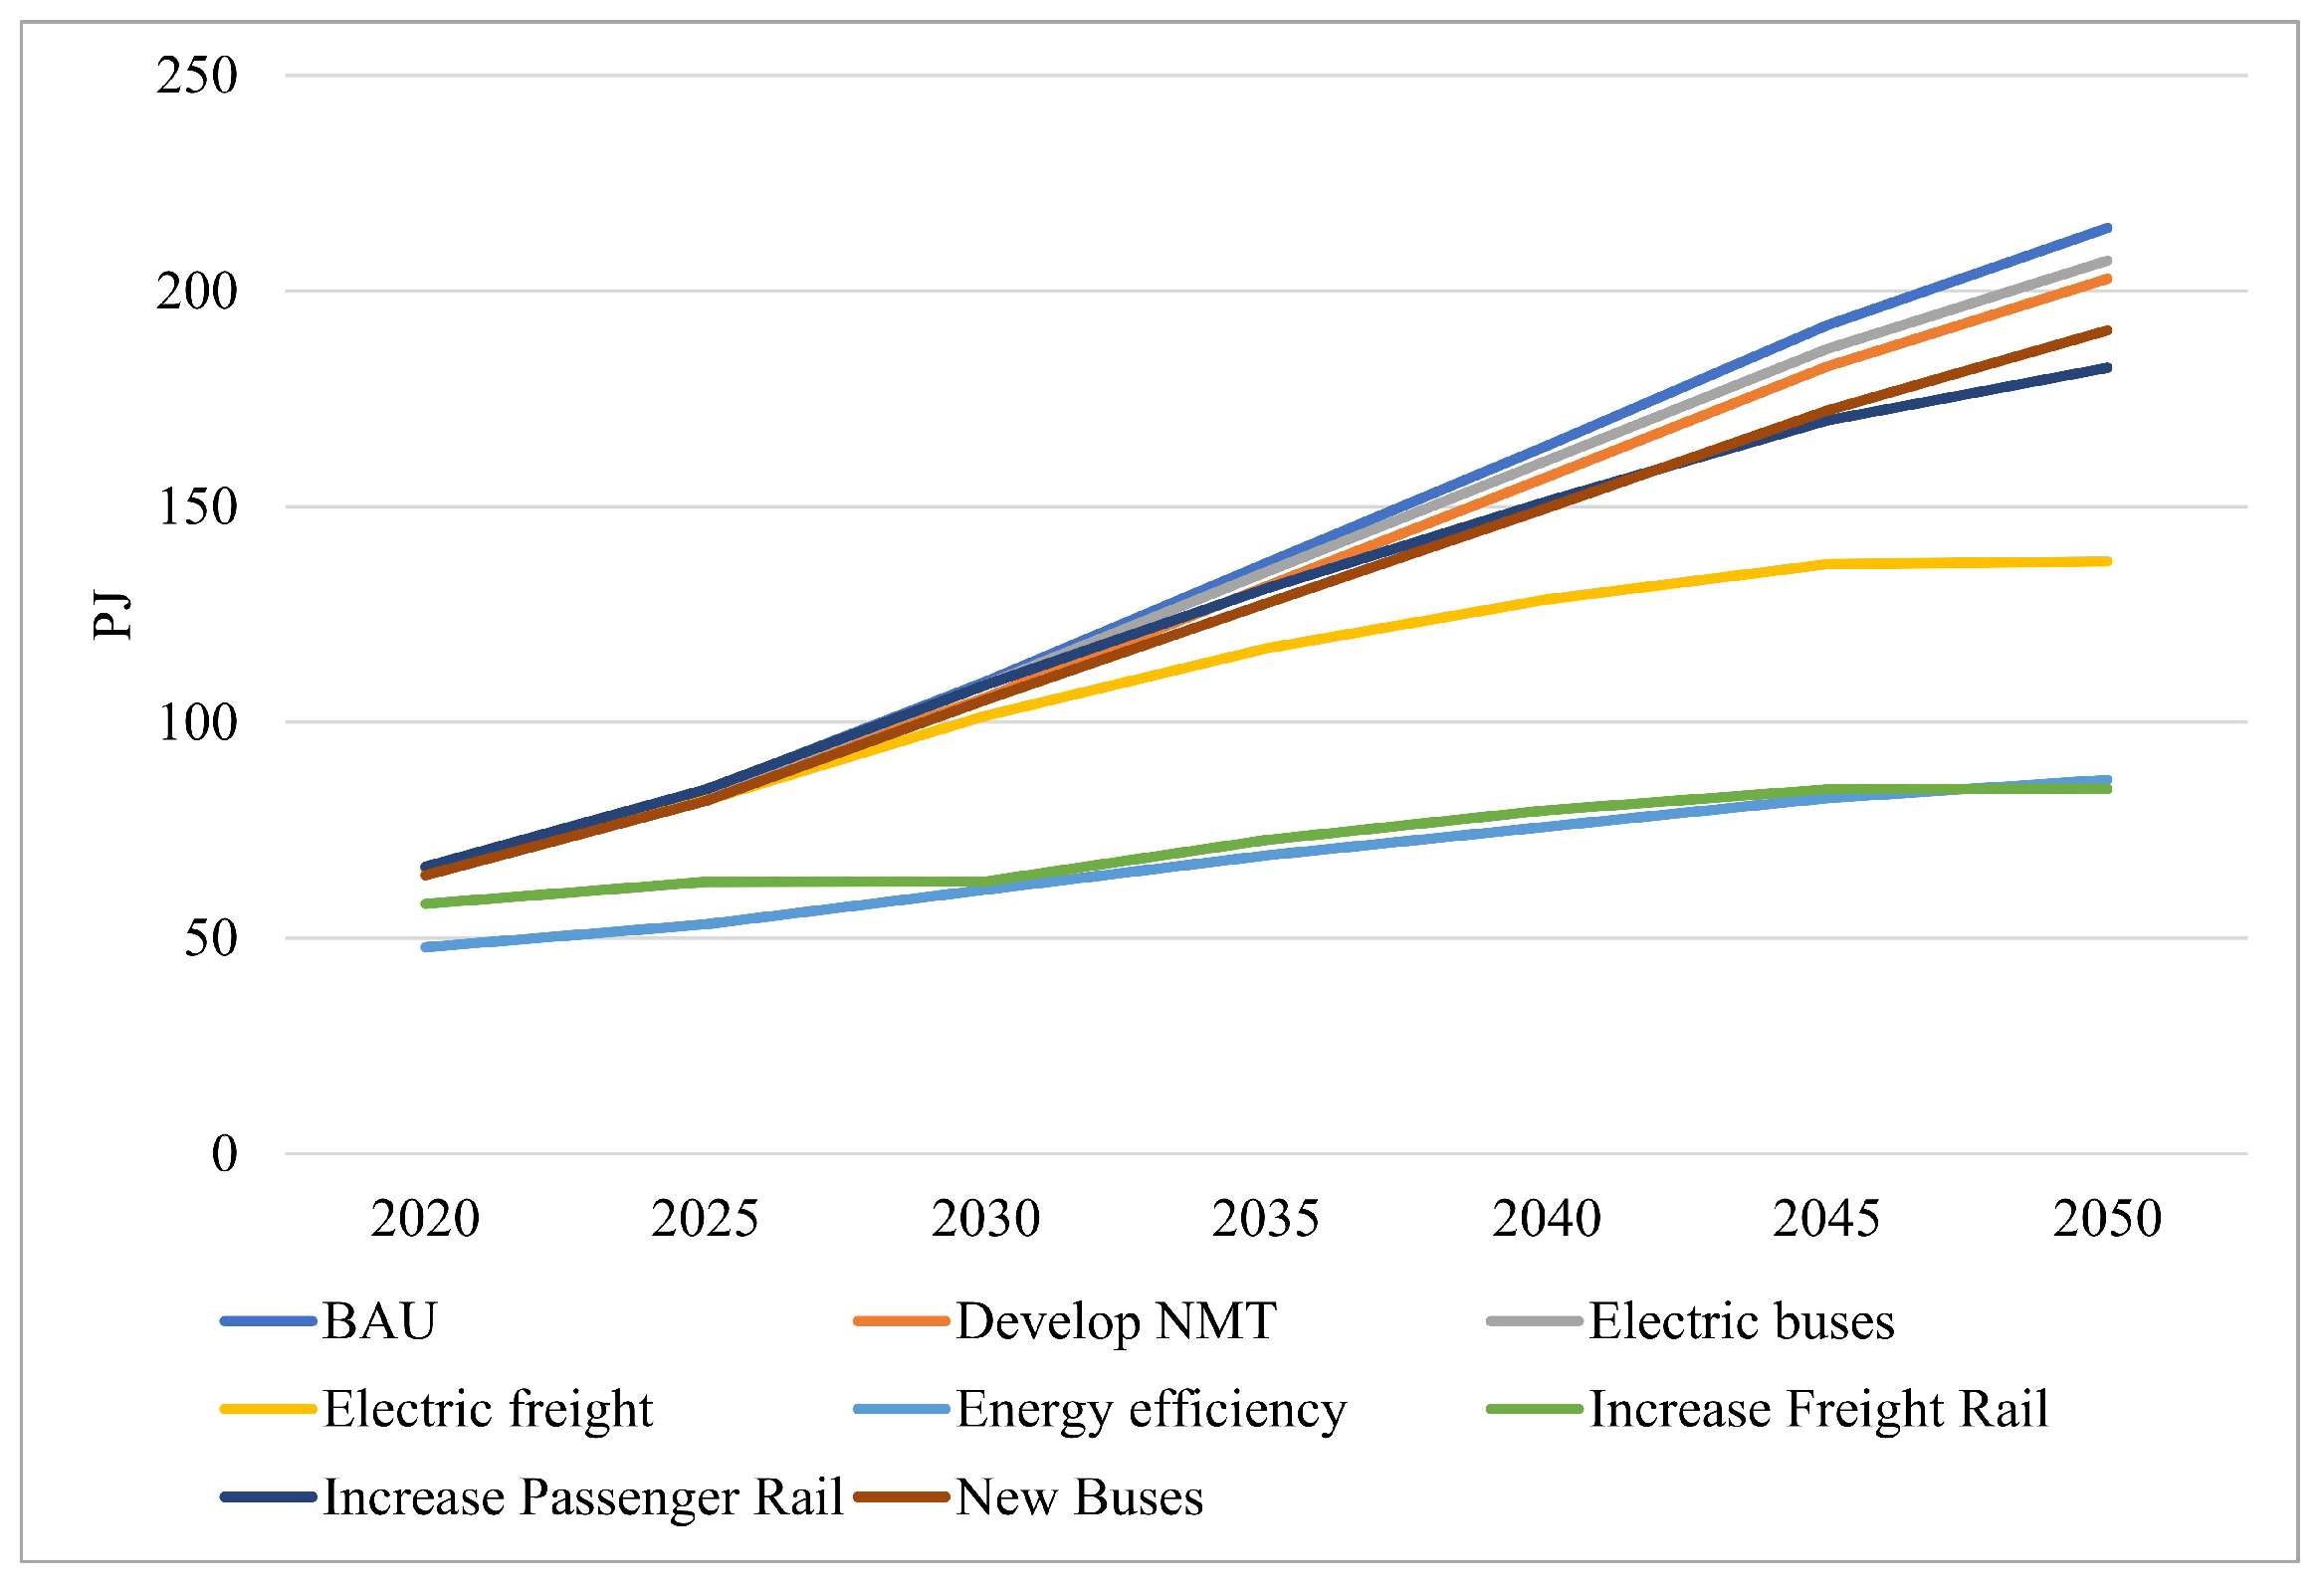

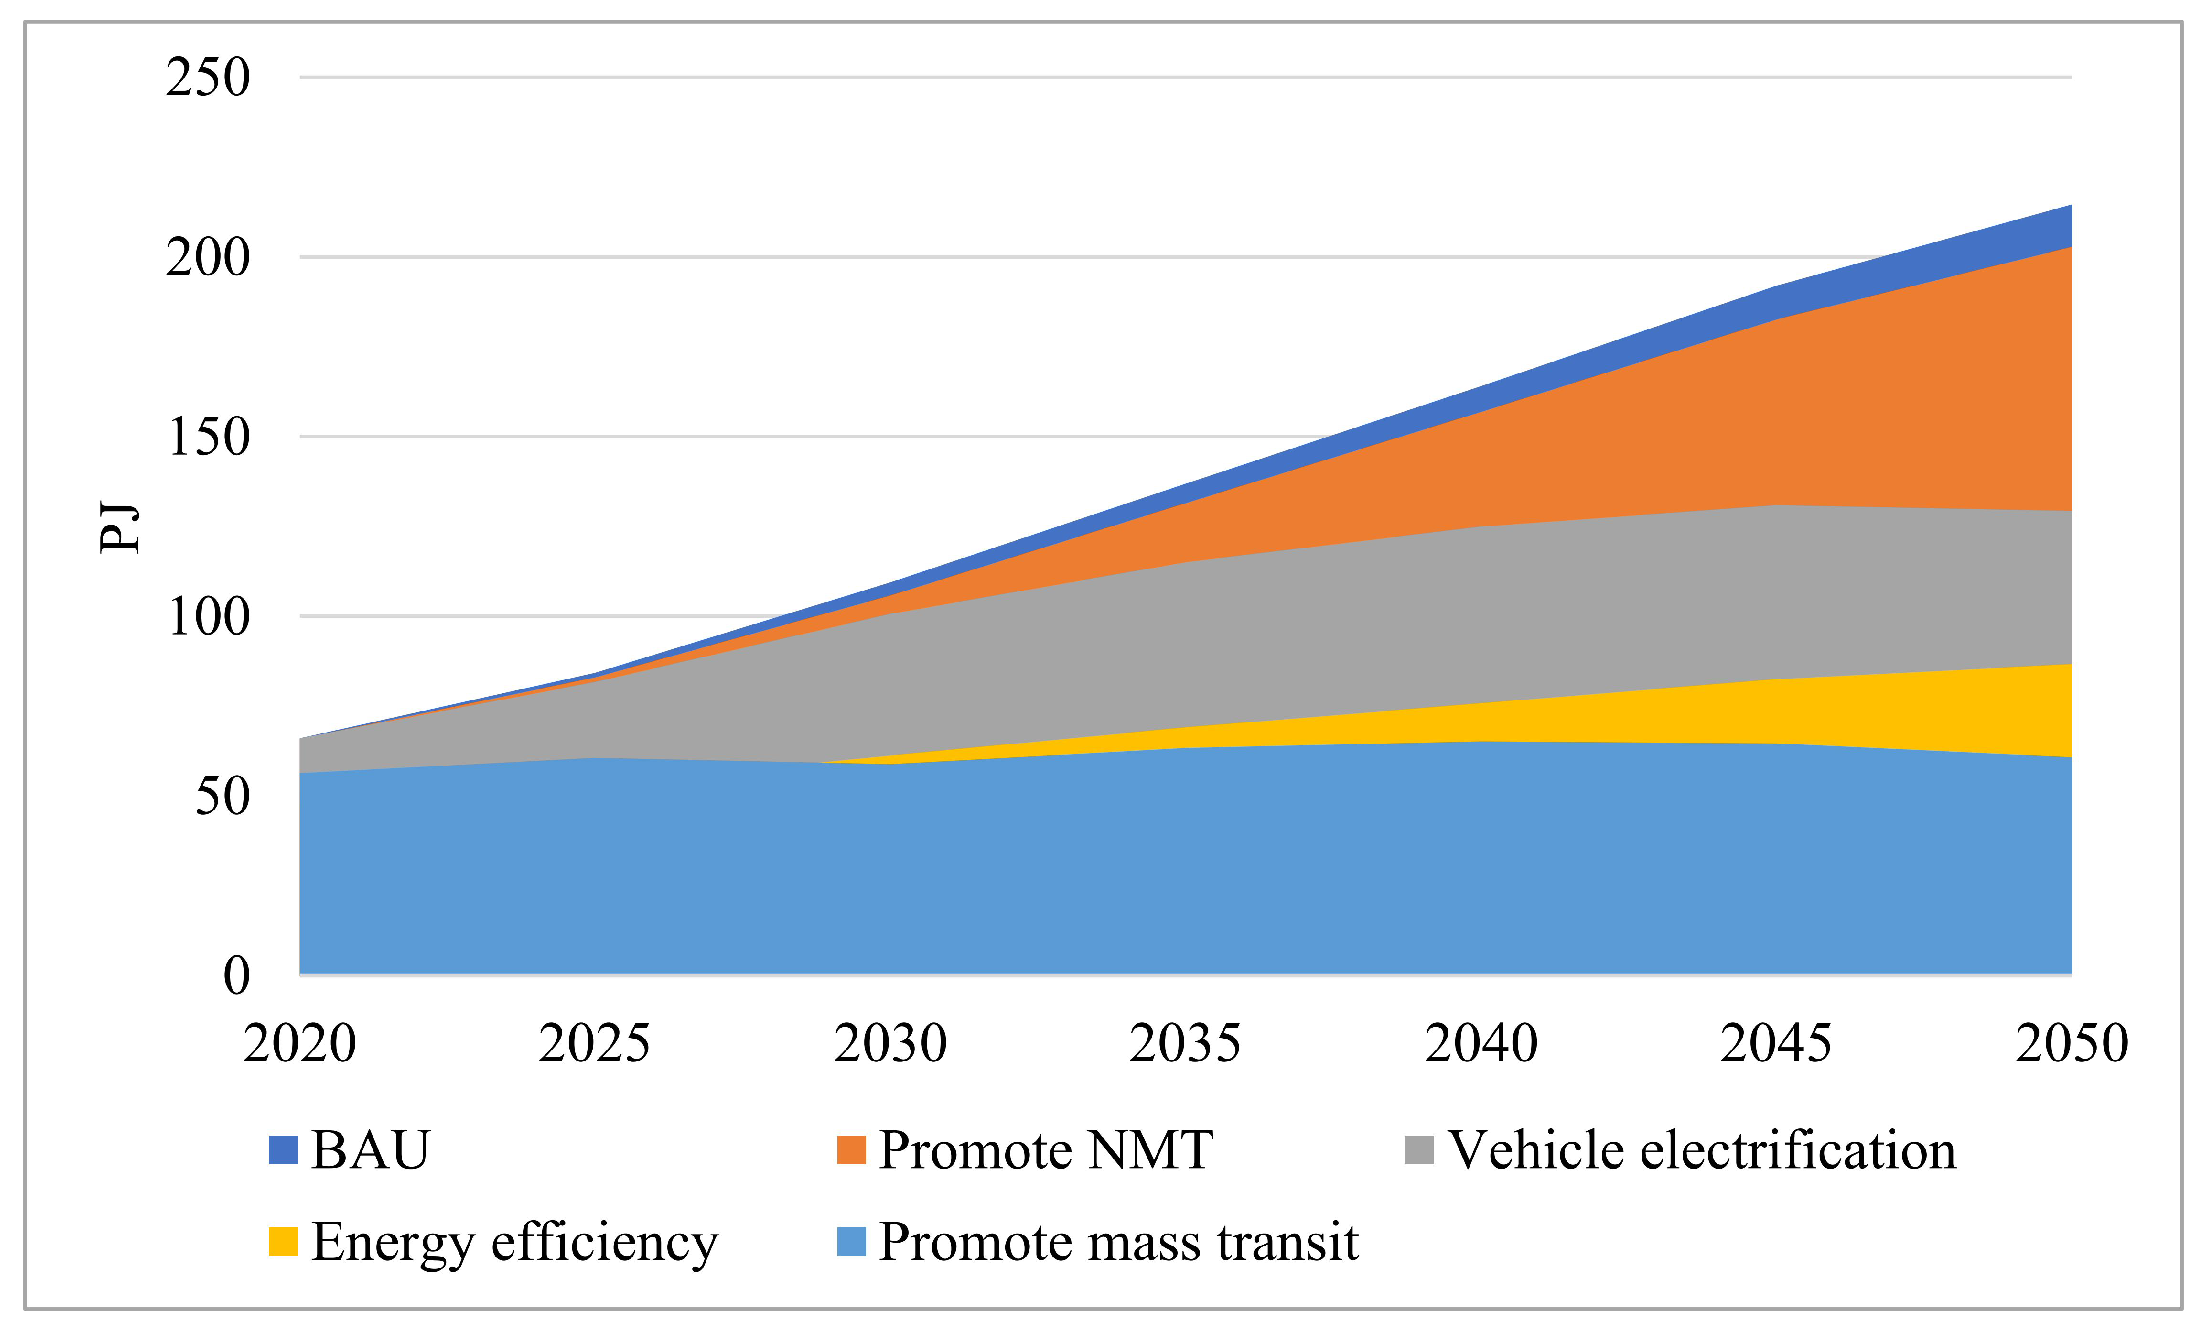


Disclaimer/Publisher’s Note: The statements, opinions and data contained in all publications are solely those of the individual author(s) and contributor(s) and not of MDPI and/or the editor(s). MDPI and/or the editor(s) disclaim responsibility for any injury to people or property resulting from any ideas, methods, instructions or products referred to in the content. |
© 2025 by the authors. Licensee MDPI, Basel, Switzerland. This article is an open access article distributed under the terms and conditions of the Creative Commons Attribution (CC BY) license (https://creativecommons.org/licenses/by/4.0/).