Improving Daily CMIP6 Precipitation in Southern Africa Through Bias Correction—Part 1: Spatiotemporal Characteristics


Abstract
1. Introduction
2. Study Area, Data, and Methods
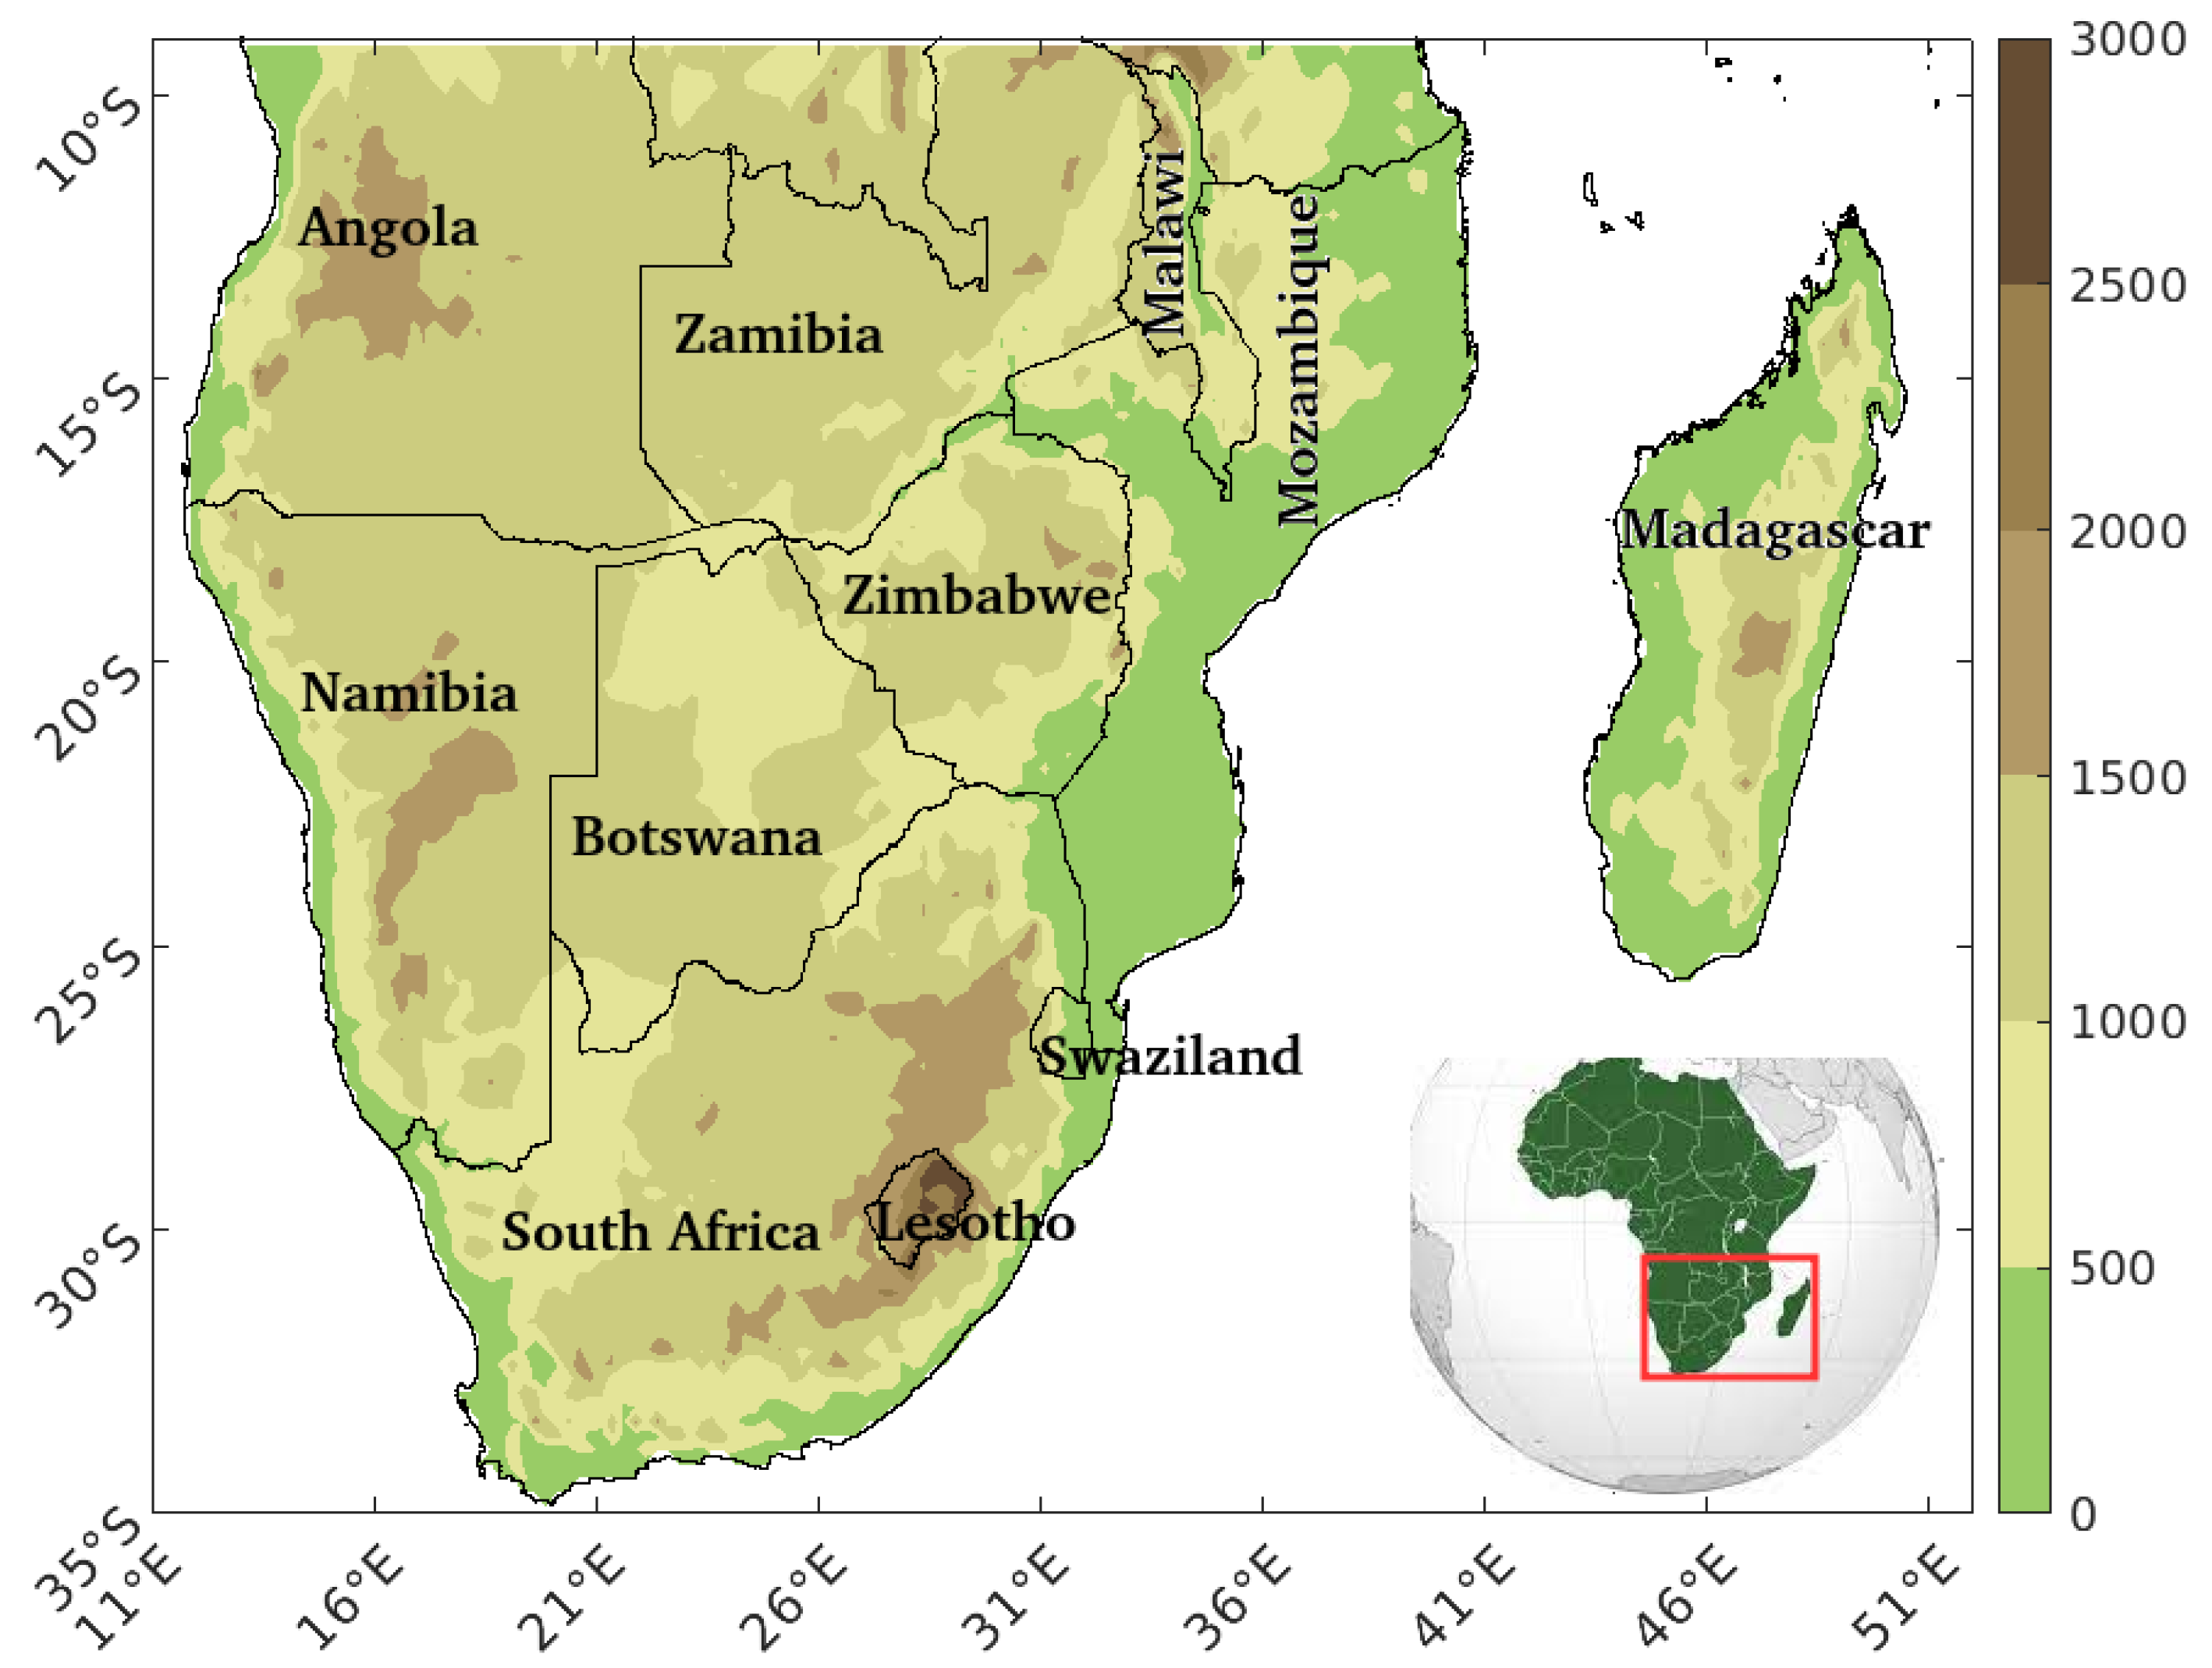
2.1. The Study Area
2.2. Data
2.2.1. Observational Data
2.2.2. Cmip6 Climate Models
2.3. Methods
2.3.1. Bias Correction
Quantile Distribution Mapping
Scaled Distribution Mapping (SDM)
2.3.2. Performance Evaluation Statistical Metrics
3. Results and Discussion
3.1. The Kolmogorov–Smirnov (K–S) Goodness-of-Fit Test
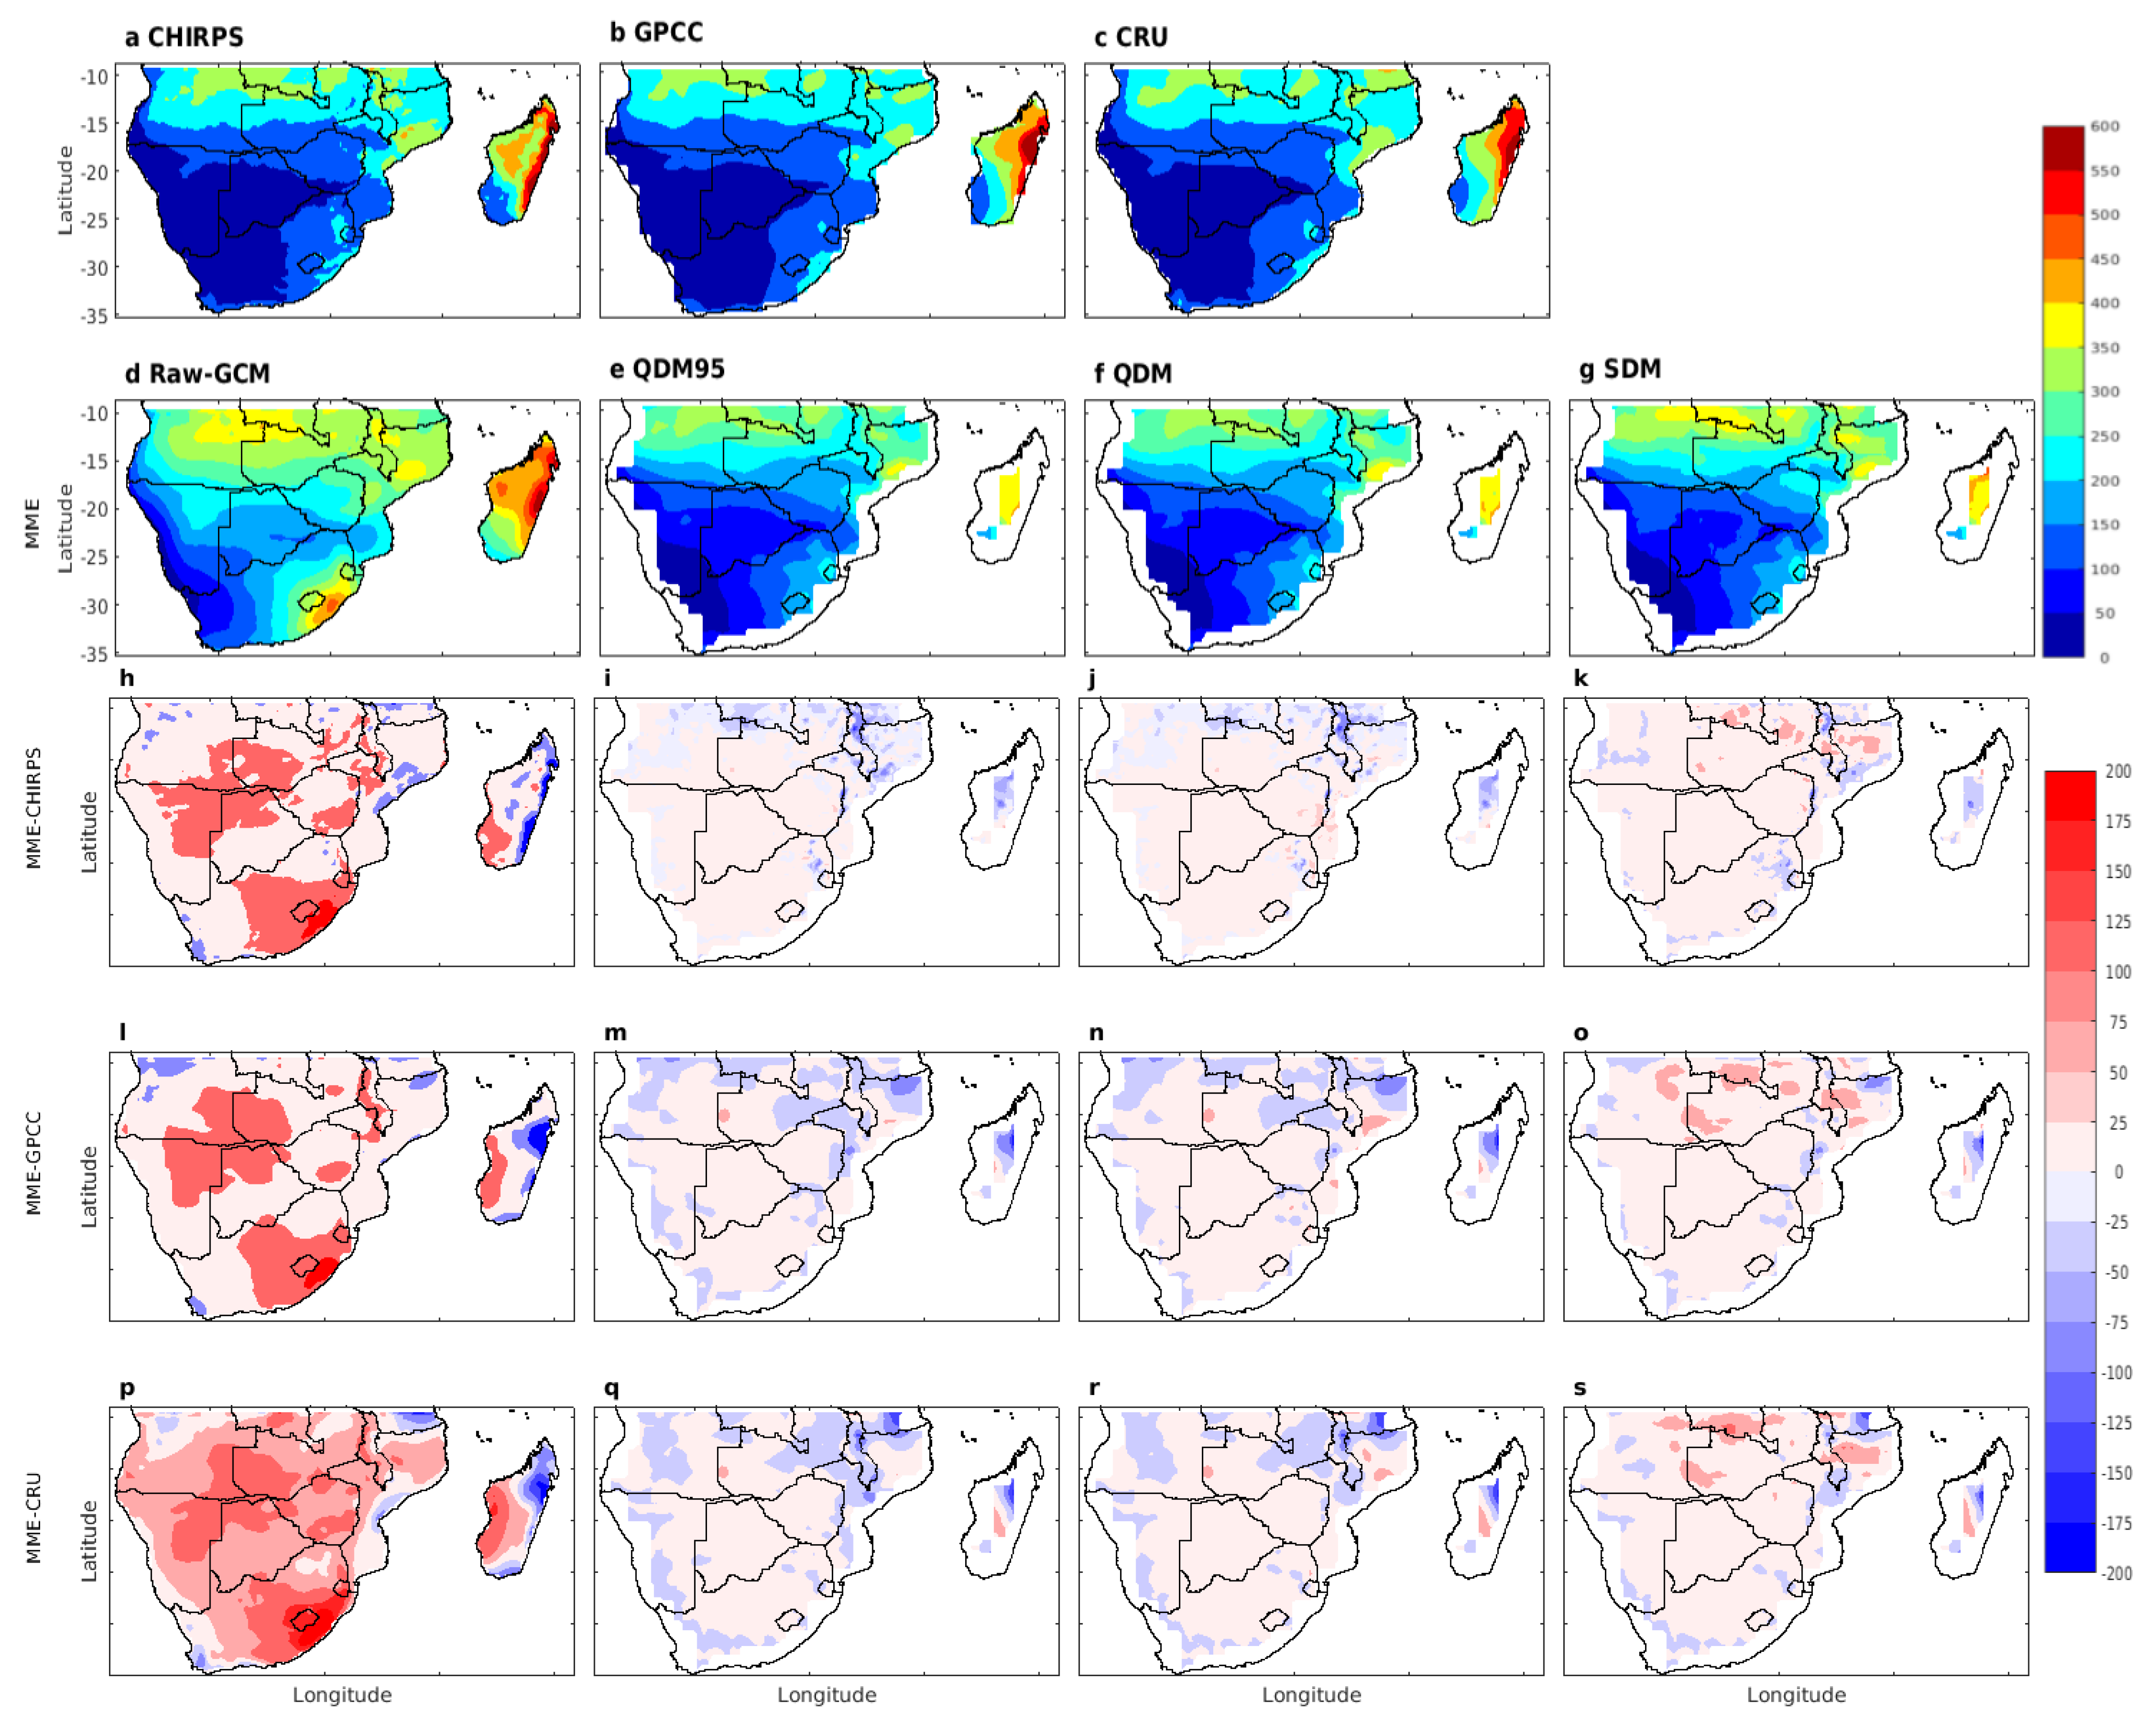
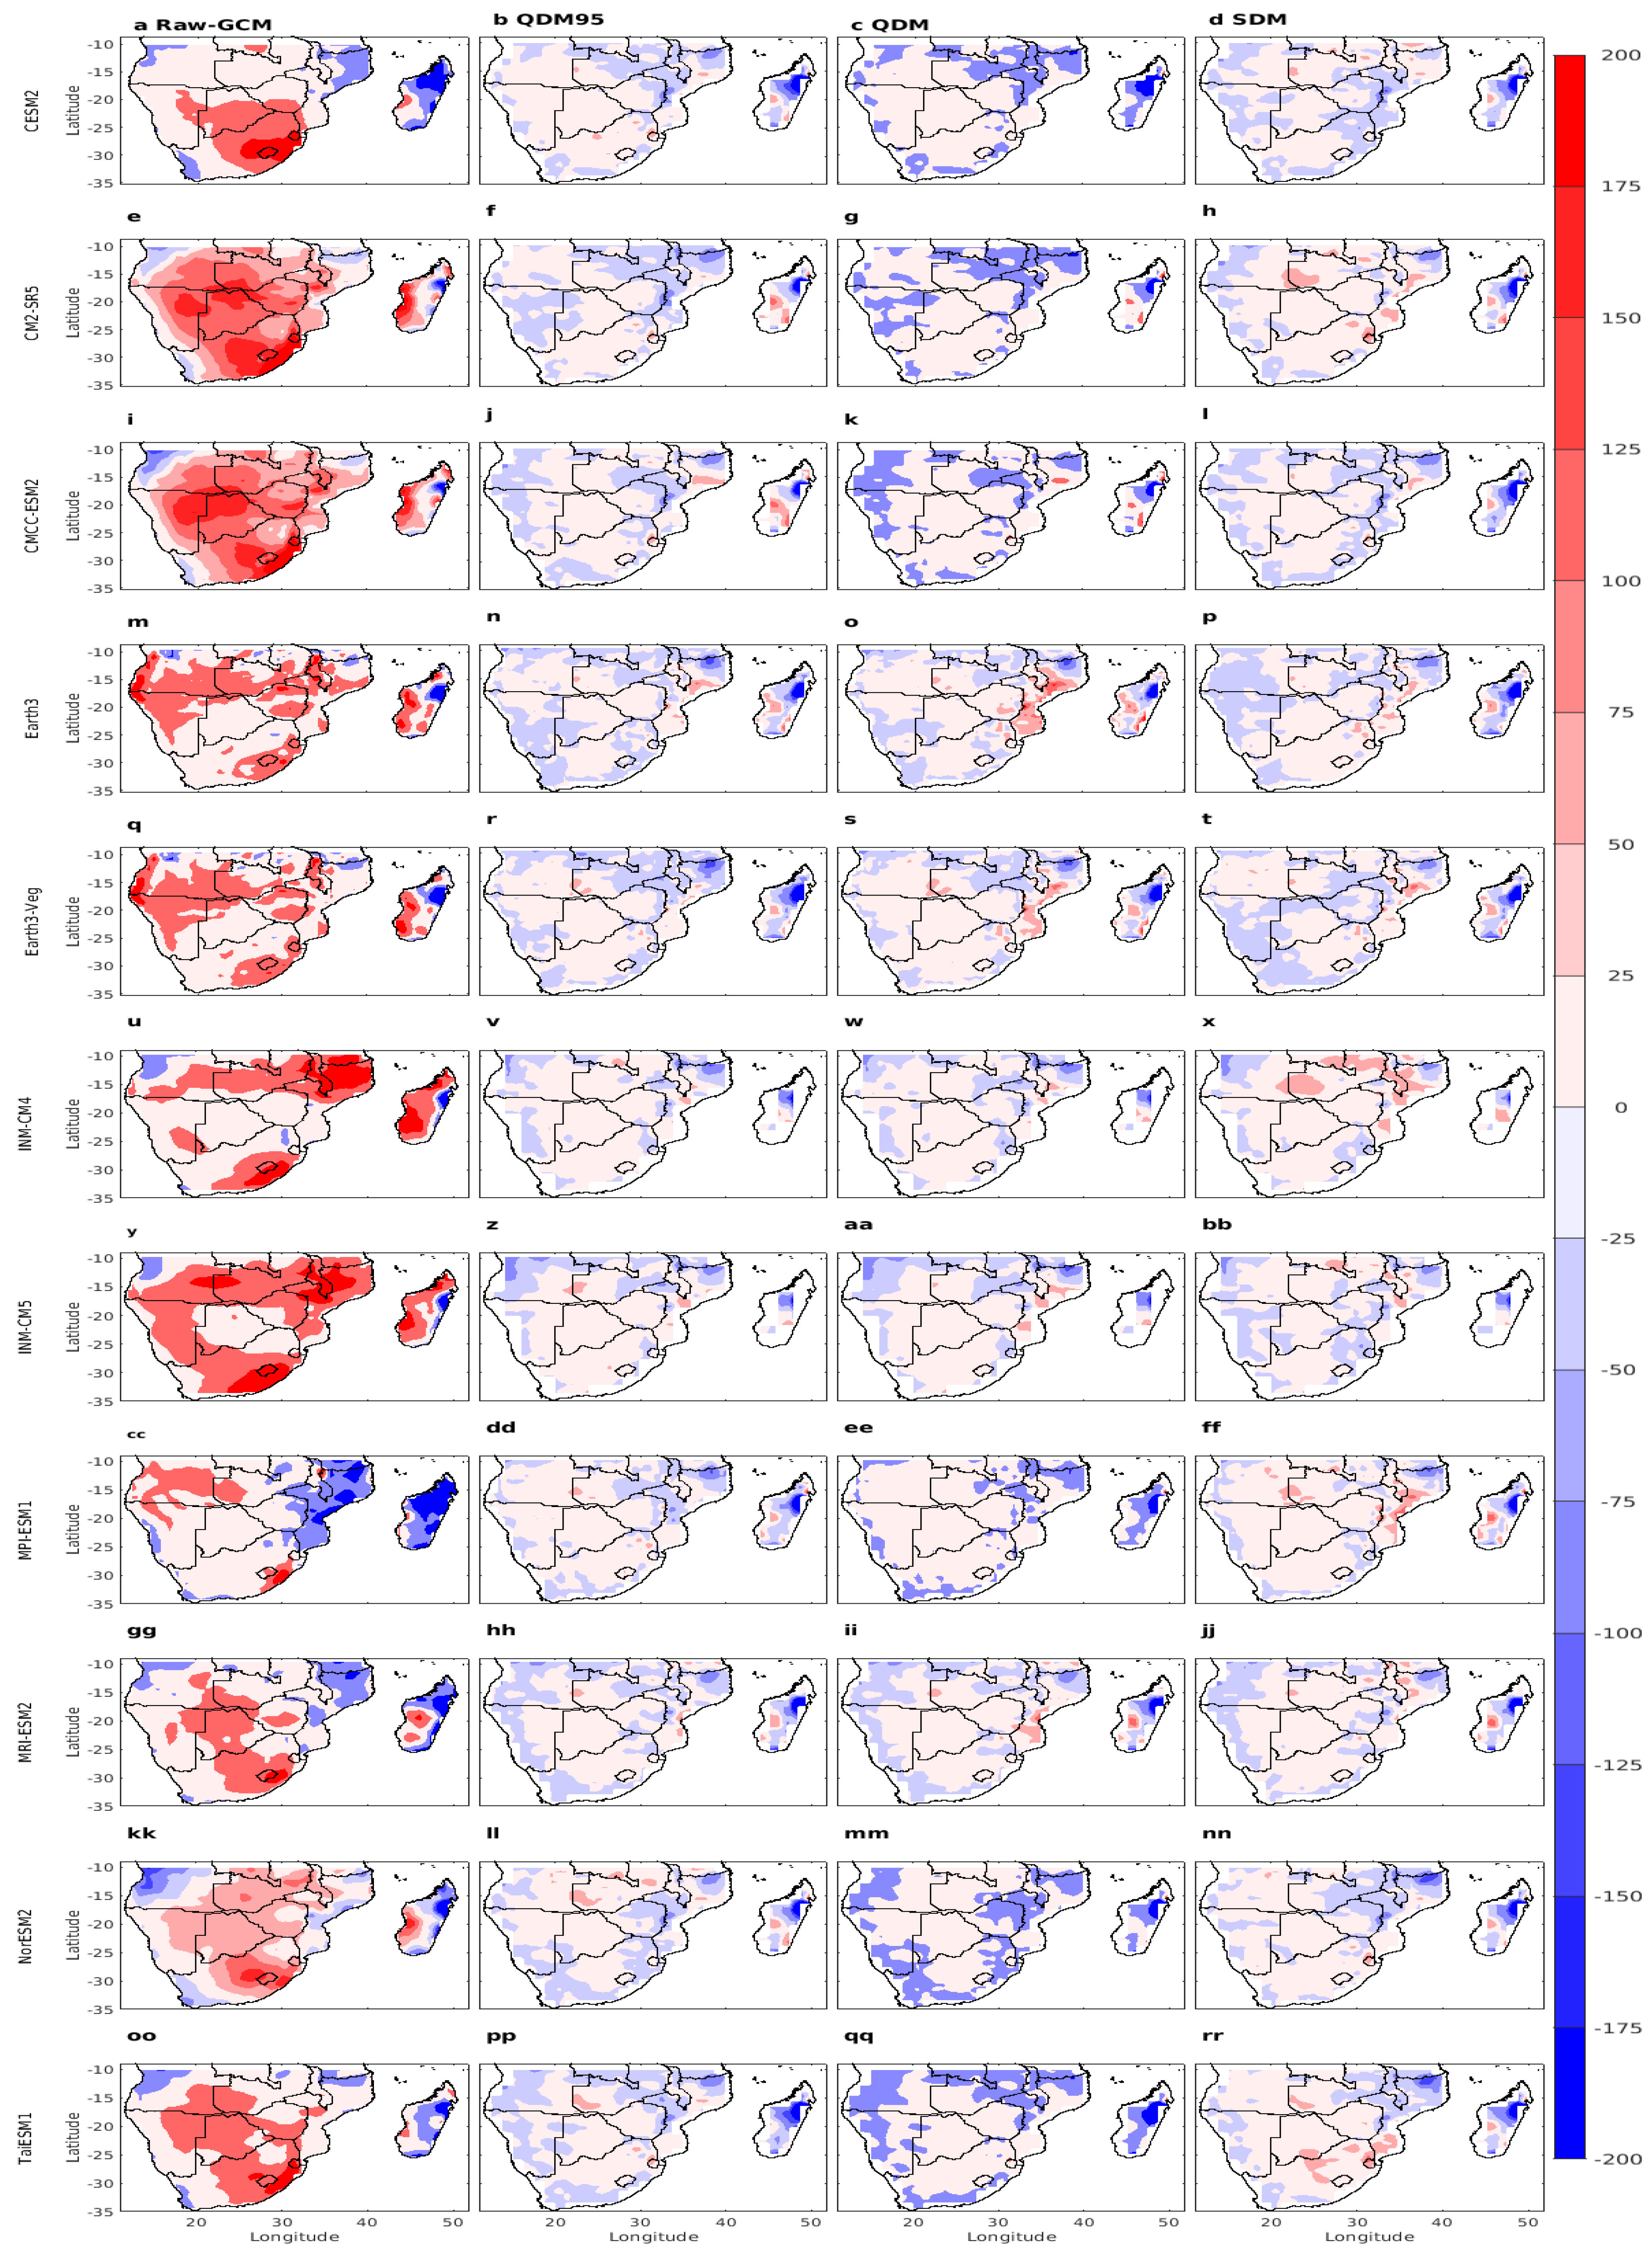
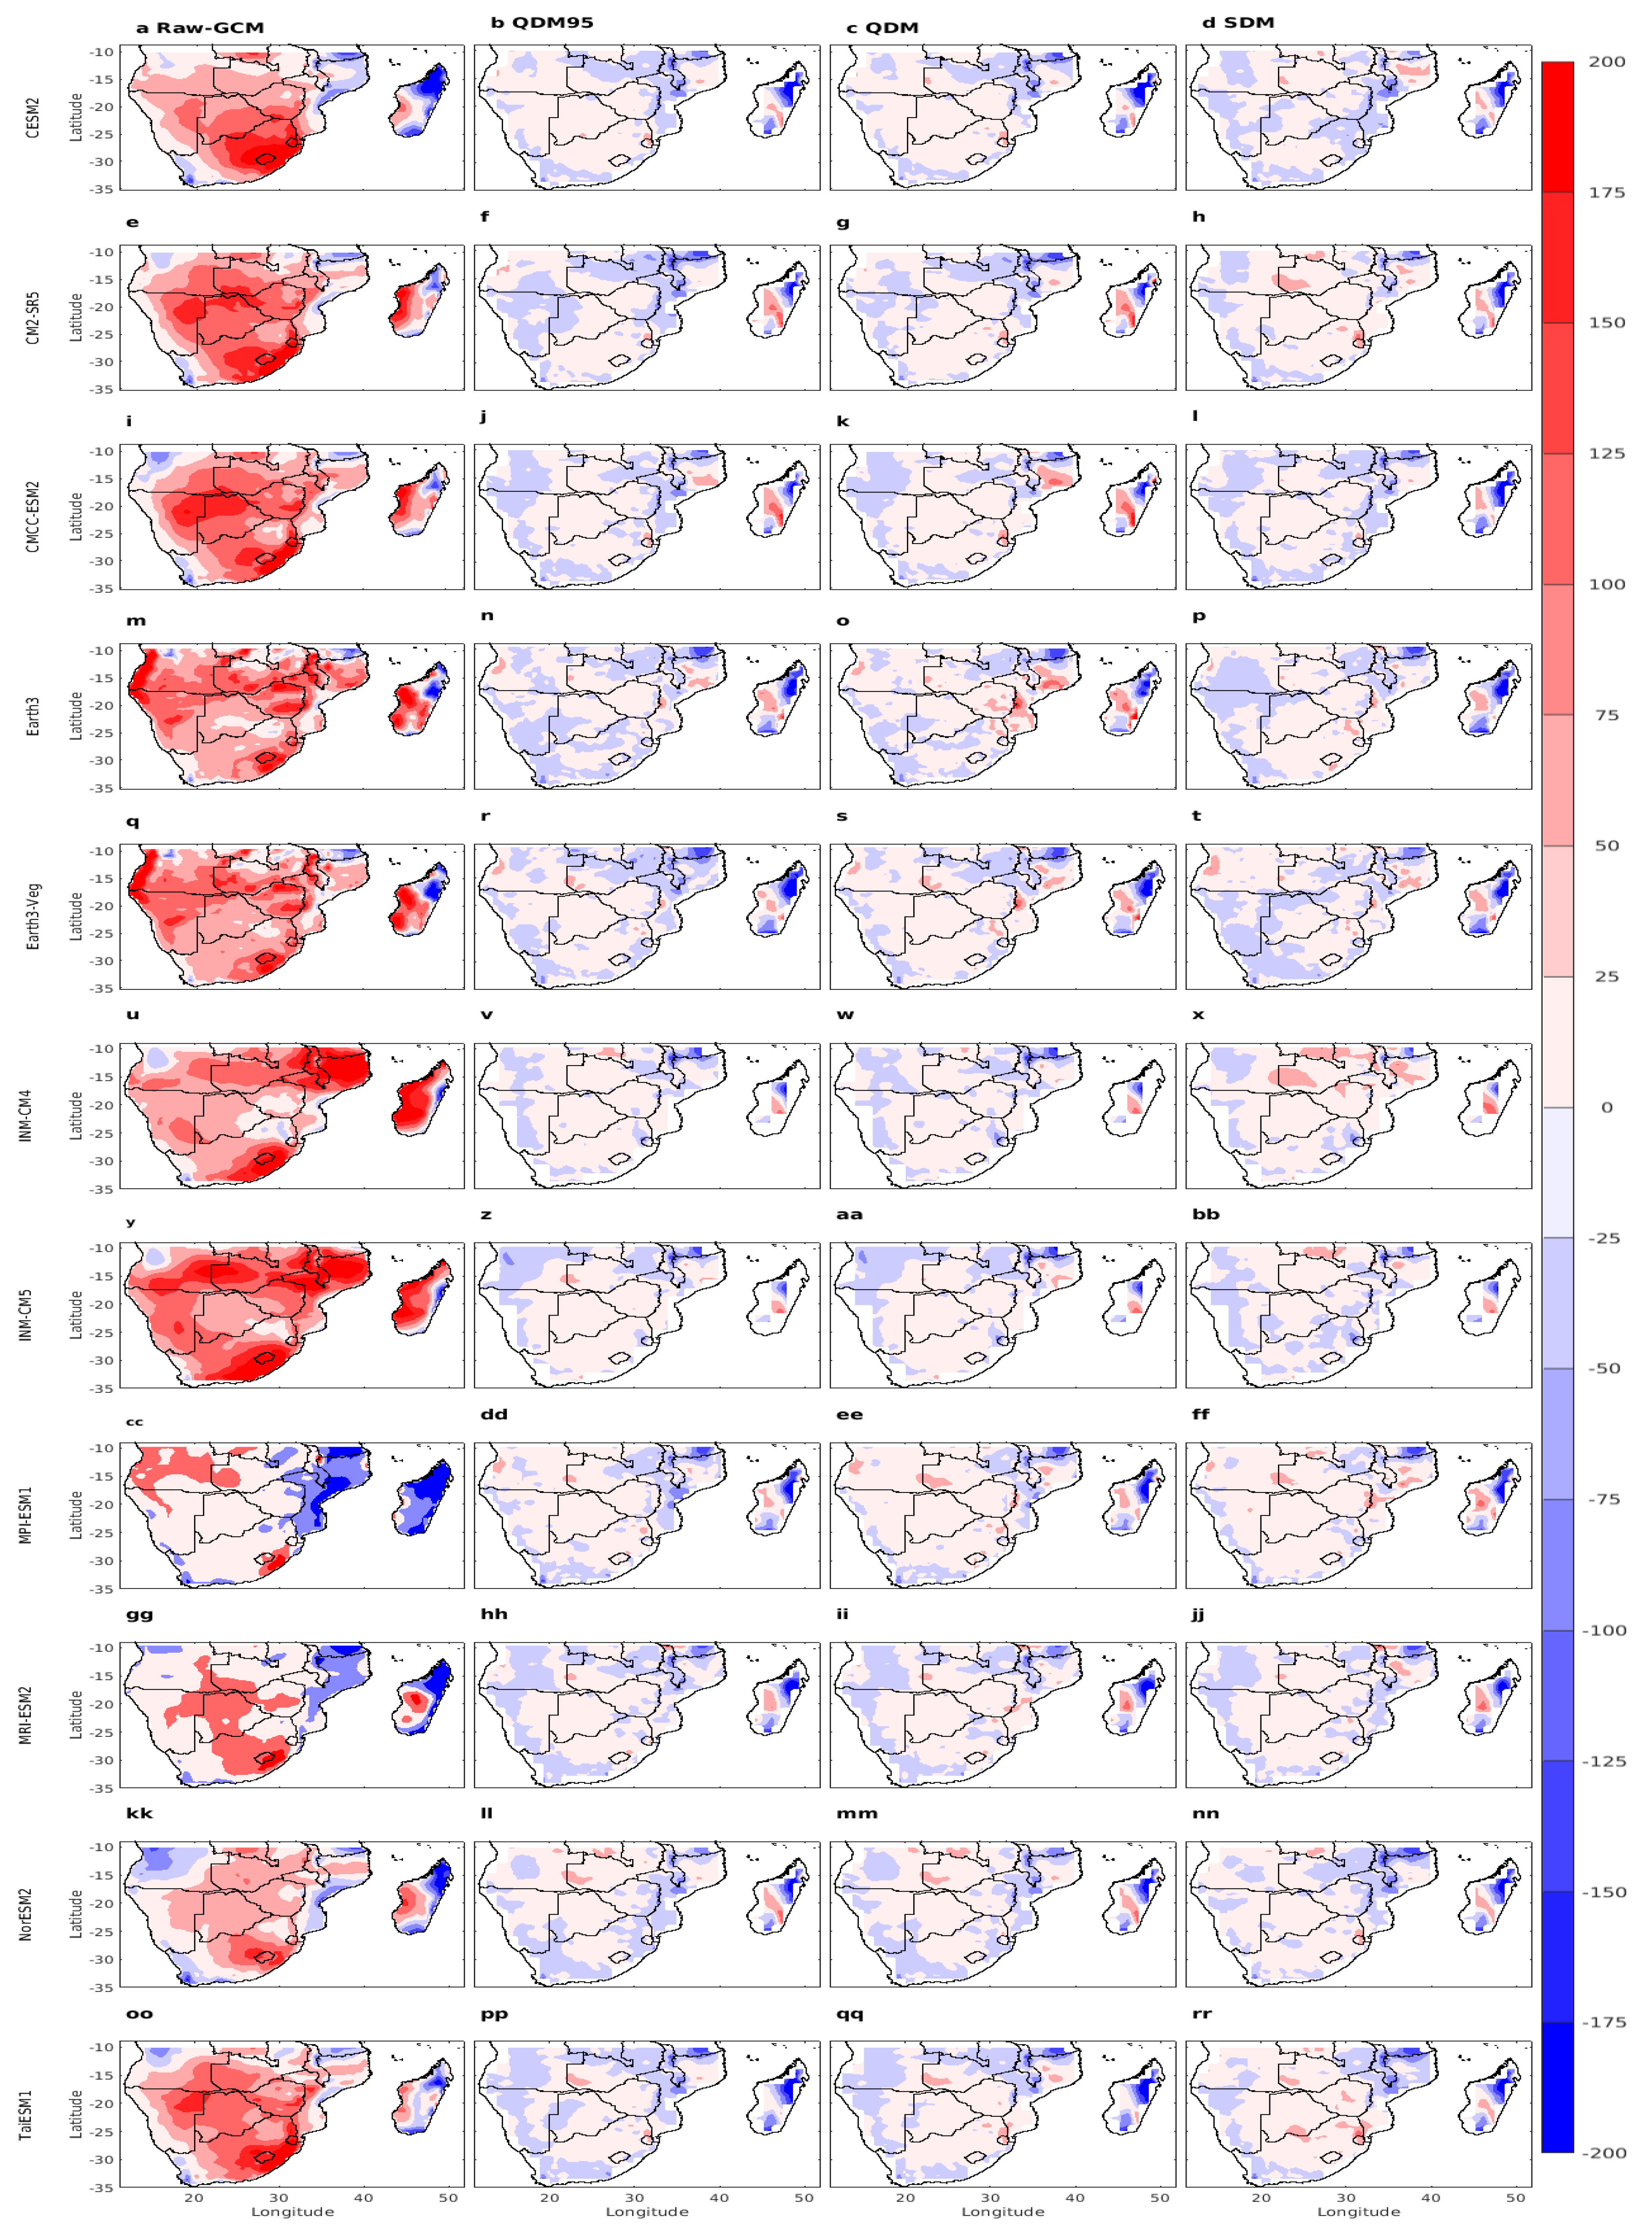
3.2. Seasonal Precipitation Climatology
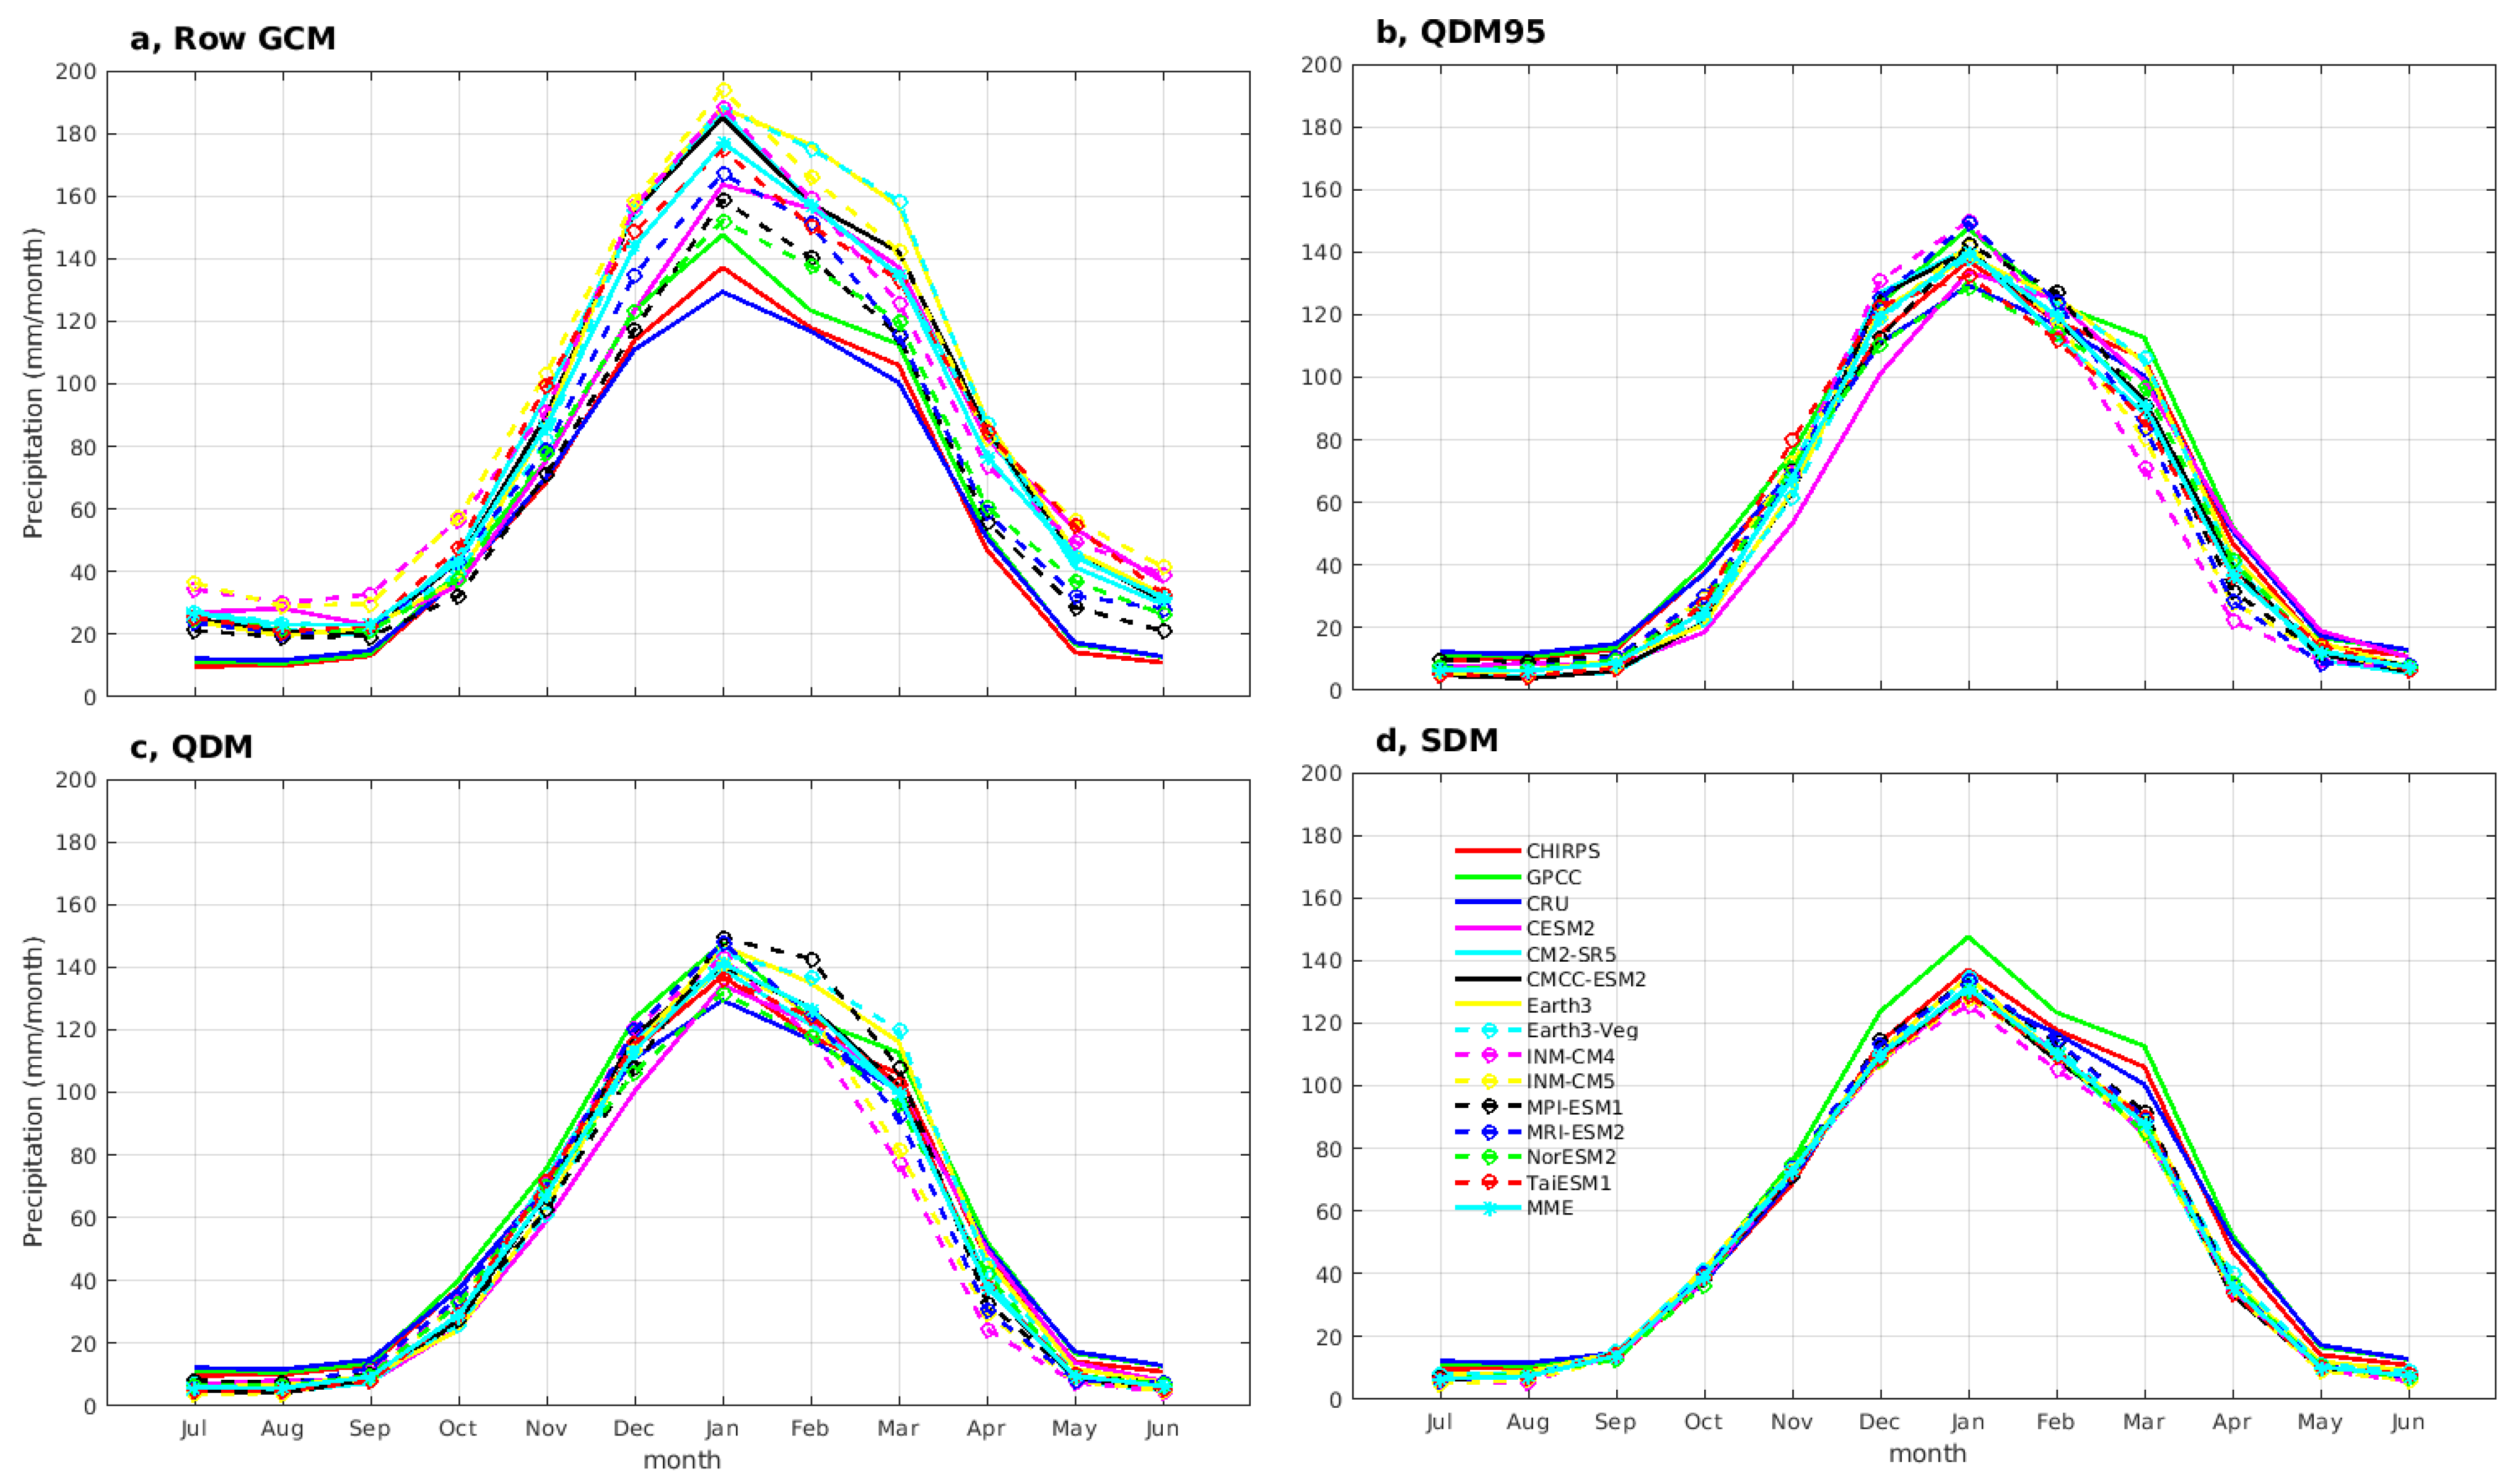
3.3. Mean Seasonal Cycle Precipitation
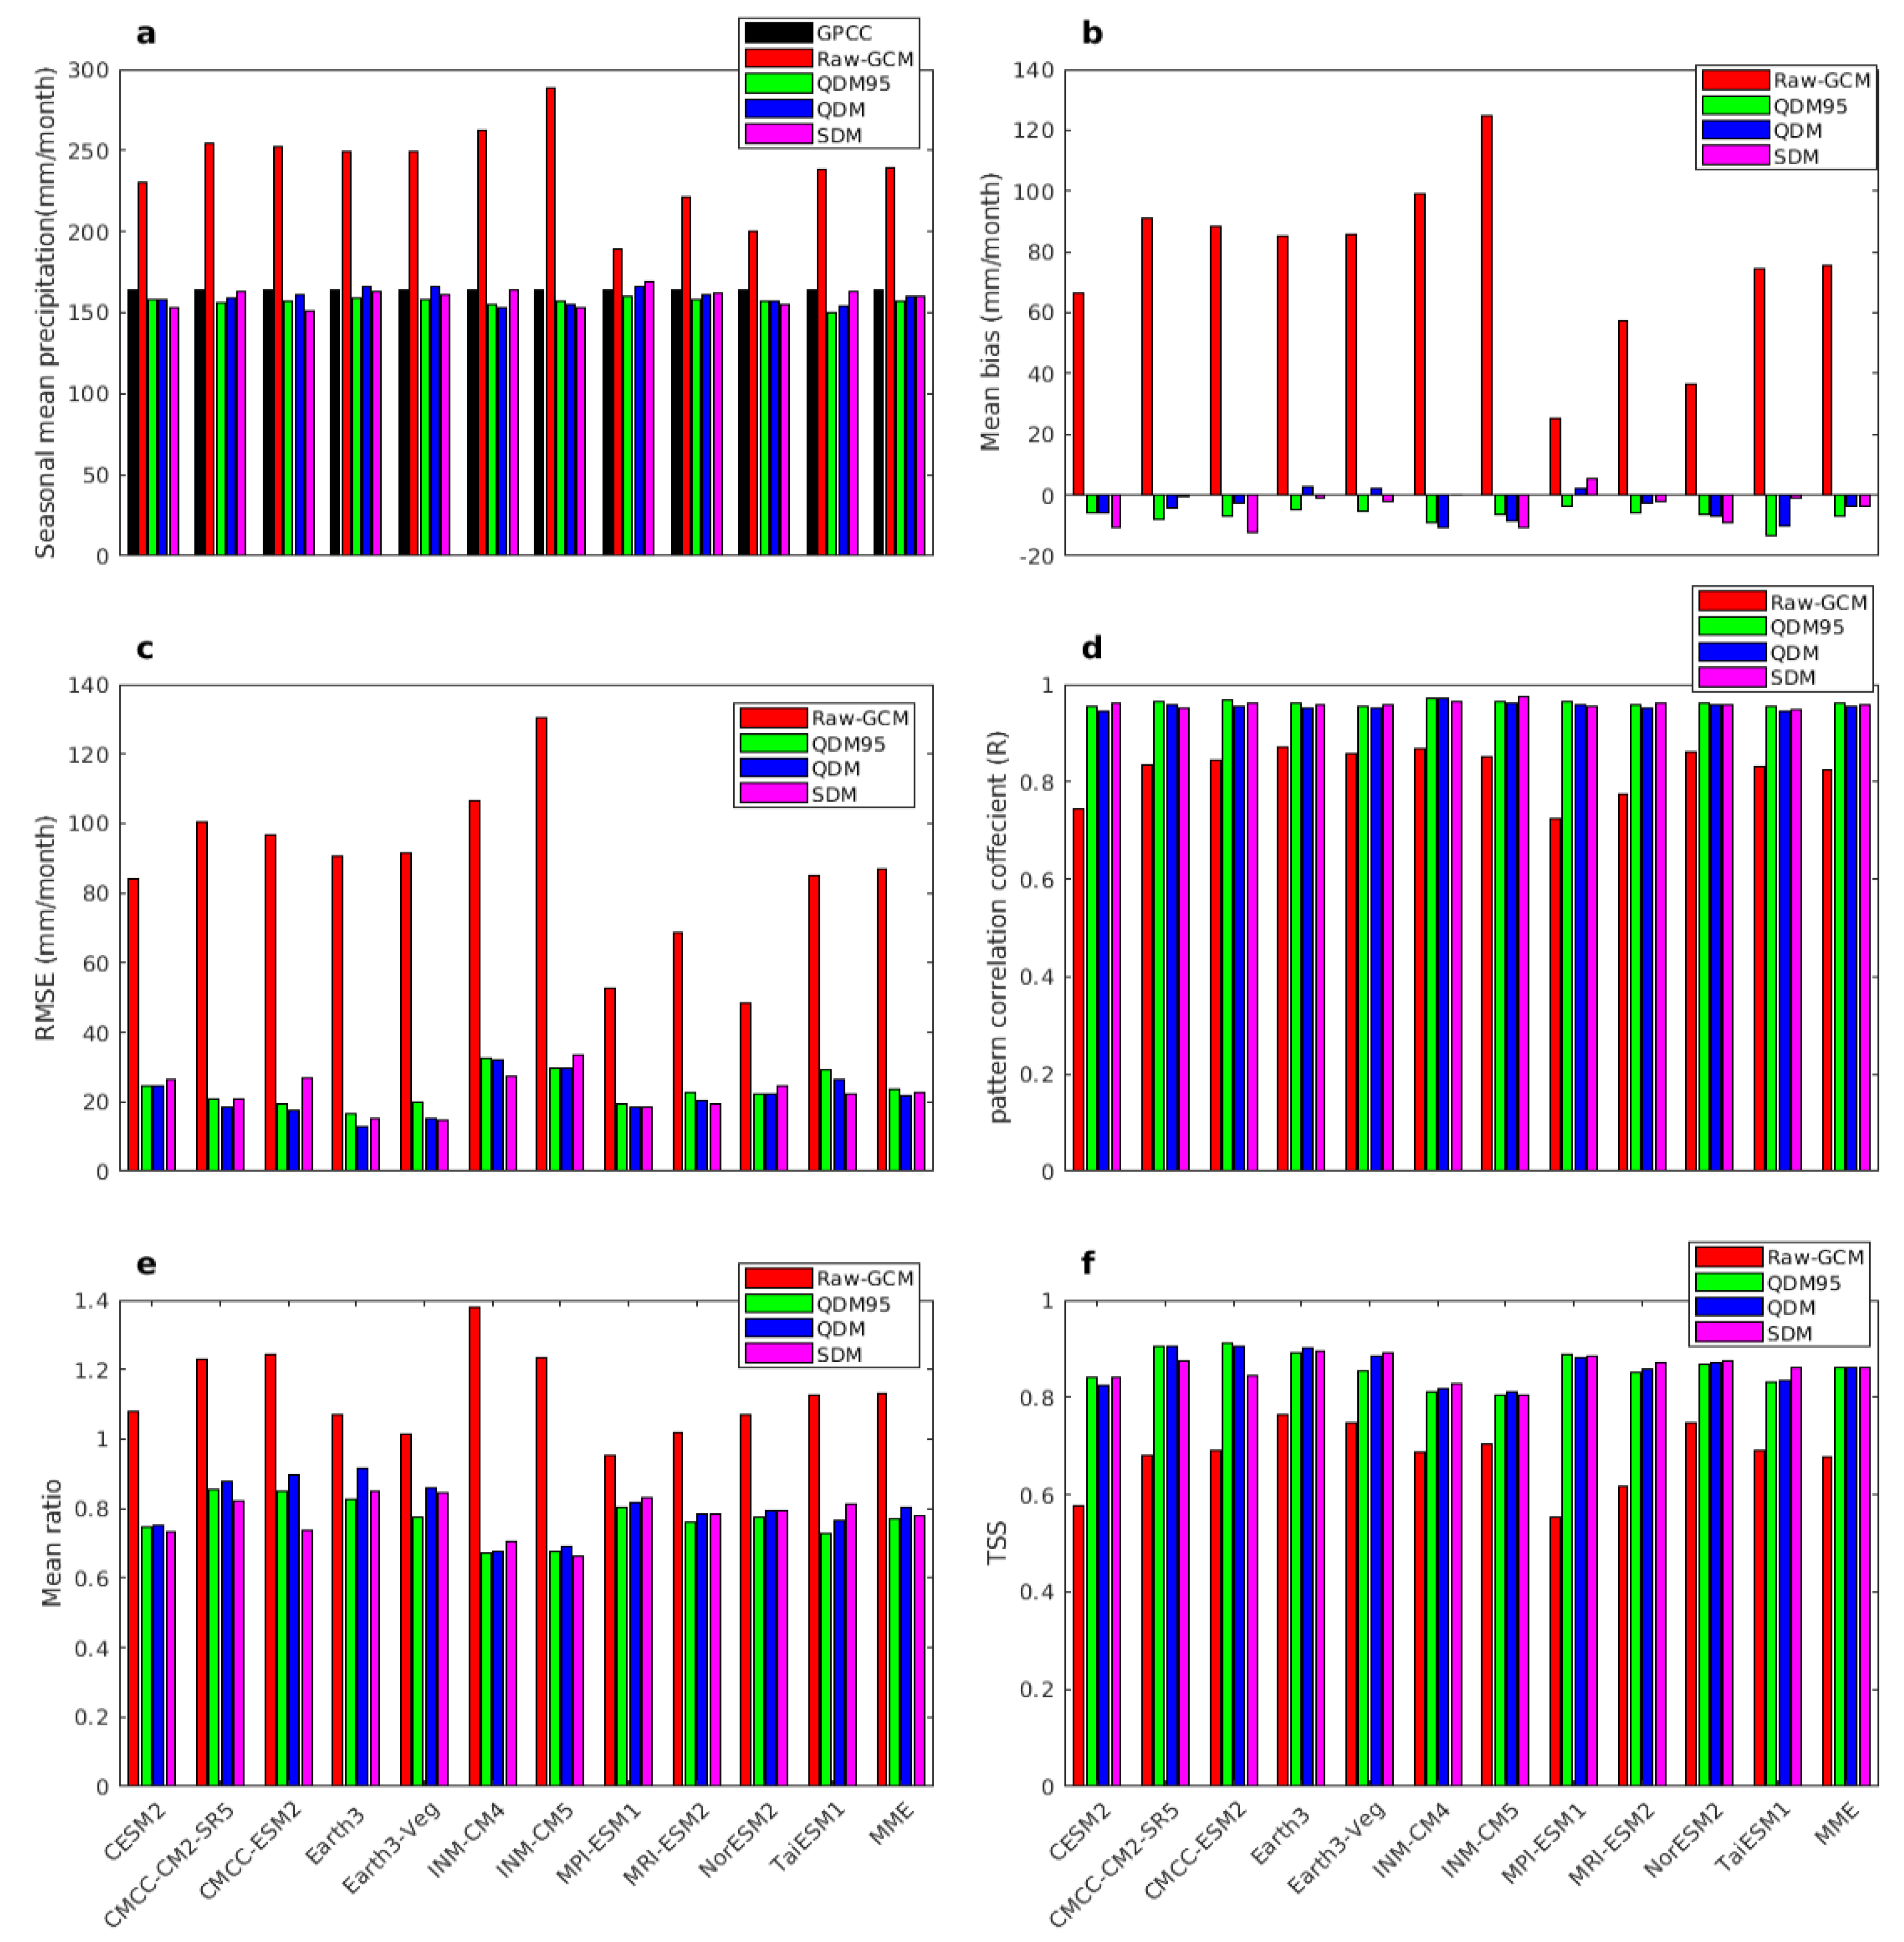
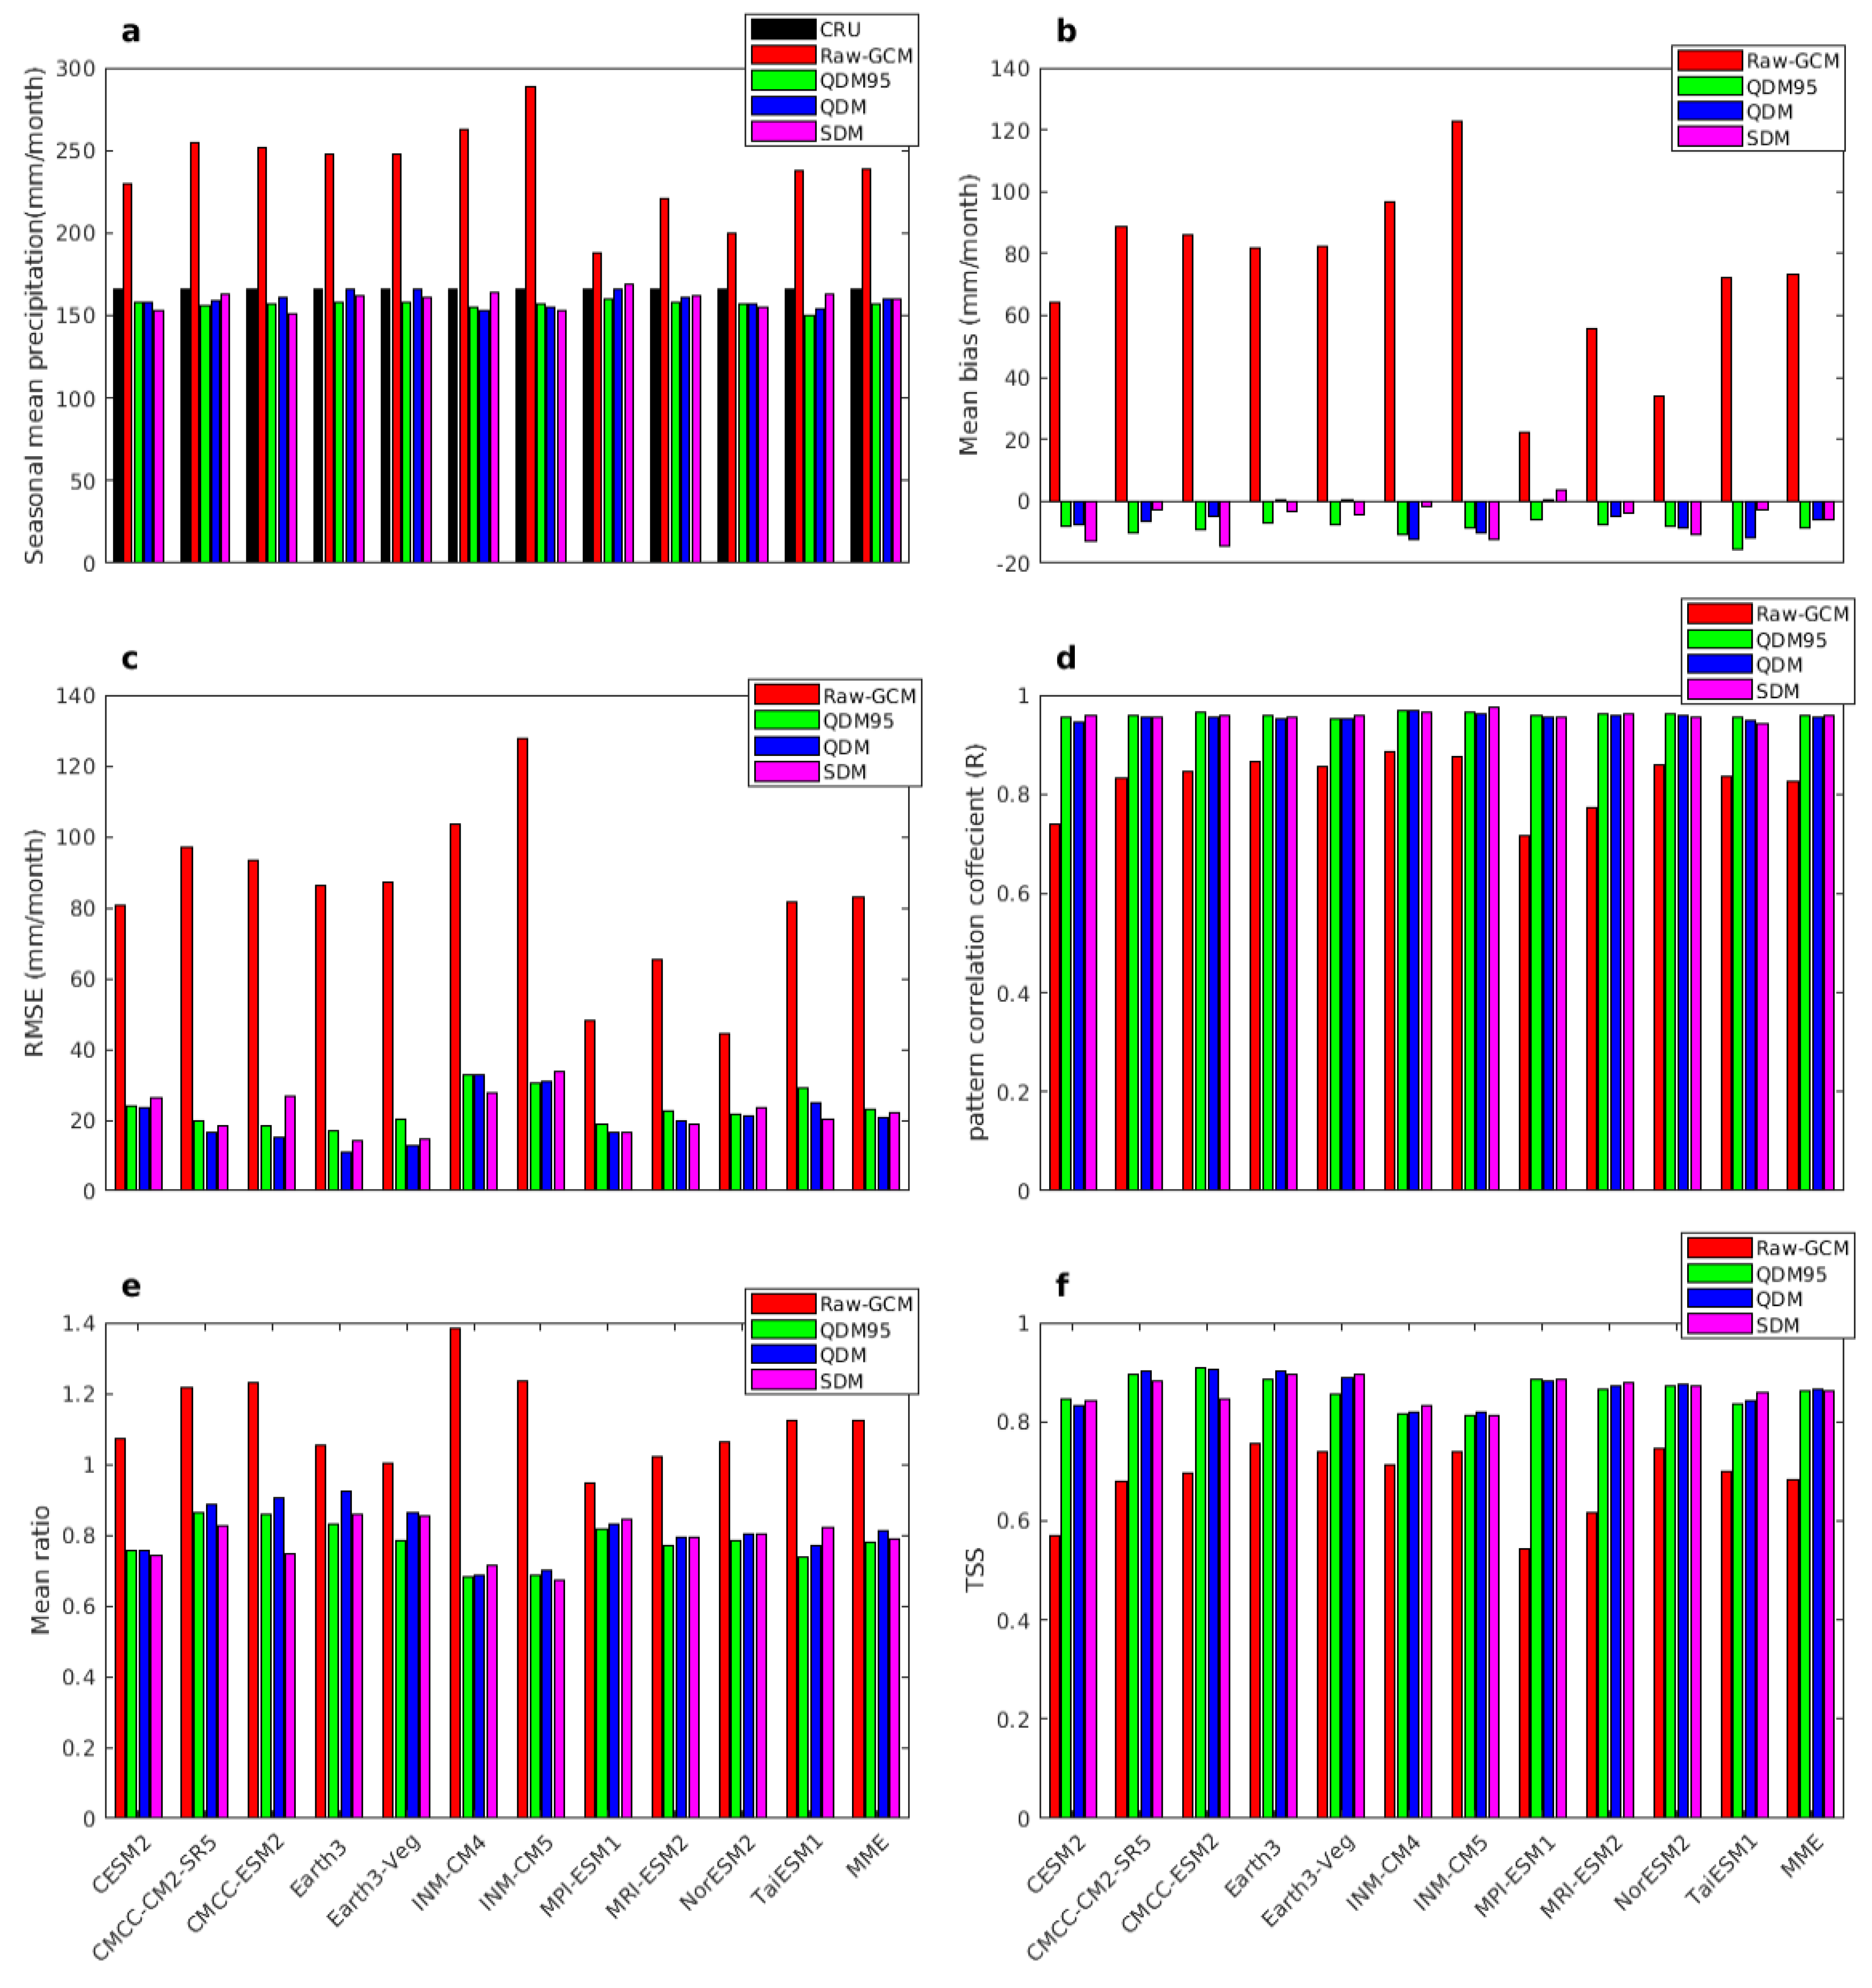
3.4. Performance of Bias-Corrected and Corrected CMIP6 GCM Models in Simulating Observed CHIRPS, GPCC, and CRU Precipitation
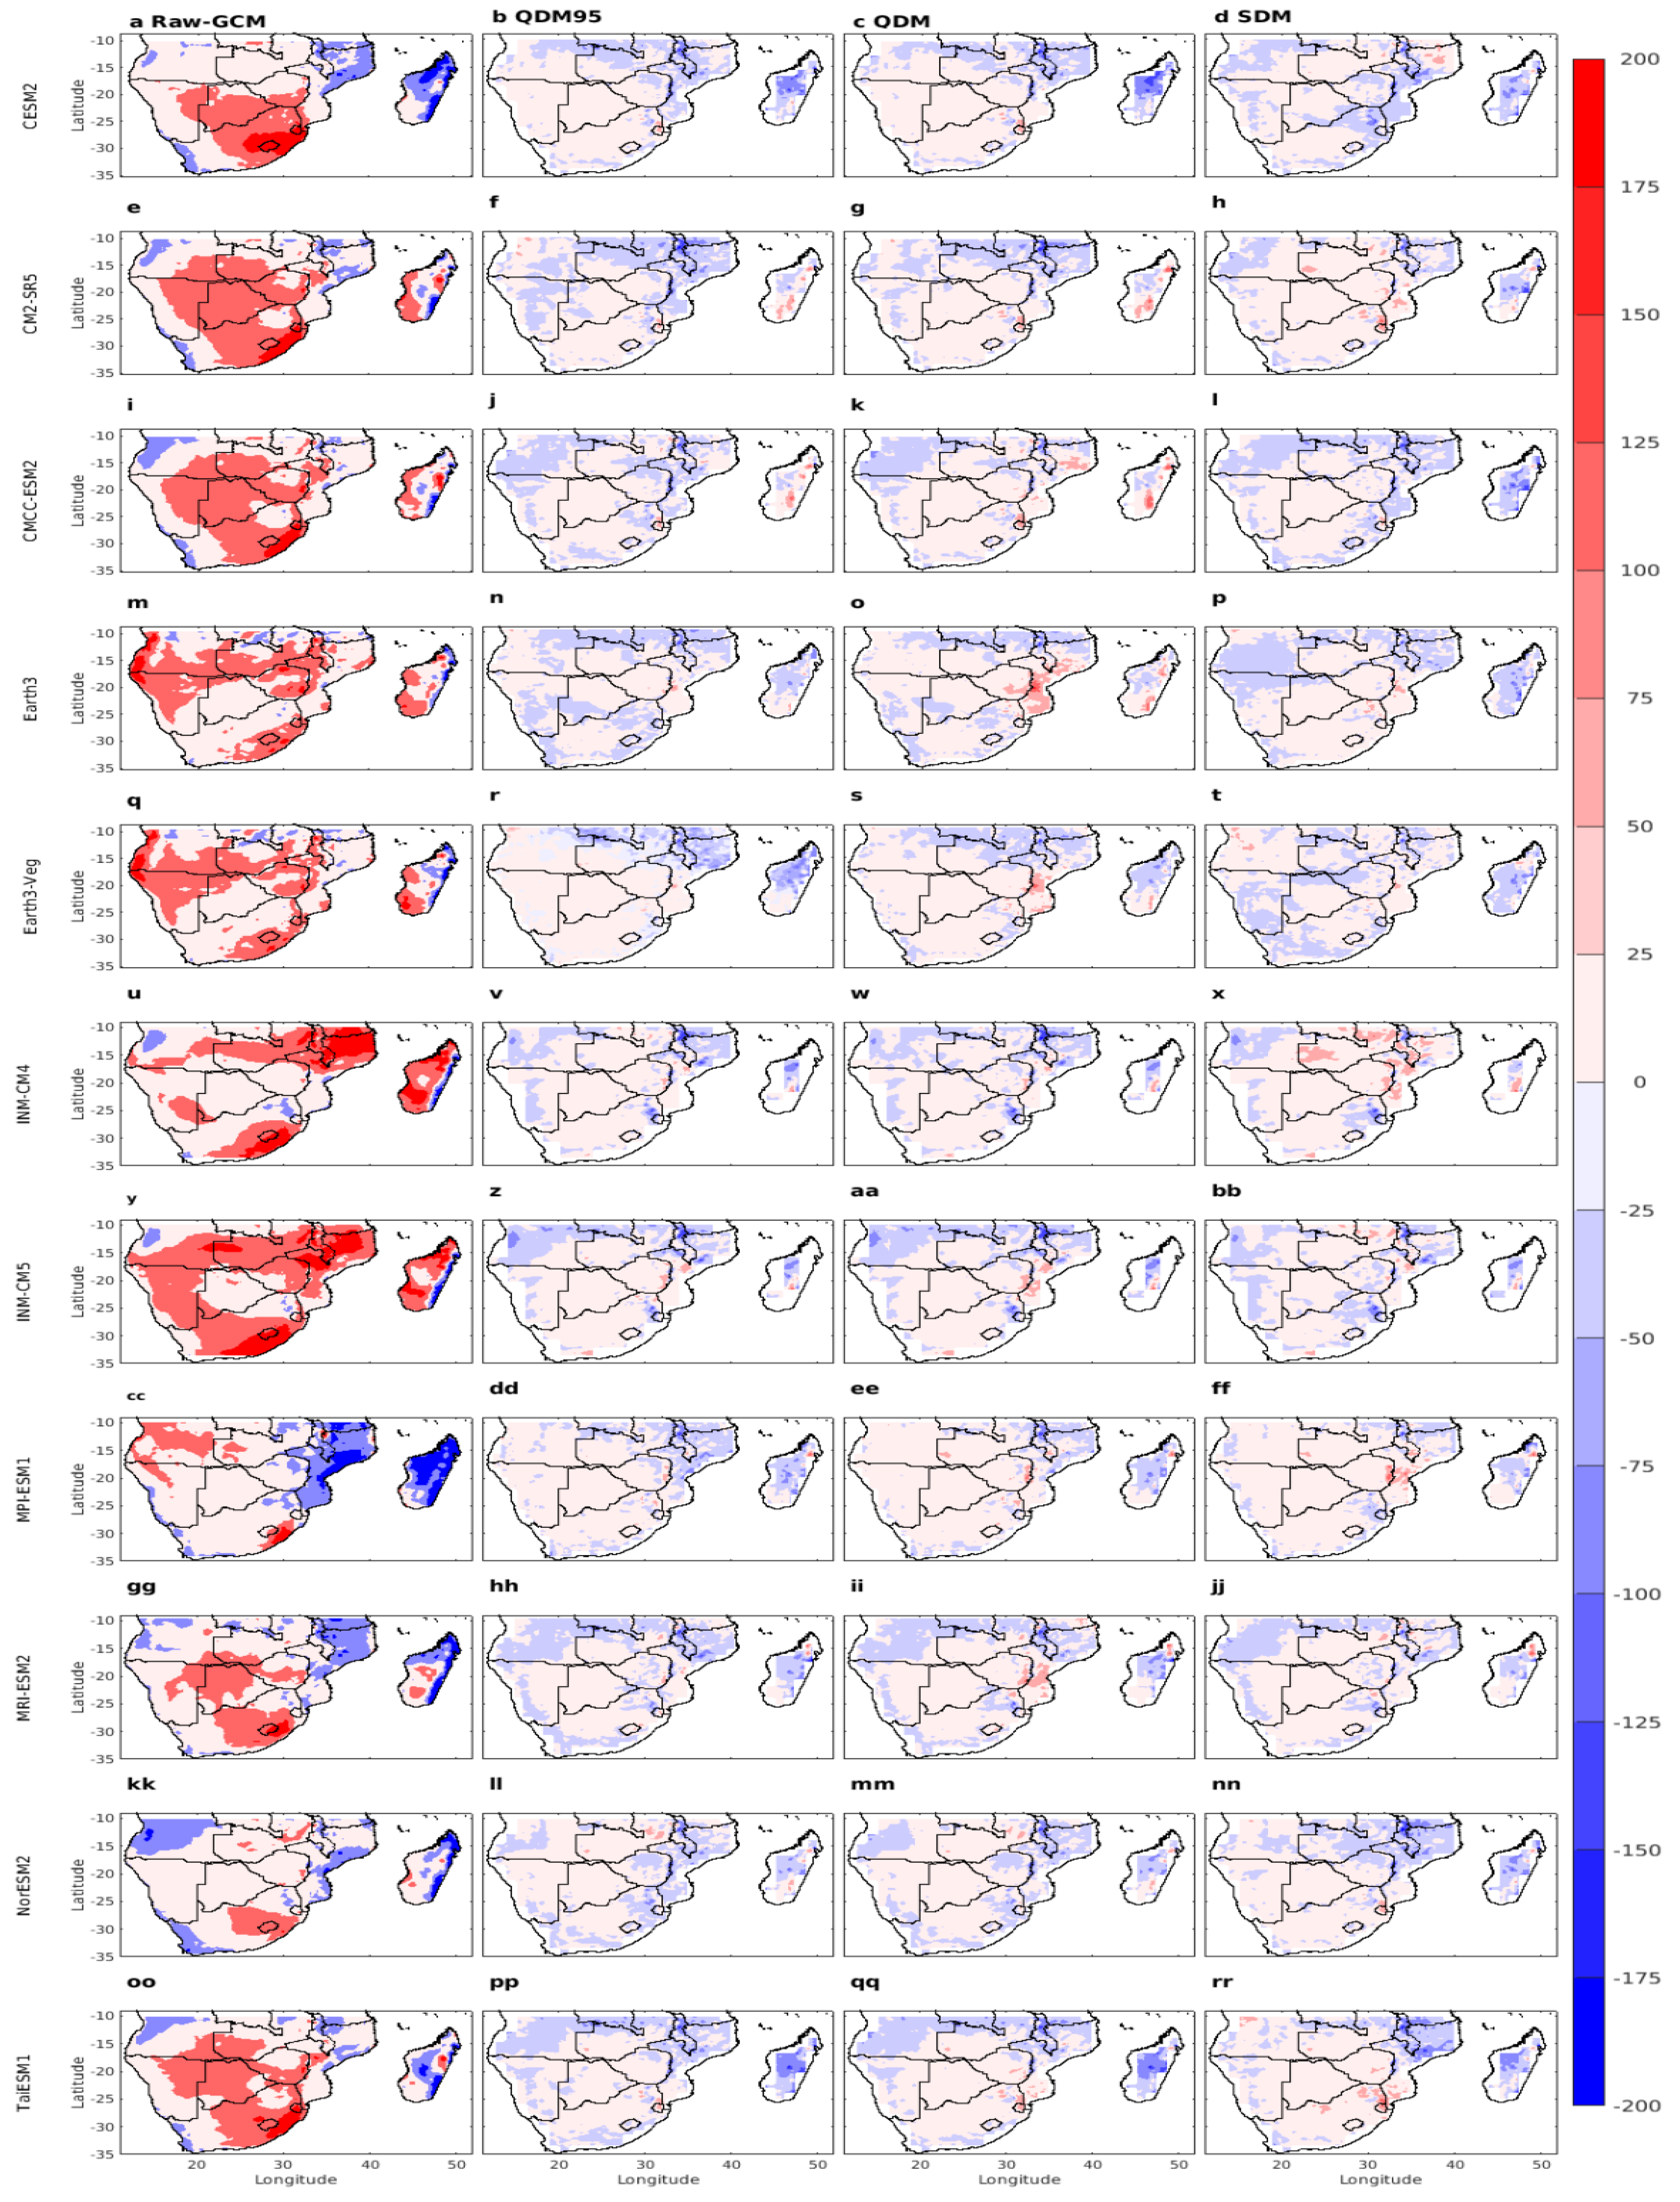
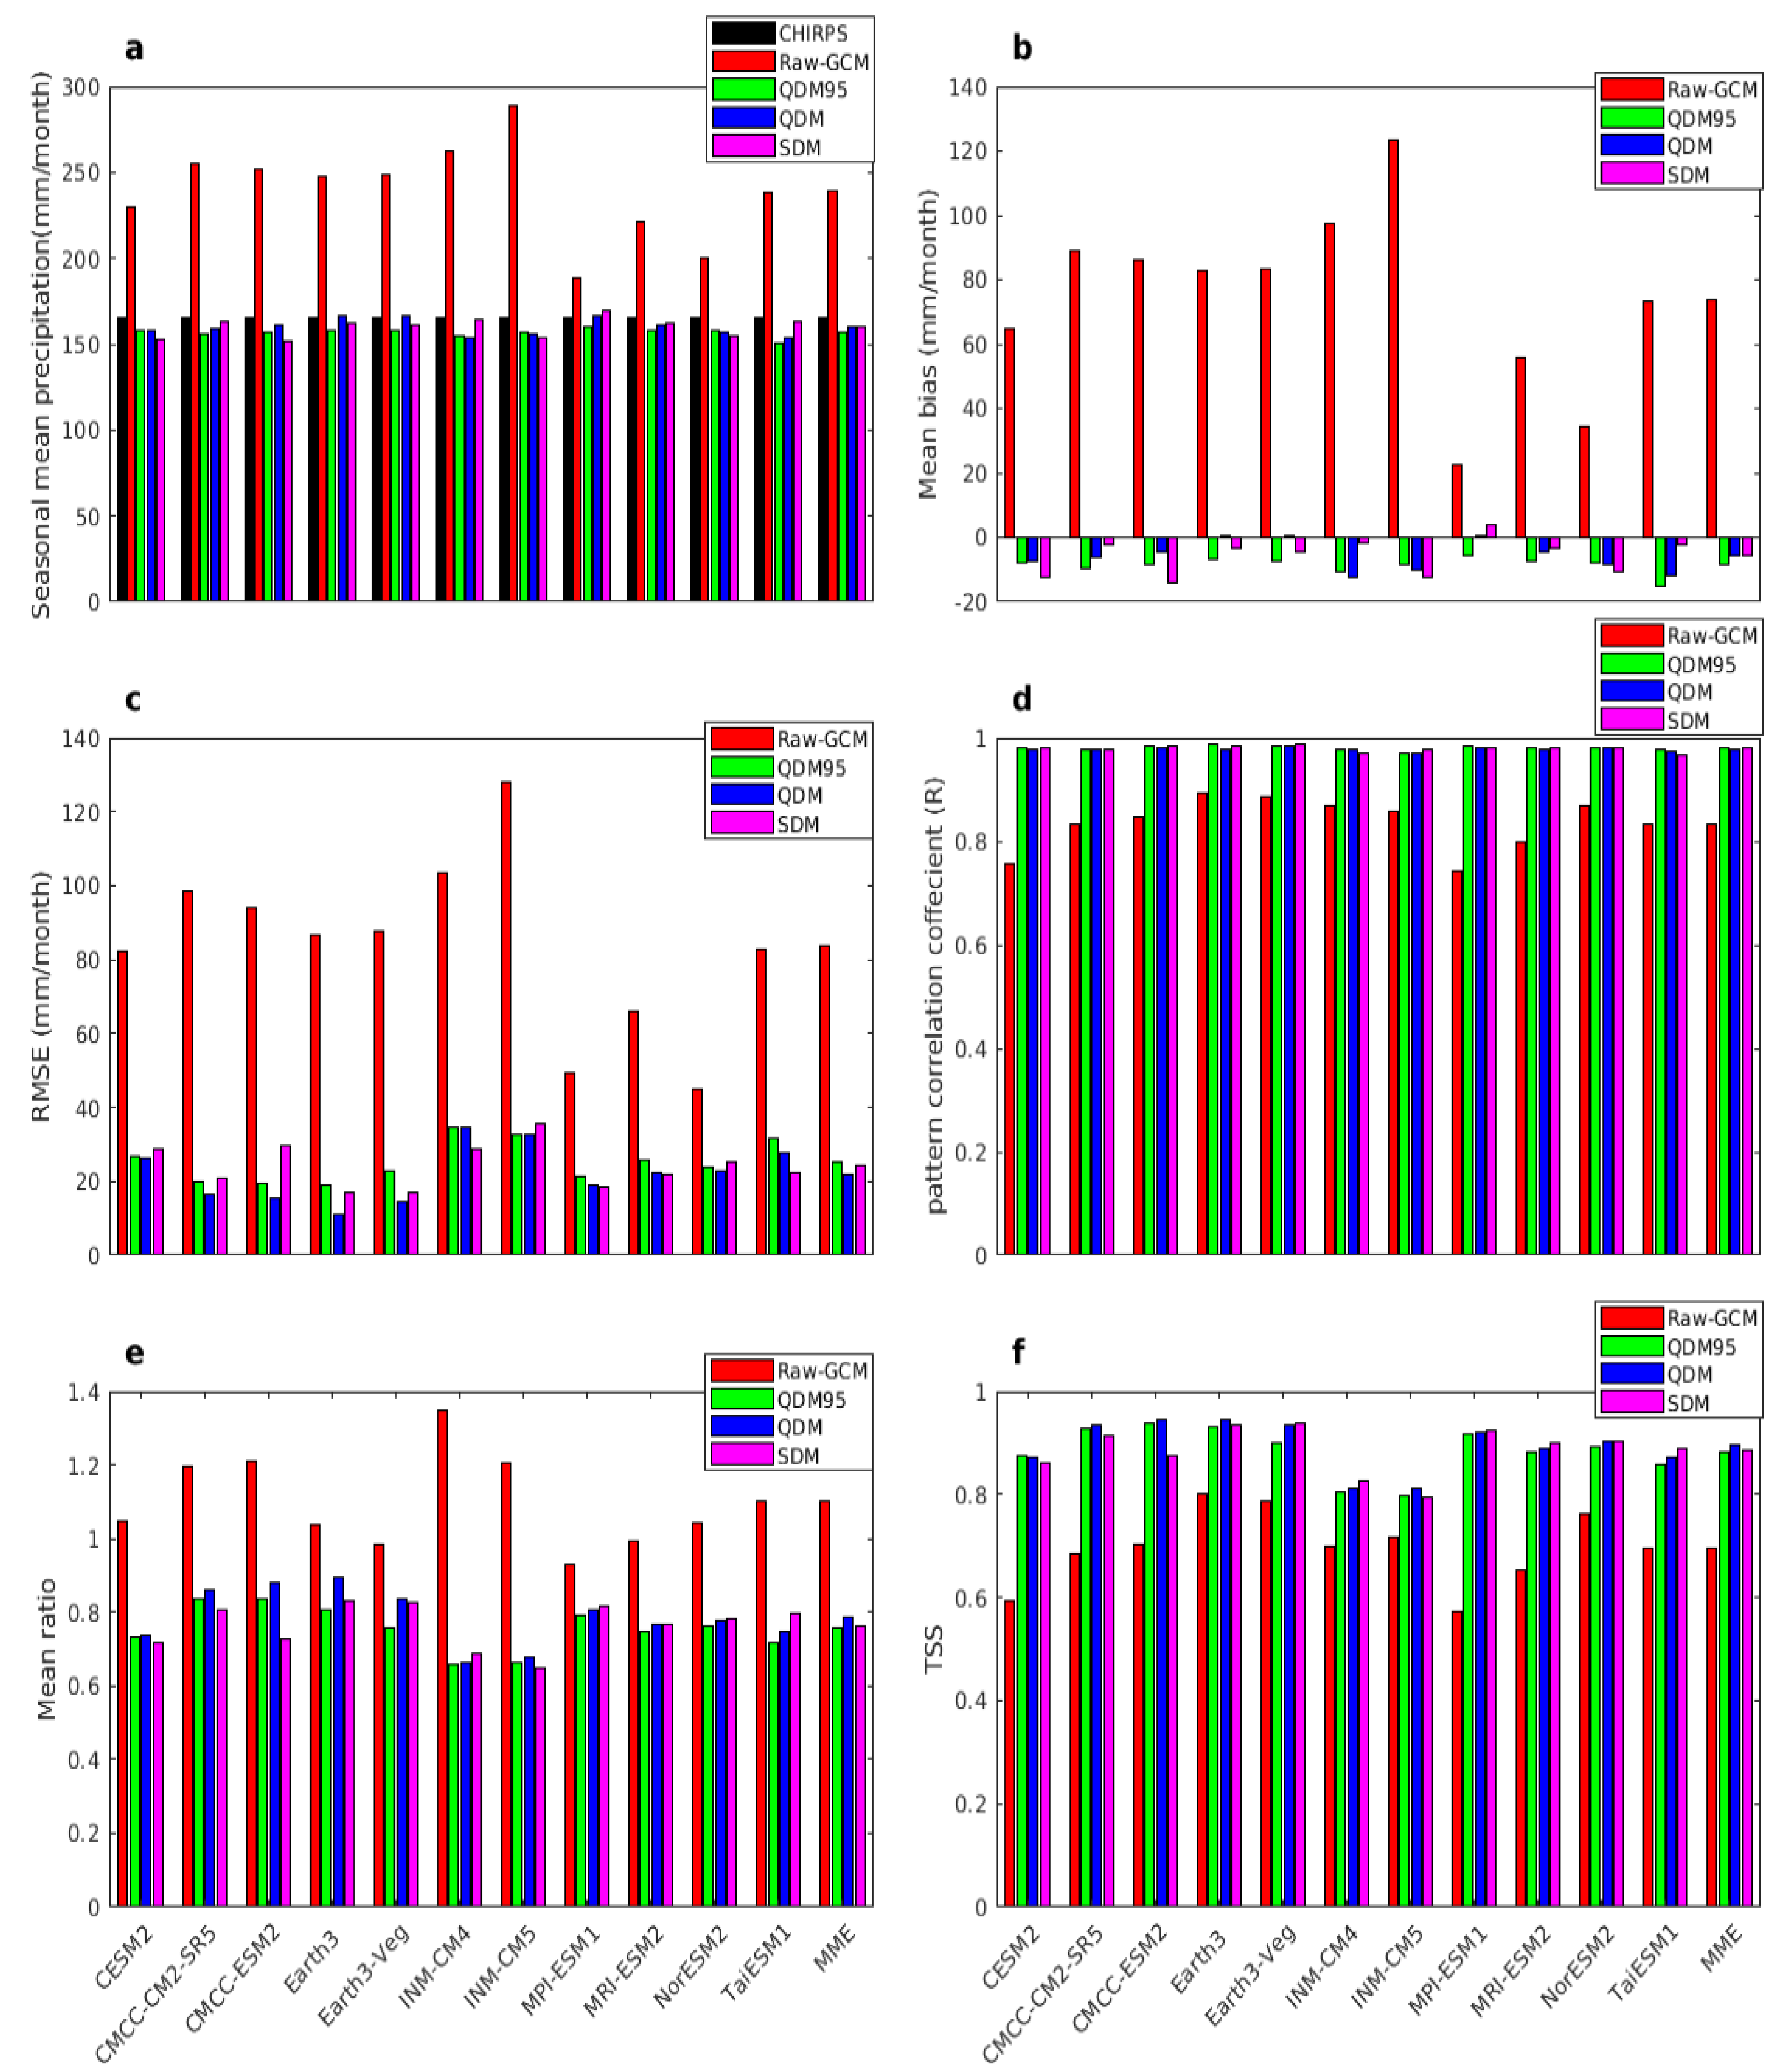
3.4.1. Bias
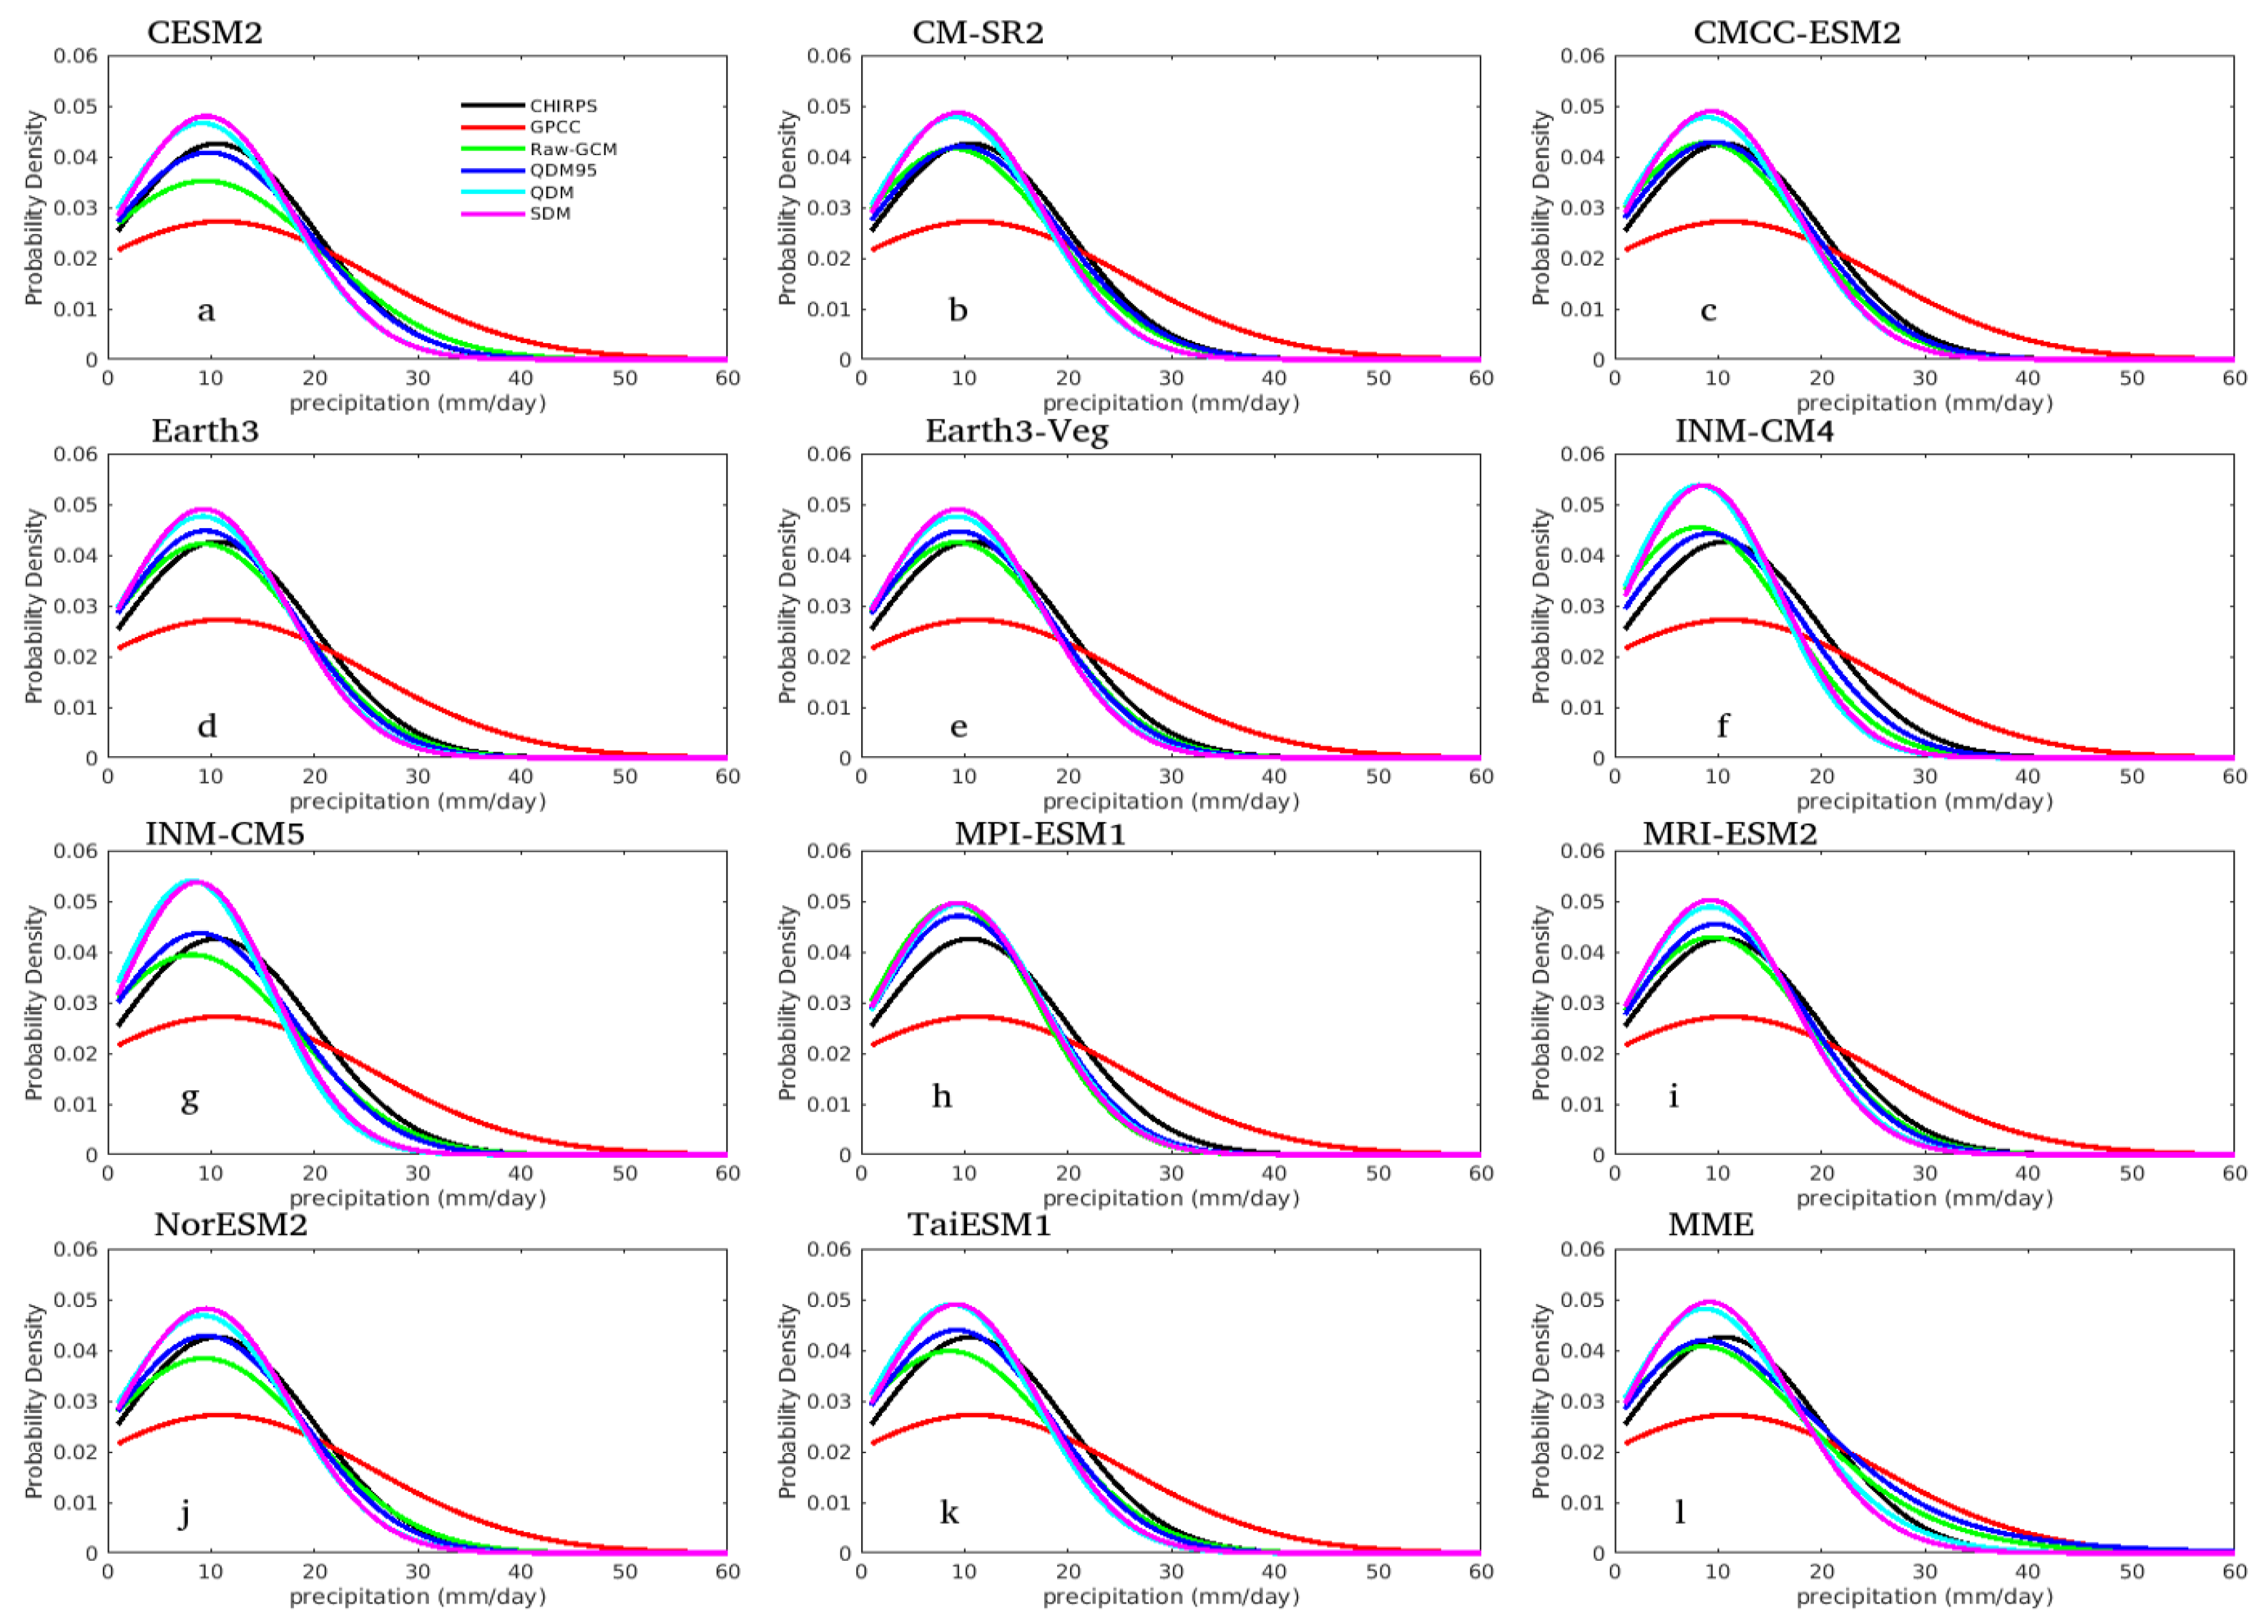
3.4.2. Distribution of Probability Density Functions (PDFs)
3.4.3. Region-Wide Aggregated Performance of CMIP6 Models
3.4.4. Ranking of CMIP6 Models
4. Conclusions
Author Contributions
Funding
Data Availability Statement
Acknowledgments
Conflicts of Interest
References
- Chandio, A.A.; Jiang, Y.; Amin, A.; Ahmad, M.; Akram, W.; Ahmad, F. Climate change and food security of South Asia: Fresh evidence from a policy perspective using novel empirical analysis. J. Environ. Plan. Manag. 2023, 66, 169–190. [Google Scholar] [CrossRef]
- Parker, D.J.; Blyth, A.M.; Woolnough, S.J.; Dougill, A.J.; Bain, C.L.; de Coning, E.; Diop-Kane, M.; Kamga Foamouhoue, A.; Lamptey, B.; Ndiaye, O.; et al. The African SWIFT project: Growing science capability to bring about a revolution in weather prediction. Bull. Am. Meteorol. Soc. 2021, 103, E349–E369. [Google Scholar] [CrossRef]
- Ferrari, C.T.d.R.; Signor, A. Water crisis in Parana: Causes and consequences. Open Sci. J. 2023, 8, 3284. [Google Scholar]
- Zwiers, F.W.; Zhang, X. Translating Science into Actionable Policy Information—A Perspective on the Intergovernmental Panel on Climate Change Process. In Applied Data Science; Springer: Cham, Switzerland, 2023; pp. 1–12. [Google Scholar]
- Xu, Z.; Han, Y.; Yang, Z. Dynamical downscaling of regional climate: A review of methods and limitations. Sci. China Earth Sci. 2019, 62, 365–375. [Google Scholar] [CrossRef]
- Maraun, D. Bias correcting climate change simulations-a critical review. Curr. Clim. Chang. Rep. 2016, 2, 211–220. [Google Scholar] [CrossRef]
- Ghimire, U.; Srinivasan, G.; Agarwal, A. Assessment of rainfall bias correction techniques for improved hydrological simulation. Int. J. Climatol. 2019, 39, 2386–2399. [Google Scholar] [CrossRef]
- Li, X.; Li, Z. Evaluation of bias correction techniques for generating high-resolution daily temperature projections from CMIP6 models. Clim. Dyn. 2023, 61, 3893–3910. [Google Scholar] [CrossRef]
- Casanueva, A.; Herrera, S.; Iturbide, M.; Lange, S.; Jury, M.; Dosio, A.; Maraun, D.; Gutiérrez, J.M. Testing bias adjustment methods for regional climate change applications under observational uncertainty and resolution mismatch. Atmos. Sci. Lett. 2020, 21, e978. [Google Scholar] [CrossRef]
- Tabari, H.; Paz, S.M.; Buekenhout, D.; Willems, P. Comparison of statistical downscaling methods for climate change impact analysis on precipitation-driven drought. Hydrol. Earth Syst. Sci. 2021, 25, 3493–3517. [Google Scholar] [CrossRef]
- Gumindoga, W.; Rientjes, T.H.; Haile, A.T.; Makurira, H.; Reggiani, P. Performance of bias-correction schemes for CMORPH rainfall estimates in the Zambezi River basin. Hydrol. Earth Syst. Sci. 2019, 23, 2915–2938. [Google Scholar] [CrossRef]
- Chen, J.; Brissette, F.P.; Chaumont, D.; Braun, M. Finding appropriate bias correction methods in downscaling precipitation for hydrologic impact studies over North America. Water Resour. Res. 2013, 49, 4187–4205. [Google Scholar] [CrossRef]
- Ayugi, B.; Tan, G.; Ruoyun, N.; Babaousmail, H.; Ojara, M.; Wido, H.; Mumo, L.; Ngoma, N.H.; Nooni, I.K.; Ongoma, V. Quantile mapping bias correction on rossby centre regional climate models for precipitation analysis over Kenya, East Africa. Water 2020, 12, 801. [Google Scholar] [CrossRef]
- Hamadalnel, M.; Zhu, Z.; Gaber, A.; Iyakaremye, V.; Ayugi, B. Possible changes in Sudan’s future precipitation under the high and medium emission scenarios based on bias adjusted GCMs. Atmos. Res. 2022, 269, 106036. [Google Scholar] [CrossRef]
- Sian, K.T.C.L.K.; Hagan, D.F.T.; Ayugi, B.O.; Nooni, I.K.; Ullah, W.; Babaousmail, H.; Ongoma, V. Projections of precipitation extremes based on bias-corrected Coupled Model Intercomparison Project phase 6 models ensemble over southern Africa. Int. J. Climatol. 2022, 42, 8269–8289. [Google Scholar] [CrossRef]
- Switanek, M.B.; Troch, P.A.; Castro, C.L.; Leuprecht, A.; Chang, H.I.; Mukherjee, R.; Demaria, E. Scaled distribution mapping: A bias correction method that preserves raw climate model projected changes. Hydrol. Earth Syst. Sci. 2017, 21, 2649–2666. [Google Scholar] [CrossRef]
- Sian, K.T.C.L.K.; Wang, J.; Ayugi, B.O.; Nooni, I.K.; Ongoma, V. Multi-decadal variability and future changes in precipitation over Southern Africa. Atmosphere 2021, 12, 742. [Google Scholar] [CrossRef]
- Ribes, A.; Qasmi, S.; Gillett, N.P. Making climate projections conditional on historical observations. Sci. Adv. 2021, 7, eabc0671. [Google Scholar] [CrossRef]
- Mmame, B.; Ngongondo, C. Evaluation of CMIP6 model skills in simulating tropical climate extremes over Malawi, Southern Africa. Model. Earth Syst. Environ. 2024, 10, 1695–1709. [Google Scholar] [CrossRef]
- Li, X.; Li, Z. Assessment of bias correction methods for high resolution daily precipitation projections with CMIP6 models: A Canadian case study. J. Hydrol. Reg. Stud. 2025, 58, 102223. [Google Scholar] [CrossRef]
- Samuel, S.; Mengistu Tsidu, G.; Dosio, A.; Mphale, K. Assessment of historical and future mean and extreme precipitation over sub-saharan africa using nex-gddp-cmip6: Part i—Evaluation of historical simulation. Int. J. Climatol. 2025, 45, e8672. [Google Scholar] [CrossRef]
- Babaousmail, H.; Hou, R.; Ayugi, B.; Ojara, M.; Ngoma, H.; Karim, R.; Rajasekar, A.; Ongoma, V. Evaluation of the performance of CMIP6 models in reproducing rainfall patterns over North Africa. Atmosphere 2021, 12, 475. [Google Scholar] [CrossRef]
- Faye, A.; Akinsanola, A.A. Evaluation of extreme precipitation indices over West Africa in CMIP6 models. Clim. Dyn. 2022, 58, 925–939. [Google Scholar] [CrossRef]
- Ngoma, H.; Wen, W.; Ayugi, B.; Babaousmail, H.; Karim, R.; Ongoma, V. Evaluation of precipitation simulations in CMIP6 models over Uganda. Int. J. Climatol. 2021, 41, 4743–4768. [Google Scholar] [CrossRef]
- Makula, E.K.; Zhou, B. Coupled Model Intercomparison Project phase 6 evaluation and projection of East African precipitation. Int. J. Climatol. 2022, 42, 2398–2412. [Google Scholar] [CrossRef]
- Jima, W.L.; Bahaga, T.K.; Tsidu, G.M. Fidelity of CMIP6 Models in Simulating June–September Rainfall Climatology, Spatial and Trend Patterns Over Complex Topography of Greater Horn of Africa. Pure Appl. Geophys. 2024, 181, 577–609. [Google Scholar] [CrossRef]
- Almazroui, M.; Saeed, F.; Saeed, S.; Nazrul Islam, M.; Ismail, M.; Klutse, N.A.B.; Siddiqui, M.H. Projected change in temperature and precipitation over Africa from CMIP6. Earth Syst. Environ. 2020, 4, 455–475. [Google Scholar] [CrossRef]
- Samuel, S.; Dosio, A.; Mphale, K.; Faka, D.N.; Wiston, M. Comparison of multimodel ensembles of global and regional climate models projections for extreme precipitation over four major river basins in southern Africa—assessment of the historical simulations. Clim. Chang. 2023, 176, 57. [Google Scholar] [CrossRef]
- Favre, A.; Hewitson, B.; Lennard, C.; Cerezo-Mota, R.; Tadross, M. Cut-off lows in the South Africa region and their contribution to precipitation. Clim. Dyn. 2013, 41, 2331–2351. [Google Scholar] [CrossRef]
- Peel, M.C.; Finlayson, B.L.; McMahon, T.A. Updated world map of the Köppen-Geiger climate classification. Hydrol. Earth Syst. Sci. 2007, 11, 1633–1644. [Google Scholar] [CrossRef]
- Engelbrecht, F.; McGregor, J.; Engelbrecht, C. Dynamics of the Conformal-Cubic Atmospheric Model projected climate-change signal over southern Africa. Int. J. Climatol. J. R. Soc. 2009, 29, 1013–1033. [Google Scholar] [CrossRef]
- Usman, M.T.; Reason, C. Dry spell frequencies and their variability over southern Africa. Clim. Res. 2004, 26, 199–211. [Google Scholar] [CrossRef]
- Dunning, C.M.; Black, E.C.; Allan, R.P. The onset and cessation of seasonal rainfall over Africa. J. Geophys. Res. Atmos. 2016, 121, 11–405. [Google Scholar] [CrossRef]
- Nicholson, S.E. The ITCZ and the seasonal cycle over equatorial Africa. Bull. Am. Meteorol. Soc. 2018, 99, 337–348. [Google Scholar] [CrossRef]
- Daron, J.; Burgin, L.; Janes, T.; Jones, R.G.; Jack, C. Climate process chains: Examples from southern Africa. Int. J. Climatol. 2019, 39, 4784–4797. [Google Scholar] [CrossRef]
- NOAA National Geophysical Data Center. 2-Minute Gridded Global Relief Data (ETOPO2) v2; NOAA National Centers for Environmental Information: Asheville, NC, USA, 2006.
- Akinsanola, A.; Ogunjobi, K.; Ajayi, V.; Adefisan, E.; Omotosho, J.; Sanogo, S. Comparison of five gridded precipitation products at climatological scales over West Africa. Meteorol. Atmos. Phys. 2017, 129, 669–689. [Google Scholar] [CrossRef]
- Funk, C.; Peterson, P.; Landsfeld, M.; Pedreros, D.; Verdin, J.; Shukla, S.; Husak, G.; Rowland, J.; Harrison, L.; Hoell, A.; et al. The climate hazards infrared precipitation with stations—A new environmental record for monitoring extremes. Sci. Data 2015, 2, 1–21. [Google Scholar] [CrossRef]
- Schneider, U.; Becker, A.; Finger, P.; Meyer-Christoffer, A.; Ziese, M.; Rudolf, B. GPCC’s new land surface precipitation climatology based on quality-controlled in situ data and its role in quantifying the global water cycle. Theor. Appl. Climatol. 2014, 115, 15–40. [Google Scholar] [CrossRef]
- Jones, P.; Harris, I. CRU Time Series (TS) High Resolution Gridded Datasets; Clim Res Unit, Univ East Anglia: Norwich, UK, 2008; Available online: https://iridl.ldeo.columbia.edu/expert/SOURCES/.UEA/.CRU/.TS3p1/.monthly/.pre (accessed on 1 April 2025).
- Samuel, S.; Mengistu Tsidu, G.; Dosio, A.; Mphale, K. Exploring the influence of improved horizontal resolution on extreme precipitation in Southern Africa major river basins: Insights from CMIP6 HighResMIP simulations. Clim. Dyn. 2024, 62, 8099–8120. [Google Scholar] [CrossRef]
- Danabasoglu, G. NCAR CESM2-WACCM model output prepared for CMIP6 CMIP historical. Earth Syst. Grid Fed. 2019. [Google Scholar] [CrossRef]
- Cherchi, A.; Fogli, P.G.; Lovato, T.; Peano, D.; Iovino, D.; Gualdi, S.; Masina, S.; Scoccimarro, E.; Materia, S.; Bellucci, A.; et al. Global mean climate and main patterns of variability in the CMCC-CM2 coupled model. J. Adv. Model. Earth Syst. 2019, 11, 185–209. [Google Scholar] [CrossRef]
- Fogli, P.G.; Manzini, E.; Vichi, M.; Alessandri, A.; Patara, L.; Gualdi, S.; Scoccimarro, E.; Masina, S.; Navarra, A. INGV-CMCC carbon (ICC): A carbon cycle earth system model. CMCC Res. Pap. 2009. [Google Scholar] [CrossRef]
- Döscher, R.; Acosta, M.; Alessandri, A.; Anthoni, P.; Arneth, A.; Arsouze, T.; Bergmann, T.; Bernadello, R.; Bousetta, S.; Caron, L.P.; et al. The EC-earth3 Earth system model for the climate model intercomparison project 6. Geosci. Model Dev. Discuss. 2021, 2021, 1–90. [Google Scholar]
- Volodin, E.M.; Mortikov, E.V.; Kostrykin, S.V.; Galin, V.Y.; Lykossov, V.N.; Gritsun, A.S.; Diansky, N.A.; Gusev, A.V.; Iakovlev, N.G.; Shestakova, A.A.; et al. Simulation of the modern climate using the INM-CM48 climate model. Russ. J. Numer. Anal. Math. 2018, 33, 367–374. [Google Scholar] [CrossRef]
- Volodin, E.; Gritsun, A. Simulation of observed climate changes in 1850–2014 with climate model INM-CM5. Earth Syst. Dyn. 2018, 9, 1235–1242. [Google Scholar] [CrossRef]
- Yukimoto, S.; Kawai, H.; Koshiro, T.; Oshima, N.; Yoshida, K.; Urakawa, S.; Tsujino, H.; Deushi, M.; Tanaka, T.; Hosaka, M.; et al. The Meteorological Research Institute Earth System Model version 2.0, MRI-ESM2. 0: Description and basic evaluation of the physical component. J. Meteorol. Soc. Jpn. Ser. II 2019, 97, 931–965. [Google Scholar] [CrossRef]
- Yukimoto, S.; Yoshimura, H.; Hosaka, M.; Sakami, T.; Tsujino, H.; Hirabara, M.; Tanaka, T.Y.; Deushi, M.; Obata, A.; Nakano, H.; et al. Meteorological research institute-earth system model version 1 (MRI-ESM1)-model description. Meteorol. Res. Inst. Tech. Rep. 2011, 64, 92. [Google Scholar]
- Seland, Ø.; Bentsen, M.; Olivié, D.; Toniazzo, T.; Gjermundsen, A.; Graff, L.S.; Debernard, J.B.; Gupta, A.K.; He, Y.-C.; Kirkevåg, A.; et al. Overview of the Norwegian Earth System Model (NorESM2) and key climate response of CMIP6 DECK, historical, and scenario simulations. Geosci. Model Dev. 2020, 13, 6165–6200. [Google Scholar] [CrossRef]
- Lee, W.L.; Wang, Y.C.; Shiu, C.J.; Tsai, I.c.; Tu, C.Y.; Lan, Y.Y.; Chen, J.P.; Pan, H.L.; Hsu, H.H. Taiwan Earth System Model Version 1: Description and evaluation of mean state. Geosci. Model Dev. 2020, 13, 3887–3904. [Google Scholar] [CrossRef]
- Piani, C.; Weedon, G.P.; Best, M.; Gomes, S.M.; Viterbo, P.; Hagemann, S.; Haerter, J.O. Statistical bias correction of global simulated daily precipitation and temperature for the application of hydrological models. J. Hydrol. 2010, 395, 199–215. [Google Scholar] [CrossRef]
- Ringard, J.; Seyler, F.; Linguet, L. PA quantile mapping bias correction method based on hydroclimatic classification of the Guiana Shield. Sensors 2017, 17, 1413. [Google Scholar] [CrossRef]
- Moses, O.; Blamey, R.; Reason, C. Extreme rainfall events over the Okavango river basin, southern Africa. Weather. Clim. Extrem. 2023, 41, 100589. [Google Scholar] [CrossRef]
- Weber, T.; Cabos, W.; Sein, D.V.; Jacob, D. Benefits of simulating precipitation characteristics over Africa with a regionally-coupled atmosphere–ocean model. Clim. Dyn. 2023, 60, 1079–1102. [Google Scholar] [CrossRef]
- Rouault, M.; Dieppois, B.; Tim, N.; Hünicke, B.; Zorita, E. Southern Africa Climate Over the Recent Decades: Description, Variability and Trends. In Sustainability of Southern African Ecosystems under Global Change: Science for Management and Policy Interventions; Springer: Berlin/Heidelberg, Germany, 2024; pp. 149–168. [Google Scholar]
- Gampe, D.; Ludwig, R. Evaluation of gridded precipitation data products for hydrological applications in complex topography. Hydrology 2017, 4, 53. [Google Scholar] [CrossRef]
- Gordon, N.D.; Shaykewich, J. Guidelines on Performance Assessment of Public Weather Services; World Meteorological Organization: Geneva, Switzerland, 2000. [Google Scholar]
- Enayati, M.; Bozorg-Haddad, O.; Bazrafshan, J.; Hejabi, S.; Chu, X. Bias correction capabilities of quantile mapping methods for rainfall and temperature variables. J. Water Clim. Chang. 2021, 12, 401–419. [Google Scholar] [CrossRef]
- Dasari, H.P.; Salgado, R.; Perdigao, J.; Challa, V.S. A regional climate simulation study using WRF-ARW model over Europe and evaluation for extreme temperature weather events. Int. J. Atmos. Sci. 2014, 2014, 704079. [Google Scholar] [CrossRef]
- Chen, J.; Li, G. Estimation of monthly mean solar radiation from air temperature in combination with other routinely observed meteorological data in Yangtze River basin in China. Meteorol. Appl. 2012, 10, 1002. [Google Scholar]
- Taylor, K.E. Summarizing multiple aspects of model performance in a single diagram. J. Geophys. Res. Atmos. 2001, 106, 7183–7192. [Google Scholar] [CrossRef]
- Wang, B.; Zheng, L.; Liu, D.L.; Ji, F.; Clark, A.; Yu, Q. Using multi-model ensembles of CMIP5 global climate models to reproduce observed monthly rainfall and temperature with machine learning methods in Australia. Int. J. Climatol. 2018, 38, 4891–4902. [Google Scholar] [CrossRef]
- Zhu, H.; Jiang, Z.; Li, J.; Li, W.; Sun, C.; Li, L. Does CMIP6 inspire more confidence in simulating climate extremes over China? Adv. Atmos. Sci. 2020, 37, 1119–1132. [Google Scholar] [CrossRef]
- Ayugi, B.; Zhihong, J.; Zhu, H.; Ngoma, H.; Babaousmail, H.; Rizwan, K.; Dike, V. Comparison of CMIP6 and CMIP5 models in simulating mean and extreme precipitation over East Africa. Int. J. Climatol. 2021, 41, 6474–6496. [Google Scholar] [CrossRef]
- Ahmed, K.; Sachindra, D.A.; Shahid, S.; Demirel, M.C.; Chung, E.S. Selection of multi-model ensemble of general circulation models for the simulation of precipitation and maximum and minimum temperature based on spatial assessment metrics. Hydrol. Earth Syst. Sci. 2019, 23, 4803–4824. [Google Scholar] [CrossRef]
- Chen, J.; Brissette, F.P.; Zhang, X.J.; Chen, H.; Guo, S.; Zhao, Y. Bias correcting climate model multi-member ensembles to assess climate change impacts on hydrology. Clim. Chang. 2019, 153, 361–377. [Google Scholar] [CrossRef]
- Oseni, B.A.; Ayoola, F.J. Fitting the Statistical Distribution for Daily Rainfall in Ibadan, Based On Chi-Square and Kolmogorov-Smirnov Goodness-Of-Fit Tests. West Afr. J. Ind. Acad. Res. 2013, 7, 93–100. [Google Scholar]
- Jury, M.R.; Parker, B.; Raholijao, N.; Nassor, A. Variability of summer rainfall over Madagascar: Climatic determinants at interannual scales. Int. J. Climatol. 1995, 15, 1323–1332. [Google Scholar] [CrossRef]
- Macron, C.; Richard, Y.; Garot, T.; Bessafi, M.; Pohl, B.; Ratiarison, A.; Razafindrabe, A. Intraseasonal rainfall variability over Madagascar. Mon. Weather. Rev. 2016, 144, 1877–1885. [Google Scholar] [CrossRef]
- Kalognomou, E.A.; Lennard, C.; Shongwe, M.; Pinto, I.; Favre, A.; Kent, M.; Hewitson, B.; Dosio, A.; Nikulin, G.; Panitz, H.J.; et al. A diagnostic evaluation of precipitation in CORDEX models over southern Africa. J. Clim. 2013, 26, 9477–9506. [Google Scholar] [CrossRef]
- Papadimitriou, L.V.; Koutroulis, A.G.; Grillakis, M.G.; Tsanis, I.K. High-end climate change impact on European runoff and low flows–exploring the effects of forcing biases. Hydrol. Earth Syst. Sci. 2016, 20, 1785–1808. [Google Scholar] [CrossRef]
- Maraun, D. Bias correction, quantile mapping, and downscaling: Revisiting the inflation issue. J. Clim. 2013, 26, 2137–2143. [Google Scholar] [CrossRef]
- Cannon, A.J.; Sobie, S.R.; Murdock, T.Q. Bias Correction of GCM Precipitation by Quantile Mapping: How Well Do Methods Preserve Changes in Quantiles and Extremes? J. Clim. 2015, 28, 6938–6959. [Google Scholar] [CrossRef]
- Vidrio-Sahagún, C.T.; He, J.; Pietroniro, A. Improved Correction of Extreme Precipitation through Explicit and Continuous Nonstationarity Treatment and the Metastatistical Approach. Water Resour. Res. 2025, 61, e2024WR037721. [Google Scholar] [CrossRef]
- Dosio, A.; Pinto, I.; Lennard, C.; Sylla, M.B.; Jack, C.; Nikulin, G. What can we know about recent past precipitation over Africa? Daily characteristics of African precipitation from a large ensemble of observational products for model evaluation. Earth Space Sci. 2021, 8, e2020EA001466. [Google Scholar] [CrossRef]
- Karypidou, M.C.; Katragkou, E.; Sobolowski, S.P. Precipitation over southern Africa: Is there consensus among global climate models (GCMs), regional climate models (RCMs) and observational data. Geosci. Model Dev. 2022, 15, 3387–3404. [Google Scholar] [CrossRef]
- Libanda, B.; Nkolola, N.B. Skill of CMIP5 models in simulating rainfall over Malawi. Model. Earth Syst. Environ. 2019, 5, 1615–1626. [Google Scholar] [CrossRef]
- Diallo, I.; Giorgi, F.; Sukumaran, S.; Stordal, F.; Giuliani, G. Evaluation of RegCM4 driven by CAM4 over Southern Africa: Mean climatology, interannual variability and daily extremes of wet season temperature and precipitation. Theor. Appl. Climatol. 2015, 121, 749–766. [Google Scholar] [CrossRef]
- Akinsanola, A.A.; Wenhaji, C.N.; Barimalala, R.; Monerie, P.-A.; Dixon, R.D.; Tamoffo, A.T.; Adeniyi, M.O.; Ongoma, V.; Diallo, I.; Gudoshava, M.; et al. Modeling of Precipitation over Africa: Progress, Challenges, and Prospects. Adv. Atmos. Sci. 2025, 1–28. [Google Scholar] [CrossRef]
- Barimalala, R.; Blamey, R.C.; Desbiolles, F.; Reason, C.J.C. The influence of southeastern African river valley jets on regional rainfall. Clim. Dyn. 2021, 57, 2905–2920. [Google Scholar] [CrossRef]
- Mishra, V.; Kumar, D.; Ganguly, A.R.; Sanjay, J.; Mujumdar, M.; Krishnan, R.; Shah, R.D. Reliability of regional and global climate models to simulate precipitation extremes over India. J. Geophys. Res. Atmos. 2014, 119, 9301–9323. [Google Scholar] [CrossRef]
- Agel, L.; Barlow, M. How well do CMIP6 historical runs match observed Northeast US Precipitation and extreme precipitation—Related circulation. J. Clim. 2020, 33, 9835–9848. [Google Scholar] [CrossRef]


| Model Name | Institution | Main Reference | Variant Label | Resolution () | Acronym |
|---|---|---|---|---|---|
| CESM2-WACCM | National Center for Atmospheric Research | Danabasoglu [42] | r1i1p1f1 | CESM2 | |
| CMCC-CM2-SR5 | Euro-Mediterranean Center for Climate Change (Italy) | Cherchi et al. [43] | r1i1p1f1 | CM2-SR5 | |
| CMCC-ESM2 | Euro-Mediterranean Center for Climate Change (Italy) | Fogli et al. [44] | r1i1p1f1 | CMCC-ESM2 | |
| EC-Earth3 | EC-Earth Consortium (Europe) | Döscher et al. [45] | r1i1p1f1 | Earth3 | |
| EC-Earth3 -Veg | EC-Earth Consortium (Europe) | Döscher et al. [45] | r1i1p1f1 | Earth3-Veg | |
| INM-CM4 -8 | Institute for Numerical Mathematics (Rus.) | Volodin et al. [46] | r1i1p1f1 | INM-CM4 | |
| INM-CM5 -0 | Institute for Numerical Mathematics (Rus.) | Volodin and Gritsun [47] | r1i1p1f1 | INM-CM5 | |
| MPI-ESM1 -2-HR | Max Planck Institute for Meteo. (Germany) | Yukimoto et al. [48] | r1i1p1f1 | MPI-ESM1 | |
| MRI-ESM2 -0 | Meteorological Research Institute (Japan) | Yukimoto et al. [49] | r1i1p1f1 | MRI-ESM2 | |
| NorESM2-MM | Norwegian Climate Centre, Norway | Seland et al. [50] | r1i1p1f1 | NorESM2 | |
| TaiESM1 | Research Center for Environmental Changes (Taiwan) | Lee et al. [51] | r1i1p1f1 | TaiESM1 |
| Model Name | Raw-GCM | QDM95 | QDM | SDM | ||||||||
|---|---|---|---|---|---|---|---|---|---|---|---|---|
| h = 0 | h = 1 | K-S | h = 0 | h = 1 | K-S | h = 0 | h = 1 | K-S | h = 0 | h = 1 | K-S | |
| (%) | (%) | (%) | (%) | (%) | (%) | (%) | (%) | |||||
| CESM2 | 34 | 66 | 0.2692 | 63 | 37 | 0.2584 | 89 | 11 | 0.2457 | 66 | 34 | 0.2489 |
| CM2-SR5 | 32 | 68 | 0.2725 | 48 | 52 | 0.2550 | 85 | 15 | 0.2408 | 63 | 37 | 0.2478 |
| CMCC-ESM2 | 31 | 69 | 0.2711 | 50 | 50 | 0.2549 | 85 | 15 | 0.2381 | 63 | 37 | 0.2580 |
| Earth3 | 40 | 60 | 0.2555 | 62 | 38 | 0.2472 | 76 | 24 | 0.2398 | 77 | 23 | 0.2494 |
| Earth3-Veg | 40 | 60 | 0.2539 | 62 | 38 | 0.2476 | 79 | 21 | 0.2402 | 76 | 24 | 0.2492 |
| INM-CM4 | 43 | 57 | 0.2643 | 57 | 43 | 0.2543 | 91 | 9 | 0.2345 | 74 | 26 | 0.2422 |
| INM-CM5 | 43 | 57 | 0.2660 | 62 | 38 | 0.2516 | 93 | 7 | 0.2319 | 77 | 23 | 0.2368 |
| MPI-ESM1 | 29 | 71 | 0.2930 | 55 | 45 | 0.2509 | 73 | 27 | 0.2431 | 71 | 29 | 0.2437 |
| MRI-ESM2 | 34 | 66 | 0.2828 | 56 | 44 | 0.2593 | 71 | 29 | 0.2509 | 73 | 27 | 0.2483 |
| NorESM2 | 34 | 66 | 0.2696 | 51 | 49 | 0.2522 | 73 | 27 | 0.2456 | 81 | 19 | 0.2460 |
| TaiESM1 | 36 | 64 | 0.2679 | 57 | 43 | 0.2537 | 88 | 12 | 0.2410 | 74 | 26 | 0.2462 |
| MME | 33 | 67 | 0.3059 | 71 | 29 | 0.2657 | 70 | 30 | 0.2724 | 65 | 35 | 0.2872 |
| Model Name | Bias Uncorrected and Corrected | Seas. Mean (mm/Month) | MB (mm/Month) | RMSE (mm/Month) | R | Stdv (mm/Month) | Mean Ratio | TSS |
|---|---|---|---|---|---|---|---|---|
| CHIRPS (obs.) | 165.47 | 0 | 0 | 1 | 80.21 | 1 | ||
| CESM2 | Raw-GCM | 230.11 | 64.59 | 82.08 | 0.760 | 84.21 | 1.04 | 0.60 |
| QDM95 | 157.86 | −7.46 | 26.68 | 0.980 | 58.77 | 0.73 | 0.86 | |
| QDM | 158.10 | −7.60 | 26.18 | 0.978 | 59.07 | 0.73 | 0.87 | |
| SDM | 152.60 | −12.52 | 28.77 | 0.979 | 57.65 | 0.71 | 0.86 | |
| CM2-SR5 | Raw-GCM | 254.69 | 89.22 | 98.24 | 0.833 | 96.01 | 1.19 | 0.68 |
| QDM95 | 155.73 | −9.73 | 19.92 | 0.978 | 67.07 | 0.84 | 0.93 | |
| QDM | 159.41 | −6.05 | 16.32 | 0.978 | 69.12 | 0.86 | 0.94 | |
| SDM | 163.413 | −2.34 | 20.72 | 0.978 | 64.47 | 0.80 | 0.91 | |
| CMCC-ESM2 | Raw-GCM | 251.91 | 86.44 | 94.29 | 0.848 | 97.08 | 1.21 | 0.70 |
| QDM95 | 156.85 | −8.61 | 19.28 | 0.984 | 66.86 | 0.83 | 0.94 | |
| QDM | 161.10 | −4.36 | 15.32 | 0.979 | 70.61 | 0.88 | 0.95 | |
| SDM | 151.57 | −13.89 | 29.53 | 0.984 | 58.13 | 0.72 | 0.87 | |
| Earth3 | Raw-GCM | 248.14 | 82.67 | 86.50 | 0.893 | 83.21 | 1.03 | 0.80 |
| QDM95 | 158.44 | −7.02 | 18.95 | 0.987 | 64.51 | 0.80 | 0.93 | |
| QDM | 166.06 | 0.59 | 10.94 | 0.978 | 71.71 | 0.89 | 0.95 | |
| SDM | 162.34 | −3.12 | 16.85 | 0.984 | 66.59 | 0.83 | 0.94 | |
| Earth3-Veg | Raw-GCM | 248.62 | 83.15 | 87.51 | 0.885 | 78.91 | 0.98 | 0.79 |
| QDM95 | 158.19 | −7.27 | 22.73 | 0.985 | 60.69 | 0.75 | 0.90 | |
| QDM | 165.86 | 0.39 | 14.60 | 0.983 | 67.03 | 0.83 | 0.94 | |
| SDM | 161.13 | −4.33 | 16.85 | 0.987 | 66.13 | 0.82 | 0.94 | |
| INM-CM4 | Raw-GCM | 262.85 | 97.38 | 103.44 | 0.868 | 108.16 | 1.35 | 0.69 |
| QDM95 | 154.74 | −10.72 | 34.51 | 0.976 | 52.86 | 0.65 | 0.80 | |
| QDM | 153.19 | −12.27 | 34.52 | 0.977 | 53.30 | 0.66 | 0.82 | |
| SDM | 163.95 | −1.51 | 28.93 | 0.972 | 55.25 | 0.68 | 0.82 | |
| INM-CM5 | Raw-GCM | 288.76 | 123.29 | 128.11 | 0.856 | 96.62 | 1.20 | 0.71 |
| QDM95 | 157.20 | −8.26 | 32.82 | 0.970 | 53.14 | 0.66 | 0.79 | |
| QDM | 155.41 | −10.05 | 32.49 | 0.969 | 54.36 | 0.67 | 0.81 | |
| SDM | 153.25 | −12.21 | 35.60 | 0.976 | 52.01 | 0.64 | 0.79 | |
| MPI-ESM1 | Raw-GCM | 188.24 | 22.77 | 49.30 | 0.741 | 74.44 | 0.93 | 0.57 |
| QDM95 | 159.84 | −5.62 | 21.45 | 0.984 | 63.44 | 0.79 | 0.92 | |
| QDM | 166.23 | 0.76 | 18.71 | 0.982 | 64.64 | 0.81 | 0.92 | |
| SDM | 169.17 | 3.70 | 18.39 | 0.982 | 65.35 | 0.82 | 0.93 | |
| MRI-ESM2 | Raw-GCM | 221.12 | 55.65 | 65.86 | 0.798 | 79.67 | 0.99 | 0.65 |
| QDM95 | 158.18 | −7.28 | 25.71 | 0.980 | 59.75 | 0.75 | 0.88 | |
| QDM | 161.01 | −4.42 | 22.45 | 0.976 | 61.67 | 0.77 | 0.89 | |
| SDM | 164.92 | −3.54 | 22.09 | 0.982 | 61.48 | 0.77 | 0.90 | |
| NorESM2 | Raw-GCM | 199.95 | 34.48 | 45.16 | 0.870 | 83.50 | 1.04 | 0.76 |
| QDM95 | 157.53 | −7.93 | 23.76 | 0.981 | 60.97 | 0.76 | 0.89 | |
| QDM | 156.97 | −8.49 | 22.94 | 0.980 | 62.40 | 0.78 | 0.90 | |
| SDM | 154.88 | −10.58 | 25.19 | 0.981 | 62.55 | 0.78 | 0.91 | |
| TaiESM1 | Raw-GCM | 238.49 | 73.02 | 82.95 | 0.832 | 88.30 | 1.11 | 0.70 |
| QDM95 | 150.32 | −15.14 | 31.57 | 0.979 | 57.39 | 0.72 | 0.86 | |
| QDM | 153.87 | −11.59 | 27.79 | 0.973 | 60.02 | 0.75 | 0.87 | |
| SDM | 163.05 | −2.41 | 22.40 | 0.967 | 63.88 | 0.79 | 0.89 | |
| MME | Raw-GCM | 239.35 | 73.88 | 83.95 | 0.835 | 88.19 | 1.09 | 0.70 |
| QDM95 | 156.81 | −8.65 | 25.22 | 0.980 | 60.50 | 0.75 | 0.88 | |
| QDM | 159.74 | −5.72 | 22.03 | 0.978 | 63.08 | 0.77 | 0.90 | |
| SDM | 159.76 | −5.70 | 24.11 | 0.979 | 61.22 | 0.76 | 0.89 |
| Model Name | Bias Uncorrected and Corrected | Seas. Mean (mm/Month) | MB (mm/Month) | RMSE (mm/Month) | R | Stdv (mm/Month) | Mean Ratio | TSS |
|---|---|---|---|---|---|---|---|---|
| GPCC (obs.) | 163.65 | 0 | 0 | 1 | 78.51 | 1 | ||
| CESM2 | Raw-GCM | 229.94 | 66.28 | 84.12 | 0.744 | 84.67 | 1.07 | 0.57 |
| QDM95 | 157.72 | −5.92 | 24.59 | 0.955 | 58.69 | 0.75 | 0.84 | |
| QDM | 157.86 | −5.79 | 24.78 | 0.944 | 58.98 | 0.75 | 0.82 | |
| SDM | 152.81 | −10.84 | 26.27 | 0.962 | 57.56 | 0.73 | 0.84 | |
| CM2-SR5 | Raw-GCM | 254.64 | 90.98 | 100.55 | 0.836 | 96.48 | 1.22 | 0.68 |
| QDM95 | 155.57 | −8.07 | 21.02 | 0.964 | 66.97 | 0.85 | 0.91 | |
| QDM | 159.26 | −4.39 | 18.70 | 0.959 | 69.05 | 0.87 | 0.91 | |
| SDM | 162.99 | −0.66 | 20.65 | 0.953 | 64.40 | 0.82 | 0.87 | |
| CMCC-ESM2 | Raw-GCM | 251.84 | 88.19 | 96.74 | 0.844 | 97.51 | 1.24 | 0.69 |
| QDM95 | 156.69 | −6.96 | 19.50 | 0.967 | 66.71 | 0.85 | 0.91 | |
| QDM | 160.48 | −2.71 | 17.51 | 0.955 | 70.48 | 0.90 | 0.90 | |
| SDM | 151.44 | −11.21 | 27.13 | 0.960 | 58.05 | 0.74 | 0.84 | |
| Earth3 | Raw-GCM | 248.88 | 85.23 | 90.60 | 0.870 | 83.91 | 1.06 | 0.76 |
| QDM95 | 158.83 | −4.81 | 16.82 | 0.961 | 64.78 | 0.83 | 0.89 | |
| QDM | 166.48 | 2.83 | 13.02 | 0.952 | 72.00 | 0.92 | 0.90 | |
| SDM | 162.59 | −2.22 | 15.10 | 0.958 | 66.84 | 0.85 | 0.89 | |
| Earth3-Veg | Raw-GCM | 249.19 | 85.53 | 91.31 | 0.859 | 79.75 | 1.01 | 0.75 |
| QDM95 | 158.41 | −5.24 | 20.04 | 0.955 | 60.92 | 0.78 | 0.86 | |
| QDM | 166.48 | 2.44 | 15.11 | 0.951 | 67.28 | 0.86 | 0.88 | |
| SDM | 162.59 | −2.22 | 14.96 | 0.958 | 66.36 | 0.85 | 0.89 | |
| INM-CM4 | Raw-GCM | 262.52 | 98.86 | 106.70 | 0.868 | 108.38 | 1.38 | 0.69 |
| QDM95 | 154.74 | −8.91 | 32.37 | 0.971 | 52.86 | 0.67 | 0.81 | |
| QDM | 153.19 | −10.45 | 32.22 | 0.973 | 53.30 | 0.68 | 0.82 | |
| SDM | 163.905 | 0.29 | 27.58 | 0.966 | 55.25 | 0.70 | 0.83 | |
| INM-CM5 | Raw-GCM | 288.29 | 124.64 | 130.53 | 0.853 | 96.76 | 1.20 | 0.71 |
| QDM95 | 157.20 | −6.44 | 29.89 | 0.966 | 53.14 | 0.68 | 0.80 | |
| QDM | 155.41 | −8.24 | 29.87 | 0.961 | 54.36 | 0.69 | 0.81 | |
| SDM | 153.25 | −10.40 | 33.46 | 0.974 | 52.01 | 0.66 | 0.80 | |
| MPI-ESM1 | Raw-GCM | 188.79 | 25.14 | 52.67 | 0.725 | 74.77 | 0.95 | 0.55 |
| QDM95 | 159.71 | −3.93 | 19.55 | 0.964 | 63.15 | 0.80 | 0.89 | |
| QDM | 166.09 | 2.43 | 18.62 | 0.958 | 64.26 | 0.82 | 0.88 | |
| SDM | 169.07 | 5.42 | 18.62 | 0.956 | 65.08 | 0.83 | 0.88 | |
| MRI-ESM2 | Raw-GCM | 220.86 | 57.21 | 68.55 | 0.774 | 79.90 | 1.01 | 0.62 |
| QDM95 | 158.08 | −5.56 | 22.71 | 0.958 | 59.72 | 0.76 | 0.85 | |
| QDM | 160.95 | −2.69 | 20.14 | 0.953 | 61.65 | 0.79 | 0.86 | |
| SDM | 161.82 | −1.82 | 19.31 | 0.961 | 61.44 | 0.78 | 0.87 | |
| NorESM2 | Raw-GCM | 200.04 | 36.39 | 48.51 | 0.861 | 83.94 | 1.06 | 0.75 |
| QDM95 | 157.39 | −6.25 | 22.39 | 0.961 | 60.90 | 0.78 | 0.87 | |
| QDM | 156.84 | −6.80 | 22.33 | 0.958 | 62.34 | 0.79 | 0.87 | |
| SDM | 154.72 | −8.92 | 24.65 | 0.960 | 62.42 | 0.78 | 0.88 | |
| TaiESM1 | Raw-GCM | 238.22 | 74.57 | 85.08 | 0.830 | 88.59 | 1.13 | 0.69 |
| QDM95 | 150.18 | −13.46 | 29.46 | 0.956 | 57.28 | 0.73 | 0.83 | |
| QDM | 153.74 | −9.90 | 26.28 | 0.945 | 59.92 | 0.76 | 0.83 | |
| SDM | 162.89 | −0.76 | 22.18 | 0.946 | 63.77 | 0.81 | 0.86 | |
| MME | Raw-GCM | 239.38 | 75.73 | 86.85 | 0.824 | 88.61 | 1.12 | 0.68 |
| QDM95 | 156.78 | −6.87 | 23.49 | 0.962 | 60.47 | 0.77 | 0.86 | |
| QDM | 159.71 | −3.93 | 21.69 | 0.955 | 63.06 | 0.80 | 0.86 | |
| SDM | 159.72 | −3.92 | 22.72 | 0.959 | 61.20 | 0.78 | 0.86 |
| Model Name | Bias Uncorrected and Corrected | Seas. Mean (mm/Month) | MB (mm/Month) | RMSE (mm/Month) | R | Stdv (mm/Month) | Mean Ratio | TSS |
|---|---|---|---|---|---|---|---|---|
| CRU (obs.) | 165.56 | 0 | 0 | 1 | 77.60 | 1 | ||
| CESM2 | Raw-GCM | 230.11 | 64.21 | 80.57 | 0.760 | 84.21 | 1.07 | 0.57 |
| QDM95 | 157.86 | −7.86 | 23.79 | 0.980 | 58.77 | 0.75 | 0.84 | |
| QDM | 158.10 | −7.72 | 23.67 | 0.978 | 59.07 | 0.75 | 0.83 | |
| SDM | 152.60 | −12.73 | 26.11 | 0.979 | 57.65 | 0.74 | 0.84 | |
| CM2-SR5 | Raw-GCM | 254.69 | 88.69 | 97.15 | 0.833 | 96.01 | 1.21 | 0.68 |
| QDM95 | 155.73 | −10.02 | 19.62 | 0.978 | 67.07 | 0.86 | 0.90 | |
| QDM | 159.41 | −6.37 | 16.64 | 0.978 | 69.12 | 0.88 | 0.90 | |
| SDM | 163.413 | −2.64 | 18.19 | 0.978 | 64.47 | 0.82 | 0.88 | |
| CMCC-ESM2 | Raw-GCM | 251.91 | 85.81 | 93.225 | 0.848 | 97.08 | 1.23 | 0.70 |
| QDM95 | 156.85 | −8.89 | 18.16 | 0.984 | 66.86 | 0.85 | 0.91 | |
| QDM | 161.10 | −4.64 | 15.34 | 0.979 | 70.61 | 0.90 | 0.91 | |
| SDM | 151.57 | −14.16 | 26.93 | 0.984 | 58.13 | 0.74 | 0.85 | |
| Earth3 | Raw-GCM | 248.14 | 82.00 | 86.45 | 0.893 | 83.21 | 1.05 | 0.75 |
| QDM95 | 158.44 | −7.11 | 17.17 | 0.987 | 64.51 | 0.83 | 0.89 | |
| QDM | 166.06 | 0.49 | 10.76 | 0.978 | 71.71 | 0.92 | 0.90 | |
| SDM | 162.34 | −3.22 | 14.19 | 0.984 | 66.59 | 0.85 | 0.90 | |
| Earth3-Veg | Raw-GCM | 248.62 | 87.20 | 87.51 | 0.885 | 78.91 | 1.00 | 0.74 |
| QDM95 | 158.19 | −7.36 | 20.22 | 0.985 | 60.69 | 0.78 | 0.86 | |
| QDM | 165.86 | 0.29 | 12.92 | 0.983 | 67.03 | 0.86 | 0.89 | |
| SDM | 161.13 | −4.39 | 14.53 | 0.987 | 66.13 | 0.85 | 0.90 | |
| INM-CM4 | Raw-GCM | 262.85 | 96.60 | 103.57 | 0.868 | 108.16 | 1.38 | 0.71 |
| QDM95 | 154.74 | −10.82 | 32.83 | 0.976 | 52.86 | 0.68 | 0.81 | |
| QDM | 153.19 | −12.36 | 32.91 | 0.977 | 53.30 | 0.68 | 0.82 | |
| SDM | 163.95 | −1.61 | 27.75 | 0.972 | 55.25 | 0.71 | 0.83 | |
| INM-CM5 | Raw-GCM | 288.76 | 122.78 | 127.67 | 0.856 | 96.62 | 1.23 | 0.73 |
| QDM95 | 157.20 | −8.35 | 30.67 | 0.970 | 53.14 | 0.68 | 0.81 | |
| QDM | 155.41 | −10.15 | 30.78 | 0.969 | 54.36 | 0.70 | 0.82 | |
| SDM | 153.25 | −12.31 | 33.92 | 0.976 | 52.01 | 0.67 | 0.81 | |
| MPI-ESM1 | Raw-GCM | 188.24 | 22.31 | 47.98 | 0.741 | 74.44 | 0.94 | 0.54 |
| QDM95 | 159.84 | −5.68 | 18.99 | 0.984 | 63.44 | 0.81 | 0.88 | |
| QDM | 166.23 | 0.68 | 16.67 | 0.982 | 64.64 | 0.83 | 0.88 | |
| SDM | 169.17 | 3.66 | 16.54 | 0.982 | 65.35 | 0.84 | 0.89 | |
| MRI-ESM2 | Raw-GCM | 221.12 | 55.50 | 65.45 | 0.798 | 79.67 | 1.02 | 0.62 |
| QDM95 | 158.18 | −7.43 | 22.73 | 0.980 | 59.75 | 0.76 | 0.86 | |
| QDM | 161.01 | −4.58 | 19.60 | 0.976 | 61.67 | 0.79 | 0.87 | |
| SDM | 164.92 | −3.66 | 18.94 | 0.982 | 61.48 | 0.79 | 0.88 | |
| NorESM2 | Raw-GCM | 199.95 | 34.07 | 44.29 | 0.870 | 83.50 | 1.06 | 0.74 |
| QDM95 | 157.53 | −8.21 | 21.47 | 0.981 | 60.97 | 0.78 | 0.87 | |
| QDM | 156.97 | −8.74 | 21.13 | 0.980 | 62.40 | 0.80 | 0.86 | |
| SDM | 154.88 | −10.88 | 23.64 | 0.981 | 62.55 | 0.80 | 0.87 | |
| TaiESM1 | Raw-GCM | 238.49 | 72.46 | 81.435 | 0.832 | 88.30 | 1.12 | 0.70 |
| QDM95 | 150.32 | −15.37 | 28.91 | 0.979 | 57.39 | 0.73 | 0.84 | |
| QDM | 153.87 | −11.83 | 25.11 | 0.973 | 60.02 | 0.77 | 0.84 | |
| SDM | 163.05 | −2.70 | 20.42 | 0.967 | 63.88 | 0.82 | 0.86 | |
| MME | Raw-GCM | 239.35 | 73.36 | 83.18 | 0.835 | 88.19 | 1.12 | 0.68 |
| QDM95 | 156.81 | −8.83 | 23.14 | 0.980 | 60.50 | 0.77 | 0.86 | |
| QDM | 159.74 | −5.90 | 20.50 | 0.978 | 63.08 | 0.81 | 0.87 | |
| SDM | 159.76 | −5.87 | 21.92 | 0.979 | 61.22 | 0.78 | 0.86 |
| Model | Bias Correction | CHIRPS | GPCC | CRU | |||
|---|---|---|---|---|---|---|---|
| MR | Rank | MR | Rank | MR | Rank | ||
| CESM2 | Raw-GCM | 0.08 | 39 | 0.08 | 37 | 0.07 | 39 |
| QDM95 | 0.35 | 27 | 0.37 | 27 | 0.33 | 26 | |
| QDM | 0.43 | 25 | 0.38 | 26 | 0.38 | 24 | |
| SDM | 0.33 | 28 | 0.33 | 29 | 0.35 | 25 | |
| MBCE | 0.35 | 27 | 0.36 | 28 | 0.35 | 25 | |
| CM2-SR5 | Raw-GCM | 0.03 | 41 | 0.04 | 39 | 0.03 | 40 |
| QDM95 | 0.83 | 6 | 0.93 | 3 | 0.87 | 4 | |
| QDM | 0.85 | 5 | 0.89 | 4 | 0.83 | 8 | |
| SDM | 0.62 | 16 | 0.60 | 17 | 0.63 | 14 | |
| MBCE | 0.78 | 10 | 0.82 | 8 | 0.79 | 9 | |
| CMCC-ESM2 | Raw-GCM | 0.08 | 39 | 0.08 | 40 | 0.08 | 38 |
| QDM95 | 0.95 | 2 | 0.98 | 1 | 0.97 | 2 | |
| QDM | 0.98 | 1 | 0.95 | 2 | 0.98 | 1 | |
| SDM | 0.39 | 26 | 0.41 | 25 | 0.40 | 23 | |
| MBCE | 0.82 | 7 | 0.83 | 7 | 0.84 | 7 | |
| Earth3 | Raw-GCM | 0.13 | 36 | 0.12 | 38 | 0.12 | 35 |
| QDM95 | 0.80 | 8 | 0.81 | 9 | 0.78 | 10 | |
| QDM | 0.98 | 1 | 0.93 | 3 | 0.95 | 3 | |
| SDM | 0.79 | 9 | 0.78 | 11 | 0.81 | 8 | |
| MBCE | 0.88 | 3 | 0.86 | 6 | 0.86 | 6 | |
| Earth3-Veg | Raw-GCM | 0.10 | 37 | 0.09 | 36 | 0.10 | 36 |
| QDM95 | 0.55 | 19 | 0.48 | 23 | 0.48 | 20 | |
| QDM | 0.86 | 4 | 0.79 | 10 | 0.87 | 5 | |
| SDM | 0.86 | 4 | 0.82 | 8 | 0.84 | 7 | |
| MBCE | 0.76 | 11 | 0.71 | 12 | 0.74 | 11 | |
| INM-CM4 | Raw-GCM | 0.08 | 39 | 0.08 | 37 | 0.08 | 37 |
| QDM95 | 0.26 | 32 | 0.26 | 32 | 0.26 | 31 | |
| QDM | 0.29 | 29 | 0.30 | 30 | 0.30 | 28 | |
| SDM | 0.28 | 30 | 0.28 | 31 | 0.31 | 27 | |
| MBCE | 0.28 | 30 | 0.28 | 31 | 0.29 | 29 | |
| INM-CM5 | Raw-GCM | 0.05 | 40 | 0.06 | 38 | 0.07 | 39 |
| QDM95 | 0.21 | 34 | 0.21 | 33 | 0.20 | 34 | |
| QDM | 0.27 | 31 | 0.28 | 30 | 0.28 | 30 | |
| SDM | 0.18 | 35 | 0.20 | 34 | 0.21 | 33 | |
| MBCE | 0.23 | 33 | 0.23 | 31 | 0.22 | 32 | |
| MPI-ESM1 | Raw-GCM | 0.09 | 38 | 0.08 | 37 | 0.08 | 38 |
| QDM95 | 0.85 | 5 | 0.93 | 3 | 0.92 | 4 | |
| QDM | 0.86 | 4 | 0.88 | 5 | 0.87 | 5 | |
| SDM | 0.68 | 14 | 0.58 | 18 | 0.63 | 14 | |
| MBCE | 0.80 | 8 | 0.82 | 8 | 0.81 | 8 | |
| MRI-ESM2 | Raw-GCM | 0.09 | 38 | 0.09 | 36 | 0.09 | 37 |
| QDM95 | 0.53 | 21 | 0.53 | 21 | 0.59 | 16 | |
| QDM | 0.61 | 17 | 0.59 | 18 | 0.66 | 12 | |
| SDM | 0.64 | 15 | 0.67 | 14 | 0.64 | 13 | |
| MBCE | 0.58 | 17 | 0.63 | 16 | 0.60 | 15 | |
| NorESM2 | Raw-GCM | 0.23 | 33 | 0.22 | 32 | 0.21 | 33 |
| QDM95 | 0.48 | 24 | 0.54 | 20 | 0.51 | 19 | |
| QDM | 0.68 | 14 | 0.68 | 13 | 0.66 | 12 | |
| SDM | 0.64 | 15 | 0.68 | 13 | 0.64 | 13 | |
| MBCE | 0.59 | 17 | 0.63 | 16 | 0.60 | 15 | |
| TaiESM1 | Raw-GCM | 0.13 | 36 | 0.13 | 35 | 0.13 | 34 |
| QDM95 | 0.42 | 26 | 0.47 | 24 | 0.44 | 22 | |
| QDM | 0.58 | 18 | 0.56 | 19 | 0.56 | 17 | |
| SDM | 0.50 | 23 | 0.51 | 22 | 0.48 | 20 | |
| MBCE | 0.50 | 23 | 0.51 | 22 | 0.48 | 20 | |
| MME | Raw-GCM | 0.10 | 37 | 0.08 | 37 | 0.08 | 37 |
| QDM95 | 0.51 | 22 | 0.53 | 21 | 0.51 | 19 | |
| QDM | 0.70 | 13 | 0.64 | 15 | 0.64 | 13 | |
| SDM | 0.43 | 25 | 0.44 | 25 | 0.45 | 21 | |
| MBCE | 0.54 | 20 | 0.53 | 21 | 0.53 | 18 | |
Disclaimer/Publisher’s Note: The statements, opinions and data contained in all publications are solely those of the individual author(s) and contributor(s) and not of MDPI and/or the editor(s). MDPI and/or the editor(s) disclaim responsibility for any injury to people or property resulting from any ideas, methods, instructions or products referred to in the content. |
© 2025 by the authors. Licensee MDPI, Basel, Switzerland. This article is an open access article distributed under the terms and conditions of the Creative Commons Attribution (CC BY) license (https://creativecommons.org/licenses/by/4.0/).
Share and Cite
Addisuu, A.A.; Mengistu Tsidu, G.; Basupi, L.V. Improving Daily CMIP6 Precipitation in Southern Africa Through Bias Correction—Part 1: Spatiotemporal Characteristics. Climate 2025, 13, 95. https://doi.org/10.3390/cli13050095
Addisuu AA, Mengistu Tsidu G, Basupi LV. Improving Daily CMIP6 Precipitation in Southern Africa Through Bias Correction—Part 1: Spatiotemporal Characteristics. Climate. 2025; 13(5):95. https://doi.org/10.3390/cli13050095
Chicago/Turabian StyleAddisuu, Amarech Alebie, Gizaw Mengistu Tsidu, and Lenyeletse Vincent Basupi. 2025. "Improving Daily CMIP6 Precipitation in Southern Africa Through Bias Correction—Part 1: Spatiotemporal Characteristics" Climate 13, no. 5: 95. https://doi.org/10.3390/cli13050095
APA StyleAddisuu, A. A., Mengistu Tsidu, G., & Basupi, L. V. (2025). Improving Daily CMIP6 Precipitation in Southern Africa Through Bias Correction—Part 1: Spatiotemporal Characteristics. Climate, 13(5), 95. https://doi.org/10.3390/cli13050095