Abstract
This study analyzes winds over the Red Sea (17 N, 39.5 E) and consequences for the northeast African climate in early summer (May–July). As the Indian SW monsoon commences, NNW winds > 6 m/s are channeled over the Red Sea between 2000 m highlands, forming a low-level jet. Although sea surface temperatures of 30C instill evaporation of 8 mm/day and surface humidity of 20 g/kg, the air mass above the marine layer is dry and dusty (6 g/kg, 100 µg/m3). Land–sea temperature gradients drive afternoon sea breezes and orographic rainfall (~4 mm/day) that accumulate soil moisture in support of short-cycle crops such as teff. Statistical analyses of satellite and reanalysis datasets are employed to reveal the mesoscale structure and temporal response of NE African climate to marine winds via air chemistry data alongside the meteorological elements. The annual cycle of dewpoint temperature often declines from 12C to 4C during the Indian SW monsoon onset, followed by dusty NNW winds over the Red Sea. Consequences of a 14 m/s wind surge in June 2015 are documented via analysis of satellite and meteorological products. Moist convection was stunted, according to Cloudsat reflectivity, creating a dry-east/moist-west gradient over NE Africa (13–14.5 N, 38.5–40 E). Diurnal cycles are studied via hourly data and reveal little change for advected dust and moisture but large amplitude for local heat fluxes. Inter-annual fluctuations of early summer rainfall depend on airflows from the Red Sea in response to regional gradients in air pressure and temperature and the SW monsoon over the Arabian Sea. Lag correlation suggests that stronger NNW winds herald the onset of Pacific El Nino.
1. Introduction
The 2000 km long × 200 km wide Red Sea forms part of the East African Rift Valley from the Sinai Peninsula (28 N) to the Gulf of Aden (12 N). During winter, an SSE wind prevails over the southern Red Sea, whereas in summer, a persistent NNW wind blows along the entire length [1,2], being drawn by the Indian SW monsoon [3] according to numerical simulations. Coastal mountains > 2000 m channel inflow to the Red Sea from the Mediterranean, with gaps along the coast such as Tokar [4,5,6,7]. Further south over the Gulf of Aden, the Red Sea outflow joins the cross-equatorial Somali Jet, located between coastal upwelling and atmospheric subsidence [8]. The intensity of NNW winds over the Red Sea are attributed to air pressure gradients between the southern subtropics and equatorial trough [9,10,11,12]. As the Indian SW monsoon strengthens in May–July, NNW winds over the Red Sea are channeled into a low-level jet [13,14] that disperses Saharan and Arabian Desert dust into orographic clouds along the escarpment. This narrow circulation accelerates with a trough to the east (Asia) and a ridge to the west (Africa).
NNW winds over the Red Sea during the May–July season are the focus of research here. We seek to understand the patterns and variability in a wider context and describe impacts on the northeast (NE) African climate in early summer. To quantify how the Indian SW monsoon draws airflow from the Red Sea into a dry, dusty, low-level jet, mesoscale features are studied, and a temporal index is generated for statistical analysis. Our scope includes annual cycling, synoptic weather pulsing, local diurnal cycles, and year-to-year fluctuations across a region that extends from Africa to India. The main objective is to link NNW airflow that is channeled over the Red Sea to climate and weather conditions over NE Africa and to reveal regional and local forcing and consequences.
2. Data Analysis
Data used to study the Red Sea winds and the NE African highland climate derive from CFS2, ERA5, and Merra2 reanalyses. Environmental parameters include winds, vertical motion, air pressure, air temperature, humidity, actual and potential evaporation (via surface heat fluxes), and surface dewpoint temperature from 1980 to 2023. Carbon monoxide, dust aerosols, rainfall, sea surface temperature (SST), net outgoing longwave radiation (OLR), land surface temperature, and vegetation color (fraction) are derived from multi-satellite reanalysis 2000–2023. The temporal resolution is hourly, daily, and seasonal. Table 1 lists the datasets, acronyms, resolution, and references that cover data validation, for example, de-clouding procedures. The length of record needed for robust statistical inferences naturally declines with shorter time-interval datasets. Most spatial analyses were performed with online resources listed in the acknowledgments.

Table 1.
Details of datasets employed; validations are covered by references.
Averages were calculated for May–July 2000–2023 and for May–July 2015 to study mesoscale structure over the area 12–20 N, 36–44 E. Time series were extracted over the Red Sea and NE Africa, shown in Figure 1a and Figure 2a. The marine point is where NNW winds lift toward Ethiopia: 925 hPa, 17 N, 39.5 E; the terrestrial point is over Tigray (pop. 6 M): 850 hPa, 13–14.5 N, 38.5–40 E. A variety of datasets are employed according to the available parameters and space-time resolution: Merra2—regional structure, ERA5—Red Sea wind, CFS2—diurnal heat fluxes, and satellite—mesoscale features. Near-surface winds are analyzed from the 1000 to 925 hPa layer-averaged sigma-level vector components that float over the topography.
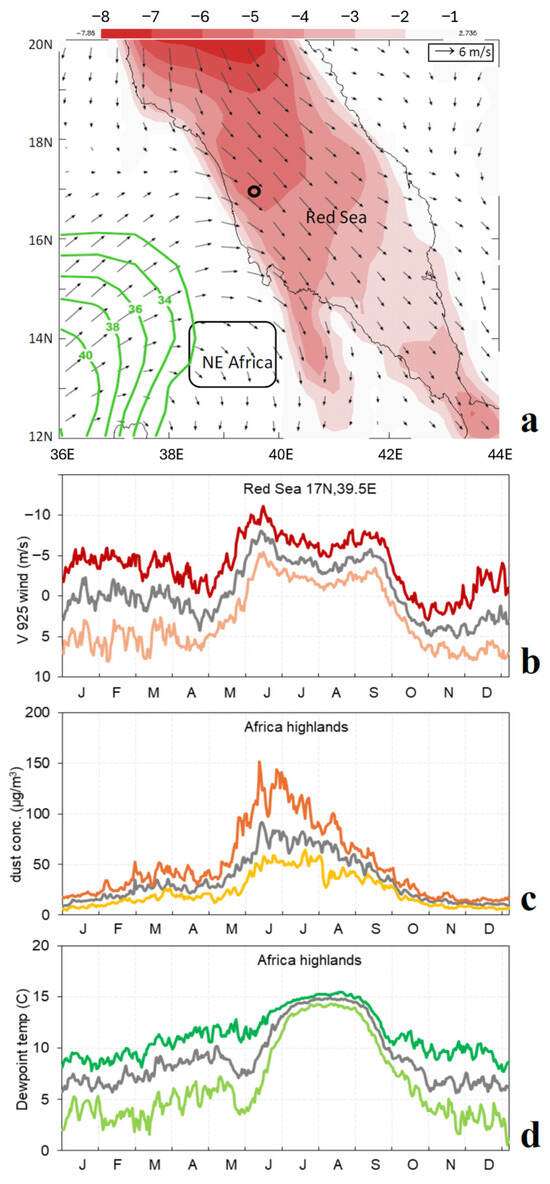
Figure 1.
(a) The 2000–2023 average Merra2 May–July 1000–925 hPa equivalent sigma-level wind vectors, V wind component (shaded), incoming precipitable water (green contour), Red Sea ‘station’ (circle), and NE Africa index (box). Daily annual cycle, 2000–2023 median and quintiles of: (b) V wind over the Red Sea at 925 hPa, 17 N, 39.5 E (inverted), (c) African highland dust aerosols, and (d) dewpoint temperature 13–14.5 N, 38.5–40 E; where the spread of quintiles suggests inter-annual range. Note that vectors in (a) ‘float’ over the topography as sigma levels here and below.
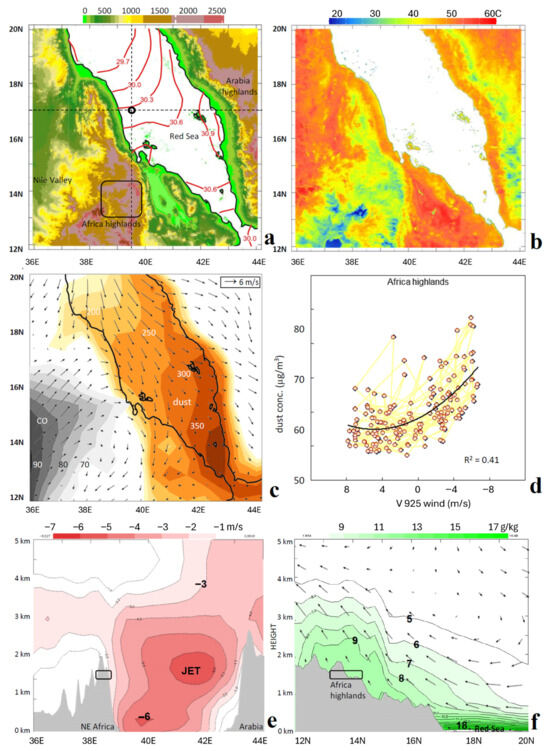
Figure 2.
May–July 2015 averaged: (a) NOAA SST (red contours) and topography (shaded) with station, sections, highlands; (b) Modis daytime land surface temperature; and (c) Merra2 carbon monoxide (gray, ppb) and dust concentration (brown, µg/m3) and 1000–925 hPa sigma-level wind vectors. (d) Scatterplot of ERA5 monthly (inverted) V wind and Merra2 dust in the highlands, 1980–2023. May–July 2015 averaged ERA5 height sections: (e) V wind E–W on 17 N (upwind of the Tokar Gap), (f) specific humidity and meridional circulation (vectors) N–S on 39 E, with topography and index.
The coefficient of variation for May–July satellite rainfall was calculated to understand sources of climatic instability. Height sections were calculated along 17 N (east–west) and along 39 E (north–south) from 1000 to 300 hPa. The east–west section and key point are located where the Mediterranean inflow joins the Tokar Gap wind that continues onward to the Gulf of Aden. The ERA5 daily 925 hPa meridional wind (V 925) time series over the Red Sea was employed in statistical correlations with regional May–July fields of daily near-surface wind, net OLR, sea level air pressure, and surface air temperature. This was performed to quantify intraseasonal to interannual forcing in the period 1980–2023 over the area 10 S–40 N, 0–80 E. With N = 4000 and degrees of freedom reduced by seasonality to ~100, R values achieving 95% confidence should exceed |0.20|. The V 925 time series was ranked to find the top 10 May–July seasons with strong NNW winds and construct composite maps and sections. Correlations were also explored with known climate indices for the Pacific El Nino Southern Oscillation (ENSO) and Indian Ocean Dipole. Although weak in early summer, lag correlations were calculated with respect to monthly Nino3 SST to establish a functional tendency. Similarly, temporal lag correlations were computed between the Somali Jet (represented by daily U 850 wind at 13 N, 56 E) and Red Sea V 925, May–July 1980–2023. These require R values > |0.29| to infer significant influence, not causation. Note that the V 925 time series over the Red Sea are inverted, so higher values signify NNW winds.
The May–July 2015 period was identified as having strong NNW winds over the Red Sea and drought over the NE African highlands. Diurnal cycling of environmental conditions was analyzed via hourly box-whisker plots and mean maps at 6 h intervals. A surge of NNW winds in mid-June 2015 was studied using Merra2 hourly dust concentrations, a radiosonde profile (18.2 N, 42.6 E), and N–S height sections of Caliop dust concentration and Cloudsat reflectivity. Hysplit ensemble back-trajectories over 11–15 June 2015 at 700 hPa, 17 N, 39.5 E describe entrainment to the dust plume. Changes in vegetation color fraction and daytime land surface temperature from early May to late July 2015 were described using de-clouded Modis visible and infrared imagery. It is suggested that the 2015 case is representative of periods with strong Red Sea winds that bring dust and suppress summer rainfall over the NE African highlands.
3. Results
3.1. Mesoscale Structure and Temporal Characteristics
The May–July 2000–2023 average 1000–925 hPa airflow over the study area is illustrated in Figure 1a. The strongest NNW winds occur over the Red Sea (17–20 N, 38–40 E) and tend to fan out across the surrounding coasts and weaken downstream. Moist SW winds are drawn from the Nile Valley, forming a clockwise loop around the NE African highlands. Annual cycles (2000–2023) of daily Red Sea meridional wind (V 925) and highland dust concentration and dewpoint temperature are presented in Figure 1b–d. These clearly define our season of interest (May–July) when NNW winds strengthen, dust increases, and dewpoint dips then rises. The onset of the Indian SW monsoon triggers these sudden changes. The quintile range for V wind is steady across the annual cycle, whereas dust and dewpoint show a wider range in early June, inferring high amplitude intra-seasonal to inter-annual variability and shifting onset. Of note is that dewpoint dips before dust and wind. The annual cycles exhibit different structures: the highland dewpoint is unimodal, whereas Red Sea winds appear bimodal. In contrast, dust spikes (150 µg/m3) then decline gradually after mid-June due to moist convective scavenging in July–August.
Figure 2a presents May–July 2015 SST, detailed topography, and locations of data extraction and height sections. SSTs in the Red Sea are warm 30C and, together with strong NNW winds, induce evaporation rates > 8 mm/day. Land surface temperatures reflect the topographic features. Daytime values (Figure 2b) range from 20C over the highlands of Africa to 50C over the Arabian lowlands bordering the Red Sea, reaching 60C in the Afar Depression (13–14 N, 41 E). Hot conditions over subtropical deserts in early summer induce diurnal turbulence and boundary layer height of ~5 km. Despite the warm SST, there are strong land–sea temperature gradients that induce afternoon sea breezes (analyzed below). May–July 2015 average dust and carbon monoxide concentrations are presented in Figure 2c. Carbon monoxide (> 60 ppb) emerges from the Nile Valley, indicative of agricultural smoke embedded within SW winds [28]. Dust is concentrated over the Red Sea and increases downwind from 200 to 350 µg/m3 during May–July 2015. Dust spills across the lowlands and is drawn along the escarpment toward the southern outlet. The scatterplot of monthly V 925 wind and dust over the African highlands (Figure 2d) reveals R2 0.41, mainly attributable to the annual alternation of SSE vs. NNW winds that entrain oceanic vs. desert aerosols. Monthly dust values of 80 µg/m3 occur in early summer when turbulent heating coincides with the onset of the Indian SW monsoon. Height sections of V wind (E–W on 17 N) and humidity and meridional circulation (N–S on 39.5 E) in May–July 2015 are presented in Figure 2e,f. This section is located where the Mediterranean inflow joins the Tokar Gap wind and becomes channeled NNW over the Red Sea. The venturi effect induces −6 m/s values in two cores: ~500 m, 39.5 E, and ~1700 m, 41.5 E, next to Africa and Arabia, respectively. These two jets may reflect seasonal progression instead of simultaneous occurrence. The humidity section reveals sharp gradients over the Red Sea (moist surface, dry aloft), with values of 20 g/kg confined to the boundary layer. The 30C SST and strong winds overlain by desert air induce sharp gradients of humidity (Figure 2f). The meridional overturning circulation is subsident around 20 N and lifts moisture (9 g/kg) onto the highlands at 14 N.
3.2. Time-Space Field Correlations: May–July 1980–2023
The environmental conditions modulating NNW winds over the Red Sea make use of daily V 925 time series at 17 N, 39.5 E, aggregated into May–July seasonal values and illustrated in Figure 3a. There are many years with strong values of −6 m/s (1990, 1999, 2002, 2004, 2006, 2008, 2010, 2011, 2015, 2017) and many with weak values of −4 m/s, but few neutral cases. Satellite net OLR fluctuations in the downstream African highlands tend to follow winds with a 0.47 correlation that indicates moist convection is suppressed by NNW airflow. The May–July net OLR time series exhibits many neutral years, consistent with the narrow range of dewpoint quintiles in July (cf. Figure 1d). To evaluate the source of May–July rainfall fluctuations, the coefficient of variation is presented in Figure 3b. Climatic instability spreads from the northern Red Sea to the adjacent lowlands. The low-level jet is thus a source of uncertainty via divergent equatorward airflow and subsidence.
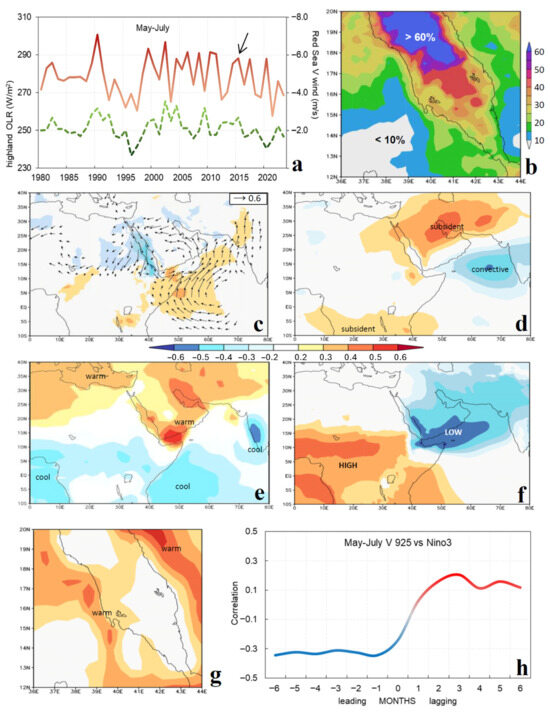
Figure 3.
(a) Time series of May–July ERA5 Red Sea (red, inverted) V 925, 17 N, 39.5 E, and highland net OLR (green dashed) arrow points to the 2015 case. (b) Coefficient of variation for May–July rainfall, 2000–2023 (%). Correlation of (inverted) daily V wind time series and May–July 1980–2023 fields: (c) Merra2 V wind (shaded) and 925 hPa sigma-level wind field (vectors, insignificant omitted), (d) satellite net OLR, (e) Merra2 surface air temperature, (f) sea level air pressure, and (g) local correlation with daily air temperature for V 925 < −6 m/s; all use the same color bar. (h) Temporal lag correlation between May–July V 925 and monthly Pacific Nino3 SST 1980–2023.
The modulation of V 925 winds over the Red Sea is statistically analyzed by daily correlation with regional fields, May–July 1980–2023 (Figure 3c–f). The NNW winds show a sympathetic response (Figure 3c) to the Indian SW monsoon. Correlation vectors, which quantify the linkage, curve across the equatorial West Indian Ocean from the southern to northern subtropics, forming the Somali Jet. These ‘pull’ airflow southward from the eastern Mediterranean Sea and the Sahara Desert. Two rotors are seen: counterclockwise over the Arabian Peninsula and clockwise over the western Indian Ocean. The ITCZ, where northerlies and southerlies meet, is clearly linked to the Red Sea jet. Many of these features are similar to the Somali Jet model simulation of [3]. Other field correlation maps (Figure 3d–f) reveal warmer air temperatures and subsidence (+OLR) over the northern subtropics and cooler temperatures and high air pressure over the southern subtropics and Congo Basin. Enhanced moist convection (–OLR) and low air pressure appear over the Arabian Sea as NNW winds accelerate over the Red Sea. Correlation with the local air temperature field for V 925 < −6 m/s (Figure 3g) indicates warming in the lowlands and escarpment, which dries soil moisture. Although simultaneous association with Pacific ENSO is weak, temporal lag correlations exhibit a trend from La Nina to El Nino (Figure 3h). We infer that the Red Sea winds in early summer are involved in interannual climate transitions.
3.3. Wind Surge and Dust Plume in May–July 2015
The May–July 2015 season is a focus for mesoscale analysis due to its stronger NNW winds (cf. Figure 3a). Daily time series are presented in Figure 4a, which shows synoptic weather-induced surges of Red Sea wind and low dewpoint in NE Africa. During the first half of June 2015, dust concentrations exceeded 200 µg/m3. Whereafter dust declined to ~50 µg/m3 while dewpoint rose above 15C as summer rains commenced. Maps of early May and mid-June 2015 wind, rain, and dust are presented in Figure 4b–e. During early May, SSE winds prevailed, and dust concentrations were low. In contrast, mid-June saw strong NNW winds over the Red Sea and clockwise airflow around the African highlands, which contained rainfall > 6 mm/day. Very dusty conditions prevailed over the Red Sea and adjacent coastal plains. An N–S height section of Cloudsat reflectivity on 22 June 2015 along 38–40 E (Figure 4f) reveals that droplets > 15 dBz remained below the freezing level (6 km) over NE Africa 12–15 N. Equatorward winds and dust inhibited deep convection. The Arabia radiosonde profile (Figure 5a) reveals very deep northeasterly winds and dry conditions on 10 June. Near-surface air temperature and dew point were 30C and −10C, respectively. Back trajectories arriving over the Red Sea at 3 km, 17 N, 39.5 E, 11–15 June (Figure 5b) exhibit clockwise paths that entrained desert dust from 20 to 25 N, 35–45 E. The dust plume on 8 and 15 June 2015 is analyzed via Caliop aerosol extinction in N–S height Sections 38–40 E (Figure 5c,d). Dense concentrations > 300 µg/m3 are evident in a deep layer 1–5 km, which blankets the African highlands with the onset of the Indian SW monsoon. Figure 6a presents the low-level jet over the Red Sea at its most accelerated state in May–July 2015: NNW winds exceed 16 m/s in the 0.5–2 km layer from 40 to 42 E. Low-level subsidence > 5 cm/s on either side of the jet corresponds with May–July rainfall departures of –30% at 39.5 E and 42 E (Figure 6b). Venturi channeling can accelerate the airflow three times above average.
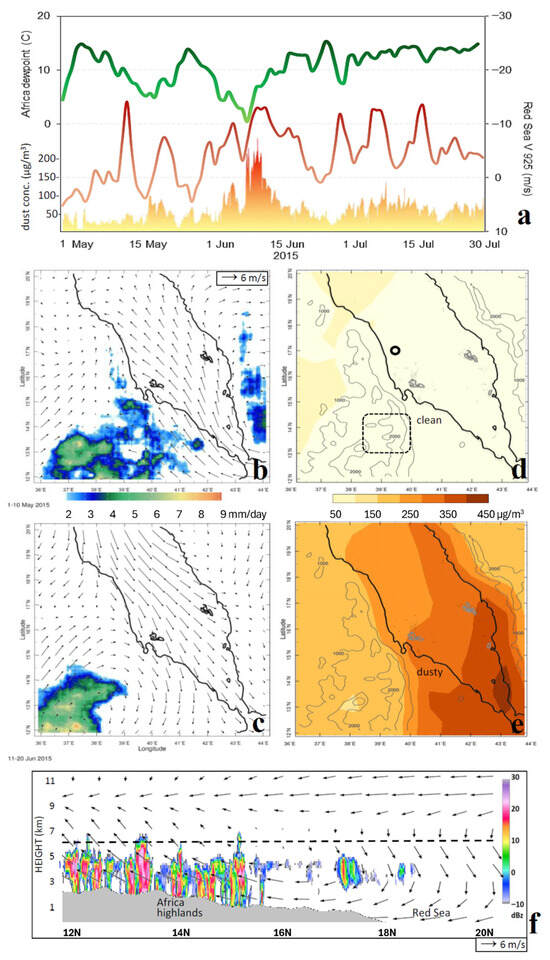
Figure 4.
(a) Daily time series of ERA5 surface dewpoint temperature (green), Merra2 dust concentration (shaded) in the African highlands 13–14.5 N, 38.5–40 E, and ERA5 V 925, 17 N, 39.5 E (inverted, red). Maps for 1–10 May and 11–20 June 2015 (lower) of: (b,c) Merra2 1000–925 hPa sigma-level wind vectors and Chirp rainfall, and (d,e) Merra2 dust concentration and topography. (f) Cloudsat reflectivity N–S height section on 38–40 E for 22 June 2015, and Merra2 meridional circulation (vectors); freezing level is dashed, and vertical motion is exaggerated.
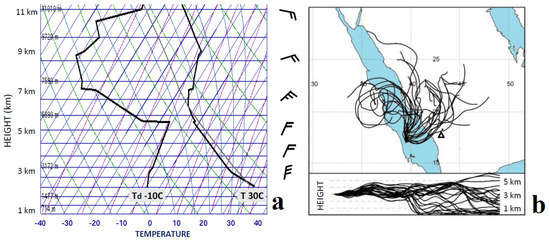
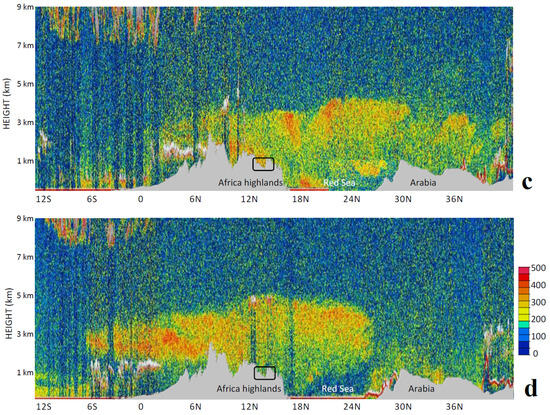
Figure 5.
(a) Radiosonde profile 12Z 10 June 2015 on the Arabia highlands 18.2 N, 42.6 E. (b) Hysplit analysis in map and side view of back-trajectories arriving at 3 km over the Red Sea 11–15 June 2015 (Δ is radiosonde). (c,d) Data on 8 June and 15 June 2015 of Caliop dust aerosols (µg/m3) in N–S height sections on 38–40 E.
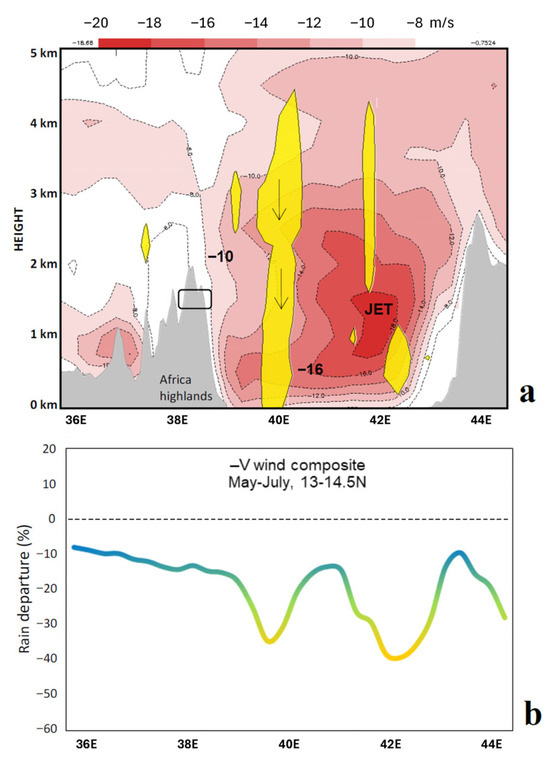
Figure 6.
(a) ERA5 minimum V wind over the May–July 2015 season, E–W height section on 17 N, for comparison with the mean in Figure 2e; ERA5 estimated subsidence > 5 cm/s (yellow shaded). (b) Graph of composite May–July Chirp rainfall departures in highland latitudes 13–14.5 N for the top 10 seasons in the V 925 time series (Figure 3a): 1990, 1999, 2002, 2004, 2006, 2008, 2010, 2011, 2015, 2017.
3.4. Diurnal Analysis in May–July 2015
Hourly data are studied for diurnal cycling over the study area in May–July 2015. Figure 7a–f presents box-whisker plots of key variables. Dust and precipitable water show little variation—slightly less dust in the evening follows increased rainfall. Naturally, the surface heat fluxes that control actual and potential evaporation exhibited a strong diurnal cycle aligned with solar insolation, rising to a peak 12–15 h. V winds over NE Africa reflect turbulent momentum exchange: minimal at night and rising throughout the day to a –6 m/s crest from 15 to 18 h. The steadiness of dust and precipitable water suggests remote sources, while diurnal heat fluxes were localized. The afternoon strengthening of NNW winds is attributed to a thermal low over the Arabian Peninsula (Figure 3e,f).
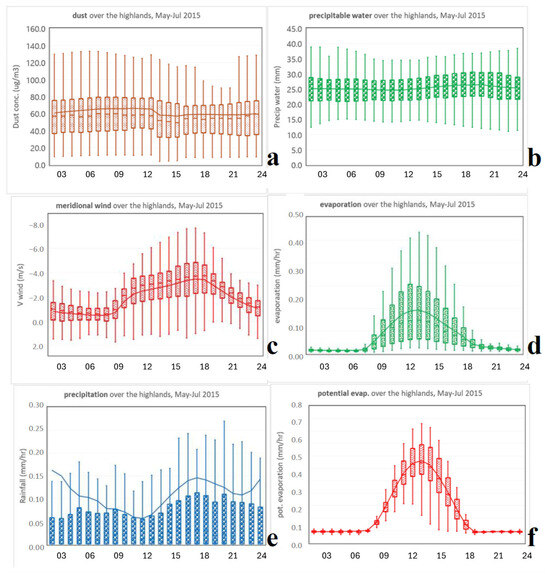
Figure 7.
Diurnal cycle analysis, hourly averaged box-whisker plots during May–July 2015: (a) Merra2 dust concentration (µg/m3), (b) precipitable water (mm), (c) ERA5 near-surface meridional wind (inverted, m/s), (d) evaporation from CFS2 LHF (mm/h), (e) Chirp precipitation (mm/h), and (f) potential evaporation from CFS2 SHF (mm/h); all times local, N = 2190.
The diurnal cycle analysis continues in Figure 8a–c for the 11–15 June 2015 NNW wind surge. Hourly V winds over the highlands varied from −1 m/s (late night) to −7 m/s (afternoon), following the actual and potential evaporation (fluxes) that peak with solar insolation. The hourly time series (Figure 8a) highlights much greater amplitude for potential evaporation (12 mm/day) than actual evaporation (2 mm/day), due to minimal transpiration in early summer. Maps of diurnal averages at 6 h intervals (Figure 6b) indicate terrestrial air temperatures of 45C at 09–12 h and 15–18 h over the lowlands, which generate 6 m/s sea breezes on the east and west shores of the Red Sea. Diffluent marine airflow coincides with orographic rainfall ~2 mm/h over the adjacent highlands of Arabia at 15 h and Africa at 21–24 h. Venturi channeling of the low-level jet over the Red Sea is aided by nocturnal land breezes from cool 15C highlands; NNW winds > 10 m/s penetrate toward the Gulf of Aden by 03–06 h.
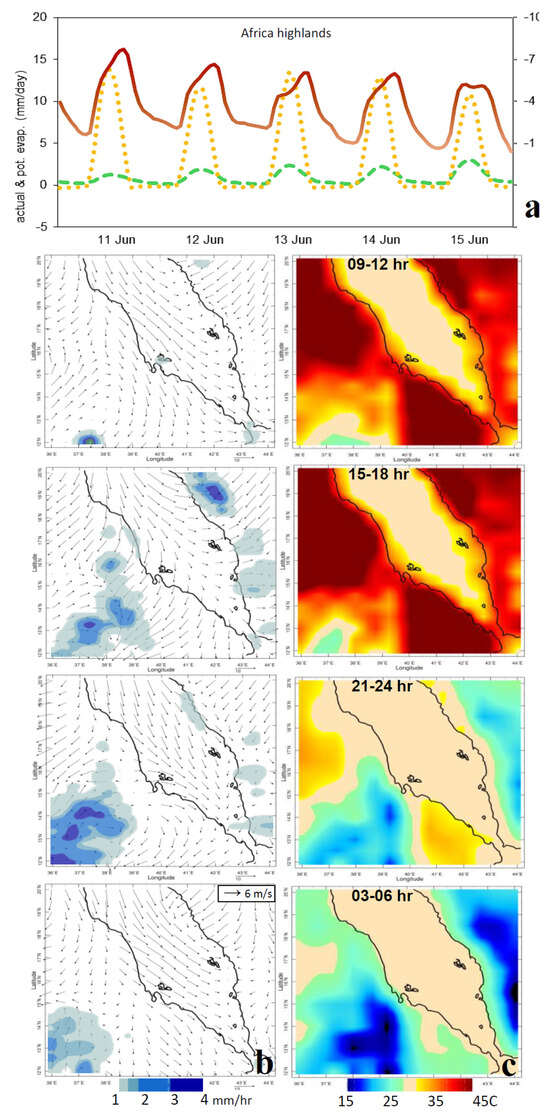
Figure 8.
Diurnal cycle analysis 11–15 June 2015: (a) Merra2 hourly time series of highlands evaporation (green), potential evaporation, and ERA5 near-surface V wind (red, inverted). (b,c) Maps of mean Merra2 (left) 1000-925 hPa sigma-level wind (vector) and rain (shaded), and (right) surface temperature at 6 h intervals (top–down: 09–12, 15–18, 21–24, 03–06 h local time).
3.5. Seasonal Impacts
The onset of rainy weather over NE Africa is brought out in Figure 9a–c. The satellite vegetation fraction increased from 0.2 in early May to 0.4 in late July 2015, as moist convection was established. Clouds that were initially overburdened by desert dust gradually scavenged and cleaned the air, doubling precipitation efficiency from 7 to 14%. With precipitable water (30 mm) from the upper Nile Valley and local transpiration (8 mm/day) in late July, daytime land surface temperatures declined 20C over the African highlands. Potential evaporation was constrained, and the near-surface soil moisture fraction reached 0.5, enabling 2015 crop production of ~2 T/ha in the index area [29] despite Pacific El Nino and strong NNW winds over the Red Sea.
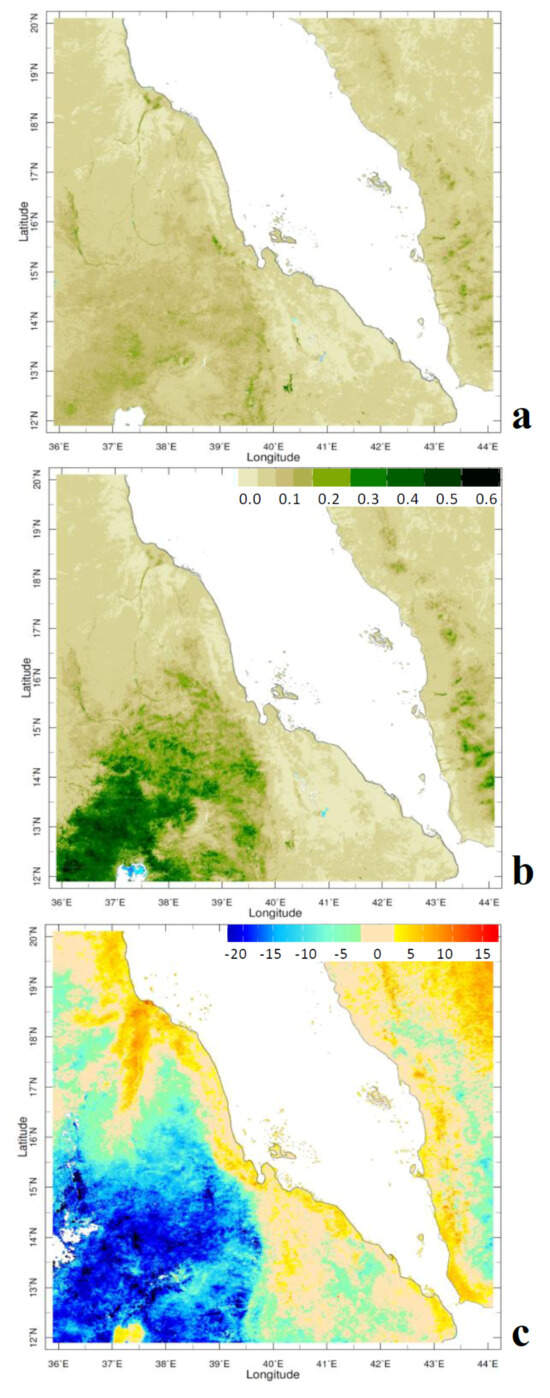
Figure 9.
Change in Modis vegetation color from (a) 1–10 May to (b) 21–31 July 2015, and (c) difference in daytime land surface temperature (late July–early May).
4. Concluding Discussion
This study has analyzed winds over the Red Sea and impacts on NE Africa climate in early summer (May–July). With the onset of the Indian SW monsoon, NNW winds > 6 m/s are channeled over the Red Sea between 2000 m highlands. The results show how inflow from the Mediterranean is joined by gap winds and proceeds toward the Gulf of Aden, where outflow joins the Somali Jet and SW Indian Monsoon (cf. Figure 3c), similar to the model simulation in [3]. Although SST of 30C instills evaporation of 8 mm/day and surface humidity of 20 g/kg, the air mass above the boundary layer is dry and dusty (6 g/kg, 100 µg/m3, cf. Supplementary Figure S1). Land–sea temperature gradients drive afternoon sea breezes and orographic rainfall (~4 mm/day) that accumulates soil moisture in support of short-cycle crops such as teff [30].
Statistical analysis of satellite and reanalysis datasets reveals the mesoscale structure and temporal variability of V 925 winds over the Red Sea. Air chemistry data on low-level carbon monoxide and dust aerosols were considered alongside the meteorological elements. Mean annual cycles for daily meridional wind, dust concentration, and dewpoint temperature gave useful insights: Td in the African highlands often declines from 12C to 4C just prior to acceleration of the dusty low-level jet over the Red Sea. Inter-annual fluctuations of NNW winds over the Red Sea were modulated by regional gradients of surface air pressure, air temperature, and the Indian SW monsoon. The anomalous circulation is part of a strengthened northern Hadley Cell that entrains dry, dusty air and forces a retreat of the equatorial trough across NE Africa in early summer, as seen in the composite N-S height section (Figure 10a) and earlier results (Figure 3c). Temporal lag correlations with the Somali Jet [31] (U 850, 13 N, 56 E) demonstrate how daily Red Sea winds respond to the pulling effect of the Indian SW monsoon via the Somali Jet (Figure 10b). Correlations become significant at a 5-day lead and peak (R = 0.65) at a 10-day lag, indicating a sustained influence in the May–July season as seen in [3]. Our results indicate that dusty gap winds feed the prevailing NNW airflow over the Red Sea. The Venturi channeling induces subsidence, which, together with high aerosol densities, inhibits convection over NE Africa.
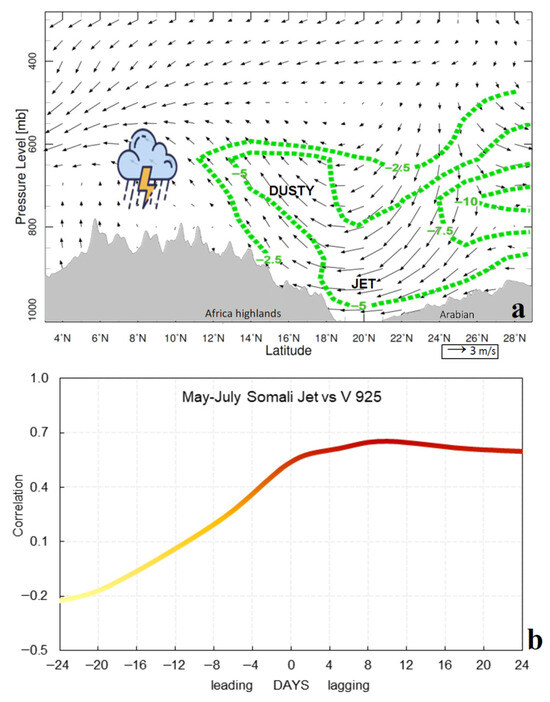
Figure 10.
(a) Anomalous Merra2 May–July meridional circulation and moisture for top-10 seasons in the V 925 time series: Figure 3a, as an N-S height section along 38–40 E, represented as vectors and humidity < −2.5% (green contour). The thunderstorm icon refers to the southward retreat of rainfall with the equatorial trough. The composite uses 1990, 1999, 2002, 2004, 2006, 2008, 2010, 2011, 2015, and 2017; vertical motion is exaggerated; compare with the mean airflow in Figure 2f. (b) Temporal lag correlation between the daily Somali Jet (U 850, 13 N, 56 E) and May–July Red Sea V 925, 1980–2023, where R > |0.25| reaches 98% confidence, +R refers to Arabian Sea westerlies ‘pulling’ Red Sea northerlies.
A surge of dry, dusty NNW winds in June 2015 was documented via meteorological and satellite aerosol analyses. Dust storms were drawn into a plume (conducted by the Tokar Gap) that skirts the highlands. Cold-cloud development is suppressed, according to Cloudsat reflectivity. This persistent feature induces a dry-east/moist-west gradient across NE Africa, as seen in Supplementary Figure S2. Diurnal cycles were studied via hourly data in May–July 2015 and revealed low amplitude for advected dust and precipitable water and high amplitude for local heat fluxes. NNW winds over the Red Sea became diffluent during afternoon sea breezes and contributed to subsidence over the coastal plains. The channeled airflow that brings dry air has consequences for environmental resources: altering vegetation fraction and soil moisture by 25%. As moist convection builds in July and scavenges the desert dust, daytime land surface temperatures decline to ~ 20C, enabling short-cycle crop growth.
Lag correlations with Nino3 SST exhibited a transition from Pacific La Nina to El Nino, inferring that NNW winds over the Red Sea are involved in global climate variability. We note a slight decline in Red Sea winds (Figure 3a), which may benefit agricultural production going forward [29]. But recent conflicts in NE Africa have led to socio-economic stress, in addition to the natural variability documented here. It is hoped that these challenges can be overcome so that the NE African highlands can export agricultural products to the surrounding lowlands and alleviate shortages amplified by global warming.
Supplementary Materials
The following supporting information can be downloaded at https://www.mdpi.com/article/10.3390/cli13100215/s1, Figure S1: Modis visible image of an early summer dust storm over the Red Sea (from NASA GSFC). Figure S2: Meteosat May–July cloud fraction along 14 N: 2000–2023 mean (black), 2015 (red).
Funding
This research received no external funding.
Acknowledgments
Indirect support from the South African Department of Higher Education via the University of Zululand is noted. Online data analysis systems include the following: https://iridl.ldeo.columbia.edu/, https://climexp.knmi.nl/start.cgi, http://apdrc.soest.hawaii.edu/, https://disc.gsfc.nasa.gov/, and https://ready.arl.noaa.gov/index.php (accessed on 3 September 2025). Useful feedback was received from the staff of the Institute for Climate and Society at Mekele University.
Conflicts of Interest
The author declares no conflicts of interest; no direct funding was received for this work. A data spreadsheet is available on request.
References
- Ralston, D.K.; Jiang, H.; Ferrar, T.F. Waves in Red Sea: Response to monsoonal and mountain gap winds. Cont. Shelf Res. 2013, 65, 1–13. [Google Scholar] [CrossRef]
- Langodan, S.; Cavaleri, L.; Viswanadhapalli, Y.; Hoteit, I. The Red Sea: A natural laboratory for wind and wave modeling. J. Phys. Oceanogr. 2014, 44, 3139–3159. [Google Scholar] [CrossRef]
- Krishnamurti, T.N.; Wong, V.; Pan, H.L.; Pasch, R.; Molinari, J.; Ardanuy, P. Three dimensional planetary boundary layer model for the Somali Jet. J. Atmos. Sci. 1983, 40, 894–908. [Google Scholar] [CrossRef]
- Jiang, H.; Farrar, J.T.; Beardsley, R.C.; Chen, R.; Chen, C. Zonal surface wind jets across the Red Sea due to mountain gap forcing along both sides of the Red Sea. Geophys. Res. Lett. 2009, 36, L19605. [Google Scholar] [CrossRef]
- Davis, S.R.; Pratt, L.J.; Jiang, H. The Tokar Gap jet: Regional circulation, diurnal variability and moisture transport based on numerical simulations. J. Clim. 2015, 28, 5885–5907. [Google Scholar] [CrossRef]
- Davis, S.R.; Farrar, J.T.; Weller, R.A.; Jiang, H.; Pratt, L.J. The land-sea breeze of the Red Sea: Observations, simulations, and relationships to regional moisture transport. J. Geophys. Res. Atmos. 2019, 124, 13803–13825. [Google Scholar] [CrossRef]
- Pratt, L.J.; Albright, E.J.; Rypina, I.; Jiang, H. Eulerian and Lagrangian comparison of wind jets in the Tokar Gap region. Fluids 2020, 5, 193. [Google Scholar] [CrossRef]
- Masiwal, R.; Dixit, V.; Seshadri, A.K. Explaining dynamics and rapid onset of the Somali Jet through its kinetic energy budget. J. Atmos. Sci. 2023, 80, 833–847. [Google Scholar] [CrossRef]
- Bannon, P.R. On the dynamics of the East African Jet. I: Simulations of mean conditions for July. J. Atmos. Sci. 1979, 36, 2139–2152. [Google Scholar] [CrossRef]
- Bannon, P.R. On the dynamics of the East African jet. II: Arabian Sea branch. J. Atmos. Sci. 1982, 39, 2267–2278. [Google Scholar] [CrossRef]
- Vizy, E.K.; Cook, K.H. Connections between the summer east African and Indian rainfall regimes. J. Geophys. Res. 2003, 108, 4510. [Google Scholar] [CrossRef]
- Mafimbo, A.J.; Reason, C.J.C. Air-sea interaction over the upwelling region of the Somali coast. J. Geophys. Res. 2010, 115, C01001. [Google Scholar] [CrossRef]
- Zhai, P.; Bower, A. The response of the Red Sea to a strong wind jet near the Tokar Gap in summer. J. Geophys. Res. Ocean. 2013, 118, 422–434. [Google Scholar] [CrossRef]
- Langodan, S.; Cavaleri, L.; Vishwanadhapalli, Y.; Pomaro, A.; Bertotti, L.; Hoteit, I. The climatology of the Red Sea—Part 1: The wind. Intl. J. Climatol. 2017, 37, 4509–4517. [Google Scholar] [CrossRef]
- Winker, D.M.; Hunt, W.M.; McGill, M.J. Initial performance assessment of CALIOP. Geophys. Res. Lett. 2007, 34, L19803. [Google Scholar] [CrossRef]
- Stephens, G.L.; Vane, D.G.; Boain, R.J.; Mace, G.G.; Sassen, K.; Wang, Z.; Illingworth, A.J.; O’connor, E.J.; Rossow, W.B.; Durden, S.L.; et al. The CloudSat Mission and the A-Train. Bull. Amer. Meteo. Soc. 2002, 83, 1771–1790. [Google Scholar] [CrossRef]
- Saha, S.; Moorthi, S.; Wu, X.; Wang, J.; Nadiga, S.; Tripp, P.; Behringer, D.; Hou, Y.T.; Chuang, H.Y.; Iredell, M.; et al. The NCEP climate forecast system v2. J. Clim. 2014, 27, 2185–2208. [Google Scholar] [CrossRef]
- Funk, C.C.; Peterson, P.J.; Landsfeld, M.F.; Pedreros, D.H.; Verdin, J.P.; Rowland, J.D.; Romero, B.E.; Husak, G.J.; Michaelsen, J.C.; Verdin, A.P. A quasi-global precipitation time series for drought monitoring. U.S. Geol. Surv. Data Ser. 2014, 832, 4. [Google Scholar]
- Hersbach, H.; Bell, B.; Berrisford, P.; Hirahara, S.; Horányi, A.; Muñoz-Sabater, J.; Nicolas, J.; Peubey, C.; Radu, R.; Schepers, D.; et al. The ERA5 global reanalysis. Qtr. J. R. Meteo. Soc. 2020, 146, 1999–2049. [Google Scholar] [CrossRef]
- Stein, A.F.; Draxler, R.R.; Rolph, G.D.; Stunder, B.J.; Cohen, M.D.; Ngan, F. NOAA HYSPLIT atmospheric transport and dispersion modeling system. Bull. Amer. Meteor. Soc. 2015, 96, 2059–2077. [Google Scholar] [CrossRef]
- Molod, A.; Takacs, L.; Suarez, M.; Bacmeister, J. Development of the GEOS-5 atmospheric general circulation model: Evolution to Merra2. Geosci. Model Dev. 2015, 8, 1339–1356. [Google Scholar] [CrossRef]
- Randles, C.A.; Silva, A.M.; Buchard, V.; Colarco, P.R.; Darmenov, A.; Govindaraju, R.; Smirnov, A.; Holben, B.; Ferrare, R.; Hair, J.; et al. The Merra2 aerosol reanalysis, 1980 onward, part I: System description and data assimilation evaluation. J. Clim. 2017, 30, 6823–6850. [Google Scholar] [CrossRef]
- Gelaro, R.; McCarty, W.; Suárez, M.J.; Todling, R.; Molod, A.; Takacs, L.; Randles, C.A.; Darmenov, A.; Bosilovich, M.G.; Reichle, R.; et al. The modern-era retrospective analysis for research and applications v2 (Merra2). J. Clim. 2017, 30, 5419–5454. [Google Scholar] [CrossRef]
- Lee, H.-T. Climate Algorithm Theoretical Basis: Daily Outgoing Longwave Radiation CDR; CDRP-ATBD-0526; NOAA: Washington, DC, USA, 2014; p. 46.
- Reynolds, R.W.; Smith, T.M.; Liu, C.; Chelton, D.B.; Casey, K.S.; Schlax, M.G. Daily high-resolution blended analyses for sea surface temperature. J. Clim. 2007, 20, 5473–5496. [Google Scholar] [CrossRef]
- Pinzon, J.E.; Tucker, C.J. A non-stationary 1981–2012 AVHRR NDVI time series. Remote Sens. 2014, 6, 6929–6960. [Google Scholar] [CrossRef]
- Hulley, G.; Freepartner, R.; Malakar, N.; Sarkar, S. MODIS Land Surface Temperature and Emissivity Product v6, NASA-GSFC-JPL; NASA: Washington, DC, USA, 2016.
- Andreae, M.O. Emission of trace gases and aerosols from biomass burning—An updated assessment. Atmos. Chem. Phys. 2019, 19, 8523–8546. [Google Scholar] [CrossRef]
- Eze, E.; Girma, A.; Zenebe, A.; Okolo, C.C.; Kourouma, J.M.; Negash, E. Predictors of drought-induced crop yield/losses in agroecologies of Tigray Ethiopia. Sci. Rep. 2022, 12, 6284. [Google Scholar] [CrossRef]
- Viste, E.; Sorteberg, A. The effect of moisture transport variability on Ethiopian summer precipitation. Int. J. Climatol. 2013, 33, 3106–3123. [Google Scholar] [CrossRef]
- Findlater, J. A major low-level air current near the Indian Ocean during the northern summer. Quart. J. Roy. Meteor. Soc. 1969, 95, 362–380. [Google Scholar] [CrossRef]


Disclaimer/Publisher’s Note: The statements, opinions and data contained in all publications are solely those of the individual author(s) and contributor(s) and not of MDPI and/or the editor(s). MDPI and/or the editor(s) disclaim responsibility for any injury to people or property resulting from any ideas, methods, instructions or products referred to in the content. |
© 2025 by the author. Licensee MDPI, Basel, Switzerland. This article is an open access article distributed under the terms and conditions of the Creative Commons Attribution (CC BY) license (https://creativecommons.org/licenses/by/4.0/).