Article

Interaction of Tropical Easterly Jets over North Africa

1
Geography Department, University of Zululand, KwaDlangezwa 3886, South Africa
2
Physics Department, University of Puerto Rico, Mayagüez, PR 00681, USA
Climate 2025, 13(10), 214; https://doi.org/10.3390/cli13100214
Submission received: 6 August 2025 / Revised: 30 August 2025 / Accepted: 4 September 2025 / Published: 17 October 2025

Abstract

The objective of this study is to determine how easterly jets and associated convections interact over tropical North Africa during the Jul–Sep season, using reanalysis and satellite datasets for 1990–2024. Four indices are formed to describe mid- and upper-level zonal winds, and moist convection over the Sahel and India. Time-space regression identifies the large-scale features modulating the easterly jets. Cumulative departures are analyzed and ranked to form composites in east wind/convective phases and weak wind/subsident phases. The upper-level tropical easterly jet accelerates over the Arabian Sea during and after Pacific La Nina and the cool-west Indian Ocean dipole, and shows four year cycling aligned with thermocline oscillations. The mid-level Africa easterly jet strengthens during Atlantic Nino conditions that enhance the Sahel’s convection in the Jul–Sep season. Both jets accelerate when convection spreads west of India, whereas brief spells of decoupling suppress North African crop yields. The case of 15–20 August 2018 is analyzed, when a surge of Indian monsoon convection and tropical easterly jet penetrated the Sahel, leading to widespread uplift and rainfall.

1. Introduction

The 20 m/s tropical easterly jet (TEJ) at 200–150 hPa over the Arabian Sea during northern summer (Jul–Sep), forms in response to an inverted thermal gradient [1]. Latent heating within the moist convection over the Bay of Bengal and India, and sensible heating over the Tibetan Plateau, produces an upper anticyclone whose outflow turns westward in the 5–18 N latitude band during summer. Intra-seasonal and inter-annual variability of the TEJ arises from pulsing by subtropical and equatorial waves and the El Nino Southern Oscillation (ENSO) [2,3]. Downstream consequences over the Sahel depend on the 10 m/s African easterly jet (AEJ) at 600–500 hPa [4,5,6], which is quite steady due to seasonal heating of the Sahara Desert. Although both jets are driven by an inverted thermal gradient, contrasts in their proximity to moist/dry convective heating and global ENSO circulations make synchronous coupling uncertain, and therefore of scientific interest.
Climate-sensitive resources in the Sahel depend on summer rainfall delivered by cloud clusters that form leeward of the northeast African highlands [7,8,9]. Moist convection tends to build when cyclonic vorticity from the AEJ is supported by divergence in the TEJ [10,11,12,13]. Coupling between the Asia–Africa monsoons and their jets is modulated by Indian Ocean dipole (IOD) response to ENSO [14]. Ref. [15] attributes inter-annual shifts in the TEJ core and convection to circulations over the north Indian Ocean and temperature gradients across the Atlantic and Pacific. The TEJ undergoes a NW advance and SE retreat from June to September, shifting from the Gulf of Aden to southern India [16]. The inverted thermal gradient is absent from Oct–May, when subtropical westerlies prevail.
Here the easterly jets over North Africa are statistically analyzed to uncover thermodynamic and kinematic features during the Jul–Sep season. For this purpose, daily to monthly indices of convection and zonal wind from the Sahel to India are drawn from satellite and reanalysis data. Inter-annual variations in jet intensity are related to fields of net outgoing longwave radiation (OLR) and sea surface temperature (SST). Intra-seasonal fluctuations are studied via daily statistics. Following the data and methods, a Jul–Sep climatology is presented to define the indices, and temporal characteristics are presented. Correlation maps and composite height and depth sections were calculated and a typical case study is offered, followed by a summarizing discussion.

2. Data and Methods

Data employed to characterize the TEJ and AEJ derived from daily and monthly Merra2 reanalysis [17] zonal wind at 200–150 hPa, 30–70 E, 5–18 N, and 600–500 hPa, 25 W–15 E, 8–20 N (Figure 1a–d), are based on summer amplification therein. The 1990–2024 period was selected to avoid a gap in geostationary satellite wind retrievals over the west Indian Ocean in the 1980s, and Jul–Sep averages were employed to avoid subtropical jet intrusions from the Mediterranean in June. Ancillary Merra2 reanalysis fields include wind velocity, vertical motion, relative and specific humidity, and air temperature. Large-scale ocean influences were evaluated via monthly NOAA sea surface temperature (SST) [18] and GODAS reanalysis [19] sea temperature, salinity, currents, and vertical motion. Satellite net OLR fields [20] are used to detect moist convection and subsidence, and indices were formulated for India (iOLR) 70–100 E, 5–18 N, and Africa (aOLR) 5–15 N, 15 W–15 E. Monthly to hourly rainfall was drawn from interpolated gauge–satellite measurements [21], and Sahel annual crop yields were obtained [22].
The continuous monthly TEJ, AEJ, iOLR, aOLR indices were statistically explored in the period 1990–2024. Jul–Sep TEJ lag correlations were analyzed with respect to ENSO and IOD indices from −12 to +12 months and running 3 year correlations of the three-time series: TEJ vs. iOLR and TEJ vs. AEJ were calculated. Wavelet spectral analysis was applied to inter-annual filtered records to determine the amplitude of 1–10 year cycling. Time-space correlations were calculated to understand the global conditions favoring the TEJ and AEJ. This was accomplished by regressing the (inverted) jet indices onto Jul–Sep gridded fields, then mapping the resultant matrix of R-values for SST and OLR (40 S–45 N, 180 W–180 E). With ~35 degrees of freedom, R > |0.28| achieves 90% confidence.
After ranking the cumulative Jul–Sep standardized departures of the four indices, the top and bottom five seasons were identified: 1996, 1998, 2010, 2020, 2021, and 1990, 1997, 2002, 2015, 2023, respectively. Positive phase refers to increased convection under easterly airflow, and negative phase to decreased convection under weak airflow (U wind and OLR inverted). Positive minus negative composites were calculated over the area 5 S–30 N, 40 W–100 E, and across zonal sections of atmospheric height 1000–50 hPa that averaged 5–17 N, and ocean depth 0–300 m that averaged 0–15 N. A composite meridional height section that averaged 5–30 E was also analyzed.
The above outcomes reflect inter-annual variability; to characterize intra-seasonal behavior, lag correlations were analyzed for daily TEJ vs. iOLR and AEJ 2004–2024 from −12 to +12 days. Cumulative correlations were studied with the respective daily TEJ, each summer from 2004 to 2024. With N = 1932, R > |0.10| achieves 90% confidence. Year 2018 presented highest cumulative R-values; hovmoller plots of daily 850 hPa air temperature and 400 hPa specific humidity were made across the Sahel 0° E from 5 S to 30 N. A case study of 15–20 August 2018 was analyzed for height section of cloud reflectivity, zonal wind, vertical motion, and humidity; and maps of 850 hPa temperature, 600 hPa wind, rainfall, and 150 hPa wind. A conceptual understanding of TEJ and AEJ interaction is given, supported by eigenvector analysis on a height section of daily zonal winds 5 S–30 N, Jul–Sep 1990–2024. One limitation of the study is static index areas that focus on variations in intensity, not location. Much of the analysis was performed using online resources and MS Excel.

3. Results

3.1. Climatology and Inter-Annual Characteristics

Figure 1a–c presents the Jul–Sep 1990–2024 average upper- and mid-level circulation and convection (OLR). Well known features are identified: upper TEJ over the Arabian Sea and mid-level AEJ over the Sahel, moist convection east of India and northwest of Congo, and subsidence over the Arabia and Sahara Deserts. There is reduced Jul–Sep convection over the cross-equatorial low-level Somali Jet, due to oceanic upwelling. In the elevation map, SST > 27C spread around India and the equatorial Atlantic. The index areas are defined in Figure 1d, and naturally focused on the easterly jets and tropical convection.
To determine the stability of association, 3 year running correlations are analyzed between the three-time series: TEJ vs. iOLR and TEJ vs. AEJ in Figure 2a. Seasonal cycling maintains R~0.9, inferring that the TEJ is driven by outflow from the Indian Monsoon and Tibetan High, and co-varies with the AEJ due to the inverted −dT/dy gradient. There is a slight weakening, interspersed with spells of reduced association between the TEJ and convection (2006, 2012) and the African jet (1999, 2010), which affect Sahel crop yields. Inter-annual filtered wavelet spectra (Figure 2b) show cycling of the TEJ at ~4 years, the AEJ at ~2–3 years, and at ~6 years in the 1990s. This periodicity is aligned with thermocline oscillations that depend on the oceanic Rossby wave coupling with the overlying Walker circulations [23].
The Jul–Sep time series presented in Figure 2c (inverted for westward intensity) is used in time-space correlation mapping with respect to SST and OLR fields (Figure 2d,e). The TEJ responds to global La Nina conditions with a cold tongue in the East Pacific and associated subsidence and warming around the Maritime Continent and associated convection. The AEJ has a more isolated response to the warming of the tropical east Atlantic (Nino) and subsidence over the west Indian Ocean. The TEJ-OLR correlation pattern is subsident in the Africa subtropics, inferring that an accelerated jet involves meridional overturning.
Lag correlations (Figure 2f) indicate that inter-annual TEJ variability is linked with the ENSO and IOD phases in the preceding season. Following La Nina with negative dipole, the TEJ accelerates in Jul–Sep due to the warm-north/cool-south temperature gradient over the Arabian Sea. Convective outflows from the Tibetan High, Bay of Bengal, and Maritime Continent are guided westward by the Walker circulation [3]. Further statistical tests revealed that equatorial Madden-Julian waves pulse the monsoon (iOLR); however, correlations with the stratospheric quasi-biennial oscillation were negligible. Composite analysis of the top and bottom 5 index seasons are presented in the following section.

3.2. Composite Difference Maps and Sections

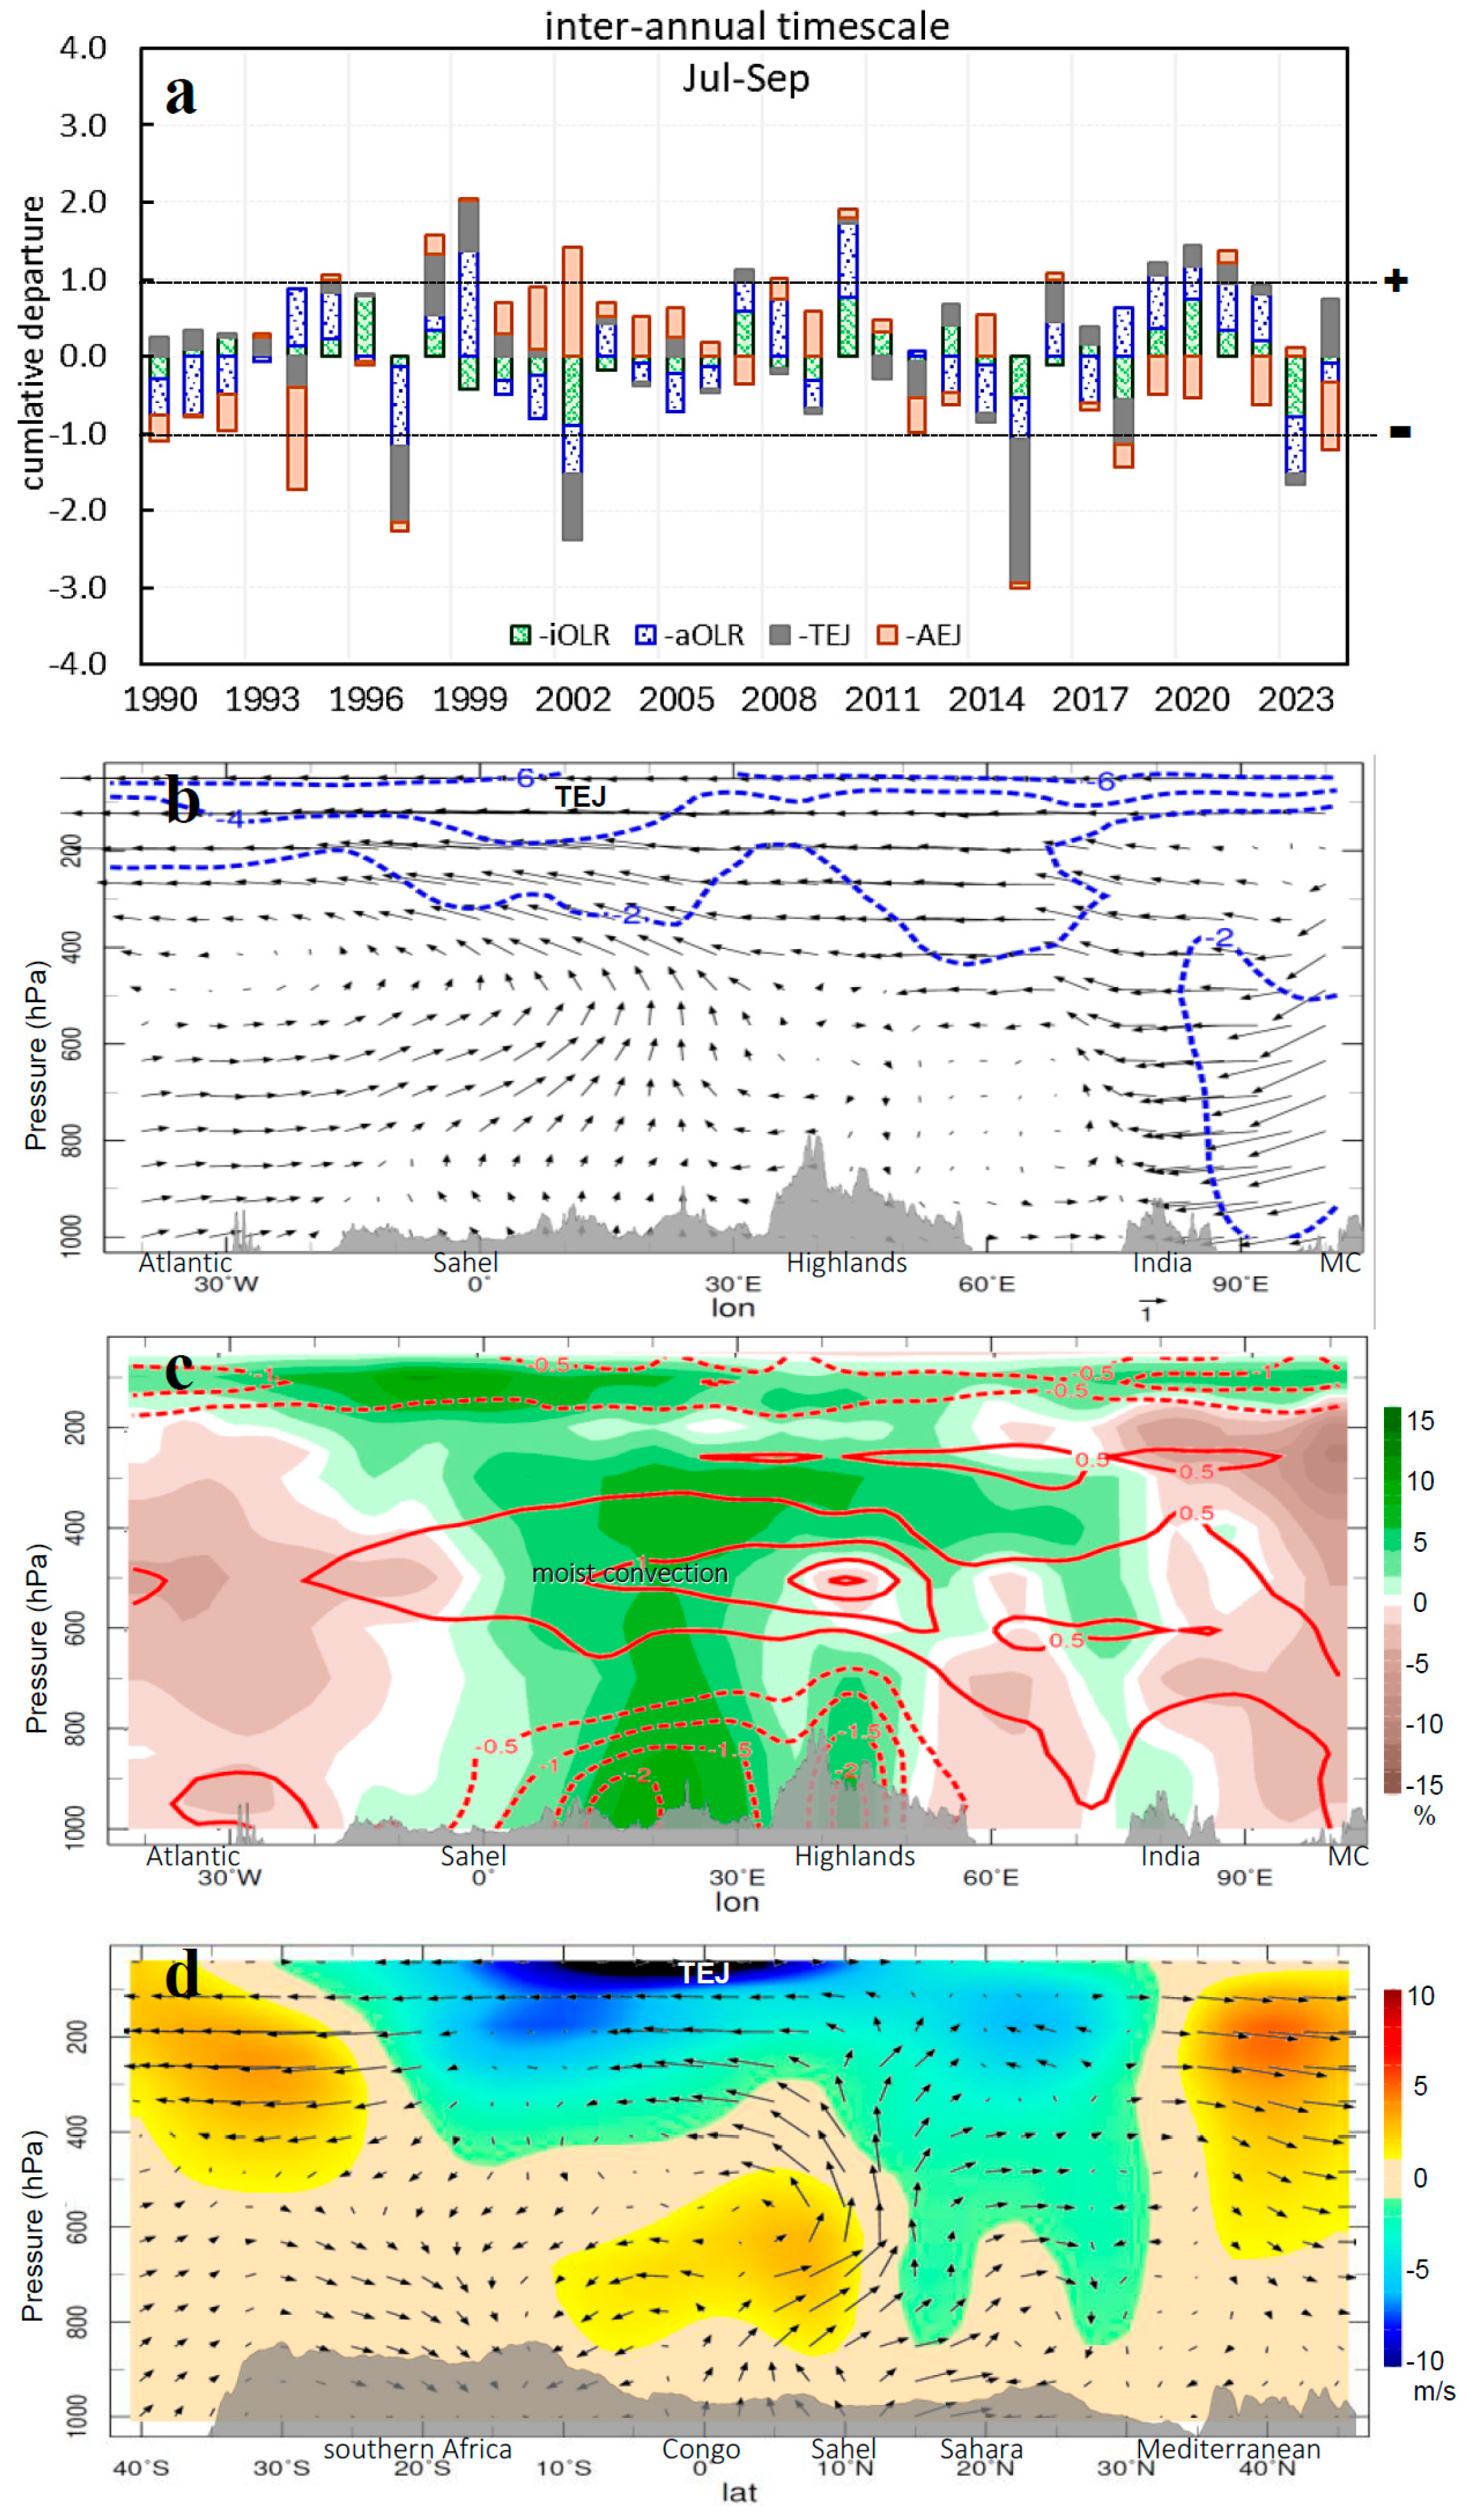
Cumulative Jul–Sep departures of the easterly jet and convective indices (Figure 3a) show alternating dips and crests. When coherently positive, as in 2010, the jets are strong and the Asia–Africa convection prevails; when coherently negative, as in 2015, the jets are weak, and subsidence prevails. Composites of the five most positive minus five most negative seasons are illustrated in Figure 3b,c as zonal height sections averaged 5–15 N. Easterly winds over India joined the TEJ over the Arabian Sea and spread across the Sahel, inducing moist uplift and convective heating to 400–600 hPa. The composite meridional height section averaged 5–30 E (Figure 3d), which reveals that uplift over the Sahel 5–15 N is supported by anomalous easterlies 10 S/20 N and divergence above 400–100 hPa. In contrast, westerlies accelerate in the subtropical jets 35 S/40 N and over the Congo. Cyclonic vorticity equatorward of the AEJ is prominent 800–500 hPa, and generates background vertical motion according to W = ξ (Z⁄f dt). With ξ = 10−5 s−1, Z = 4 × 10³ m, f = 3 × 10⁻⁵ s−1, dt = 8 × 10⁴ s, the resultant W = 6 cm/s.
The subsurface zonal composites that averaged 0–15 N (Figure 4a) show influences from the Atlantic Nino and negative IOD. The Atlantic temperatures reflect +2C differences above 100 m depth, while the Indian Ocean temperatures reveal a cool-west/warm-east dipole. Both basins show an eastward downwelling circulation (Figure 4b) suggesting air–sea interactions modulated by ENSO and −IOD conditions. Composite positive minus negative near-surface (925 hPa) wind and rainfall differences are illustrated in Figure 4c. Enhanced monsoon circulations and convection appear over the tropical Atlantic, India and Bay of Bengal. Although the Somali Jet is neutral during strengthened TEJ-AEJ, a cyclonic eddy emerges over the Nile Valley 20 N, 20 E. Surplus rainfall is prominent from the Maritime Continent to India, and from Ethiopia to the Guinea Coast, while deficits are noted over the tropical west Indian Ocean, consistent with cool/west -IOD phase.

3.3. Intra-Seasonal Features and August 2018 Case

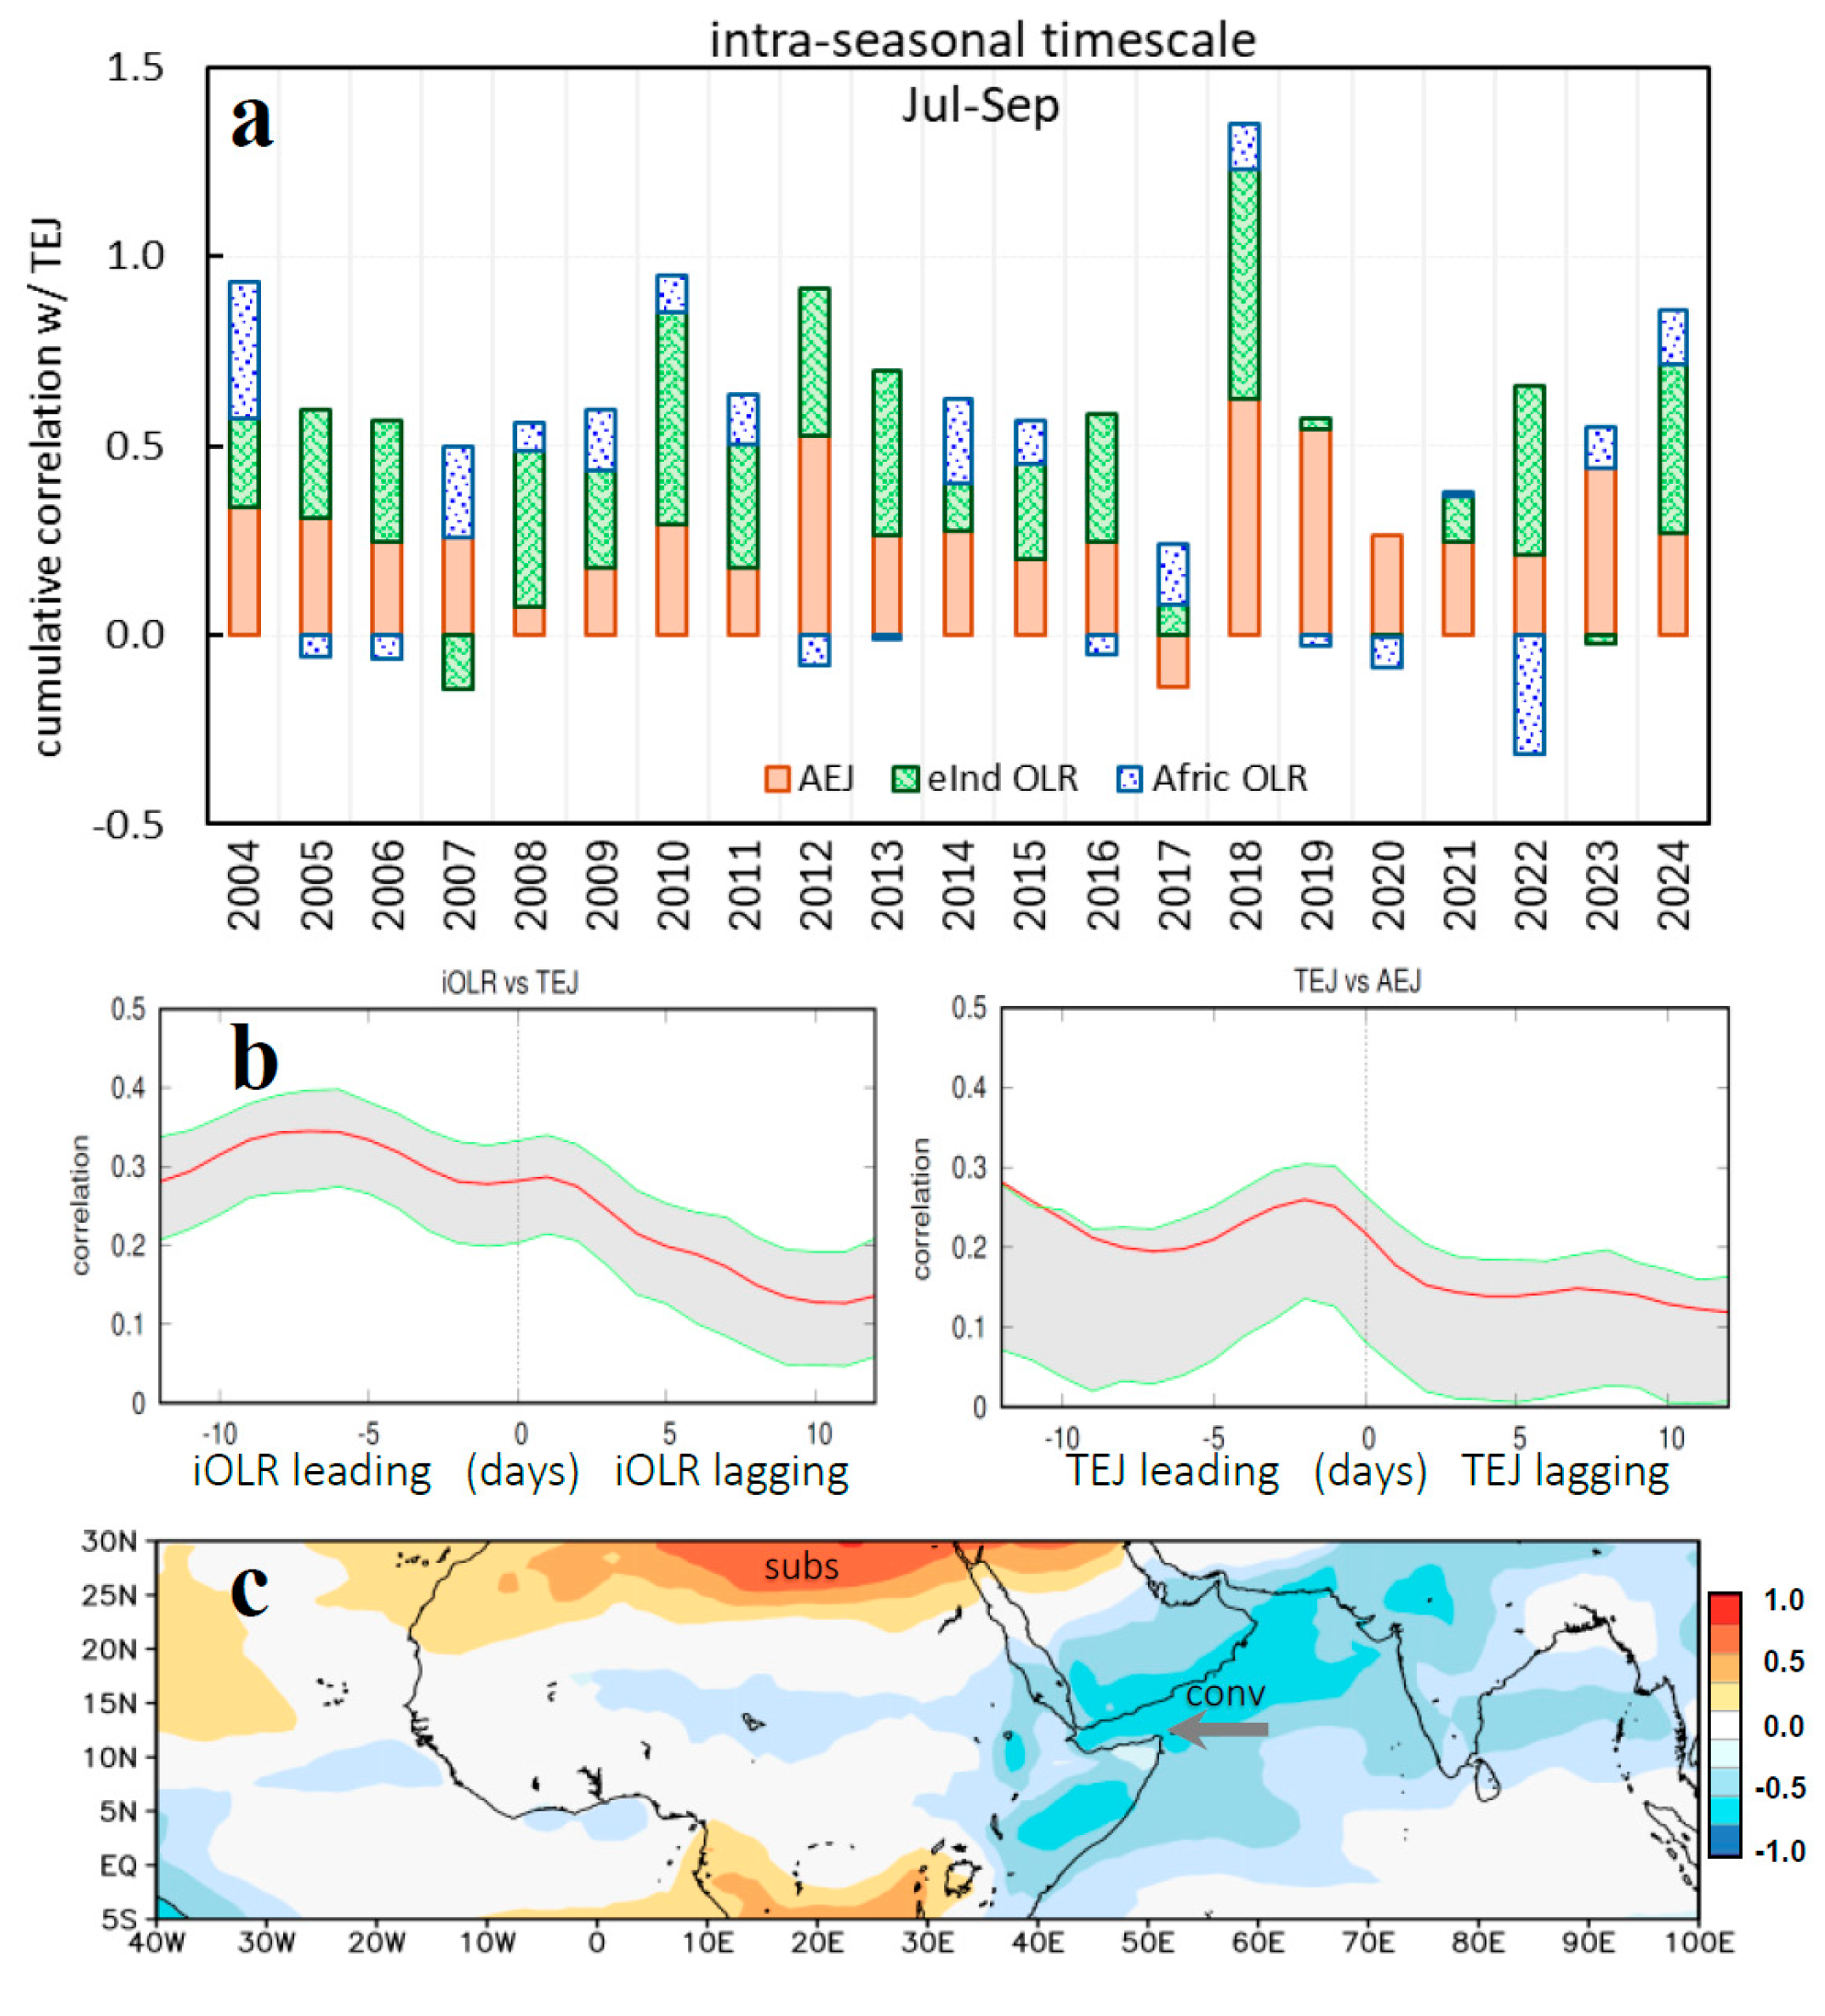
Inter-annual modulation has been deduced from monthly datasets; next, we turn our attention to intra-seasonal behavior using daily statistics. Simultaneous pair-wise correlations with respect to the TEJ each Jul–Sep are plotted in a cumulative fashion in Figure 5a. Generally positive values indicate that intra-seasonal pulsing is coherent: strengthened upper easterly jets stimulate Asia–Africa convection. Lag correlations between the daily TEJ and the Indian OLR and AEJ are presented in Figure 5b. These confirm a cascade of processes, starting with increased convection over India and the Bay of Bengal seven days before TEJ acceleration over the Arabian Sea. The AEJ strengthens over the Sahel two days later. Although R values are ~0.3, the large sample size generates 90% confidence. The daily TEJ index is time-space correlated with daily OLR fields at a seven day lead (Figure 5c). Anomalous convection over the Arabian Sea connects the Asia–Africa monsoons. Also noteworthy are the +OLR values over the Congo and Mediterranean, which act to channel AEJ impacts over the Sahel.
The year 2018 had highest cumulative correlation and drew our attention for case study analysis. The Jul–Sep daily time series is presented in Figure 6a. The TEJ fluctuated ~25 m/s (-U) while the AEJ remained steady ~10 m/s. Convection over India (OLR = 200 W/m2) was active in mid-August, and pulsed over the Sahel a few days later. Convection over India weakened in early September and the TEJ relaxed to 12 m/s. Hovmoller plots of Jul–Sep 2018’s daily 850 air temperature and 400 hPa specific humidity are presented in Figure 6b. The warm-north/cool-south thermal gradient was well established in Jul–Aug, and underpinned the steadiness of the AEJ. Moisture was injected upward over the Sahel 10 N, but dispersed northward in early August and mid-September 2018. Arabian radiosonde profiles of temperature and windspeed during a surge of the TEJ on 16–17 Aug are given in Figure 6c. The tropopause inflection at 17.4 km showed radiative cooling −85C and easterlies ~30 m/s that extended well into the stratosphere. A cloudsat radar reflectivity section is presented in Figure 6d. Deep convection was sustained from 10 to 15 N, while shallow convection developed over the Guinea Coast (6–8 N). The meridional overturning circulation shows low-level southerlies/upper-level northerlies. Cloud-top reflectivity reached 12,000 m over the Sahel.
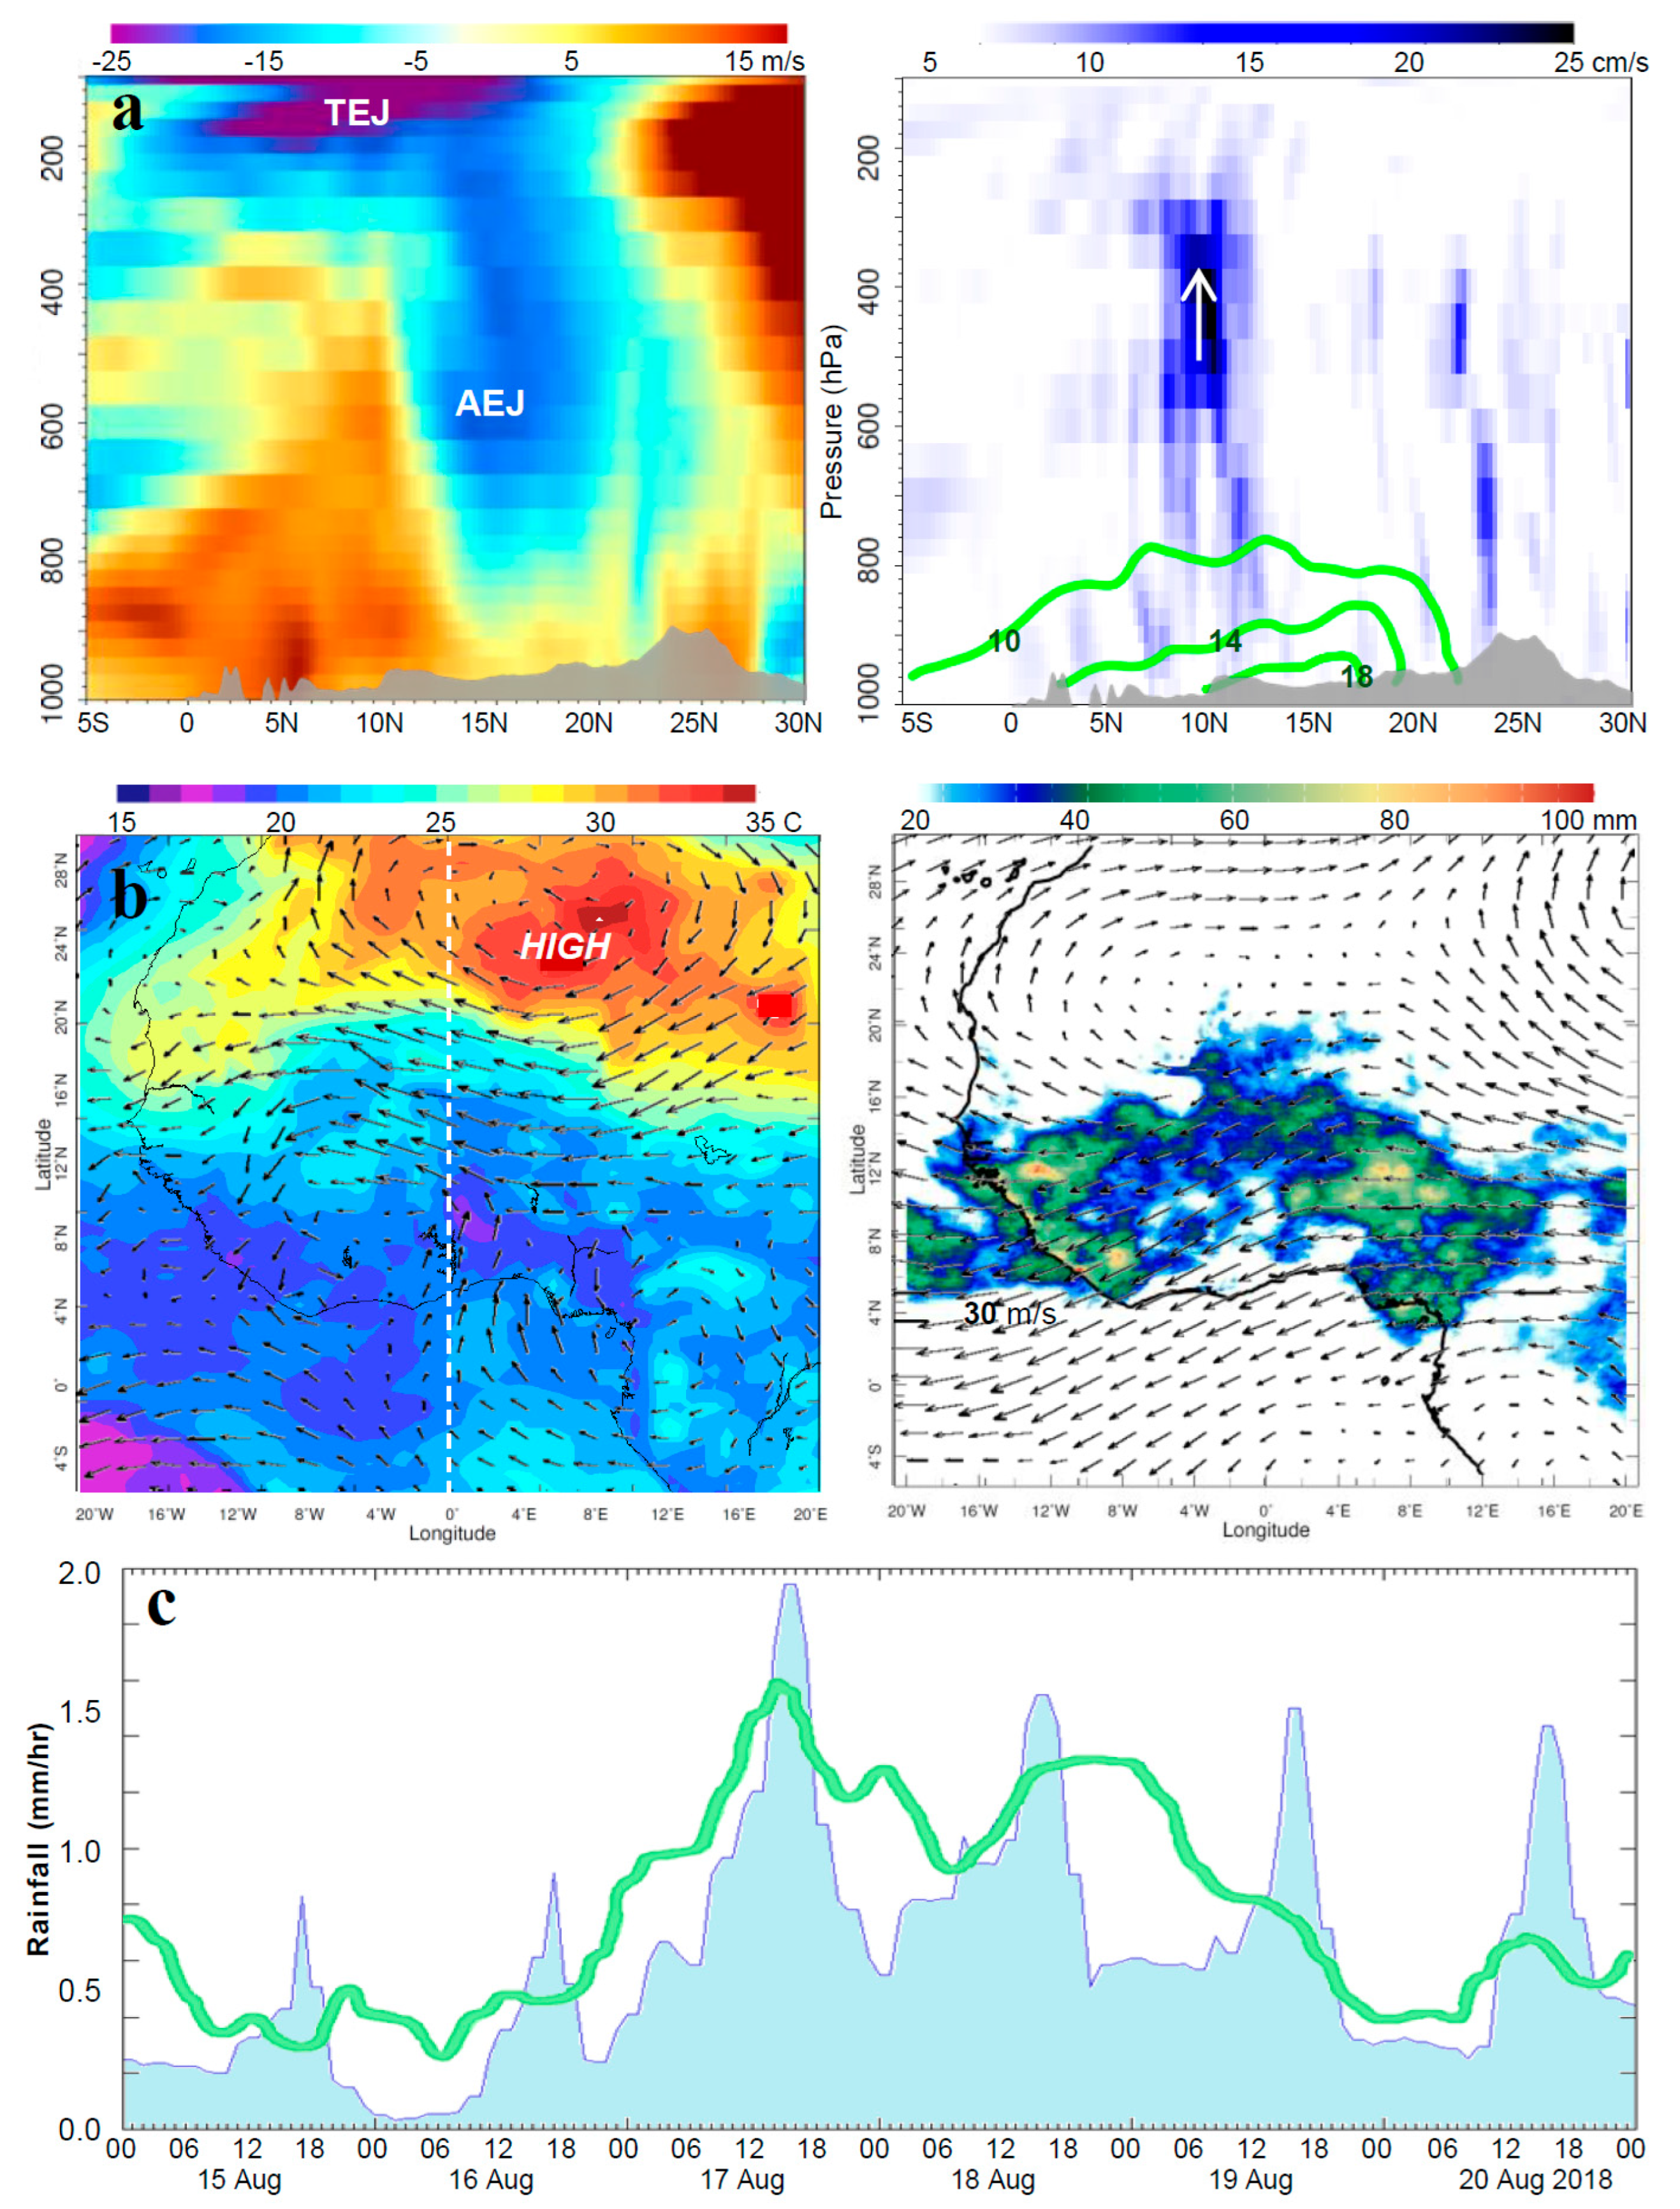
The disposition of easterly jets and the associated uplift on 18 August 2018 is analyzed as height sections on 0° E in Figure 7a. The TEJ (5 N, 100 hPa) and AEJ (15 N, 600 hPa) were active and flanked by westerlies over the Guinea Coast (5 N, 900 hPa) and the subtropical jet (30 N, 200 hPa). Cyclonic vorticity 5 × 10⁻⁴ s−1 induced 25 cm/s uplift from 7 to 12 N, 300–700 hPa, drawing moisture northward into the Sahel. Maps of the 850 hPa air temperature and 600 hPa wind (Figure 7b) reveal a warm anticyclone over the Sahara. TEJ outflow at 5–12 N spread rainfall across the Sahel at 15 W–12 E, benefiting agricultural production [22]. A comparison of hourly rainfall from reanalysis (Figure 7c) shows general agreement. The diurnal cycle of rainfall was more accentuated in ERA5 (cresting 17:00 h) than Merra2. Moist convection exceeded 1 mm/h on 17–18 August 2018 as the easterly wave passed.

4. Summary Discussion

This study has analyzed inter-annual to intra-seasonal fluctuations and the force of easterly jets and convection over North Africa and nearby oceans during the Jul–Sep season, using reanalysis and satellite datasets of 1990–2024. Four indices were formed (cf. Figure 1d) to describe the upper tropical and mid-level African easterly jets and moist convection over the Sahel and India. Time-space regression analysis identified global modulation of the jets. Cumulative departures were analyzed and ranked to form composite differences between east/convective and west/subsident seasons. The upper-level TEJ accelerated over the Arabian Sea during and after Pacific La Nina and the cool-west Indian Ocean dipole. Both jet time series had 3–4 year cycling, consistent with the alternating ENSO phase. The AEJ was also responsive to Atlantic Nino conditions that enhanced Sahel convection in the Jul–Sep season. The two jets coupled when intra-seasonal convection spread west of India. Lag correlations identified a cascade of processes: increased convection over the Bay of Bengal seven days before TEJ acceleration over the Arabian Sea, followed two days later by AEJ strengthening and moist convection over the Sahel. The case of August 2018 was analyzed when a TEJ surge penetrated westward, leading to widespread uplift and rainfall.
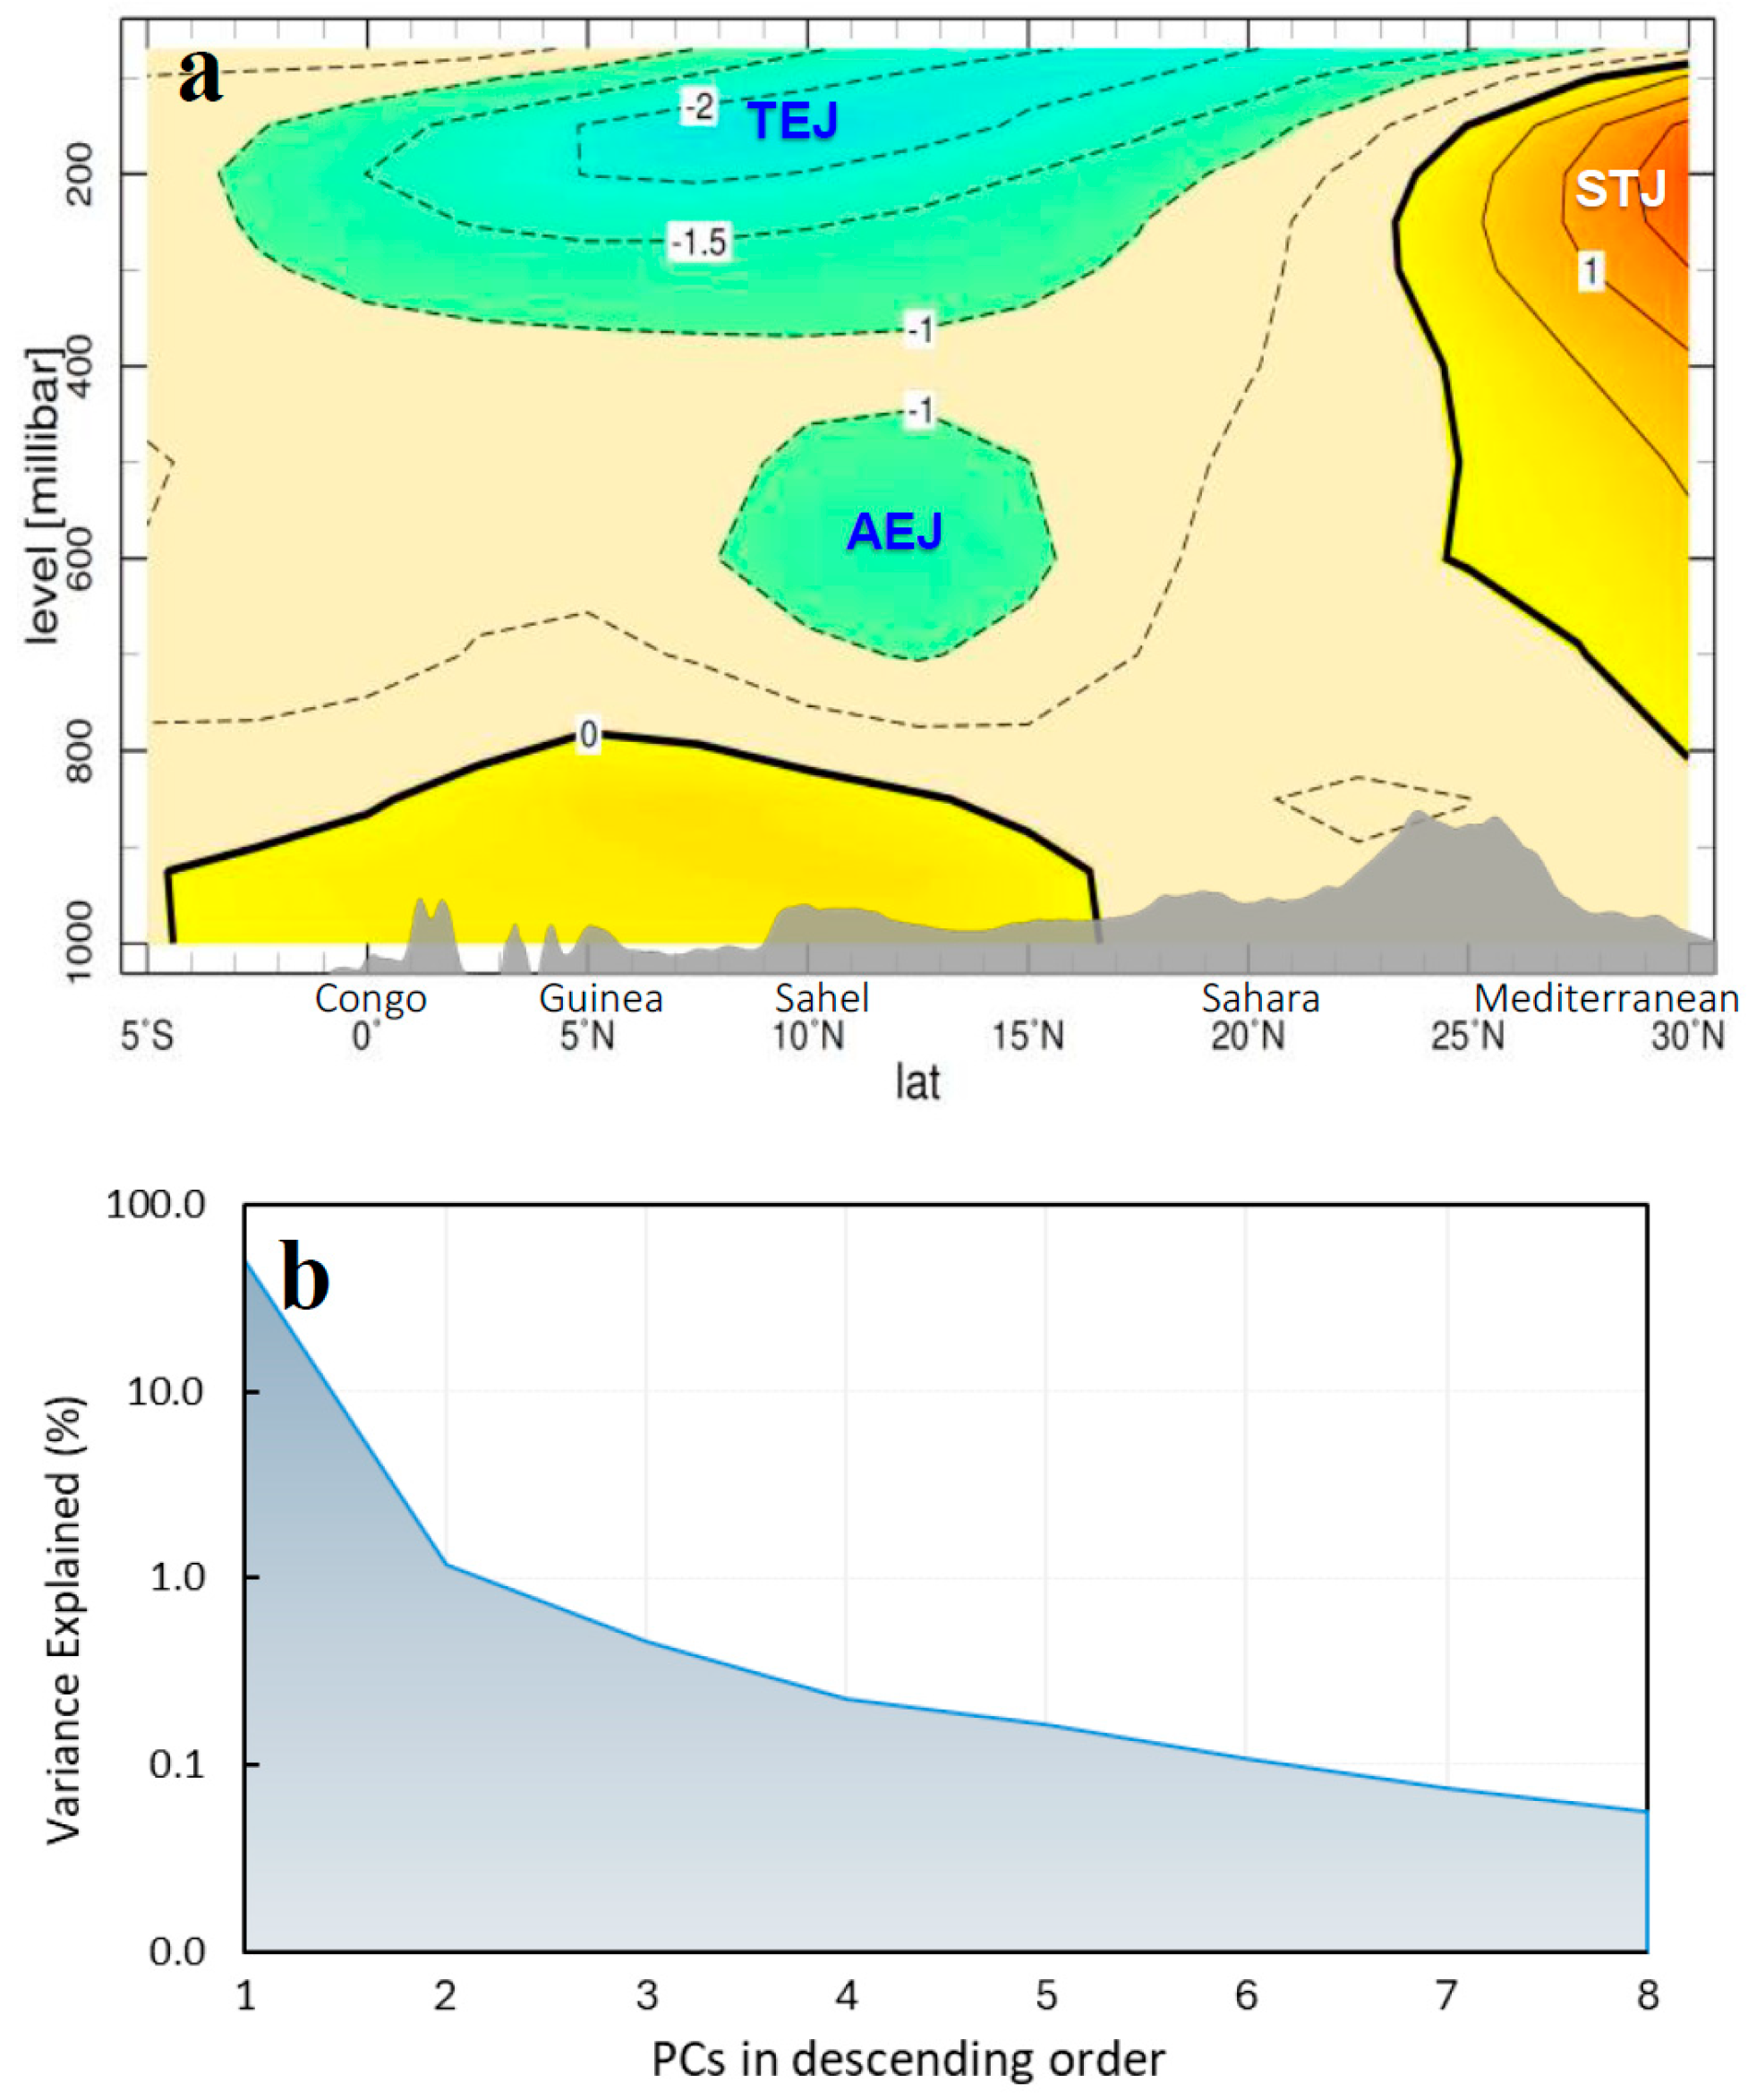
A conceptual understanding is presented in Table 1, which contrasts the opposing phases. When Pacific La Nina and -IOD coincide, the Walker circulation is fed by convective outflows from the Maritime Continent and the TEJ reaches the Sahel. It triggers low-level westerlies over the Guinea Coast that enhance vorticity uplift over the Sahel (cf. Figure 3d). When Indo-Pacific teleconnections are weak, the Atlantic Nino becomes a climate modulator (cf. Figure 4a). Inter-annual oscillations of the TEJ and AEJ tend to be coherent, according to Jul–Sep 1990–2024 eigenvector analysis (Appendix A, Figure A1). The leading mode, with 51% variance, exhibits sympathetic centers of action at 175 hPa, 9 N, TEJ and 550 hPa, 13 N, AEJ. The evidence points to simultaneous modulation of TEJ and AEJ in conjunction with the global Walker circulation and sea temperature dipoles. Infrequent decoupling of the two jets tends to suppress agricultural production in the Sahel (cf. Figure 2a). Further work will study TEJ interaction with the stratospheric circulation and consider ways to analyze changes in jet position beyond the static indices employed here.

Funding

This research received no external funding.

Acknowledgments

Indirect support from the South African Dept of Higher Education is acknowledged. Online data analysis derive from: /iridl.ldeo.columbia.edu/ (accessed on 1 May 2025), /climexp.knmi.nl/ (accessed on 1 May 2025), /apdrc.soest.hawaii.edu/las86/ and https://www.ncei.noaa.gov/erddap/ (accessed on 1 May 2025), /giovanni.gsfc.nasa.gov/ (accessed on 1 May 2025), https://weather.uwyo.edu/upperair/sounding.shtml (accessed on 1 May 2025), /www.cloudsat.cira.colostate.edu/ (accessed on 1 May 2025).

Conflicts of Interest

The author declares no conflicts of interest in this work.

Appendix A

Figure A1. Eigenvector analysis Jul–Sep 1990–2024 of zonal wind averaged 5–30 E. (a) First mode loading pattern over North Africa, with topographic profile and jet labels. (b) Declining normalized variance explained by the leading modes, PC1 = 51%.
Climate 13 00214 g0a1

References

  1. Sathiyamoorthy, V.; Pal, P.K.; Joshi, P.C. Intra-seasonal variability of the tropical easterly jet, Meteor. Atmos. Phys. 2007, 96, 305–316. [Google Scholar] [CrossRef]
  2. Webster, P.J.; Fasullo, J. Monsoon dynamical theory. Encycl. Atmos. Sci. 2003, 3, 1370–1386. [Google Scholar] [CrossRef]
  3. Huang, S.; Wang, B.; Wen, Z.; Chen, Z. Enhanced tropical eastern Indian Ocean rainfall breaks down the tropical easterly jet–Indian rainfall relationship. J. Clim. 2021, 34, 3039–3048. [Google Scholar] [CrossRef]
  4. Thorncroft, C.D.; Blackburn, M. Maintenance of the African easterly jet. Q. J. R. Meteorol. Soc. 1999, 125, 763–786. [Google Scholar] [CrossRef]
  5. Hsieh, J.-S.; Cook, K.H. Generation of African easterly wave disturbances: Relationship to the African easterly jet. Mon. Wea. Rev. 2005, 133, 1311–1327. [Google Scholar] [CrossRef]
  6. Leroux, S.; Hall, N.M.J. On the relationship between African easterly waves and the African easterly jet. J. Atmos. Sci. 2009, 66, 2303–2316. [Google Scholar] [CrossRef]
  7. Leroux, S.; Hall, N.M.J.; Kiladis, G.N. A climatological study of transient–mean-flow interactions over West Africa. Q. J. R. Meteorol. Soc. 2010, 136, 397–410. [Google Scholar] [CrossRef]
  8. Spinks, J.; Lin, Y.-L. Variability of the subtropical highs, African easterly jet and easterly wave intensities over North Africa and Arabian Peninsula in late summer. Intl. J. Climatol. 2014, 35, 3540–3555. [Google Scholar] [CrossRef]
  9. Sultan, B.; Defrance, D.; Iizumi, T. Evidence of crop production losses in West Africa due to historical global warming in crop models. Sci. Rep. 2019, 9, 12834. [Google Scholar] [CrossRef] [PubMed]
  10. Mekonnen, A. Synoptic-Scale Convection and Wave Activity over Tropical Africa and the Atlantic. Ph.D. Thesis, State University of New York, Albany, NY, USA, 2007. [Google Scholar]
  11. Nicholson, S.E. On the factors modulating the intensity of the tropical rainbelt over West Africa. Intl. J. Climatol. 2009, 29, 673–689. [Google Scholar] [CrossRef]
  12. Spinks, J.; Lin, Y.-L.; Mekonnen, A. Effects of the subtropical anticyclones over North Africa and Arabian Peninsula on the African easterly jet. Intl. J. Climatol. 2014, 35, 733–745. [Google Scholar] [CrossRef]
  13. Lemburg, A.; Bader, J.; Claussen, M. Sahel rainfall-tropical easterly jet relationship on synoptic to intraseasonal time scales. Mon. Weather Rev. 2019, 147, 1733–1752. [Google Scholar] [CrossRef]
  14. Preethi, B.; Sabin, T.; Adedoyin, J.; Ashok, K. Impacts of the ENSO and other tropical climate-drivers on African rainfall. Sci. Rep. 2015, 5, 16653. [Google Scholar] [CrossRef] [PubMed]
  15. Huang, S.; Wen, Z. Diversity of the tropical easterly jet’s core location. Environ. Res. Lett. 2024, 19, 074027. [Google Scholar] [CrossRef]
  16. Liu, S.; Huang, S.; Tan, Y.; Wen, Z.; Chen, X.; Guo, Y. Characteristics and mechanisms of the interannual variability of the Northwest–Southeast shift of the tropical easterly Jet’s core in July. J. Clim. 2024, 37, 3219–3235. [Google Scholar] [CrossRef]
  17. Gelaro, R.; McCarty, W.; Suárez, M.J.; Todling, R.; Molod, A.; Takacs, L.; Randles, C.A.; Darmenov, A.; Bosilovich, M.G.; Reichle, R.; et al. The modern-era retrospective analysis for research and applications, v2 (Merra2). J. Clim. 2017, 30, 5419–5454. [Google Scholar] [CrossRef] [PubMed]
  18. Reynolds, R.W.; Smith, T.M.; Liu, C.; Chelton, D.B.; Casey, K.S. Daily high-resolution blended analyses for sea surface temperature. J. Clim. 2007, 20, 5473–5496. [Google Scholar] [CrossRef]
  19. Penny, S.G.; Behringer, D.W.; Carton, J.A.; Kalnay, E. The hybrid global ocean data assimilation system at NCEP. Mon. Wea. Rev. 2015, 143, 4660–4677. [Google Scholar] [CrossRef]
  20. Lee, H.-T. Climate Algorithm Theoretical Basis Document: Outgoing Longwave Radiation (OLR); NOAA’s CDR Program, CDRP-ATBD-0526; NOAA Climate Data Record Program Office: Asheville, NC, USA, 2014; 46p. [Google Scholar]
  21. Funk, C.; Verdin, A.; Michaelsen, J.; Peterson, P.; Pedreros, D.; Husak, G. A global satellite-assisted precipitation climatology. Earth Syst. Sci. Data Discuss. 2015, 8, 25. [Google Scholar] [CrossRef]
  22. FAOstat. Aggregated Crop Yield over the Sahel. 2025. Available online: https://www.fao.org/faostat/en/#data/QI (accessed on 1 May 2025).
  23. White, W.B. Tropical coupled Rossby waves in the Pacific ocean–atmosphere system. J. Phys. Oceanogr. 2000, 30, 1245–1264. [Google Scholar] [CrossRef]
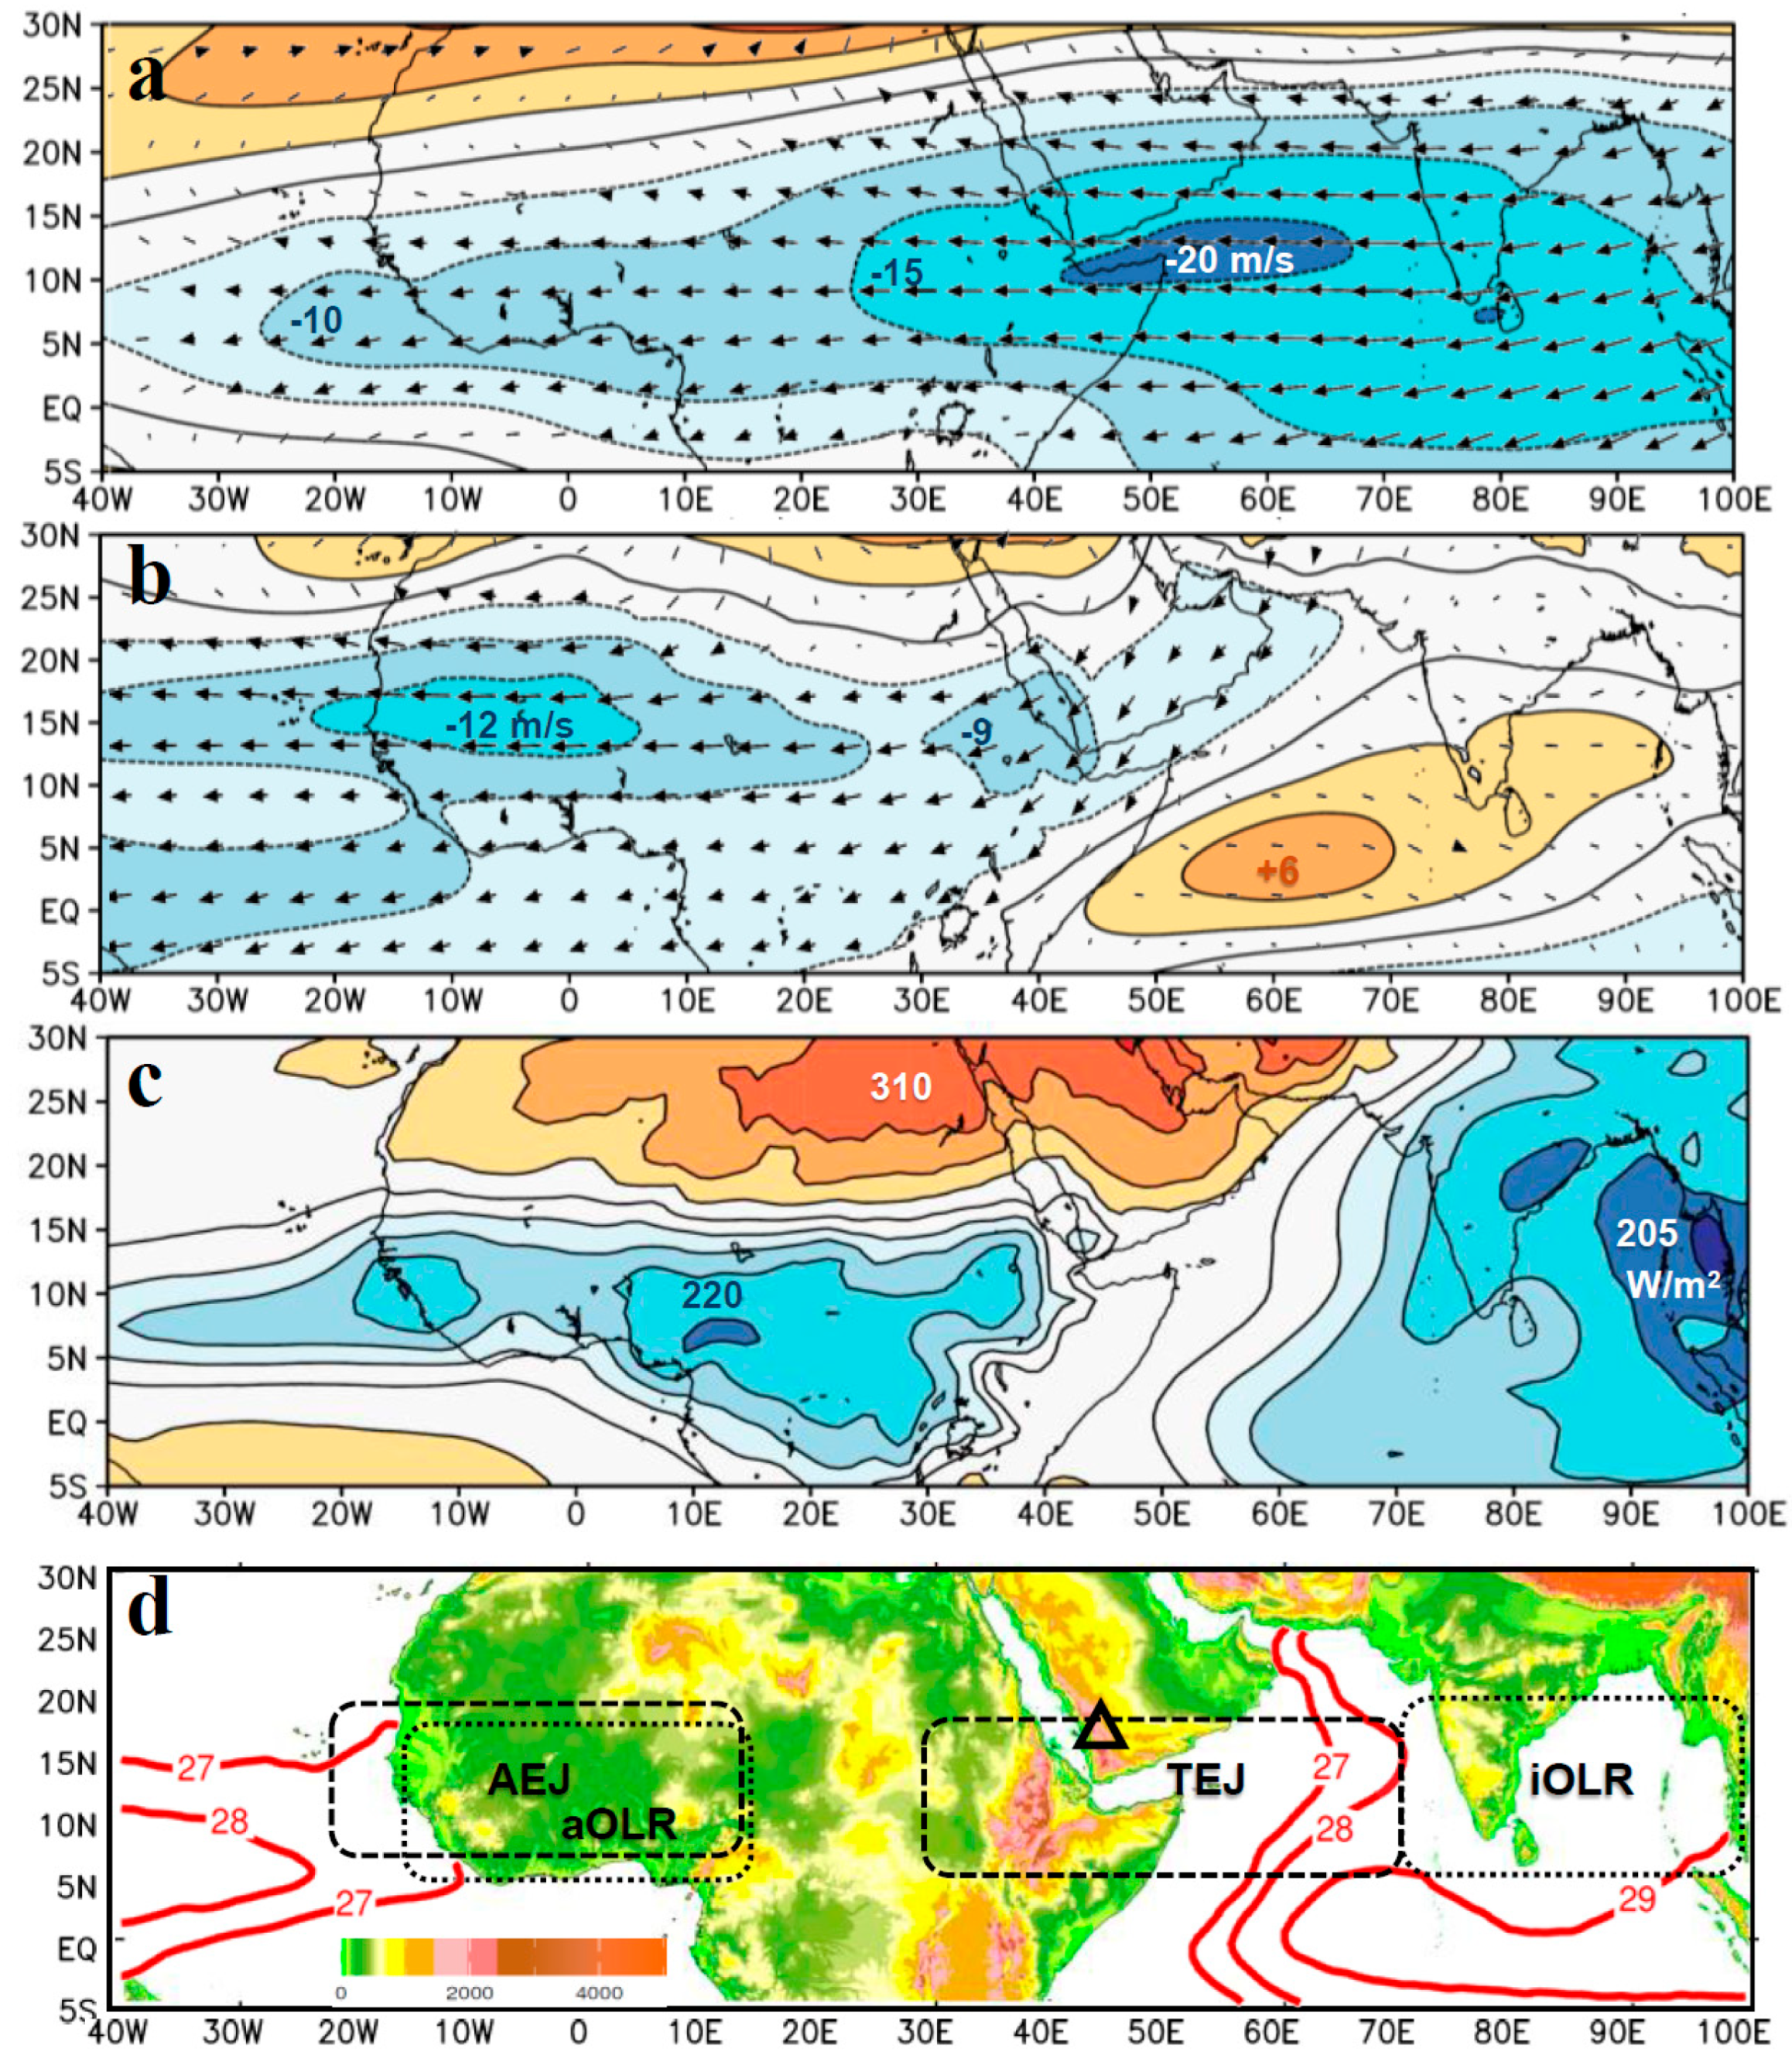
Figure 1. Long-term average Jul–Sep: (a) 150–200 hPa zonal wind and vectors, (b) 500–600 hPa zonal wind and vectors, (c) net outgoing long-wave radiation 1990–2024, (d) topography (shaded), SST > 27C (red contour) and index areas (dashed), triangle is radiosonde. The outcomes in (ac) are used to define the index areas in (d).
Climate 13 00214 g001
Figure 2. (a) Three-year running correlation of indices (median red, terciles shaded), blue line is Sahel crop yield. (b) Wavelet spectral analysis of inter-annual filtered TEJ (left) and AEJ indices, color shaded from 90 to 99% confidence (blue–orange). (c) Inverted Jul–Sep index standardized departures. TEJ (left) and AEJ time-space regression onto Jul–Sep fields: (d) SST, (e) OLR, R > |0.28| achieves 90% confidence. (f) Lag correlation of (inverted) Jul–Sep TEJ with ENSO and IOD indices. Correlations refer to accelerated jets.
Climate 13 00214 g002
Figure 3. (a) Cumulative (inverted) Jul–Sep standardized departures of the four index time series, used to define >1σ positive (east/conv) and negative (weak/subs) phase. Composites of 5 positive: 1996, 1998, 2010, 2020, 2021, minus 5 negative seasons: 1990, 1997, 2002, 2015, 2023, illustrating: (b) zonal circulation difference (vectors and contours) and (c) humidity (shaded) and temperature (red contour) differences along height section averaged 5–17 N. (d) Composite of meridional circulation (vector) and U-wind (shaded), along height section averaged 5–30 E, with topographic profile and vertical motion exaggerated. Composites refer to accelerated jets and rainy weather.
Climate 13 00214 g003
Figure 4. Composites of 5 positive minus 5 negative seasons, depth section averaged 0–15 N of: (a) upper ocean temperature and (b) zonal current (vector, largest 0.1 m/s) and salinity differences (<−0.15 ppt, blue contour) with vertical motion exaggerated. (c) Composite map of near-surface (925 hPa) wind (vector, largest 5 m/s) and rainfall differences (shaded, mm). Composites refer to differences when both TEJ and AEJ are accelerated.
Climate 13 00214 g004
Figure 5. (a) Cumulative correlation of Jul–Sep daily indices with TEJ. (b) Lag correlation of daily indices TEJ vs. iOLR and AEJ, Jul–Sep 2004–2024, N = 1932. (c) Correlation of (inverted) TEJ index on Jul–Sep OLR field at 7 day lead, blue—convective/red—subsident.
Climate 13 00214 g005
Figure 6. (a) Daily time series of indices in Jul–Sep 2018, not inverted. (b) Hovmoller plots along 0° E of (left) 850 hPa temperature and 400 hPa specific humidity in 2018; arrows point to case study. (c) Radiosonde temperature (left) and wind profiles at 18 N, 42 E on 16–17 Aug 2018. (d) Cloudsat reflectivity (shaded) along 5 E height section on 17 Aug with meridional circulation (vectors, largest 5 m/s).
Climate 13 00214 g006
Figure 7. Case study of easterly wave over the Sahel 18 August 2018: (a) height sections on 0° E dashed in (c) of (left) zonal wind and upward motion (>5 cm/s, blue shaded) and specific humidity (>10 g/kg, green contour) with topographic profile. (b) 18 Aug 2018 maps of (left) 850 hPa air temperature (shaded) and 600 hPa wind (vector, largest 15 m/s) and (right) rainfall (mm) and 150 hPa wind (vector, largest 30 m/s). (c) Hourly rain rate averaged over the Sahel 5–15 N, 12 W–12 E (mm/h): ERA5 blue shaded, Merra2 green line, time = local.
Climate 13 00214 g007
Table 1. Conceptual understanding from the research.
Positive PhaseNegative Phase
India convectionIndia subsidence
TEJ surgeTEJ weak
AEJ linkedAEJ decoupled
Sahel convectionSahel subsidence
Pacific La NinaPacific El Nino
Negative I.O.D.Positive I.O.D.
Atlantic NinoAtlantic Nina
Strong -dT/dyWeak -dT/dy
Outflow from M.C.Weak flow M.C.
Favorable rainfallInadequate rainfall
Surplus crop yieldResource deficits
Disclaimer/Publisher’s Note: The statements, opinions and data contained in all publications are solely those of the individual author(s) and contributor(s) and not of MDPI and/or the editor(s). MDPI and/or the editor(s) disclaim responsibility for any injury to people or property resulting from any ideas, methods, instructions or products referred to in the content.