Article

Temporal Variability of Major Stratospheric Sudden Warmings in CMIP5 Climate Change Scenarios

by
Víctor Manuel Chávez-Pérez
1,2,*,
Juan A. Añel
3,
Citlalli Almaguer-Gómez
4 and
Laura de la Torre
3
1
Department of Basic Sciences, University Center of Tlaquepaque, University of Guadalajara, San Pedro Tlaquepaque 45599, Mexico
2
Department of Mechatronics, Technological University of Jalisco, Guadalajara 44970, Mexico
3
Environmental Physics Laboratory (EPhysLab), Centro de Investigación Mariña (CIM-UVIGO), Universidade de Vigo, Edificio Campus da Auga, 32004 Ourense, Spain
4
Department of Electro-Photonics, University Center of Exact Sciences and Engineering, University of Guadalajara, Av. Revolución 1500, Guadalajara 44430, Mexico
*
Author to whom correspondence should be addressed.
Climate 2025, 13(10), 207; https://doi.org/10.3390/cli13100207
Submission received: 10 August 2025 / Revised: 23 September 2025 / Accepted: 29 September 2025 / Published: 2 October 2025
(This article belongs to the Section Climate and Environment)

Abstract

Major stratospheric sudden warmings are key processes in the coupling between the stratosphere and the troposphere, exerting a direct influence on mid-latitude climate variability. This study evaluates projected changes in the frequency of these phenomena during the 2006–2100 period using six high-top general circulation models from the CMIP5 project under the Representative Concentration Pathway scenarios 2.6, 4.5, and 8.5. The analysis combines the full future period with a moving-window approach of 27 and 48 years, compared against both the satellite-era (1979–2005) and extended historical (1958–2005) periods. This methodology reveals that model responses are highly heterogeneous, with alternating periods of significant increases and decreases in event frequency, partially modulated by internal variability. The magnitude and statistical significance of the projected changes strongly depend on the chosen historical reference period, and most models tend to reproduce displacement-type polar vortex events preferentially over split-type events. These results indicate that assessments based solely on multi-model means or long aggregated periods may mask subperiods with robust signals, although some of these may arise by chance given the 5% significance threshold. This underscores the need for temporally resolved analyses to improve the understanding of stratospheric variability and its potential impact on climate predictability.

1. Introduction

1.1. Background on SSW Dynamics

The stratospheric polar vortex is a large-scale cyclonic structure that dominates Northern Hemisphere (NH) atmospheric circulation during the boreal winter. It is characterized by a low-pressure region surrounded by strong westerly zonal winds rotating counterclockwise around the Arctic, primarily between 10 and 50 hPa [1,2,3,4,5]. Stratospheric Sudden Warmings (SSWs) correspond to large-scale dynamic disturbances of this system, mainly associated with the upward propagation of planetary waves from the troposphere, which transfer momentum and heat to the stratosphere and weaken the polar vortex [6,7,8,9].
These disturbances modify the zonal circulation through planetary wave forcing, which promotes the weakening of the polar vortex, induces adiabatic descent of air, and consequently produces an abrupt temperature increase in the polar stratosphere that may include the reversal of the zonal wind [6,8,9,10]. According to the classical definition adopted by the World Meteorological Organization, SSWs are classified into minor or major events. Minor events exhibit a significant warming without reversal of the 60° N, 10 hPa mean zonal wind, while major events (referred to as SSWm in this study) imply a full westerly-to-easterly reversal at the same latitude and level [7,11,12].
Understanding the dynamical mechanisms that trigger SSWm remains one of the main challenges in middle-atmosphere studies. Recent research has highlighted the complexity of the interactions between planetary waves and the zonal circulation, as well as the influence of factors such as tropospheric forcing and the state of the Quasi-Biennial Oscillation (QBO) in generating SSWm [13,14]. Furthermore, investigations of recent events have provided new insights into the variability and predictability of these phenomena [15].
The study of SSWm events is particularly relevant due to their impact on sub-seasonal weather predictability and their influence on mid-latitude climate variability [8,9,16]. For this reason, SSWm events have been widely analyzed using both reanalyses data and climate simulations. These studies range from single-model experiments to multi-model intercomparison exercises, within initiatives such as the Coupled Model Intercomparison Project (CMIP) [17,18,19,20,21,22] and the Chemistry–Climate Model Initiative (CCMI) [7,23].
It is well documented that the ability of climate models to reproduce the observed frequency of SSWm events depends strongly on the climatology of the polar vortex, particularly on the strength and variability of the stratospheric zonal wind [22,24,25,26,27]. When SSWm events occur, they can manifest as displacements or splits of the polar vortex, denoted as S S W D and S S W S , respectively. These configurations are mainly controlled by the vertical propagation of Rossby planetary waves: S S W D events are usually dominated by wave-1 activity, whereas S S W S events are associated with wave-2 amplification [6,9,12,15,28,29,30,31,32].
Although few multi-model studies have explicitly addressed the classification between S S W D and S S W S , the available evidence indicates substantial differences in both their internal structure and associated tropospheric response. In particular, S S W S events tend to induce a stronger and more persistent tropospheric response, with a predominantly barotropic structure throughout the stratosphere, whereas S S W D events exhibit more baroclinic characteristics and a weaker tropospheric signal [8,19,20,27].
Recent studies using CMIP5 and CMIP6 models show that the simulated mean frequency of S S W D events largely exceeds that of S S W S events, thereby underestimating the relative occurrence of S S W S in comparison with reanalyses. For the satellite-era period (1979–2005), reanalyses indicate that displacement events occurred only 0.70–0.80 times as frequently as S S W S , while for the extended period (1958–2005) this ratio was 0.67. In contrast, CMIP5 simulations yield mean displacement-to-split ratios of 3.26 ± 2.19 (1979–2005) and 3.19 ± 1.46 (1958–2005), demonstrating a systematic overrepresentation of displacement events [26]. For CMIP6, reanalyses covering the extended satellite record report nearly equal frequencies of both event types (≈four S S W D and two S S W S per decade, corresponding to ratios of 1.1 in ERA-Interim and 1.5 in ERA5), whereas most models continue to underestimate S S W S events, with displacement-to-split ratios ranging from 1.42 to 8.95 [27]. This discrepancy reflects the persistent difficulty of models to adequately reproduce wave-2 propagation, which is essential for S S W S occurrence. Moreover, some models invert the observed ratio between the two types, artificially favoring S S W D , which can affect the assessment of projected tropospheric responses and the patterns associated with AO/NAO in future scenarios [33].
This study provides a complementary approach by combining a moving-window analysis with the classification of S S W D and S S W S types using several CMIP5 [34] high-top models. Although CMIP6 simulations are now available, CMIP5 remains appropriate for this analysis as it offers a broad set of historical and future integrations, allowing consistent temporal comparisons with previous multi-model studies. By focusing on event frequencies with temporal resolution rather than long-term aggregated means, the analysis identifies subperiods with statistically significant changes that might remain unnoticed in traditional approaches, providing additional insight into stratospheric variability and its potential implications for mid-latitude climate predictability.

1.2. SSWm Under Climate Change and Modeling Challenges

Assessing how anthropogenic climate change affects the frequency of SSWm events is challenging, mainly due to the limited length of observational records for comparison. Previous analyses of projections under the RCP8.5 scenario found that 21 out of 27 CMIP5 models exhibited an increasing trend in SSWm frequency [21]. Conversely, a study using 12 CCMI models with the REFC2 simulation (based on RCP6.0), found no robust evidence of future changes, suggesting that the RCP6.0 forcing may be insufficient to generate a clear signal [35]. This difference between scenarios had already been anticipated in previous studies [36,37], although its verification remains difficult due to the limited availability of RCP8.5 simulations in both CMIP and CCMI frameworks [8,24].
Most of the aforementioned studies do not explicitly distinguish between event types, with one exception [38], who used the CESM2-WACCM model under different scenarios. Their results show SSWm frequencies of 4–7 events per decade, comparable to the ∼6 per decade reported in ERA-Interim and NCEP/NCAR reanalyses. However, they identified a systematic underestimation in the simulated frequency, particularly for S S W S events, consistent with previous findings [25,26,27]. Again, this limitation is related to the difficulty of models in reproducing wave-2 propagation, which is fundamental for vortex-splitting events.
Based on the above, this study analyzes changes in SSWm frequency under different CMIP5 climate change scenarios, including event-type classification, unlike most previous studies. Only “high-top” models were selected, as they have been shown to reproduce the main stratospheric features relevant for SSWm [26,27]. The choice of CMIP5, rather than CMIP6, responds to the availability of a larger number of previous studies for contextualizing results and to the fact that the main biases, such as the underrepresentation of S S W S events, persist in CMIP6 [24,27].
Additionally, this work incorporates a methodological approach that has not been common in previous studies: the use of moving windows to estimate SSWm frequency. This approach allows averaging over intervals of the same length as the historical periods, avoiding the combination of very different forcing phases in the 2006–2100 mean. Two historical periods are used to define the window length: 1958–2005 (pre-satellite) and 1979–2005 (satellite). This makes it possible to evaluate the temporal evolution of SSWm frequency in a manner consistent with both the forcing signal and internal variability. This strategy allows distinguishing robust changes from internal variability and provides a solid basis for assessing climate change scenarios.

2. Data and Methods

To analyze future changes in the frequency of SSWm under different climate change scenarios, six CMIP5 high-top models were selected (CMCC-CESM, CMCC-CMS, HadGEM2-CC, IPSL-CM5A-MR, MPI-ESM-LR, and MPI-ESM-MR). The data from the CMIP5 simulations was obtained from https://esgf-metagrid.cloud.dkrz.de (accessed on 30 September 2025). These models were previously evaluated against reanalyses, confirming their ability to reproduce the main observed features of SSWm variability, particularly during the satellite era [26]. During 1979–2005, they reproduced at least seven of the basic characteristics of SSWm. Other models met most criteria but were discarded because they did not adequately reproduce the annual event frequency, which is the primary characteristic evaluated in this study. For all analyses, only the first ensemble member of the historical (1950–2005) and future (2006–2100) simulations was used. Table 1 lists the selected models along with their available RCP scenarios, horizontal resolution, number of vertical levels, and model top.
The detection of SSWm events followed the definition of the World Meteorological Organization (WMO), from which the criterion introduced by Charlton and Polvani (hereafter CP07) is derived [11,39]. According to the WMO, a major SSW occurs when the zonal mean wind at 60° N and 10 hPa reverses from westerly to easterly, accompanied by a sudden and significant stratospheric temperature increase over the winter pole. CP07 proposed a simplified method based solely on zonal wind reversal, arguing that the warming is implicitly captured in the dynamics. Previous studies have shown that both criteria produce equivalent results for event frequency [23,39].
In this work, the CP07 criterion was applied, with the reversal date considered as the central day of the event, which ends when the zonal wind returns to westerly during the November–March season.
To assess future changes in SSWm frequency, we used a moving-window methodology as an extension of previous work [26]. The procedure consists of counting events within consecutive 27-year intervals, shifting the window by one year across 2006–2100. This window length matches the duration of the two historical periods used as reference here: 1979–2005 (satellite era) and 1958–2005 (extended, including the pre-satellite era). This technique allows identifying smooth trends and possible non-monotonic changes in SSWm frequency, reducing the influence of short-term internal variability and the progressive intensification of radiative forcing during the 21st century.
Within each window, SSWm events were identified using the CP07 criterion, and the total number of events was used as the occurrence frequency. Simulated frequencies were then compared with both historical reference periods (1958–2005 and 1979–2005) to evaluate statistical significance. The standard error of event frequency was calculated following CP07, as the standard deviation of the sample divided by the square root of the number of years within each moving window. Finally, future changes were analyzed under the available RCP2.6, RCP4.5, and RCP8.5 scenarios for each model. This comparison allows us to detect potential trends and assess the sensitivity of the diagnosis to the chosen historical reference period.
This analysis follows some methodological elements of previous work [26], such as model selection and the CP07 detection criterion, but focuses specifically on the frequency of SSWm events under climate change scenarios. This approach allows examining the temporal evolution of the simulated frequency in different CMIP5 models, evaluating its sensitivity to projected radiative forcing, and quantifying how it depends on the historical reference period.

3. Results

3.1. Analysis of the Annual Mean Frequency of SSWm Under Different Climate Change Scenarios

Although the most robust analysis requires time windows of comparable length, we also include the calculation of the annual mean SSWm frequency for the entire future period (2006–2100), following the approach commonly used in previous studies. This mean is compared with both historical periods (1958–2005 and 1979–2005) to illustrate how the choice of reference period affects the assessment of changes in SSWm frequency (Table 2).
For the RCP2.6 scenario, simulated frequencies are similar to historical values. None of the three models with this scenario show statistically significant differences from 1979 to 2005. However, when compared with 1958–2005, one model shows a significant decrease in SSWm frequency.
Under RCP4.5, two of the five models do not differ significantly from 1979 to 2005: CMCC-CMS shows a decrease, and HadGEM2-CC shows an increase. Compared to 1958–2005, four models show significant differences: two with decreases (CMCC-CMS and MPI-ESM-MR) and two with increases (HadGEM2-CC and MPI-ESM-LR).
For RCP8.5, five of the six models show significant differences relative to 1979–2005, with four showing increases (CMCC-CESM, HadGEM2-CC, MPI-ESM-LR, and MPI-ESM-MR) and one showing a decrease (CMCC-CMS). Using 1958–2005 as the reference, four models show significant differences: three with increases (CMCC-CESM, HadGEM2-CC, and MPI-ESM-LR) and one with a decrease (CMCC-CMS).
The results do not allow a definitive conclusion about how SSWm occurrence frequency will change in the future since no consistent increasing or decreasing trend is identified. This behavior is consistent with the contradictory conclusions of previous studies, which also could not determine a clear response of SSWm frequency under climate change scenarios [21,35,36,37,38,40,41,42,43,44].
In this analysis, the models show heterogeneous behavior: some exhibit significant increases in frequency, others decreases, and in some cases both behaviors occur within different future periods. The question arises if multi-model averages and analyses of extended periods could mask internal temporal variability and, therefore, the existence of subperiods in which SSWm frequency changes do reach statistical significance. To address this uncertainty, this study analyzes subperiods defined using moving windows, generating for each model a continuous series combining historical data (1950–2005) with future simulations (2006–2100).

3.2. Analysis of SSWm Occurrence Frequency Using Moving Averages

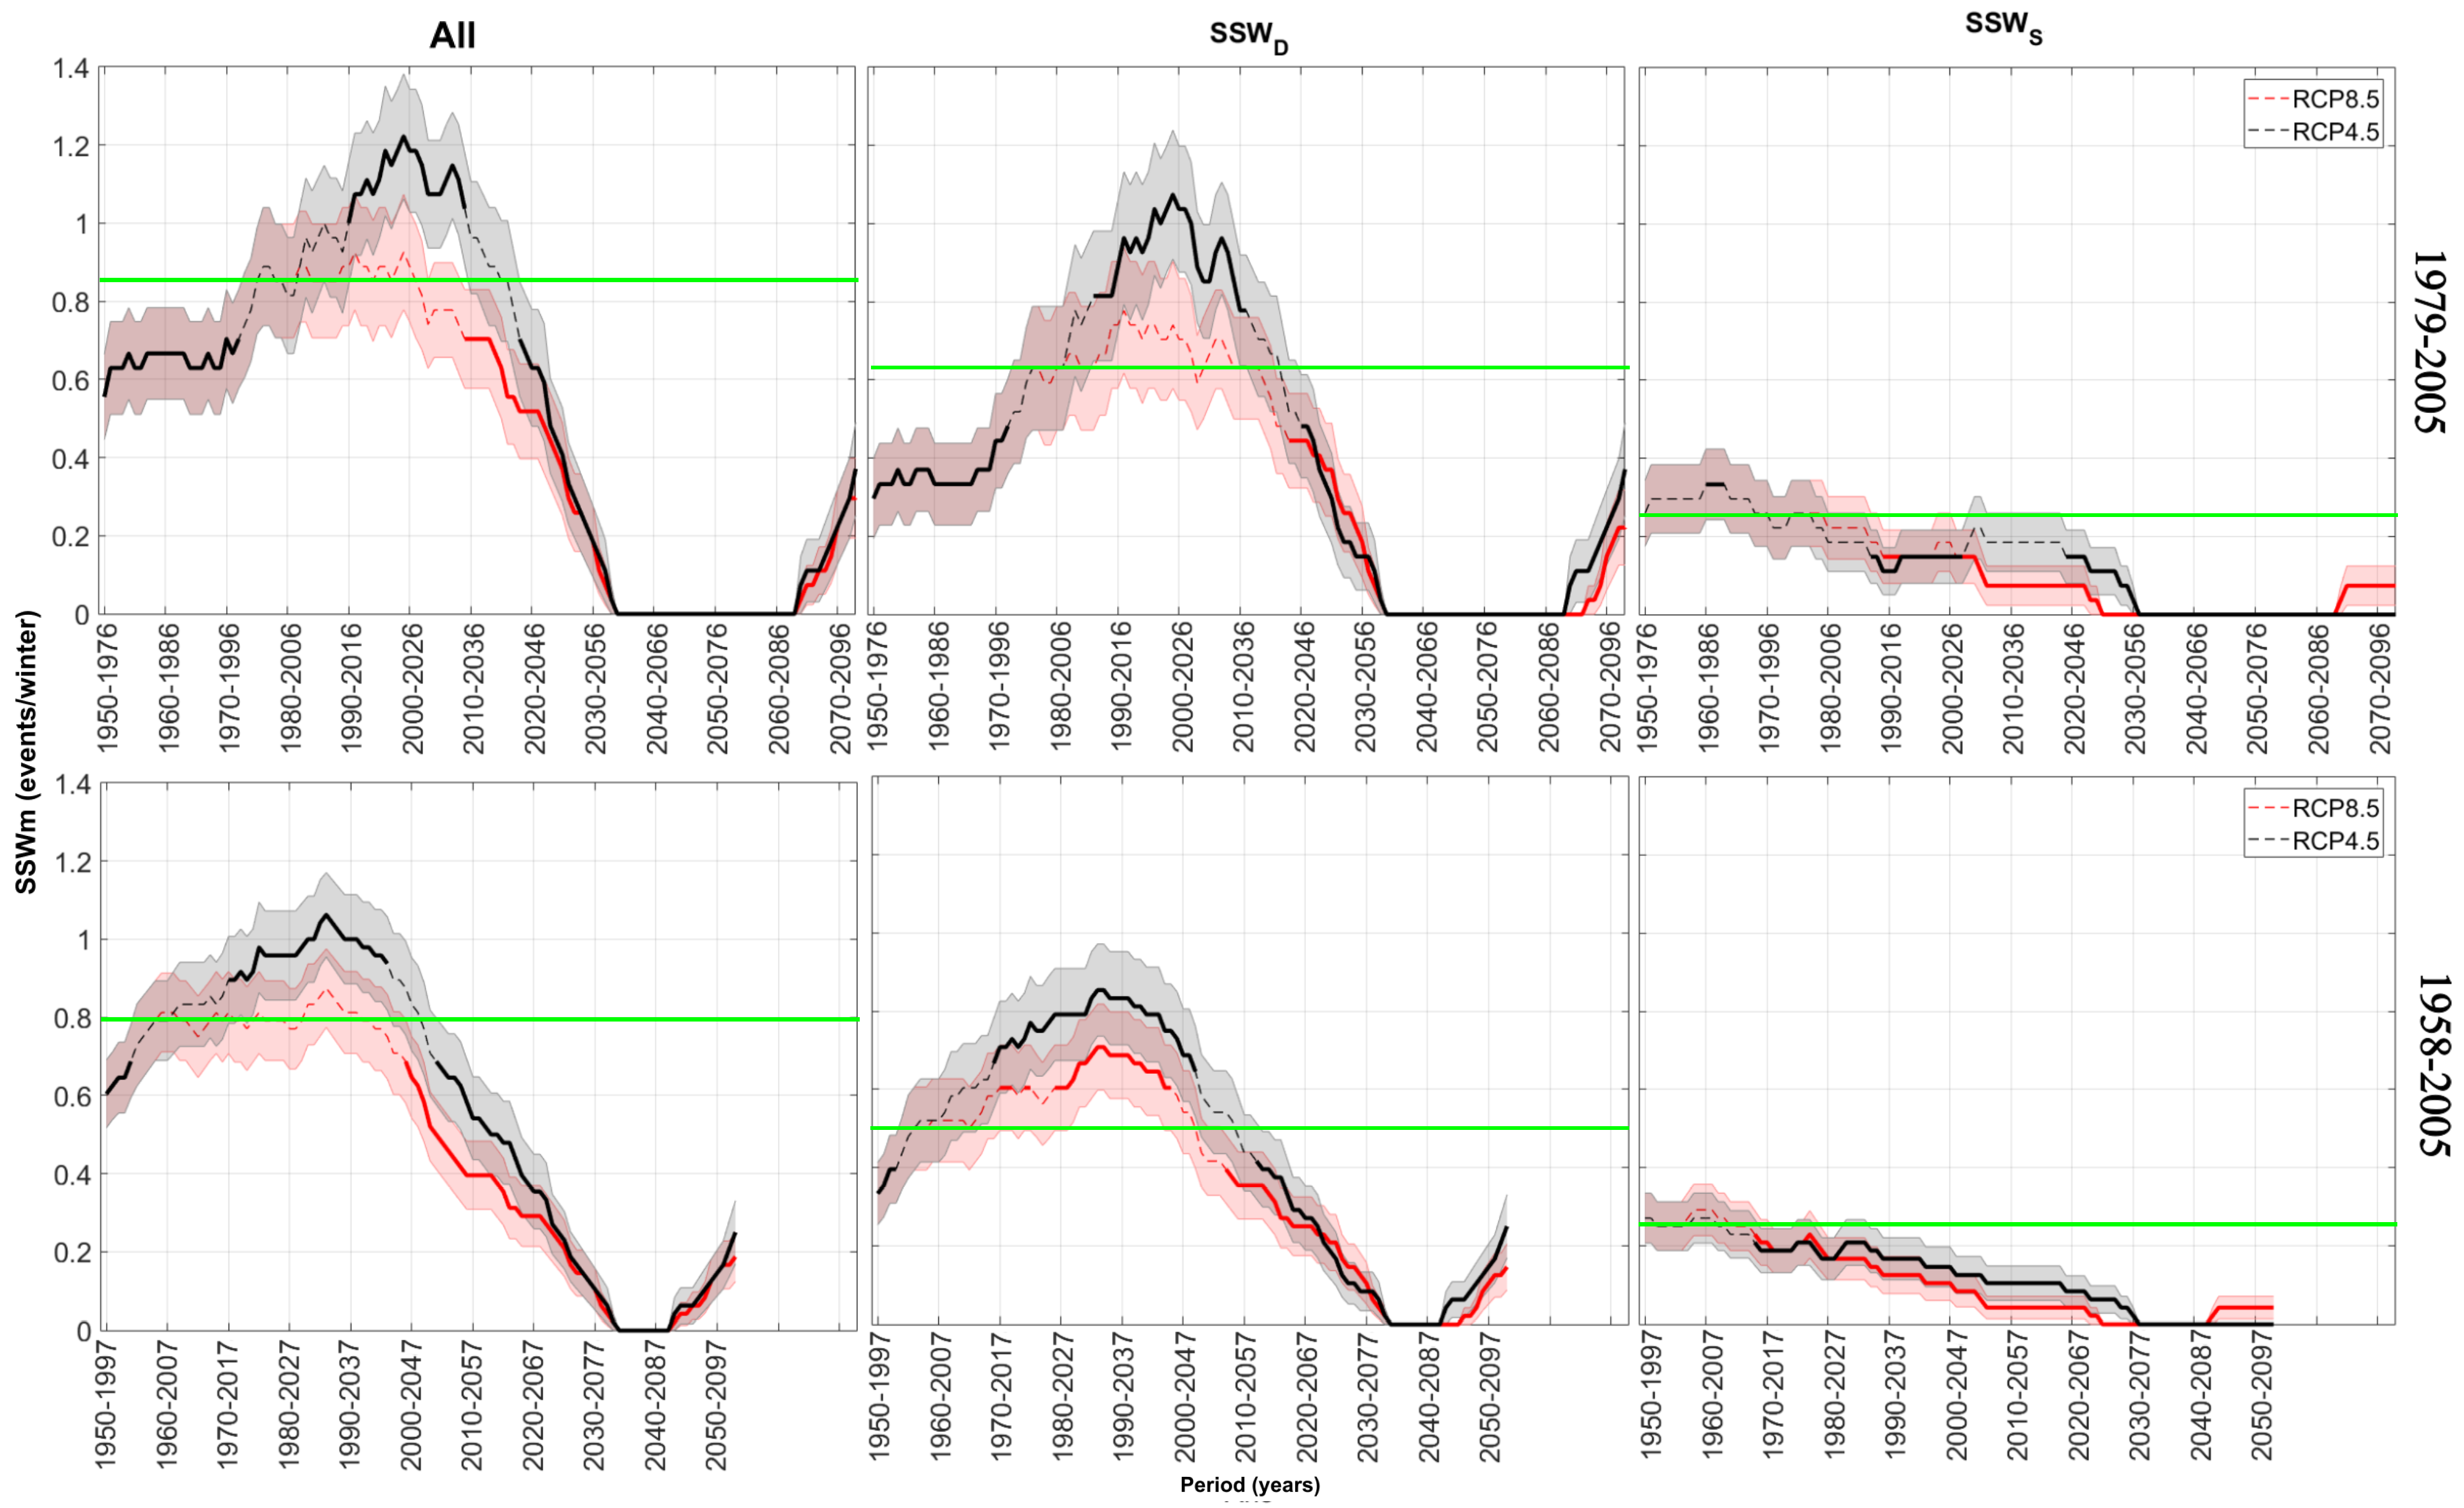
As the satellite period spans 27 years and the extended historical period spans 48 years, therefore, moving windows of 27 and 48 years are used here to calculate SSWm frequency and evaluate its statistical significance. For example, for the 27-year window, the period 1979–2005 is compared sequentially with 1950–1976, then 1951–1977, and so on. This application of the moving-window method reveals subperiods with significant changes that remain hidden when only long-term averages are considered.
Figure 1 shows the temporal behavior of SSWm frequency for the CMCC-CESM model under the RCP8.5 scenario. This model shows a significant increase relative to both reference periods. For S S W S events, an initial increase is followed by a temporary decrease toward the end of the series, while S S W D events show a less pronounced pattern.
Figure 2 shows the temporal evolution of frequency for the RCP scenarios of the CMCC-CMS model. For RCP4.5, S S W D events show a significant increase in SSWm frequency in both reference periods, followed by a significant decrease, due to a 58-year period with no events starting in 2034. This extended period without events has no precedent in the literature, making it an interesting target for future detailed analysis to understand the mechanisms behind the disappearance of events. For RCP8.5, all cases show a significant decrease, with only a brief initial increase in S S W D before the decline. For S S W S events, all scenarios show only a significant decrease in occurrence frequency.
Figure 3 shows the temporal evolution of frequency for the RCP scenarios of the HadGEM2-CC model. A significant increase in SSWm occurrence is observed relative to the historical reference period for both the RCP8.5 and RCP4.5 scenarios, with a greater number of events (of both types) in RCP4.5 compared to RCP8.5 throughout the entire future period.
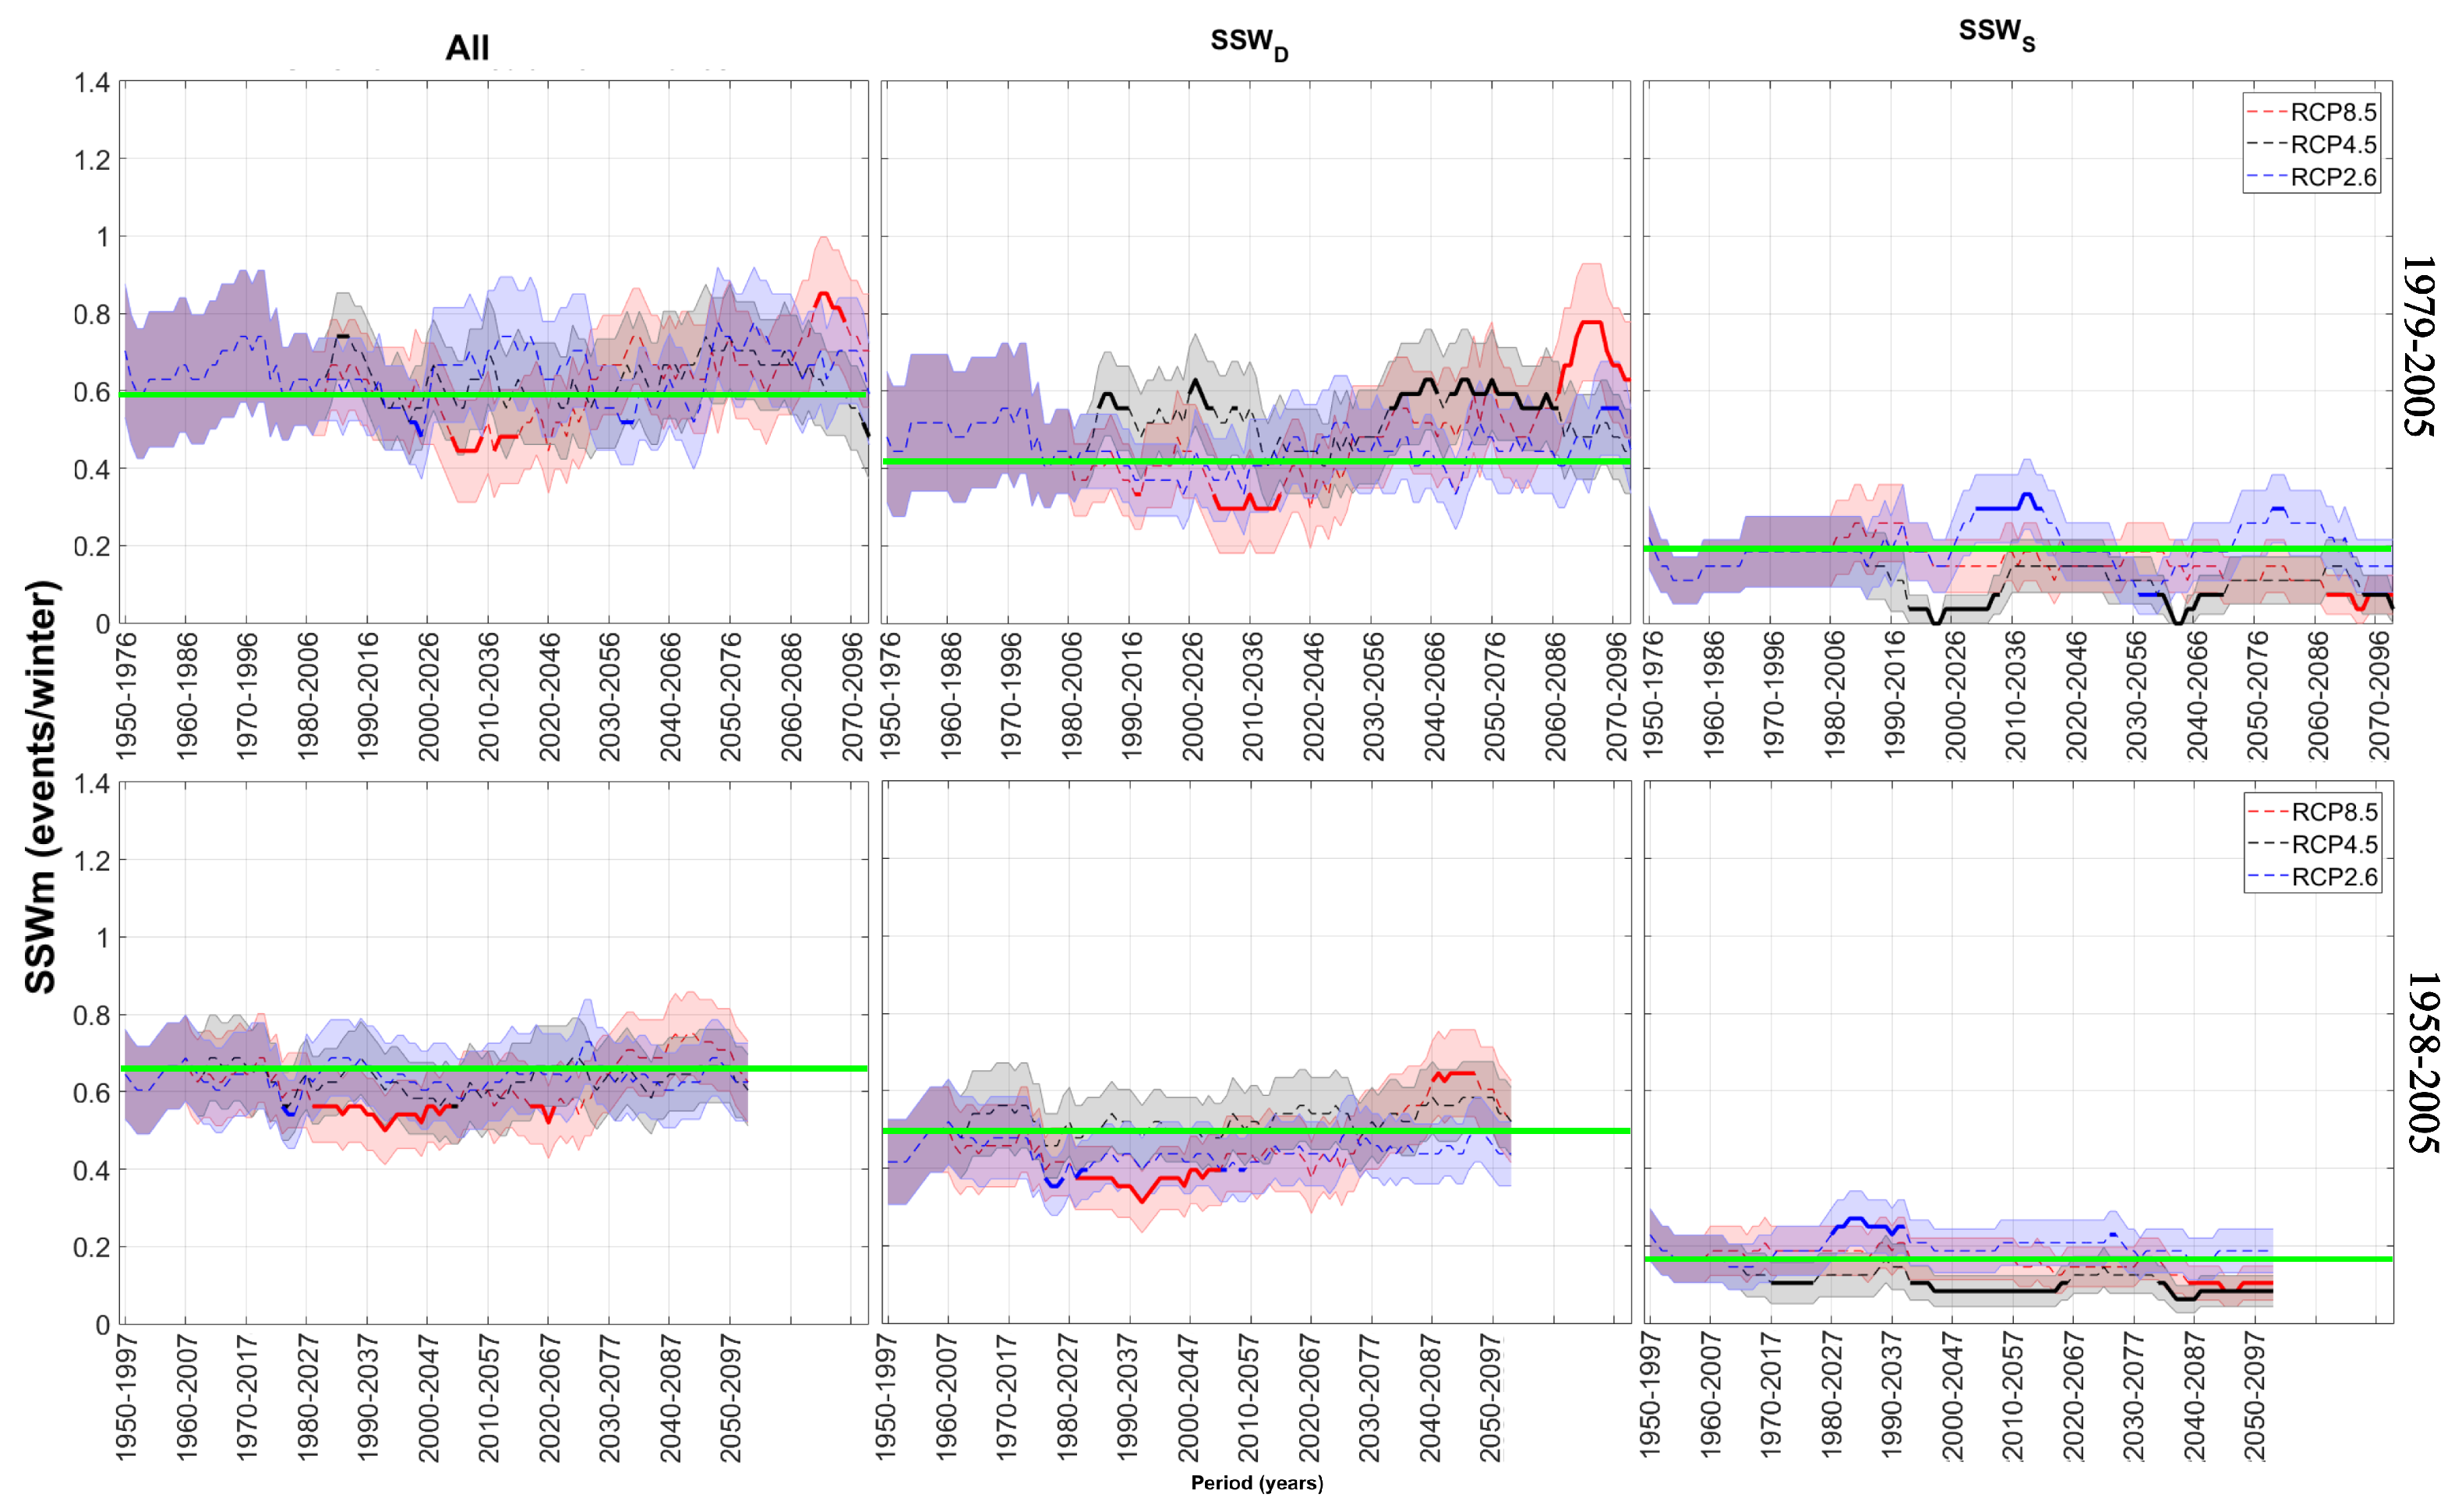
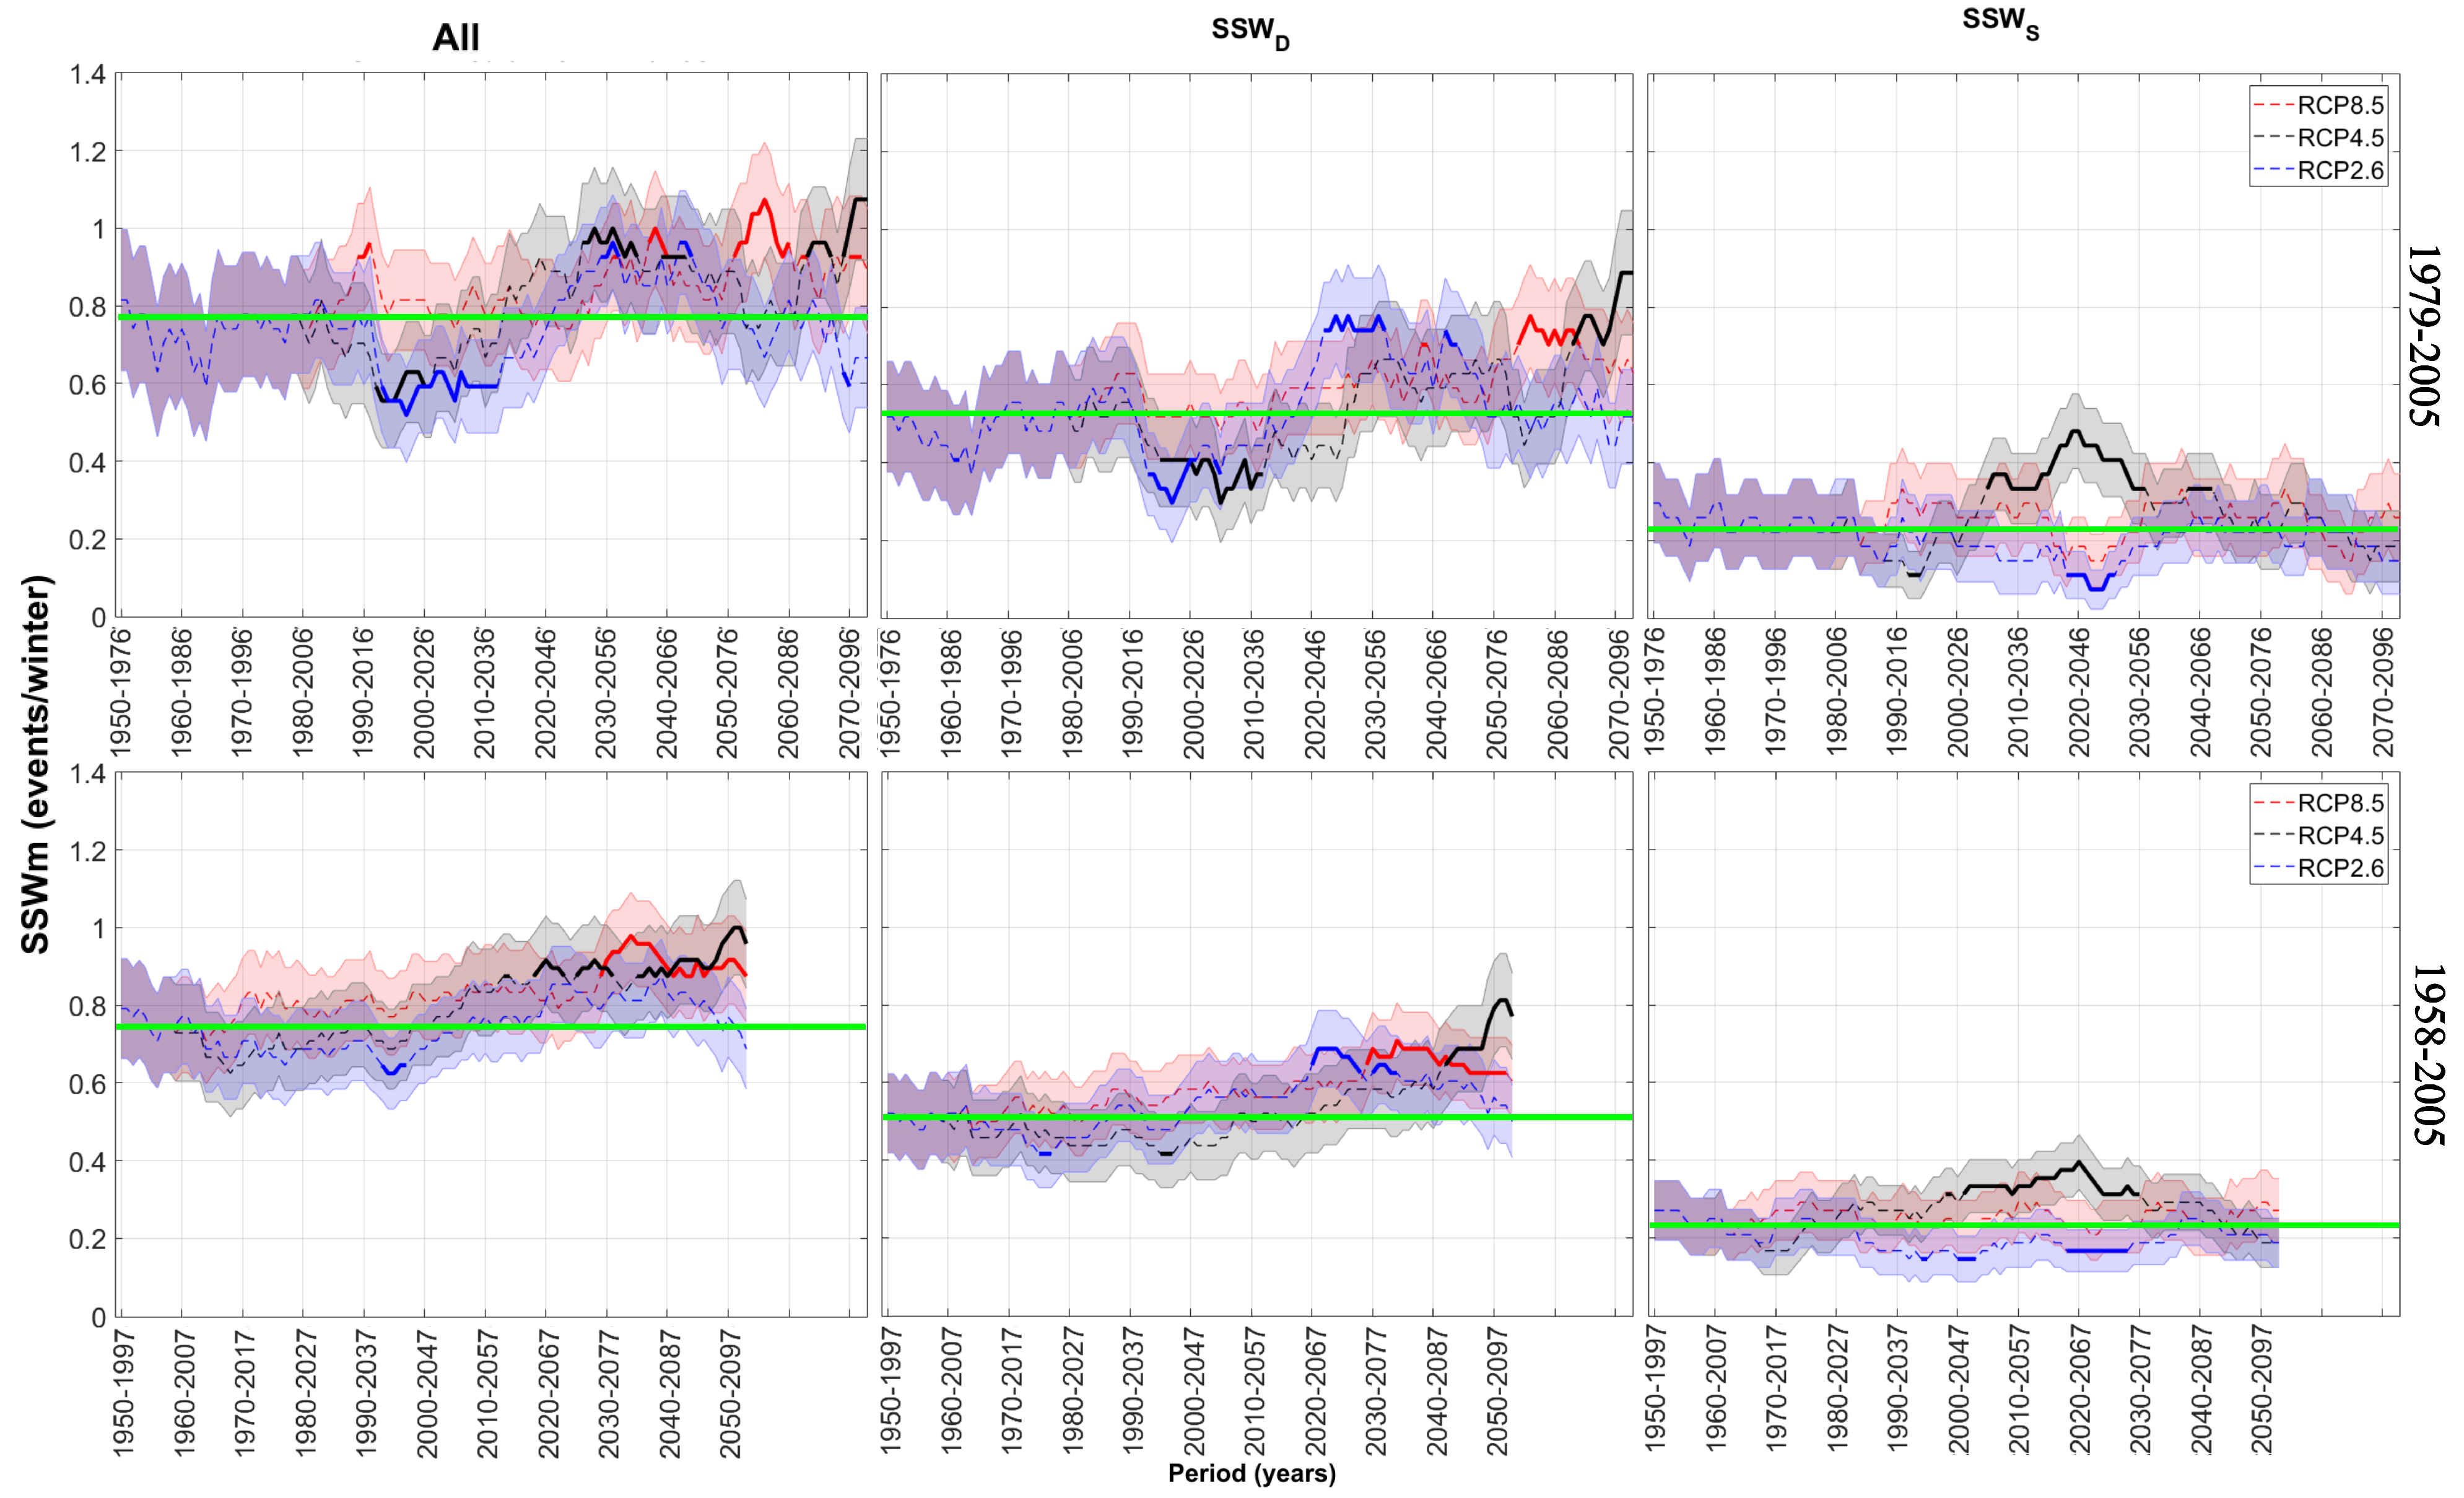
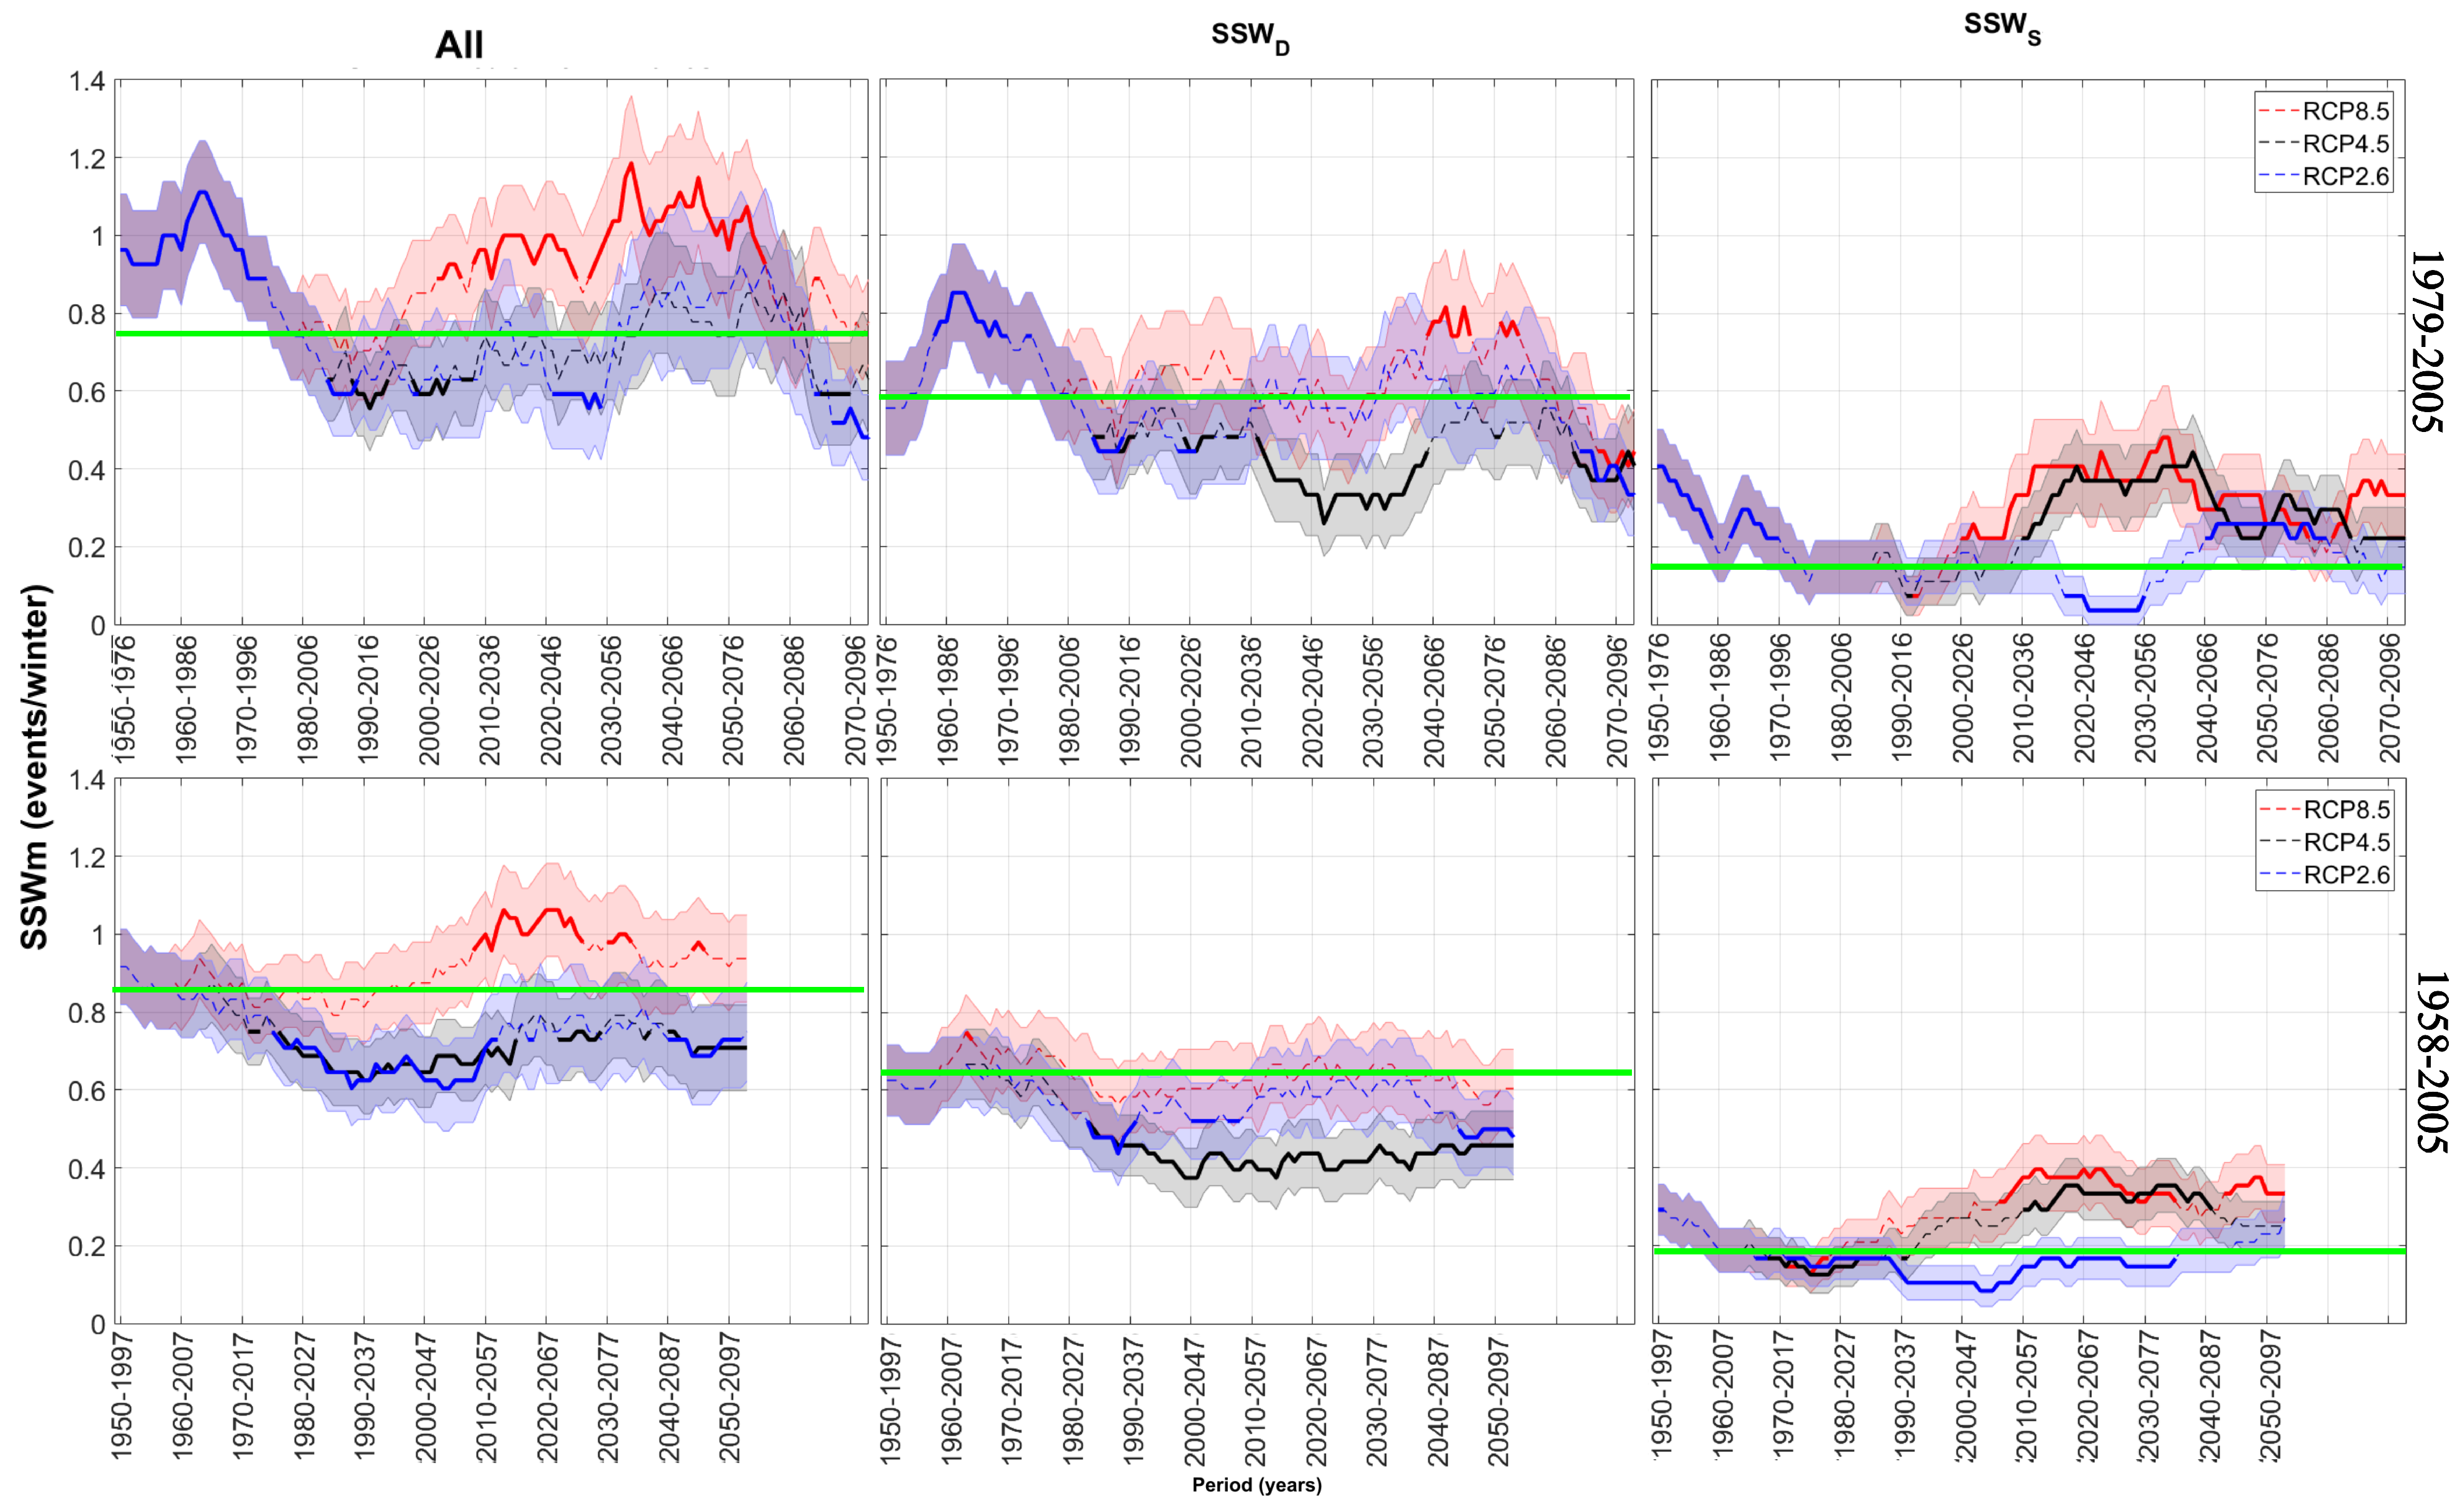
Figure 4 shows the temporal evolution of frequency for the RCP scenarios of the IPSL-CM5A-MR model. Under RCP8.5, S S W S events show a decrease in frequency, although significance occurs only in short periods. For S S W D events, a frequency increase is observed relative to the historical reference period, but significance is only achieved in some intervals.
Figure 5 shows the temporal evolution of frequency for the RCP scenarios of the MPI-ESM-LR model. Under RCP8.5, S S W D frequency increases over time, although significance occurs only in short periods. For S S W S events, a significant increase is observed only for part of the period under RCP4.5, from 2000 to 2077. The RCP2.6 scenario shows a decrease relative to historical periods, but significance is reached only for a few years.
Figure 6 shows the temporal evolution of frequency for the RCP scenarios of the MPI-ESM-MR model. For SSWm events under RCP8.5, a significant increase in frequency is observed, more consistent relative to the 27-year period than to the 48-year period, where significance occurs only in one interval. However, under RCP4.5 and RCP2.6, a significant decrease in occurrence frequency is observed. When analyzed by event type, S S W D frequency decreases, although significance is only reached for RCP4.5, and more consistently when compared with the longer historical period. In the case of S S W S events, a significant increase in frequency is observed under RCP8.5 and RCP4.5, and a significant decrease under RCP2.6, but only when compared with the longer historical period.
In summary, the figures above show that all models reproduce fewer S S W S events compared to S S W D events, which is a well-known challenge. In addition, our analysis highlights novel aspects, including the unprecedented absence of SSWm events over a 58-year period in the CMCC-CMS model, the strong dependence of the detected signals on the chosen historical reference period, and the presence of alternating statistically significant increases and decreases within individual simulations, which underscores the role of internal variability.

4. Discussion

The results obtained show that the response of SSWm frequency to climate forcing is highly heterogeneous across models and scenarios, without a uniform trend pattern. This variability is consistent with previous studies that have reported contradictory conclusions regarding the impact of climate change on SSWm [21,35,38]. In particular, the identification of alternating periods of significant increase and decrease within the same simulation suggests that internal variability plays a central role, and that analyses based solely on multi-model means may mask relevant signals.
When compared with earlier studies, the increase in S S W S under high-forcing scenarios is consistent with the trend reported in the literature [21], whereas the prolonged decrease in CMCC-CMS has no documented precedent. This atypical behavior could be related to model limitations, such as the representation of planetary wave propagation or vertical resolution, and further investigations are needed to determine whether it reflects real physical dynamics or a numerical artifact. In addition, inter-model differences in SSW frequency are likely influenced by dynamical conditions such as the strength of the winter polar jet and planetary wave activity fluxes. Although not explicitly analyzed in this study, these factors represent an important avenue for future research to better understand model biases in the representation of SSWm.
The persistence of the bias toward S S W D events observed in all simulations reflects a well-known issue in stratospheric modeling [19,27,40]. This bias limits the ability of models to adequately capture tropospheric impacts associated with SSWm, since the atmospheric response differs between displacement and split events. Furthermore, the sensitivity of the results to the choice of historical reference period highlights the importance of using comparable windows and detailed temporal analyses to interpret climate change projections.
Overall, the findings of this study confirm that the response of SSWm to climate forcing is highly dependent on the model and the event type, which limits the reliability of assessments based on a reduced set of simulations. Therefore, it will be necessary to expand future multi-model analyses by incorporating CMIP6 and upcoming CMIP7 simulations, as well as performing targeted validations of S S W S representation. This approach will contribute to improving our understanding of stratospheric variability and provide a stronger basis for evaluating its influence on climate predictability, although some of the temporally significant variations identified may partly reflect chance occurrences expected at the 5% significance level.

5. Conclusions

The results presented show that under the RCP8.5 scenario, most models exhibit periods with a significant increase in SSWm occurrence frequency relative to the comparison period, which is consistent with previous findings [21]. Three of these models (CMCC-CMS, IPSL-CM5A-MR, and MPI-ESM-MR) also show short periods with a significant decrease in SSWm frequency under the same scenario. The results demonstrate that changes in SSWm occurrence frequency across the different scenarios do not follow a temporally homogeneous pattern; instead, they are highly variable with respect to both time and event type, sometimes showing significant increases and decreases within the same simulation. However, some of these temporally significant variations may partly reflect chance occurrences expected at the 5% significance level. Variability among the models also explains the lack of agreement in previous studies on the impact of climate change on SSWm, as results will largely depend on the combination of models used, as expected.
The CMCC-CMS model exhibits a highly erratic behavior characterized by a pronounced decrease in SSWm frequency, driven by an extended period with no events across all available RCP scenarios. In-depth studies would be required to determine the underlying cause of this behavior.
There is a degree of consistency among models in showing a significant increase in S S W S frequency under RCP8.5 and RCP4.5 scenarios, or at least extended periods with significant increases, with the previously noted exception of CMCC-CMS. In contrast, trends in S S W D frequency are less clear, with differences in sign (increase or decrease) across models. Furthermore, when both event types are considered, it is possible to find situations in which one type exhibits a significant decrease in frequency while the other shows a significant increase, as occurs with the MPI-ESM-MR model under the RCP4.5 scenario.
All this underscores the inherent limitations of our current models in capturing the intricacies of a critical atmospheric phenomenon on our planet. The challenge stems, in part, from the relatively short observational history of SSWm events, which were identified just seven decades ago, and the lack of observations of the atmosphere at high altitudes until five decades ago [45]. Therefore, it is critical to sustain robust and continuous monitoring efforts [46] so we can effectively track their evolution in the context of climate change, and improve their representation in climate models.

Author Contributions

Conceptualization, V.M.C.-P., L.d.l.T. and J.A.A.; methodology, V.M.C.-P. and J.A.A.; software, V.M.C.-P.; validation, V.M.C.-P., L.d.l.T. and J.A.A.; formal analysis, V.M.C.-P. and C.A.-G.; investigation, V.M.C.-P.; resources, L.d.l.T.; data curation, V.M.C.-P. and C.A.-G.; writing—original draft preparation, V.M.C.-P., L.d.l.T. and J.A.A.; writing—review and editing, All; visualization, V.M.C.-P.; supervision, J.A.A. and L.d.l.T.; project administration, L.d.l.T. and J.A.A.; funding acquisition, L.d.l.T. and J.A.A. All authors have read and agreed to the published version of the manuscript.

Funding

This study was supported by the Spanish Ministry of Economy and Competitiveness under the ExCirEs (CGL2011-24826), ZEXMOD (CGL2015-71575-P) and CHESS (PID2021-124991OB-I00) projects. This work is supported by the International Space Science Institute (ISSI) in Bern through the ISSI International Team project #25-631 (Impacts and Monitoring of Climate Change on the Middle and Upper Atmosphere). The EPhysLab is supported by the Xunta de Galicia (Consellería de Cultura, Educación y Universidad) under a Programa de Consolidación e Estructuración de Unidades de Investigación Competitivas grant (ED431C 2025/37) and by the European Regional Development Fund.

Institutional Review Board Statement

Not applicable.

Informed Consent Statement

Not applicable.

Data Availability Statement

The original contributions presented in the study are included in the article, and further inquiries can be directed to the corresponding author.

Acknowledgments

We acknowledge three anonymous reviewers for their comments that helped to improve this paper.

Conflicts of Interest

The authors declare no conflicts of interest.

Abbreviations

The following abbreviations are used in this manuscript:
SSWsStratospheric Sudden Warmings
SSWmMajor Stratospheric Sudden Warming
S S W D Displacement-type SSWm
S S W S Split-type SSWm
CMIP5Coupled Model Intercomparison Project Phase 5
CCMIChemistry–Climate Model Initiative
NHNorthern Hemisphere
CP07Charlton and Polvani (2007) detection criterion
RCPRepresentative Concentration Pathway
WMOWorld Meteorological Organization
CMCCCentro Euro-Mediterraneo sui Cambiamenti Climatici
Met OfficeUK Met Office Hadley Centre
IPSLInstitut Pierre-Simon Laplace
MPI-MMax Planck Institute for Meteorology

References

  1. Gimeno, L.; de la Torre, L.; Nieto, R.; Gallego, D.; Ribera, P.; García-Herrera, R. A new diagnostic of stratospheric polar vortices. J. Atmos. Sol. Terr. Phys. 2007, 69, 1797–1812. [Google Scholar] [CrossRef]
  2. Liberato, M.L.R.; Castanheira, J.M.; de la Torre, L.; DaCamara, C.C.; Gimeno, L. Wave Energy Associated with the Variability of the Stratospheric Polar Vortex. J. Atmos. Sci. 2007, 64, 2683–2694. [Google Scholar] [CrossRef]
  3. Castanheira, J.M.; Liberato, M.L.R.; de la Torre, L.; Graf, H.F.; DaCamara, C.C. Baroclinic Rossby Wave Forcing and Barotropic Rossby Wave Response to Stratospheric Vortex Variability. J. Atmos. Sci. 2009, 66, 902–914. [Google Scholar] [CrossRef]
  4. Waugh, D.W.; Sobel, A.H.; Polvani, L.M. What Is the Polar Vortex and How Does It Influence Weather? Bull. Am. Meteorol. Soc. 2017, 98, 37–44. [Google Scholar] [CrossRef]
  5. Mitchell, D.M.; Scott, R.K.; Seviour, W.J.M.; Thomson, S.I.; Waugh, D.W.; Teanby, N.A.; Ball, E.R. Polar Vortices in Planetary Atmospheres. Rev. Geophys. 2021, 59, e2020RG000723. [Google Scholar] [CrossRef]
  6. Matsuno, T. A Dynamical Model of the Stratospheric Sudden Warming. J. Atmos. Sci. 1971, 28, 1479–1494. [Google Scholar] [CrossRef]
  7. Charlton, A.J.; Polvani, L.M.; Perlwitz, J.; Sassi, F.; Manzini, E.; Shibata, K.; Pawson, S.; Nielsen, J.E.; Rind, D. A New Look at Stratospheric Sudden Warmings. Part II: Evaluation of Numerical Model Simulations. J. Clim. 2007, 20, 470–488. [Google Scholar] [CrossRef]
  8. Baldwin, M.P.; Ayarzagüena, B.; Birner, T.; Butchart, N.; Butler, A.H.; Charlton-Perez, A.J.; Domeisen, D.I.V.; Garfinkel, C.I.; Garny, H.; Gerber, E.P.; et al. Sudden Stratospheric Warmings. Rev. Geophys. 2021, 59, e2020RG000708. [Google Scholar] [CrossRef]
  9. Wu, R.W.Y.; Wu, Z.; Domeisen, D.I.V. Differences in the sub-seasonal predictability of extreme stratospheric events. Weather Clim. Dyn. 2022, 3, 755–776. [Google Scholar] [CrossRef]
  10. Hitchcock, P.; Simpson, I.R. The Downward Influence of Stratospheric Sudden Warmings. J. Atmos. Sci. 2014, 71, 3856–3876. [Google Scholar] [CrossRef]
  11. WMO/IQSY. International Years of the Quiet Sun (IQSY) 1964-65; WMO/IQSY Report No 6. Technical Report; World Meteorological Organization: Geneva, Switzerland, 1964. [Google Scholar]
  12. de la Torre, L.; Garcia, R.R.; Barriopedro, D.; Chandran, A. Climatology and characteristics of stratospheric sudden warmings in the Whole Atmosphere Community Climate Model. J. Geophys. Res. Atmos. 2012, 117, D04110. [Google Scholar] [CrossRef]
  13. Vorobeva, E.; Orsolini, Y. The impact of tropospheric blockings on duration of the sudden stratospheric warmings in boreal winter 2023/24. EGUsphere 2025, 2025, 1–18. [Google Scholar] [CrossRef]
  14. Ma, J.; Chen, W.; Yang, R.; Ma, T.; Shen, X. Downward propagation of the weak stratospheric polar vortex events: the role of the surface arctic oscillation and the quasi-biennial oscillation. Clim. Dyn. 2024, 62, 4117–4131. [Google Scholar] [CrossRef]
  15. Zi, Y.; Long, Z.; Sheng, J.; Lu, G.; Perrie, W.; Xiao, Z. The Sudden Stratospheric Warming Events in the Antarctic in 2024. Geophys. Res. Lett. 2025, 52, e2025GL115257. [Google Scholar] [CrossRef]
  16. Lawrence, Z.D.; Abalos, M.; Ayarzagüena, B.; Barriopedro, D.; Butler, A.H.; Calvo, N.; de la Cámara, A.; Charlton-Perez, A.; Domeisen, D.I.V.; Dunn-Sigouin, E.; et al. Quantifying stratospheric biases and identifying their potential sources in subseasonal forecast systems. Weather Clim. Dyn. 2022, 3, 977–1001. [Google Scholar] [CrossRef]
  17. Charlton-Perez, A.J.; Baldwin, M.P.; Birner, T.; Black, R.X.; Butler, A.H.; Calvo, N.; Davis, N.A.; Gerber, E.P.; Gillett, N.; Hardiman, S.; et al. On the lack of stratospheric dynamical variability in low-top versions of the CMIP5 models. J. Geophys. Res. Atmos. 2013, 118, 2494–2505. [Google Scholar] [CrossRef]
  18. Osprey, S.M.; Gray, L.J.; Hardiman, S.C.; Butchart, N.; Hinton, T.J. Stratospheric Variability in Twentieth-Century CMIP5 Simulations of the Met Office Climate Model: High Top versus Low Top. J. Clim. 2013, 26, 1595–1606. [Google Scholar] [CrossRef]
  19. Seviour, W.J.M.; Gray, L.J.; Mitchell, D.M. Stratospheric polar vortex splits and displacements in the high-top CMIP5 climate models. J. Geophys. Res. Atmos. 2016, 121, 1400–1413. [Google Scholar] [CrossRef]
  20. Lehtonen, I.; Karpechko, A.Y. Observed and modeled tropospheric cold anomalies associated with sudden stratospheric warmings. J. Geophys. Res. Atmos. 2016, 121, 1591–1610. [Google Scholar] [CrossRef]
  21. Kim, J.; Son, S.W.; Gerber, E.P.; Park, H.S. Defining Sudden Stratospheric Warming in Climate Models: Accounting for Biases in Model Climatologies. J. Clim. 2017, 30, 5529–5546. [Google Scholar] [CrossRef]
  22. Taguchi, M. A study of different frequencies of major stratospheric sudden warmings in CMIP5 historical simulations. J. Geophys. Res. Atmos. 2017, 122, 5144–5156. [Google Scholar] [CrossRef]
  23. Ayarzagüena, B.; Polvani, L.M.; Langematz, U.; Akiyoshi, H.; Bekki, S.; Butchart, N.; Dameris, M.; Deushi, M.; Hardiman, S.C.; Jöckel, P.; et al. No robust evidence of future changes in major stratospheric sudden warmings: A multi-model assessment from CCMI. Atmos. Chem. Phys. 2018, 18, 11277–11287. [Google Scholar] [CrossRef] [PubMed]
  24. Wu, Z.; Reichler, T. Variations in the Frequency of Stratospheric Sudden Warmings in CMIP5 and CMIP6 and Possible Causes. J. Clim. 2020, 33, 10305–10320. [Google Scholar] [CrossRef]
  25. Chávez, V.M.; Añel, J.A.; Garcia, R.R.; Šácha, P.; de la Torre, L. Impact of Increased Vertical Resolution in WACCM on the Climatology of Major Sudden Stratospheric Warmings. Atmosphere 2022, 13, 546. [Google Scholar] [CrossRef]
  26. Chávez-Pérez, V.M.; Añel, J.A.; Almaguer-Gómez, C.; de la Torre, L. Influence of Satellite and Presatellite Periods on the Validation of Major Sudden Stratospheric Warmings in Historical CMIP5 Simulations. Atmosphere 2025, 16, 628. [Google Scholar] [CrossRef]
  27. Hall, R.J.; Mitchell, D.M.; Seviour, W.J.M.; Wright, C.J. Persistent Model Biases in the CMIP6 Representation of Stratospheric Polar Vortex Variability. J. Geophys. Res. Atmos. 2021, 126, e2021JD034759. [Google Scholar] [CrossRef]
  28. Andrews, D.G.; Holton, J.R.; Leovy, C.B. Middle Atmosphere Dynamics; Academic Press: Orlando, FL, USA, 1987; pp. xi–489. [Google Scholar]
  29. Castanheira, J.M.; Barriopedro, D. Dynamical connection between tropospheric blockings and stratospheric polar vortex. Geophys. Res. Lett. 2010, 37, L13809. [Google Scholar] [CrossRef]
  30. Limpasuvan, V.; Richter, J.H.; Orsolini, Y.J.; Stordal, F.; Kvissel, O.K. The roles of planetary and gravity waves during a major stratospheric sudden warming as characterized in WACCM. J. Atmos. Sol.-Terr. Phys. 2012, 78–79, 84–98. [Google Scholar] [CrossRef]
  31. Sassi, F.; Liu, H.L. Westward traveling planetary wave events in the lower thermosphere during solar minimum conditions simulated by SD-WACCM-X. J. Atmos. Sol.-Terr. Phys. 2014, 119, 11–26. [Google Scholar] [CrossRef]
  32. Huang, J.; Tian, W.; Gray, L.J.; Zhang, J.; Li, Y.; Luo, J.; Tian, H. Preconditioning of Arctic Stratospheric Polar Vortex Shift Events. J. Clim. 2018, 31, 5417–5436. [Google Scholar] [CrossRef]
  33. Maycock, A.C.; Hitchcock, P. Do split and displacement sudden stratospheric warmings have different annular mode signatures? Geophys. Res. Lett. 2015, 42, 10943–10951. [Google Scholar] [CrossRef]
  34. Taylor, K.E.; Stouffer, R.J.; Meehl, G.A. An Overview of CMIP5 and the Experiment Design. Bull. Am. Meteorol. Soc. 2012, 93, 485–498. [Google Scholar] [CrossRef]
  35. Ayarzagüena, B.; Charlton-Perez, A.J.; Butler, A.H.; Hitchcock, P.; Simpson, I.R.; Polvani, L.M.; Butchart, N.; Gerber, E.P.; Gray, L.; Hassler, B.; et al. Uncertainty in the Response of Sudden Stratospheric Warmings and Stratosphere-Troposphere Coupling to Quadrupled CO2 Concentrations in CMIP6 Models. J. Geophys. Res. Atmos. 2020, 125, e2019JD032345. [Google Scholar] [CrossRef]
  36. Mitchell, D.M.; Osprey, S.M.; Gray, L.J.; Butchart, N.; Hardiman, S.C.; Charlton-Perez, A.J.; Watson, P. The Effect of Climate Change on the Variability of the Northern Hemisphere Stratospheric Polar Vortex. J. Atmos. Sci. 2012, 69, 2608–2618. [Google Scholar] [CrossRef]
  37. Hansen, F.; Matthes, K.; Petrick, C.; Wang, W. The influence of natural and anthropogenic factors on major stratospheric sudden warmings. J. Geophys. Res. Atmos. 2014, 119, 8117–8136. [Google Scholar] [CrossRef]
  38. Liang, Z.; Rao, J.; Guo, D.; Lu, Q. Simulation and projection of the sudden stratospheric warming events in different scenarios by CESM2-WACCM. Clim. Dyn. 2022, 59, 1–21. [Google Scholar] [CrossRef]
  39. Charlton, A.J.; Polvani, L.M. A New Look at Stratospheric Sudden Warmings. Part I: Climatology and Modeling Benchmarks. J. Clim. 2007, 20, 449–469. [Google Scholar] [CrossRef]
  40. Charlton-Perez, A.J.; Polvani, L.M.; Austin, J.; Li, F. The frequency and dynamics of stratospheric sudden warmings in the 21st century. J. Geophys. Res. Atmos. 2008, 113, D16116. [Google Scholar] [CrossRef]
  41. Bell, C.J.; Gray, L.J.; Kettleborough, J. Changes in Northern Hemisphere stratospheric variability under increased CO2 concentrations. Q. J. R. Meteorol. Soc. 2010, 136, 1181–1190. [Google Scholar] [CrossRef]
  42. Mitchell, D.M.; Charlton-Perez, A.J.; Gray, L.J.; Akiyoshi, H.; Butchart, N.; Hardiman, S.C.; Morgenstern, O.; Nakamura, T.; Rozanov, E.; Shibata, K.; et al. The nature of Arctic polar vortices in chemistry—Climate models. Q. J. R. Meteorol. Soc. 2012, 138, 1681–1691. [Google Scholar] [CrossRef]
  43. Gettelman, A.; Hegglin, M.; Son, S.W.; Fujiwara, M.; Tilmes, L.P.S.; Hoor, P.; Lee, H.; Manney, G.; Birner, T.; Stiller, G.; et al. Upper Troposphere and Lower Stratosphere (UTLS) in SPARC CCMVal, SPARC CCMVal Report on the Evaluation of Chemistry-Climate Models; Hokkaido University: Sapporo, Japan, 2010. [Google Scholar]
  44. Ayarzagüena, B.; Langematz, U.; Meul, S.; Oberländer, S.; Abalichin, J.; Kubin, A. The role of climate change and ozone recovery for the future timing of major stratospheric warmings. Geophys. Res. Lett. 2013, 40, 2460–2465. [Google Scholar] [CrossRef]
  45. Añel, J.A. The stratosphere: History and future a century after its discovery. Contemp. Phys. 2016, 57, 230–233. [Google Scholar] [CrossRef]
  46. Añel, J.A.; Cnossen, I.; Antuña-Marrero, J.C.; Beig, G.; Brown, M.K.; Doornbos, E.; Osprey, S.; Mutschler, S.M.; Souto, C.P.; Šácha, P.; et al. The Need for Better Monitoring of Climate Change in the Middle and Upper Atmosphere. AGU Adv. 2025, 6, e2024AV001465. [Google Scholar] [CrossRef]
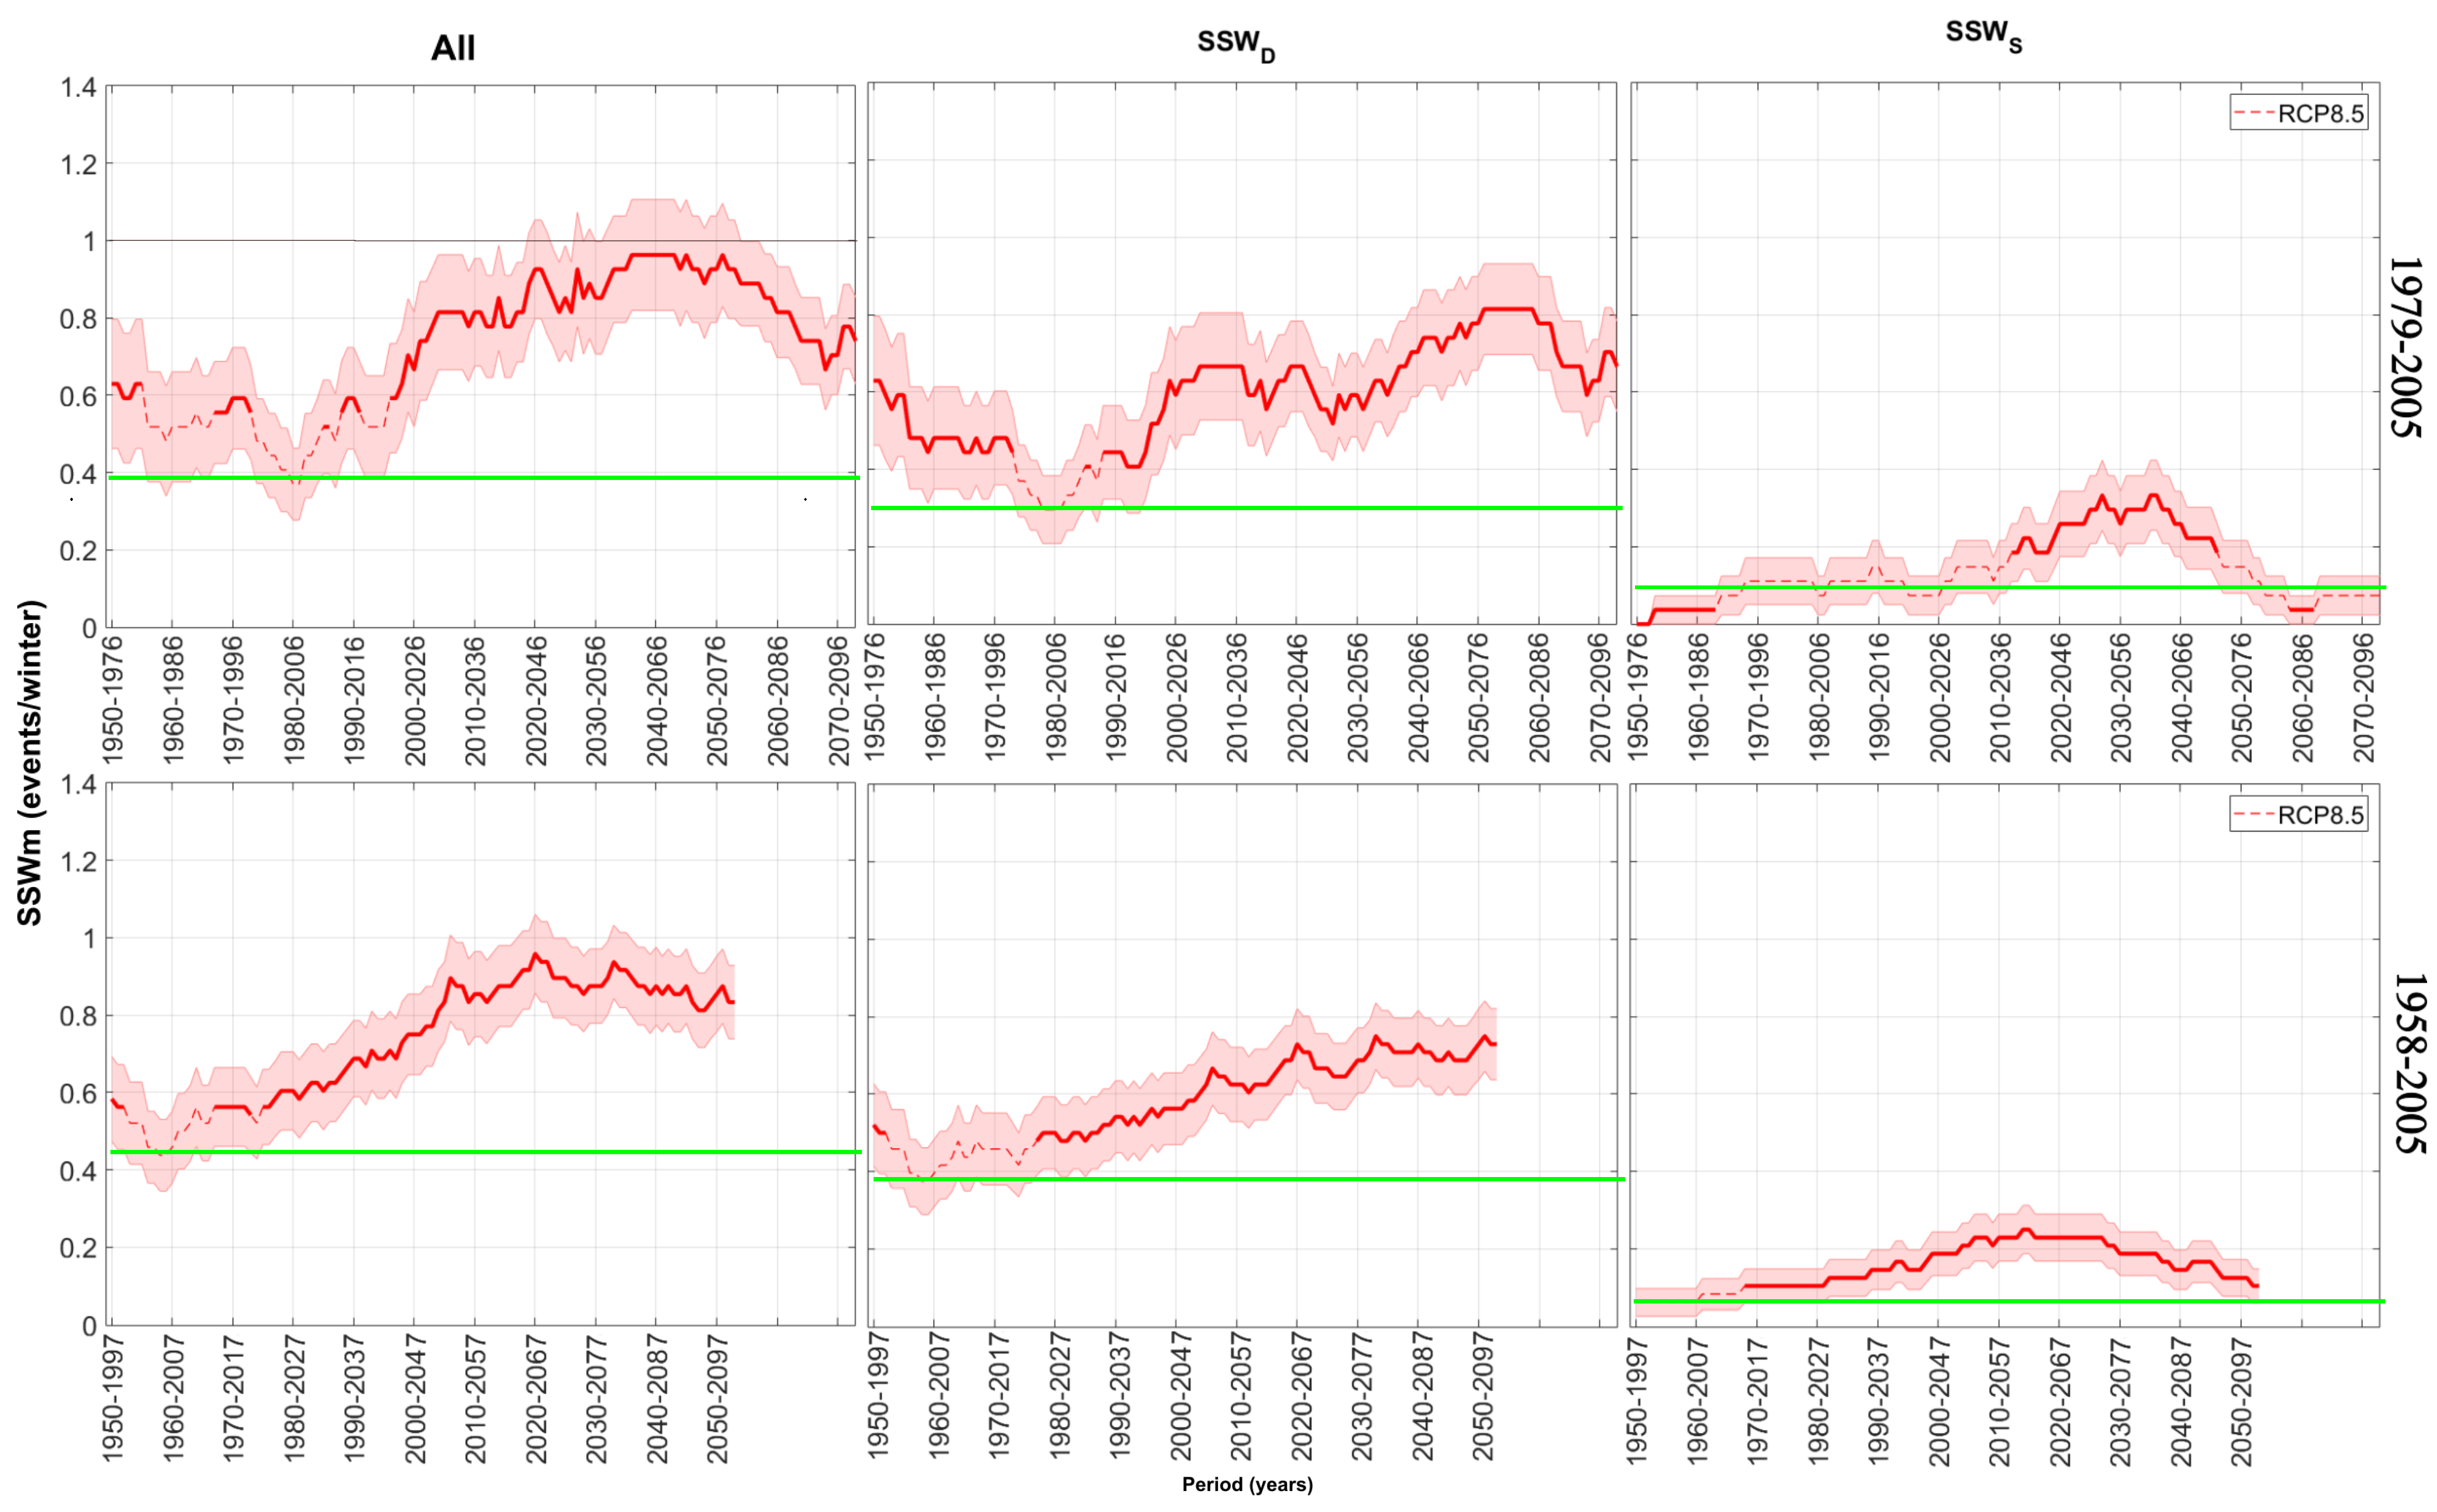
Figure 1. Temporal evolution of the annual SSWm frequency for the CMCC-CESM model under the RCP8.5 scenario. The dashed line represents the 27-year moving average (upper panel) and the 48-year moving average (lower panel). The shaded area indicates the standard error. Solid line segments indicate values significantly different at the 5% level relative to the reference period: (upper panel) for 1979–2005 and (lower panel) for 1958–2005. The green horizontal line indicates the observed mean SSWm frequency for the corresponding reference period: 1979–2005 in the (upper panel) and 1958–2005 in the (lower panel).
Climate 13 00207 g001
Figure 2. Temporal evolution of the annual SSWm frequency for the CMCC-CMS model under the RCP scenarios. The black (RCP4.5) and red (RCP8.5) curves represent the time series of SSWm frequency. The dashed line corresponds to the moving average (27 years in the (upper panel) and 48 years in the (lower panel)). The shaded area indicates the standard error. Solid line segments indicate values significantly different at the 5% level relative to the reference period: (upper panel) for 1979–2005 and (lower panel) for 1958–2005. The green horizontal line indicates the observed mean SSWm frequency for the corresponding reference period: 1979–2005 in the (upper panel) and 1958–2005 in the (lower panel).
Climate 13 00207 g002
Figure 3. Temporal evolution of the annual SSWm frequency for the HadGEM2-CC model under the RCP scenarios. The black (RCP4.5) and red (RCP8.5) curves represent the time series of SSWm frequency. The dashed line corresponds to the moving average (27 years in the (upper panel) and 48 years in the (lower panel)). The shaded area indicates the standard error. Solid line segments indicate values significantly different at the 5% level relative to the reference period: (upper panel) for 1979–2005 and (lower panel) for 1958–2005. The green horizontal line indicates the observed mean SSWm frequency for the corresponding reference period: 1979–2005 in the (upper panel) and 1958–2005 in the (lower panel).
Climate 13 00207 g003
Figure 4. Temporal evolution of the annual SSWm frequency for the PSL-CM5A-MR model under the RCP scenarios. The blue (RCP2.6), black (RCP4.5), and red (RCP8.5) curves represent the time series of SSWm frequency. The dashed line corresponds to the moving average (27 years in the (upper panel) and 48 years in the (lower panel)). The shaded area indicates the standard error. Solid line segments indicate values significantly different at the 5% level relative to the reference period: (upper panel) for 1979–2005 and (lower panel) for 1958–2005. The green horizontal line indicates the observed mean SSWm frequency for the corresponding reference period: 1979–2005 in the (upper panel) and 1958–2005 in the (lower panel).
Climate 13 00207 g004
Figure 5. Temporal evolution of the annual SSWm frequency for the MPI-ESM-LR model under the RCP scenarios. The blue (RCP2.6), black (RCP4.5), and red (RCP8.5) curves represent the time series of SSWm frequency. The dashed line corresponds to the moving average (27 years in the (upper panel) and 48 years in the (lower panel)). The shaded area indicates the standard error. Solid line segments indicate values significantly different at the 5% level relative to the reference period: (upper panel) for 1979–2005 and (lower panel) for 1958–2005. The green horizontal line indicates the observed mean SSWm frequency for the corresponding reference period: 1979–2005 in the (upper panel) and 1958–2005 in the (lower panel).
Climate 13 00207 g005
Figure 6. Temporal evolution of the annual SSWm frequency for the MPI-ESM-MR model under the RCP scenarios. The blue (RCP2.6), black (RCP4.5), and red (RCP8.5) curves represent the time series of SSWm frequency. The dashed line corresponds to the moving average (27 years in the (upper panel) and 48 years in the (lower panel)). The shaded area indicates the standard error. Solid line segments indicate values significantly different at the 5% level relative to the reference period: (upper panel) for 1979–2005 and (lower panel) for 1958–2005. The green horizontal line indicates the observed mean SSWm frequency for the corresponding reference period: 1979–2005 in the (upper panel) and 1958–2005 in the (lower panel).
Climate 13 00207 g006
Table 1. CMIP5 high-top models used for the analysis of major SSW frequency and their available RCP scenarios. Horizontal resolution is given in degrees (latitude × longitude) and model top in km. Full names of modeling centers are listed in the Abbreviations section.
ModelModeling CenterRCP ScenariosHorizontal Resolution (° lat × ° lon)Vertical LevelsModel Top (km)
1CMCC-CESMCMCC8.53.44 × 3.753980.6
2CMCC-CMSCMCC8.5; 4.53.71 × 3.759580.6
3HadGEM2-CCMet Office8.5; 4.51.25 × 1.879684.1
4IPSL-CM5A-MRIPSL8.5; 4.5; 2.61.25 × 2.523970.4
5MPI-ESM-LRMPI-M8.5; 4.5; 2.61.88 × 0.944780.6
6MPI-ESM-MRMPI-M8.5; 4.5; 2.61.88 × 0.944780.6
Note: Full names of modeling centers are provided in the Abbreviations section.
Table 2. Annual frequency of major SSW (SSWm) events under different climate change scenarios for the period 2006–2100. Values in parentheses indicate the standard error. Frequencies marked with an asterisk (*) are not significantly different ( p < 0.05 ) from 1979 to 2005, and frequencies marked with a dagger () are not significantly different from 1958 to 2005.
Model1979–20051958–2005RCP 8.5RCP 4.5RCP 2.6
1CMCC-CESM0.41 (0.11)0.44 (0.09)0.84 (0.07)
2CMCC-CMS0.81 (0.15)0.77 (0.10)0.33 (0.06)0.45 (0.07)
3HadGEM2-CC0.48 (0.10)0.44 (0.08)0.72 (0.08)0.88 (0.08)
4IPSL-CM5A-MR0.63 (0.12)0.67 (0.11)0.60 *, † (0.07)0.59 *, † (0.07)0.61 *, † (0.07)
5MPI-ESM-LR0.78 (0.15)0.75 (0.12)0.85 (0.08)0.88 * (0.08)0.72 *, † (0.07)
6MPI-ESM-MR0.74 (0.11)0.85 (0.10)0.93 (0.08)0.69 * (0.07)0.68 * (0.08)
Disclaimer/Publisher’s Note: The statements, opinions and data contained in all publications are solely those of the individual author(s) and contributor(s) and not of MDPI and/or the editor(s). MDPI and/or the editor(s) disclaim responsibility for any injury to people or property resulting from any ideas, methods, instructions or products referred to in the content.