Abstract
The Upper Blue Nile Basin (UBNB), which contributes about 60% to the annual Nile flow, plays a critical role in the Nile water management. However, its complex terrain and climate create significant challenges for accurate regional climate simulations, which are essential for climate impact assessments. This study aims to address the challenges of climate simulation over the UBNB by enhancing the Regional Climate Model system (RegCM5) with its new non-hydrostatic dynamical core (MOLOCH) to simulate precipitation and temperature. The model is driven by ERA5 reanalysis for the period (2000–2009), and two scenarios are simulated using two different schemes of the Planetary Boundary Layer (PBL): Holtslag (Hol) and University of Washington (UW). The two scenarios, noted as (MOLOCH-Hol and MOLOCH-UW), are compared to the previously best-performing hydrostatic configuration. The MOLOCH-UW scenario showed the best precipitation performance relative to observations, with an accepted dry Bias% up to 22%, and a high annual cycle correlation >0.85. However, MOLOCH-Hol showed a very good performance only in the wet season with a wet bias of 4% and moderate correlation of ≈0.6. For temperature, MOLOCH-UW also outperformed, achieving the lowest cold/warm bias range of −2% to +3%, and high correlations of ≈0.9 through the year and the wet season. This study concluded that the MOLOCH-UW is the most reliable configuration for reproducing the climate variability over the UBNB. This developed configuration is a promising tool for the basin’s hydroclimate applications, such as dynamical downscaling of the seasonal forecasts and future climate change scenarios produced by global circulation models. Future improvements could be achieved through convective-permitting simulation at ≤4 km resolution, especially in the application of assessing the land use change impact.
1. Introduction
The weather pattern of the Upper Blue Nile Basin (UBNB) is mainly controlled by large-scale atmospheric patterns, which are responsible for the moisture transportation from the surrounding oceans and water bodies [1]. The transported moist air masses are dominated by a convergence zone in low-pressure systems, accompanied by the Intertropical Convergence Zone (ITCZ), which extends from West Africa across the north of the basin [2]. The main rainfall season (June–September (JJAS)) contributes around 70% to the annual rainfall over the UBNB, which is on average 1200 mm [3]. The JJAS weather pattern is influenced by the northward migration of the ITCZ, the strengthening of the tropical easterly jet, and the moist southwesterly monsoon flow originating from the Atlantic Ocean and the Congo basin [1,4]. During this season, the low-level East African jet and mid-level African easterly jet play critical roles in transporting moisture into Ethiopia [5]. The low-level East African jet enhances the moisture transport from the Indian Ocean across northern Ethiopia, increasing the JJAS rainfall [4,6]. The mid-level African Easterly Jet influences the development of African Easterly Waves, enhancing the convective activity and rainfall [7,8]. In addition, the mechanism of the North Atlantic Subtropical High (the Azores High) also controls low-level westerly flows and moisture advection toward northeastern Africa, affecting the JJAS rainfall over the Ethiopian Highlands [9].
The UBNB rainfall is affected by two other seasons called the short rain (February–May (FMAM)) and winter dry (October–January (ONDJ)) seasons. The FMAM season is considered the secondary rainy season and is characterized by sporadic and highly variable rainfall patterns due to the transitional position of the ITCZ in this period, resulting in weak and unstable synoptic systems [10]. FMAM climate is modulated by the interaction between mid-latitude troughs and tropical systems. For example, the rain is produced by moisture convergence formed by the seasonal southward extension of the subtropical westerly jet stream with deep troughs in the easterly flow [11]. In contrast, the ONDJ season is dominated by the retreat of the ITCZ to the southern hemisphere and the incursion of northeasterly dry winds driven by subtropical anticyclones such as the Siberian High. During ONDJ, the UBNB receives minimal rainfall, although localized precipitation may occur due to residual moisture and local orographic effects [1].
The UBNB rainfall is also highly correlated with the global Sea Surface Temperature (SST) anomalies. Variations in SST, particularly El Niño Southern Oscillation, influence the interannual variability of the rainfall; El Niño events often suppress rainfall, while La Niña tends to enhance it [12,13].
In the hydrology of the Nile River system, the UBNB plays a vital role, contributing about 60% to the annual flow of the main Nile, serving as a lifeline for the downstream countries, including Egypt. The complexity of the basin topography and climate, characterized by a strong seasonal regime dominated by convective processes, poses challenges for accurate climate modelling. Hence, a reliable simulation of climate variables over the basin, especially precipitation and temperature, is essential for effective land and water resources management in the entire Nile basin. The high sensitivity of the basin to the variations in the large-scale circulations raises the importance of applying high-resolution Regional Climate Models (RCMs) capable of capturing the localized processes over the basin. Previously, there were some studies that applied RCMs over the basin and surrounding areas, such as Eastern Africa. Ref. [5] simulated the precipitation over the UBNB using the Regional Climate Model system (RegCM) version 4 (RegCM4), resulting in overestimation over the southwest and central parts, while underestimation over the eastern part. Ref. [14] developed Weather and Research Forecasting (WRF) over the Eastern Nile and assessed the model simulations of the precipitation and temperature over the UBNB. Among 16 simulations, they identified an optimal configuration with a small precipitation bias during the wet season, although a systematic bias of about 3 °C persisted in the surface air temperature simulation. Similarly, ref. [15] tested the WRF model sensitivity towards different microphysics and Planetary Boundary Layer (PBL) parameterization schemes over the Eastern Nile. The precipitation was highly underestimated over the UBNB; therefore, they corrected the simulation using a bias correction method before applying it to the hydrological model.
Over the past decade, RCMs have undergone a significant transformation, driven by advances in computational capacity and high-resolution modeling capabilities. Among the available RCMs, the latest version of the RegCM (RegCM5) is selected for this study due to RegCM’s extensive application and proven performance in Africa and the Nile Basin [5,16,17,18,19,20]. In addition, except for the polar regions, RegCM is the most widely used model due to its good performance over different domains around the globe [21]. Beyond Africa, several studies have confirmed the robustness of RegCM in climatically similar regions. For example, ref. [22] evaluated RegCM4.5 over the Western Tianshan Mountains in Central Asia by investigating different mixed cumulus convective schemes (over land and ocean) on annual and seasonal variability of precipitation, temperature, and wind. On an annual scale, the identified best configuration showed a skill in reproducing the different variables; however, it struggled to show the same performance in all four seasons. Similarly, ref. [23] assessed RegCM4.3 over the South Asian monsoon region and found that a mixed convective scheme provided the most realistic representation of monsoon rainfall and circulation processes. Over tropical South America, RegCM4.6 has also demonstrated the capability in capturing the seasonal variability of rainfall and temperature, particularly over the Amazon and Northeast Brazil [24]. These precedents support the selection of RegCM5 for application over the UBNB, which shares comparable climatic challenges such as complex topography, strong land-atmosphere interactions, and monsoon-dominated precipitation.
However, previous studies have demonstrated that RegCM reproduces the main features of the East African climate, though challenges remain in precipitation representation over complex terrains such as the Ethiopian Highlands [16,25]. The RegCMs used in these studies were derived using old generations of the ECMWF reanalysis (ERA-Interim) with coarse spatial and temporal resolutions of 1.5° or 0.75° and 6 h, respectively, limiting the simulation of the finer local climate features. Currently, the availability of ERA5 (fifth-generation ECMWF) reanalysis, which provides high spatiotemporal resolution (0.25° and 1 h), improved representation of atmospheric and surface processes compared to its predecessors. Some studies have assessed the ERA5 compared to the ERA-Interim in forcing the RCMs as initial and boundary conditions. For example, evaluations showed that ERA5-forced-RCMs reduce temperature biases and improve precipitation characteristics relative to those forced by ERA-Interim [26,27]. In our recent work [28], the RegCM5, derived by ERA5 reanalysis, was calibrated to determine the optimal configuration for simulating precipitation over the UBNB using the hydrostatic dynamical core. Seven scenarios combining different physics parameterization schemes of microphysics and cumulus convection were tested and evaluated. Unfortunately, even the most optimal scenario highly overestimated the precipitation with a 66% bias. Therefore, this study recommends enhancing the simulations by employing the new non-hydrostatic MOLOCH core and exploring alternative parameterization schemes, particularly the Planetary Boundary Layer (PBL) scheme, which influences precipitation simulation. The inclusion of MOLOCH in the RegCM5 makes the simulation more accurate and computationally stable [29]. For the PBL, there is an alternative to the commonly used Holtslag scheme [30], called the “University of Washington (UW)” scheme [31], found to better simulate boundary-layer dynamics and vertical mixing, reducing biases in precipitation and temperature simulations over West Africa [18]. Therefore, using MOLOCH in combination with the UW scheme can be promising to address previous limitations and improve the simulation of mesoscale processes over the UBNB.
This study aims to enhance previous modeling efforts by applying the non-hydrostatic MOLOCH dynamical core and UW scheme within RegCM5, forced by the high-resolution ERA5 reanalysis, to simulate precipitation and temperature over the UBNB. Unlike earlier studies that relied on coarser reanalysis datasets (ERA-Interim) and the hydrostatic core of RegCM, our approach leverages improved physics and finer resolution to address persistent biases in precipitation and temperature simulations. By evaluating different model configurations, this work aims to identify the optimal setup for a robust simulation of the UBNB climate, thereby providing a base for future studies on climate change, land use change, and hydrological impacts in the Nile Basin.
2. Study Area and Data
2.1. Study Area
This study focuses on the UBNB, which plays a critical role in the hydrology of the Nile River system. The UBNB has a complex terrain involving the Ethiopian highlands. Such highlands play a vital role in forming the region’s climate, since they influence the atmospheric circulation patterns, moisture convergence, and convective activity. The Ethiopian highlands are the main reason for the annual rainfall being in excess of 1000 mm over the UBNB [32], where the precipitation is enhanced through the orographic lifting of moist air masses transported from the Indian Ocean and Congo basin, especially during the main rainfall season (JJAS) [8,33]. In addition, the complex topography introduces spatial heterogeneity in rainfall and temperature distributions across the basin [34,35].
To capture both local and large-scale atmospheric processes influencing rainfall and temperature over the basin, the simulation domain was defined to cover a broad region surrounding the UBNB (Figure 1). The chosen domain extent encompasses the main topographic features, including the Ethiopian Highlands, the western Indian Ocean, the Arabian Peninsula, and the southern Red Sea, which are essential in modulating moisture transport and rainfall variability over the basin. The domain spans from 27° E to 53° E longitude and 5° S to 21° N latitude, while the UBNB itself extends from 7°45′ to 13° N latitude and 34°30′ to 39°45′ E longitude. Figure 1a presents the full model domain, while Figure 1b highlights the UBNB as the focus area of analysis.
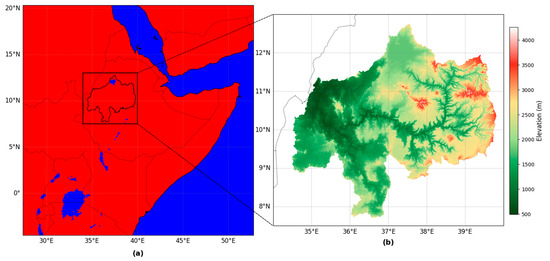
Figure 1.
The extent of the UBNB Domain. (a) Domain Land Mask (red for land and blue for water); (b) UBNB Topography.
2.2. Initial and Lateral Boundary Conditions
The initial and lateral boundary conditions are derived from the ERA5 hourly reanalysis dataset at 0.25° × 0.25° spatial resolution, provided by the ECMWF [36]. ERA5 reanalysis data use a more advanced assimilation system and include more sources of data. From ERA5, for a period (2000–2009), five atmospheric variables, geopotential height, air temperature, specific humidity, and zonal/meridional wind components, are collected on different pressure levels, while the SST is collected on a single level.
2.3. Observed Data
To evaluate the RegCM5 precipitation simulations, observed daily rainfall data with a spatial resolution of 20 km × 20 km is collected from the Nile Forecasting System database [37] in the Egyptian Ministry of Water Resources and Irrigation. The data are obtained from the Pre-Processor 7 (PP7), a gridded dataset merged between gauge and satellite data. The PP7 rainfall data are validated over the Nile Basin and utilized in the basin hydrological modeling, showing a very good performance [38,39]. For the evaluation of temperature simulations, the monthly gridded temperature data with a spatial resolution of 0.5° × 0.5° are collected from the Climate Research Unit (CRU) [40]. The CRU data are derived from interpolated observations from the World Meteorological Organization global station, and extensively evaluated and applied in East African and Nile Basin studies [38,41,42,43,44,45]. In addition, the hourly ERA5-land data are also considered in evaluation datasets as reanalysis-driven data for both precipitation and temperature. ERA5-land is a land-focused extension of ERA5, and does not assimilate additional observations beyond those used in ERA5; instead, it downscales ERA5 using a refined land surface model [46]. It is specifically designed to provide a higher spatial resolution of 0.1° × 0.1° and improved representation of land surface processes. All the observed data are collected for the period of (2001–2009), since the first year of the simulation period, 2000, is considered as a spin-up period and extracted from the evaluation analysis period.
3. Model Description and Development
The RegCM5 is the latest version that was physically upgraded by a contribution between the Abdus Salam International Centre for Theoretical Physics modeling team and the Institute of Atmospheric Sciences and Climate of the National Research Council of Italy [29]. In the last four years, the dynamical core of the model has been upgraded to have another two options, in addition to the hydrostatic core. After the inclusion of the non-hydrostatic dynamical core of the MM5 in the former version, RegCM5-NH [47], the non-hydrostatic weather prediction model (MOLOCH) has been added as a third option in the RegCM5. The MOLOCH dynamical core allows the climate modelling to operate effectively and at high spatial resolution, including convective-permitting scales (≤4 km), maintaining computational stability and improved performance relative to the hydrostatic core.
3.1. Model Setup
In this study, the model setup builds upon our previous work [28], in which RegCM5 was calibrated to simulate precipitation over the UBNB. The domain (Figure 1a) was configured with a horizontal resolution of 10 km. Many studies confirm that this resolution adequately captures precipitation and temperature variability over complex terrain (e.g., [48,49]). In earlier studies that relied on ERA-Interim reanalysis, achieving such resolutions typically required double nesting (e.g., downscaling from ~50 km to ~12–10 km) (e.g., [50,51]). Currently, the higher spatial and temporal resolution of ERA5 facilitates direct simulations at 10 km at once (e.g., [52]), since the nesting ratio should be ≤1:5.
In previous work, the hydrostatic core of RegCM5 was employed to simulate precipitation over the UBNB for the period 2000–2009. In RegCM5, precipitation is produced through two components: large-scale (resolvable, non-convective) processes represented by the microphysics scheme, and convective processes represented by the cumulus convective scheme. Numerous studies have shown that the ability of RCMs to reproduce precipitation is largely determined by the choice of the cumulus convective scheme [53]. Based on this, the model was calibrated by testing all available cumulus convective schemes in combination with two microphysics scheme options. The results indicated that the Emanuel convective scheme [54] paired with the Nogherotto–Tompkins (NoTo) microphysics scheme [55] provided the most suitable parameterization for simulating precipitation over the basin. However, the results showed a very high wet bias, leading to the recommendation of using the MOLOCH dynamical core and further investigating alternative Planetary Boundary Layer (PBL). The PBL controls the supply of moisture and energy from the surface to the atmosphere, influencing the development of convective systems and storms [18].
Accordingly, in this current research, the MOLOCH dynamic core is used to simulate not only the precipitation, but also the surface air temperature over the UBNB. Two PBL schemes are tested: the Hol, which was used as the default in previous work, and the UW, included in this study to provide an alternative representation. The schemes that represent the other components, such as land, ocean, and radiation, are selected as in the previous work. Including surface air temperature as a simulated variable enhances the robustness of the model evaluation, as it expands the assessment beyond precipitation. While simulating precipitation is very challenging due to its high variability over the basin, temperature is also important for hydrometeorological processes in the basin. Accurate temperature simulation is crucial for hydrologic applications such as evapotranspiration estimation and for climate impact studies related to agricultural productivity. Thus, evaluating the model’s ability to reproduce temperature strengthens its reliability and applicability for water resources and climate studies. Table 1 summarizes the RegCM5 configuration.

Table 1.
The RegCM5 Configuration.
3.2. Model Evaluation
To investigate the ability of using the new dynamical core (MOLOCH) and considering another PBL option (UW) in the RegCM5 configuration to simulate the climate over the UBNB, three simulation scenarios are compared. The selected best scenario from the previous work is compared to the two new scenarios simulated in the current work. Table 2 reports the three scenarios.

Table 2.
RegCM5 scenarios for comparison.
The spatiotemporal annual and interannual cycles of three scenarios are compared visually. In addition, three main statistical criteria are used to evaluate the results of the three scenarios. The Percent Bias (Bias%), Equation (1), Root Mean Squared Error to observation Standard Deviation Ratio (RSR), Equation (2), and correlation coefficient, Equation (2), are calculated on a monthly basis for both the precipitation and temperature simulations.
where is the number of observations, and are the simulated and observed data at time t, respectively, and and are the mean of the observed and simulated data during the evaluation period. The and are the standard deviation of the observed and the simulated data.
Finally, a Taylor-style diagram is constructed to present the statistical criteria to visually summarize the comparison for the full year and the three seasons (FMAM, JJAS, and ONDJ). The diagram incorporates the correlation coefficient and the RSR to assess the strength of the linear agreement and the error variability of the model simulations relative to observations. Figure 2 shows a framework diagram for the evaluation of the different RegCM5 configuration scenarios.
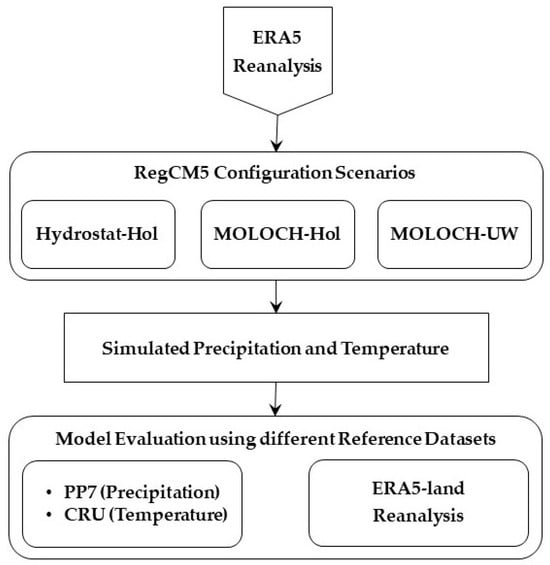
Figure 2.
Framework diagram for the evaluation of the different RegCM5 configuration scenarios.
4. Results
4.1. Precipitation
The spatial patterns and annual and interannual cycles of the seasonal rainfall over the UBNB are analyzed. The seasonal mean rainfall over the UBNB is estimated for the period (2001–2009) for both reference datasets, PP7/ERA5-land, and shows that the UBNB receives around 215/265, 905/1330, and 125/160 mm during the three seasons FMAM, JJAS, and ONDJ, respectively. Figure 3 shows the spatial distribution of the seasonal mean rainfall of the RegCM5 simulations over the UBNB compared to the PP7 and ERA5-land. The spatial distribution of the RegCM5 simulations aligns more closely with ERA5-land than with PP7, showing stronger consistency with the reanalysis dataset. The Hydrostatic core overestimates all the PP7 seasons, while it succeeds in capturing the rainfall intensity of ERA5-land during JJAS only. Converting the dynamical core to MOLOCH succeeds in reducing the overestimation compared to the PP7, especially during the JJAS. However, compared to ERA5-land, it cannot fix the overestimation of the short rain and dry seasons (FMAM and ONDJ). Finally, using the UW with MOLOCH overcomes the high overestimation between both reference data and simulated rainfall, with a slight underestimation during FMAM and ONDJ. During JJAS, MOLOCH_UW relatively/highly underestimates the precipitation compared to PP7/ERA5-land. In addition, it tends to be consistent with the actual spatial variability of the rainfall over the basin, in which the central and southwestern parts receive the highest rainfall rates [5], as shown in the PP7.
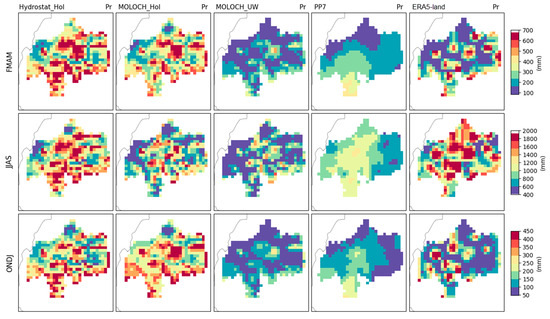
Figure 3.
Seasonal mean precipitation over the UBNB for (FMAM, JJAS, and ONDJ) at (upper, middle, and lower) rows.
The Bias% is analyzed, spatially and on average over the UBNB, to evaluate the performance of the three different RegCM5 scenarios. Figure 4 shows the spatially distributed Bias% of the simulated RegCM5 scenarios over the UBNB with respect to PP7 and ERA5-land. In general, during the FMAM, when using the Hol PBL, it is found that the MOLOCH core outperforms the Hydrostatic core by reducing the Bias% by more than 20%, while during the ONDJ, the Bias% is increased to around 10%. During the JJAS, the hydrostatic core shows the best performance with a minimal dry bias of 1% relative to ERA5-land, while the MOLOCH shows the best performance with a slight wet bias of 4% compared to PP7. Using the UW PBL with MOLOCH core achieves superior performance, since all three seasons lie in the accepted bias range of ±25% compared to the PP7. However, compared to ERA5-land, it is highly underestimated with unsatisfactory performance, according to [59], up to 48%.
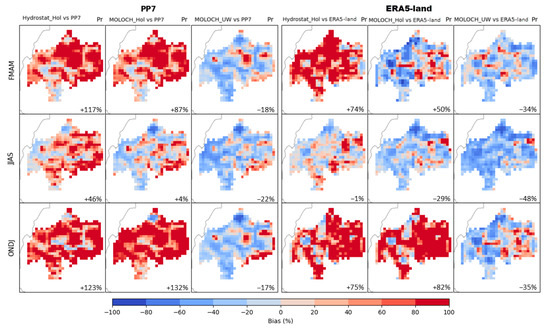
Figure 4.
Seasonal mean precipitation percent bias (Bias%) with respect to the PP7 and ERA5-land data over the UBNB during the three seasons (FMAM, JJAS, and ONDJ) at (upper, middle, and lower) rows.
Figure 5 shows the mean monthly precipitation of simulated scenarios compared to the reference datasets (PP7 and ERA5-land) over the analysis period (2001–2009). The mean annual of the PP7 and ERA5-land equals 1232 mm and 1740 mm, respectively, where the ERA5-land overestimates the PP7 main wet season (JJAS). The hydrostatic scenario succeeds in capturing the ERA5-land pattern during JJAS, although a relative underestimation/overestimation in the JJAS onset/peak (Aug.). It is also highly overestimated compared to the PP7; however, it captures the JJAS onset of the PP7. This overestimation by the ERA5-land is similarly found by [60], exhibiting the poorest performance when assessed, among other reference datasets, by comparing with ground-based rainfall data over the UBNB. Ref. [60] concluded that the rainfall products with in-situ data gauge assimilation provide more accurate estimates than the reanalysis-based data, especially over a complex terrain basin like the UBNB. MOLOCH succeeds in reducing overestimation to be closer to PP7, especially during JJAS, but the short rain and dry seasons (FMAM and ONDJ) are still overestimated compared to PP7 and ERA5-land. Generally, both MOLOCH scenarios struggle to capture the JJAS onset. Finally, the UW succeeds in fixing the whole rainfall pattern except for a relative underestimation in JJAS compared to observations (PP7), showing that it is the most optimal scenario in reproducing the seasonal cycle of the precipitation over the UBNB.
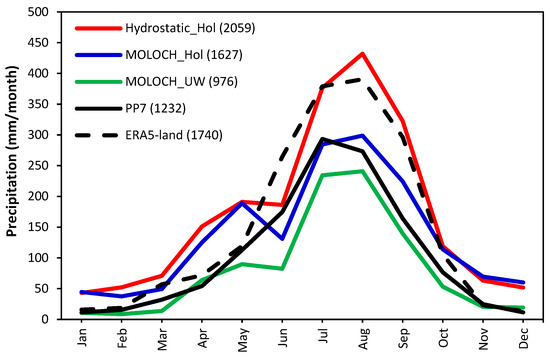
Figure 5.
Mean monthly precipitation over the UBNB.
To investigate the deficiencies of the model in reproducing the whole rainfall pattern over the UBNB, when using the Hol PBL, the annual cycles of monthly precipitation for all simulated scenarios are compared with observed precipitation in Figure 6. It is shown that the RegCM5 struggles to capture the rainfall in the months of the short and dry seasons, especially in April and May, the transitional months from short to long rain. However, the MOLOCH-UW scenario mostly succeeds in fixing the spikes in the short and dry seasons in most years. In UBNB, FMAM rainfall is interannually more variable because it is highly influenced by cyclonic activity than JJAS rainfall [34]. For example, ref. [61] found that the FMAM rainfall is affected by the frequency of tropical depressions over the Southwest Indian Ocean during the preceding November-January period. This sensitivity of FMAM rainfall to the interannual variability may contribute to the difficulty of the RegCM5 in accurately simulating the FMAM rainfall compared to the more stable JJAS season.
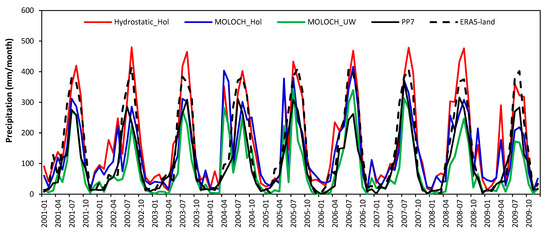
Figure 6.
The annual cycle of monthly precipitation over the UBNB.
Further analysis is shown in Figure 7; Taylor-style diagrams present the correlation coefficient and the RSR across the whole year, and the three seasons (FMAM, JJAS, and ONDJ). The diagrams evaluate the performance of the precipitation simulations over the UBNB against the PP7 and ERA5-land. The 0.7 RSR threshold line, marked in red, served as a reference boundary indicating acceptable model performance according to [59]. The Bias% is also represented in the diagram; the small triangles represent results lying within the acceptable range (±25%), while the big ones indicate unsatisfactory performance, exceeding the accepted range. As shown in Figure 7, in general, the model performance for the three different simulations is better across the annual analysis than the seasons, indicating difficulties in accurately capturing the seasonal variability of the rainfall over the UBNB. Relative to PP7 observations (Figure 7a–d), among the three scenarios, the MOLOCH-UW fully achieves the accepted comparative criteria, especially through the annual analysis (Figure 7a) with RSR less than 0.7, R2 exceeding 0.85, and an accepted dry bias. Even during the JJAS, it shows better performance than MOLOCH-Hol with R2 approaching 0.7. Compared to ERA5-land data (Figure 7e–h), both Hol scenarios annually achieve the best performance with high correlation (0.8–0.9) and accepted RSR and bias, as shown in Figure 7e. However, during the JJAS (Figure 7g), the Hydrostatic_Hol performs better with RSR and R2 approaching 1 and 0.8, respectively, and an accepted dry bias. The FMAM (Figure 7b,f) and ONDJ (Figure 7d,h) seasons cannot be accurately captured through the RegCM5 simulations. Simulations using longer periods, larger than 9 years, may enhance the analysis results and show a more accurate assessment.
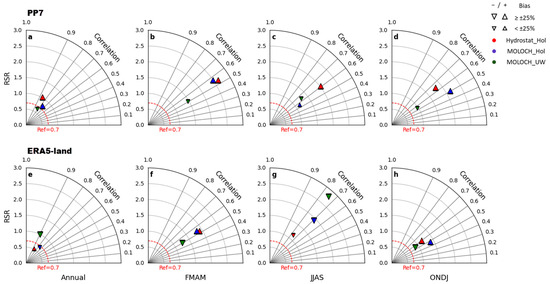
Figure 7.
Constructed Taylor-style diagrams of Annual, FMAM, JJAS, and ONDJ precipitation with respect to the PP7 (a,b,c,d, respectively) and ERA5-land (e,f,g,h, respectively).
4.2. Surface Air Temperature
The mean seasonal surface air temperature spatial distribution and the annual and interannual variability over the UBNB are analyzed. The average 2 m temperature over the UBNB during the period (2001–2009) is derived from the CRU/ERA5-land reference datasets, showing that the basin experiences seasonal mean 2 m temperature approximately 22/21 °C in FMAM, 19.5/17.3 °C in JJAS, and 19.2/18.6 °C in ONDJ. Figure 8 shows the seasonal mean of the 2 m temperature spatially distributed over the UBNB for the RegCM5 three different simulations compared to the CRU and ERA5-land reference datasets. It is shown that the model can simulate the variability driven predominantly by the basin’s complex topography, with lower temperatures in the eastern and southeastern altitudes, gradually increasing toward the western lowlands [34]. From Figure 8, it is also clear that the MOLOCH-UW scenario is mostly closer to the reference datasets in the spatially distributed values than the others, which use the Hol PBL.
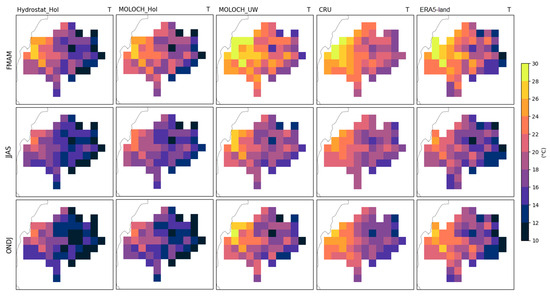
Figure 8.
Seasonal mean surface air temperature over the UBNB for (FMAM, JJAS, and ONDJ) at (upper, middle, and lower) rows.
To evaluate the RegCM5 simulations of the surface air temperature over the UBNB, a bias threshold of ±1.4 °C is employed, in accordance with the bias limit recommended by [62] for RCM assessments. This bias threshold accounts for both interannual climate variability and observational uncertainty. To standardize the assessment, as in precipitation simulations, the 1.4 °C is translated to 7% from the mean annual 2 m temperature over the UBNB, which is determined to be approximately 20 °C for the period (2001–2009). Accordingly, a ±7% bias range is adopted as the criterion for acceptable model performance in this study. Such a bias range limit of ±7% in assessing temperature simulations can be used in regions that have similar climatological characteristics as the UBNB.
Figure 9 shows the spatially distributed Bias% of the mean seasonal surface air temperature simulation with respect to the CRU and ERA5-land reference datasets. Both the Hol scenarios show a highly seasonal cold bias up to 25%, except for the JJAS season in the MOLOCH-Hol simulation with minimal cold bias (−3%), compared to ERA5-land 2 m temperature data. The MOLOCH-UW also shows the best performance with up to a warm/cold bias of +3%/−2%, compared to CRU data. However, when compared to ERA5-land data, an unsatisfactory warm bias of 10% was found in JJAS, while an acceptable warm bias was observed during the other seasons, up to ≈+7%. These results are consistent with the precipitation assessment results in terms of the comparison between the simulations with ERA5-land and other observational data.
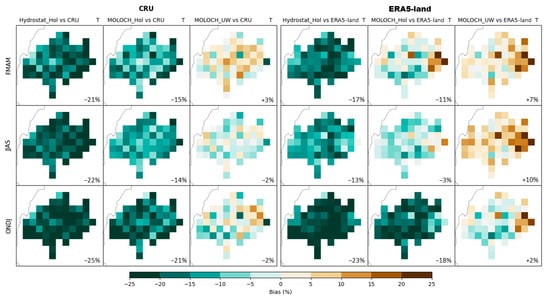
Figure 9.
Seasonal mean surface air temperature percent bias (Bias%) with respect to the CRU and ERA5-land data over the UBNB during the three seasons (FMAM, JJAS, and ONDJ) at (upper, middle, and lower) rows, respectively.
To assess the interannual variability of the RegCM5 simulations of the surface air temperature over the UBNB, a comparison between the three simulated scenarios and the CRU and ERA5-land reference datasets’ seasonal cycles is shown in Figure 10. Simulated and observational data reflect the seasonal trend, with the highest temperatures occurring during the March–May period. This aligns well with the climatic characteristics described by [34], where the hottest period occurs before the onset of the main wet season (JJAS). Among the model outputs, the MOLOCH-UW most accurately reproduces the observed pattern, closely matching the CRU data and capturing both timing and magnitude (annual mean of 20.2 °C) of the temperature cycle. In contrast, both Hydrostat_Hol and MOLOCH-Hol highly underestimate the observed temperatures throughout the year, particularly during the warm months. The cooler period during July and August, influenced by cloud cover, rainfall, and energy redistribution by evapotranspiration [34], was relatively captured in the MOLOCH-UW pattern only. This underscores the advantage of using the non-hydrostatic MOLOCH with the UW PBL scheme for more realistic surface air temperature simulation over the UBNB.
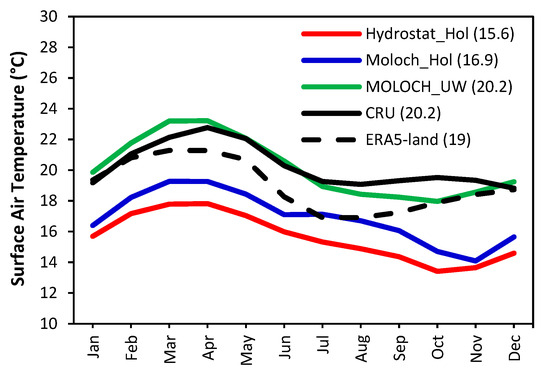
Figure 10.
Mean monthly surface air temperature over the UBNB.
Figure 11 presents the annual cycles of the monthly surface air temperature over the UBNB from 2001 to 2009 for the simulated RegCM5 scenarios compared to the observational reference data from CRU and ERA5-land. Compared to CRU and ERA5-land, all scenarios’ time series consistently reproduce the temperature peaks occurring during the March–May period in spring. However, only the MOLOCH-UW exhibits a strong annual cycle with temperature troughs in rainy months (July–August), while the other Hol scenarios’ temperature troughs are shifted in the winter dry months (October–November). In addition, it is clearly shown that the MOLOCH-UW performs best in capturing the timing of observed temperature fluctuations, closely aligning with the CRU values with slight underestimation in both the late rainy season (JJAS) and the onset of the dry season (ONDJ). The highly underestimated temperatures in the Hydrostat-Hol and MOLOCH-Hol reflect biases in the representation of surface energy balance or planetary boundary layer dynamics in the model configuration.
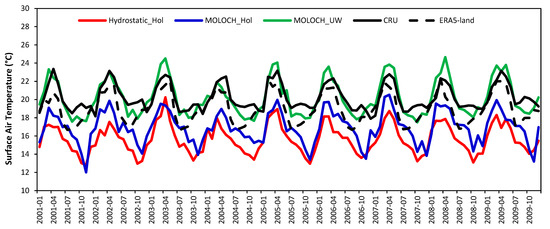
Figure 11.
The annual cycle of monthly surface air temperature over the UBNB.
The interannual and annual cycles of the observational data of CRU and ERA5-land (presented in Figure 10 and Figure 11) show a discrepancy between them. The ERA5-land temperatures are slightly lower than the CRU and highly underestimate temperature troughs. This difference was reported in some studies (e.g., [63,64]), and can be attributed to differences in data sources, spatial distribution, and assimilation techniques. CRU is a gridded dataset based on in-situ station observations and may reflect regional warming effects more prominently due to sparse station density and interpolation methods. In contrast, ERA5-land is a reanalysis product that blends model output with assimilated observations (including satellite data), potentially resulting in smoother fields and a dampening of extreme temperature signals [65]. Refs. [64,66] found that although the ERA5-land captures the general temperature pattern, it tends to exhibit a cold bias, especially in high-altitude areas, highlighting the importance of considering such biases when using ERA5-land in climate impact assessment studies in complex terrains.
To provide a comprehensive overview of the simulation skill, Figure 12 shows the constructed Taylor-style diagrams comparing simulated temperature from three RegCM5 configurations against CRU and ERA5-land data for the annual and seasonal means. Note that the results with RSR > 3 are shown outside the diagrams. Overall, MOLOCH-UW outperforms the other configurations through most periods and reference datasets, showing high correlations (≈0.9 across the year and JJAS), low RSR (0.7–1 across the year). In contrast, the Hydrostat-Hol shows a weaker performance with higher RSR and lower correlation values, especially when compared to CRU during ONDJ (RSR = 9.4, and R2 = 0.05).
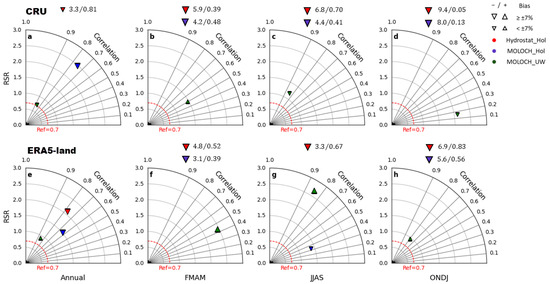
Figure 12.
Constructed Taylor-style diagrams of Annual, FMAM, JJAS, and ONDJ temperature with respect to the CRU (top row: a,b,c,d, respectively) and ERA5-land (bottom row: e,f,g,h, respectively).
5. Discussion
In this study, we enhance the RegCM5 simulation over the UBNB using different dynamical cores and PBL schemes. The comparative assessment of RegCM5 simulations using different dynamical cores and PBL schemes provides important insights for seasonal climate representation over the UBNB. The findings show that the non-hydrostatic MOLOCH core combined with UW enhances precipitation and temperature simulations compared to the hydrostatic with Hol configuration.
First, when keeping the default PBL (Hol), the MOLOCH non-hydrostatic dynamical core improved RegCM5 performance in simulating precipitation and 2 m temperature over the UBNB, especially during JJAS. For precipitation, this can be attributed to the capacity of the non-hydrostatic models to better simulate the convective processes, capturing the vertical atmospheric motions [47]. The non-hydrostatic dynamics allow the model to resolve the vertical acceleration that is critical for the deep convective simulation, especially in moist conditions, even at resolutions coarser than 10 km [29,51]. Regarding the improved representation of 2 m temperature relative to the non-hydrostatic core, it results from the modified reference temperature profile implemented in the non-hydrostatic dynamical core of the model [67].
Despite the MOLOCH-Hol improving the JJAS simulation, its performance in FMAM and ONDJ remains less satisfactory. It can be due to the inability of the Hol to simulate shallow convection and unstable atmospheric conditions accurately [68], particularly when weak lifting mechanisms and dry air advection dominate. For instance, ref. [69] found that the Hol assumes surface fluxes as the only energy source for turbulence, neglecting other processes like radiative cooling that can influence turbulence and cloud formation. Ref. [70] also indicated that simulations with Hol can result in unrealistic precipitation and near-surface temperature depending on the region and season, often due to poor vertical mixing and cloud-topped boundary layer misrepresentation. Ref. [71] found that the Hol, non-local mixing scheme, generally overestimated the PBL height, over the mountainous areas, connecting this to the gap in the global radiation measurements due to the very few stations. In addition, the non-local mixing formulation is associated with this PBL height overestimation and, therefore, accompanied by the underestimation of total cloud cover [72]. However, in our study, despite receiving more shortwave radiation at the surface, Hol produced a lower near-surface temperature instead of warming, as is normal. This shows the limitations of the Hol in the simulation at a high resolution, especially over a complex domain such as the UBNB.
However, we think that the restricted domain extent may restrict the model’s ability to fully capture the large-scale moisture transport and jet-related dynamics originating from the Atlantic Ocean. This arises from the previous studies that used Hol (e.g., [5]), which showed good simulation of the spring (FMAM) and summer (JJAS) rainfall over the UBNB at a resolution of 50 km using RegCM4 forced by ERA-Interim reanalysis data. Their domain involved the Indian and Atlantic Oceans to a large extent. Hence, in our study, we think that the MOLOCH-Hol scenario still could not exploit the improved boundary conditions provided by the driven ERA5 reanalysis data with a high resolution of 31 km. Extending the simulation domain westward to include parts of the tropical and subtropical Atlantic Ocean could enhance the scenario’s ability to simulate moisture fluxes and circulation dynamics, such as the Azores High and moist southwesterly monsoon flow, that significantly affect the full climate pattern over the UBNB. However, such an extension would substantially increase the computational cost, making it less feasible within the current study framework.
Finally, the MOLOCH-UW configuration shows a robust performance across all seasons despite using the same domain. It successfully captures the seasonal patterns of rainfall and temperature variability, reducing the wet and cold bias, respectively. These results agree with studies [68,71,73], which found that using the UW reduces systematic biases compared to Hol. The advantage of the UW lies in its more physically consistent representation of surface fluxes, turbulence, and boundary layer processes, which are important in controlling land-atmosphere interactions [67]. Its capability to stabilize surface heat and moisture exchange could partly compensate for deficiencies in large-scale dynamics, leading to better seasonal consistency. Over West Africa, ref. [18] similarly found that the UW outperformed Hol in reproducing the precipitation, 2 m temperature, cloud cover, and boundary layer height during the West African monsoon. They attributed that to the UW scheme’s prognostic formulation of the turbulent kinetic energy, which allows simulating vertical mixing driven not only by surface fluxes but also by radiative cooling at cloud tops. Such cloud-top driven turbulence plays a critical role in tropical regions, where vigorous convection and moist boundary layers enhance the hydrological cycle and upper atmospheric cloud development [74].
6. Conclusions
In conclusion, this study identified the best configuration of the RegCM5 using the non-hydrostatic MOLOCH dynamical core with the UW PBL scheme in simulating the precipitation and the 2 m temperature over the UBNB. In addition, we found that MOLOCH could exploit the high-resolution ERA5 reanalysis to simulate UBNB climate at fine resolution using a relatively smaller domain. In addition, the UW outperformed the Hol in reducing the systematic biases found in the hydrostatic simulation, enhancing the representation of the seasonal cycle of both precipitation and 2 m temperature. The findings also indicate that ERA5-land data fail to capture observed climate patterns over the UBNB, exhibiting significant biases. Hence, it is essential to account for these biases when employing ERA5-Land for climate impact assessment studies in the basin.
Overall, the RegCM5 developed over the UBNB is considered a promising tool for future climate and water resources studies in the basin, such as climate change projection and land use impact on the basin’s climate, as well as hydrologic applications of the dynamically seasonal forecasts. Further improvements could be achieved through convection-permitting simulations at grid spacing ≤ 4 km to represent the small local features in the basin. Such an approach would be particularly valuable for assessing the impacts of land use and land cover changes, such as those driven by reservoirs impounded upstream of the constructed dams.
Author Contributions
Conceptualization, E.K., D.A., A.M.E. and M.A.G.; methodology, E.K., D.A., A.M.E. and M.A.G.; software, E.K.; validation, E.K., D.A., A.M.E. and M.A.G.; formal analysis, E.K.; investigation, E.K.; resources, E.K. and D.A.; data curation, E.K.; writing—original draft preparation, E.K.; writing—reviewing and editing, E.K., D.A. and A.M.E.; visualization, E.K.; supervision, D.A., A.M.E. and M.A.G.; project administration, E.K.; funding acquisition, E.K., D.A. and A.M.E. All authors have read and agreed to the published version of the manuscript.
Funding
This research was funded by the Science, Technology, and Innovation Funding Authority (STDF) under the 2nd postgraduate support grant, grant number 48620. The APC was supported through a project entitled “Projection of Stored Water Upstream Dams on Microclimate” funded by this STDF grant in Egypt.
Data Availability Statement
The RegCM5 code is available from the project website: https://github.com/graziano-giuliani/RegCM/tree/5.0.0 (accessed on 13 July 2025). The RegCM5 used to produce the results used in this paper is archived by Zenodo at https://doi.org/10.5281/zenodo.7548172 [75]. The model input data are available at http://clima-dods.ictp.it/regcm4 (accessed on 13 July 2025). The ERA5 reanalysis data are available at https://cds.climate.copernicus.eu/datasets/reanalysis-era5-pressure-levels (accessed on 13 July 2025) for the initial and boundary conditions, and https://cds.climate.copernicus.eu/datasets/reanalysis-era5-single-levels (accessed on 13 July 2025) for the SST data. The ERA5-land reanalysis data are available at https://cds.climate.copernicus.eu/datasets/reanalysis-era5-land (accessed on 13 July 2025). Finally, the CRU surface air temperature data are available at https://crudata.uea.ac.uk/cru/data/hrg/cru_ts_4.09/cruts.2503051245.v4.09/tmp (accessed on 13 July 2025).
Acknowledgments
The authors would like to express their sincere thanks to the Nile Forecast Center, MWRI, Egypt, for providing the rainfall data of the Nile Forecast System. The authors also gratefully acknowledge STDF for supporting this paper work under the 2nd postgraduate support grant.
Conflicts of Interest
The authors declare no conflicts of interest. The funders had no role in the design of this study; in the collection, analyses, or interpretation of data; in the writing of the manuscript; or in the decision to publish the results.
Abbreviations
The following abbreviations are used in this manuscript:
| UBNB | Upper Blue Nile Basin |
| RegCM | Regional Climate Model System |
| PBL | Planetary Boundary Layer |
| UW | University of Washington |
| Hol | Holtslag |
| JJAS | June-September |
| ITCZ | Inter-Tropical Convergence Zone |
| FMAM | February-May |
| ONDJ | October-January |
| SST | Sea Surface Temperature |
| RCMs | Regional Climate Models |
| WRF | Weather Research and Forecasting |
| NoTo | Nogherotto–Tompkins |
| ECMWF | European Centre for Medium-Range Weather Forecasts |
| PP7 | Pre-Processor 7 |
| CRU | Climate Research Unit |
| Bias% | Percent Bias |
| RSR | Root Mean Squared Error to observation Standard Deviation Ratio |
| CORDEX | COordinated Regional climate Downscaling Experiment |
| STDF | Science, Technology and Innovation Funding Authority |
References
- Birhan, M.W.; Raju, U.J.P.; Kenea, S. Estimating the Role of Upper Blue Nile Basin Moisture Budget and Recycling Ratio in Spatiotemporal Precipitation Distributions. J. Atmos. Sol. Terr. Phys. 2019, 193, 105064. [Google Scholar] [CrossRef]
- Viste, E.; Sorteberg, A. Moisture Transport into the Ethiopian Highlands. Int. J. Climatol. 2011, 33, 249–263. [Google Scholar] [CrossRef]
- Keshta, E.; Gad, M.A.; Amin, D. A Long–Term Response-Based Rainfall-Runoff Hydrologic Model: Case Study of The Upper Blue Nile. Hydrology 2019, 6, 69. [Google Scholar] [CrossRef]
- Segele, Z.T.; Lamb, P.J. Characterization and Variability of Kiremt Rainy Season over Ethiopia. Meteorol. Atmos. Phys. 2005, 89, 153–180. [Google Scholar] [CrossRef]
- Zeleke, T.; Yeshita, B.D.; Agidew, F.M. Evaluation of a Regional Climate Model for the Upper Blue Nile Region. In Topics in Climate Modeling; Hromadka, T., Rao, P., Eds.; IntechOpen: London, UK, 2016. [Google Scholar]
- Diro, G.T.; Grimes, D.I.F.; Black, E. Large Scale Features Affecting Ethiopian Rainfall. In African Climate and Climate Change: Physical, Social and Political Perspectives; Williams, C.J.R., Kniveton, D.R., Eds.; Springer: Dordrecht, The Netherlands, 2011; pp. 13–50. ISBN 978-90-481-3842-5. [Google Scholar]
- Hamilton, H.L.; Núñez Ocasio, K.M.; Evans, J.L.; Young, G.S.; Fuentes, J.D. Topographic Influence on the African Easterly Jet and African Easterly Wave Energetics. J. Geophys. Res. Atmos. 2020, 125, e2019JD032138. [Google Scholar] [CrossRef]
- Segele, Z.T.; Lamb, P.J.; Leslie, L.M. Large-Scale Atmospheric Circulation and Global Sea Surface Temperature Associations with Horn of Africa June–September Rainfall. Int. J. Climatol. 2009, 29, 1075–1100. [Google Scholar] [CrossRef]
- Nicholson, S.E. Climate and Climatic Variability of Rainfall over Eastern Africa. Rev. Geophys. 2017, 55, 590–635. [Google Scholar] [CrossRef]
- Seleshi, Y.; Zanke, U. Recent Changes in Rainfall and Rainy Days in Ethiopia. Int. J. Climatol. 2004, 24, 973–983. [Google Scholar] [CrossRef]
- Fekadu, K. Ethiopian Seasonal Rainfall Variability and Prediction Using Canonical Correlation Analysis (CCA). Earth Sci. 2015, 4, 112–119. [Google Scholar] [CrossRef]
- Korecha, D.; Barnston, A.G. Predictability of June–September Rainfall in Ethiopia. Mon. Weather Rev. 2007, 135, 628–650. [Google Scholar] [CrossRef]
- Gissila, T.; Black, E.; Grimes, D.I.F.; Slingo, J.M. Seasonal Forecasting of the Ethiopian Summer Rains. Int. J. Climatol. 2004, 24, 1345–1358. [Google Scholar] [CrossRef]
- Abdelwares, M.; Haggag, M.; Wagdy, A.; Lelieveld, J. Customized Framework of the WRF Model for Regional Climate Simulation over the Eastern Nile Basin. Theor. Appl. Climatol. 2018, 134, 1135–1151. [Google Scholar] [CrossRef]
- Osman, M.; Zittis, G.; Haggag, M.; Abdeldayem, A.W.; Lelieveld, J. Optimizing Regional Climate Model Output for Hydro-Climate Applications in the Eastern Nile Basin. Earth Syst. Environ. 2021, 5, 185–200. [Google Scholar] [CrossRef]
- Segele, Z.T.; Leslie, L.M.; Lamb, P.J. Evaluation and Adaptation of a Regional Climate Model for the Horn of Africa: Rainfall Climatology and Interannual Variability. Int. J. Climatol. 2009, 29, 47–65. [Google Scholar] [CrossRef]
- Zeleke, T.; Giorgi, F.; Mengistu Tsidu, G.; Diro, G.T. Spatial and Temporal Variability of Summer Rainfall over Ethiopia from Observations and a Regional Climate Model Experiment. Theor. Appl. Climatol. 2013, 111, 665–681. [Google Scholar] [CrossRef]
- Silué, F.; Diawara, A.; Koné, B.; Diedhiou, A.; Kouassi, A.A.; Kouassi, B.K.; Yoroba, F.; Bamba, A.; Kouadio, K.; Tiémoko, D.T.; et al. Assessment of the Sensitivity of the Mean Climate Simulation over West Africa to Planetary Boundary Layer Parameterization Using RegCM5 Regional Climate Model. Atmosphere 2024, 15, 332. [Google Scholar] [CrossRef]
- Nikulin, G.; Jones, C.; Giorgi, F.; Asrar, G.; Büchner, M.; Cerezo-Mota, R.; Christensen, O.B.; Déqué, M.; Fernandez, J.; Hänsler, A.; et al. Precipitation Climatology in an Ensemble of CORDEX-Africa Regional Climate Simulations. J. Clim. 2012, 25, 6057–6078. [Google Scholar] [CrossRef]
- Coppola, E.; Giorgi, F.; Mariotti, L.; Bi, X. RegT-Band: A Tropical Band Version of RegCM4. Clim. Res. 2012, 52, 115–133. [Google Scholar] [CrossRef][Green Version]
- Almazroui, M.; Islam, M.N.; Al-Khalaf, A.K.; Saeed, F. Best Convective Parameterization Scheme within RegCM4 to Downscale CMIP5 Multi-Model Data for the CORDEX-MENA/Arab Domain. Theor. Appl. Climatol. 2016, 124, 807–823. [Google Scholar] [CrossRef]
- Cheng, Q.; Li, F. Performance of RegCM4.5 in Simulating the Regional Climate of Western Tianshan Mountains in Xinjiang, China. Atmosphere 2021, 12, 1544. [Google Scholar] [CrossRef]
- Raju, P.V.S.; Bhatla, R.; Almazroui, M.; Assiri, M. Performance of Convection Schemes on the Simulation of Summer Monsoon Features over the South Asia CORDEX Domain Using RegCM-4.3. Int. J. Climatol. 2015, 35, 4695–4706. [Google Scholar] [CrossRef]
- Santos e Silva, C.M.; Bezerra, B.G.; Mutti, P.R.; Lucio, P.S.; Mendes, K.R.; Rodrigues, D.; Oliveira, C.P.; Medeiros, F.; Silva, M.L.; dos Reis, L.C.; et al. Climatic Variability of Precipitation Simulated by a Regional Dynamic Model in Tropical South America. Environ. Sci. Proc. 2022, 19, 61. [Google Scholar] [CrossRef]
- Endris, H.S.; Omondi, P.; Jain, S.; Lennard, C.; Hewitson, B.; Chang’a, L.; Awange, J.L.; Dosio, A.; Ketiem, P.; Nikulin, G.; et al. Assessment of the Performance of CORDEX Regional Climate Models in Simulating East African Rainfall. J. Clim. 2013, 26, 8453–8475. [Google Scholar] [CrossRef]
- Ji, F.; Di Virgilio, G.; Nishant, N.; Tam, E.; Evans, J.P.; Kala, J.; Andrys, J.; Thomas, C.; Riley, M.L. Evaluation of Precipitation Extremes in ERA5 Reanalysis Driven Regional Climate Simulations over the CORDEX-Australasia Domain. Weather Clim. Extrem. 2024, 44, 100676. [Google Scholar] [CrossRef]
- Di Virgilio, G.; Ji, F.; Tam, E.; Evans, J.P.; Kala, J.; Andrys, J.; Thomas, C.; Choudhury, D.; Rocha, C.; Li, Y.; et al. Evaluation of CORDEX ERA5-Forced NARCliM2.0 Regional Climate Models over Australia Using the Weather Research and Forecasting (WRF) Model Version 4.1.2. Geosci. Model Dev. 2025, 18, 703–724. [Google Scholar] [CrossRef]
- Keshta, E.; Amin, D.; ElMoustafa, A.M.; Gad, M.A. Optimizing Precipitation Parameterizations in Regional Climate Model (RegCM5): A Case Study of the Upper Blue Nile Basin (UBNB). EGUsphere, 2025; preprint. [Google Scholar] [CrossRef]
- Giorgi, F.; Coppola, E.; Giuliani, G.; Ciarlo‘, J.M.; Pichelli, E.; Nogherotto, R.; Raffaele, F.; Malguzzi, P.; Davolio, S.; Stocchi, P.; et al. The Fifth Generation Regional Climate Modeling System, RegCM5: Description and Illustrative Examples at Parameterized Convection and Convection-Permitting Resolutions. J. Geophys. Res. Atmos. 2023, 128, e2022JD038199. [Google Scholar] [CrossRef]
- Holtslag, A.A.M.; De Bruijn, E.I.F.; Pan, H.-L. A High Resolution Air Mass Transformation Model for Short-Range Weather Forecasting. Mon. Weather Rev. 1990, 118, 1561–1575. [Google Scholar] [CrossRef]
- Bretherton, C.S.; McCaa, J.R.; Grenier, H. A New Parameterization for Shallow Cumulus Convection and Its Application to Marine Subtropical Cloud-Topped Boundary Layers. Part I: Description and 1D Results. Mon. Weather Rev. 2004, 132, 864–882. [Google Scholar] [CrossRef]
- Onyutha, C.; Willems, P. Spatial and Temporal Variability of Rainfall in the Nile Basin. Hydrol. Earth Syst. Sci. 2015, 19, 2227–2246. [Google Scholar] [CrossRef]
- Diro, G.T.; Black, E.; Grimes, D.I.F. Seasonal Forecasting of Ethiopian Spring Rains. Meteorol. Appl. 2008, 15, 73–83. [Google Scholar] [CrossRef]
- Conway, D. The Climate and Hydrology of the Upper Blue Nile River. Geogr. J. 2000, 166, 49–62. [Google Scholar] [CrossRef]
- Viste, E.; Korecha, D.; Sorteberg, A. Recent Drought and Precipitation Tendencies in Ethiopia. Theor. Appl. Climatol. 2013, 112, 535–551. [Google Scholar] [CrossRef]
- Hersbach, H.; Bell, B.; Berrisford, P.; Hirahara, S.; Horányi, A.; Muñoz-Sabater, J.; Nicolas, J.; Peubey, C.; Radu, R.; Schepers, D.; et al. The ERA5 Global Reanalysis. Q. J. R. Meteorol. Soc. 2020, 146, 1999–2049. [Google Scholar] [CrossRef]
- NFC. Nile Forecasting System (NFS), Version 6.0. Manual; Nile Forecast Center (NFC), Ministry of Water Rsources and Irrigation (MWRI): Giza, Egypt, 2009. [Google Scholar]
- Amin, D.; Keshta, E.; Ragab, R.; Chakrabortty, R.; Elaksher, A.F. Impact of Climate Change on Hydrological Extremes (Floods and Droughts) in the Upper Blue Nile Basin. Earth Syst. Environ. 2025, 1–20. [Google Scholar] [CrossRef]
- Elshamy, M.E. Improvement of the Hydrological Performance of Land Surface Parameterization: An Application to The Nile Basin Land Surface Parameterization. Ph.D. Thesis, Imperial College of Science, Technology, and Medicine, University of London, London, UK, 2016. [Google Scholar]
- Harris, I.; Osborn, T.J.; Jones, P.; Lister, D. Version 4 of the CRU TS Monthly High-Resolution Gridded Multivariate Climate Dataset. Sci. Data 2020, 7, 109. [Google Scholar] [CrossRef] [PubMed]
- Mahmood, R.; Jia, S.; Mahmood, T.; Mehmood, A. Predicted and Projected Water Resources Changes in the Chari Catchment, the Lake Chad Basin, Africa. J. Hydrometeorol. 2020, 21, 73–91. [Google Scholar] [CrossRef]
- Peng, J.; Dadson, S.; Hirpa, F.; Dyer, E.; Lees, T.; Miralles, D.G.; Vicente-Serrano, S.M.; Funk, C. A Pan-African High-Resolution Drought Index Dataset. Earth Syst. Sci. Data 2020, 12, 753–769. [Google Scholar] [CrossRef]
- Gebremeskel Haile, G.; Tang, Q.; Leng, G.; Jia, G.; Wang, J.; Cai, D.; Sun, S.; Baniya, B.; Zhang, Q. Long-Term Spatiotemporal Variation of Drought Patterns over the Greater Horn of Africa. Sci. Total Environ. 2020, 704, 135299. [Google Scholar] [CrossRef]
- Elshamy, M.E.; Seierstad, I.A.; Sorteberg, A. Impacts of Climate Change on Blue Nile Flows Using Bias-Corrected GCM Scenarios. Hydrol. Earth Syst. Sci. 2009, 13, 551–565. [Google Scholar] [CrossRef]
- Allam, M.M.; Jain Figueroa, A.; McLaughlin, D.B.; Eltahir, E.A.B. Estimation of Evaporation over the Upper Blue Nile Basin by Combining Observations from Satellites and River Flow Gauges. Water Resour. Res. 2016, 52, 644–659. [Google Scholar] [CrossRef]
- Muñoz-Sabater, J.; Dutra, E.; Agustí-Panareda, A.; Albergel, C.; Arduini, G.; Balsamo, G.; Boussetta, S.; Choulga, M.; Harrigan, S.; Hersbach, H.; et al. ERA5-Land: A State-of-the-Art Global Reanalysis Dataset for Land Applications. Earth Syst. Sci. Data 2021, 13, 4349–4383. [Google Scholar] [CrossRef]
- Coppola, E.; Stocchi, P.; Pichelli, E.; Torres Alavez, J.A.; Glazer, R.; Giuliani, G.; Di Sante, F.; Nogherotto, R.; Giorgi, F. Non-Hydrostatic RegCM4 (RegCM4-NH): Model Description and Case Studies over Multiple Domains. Geosci. Model Dev. 2021, 14, 7705–7723. [Google Scholar] [CrossRef]
- Gu, H.; Wang, X. Performance of the RegCM4.6 for High-Resolution Climate and Extreme Simulations over Tibetan Plateau. Atmosphere 2020, 11, 1104. [Google Scholar] [CrossRef]
- Tolika, K.; Anagnostopoulou, C.; Velikou, K.; Vagenas, C. A Comparison of the Updated Very High Resolution Model RegCM3_10km with the Previous Version RegCM3_25km over the Complex Terrain of Greece: Present and Future Projections. Theor. Appl. Climatol. 2016, 126, 715–726. [Google Scholar] [CrossRef]
- Torma, C.; Giorgi, F.; Coppola, E. Added Value of Regional Climate Modeling over Areas Characterized by Complex Terrain-Precipitation over the Alps. J. Geophys. Res. 2015, 120, 3957–3972. [Google Scholar] [CrossRef]
- Prein, A.F.; Gobiet, A.; Truhetz, H.; Keuler, K.; Goergen, K.; Teichmann, C.; Fox Maule, C.; van Meijgaard, E.; Déqué, M.; Nikulin, G.; et al. Precipitation in the EURO-CORDEX 0.11° and 0.44° Simulations: High Resolution, High Benefits? Clim. Dyn. 2016, 46, 383–412. [Google Scholar] [CrossRef]
- Ma, S.; Trancoso, R.; Syktus, J.; Chapman, S.; Eccles, R. Evaluating ERA5 Downscaled Simulations Using CCAM: Large-Scale Circulation Processes and Teleconnections. J. Geophys. Res. Atmos. 2025, 130, e2025JD043566. [Google Scholar] [CrossRef]
- Li, B.; Huang, Y.; Du, L.; Wang, D. Sensitivity Experiments of RegCM4 Using Different Cumulus and Land Surface Schemes over the Upper Reaches of the Yangtze River. Front. Earth Sci. 2023, 10, 1092368. [Google Scholar] [CrossRef]
- Emanuel, K.A. A Scheme for Representing Cumulus Convection in Large-Scale Models. J. Atmos. Sci. 1991, 48, 2313–2329. [Google Scholar] [CrossRef]
- Nogherotto, R.; Tompkins, A.M.; Giuliani, G.; Coppola, E.; Giorgi, F. Numerical Framework and Performance of the New Multiple-Phase Cloud Microphysics Scheme in RegCM4.5: Precipitation, Cloud Microphysics, and Cloud Radiative Effects. Geosci. Model Dev. 2016, 9, 2533–2547. [Google Scholar] [CrossRef]
- Clough, S.A.; Shephard, M.W.; Mlawer, E.J.; Delamere, J.S.; Iacono, M.J.; Cady-Pereira, K.; Boukabara, S.; Brown, P.D. Atmospheric Radiative Transfer Modeling: A Summary of the AER Codes. J. Quant. Spectrosc. Radiat. Transf. 2005, 91, 233–244. [Google Scholar] [CrossRef]
- Oleson, K.; Lawrence, D.; Bonan, G.; Drewniak, B.; Huang, M.; Koven, C.; Levis, S.; Li, F.; Riley, W.; Subin, Z.; et al. Technical Description of Version 4.5 of the Community Land Model (CLM); University Corporation for Atmospheric Research: Boulder, CO, USA, 2013; ISBN NCAR/TN-503+STR. [Google Scholar] [CrossRef]
- Zeng, X.; Zhao, M.; Dickinson, R.E. Intercomparison of Bulk Aerodynamic Algorithms for the Computation of Sea Surface Fluxes Using TOGA COARE and TAO Data. J. Clim. 1998, 11, 2628–2644. [Google Scholar] [CrossRef]
- Moriasi, D.N.; Arnold, J.G.; Van Liew, M.W.; Bingner, R.L.; Harmel, R.D.; Veith, T.L. Model Evaluation Guidlines for Systematic Quantification of Accuracy in Watershed Simulations. Trans. ASABE 2007, 50, 885–900. [Google Scholar] [CrossRef]
- Zargar, M.; Bronstert, A.; Francke, T.; Zimale, F.A.; Worku, K.B.; Wiegels, R.; Lorenz, C.; Hageltom, Y.; Sawadogo, W.; Kunstmann, H. Comparison and Hydrological Evaluation of Different Precipitation Data for a Large Tropical Region: The Blue Nile Basin in Ethiopia. Front. Water 2025, 7, 1536881. [Google Scholar] [CrossRef]
- Shanko, D.; Camberlin, P. The Effects of the Southwest Indian Ocean Tropical Cyclones on Ethiopian Drought. Int. J. Climatol. 1998, 18, 1373–1388. [Google Scholar] [CrossRef]
- Schoetter, R.; Hoffmann, P.; Rechid, D.; Schlünzen, K.H. Evaluation and Bias Correction of Regional Climate Model Results Using Model Evaluation Measures. J. Appl. Meteorol. Climatol. 2012, 51, 1670–1684. [Google Scholar] [CrossRef]
- Gleixner, S.; Demissie, T.; Diro, G.T. Did ERA5 Improve Temperature and Precipitation Reanalysis over East Africa? Atmosphere 2020, 11, 996. [Google Scholar] [CrossRef]
- Huai, B.; Wang, J.; Sun, W.; Wang, Y.; Zhang, W. Evaluation of the Near-Surface Climate of the Recent Global Atmospheric Reanalysis for Qilian Mountains, Qinghai-Tibet Plateau. Atmos. Res. 2021, 250, 105401. [Google Scholar] [CrossRef]
- Cornes, R.C.; van der Schrier, G.; van den Besselaar, E.J.M.; Jones, P.D. An Ensemble Version of the E-OBS Temperature and Precipitation Data Sets. J. Geophys. Res. Atmos. 2018, 123, 9391–9409. [Google Scholar] [CrossRef]
- Zhao, P.; He, Z. Evaluation of ERA5 Reanalysis Temperature Data over the Qilian Mountains of China. J. Mt. Sci. 2024, 22, 198–209. [Google Scholar] [CrossRef]
- Elguindi, N.; Bi, X.; Giorgi, F.; Nagarajan, B.; Pal, J.; Solmon, F.; Rauscher, S.; Zakey, A.; O’Brien, T.; Nogherotto, R.; et al. Regional Climate Model RegCM Reference Manual; ICTP: Trieste, Italy, 2017. [Google Scholar]
- Güttler, I.; Branković, Č.; O’Brien, T.A.; Coppola, E.; Grisogono, B.; Giorgi, F. Sensitivity of the Regional Climate Model RegCM4.2 to Planetary Boundary Layer Parameterisation. Clim. Dyn. 2014, 43, 1753–1772. [Google Scholar] [CrossRef]
- Park, S.; Bretherton, C.S. The University of Washington Shallow Convection and Moist Turbulence Schemes and Their Impact on Climate Simulations with the Community Atmosphere Model. J. Clim. 2009, 22, 3449–3469. [Google Scholar] [CrossRef]
- Giorgi, F.; Coppola, E.; Solmon, F.; Mariotti, L.; MB, S.; Bi, X.; Elguindi, N.; GT, D.; Nair, V.; Giuliani, G.; et al. RegCM4: Model Description and Preliminary Tests over Multiple CORDEX Domains. Clim. Res. 2012, 52, 7–29. [Google Scholar] [CrossRef]
- Kalmár, T.; Pieczka, I.; Pongrácz, R. A Sensitivity Analysis of the Different Setups of the RegCM4.5 Model for the Carpathian Region. Int. J. Climatol. 2021, 41, E1180–E1201. [Google Scholar] [CrossRef]
- Wood, R.; Bretherton, C.S. On the Relationship between Stratiform Low Cloud Cover and Lower-Tropospheric Stability. J. Clim. 2006, 19, 6425–6432. [Google Scholar] [CrossRef]
- Kalmár, T.; Pongrácz, R.; Pieczka, I.; Hollós, R. Evaluation of RegCM Simulation Ensemble Using Different Parameterization Scheme Combinations: A Case Study for an Extremely Wet Year in the Carpathian Region. Clim. Dyn. 2024, 62, 8201–8225. [Google Scholar] [CrossRef]
- Brinkop, S.; Roeckner, E. Sensitivity of a General Circulation Model to Parameterizations of Cloud-Turbulence Interactions in the Atmospheric Boundary Layer. Tellus A 1995, 47, 197–220. [Google Scholar] [CrossRef][Green Version]
- Giorgi, F.; Coppola, E.; Giuliani, G.; Ciarlo, J.; Pichelli, E.; Nogherotto, R.; Raffaele, F.; Malguzzi, P.; Davolio, S.; Stocchi, P.; et al. ICTP RegCM5 Model Code, version 5.0.0; Zenodo: Geneva, Switzerland, 2023. [CrossRef]
Disclaimer/Publisher’s Note: The statements, opinions and data contained in all publications are solely those of the individual author(s) and contributor(s) and not of MDPI and/or the editor(s). MDPI and/or the editor(s) disclaim responsibility for any injury to people or property resulting from any ideas, methods, instructions or products referred to in the content. |
© 2025 by the authors. Licensee MDPI, Basel, Switzerland. This article is an open access article distributed under the terms and conditions of the Creative Commons Attribution (CC BY) license (https://creativecommons.org/licenses/by/4.0/).